
DETAILED CONCEPT OF THE SYSML LIGHTWEIGHT VISUALIZATION IN ...
Upload
hiroyuki-tanakaCategory
view
215download
3
Surface Science 539 (2003) L531–L536
www.elsevier.com/locate/susc
Surface Science Letters
Visualization of detailed structures within DNA
Hiroyuki Tanaka, Tomoji Kawai *
The Institute of Scientific and Industrial Research, Osaka University, 8-1 Mihogaoka, Ibaraki, Osaka 567-0047, Japan
Received 4 January 2003; accepted for publication 3 June 2003
Abstract
Here we report ultrahigh-resolution scanning tunneling microscopy images of detailed structures within DNA
composed of a well-defined base sequence, deposited on substrates using a pulsed injection method. Poly(G–C)–
poly(G–C) and poly(A–T)–poly(A–T) have been differentiated by comparing their secondary (helical) structures. We
have visualized the structure of poly(A–T)–poly(A–T) with a resolution high enough to recognize individual nucleo-
tides. By comparing the size of individual nucleotides (the primary structure) of poly(A–T)–poly(A–T), sequencing of
individual nucleotides can be achieved successfully. These results validate the Watson and Crick DNA model at the
single molecule level 50 years after its discovery.
� 2003 Elsevier B.V. All rights reserved.
Keywords: Scanning tunneling microscopy; Surface structure, morphology, roughness, and topography; Copper; Biological mole-
cules – nucleic acids; Low index single crystal surfaces
Since discovery of the double helix structure of
DNA [1] in 1953, enormous effort has been ex-
pended to visualize detailed structures within
DNA molecules using high-resolution microscopy.
The highest resolution images were reported in1989–1990 using scanning tunneling microscopy
(STM) [2] by dropping DNA solution through air
[3–8] onto highly oriented pyrolytic graphite sub-
strates. However, later reports identified these
‘‘DNA images’’ as grain boundaries of graphite
[9,10]. After those reports, few high-resolution
STM images have appeared in scientific journals.
In order to circumvent artifacts and contamina-
* Corresponding author. Tel.: +81-6-6879-8445; fax: +81-6-
6875-2440.
E-mail address: [email protected] (T. Kawai).
0039-6028/03/$ - see front matter � 2003 Elsevier B.V. All rights res
doi:10.1016/S0039-6028(03)00794-5
tion, we developed a ‘‘pulsed injection method’’
[11,12] to prepare biological molecules, such as
DNA, for STM while avoiding decomposition and
aggregation. Using this method, STM produced
images of intact plasmid DNA and its periodichelical structure, but individual nucleotides of
single- or double-stranded DNA were not clearly
imaged [12,15]. Here, we present high-resolution
STM images of four well-defined types of double-
stranded DNA molecules, poly(A)–poly(T),
poly(A–T)–poly(A–T), poly(G)–poly(C), and
poly(G–C)–poly(G–C), in which a pair of single
strands forming a duplex strand and even indi-vidual nucleotides are visible. This validates the
Watson and Crick model at the single molecule
level 50 years after its discovery.
DNA cannot be thermally deposited due to
pyrolytic decomposition, therefore the standard
erved.

L532 H. Tanaka, T. Kawai / Surface Science 539 (2003) L531–L536SU
RFACE
SCIENCE
LETTERS
method for sample preparation involves dropping
DNA-containing solution directly onto a substrate
under ambient conditions [3–8]. However, even on
well-defined and artifact-free metal surfaces, this
method results in the deposition of aggregated
DNA because of the hydrophobicity of the metal.In our experiments, a DNA solution (0.25 mg/ml)
was pulse-injected onto a well-defined Cu(1 1 1)
surface under ultrahigh vacuum using a high speed
solenoid valve (General Valve Co., Series 9)
[11,12]. Co-deposited solvent (H2O) volatized,
leaving DNA on the surface before aggregation
occurred. This pulse injection technique was de-
veloped for the deposition of biomolecules, such asDNA, while avoiding decomposition, and has
been employed successfully for a variety of mole-
cules [13,14].
Poly(A)–poly(T), poly(A–T)–poly(A–T), poly-
(G)–poly(C), and poly(G–C)–poly(G–C) (Amer-
sham Biosciences, Tokyo, Japan) were chosen for
this study because they consist of a well-defined
base pair repeating unit. According to their certi-fication, undetermined amounts of sodium chlo-
ride (NaCl) were included in their synthesis for
structural stabilization of the DNA, and these
polymers may contain a residual amount of NaCl.
They were dissolved in water made by Milli-Q
Synthesis (Millipore Co. Ltd., Tokyo, Japan) at a
concentration of 0.25 mg/ml. The sample lengths
were measured using an electrophoresis method.The mean lengths of above four samples were over
10,000 base pairs (bp), 1534, 8560 and 249 bp,
respectively.
The samples were deposited on Cu(1 1 1) sub-
strates separately using a pulse injection method.
The pulse valve, that orifice is 0.8 mm, was filled
with a DNA solution and attached to the prepa-
ration chamber in vacuum (<1� 10�7 Torr). Aclean Cu(1 1 1) substrate was located just under the
pulse valve. The distance from the pulse valve to
the substrate was 130 mm. The solution was in-
jected toward the substrate at room temperature
when the valve was opened for 1.5 ms. Amount of
injected sample solution was 0.005 ml and less.
After deposition of the DNA on Cu(1 1 1) surface,
the base pressure of the preparation chamberchanges to >1� 10�3 Torr. After the base pressureof the preparation chamber becomes better than
1� 10�7 Torr, the Cu(1 1 1) sample was transferredto the STM chamber [11,12].
Fig. 1 shows STM images and topographic
height profiles of poly(G–C)–poly(G–C) ((a) and
(b)) and poly(G)–poly(C) ((c)–(e)) obtained after
pulse injection of the sample solutions onto cleanCu(1 1 1) substrates. As shown in Fig. 1(a) and (b),
poly(G–C)–poly(G–C) molecules had a topo-
graphic height of 0.4–0.5 nm and a width (hori-
zontal diameter) of 3–4 nm. The DNA in Fig. 1(a)
appeared to be composed of bright spots separated
by approximately 3.5 nm. Since these structural
characteristics and dimensions agree well with
previous data obtained for intact plasmid DNAadsorbed on Cu(1 1 1) surfaces [12,15], poly(G–C)–
poly(G–C) molecules are duplex and each spot
corresponds to a turn of the double helix. In the
higher resolution image (Fig. 1(b)), the structure of
regularly spaced spots (the pitch of DNA) is hard
to recognize but the more detailed structures
(subnanometer particles) are visualized. At this
time we cannot completely explain the mechanismgoverning the image production. We speculate
that materials stuck on the apex of the tip play an
important role because a clean (metallic) tip tends
to facilitate the high-resolution image. The visu-
alized particles have a diameter of 0.5–0.8 nm and
appear almost randomly arranged in the DNA.
They probably correspond to a DNA component
such as base molecule, sugar-phosphate chain, andcounter ion. As shown in Fig. 1(c) and (d),
poly(G)–poly(C) molecules have a topographic
height of 0.3–0.5 nm and a width of 3–4 nm. Due
to the condition of the tip, the pitch of DNA is
difficult to recognize, but detailed structures can be
seen. Our observations revealed no appreciable
difference in the duplex characters of poly(G–C)–
poly(G–C) and poly(G)–poly(C). However, wefound poly(G)–poly(C) to be an exception. As
shown in Fig. 1(e) the strand has a topographic
height of 0.3–0.4 nm and a width of 1.2–2 nm,
which is small for duplex DNA. The strand in the
lower portion of the image is composed of oblique
bright spots aligned in a row with a separation of
approximately 0.7 nm. Considering that the single-
stranded DNA oligomers adsorbed on Cu(1 1 1)have a longer nucleotide periodicity along the
single strand of up to 0.7–0.9 nm [16], we believe
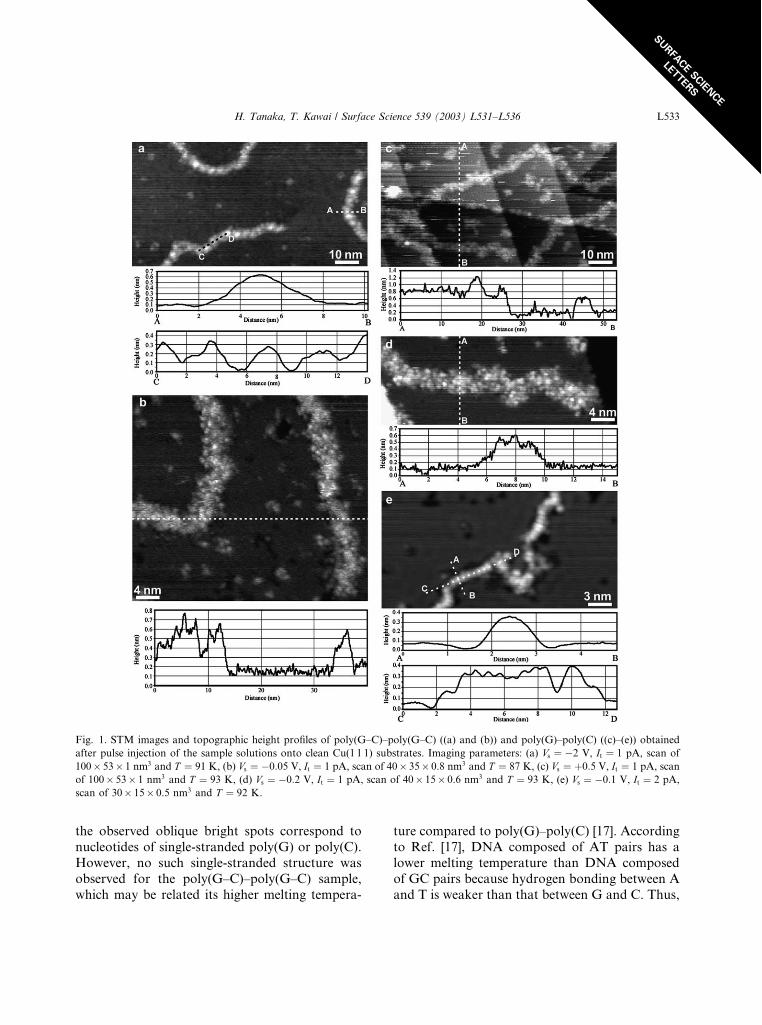
Fig. 1. STM images and topographic height profiles of poly(G–C)–poly(G–C) ((a) and (b)) and poly(G)–poly(C) ((c)–(e)) obtained
after pulse injection of the sample solutions onto clean Cu(1 1 1) substrates. Imaging parameters: (a) Vs ¼ �2 V, It ¼ 1 pA, scan of100� 53� 1 nm3 and T ¼ 91 K, (b) Vs ¼ �0:05 V, It ¼ 1 pA, scan of 40� 35� 0.8 nm3 and T ¼ 87 K, (c) Vs ¼ þ0:5 V, It ¼ 1 pA, scanof 100� 53� 1 nm3 and T ¼ 93 K, (d) Vs ¼ �0:2 V, It ¼ 1 pA, scan of 40� 15� 0.6 nm3 and T ¼ 93 K, (e) Vs ¼ �0:1 V, It ¼ 2 pA,scan of 30� 15� 0.5 nm3 and T ¼ 92 K.
H. Tanaka, T. Kawai / Surface Science 539 (2003) L531–L536 L533
SURFA
CESCIEN
CE
LETTERS
the observed oblique bright spots correspond to
nucleotides of single-stranded poly(G) or poly(C).
However, no such single-stranded structure was
observed for the poly(G–C)–poly(G–C) sample,
which may be related its higher melting tempera-
ture compared to poly(G)–poly(C) [17]. According
to Ref. [17], DNA composed of AT pairs has a
lower melting temperature than DNA composed
of GC pairs because hydrogen bonding between A
and T is weaker than that between G and C. Thus,

L534 H. Tanaka, T. Kawai / Surface Science 539 (2003) L531–L536SU
RFACE
SCIENCE
LETTERS
poly(A)–poly(T) and poly(A–T)–poly(A–T) tend
to show single-stranded structures more frequently
than do poly(G–C)–poly(G–C) and poly(G)–
poly(C).
Fig. 2 shows STM images and topographic
height profiles of poly(A)–poly(T) ((a) and (b))and poly(A–T)–poly(A–T) ((c) and (d)) obtained
after pulse injection of the sample solutions onto
clean Cu(1 1 1) substrates. As shown in the larger
Fig. 2. STM images and topographic height profiles of poly(A)–poly(T
after pulse injection of the sample solutions onto clean Cu(1 1 1) sub
100� 84� 0.6 nm3 and T ¼ 91 K, (b) Vs ¼ �0:1 V, It ¼ 2 pA, scan of 4of an area enclosed by the dotted line in (a)), (c) Vs ¼ �4 V, It ¼ 1 pA,pA, scan of 25� 22� 0.4 nm3 and T ¼ 300 K. A contrast-magnified imarrows indicate the brighter nucleotides.
scale images (Fig. 2(a) and (c)), the DNA mole-
cules have a topographic height of 0.2–0.3 nm and
a width of 1–3 nm. These values are smaller than
those for poly(G–C)–poly(G–C) and poly(G)–
poly(C). In order to eliminate the tip artifacts
and irreproducibility that arise from samplepreparation, the sample solution containing
poly(G–C)–poly(G–C) and poly(A–T)–poly(A–T)
was deposited and imaged with STM. We can
) ((a) and (b)) and poly(A–T)–poly(A–T) ((c) and (d)) obtained
strates. Imaging parameters: (a) Vs ¼ �5 V, It ¼ 1 pA, scan of0� 22� 0.4 nm3 and T ¼ 91 K (this image is an expanded imagescan of 100� 53� 1.2 nm3 and T ¼ 88 K, (d) Vs ¼ �1:5 V, It ¼ 2age (z ¼ 0:1 nm) is superimposed in the left of the square. White

Fig. 3. STM images and topographic height profile of poly(G–
C)–poly(G–C) and poly(A–T)–poly(A–T) obtained after
pulsed-injection of a mixed sample solution of poly(G–C)–
poly(G–C) and poly(A–T)–poly(A–T) onto clean Cu(1 1 1)
substrates. Imaging parameters: Vs ¼ �2 V, It ¼ 1 pA, scan of100� 62� 1.2 nm3 and T ¼ 90 K.
H. Tanaka, T. Kawai / Surface Science 539 (2003) L531–L536 L535
SURFA
CESCIEN
CE
LETTERS
identify them unambiguously, as shown in Fig. 3,
where two types of DNA can be recognized, the
larger being poly(G–C)–poly(G–C) and the smal-
ler corresponding to poly(A–T)–poly(A–T). Thus,
differentiation of DNA molecules of different base
sequence can been achieved. In the lower section
of Fig. 2(a) and (c), the major portion of the DNA
molecule appears to be more double-stranded ra-ther than single-stranded. It is, however, obvious
that both poly(A)–poly(T) and poly(A–T)–
poly(A–T) appear less rigid compared to poly(G–
C)–poly(G–C) and poly(G)–poly(C). We believe
this originates from the weaker hydrogen bonding
between A and T. The major difference between
poly(A)–poly(T) and poly(A–T)–poly(A–T) is that
approximately one-half of poly(A)–poly(T) ap-pears to be single-stranded instead of double-
stranded, as shown in Fig. 2(b). This strand has a
topographic height of 0.2–0.3 nm and a width of
1–3 nm. Although this width is an overestimate
because of the blunt tip, oblique bright spots
aligned in a row with a separation of approxi-
mately 0.7 nm can be recognized. As discussed
previously, these oblique bright spots likely cor-
respond to nucleotides of single-stranded poly(A)
or poly(T).
We have observed the structure of poly(A–T)–
poly(A–T) with resolution capable of visualizing
individual nucleotides. In Fig. 2(d), two crossing
double-stranded DNA chains can be seen. TheDNA chain located in the center (from upper-right
to lower-left) of the image becomes a pair of single
strands consisting of bright spots aligned in a row
with a separation of approximately 0.7 nm, which
correspond to individual nucleotides. The bright-
ness (apparent height) of the nucleotides alternates,
as indicated by arrows in the contrast-magnified
image. This brightness relation also applies to thepairing rows. Since adenine has a larger atomic
skeleton and HOMO nearer to the STM bias
voltage (smaller ionization potential) compared to
thymine [18,19], we conclude that the brighter and
dimmer spots correspond to the base sequence of
dA and dT, respectively. In addition to the differ-
entiation of poly(G–C)–poly(G–C) and poly(A–
T)–poly(A–T), a pair of single strands forming adouble-stranded structure and even individual nu-
cleotides have been visualized and sequenced, val-
idating the Watson and Crick DNA model at the
single molecule level 50 years after its discovery.
Acknowledgements
We thank Drs. N. Miyoshi and M. Nishimura
for assistance in the preparation of DNA and
collection of measurements, and Drs. K. Suzuki
and M. Furukawa for helpful discussions. This
work was performed under the Center of Excel-
lence (COE) program supported by the Ministry of
Education, Science, Sports, and Culture, Japan.
References
[1] J.D. Watson, F.H.C. Crick, Nature 171 (1953) 737.
[2] G. Binnig, H. Rohrer, Helv. Phys. Acta. 55 (1982) 726.
[3] R. Guckenberger, W. Wiegrabe, T. Hartmann, W. Bau-
meister, in: R. Wiesendanger, H.J. Guntherodt (Eds.),
Scanning Tunneling Microscopy II, Springer, Berlin, 1992
(Chapter 3).
[4] R. Wiesendager, Scanning Probe Microscopy and Spec-
troscopy, Cambridge University Press, 1994.

L536 H. Tanaka, T. Kawai / Surface Science 539 (2003) L531–L536SU
RFACE
SCIENCE
LETTERS
[5] T.P. Beebe Jr., T.E. Wilson, D.F. Ogletree, J.E. Katz, R.
Balhorn, M.B. Salmeron, W.J. Siekhaus, Science 243
(1989) 370.
[6] G. Lee, P.G. Arscott, V.A. Bloomfield, D.F. Evans,
Science 244 (1989) 475.
[7] P.G. Arscott, L. Lee, V.A. Bloomfield, D.F. Evans, Nature
339 (1989) 484.
[8] R.J. Driscoll, M.G. Youngquiist, J.D. Baldescwieler,
Nature 346 (1990) 294.
[9] C.R. Clemmer, T.P. Beebe Jr., Science 251 (1991) 640.
[10] W.M.Heckl, G. Binnig, Ultramicroscopy 42–44 (1992) 1073.
[11] H. Tanaka, T. Kawai, J. Vac. Sci. Technol. B 15 (3) (1997)
602.
[12] H. Tanaka, C. Hamai, T. Kanno, T. Kawai, Surf. Sci. 432
(1999) L611.
[13] K. Sugiura, H. Tanaka, T. Mastumoto, T. Kawai, Y.
Sakata, Chem. Lett. 1999 (1999) 1193.
[14] H. Kasai, H. Tanaka, S. Okada, H. Oikawa, T. Kawai,
H. Nakanishi, Chem. Lett. 2002 (2002) 696.
[15] T. Kanno, H. Tanaka, T. Nakamura, H. Tabata,
T. Kawai, Jpn. J. Appl. Phys. 38 (1999)
L606.
[16] C. Hamai, H. Tanaka, T. Kawai, J. Phys. Chem. 104
(2000) 9894.
[17] N. Sugimoto, S. Nakano, M. Yoneyama, K. Honda,
Nucleic Acids Res. 24 (1996) 4501.
[18] S. Urano, X. Yang, P.R. LeBreton, J. Mol. Struct. 214
(1989) 315.
[19] H. Tanaka, J. Yoshinobu, T. Kawai, M. Kawai, Jpn. J.
Appl. Phys. 35 (1996) L244.