VISUALIZATION OF DENSITY FUNCTIONS WITH GEOGEBRA · Continuous distributions Statistical functions...
24
Continuous distributions Statistical functions in GeoGebra Visualization and Curve fitting VISUALIZATION OF DENSITY FUNCTIONS WITH GEOGEBRA Csilla Csendes University of Miskolc, Hungary Department of Applied Mathematics ICAM 2010
-
Upload
truongkien -
Category
Documents
-
view
222 -
download
0
Transcript of VISUALIZATION OF DENSITY FUNCTIONS WITH GEOGEBRA · Continuous distributions Statistical functions...

Continuous distributions Statistical functions in GeoGebra Visualization and Curve fitting
VISUALIZATION OF DENSITY FUNCTIONSWITH GEOGEBRA
Csilla Csendes
University of Miskolc, HungaryDepartment of Applied Mathematics
ICAM 2010

Continuous distributions Statistical functions in GeoGebra Visualization and Curve fitting
Probability density functions
A random variable X has density f , where f is a non-negativeLebesgue-integrable function, if:
P[a ≤ X ≤ b] =
∫ b
af (x) dx .
Hence, if F is the cumulative distribution function of X , then:
F (x) =
∫ x
−∞f (u) du
Intuitively, one can think of f (x)dx as being the probability of Xfalling within the infinitesimal interval [x, x + dx].

Continuous distributions Statistical functions in GeoGebra Visualization and Curve fitting
Stable distributions
Stable distributions
Definition (broad sense)Let X ,X1,X2, ... be iid. random variables. The distribution of Xis stable if it is not concentrated at one point and if for each nthere exist constants an > 0 and bn such that
X1 + X2 + ...+ Xn
an− bn
has the same distribution as X .

Continuous distributions Statistical functions in GeoGebra Visualization and Curve fitting
Stable distributions
Properties
infinite variancenon-known density and distribution functiondescribe with characteristic functionapplications: finance, signal processing, etc.class of possible limit distributions as a solution to thedomain of attraction problem

Continuous distributions Statistical functions in GeoGebra Visualization and Curve fitting
Stable distributions
Parameters
Characterizationcharacteristic exponent or index of stability α ∈ (0,2]
skewness β ∈ [−1,1]
scale γ ≥ 0location δ ∈ R
Characteristic function
φ(u|α, β, γ, δ) = E exp(iuZ ) = exp(−γα[|u|α + iβη(u, α)] + iuδ),
η(u, α) =
{−(signu)tan(πα/2)|u|α, if α 6= 1,(2/π)u ln |u|, if α = 1.

Continuous distributions Statistical functions in GeoGebra Visualization and Curve fitting
Stable distributions
Density functions
α = 1 - Cauchy distributionα = 2 - Normal distribution

Continuous distributions Statistical functions in GeoGebra Visualization and Curve fitting
Other Continuous Distributions
Exponential distribution
The exponential distribution occurs naturally when describingthe lengths of the inter-arrival times in a homogeneous Poissonprocess.
parameter λ > 0 (rate parameter)An exponential random sample can be generated asln(1− U) where U is uniformly distributed.
Probability density function:
f (x) =
{λe−λx if x ≥ 0,0, otherwise

Continuous distributions Statistical functions in GeoGebra Visualization and Curve fitting
Other Continuous Distributions
Gamma distribution
The pdf. of the gamma distribution can be expressed interms of the gamma function parameterized in terms of ashape parameter k and scale parameter θ. Both k and θwill be positive values.sum of k independent exponentially distributed randomvariables, each of which has a mean of θfrequently a probability model for waiting times; forinstance, in life testing, the waiting time until death
Probability density function
f (x ; θ, k) = xk−1 e−x/θ
θk Γ(k)x ≥ 0, k , θ > 0

Continuous distributions Statistical functions in GeoGebra Visualization and Curve fitting
Other Continuous Distributions
Chi-square distribution
If X1, ...,Xk are independent, standard normal randomvariables, then the sum of their squares
Q =k∑
i=1
X 2i
is distributed according to the chi-square distribution with kdegrees of freedom.
Probability density function
f (x ; k) =1
2k/2Γ(k/2)xk/2−1e−x/2

Continuous distributions Statistical functions in GeoGebra Visualization and Curve fitting
Statistical tools
Basics
Mean[list of numbers L]Mode[list of numbers L]Median[list of numbers L]Variance[list of numbers L]CorrelationCoefficient[List of x-Coordinates, List ofy-Coordinates]

Continuous distributions Statistical functions in GeoGebra Visualization and Curve fitting
Statistical tools
BoxPlot
BoxPlot[yOffset, yScale, List of Raw Data]: Creates abox plot using the given raw data and whose verticalposition in the coordinate system is controlled by variableyOffset and whose height is influenced by factor yScale.BoxPlot[yOffset, yScale, Start Value a, Q1, Median, Q3,End Value b]: Creates a box plot for the given statisticaldata in interval [a, b].

Continuous distributions Statistical functions in GeoGebra Visualization and Curve fitting
Statistical graphics
Histograms
A histogram is a graphical display of tabular frequencies,shown as adjacent rectangles.A histogram may also be based on relative frequencies. Itthen shows the proportion of cases that fall into each ofseveral categories, with the total area equaling 1.Histograms are used to plot density of data, and often fordensity estimation: estimating the probability densityfunction of the underlying variable. The total area of ahistogram used for probability density is always normalizedto 1.

Continuous distributions Statistical functions in GeoGebra Visualization and Curve fitting
GeoGebra functions - Syntax
Histogram
Histogram[List of Class Boundaries, List of Heights]:Creates a histogram with bars of the given heights. Theclass boundaries determine the width and position of eachbar of the histogram.Histogram[List of Class Boundaries, List of Raw Data]:Creates a histogram using the raw data. The classboundaries determine the width and position of each bar ofthe histogram and are used to determine how many dataelements lie in each class.

Continuous distributions Statistical functions in GeoGebra Visualization and Curve fitting
GeoGebra functions - Syntax
BarChart
BarChart[Start Value, End Value, List of Heights]: Creates abar chart over the given interval where the number of bars isdetermined by the length of the list whose elements are theheights of the bars.
BarChart[Start Value a, End Value b, Expression, Variable k,From Number c, To Number d]: Creates a bar chart over thegiven interval [a, b], that calculates the bars heights using theexpression whose variable k runs from number c to number d.
BarChart[Start Value a, End Value b, Expression, Variable k,From Number c, To Number d, Step Width s]: Creates a barchart over the given interval [a, b], that calculates the barsheights using the expression whose variable k runs from numberc to number d using step width s.
BarChart[List of Raw Data, Width of Bars]: Creates a barchart using the given raw data whose bars have the given width.

Continuous distributions Statistical functions in GeoGebra Visualization and Curve fitting
Histograms
Normal distribution

Continuous distributions Statistical functions in GeoGebra Visualization and Curve fitting
Histograms
Levy distribution

Continuous distributions Statistical functions in GeoGebra Visualization and Curve fitting
Histograms
Cauchy distribution
Continuous distributions Statistical functions in GeoGebra Visualization and Curve fitting
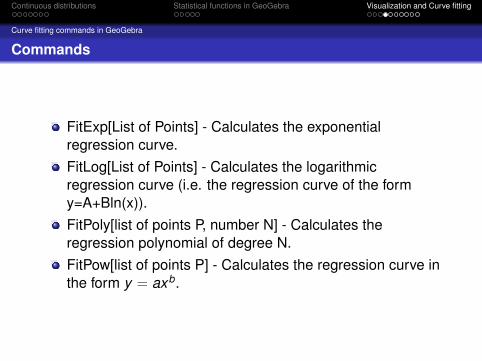
Curve fitting commands in GeoGebra
Commands
FitExp[List of Points] - Calculates the exponentialregression curve.FitLog[List of Points] - Calculates the logarithmicregression curve (i.e. the regression curve of the formy=A+Bln(x)).FitPoly[list of points P, number N] - Calculates theregression polynomial of degree N.FitPow[list of points P] - Calculates the regression curve inthe form y = axb.

Continuous distributions Statistical functions in GeoGebra Visualization and Curve fitting
Curve fitting commands in GeoGebra
Normal distribution, polynomials of 8 and 9 degrees

Continuous distributions Statistical functions in GeoGebra Visualization and Curve fitting
Curve fitting commands in GeoGebra
Normal distribution, polynomials of 10 and 12 degrees

Continuous distributions Statistical functions in GeoGebra Visualization and Curve fitting
Curve fitting commands in GeoGebra
Cauchy distribution, polynomials of 8 and 9 degrees

Continuous distributions Statistical functions in GeoGebra Visualization and Curve fitting
Curve fitting commands in GeoGebra
Cauchy distribution, polynomials of 12 and 13 degrees

Continuous distributions Statistical functions in GeoGebra Visualization and Curve fitting
Curve fitting commands in GeoGebra
Exponential distribution, exponential curve
f (x) = 0.29e−1.06x

Continuous distributions Statistical functions in GeoGebra Visualization and Curve fitting
Curve fitting commands in GeoGebra
THANKS FOR YOUR ATTENTION!