
Visualising the school-to-work transition: an analysis ... · Visualising the school-to-work...
26
* † ‡§ * † ‡ §
Transcript of Visualising the school-to-work transition: an analysis ... · Visualising the school-to-work...
Visualising the school-to-work transition: an analysis
using optimal matching∗
Richard Dorsett†and Paolo Lucchino‡§
November 7, 2012
Abstract
This paper explores the school-to-work transition in the UK with the aim of achiev-
ing a richer understanding of individuals' choices and activities in the �ve years after
reaching school-leaving age. Through the technique of `optimal matching', we assess the
degree of similarity between individuals' post-16 experiences in a way that captures the
full detail of their �ve-year histories. We consider individuals reaching school-leaving
age between 1991 and 2003 and, on the basis of the measures of similarity, identify a
small number of distinct transition patterns. Our results suggest that while 9 out of
10 young people have generally positive experiences post-16, the remaining individuals
exhibit a variety of histories that might warrant policy attention. We assess the extent
to which characteristics at age 16 can predict which type of trajectory a young person
will follow. Our results con�rm the predictive power of school attainment (grades),
family background (parental quali�cations, parental and sibling labour market status)
and gender. These characteristics are known to be strongly correlated across individu-
als and raise concerns about the degree of socio-economic polarisation in the transition
from school to work.
∗Under review for the Journal of Social Policy, published by Cambridge University Press†National Institute of Economic and Social Research‡Corresponding author: National Institute of Economic and Social Research, 2 Dean Trench Street, Smith
Square, London SW1P 3HE. Email: [email protected]; Tel: +44 (0)20 7654 1939§Acknowledgements: The authors would like to thank the Nu�eld Foundation of its support through grant
EDU/39082. The authors are grateful for comments received at seminars held at the ACEVO Commissionon Youth Unemployment, the UK Social Policy Conference and at the National Institute of Economic andSocial Research. Any errors are responsibility of the authors.
1

1 Introduction
While youth unemployment hit a record high in the wake of the recent recession, the UKyouth labour market had in fact started to deteriorate as early as 2004 for reasons that arenot well-understood (Goujard et al. 2011). Underlying the cyclical �uctuations, therefore,appears to be a deeper structural problem in the transition from school to work. Shiftingsocial and economic conditions over the last three decades in Britain, and indeed globally(Bynner 2001, Lawy 2002), have diminished the centrality of the traditional route of earlyschool-leaving and rapid entry into employment (Pollock 2007). Trajectories have becomemore individualised, with educational attainment gaining an increasing importance in shap-ing young people's life chances and exposing the poorest and lowest-achieving young peopleto greater vulnerability (Pollock 2007, Bynner 2001). Indeed, a relatively large body of liter-ature documents the social polarisation in the transition from school to work. (Micklewright1989, Dickerson & Jones 2004, Rice 1999, Spielhofer 2009, Gregg et al. 1998) While the ef-fects of disadvantage are similar across countries, these are found to be particularly markedin the UK (Ryan 2001). There is, furthermore, evidence of the existence of a hardcore groupof youth who fall between the cracks in school-to-work transition institutions and spend asubstantial amount of time NEET after the end of compulsory schooling. Research evidencepoints to speci�c personal circumstances and characteristics that go beyond mere familyand social background, such as truancy, bullying, health, disability, pregnancy and caringresponsibilities as well as attitudinal or behavioural factors such as low con�dence or selfesteem (Stone et al. 2000, Rennison et al. 2000, Sachdev et al. 2006, Gregg et al. 1998).Increasingly therefore, as con�rmed in research by Fergusson et al. (2000), the experiencesof many young people following compulsory education do not follow stable, linear and `tra-ditional' transition trajectories, but complex and often circular movements through multipledestinations.
This paper makes studies a sample of youth reaching the end of compulsory schoolingbetween 1991 and 2003 in the UK, and traces their pathways over the following �ve years.It makes two contributions. Firstly, it uses an innovative statistical technique � optimalmatching � to compare individuals' experiences and uncover patterns shared among them.The appeal of this approach is that it captures the full richness of individuals' experiencespost-school leaving age. In doing so, it overcomes the limitations of commonly used statisticswhich generally summarise outcomes at a point in time (e.g. the unemployment rate) or overa speci�ed period (e.g. time spent unemployed in the previous year) and, as a consequence,discard important information on labour market dynamics, such as the order in which eventsoccur. Such statistics are likely to be less appropriate for the youth labour market, wherethe speci�cities of employment and joblessness problems (Rees 1986) and the importanceof distinguishing between school-to-work transitions characterised by short or long-term dif-
Page 2 of 26

�culties (Ryan 2001) have been widely recognised. Optimal matching situates individuals'experiences at a given point within their wider labour market histories and can distinguish,for example, between transitory `gap years' and deep disconnect from the labour market. Itshifts the emphasis from the analysis of a speci�c step to considering the general featuresof the transition process, including initial circumstances, the routes followed by individuals,and, importantly, �nal outcomes.
Drawing on this technique, we are able take a broad look at school-to-work transitionsin the UK and identify a small number of distinct transition patterns. This builds onearlier research that used optimal matching to study youth employment histories and theschool to work transition in the UK (Halpin & Chan 1998, Schoon et al. 2001, Anyadike-Danes & McVicar 2005, Martin et al. 2008) and in a comparative perspective (Scherer 2005,Brzinsky-Fay 2007, Quintini & Manfredi 2009). However, most of this literature relies on longretrospective histories which may su�er from recall bias (Paull 2002). Brzinsky-Fay (2007)and Quintini & Manfredi (2009) are exceptions to this, but use data on youth histories up toonly 2000 and 2001 respectively. We therefore add to the existing literature by consideringdetailed monthly histories extending to 2008 and constructed from annually repeated surveydata to minimise recall bias. Finally, in consideration of recent methodological advances inthe �eld of optimal matching (Martin & Wiggins 2011), we take care to ensure our use ofsuch technique is suitably justi�ed by theory, as detailed in the relevant section below.
As the second contribution of the paper, we identify which characteristics at age 16 canact as early predictors of unsuccessful trajectories in the labour market. The ability to knowin advance who is at risk in this way provides important clues as to the type of policy thatmight be e�ective and who it should target. However, much of the relevant literature has,again, focused on the in�uence of characteristics on future outcomes de�ned at a speci�cpoint in time. As above, the prevailing approach does not distinguish by the transienceof such outcomes. Building on Anyadike-Danes & McVicar (2005, 2010), we therefore usethe groupings identi�ed in the �rst part of the analysis to focus on what characteristics areassociated with successful or unsuccessful outcomes as de�ned by the nature of one's overalltrajectory post compulsory schooling.
Our results suggest that 9 out of 10 young people experience generally successful labourmarket trajectories between ages 16 and 21. These are predominantly smooth transitionsfrom education to work, or long spells of education, in some cases interrupted by one spell ofemployment or a formal placement. On the other hand, the remaining individuals exhibit avariety of histories that might warrant policy attention. We identify six key at risk groups:individuals who experience a (possibly planned) break from employment but then appear tostruggle to return to work; individuals experiencing some employment but developing onlylimited labour market attachment; individuals exhibiting patterns of long-term worklessnessstraddling unemployment and inactivity; those in long-term inactivity from the age of 16;
Page 3 of 26

those in long-term inactivity from the age of 18; and individuals who appear to withdraw fromthe labour market following an apparently successful entry into employment. The subsequentanalysis con�rms the importance of school attainment (grades), family background (parentalquali�cations, parental and sibling labour market status), and gender as strong predictorsof future labour market trajectories, which, being highly correlated across individuals, givesrise to a signi�cant level of socio-economic polarisation.
The paper is structured as follows. Section 2 introduces the technique of optimal matchingand the methodological approach taken. A description of the data used is presented in Section3. The results from optimal matching are presented in Section 4 and are followed by resultsfrom the analysis of individual predictors of future labour market trajectories in Section 5.Section 6 concludes.
2 Creating a typology of school-to-work transitions
2.1 Approach
We explore the ways the school-to-work transition unfolds in the UK by creating a typologyof youth labour market histories (or sequences). This consists of two steps. Firstly, weuse optimal matching techniques to construct of a measure of dissimilarity between eachpair of sequences (Sanko� & Kruskal 1983, Abbot & Forrest 1986). Secondly, we applycluster analysis techniques to the derived measures of dissimilarity to group similar sequencestogether.1
Optimal matching is a relatively novel technique in the social sciences and deserves a morethorough presentation. The optimal matching algorithm derives a measure of dissimilaritybetween two sequences as a function of the number and type of operations on the elements ofthese sequences that are necessary to transform one sequence into the other. Such operationscan be combinations of insertions/deletions (indels) and substitutions of elements. Figure 1gives examples of how the same two sequences could be reconciled in alternative ways.
In Panel A, Sequence B is transformed into Sequence A by using substitutions only. Theapproach, measuring what is known as the Hamming distance, retains the timing of eventsand measures dissimilarity as the number of elements that need to be altered. On the otherhand, Panel B shows how insertions and deletions can be used to reconcile the two sequences.In this case, the algorithm will try to align common sub-sequences. The resulting measure ofdissimilarity will therefore be lower the more the sequences share common subsections. Assuch, this is known as the longest common subsequence distance. This measure emphasises
1We do this using Ward's method, which groups sequences in such a way as to minimise the variancewithin each cluster.
Page 4 of 26

Figure 1: Optimal matching operations
the presence of common subsections and the ordering of elements. However, as elements aredeleted or inserted, any relationship of contemporaneity across sequences may be broken.The temporal dimension within a sequence may also be altered as, when elements are deleted(inserted), neighbouring elements become temporally closer (more distant). This causes awarping or slowing down of time, which may not be suitable in certain contexts (more onthis below). Falling between these two extremes, alternative measures of dissimilarity can beconstructed using a combination of both types of operations by assigning each operation aspeci�ed `cost'. This cost will represent the amount such operation will add to the measureof dissimilarity. For example, an arguably `default' option is to set the cost of substitutionbe equal to the cost of a deletion followed by an insertion, as these would yield the samechange in the sequence.
2.2 Cost setting and measures of distance
The costs of each operation determine how dissimilarity is de�ned in the context under studyand how sequences are matched. Specifying a menu of costs is therefore an important step inthis process as it may in�uence the results that emerge. The literature does not set rigid ruleson this. However, there is scope to parameterise the cost matrix to make it more consistentwith theoretically-informed de�nitions of what constitutes similarity in the context understudy. A few considerations may be relevant here.
Firstly, the relative importance of the timing of events compared to the order of events canbe set through the cost assigned to indel operations. As mentioned above, similarities withinsubsections are emphasised by allowing indels to incur a low cost and may be appropriate
Page 5 of 26

when order is of most interest. This may be the case when studying, for example, theevolution of mental health or sentence structure. However, as indels cause a time-warpe�ect and break the contemporaneity between di�erent sequences, they should be limitedwhere timing is important. One example of such context is the study of working patternsover the 24 hours of the day (Lesnard 2009). More generally, timing will be relevant whensequences are de�ned over a socio-economic `calendar', which could be a very �xed temporalcycle (such as the working week), but also a somewhat looser institutional system (such asthe higher education system) or even a natural calendar (such as the stages in early childhooddevelopment).
Secondly, it is possible to de�ne the socioeconomic proximity of di�erent states throughthe costs assigned to di�erent pairs of substitutions. For example, in some contexts, self-employment can be considered to be closer to employment than to inactivity (Anyadike-Danes & McVicar 2005) and a substitution into the former might therefore be given a lowersubstitution cost. Furthermore, the cost of a substitution may vary depending on where itoccurs in the sequence. This variation can be set exogenously or be informed by the data.An example of the latter case could be setting the cost of a substitution to be the inverse ofthe unconditional probability of a transition occurring at a given point in time as calculatedfrom the data.2 This approach is used in Lesnard (2009) on working time and implies,for example, considering the substitution `not working' for `working' at the 9am element ofthe sequence to be substantially cheaper than the same substitution at 1am, as many moreindividuals exhibit such a transition at 9am than at 1am.
In analysing post-compulsory school histories, we make the following considerations.Firstly, our sequence represents the �ve academic years after the end of compulsory school-ing, and as such is set within a clear socio-economic `calendar'. There is a strong element ofcontemporaneity across sequences (e.g. summers occur at the same points in all sequences).For this reason, we retain this by not allowing indels. This requires having sequences ofthe same length. Furthermore, the institutional set up of the further education system islikely to shape observed patterns of transition (e.g. the A-level structure implies there arelikely to be transition points at the end of the �rst two years, while less so at other pointsin the academic calendar). To address this we use time-varying substitution costs de�ned asthe inverse of the unconditional transition probability at the speci�c point in the sequence,
2Following Lesnard (2006):
st (a, b) =
{4− [P (Xt = a|Xt−1 = b) + P (Xt = b|Xt−1 = a) + P (Xt+1 = a|Xt = b)] + P (Xt+1 = b|Xt = a) if a 6= b
0 otherwise
This states that the substitution cost of substituting a for b or vice versa will be a declining functionof the frequency of such transition at the given point in time, as measured in the data by the conditionalprobabilities of an a to b or b to a transition between the current and adjacent periods.
Page 6 of 26
as described above. The distance measure obtained when imposing these two conditions iscalled the dynamic hamming distance (Lesnard 2006).
2.3 Advantages and limitations
The combination of optimal matching with cluster analysis is a powerful statistically-driventechnique that can synthesise large amounts of information from complex sequences andcategorise these into relatively homogenous groups. The strength of optimal matching liesin its holistic nature, as its algorithm draws on information from the full set of elements in asequence. For this reason, it overcomes limitations of other commonly used statistics, which,as already mentioned, generally summarise outcomes at a point in time or over a speci�edperiod and therefore discard important information on labour market dynamics. Instead,optimal matching allows histories to be compared in their full dynamic richness, includingthe type, length, order and timing of spells. We can then distinguish, for example, betweenschool-to-work transitions characterised by short di�culties and those that are suggestiveof more deep-rooted problems. By avoiding the simpli�cation that arises from relying onsummary statistics, optimal matching has proved to be a very �exible technique. While itsorigins are found in the study of DNA sequences, it has increasingly been used in the socialsciences. For example, it has been used to compare status biographies (such as employmentcareers, partnership histories, mental health `careers' of service use etc), the content of collegetextbooks, English folk dances, birdsong patterns, local dialects, lynching patterns and more(see Martin & Wiggins (2011), for a review).
This growing popularity has not been without criticism (Wu 2000, Elzinga 2003, Levine2000). In particular, critics argue that while operations such as insertions, deletions andsubstitutions equate actual chemical processes in a DNA strand, their meaning in a socio-economic context is less clear, and that the same therefore would hold of any resultingmeasure of distance. Furthermore, the lack of formal rules to the de�ne the cost matrix hasalso attracted criticism, as results may be determined by arbitrary choices of the researcher(Wu 2000). Finally, it is worth pointing out that cluster analysis is also not free fromlimitations, such as the existence of multiple solutions when the data contain ties (Morgan& Ray 1995), the sensitivity of the results to di�erent cluster algorithms (Everitt et al. 2011)and the element of judgement required in the selection of the number of clusters.
Optimal matching analysts have tended respond by stressing that optimal matching, andthe operations on the sequence, are not intended to be a model of reality or an exercise insocial engineering, but rather a way of constructing a synthetic measure of di�erence fromsequences containing very complex information (Abbott 2000, Lesnard 2006). Simulationexercises aimed at understanding the sensitivity of resulting distance measures to cost-settingassumptions have only recently emerged (Halpin 2010) and this relationship is not yet fully
Page 7 of 26
understood (Martin & Wiggins 2011). Some have commented that optimal matching resultsare often robust to variation in costs (Abbott & Tsay 2000), which can be viewed as evidencein favour of the existence of objective patterns in the data. On the other hand, this wouldalso imply that the di�erent parameterisations are therefore not falsi�able (Levine 2000).
While optimal matching may arguably be no more subjective or partial than many otherdescriptive techniques, it is nevertheless worth giving due consideration to how the algorithmshould be applied and the limitations of the results it delivers. For this reason, we try to makean informed choice in setting the costs as we have motivated above. The intention here is notto mine the data for patterns, but to de�ne how the algorithm should conceive of similarity.Nevertheless, while a given parameterisation of optimal matching followed by cluster analysiswill yield a typology that satis�es the speci�ed numerical optimality conditions, whether theresulting typology does in fact have an objective socio-economic signi�cance or the extentto which this meaning may be attributed subjectively ex-post by the researcher remainopen questions. We recognise this element of subjectivity and therefore caution the readerfrom taking our descriptions of the groups identi�ed as absolute. However, the plausibilityof the results presented below and our con�dence that these will be relatively consistentlyinterpreted by the majority of observers, strengthens our belief that these techniques havesigni�cant descriptive power and are capable of identifying patterns that genuinely exist inthe data, and hence in society.
3 Data
The analysis used data from the British Household Panel Survey (BHPS), a longitudinalsurvey which followed a nationally representative sample of households at yearly intervalsfrom 1991 to 2008.3 The design of the survey is such that children within sampled house-holds become eligible for full (adult) interviews once they reach age 16, and are interviewedannually thereafter. Our attention is focused on such children.
We constructed a month-by-month history for each young person, building on the carefulstudies of other researchers (Paull 2002, Maré 2006) into how the BHPS can best be usedto generate consistent series. Indeed, the BHPS consists of a main questionnaire aboutcircumstances at the time of interview and a job history module where individuals recall theiremployment and activity history over the previous 12 to 18 months. Depending on the monthof interview, the recall period will overlap with information given at the previous interviewwave.4 Constructing consistent work-life histories requires reconciling any inconsistenciespresent in this overlap. We do so following the reconciliation techniques provided in Maré
3Booster samples were added in 1999 and 2001.4Wave X interviews occur between September X and April X+1. Individuals are asked to recall their
activity back to September X-1, thereby covering a period of 12 to 18 months, depending on the month of
Page 8 of 26

(2006). An advantage of focusing on those observed to turn 16 is that we observe theirfull labour market histories without having to rely on long-term respondent recall. Sinceinterviews take place annually, respondents are not required to recollect experiences frommore than (roughly) one year before.5 This is an important consideration as Paull (2002)�nds that individuals with the most transient behaviour, in many cases the very people ofmost interest, have the greatest di�culty accurately recalling their prior experiences. She also�nds that young people tend to overestimate the amount of time spent in employment as therecall period lengthens. The granularity of information within a labour market trajectoryis lost when using long-term retrospective data, so relying on recall periods of about oneyear keeps this potential bias to an absolute minimum. Secondly, as we are interested instatus biographies covering periods of employment as well as non-employment, we follow the`main activity' de�nition of status as in Paull (2002). This state is de�ned according to theindividuals' own identi�cation of their main activity from a list of 10 available choices.6 Wegrouped these responses into four high-level labour market states: `employment', `full-timeeducation', `NEET - unemployed' and `NEET - not active in the labour market'. We splitthe conventional de�nition of NEET to better understand whether di�erent reasons for non-employment lead to distinct trajectories. Inevitably, this approach to de�ning an individual'slabour market status has limitations. Firstly, there will be an element of subjectivity in theresponses, which may also vary across individuals (Paull 2002). Secondly, this measure doesnot allow for the possibility that individuals may be engaged in more than one activity at thesame time, such as employment and full-time education. These cases will be treated as beingin only one of the two, depending on the individual's own view of which best describes theirsituation.7 For these reasons, our de�nitions will not be consistent with o�cial labour marketmeasures such as the ILO unemployment rate. Indeed, the histories tend to overestimateeducational participation, underestimate o�cial youth employment rates but closely trackDepartment for Education NEET rates. Finally, we do not have information on part-timeeducation. Overall, however, the data provide a rich description of the history of youth inthe sample and can therefore provide important insights into their labour market experience.
We restrict our attention to the (roughly) 1,400 individuals observed for �ve consecutiveyears starting from the month they could legally leave school. This yields a 60-elementsequence for each of the individuals in our sample, where each element can take only one
interview. As previous wave interviews occurred in September X-1 or later, some months will be reportedon twice by survey respondents.
597% of the months in the reconstructed life-work histories rely on recall of 14 months or less.6There were: self-employed; employed; unemployed; retired; maternity leave; family care; full-time stu-
dent; long-term sick/disabled; Government training scheme; and other.7Concurrent employment and main activities other than employment can be identi�ed at the time of
interview but not in the months between interview waves where only one's main activity is recorded. Forthis reason, only individuals' main activities could be derived consistently across the observation period.
Page 9 of 26

of the four above-mentioned labour market states. As discussed in the previous section,having sequences of the same length is necessary when calculating the dynamic hammingdistance. This implies restricting our attention to individuals who are observed in the surveyfor the full �ve years. To account for possible non-randomness of remaining in the survey,we estimate a probability model of attrition within �ve years and use this to adjust eachyoung person's BHPS cross-sectional weight taken at the point where they can legally leaveschool.
4 Trajectory types
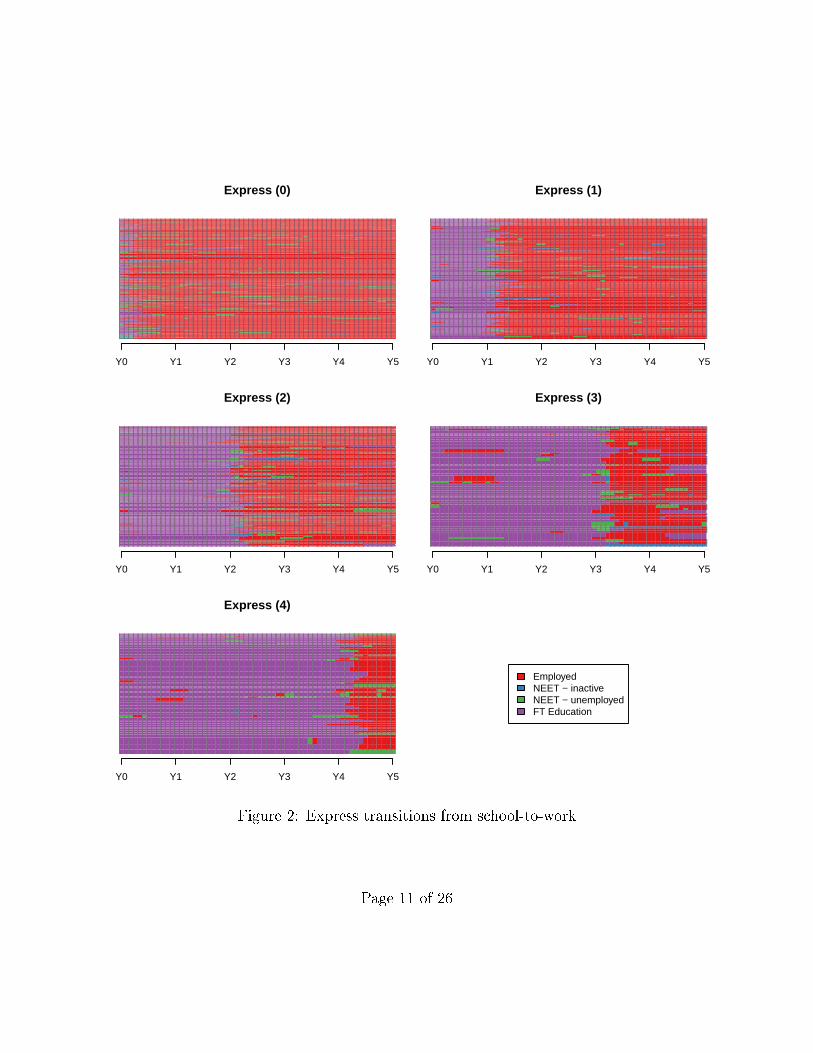
The trajectories typifying each of the groups identi�ed through the two-step procedure de-scribed above can be visualised through graphs showing the full histories of each groupmember. Recalling how each sequence consists of 60 elements (one for each month) eachtaking one of four values (employment; full-time education, NEET-unemployed; and NEET-inactive), individual histories can be represented by a horizontal series of colour-coded dots.Stacking such plots for all individuals in a given group gives an immediate picture of thegeneral labour market dynamics characterising that group.
Overall, we identi�ed 14 groups. These can themselves be grouped into three high-levelcategories. Figure 2 plots the sequences from school leaving age (Y0) to �ve years later(Y5) for individuals falling within one of the �ve groups experiencing smooth transitionsfrom education to work, and only di�ering in the number of additional years of educationbefore the transitions occurred. Note that the size of each plot is not an indication of thegroup's size (which is discussed at the end of this section). Following Brzinsky-Fay (2007)and Quintini & Manfredi (2009), we called these `Express' education to work transitions.
A further four groups describing predominantly educational trajectories are shown inFigure 3. The �rst group describes individuals who stay in education throughout, while in-dividuals in the remaining two groups also spend a substantial time in education interruptedby one (or in fewer cases two) academic year(s) in employment. We called these `Full-timeeducation' and `Full-time education with an employment spell' respectively. The latter ti-tle is likely to be inadequate for a minority of individuals in these groups who experienceda longer interruption from education and might be best termed `returners to education'.However, given their relatively small number we decided against splitting this group further.
The remaining individuals exhibit a variety of histories that might warrant policy atten-tion. Their trajectories are depicted in Figure 4 and include individuals who experience a(possibly planned) break from employment but may struggle to return to work; individu-als experiencing some employment but developing only limited labour market attachment;patterns of long-term worklessness straddling unemployment and inactivity; long-term inac-tivity from the age of 16 or from age 18; and individuals who appear to withdraw from the
Page 10 of 26
Express (0)
Y0 Y1 Y2 Y3 Y4 Y5
Express (1)
Y0 Y1 Y2 Y3 Y4 Y5
Express (2)
Y0 Y1 Y2 Y3 Y4 Y5
Express (3)
Y0 Y1 Y2 Y3 Y4 Y5
Express (4)
Y0 Y1 Y2 Y3 Y4 Y5
EmployedNEET − inactiveNEET − unemployedFT Education
Figure 2: Express transitions from school-to-work
Page 11 of 26

FTE throughout
Y0 Y1 Y2 Y3 Y4 Y5
FTE w/ emp spell (1)
Y0 Y1 Y2 Y3 Y4 Y5
FTE w/ emp spell (2)
Y0 Y1 Y2 Y3 Y4 Y5
EmployedNEET − inactiveNEET − unemployedFT Education
Figure 3: Accumulating human capital
Page 12 of 26

Description oftrajectory
Accumulatinghuman capital
Successfulschool to work
transition
Possible causefor concern
Estimatednumber eachyear ('000s)
FTE throughout 24.4% 190FTE withemploymentspell
7.8% 60
Express 56.4% 430Plannedinterruption?
1.0% 10
Partial recovery 2.9% 20Long-termworklessness
2.6% 20
NEET from 16 2.1% 20NEET from 18 1.3% 10Withdrawalsfrom the labourmarket
1.3% 10
Total 32.3% 56.4% 11.3% 760
Table 1: Trajectory groups and relative size
labour market following an apparently successful entry into employment.Table 1 presents the �nal typology we identi�ed and an estimate of the size of each
type. The results suggest that 9 out of 10 young people experience generally successfullabour market trajectories, while the remaining 1 in 10 exhibit one of the above-mentionedtrajectories that might warrant policy concern. The �nal column provides an estimate ofthe number of 16-year-olds entering each trajectory each year, based on O�ce for NationalStatistics mid-2010 Population Estimates.
The types of trajectories identi�ed above show a broad agreement with previous researchusing similar approaches. Indeed, both Brzinsky-Fay (2007) and Quintini & Manfredi (2009)identify typologies that closely resemble some of the histories grouped above. Both �nd alarge `Express' group; a group returning to education after a period in work or inactiv-ity (their `Link', `Return', `Break' and `Gap year' groups); a group �nding work after arelatively long period of unemployment ('Detour'); groups experiencing long periods out
Page 13 of 26

Planned interruption?
Y0 Y1 Y2 Y3 Y4 Y5
Partial recovery
Y0 Y1 Y2 Y3 Y4 Y5
Long−term worklessness
Y0 Y1 Y2 Y3 Y4 Y5
NEET from 16
Y0 Y1 Y2 Y3 Y4 Y5
NEET from 18
Y0 Y1 Y2 Y3 Y4 Y5
Withdrawals from the labour market
Y0 Y1 Y2 Y3 Y4 Y5
Figure 4: Possible cause for concern
Page 14 of 26

of work ('Failure' and `Discouraged'); and groups in sustained inactivity ('Disconnect' and`Dropout'). While their analyses focus on several countries, both provide an estimate of thesize of each group in the UK. As above, they �nd that the `Express' pathways is by far themost common. While they �nd that each of the other typologies refers to a minority ofindividuals, their `problem' groups tend to be somewhat larger. This may be reconciled bythe di�erent observation period used: their sequences are de�ned from when the individual�rst leaves full-time education, while ours start from the end of compulsory schooling. We dothis because we consider the choice to stay in education as an integral part of the unravellingof one's transition from the world of education to that of work.8 It is possible, therefore,that individuals who we �nd as exhibiting a stable trajectory within the de�ning structureof the educational system over the �ve years we consider may later move onto less fortunatetrajectories once they leave the education system.
5 Predicting future labour market outcomes
Understandably, individuals in the six `possible cause for concern' groups will be of greatestinterest to policy-makers. In particular, the ability to identify in advance who is at risk ofan unsuccessful transition into the labour market is clearly important to inform the type ofpolicy that might be e�ective and who it should target.
Table 2 shows the distribution of selected characteristics among individuals in eachgroup.9 Note, however, that these should be considered indicative due to the small sam-ple size of each group. Relative to those who remain in education or make a successfultransition from education to work, those in the `possible cause for concern' groups generallyexhibit lower educational attainment at age 16; are more likely to live in social rented ac-commodation; and have parents with lower educational quali�cations. Importantly, there isalso a high degree of gender variation among these groups. In particular, while unsuccessfultrajectories predominantly consisting of time in `NEET - unemployed' (groups 4 and 5) showa balanced gender pro�le overall, the overwhelming majority of those entering predominantly`NEET - inactive' trajectories (groups 6-8) are female and in almost all cases mothers by age21. This result is con�rmed when running optimal matching separately for males and females(not shown). While all other groups emerge when considering each of the two subsamplesseparately, the groups `NEET from 16', `NEET from 18' and `Withdrawals from the labourmarket' only emerge when considering females only. This point reinforces the importanceof qualifying the description of these groups as giving rise to a possible cause for concern.
8As mentioned in Section 3, this also has the advantage of placing sequences within a common socio-economic calendar.
9The groups `full-time education throughout' and `full-time education with an employment spell' havebeen combined under the broader heading `accumulating human capital'.
Page 15 of 26

1 2 3 4 5 6 7 8 Total
Ethnic minority 9% 4% 0% 4% 2% 0% 15% 0% 6%
Female 47% 45% 58% 30% 64% 91% 81% 100% 48%
Has children at 21 1% 7% 39% 4% 18% 83% 82% 100% 9%
Health limits daily activities 2% 6% 0% 0% 12% 8% 12% 4% 5%
GCSE A-C 92% 73% 55% 51% 19% 43% 37% 37% 76%
GCSE D-G 3% 17% 37% 25% 40% 14% 37% 25% 14%
No quali�cations 5% 10% 8% 24% 41% 43% 25% 38% 10%
Receipt Educational Grant 3% 5% 4% 13% 12% 0% 3% 1% 5%
Parental quali�cations high 31% 10% 0% 10% 0% 0% 0% 0% 16%
Parental quali�cations medium 59% 61% 49% 55% 16% 33% 48% 27% 58%
Parental quali�cations low 10% 28% 51% 35% 84% 67% 52% 73% 25%
Owned housing 92% 76% 91% 71% 19% 44% 57% 17% 78%
Social rented 7% 20% 9% 25% 80% 56% 36% 75% 18%
Private rented 1% 5% 0% 4% 1% 0% 7% 9% 3%
No sibling 63% 57% 49% 45% 69% 52% 65% 61% 59%
Employed sibling 12% 26% 42% 28% 14% 27% 12% 29% 21%
NEET sibling 1% 4% 0% 27% 17% 7% 5% 10% 4%
Sibling FT student 24% 13% 8% 1% 0% 14% 18% 0% 16%
Observations 419 743 15 28 30 23 21 18 1297
(1) Accumulating human capital; (2) Express; (3) Planned interruption?; (4) Partial recov-ery; (5) Long-term worklessness; (6) NEET from 16; (7) NEET from 18; (8) Withdrawalsfrom the labour market.
Table 2: Share of individuals in each group exhibiting given characteristics
In many cases, those `NEET - inactive' trajectories may be so through voluntary choice,despite their detrimental e�ects on labour market progression. However, to the extent anysuch choice is constrained, there may still be a legitimate role for policy.
We use statistical techniques to explore whether there are any distinctive characteristicsat age 16 which could help predict an individual's future labour market trajectory type. Arich body of literature has explored the issue of how early experiences and characteristicsa�ect labour market outcomes, such as employment and wages, later in life. However, thishas tended to describe outcomes as measured at a speci�c point in time rather than in amore holistic manner. Instead, building on our identi�ed typology of trajectories, we can ex-plore statistical associations between characteristics at age 16 with outcomes associated with
Page 16 of 26

one's overall trajectory over the �ve years after compulsory schooling. We run multinomiallogit estimations to predict whether an individual's history falls under the three high-leveloutcomes mentioned above: accumulating human capital, an express transition into work oran outcome of possible concern. Due to the small sample size of those in each of the `con-cern' pathways, we had to treat these as a single group rather than analyse each sub-groupindividually. It is worth pointing out that the ambition is to establish the presence of strongcorrelation rather than causality. The former is in fact a su�cient condition to identify inadvance who is at risk of an unsuccessful transition into the labour market and is what willtherefore be of interest to policy-making.
Humancapital
Express Possiblecause forconcern
Sex (ref: males)Female -0.005 -0.057 * 0.062 ***
[0.024] [0.027] [0.016]Ethnicity (ref: white)
Non-white 0.21 *** -0.157 ** -0.053 *[0.060] [0.061] [0.023]
Parental quali�cations (ref: Low)High (degree) 0.292 *** -0.184 *** -0.108 ***
[0.044] [0.048] [0.028]Medium (>GCSE A-C) 0.111 *** -0.04 -0.071 ***
[0.031] [0.035] [0.021]Housing tenure (ref: owned)
Social rented -0.133 *** 0.08 * 0.052 *[0.035] [0.039] [0.022]
Private rented -0.225 *** 0.243 *** -0.019[0.054] [0.062] [0.035]
Year of birth (time trend) -0.002 -0.001 0.003[0.003] [0.004] [0.002]
Month of birth (ref: May-Aug)Jan-Apr -0.043 0.056 -0.012
[0.029] [0.032] [0.019]Sept-Dec -0.045 0.079 * -0.033
[0.030] [0.033] [0.018]Health (ref: no limitations)Health limits daily activities -0.145 ** 0.175 ** -0.03
Page 17 of 26

[0.054] [0.059] [0.026]School attainment (ref: GCSE A-C)
GCSE D-G -0.24 *** 0.148 *** 0.092 ***[0.034] [0.040] [0.027]
No quali�cations -0.183 *** 0.034 0.149 ***[0.040] [0.047] [0.035]
Educational grant (ref: none)In receipt -0.033 0.017 0.016
[0.058] [0.063] [0.033]Local area claimant count rate dev (16-24) -0.009 0 0.01 *
[0.007] [0.008] [0.004]Parental employment (ref: not employed)
In employment -0.017 0.054 -0.037[0.033] [0.036] [0.019]
Sibling labour force status (ref: no siblings)Employed -0.125 *** 0.123 *** 0.002
[0.030] [0.033] [0.019]NEET -0.162 * 0.103 0.059
[0.067] [0.072] [0.039]In FTE 0.029 0 -0.029
[0.035] [0.039] [0.023]Count of 'negative' GHQ responses 0.016 ** -0.022 *** 0.007 *
[0.005] [0.006] [0.003]Percentage point change in probability of entering the named trajectorywhen exhibiting a given characteristic compared to the reference value
Estimated average marginal e�ects are presented in Table 3. The numbers shown indicatethe estimated percentage point change in the probability of a given individual entering thenamed trajectory when possessing a given characteristic as opposed to the reference value.For example, the table indicates that the probability that an individual whose most highly-educated parent holds a degree enters a `human capital trajectory' is just under 28 percentagepoints higher than for an otherwise identical individual whose parents' highest quali�cationsare at most GSCEs graded D-G. Standard errors are shown in brackets.
School attainment (grades), family background (parental quali�cations, housing tenure)and gender emerge as the strongest predictors of labour market outcomes. These results, to-gether with the large and relatively homogenous groups found to invest in education or enterwork straight from education, are consistent with evidence indicating that high-achieving and
Page 18 of 26

advantaged individuals will tend to successfully move along the available structured path-ways, particularly in relation to the education system (Bynner 2001, Rice 1999, Dickerson& Jones 2004, McVicar & Rice 2000, Andrews & Bradley 1997).
A number of additional characteristics are also found to be statistically associated withsubsequent labour market pathways, though their impact is mixed. For example, non-whiteyouth are found to be more likely to enter a human capital trajectory. This is consistentwith higher staying on rates among certain minority ethnic youth (Middleton et al. 2006).10
Similarly to what is found in (Crawford et al. 2010), youth born between September and De-cember, who are therefore the oldest in their classroom, exhibit more successful transitions toemployment and fewer experiences of unsuccessful trajectories. Individuals with life-limitinghealth conditions or disabilities are much less likely to be in a predominantly educationaltrajectory, but, perhaps surprisingly, appear more likely to make an express transition intowork. Finally, individuals living in local authorities with high unemployment relative toother areas are found to be more likely to enter a possible cause for concern trajectory andless likely to be investing in human capital. Wider evidence on this issue has been mixed,but increasingly indicates that local labour market conditions can in�uence the outcomes ofyoung males with lower quali�cations Rice (1999), Meschi et al. (2011).
The e�ect of older sibling labour market status is less straight forward to interpret.On the one hand, human capital theory would predict that having siblings will lead tolower investment in education as family resources are spread more thinly Becker & Lewis(1973), Becker & Tomes (1976), Willis (1973). Where signi�cant, our results are generallyconsistent with this prediction and other empirical evidence on the issue Hanushek (1992),Björklund et al. (2004). However, part of this e�ect could be driven by strong correlationbetween parental unobserved heterogeneity and fertility decisions, and alternative estimationtechniques have in fact questioned these results (Angrist et al. 2010, Cáceres-Delpiano 2006).The breaking down of the postulated quantity-quality trade-o� may be explained by seeinghuman capital acting as a public good within the family and by negative resource e�ectsbeing counterbalanced by socialisation advantages. Furthermore, our results di�erentiateaccording to the labour market status of the older sibling and hint at a correlation acrosssibling status, possibly evoking a role model e�ect.
We also explore the relationship between self-con�dence and motivation problems andlabour market trajectories. A growing body of literature has explored the e�ect of suchnon-cognitive skills on wages, and more recently on years of schooling, future employmentstatus, job type and levels of supervision on the job (Waddell 2006). Drawing on responsesto the reduced version of the General Health Questionnaire module included in the BHPS,which covers questions on attitudes and subjective well-being, we construct a count variable
10Unfortunately, it was not possible to analyse sub-groups within the non-white population due to thesmall sample size.
Page 19 of 26

indicating the number of `negative' responses to the eight questions in the survey (Waddell2006). As a robustness check, we also test an alternative speci�cation which uses factor anal-ysis to construct variables capturing the pattern of variation in responses to these questions.In both cases, results seem to con�rm that self-con�dence and motivation problems have alasting e�ect on future outcomes, increasing the probability of accumulating human capital,increasing the probability of being in the `possible cause for concern' group but reducingthe probability of being in the Express group. The inclusion of these variables may alsocontribute to capturing the impact on labour market choices of personal traits which wouldotherwise be unaccounted for in the model and could therefore bias the estimated e�ect ofother variables. It is therefore interesting to see that, even when including a measure ofpersonality traits, family background, grades and gender still remain signi�cant predictorsof future labour market trajectories.
These results reinforce existing evidence indicating that outcomes are determined in partby factors, such as educational attainment, which the individual has at least some capacityto in�uence, and others, such as family background and gender which are predetermined.The importance of the latter factors sheds light on the extent to which structural inequalitiesmay play a role in determining individual's pathways, and therefore the reproduction of theinequalities themselves. Indeed, there will be cases where individuals exhibit more than one ofthe above `risk factors', thereby giving rise to a greater polarisation than can be inferred fromTable 2. For example, educational achievement is likely to be correlated across generations.Indeed, in our sample, around 90% of youth with highly educated parents obtain GCSEs atgrades A-C at age 16, while this �gure is only around 54% for those with parents havingonly grades D-G at GSCE or equivalent. Similarly, it is well known that quali�cation levelsare closely related to employment stability and labour market attachment. Highly educatedparents are therefore also more likely to be employed parents. As a consequence, it is likelythat the e�ects of school attainment and parental education and employment will combineand reinforce each other. Indeed, using the model results, we estimate that while virtuallyno young males, with grades A-C at GCSE at age 16 and living with highly educated andemployed parents will enter a `possible concern' trajectory, this will be the case for almostone in three young males obtaining no GCSEs at 16 and living with unemployed parentsholding low quali�cations.
6 Conclusion and policy considerations
The school-to-work transition has increased in complexity over the years. In light of this,this paper has made two contributions to the evidence base on the issue. Firstly, it usedoptimal matching to examine youth school-to-work experience in a holistic way. Drawingon this technique, we were able take a broad look at school-to-work transitions in the UK
Page 20 of 26

and identify small number of distinct transition patterns. Secondly, we explored whichcharacteristics at age 16 can act as early predictors of unsuccessful trajectories in the labourmarket. By using the groupings identi�ed in the �rst part of the analysis, we could focus onwhat characteristics are associated with successful or unsuccessful outcomes as de�ned bythe nature of one's overall trajectory post compulsory schooling.
Our results suggest that 9 out of 10 young people experience generally successful labourmarket trajectories between ages 16 and 21. However, the remaining individuals exhibit avariety of histories that might warrant policy attention. We identify six key groups, whichwe have called `Planned interruption?', `Partial recovery', `Long-term worklessness', `NEETfrom 16', `NEET from 18' and `withdrawals from the labour market'. The subsequent anal-ysis con�rmed the importance of school attainment (grades), family background (parentalquali�cations, parental and sibling labour market status), and gender as strong predictorsof future labour market trajectories. These are known to be strongly correlated across indi-viduals. As such, our results ring true with other evidence highlighting the signi�cant, andpossibly increasing, level of socio-economic polarisation of the transition from school-to-work.
The ability to identify in advance who is at risk of an unsuccessful transition into thelabour market provides important clues as to the type of policy that might be e�ectiveand who it should target. Importantly, the observed labour market patterns indicate thatunsuccessful outcomes often start at key decision points in a youth's educational career(particularly at the end of compulsory schooling and at the end of two further academicyears), suggesting this could be because of a poor decision taken at that point. Clearand accessible knowledge of options post-16 is therefore essential in minimising the risk of`fractured transitions'- ending one activity without securing a stable outcome in the next(Coles 1995, Furlong et al. 2004). This possibly highlights how e�ective career advice and job-search assistance programmes may be well suited to facilitate successful employee-employermatches. More structured systems combining class-based and work-based training could alsocontribute to shaping school-to-work transition institutions which provide individuals withclear and structured options to chose from when deciding each next step.
References
Abbot, A. & Forrest, J. (1986), `Optimal matching methods for historical sequences', Journalof Interdisciplinary History 16(3), 471�494.
Abbott, A. (2000), `Reply to levine and wu', Sociological Methods & Research 29(1), 65�76.URL: http://smr.sagepub.com/content/29/1/65.short
Page 21 of 26

Abbott, A. & Tsay, A. (2000), `Sequence analysis and optimal matching methods in sociol-ogy', Sociological Methods and Research 29, 3.
Andrews, M. & Bradley, S. (1997), `Modelling the transition from school and the demandfor training in the united kingdom', Economica 64(255), 387�413.URL: http://ideas.repec.org/a/bla/econom/v64y1997i255p387-413.html
Angrist, J., Lavy, V. & Schlosser, A. (2010), `Multiple experiments for the causal link betweenthe quantity and quality of children', Journal of Labor Economics 28(4), 773�824.URL: http://ideas.repec.org/a/ucp/jlabec/v28y2010i4p773-824.html
Anyadike-Danes, M. & McVicar, D. (2005), `You'll never walk alone: Childhood in�uencesand male career path clusters', Labour Economics 12(4), 511�530.URL: http://ideas.repec.org/a/eee/labeco/v12y2005i4p511-530.html
Anyadike-Danes, M. & McVicar, D. (2010), `My brilliant career: Characterizing the earlylabor market trajectories of british women from generation x', Sociological Methods &Research 38(3), 482�512.URL: http://ideas.repec.org/a/sae/somere/v38y2010i3p482-512.html
Becker, G. S. & Lewis, H. G. (1973), `On the interaction between the quantity and qualityof children', Journal of Political Economy 81(2), S279�88.URL: http://ideas.repec.org/a/ucp/jpolec/v81y1973i2ps279-88.html
Becker, G. S. & Tomes, N. (1976), `Child endowments and the quantity and quality ofchildren', Journal of Political Economy 84(4), pp. S143�S162.URL: http://www.jstor.org/stable/1831106
Björklund, A., Eriksson, T., Jäntti, M., Oddbjørn, R. & Österbacka, E. (2004), Familystructure and labor market success: the in�uence of siblings and birth order on the earningsof young adults in norway, �nland, and sweden, in M. Corak, ed., `Generational IncomeMobility in North America and Europe', Cambridge University Press.URL: http://books.google.co.uk/books?id=fQC7Pdr5FLMC
Brzinsky-Fay, C. (2007), `Lost in transition? labour market entry sequences of school leaversin europe', European Sociological Review 23(4), 409�422.URL: http://esr.oxfordjournals.org/content/23/4/409.abstract
Bynner, J. (2001), `British youth transitions in comparative perspective', Journal of YouthStudies 4, 5.
Page 22 of 26

Cáceres-Delpiano, J. (2006), `The impacts of family size on investment in child quality',Journal of Human Resources 41(4), 738�754.
Coles, B. (1995), Youth And Social Policy: Youth Citizenship And Young Careers, UCLPress.
Crawford, C., Dearden, L. & Meghir, C. (2010), When you are born matters: the impact ofdate of birth on educational outcomes in england, IFS Working Papers W10/06, Institutefor Fiscal Studies.URL: http://ideas.repec.org/p/ifs/ifsewp/10-06.html
Dickerson, A. & Jones, P. (2004), Estimating the impact of a minimum wage on the labourmarket behaviour of 16 and 17 years old, Research report, Low Pay Commission.
Elzinga, C. H. (2003), `Sequence similarity', Sociological Methods & Research 32(1), 3�29.URL: http://smr.sagepub.com/content/32/1/3.abstract
Everitt, B., Landau, S., Leese, M. & Stahl, D. (2011), Cluster Analysis, Wiley Series inProbability and Statistics, Wiley.URL: http://books.google.co.uk/books?id=w3bE1kqd-48C
Fergusson, R., Pye, D., Esland, G., McLaughlin, E. & Muncie, J. (2000), `Normalized dislo-cation and new subjectivities in post-16 markets for education and work', Critical SocialPolicy 20(3), 283�305.URL: http://csp.sagepub.com/content/20/3/283.abstract
Furlong, A., Cartmel, F. & Foundation, J. R. (2004), Vulnerable Young Men in FragileLabour Markets: Employment, Unemployment and the Search for Long-term Security,Joseph Rowntree Foundation.URL: http://books.google.co.uk/books?id=KA3PPQAACAAJ
Goujard, A., Petrongolo, B. & Van Reenen, J. (2011), The labour market for young people,in P. Gregg & J. Wadsworth, eds, `The Labour Market in Winter: The State of WorkingBritain', Oxford University Press.
Gregg, P., Wadsworth, J. & Institute, E. P. (1998), Unemployment and Non-employment:Unpacking Economic Activity, Economic report, Employment Policy Institute.URL: http://books.google.co.uk/books?id=qy8FHAAACAAJ
Halpin, B. (2010), `Optimal matching analysis and life-course data: the importance of du-ration', Sociological Methods & Research 38(3), 365�388.
Page 23 of 26

Halpin, B. & Chan, T. W. (1998), `Class careers as sequences: An optimal matching analysisof work-life-histories', European Sociological Review 14, 111.
Hanushek, E. A. (1992), `The trade-o� between child quantity and quality', Journal ofPolitical Economy 100(1), pp. 84�117.URL: http://www.jstor.org/stable/2138807
Lawy, R. (2002), `Risky stories: Youth identities, learning and everyday risk', Journal ofYouth Studies 5(4), 407�423.URL: http://www.ingentaconnect.com/content/routledg/cjys/2002/00000005/00000004/art00004
Lesnard, L. (2006), Optimal matching and social sciences, Centre de recherche en économieet statistique, INSEE, (Paris, France).
Lesnard, L. (2009), Cost setting in optimal matching to uncover contemporaneous Socio-Temporal patterns, Notes & Documents 2009-03, SciencesPo. Observatoire sociologiquedu changement, Paris.
Levine, J. (2000), `But what have you done for us lately?: Commentary on abbott and tsay:Sequence analysis', Sociological methods & research 29(1), 34�40.
Maré, D. (2006), `Constructing consistent work-life histories: a guide for users of the britishhousehold panel survey', ISER Working Paper Series .
Martin, P., Schoon, I. & Ross, A. (2008), `Beyond transitions: Applying optimal matchinganalysis to life course research', International Journal of Social Research Methodology11(3), 179�199.URL: http://www.tandfonline.com/doi/abs/10.1080/13645570701622025
Martin, P. & Wiggins, R. (2011), Optimal Matching Analysis, Sage Publications Ltd.
McVicar, D. & Rice, P. (2000), Participation in further education in england and wales:an analysis of post-war trends, Discussion Paper Series In Economics And Econometrics0014, Economics Division, School of Social Sciences, University of Southampton.URL: http://ideas.repec.org/p/stn/sotoec/0014.html
Meschi, E., Swa�eld, J. K. & Vignoles, A. (2011), The relative importance of local labourmarket conditions and pupil attainment on Post-Compulsory schooling decisions, IZADiscussion Papers 6143, Institute for the Study of Labor (IZA).URL: http://ideas.repec.org/p/iza/izadps/dp6143.html
Page 24 of 26

Micklewright, J. (1989), `Choice at sixteen', Economica 56(221), 25�39.URL: http://EconPapers.repec.org/RePEc:bla:econom:v:56:y:1989:i:221:p:25-39
Middleton, S., Rennison, J., Cebulla, A., Perren, K. & De-Beaman, S. (2006), Young peoplefrom ethnic minority backgrounds: evidence from the Education Maintenance AllowancePilots Database, \copyright Loughborough University.
Morgan, B. & Ray, A. (1995), `Non-uniqueness and inversions in cluster analysis', AppliedStatistics p. 117�134.
Paull, G. (2002), Biases in the reporting of labour market dynamics.URL: http://www.ifs.org.uk/wps/wp0210.pdf
Pollock, G. (2007), `Holistic trajectories: A study of combined employment, housing andfamily careers using multiple sequence analysis', Journal of the Royal Statistical SocietySeries A 170, 167.
Quintini, G. & Manfredi, T. (2009), Going separate ways? School-to-Work transitions in theunited states and europe, OECD Social, Employment and Migration Working Papers 90,OECD Publishing.URL: http://ideas.repec.org/p/oec/elsaab/90-en.html
Rees, A. (1986), `An essay on youth joblessness', Journal of Economic Literature 24(2), 613�28.URL: http://EconPapers.repec.org/RePEc:aea:jeclit:v:24:y:1986:i:2:p:613-28
Rennison, J., Maguire, S., Middleton, S. & Ashworth, K. (2000), Young People not in Ed-ucation, Employment or Training: Evidence from the Education Maintenance AllowancePilots Database, DfEE Research Report 628, DfEE.URL: http://www.dfes.gov.uk/research/data/upload�les/RR628.pdf
Rice, P. (1999), `The impact of local labour markets on investment in further education:Evidence from the england and wales youth cohort studies', Journal of Population Eco-nomics 12(2), 287�312.URL: http://ideas.repec.org/a/spr/jopoec/v12y1999i2p287-312.html
Ryan, P. (2001), `The School-to-Work transition: A Cross-National perspective', Journal ofEconomic Literature 39(1), pp. 34�92.URL: http://www.jstor.org/stable/2698454
Sachdev, D., Harries, B. & Roberts, T. (2006), `Regional and sub-regional variation inNEETs�reasons, remedies and impact', Learning and Skills Development Agency .
Page 25 of 26

Sanko�, D. & Kruskal, J. (1983), Time warps, string edits, and macromolecules: the theoryand practice of sequence comparison, Addison-Wesley Pub. Co., Advanced Book Program.
Scherer, S. (2005), `Patterns of labour market entry : Long wait or career instability? anempirical comparison of italy, great britain and west germany', European Sociological Re-view 21(5), 427�440.URL: http://esr.oxfordjournals.org/content/21/5/427.abstract
Schoon, I., McCulloch, A., Joshi, H., Wiggins, R. D. & Bynner, J. (2001), `Transitions fromschool to work in a changing social context', Young 9, 4.
Spielhofer, T. (2009), Increasing participation : understanding young people who do not par-ticipate in education or training at 16 and 17, Research report, Department for Children,Schools and Families.URL: http://dera.ioe.ac.uk/11328/
Stone, V., Cotton, D. & Thomas, A. (2000), Mapping Troubled Lives: Young People Not inEducation, Employment or Training, DfEE Research Brief 181, DfEE.
Waddell, G. R. (2006), `Labor-Market consequences of poor attitude and low Self-Esteem inyouth', Economic Inquiry 44(1), 69�97.URL: http://dx.doi.org/10.1093/ei/cbj005
Willis, R. J. (1973), `A new approach to the economic theory of fertility behavior', Journalof Political Economy 81(2), S14�64.URL: http://ideas.repec.org/a/ucp/jpolec/v81y1973i2ps14-64.html
Wu, L. (2000), `Some comments on" sequence analysis and optimal matching methods insociology: Review and prospect"', Sociological methods and research 29(1), 41�64.
Page 26 of 26