Visualising Space and Time
30
Visualising in Time & Space Seeing the World in Dynamic Dimensions Shawn Day Digital Humanities Observatory DAH Spring Institute 2013 - UCC - 8 February 2013
Transcript of Visualising Space and Time

Visualising in Time & SpaceSeeing the Worldin Dynamic Dimensions
Shawn DayDigital Humanities ObservatoryDAH Spring Institute 2013 - UCC - 8 February 2013

Here’s What We Hope to do in 1 Hour
• Explore Spatial and Temporal Dimensions in Humanities Scholarship
• What Can Be Done?
• What Principles To Be Aware of?
• Some Useful Tools

Grounding Ourselves
• How do we get from:
• there to here
• then to now
• what can we learn from the path we take?
• What data do you have?
• What questions do you want to ask?
• Pure Speculation


The Classic Time, Space and Environmental Visualisation
http://www.datavis.ca/gallery/re-minard.php

What About the Path and Sequence?
• Because we are representing real world phenomenon we have have to ask what we are seeing when we identify patterns.• Trends• Shifting• Stabilising• Cyclic vs anomalies
• Burst
https://republicofletters.stanford.edu/tools/

• So what we see are that there are some great visualisations out there
• and that the power exists to create them
• ...but where do they come from?
• The place we have been talking about all day
• ...good data...
• so how do we find and manipulate data related to space and time to make it usable in such ways?
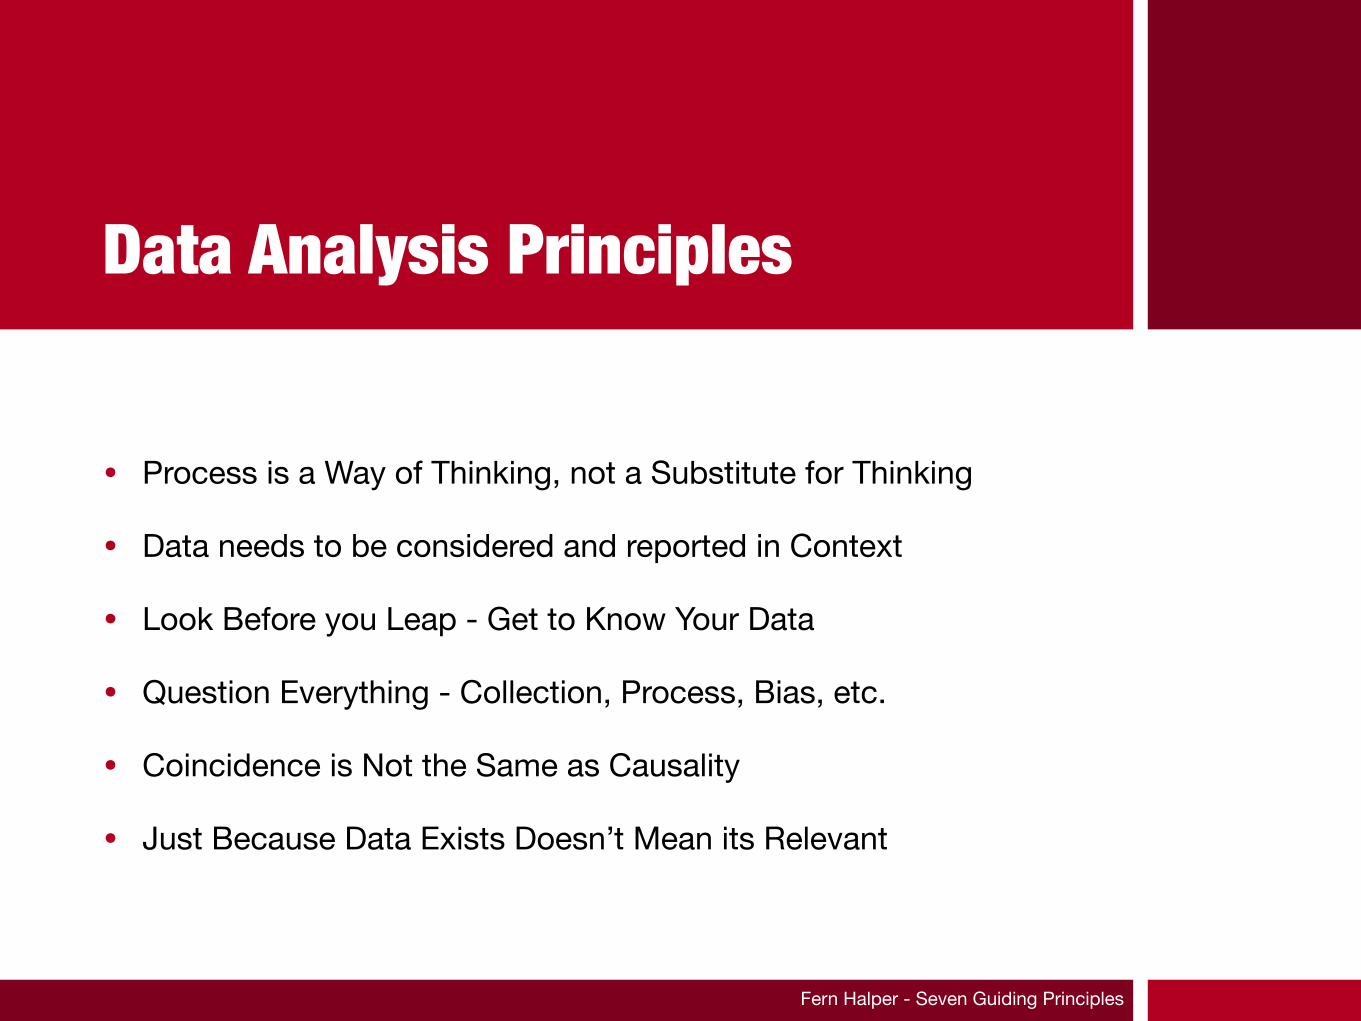
• Process is a Way of Thinking, not a Substitute for Thinking
• Data needs to be considered and reported in Context
• Look Before you Leap - Get to Know Your Data
• Question Everything - Collection, Process, Bias, etc.
• Coincidence is Not the Same as Causality
• Just Because Data Exists Doesn’t Mean its Relevant
Data Analysis Principles
Fern Halper - Seven Guiding Principles

Time
• Time series data can be continuous or discrete
• It’s usually discrete - i.e. observations exist for regularly or irregularly spaced intervals
• Although occasionally continuous - i.e. an observation at every instant of time

Processing
• Balance Sources and Formatting
• Filtering
• Normalising
• De-Duplication
• Unit Conversion
• Time Zones
• Formats
• Testing and Removing or Resolving Anomalies

Analysis versus Presentation
• Who is this for?
• Is it to convey a message or finding?
• Is it purely for discovery and analysis?
• Maps can be funny to manipulate
GDP Growth 2004 http://demo.intelytics.fr/bdf/#none/2000

But Time is ‘Funny’ and let’s consider Back to the Future
• There can be simple sequential linear tine ... it’s the one we are most used to

All 3 Movies in a Fancy Timeline
http://a.yfrog.com/img806/8237/s3c.jpg

But with simplication we see than time is not linear in this case ...
http://mysticalpha.deviantart.com/art/Back-to-the-Future-Timeline-162530828

And it really is matter of what we are representing
http://flickographics.com/the-delorean-travels/

Geospatial VisualisationA Simple Example
• A quick example - bit of how, more about the why
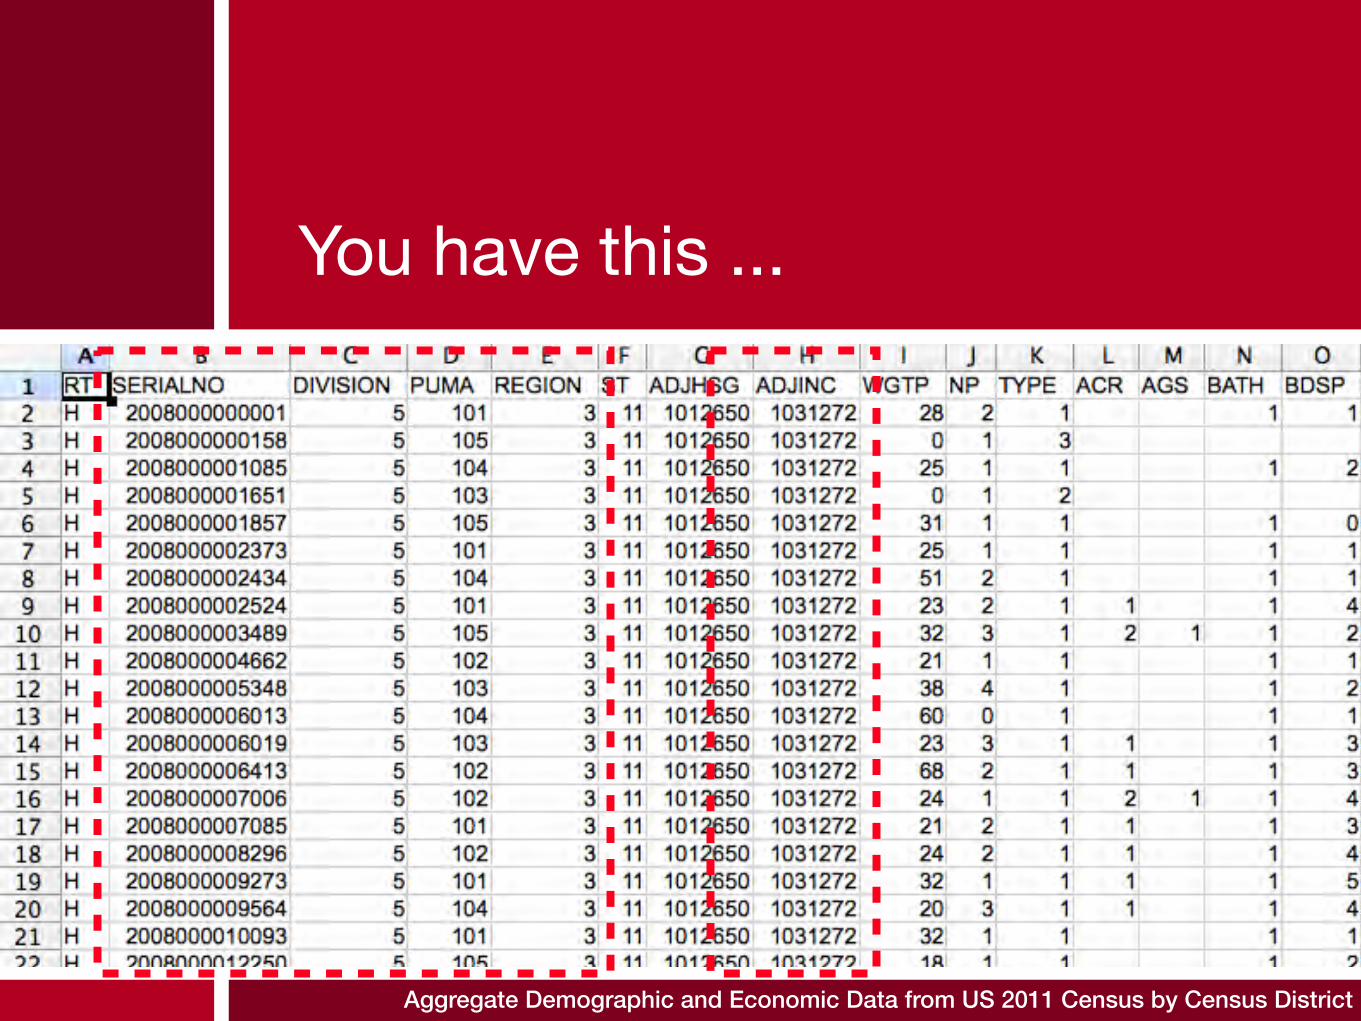
You have this ...
Aggregate Demographic and Economic Data from US 2011 Census by Census District

...and this...
US 2011 Census District Boundary files in KML

... which Reveals
http://www.richblockspoorblocks.com

Combining Statistical Datawith Geospatial Datato Visualise for Patterns
+ + =

And When You Need to Bring Time into the Equation

Herodotus TimeMap

SIMILE Timeline TimeFlow DIpity
TimelineJS TimeMap TimeGlider
Temporal Tools
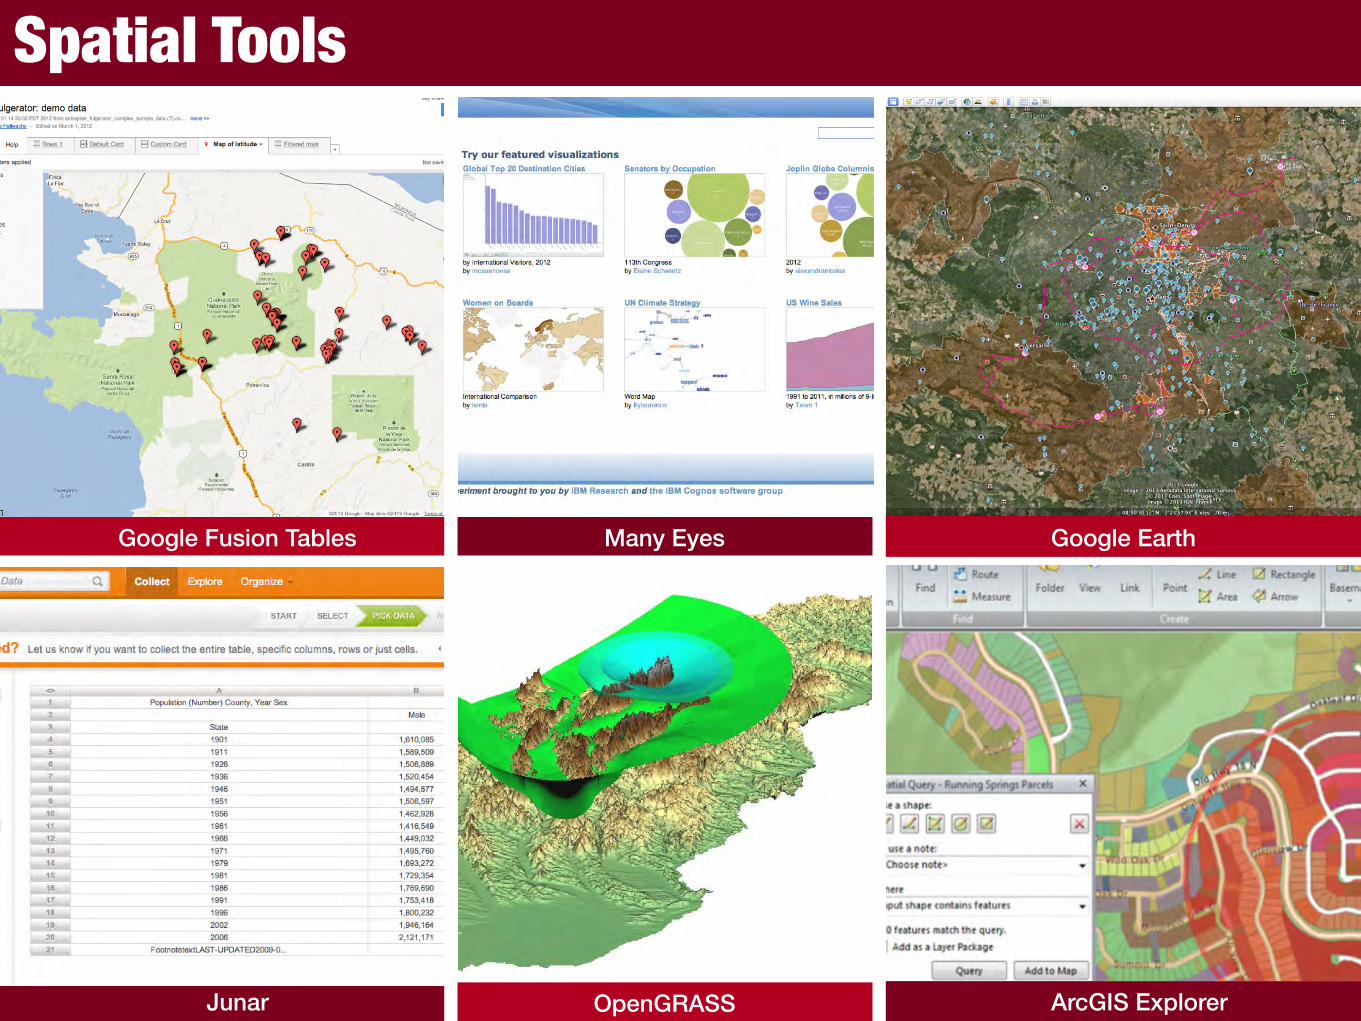
Google Fusion Tables Many Eyes Google Earth
Junar OpenGRASS ArcGIS Explorer
Spatial Tools

OpenRefine Mr Data Converter Data Wrangler
Junar R Text
Data Refining and Manipulation

Pulling It Together - Exhibit

Pulling It Together - NeatLine
Omeka Plugin

One to Watch
The Shape of What’s Coming ...
https://republicofletters.stanford.edu/tools/