VisualFlonet User Guide User Guide.pdf · PPDS calculator ... suggestions for best practice in both...
60
VisualFlonet User Guide
Transcript of VisualFlonet User Guide User Guide.pdf · PPDS calculator ... suggestions for best practice in both...

VisualFlonet
User Guide

VisualFlonet User Guide
ii
NOTICE
The information in this document is subject to change without notice and should not be construed
as a commitment by ABB. ABB assumes no responsibility for any errors that may appear in this
document.
In no event shall ABB be liable for direct, indirect, special, incidental or consequential damages of
any nature or kind arising from the use of this document, nor shall ABB be liable for incidental or
consequential damages arising from use of any software or hardware described in this document.
This document and parts thereof must not be reproduced or copied without written permission from
ABB, and the contents thereof must not be imparted to a third party nor used for any unauthorized
purpose.
The software described in this document is furnished under a license and may be used, copied, or
disclosed only in accordance with the terms of such license.
TRADEMARKS
Microsoft, Windows, Excel and Visio are either registered trademarks or trademarks of Microsoft
Corporation in the United States and/or other countries. All other trademarks are the property of
their respective owners.
COPYRIGHT
Copyright © 2005-2012 ABB Limited. All Rights Reserved.
Document: VisualFlonet User Guide
Revision: 1.1
Published: September 2012
Software: VisualFlonet
Version: 1.4.18
SUPPORT INFORMATION
This program is developed, maintained and supported by PEL Support Services, ABB. We run a
Hotline telephone and email service to answer any queries about VisualFlonet.
Please let us have any suggestions on how you feel we could improve VisualFlonet. You can
contact us by any of the following routes:
By Telephone: +44 (0)1925 74 1126 By Post: PEL Support Services
ABB Limited.
Daresbury Park
Daresbury
Warrington
Cheshire WA4 4BT
United Kingdom.
By Fax: +44 (0)1925 74 1265
By email: [email protected]

iii
Contents
Preface ........................................................................................................................ 1
About this guide ...................................................................................................... 1 Who should read this guide ............................................................................. 1 What is in this guide ........................................................................................ 1 How this guide is structured ............................................................................ 1 Conventions .................................................................................................... 2
Chapter 1 – Introduction ...................................................................................... 3
Introduction to VisualFlonet .................................................................................... 3 VisualFlonet network properties ...................................................................... 3 VisualFlonet network configurations ............................................................... 4 VisualFlonet calculation assumptions ............................................................. 4
Overview of PEL ..................................................................................................... 5 Programs for fluid flow ..................................................................................... 5
Chapter 2 – Getting started ................................................................................ 7
Starting VisualFlonet ............................................................................................... 7 Starting VisualFlonet with a Visio drawing file................................................. 7
Quitting VisualFlonet ............................................................................................... 7 User interface .......................................................................................................... 8
Accessing VisualFlonet features in Visio 2010 ............................................... 9 Editor (data entry) dialogs ............................................................................... 9 Standard calculator dialogs ............................................................................. 9
User assistance..................................................................................................... 10 Online help .................................................................................................... 10 Online documentation ................................................................................... 11 PEL Support Services ................................................................................... 11
Chapter 3 – VisualFlonet Quick Tour ........................................................... 13
Chapter 4 – VisualFlonet basics..................................................................... 17
Calculation overview ............................................................................................. 17 Loading a CAD drawing ........................................................................................ 18
Loading a drawing as a template .................................................................. 18 Showing or hiding the CAD drawing layer..................................................... 18
Creating a VisualFlonet piping diagram ................................................................ 18 Entering and editing data fields............................................................................. 19
Entering data fields ........................................................................................ 19 Converting units and values .......................................................................... 19
Saving your VisualFlonet diagram ........................................................................ 20
Chapter 5 – Running a calculation ................................................................ 21
Setting the calculation mode ................................................................................. 21 Entering node conditions for a flow calculation ..................................................... 22
Entering data for all the nodes in the system ................................................ 22 Entering data for an individual inlet or outlet node ........................................ 22 Entering data for an individual internal node ................................................. 23
VisualFlonet User Guide
iv
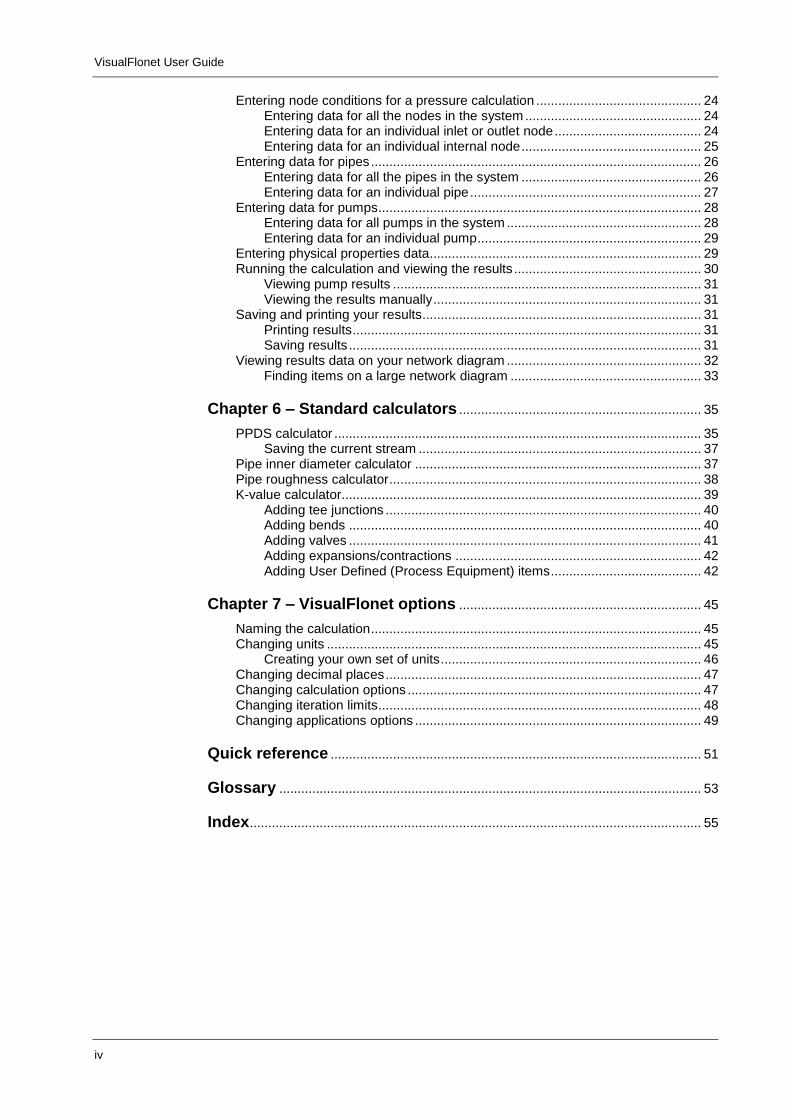
Entering node conditions for a pressure calculation ............................................. 24 Entering data for all the nodes in the system ................................................ 24 Entering data for an individual inlet or outlet node ........................................ 24 Entering data for an individual internal node ................................................. 25
Entering data for pipes .......................................................................................... 26 Entering data for all the pipes in the system ................................................. 26 Entering data for an individual pipe ............................................................... 27
Entering data for pumps ........................................................................................ 28 Entering data for all pumps in the system ..................................................... 28 Entering data for an individual pump ............................................................. 29
Entering physical properties data.......................................................................... 29 Running the calculation and viewing the results ................................................... 30
Viewing pump results .................................................................................... 31 Viewing the results manually ......................................................................... 31
Saving and printing your results ............................................................................ 31 Printing results ............................................................................................... 31 Saving results ................................................................................................ 31
Viewing results data on your network diagram ..................................................... 32 Finding items on a large network diagram .................................................... 33
Chapter 6 – Standard calculators .................................................................. 35
PPDS calculator .................................................................................................... 35 Saving the current stream ............................................................................. 37
Pipe inner diameter calculator .............................................................................. 37 Pipe roughness calculator ..................................................................................... 38 K-value calculator.................................................................................................. 39
Adding tee junctions ...................................................................................... 40 Adding bends ................................................................................................ 40 Adding valves ................................................................................................ 41 Adding expansions/contractions ................................................................... 42 Adding User Defined (Process Equipment) items ......................................... 42
Chapter 7 – VisualFlonet options .................................................................. 45
Naming the calculation .......................................................................................... 45 Changing units ...................................................................................................... 45
Creating your own set of units ....................................................................... 46 Changing decimal places ...................................................................................... 47 Changing calculation options ................................................................................ 47 Changing iteration limits ........................................................................................ 48 Changing applications options .............................................................................. 49
Quick reference ..................................................................................................... 51
Glossary ................................................................................................................... 53
Index ........................................................................................................................... 55

1
Preface
Welcome to VisualFlonet, the calculation tool for fluid flow in networks. One of a
suite of fluid flow programs for process engineers, VisualFlonet calculates the flows
and pressure drops throughout your gas or liquid network.
About this guide This guide is designed to assist you in becoming quickly familiar with the capabilities
of VisualFlonet, its interface and how the program is used.
Who should read this guide
This guide is written for users of VisualFlonet to help you take full advantage of its
calculation tools. If you are new to this product, we recommend that you first read The
60 Second Guide to VisualFlonet.
The guide assumes you are familiar with the Windows operating system. If you are
new to Windows, you can find help, tutorials and support information by clicking
Start > Help and Support.
What is in this guide
The guide contains descriptions and step-by-step instructions for all the tasks involved
in using VisualFlonet.
How this guide is structured
The chapters are organised as follows:
1. Introduction Introduces the product, outlining the database.
2. Getting started Shows how to start VisualFlonet, introducing
the user interface for the application.
3. VisualFlonet Quick Tour Tutorial for a typical session using
VisualFlonet, emphasising the commonly
used features.
4. VisualFlonet basics Describes the overall process for running a
calculation, shows how to create a basic
piping diagram and how to enter data.
5. Running a calculation Shows how to enter data and calculate results
for your piping diagram in VisualFlonet.
6. Standard Calculators Describes the standard PEL piping
calculators.
VisualFlonet User Guide
2
7. VisualFlonet options Describes the various option settings in
VisualFlonet.
The guide also includes a quick reference section and a glossary.
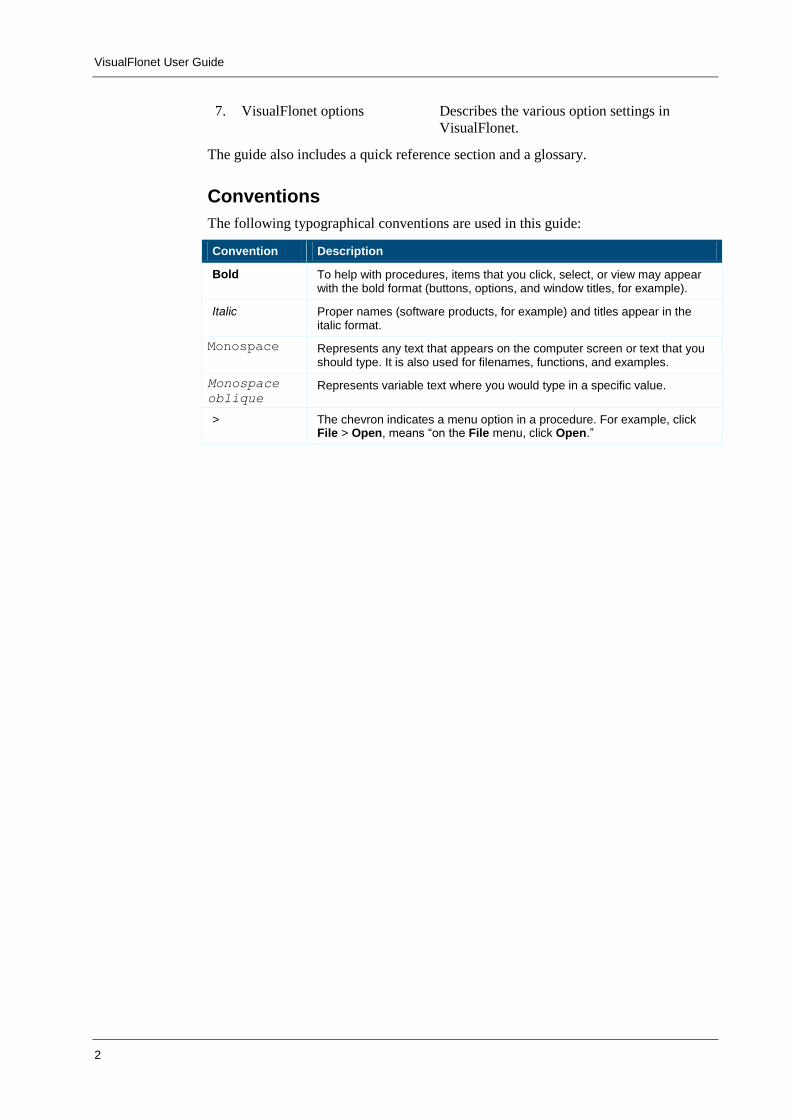
Conventions
The following typographical conventions are used in this guide:
Convention Description
Bold To help with procedures, items that you click, select, or view may appear with the bold format (buttons, options, and window titles, for example).
Italic Proper names (software products, for example) and titles appear in the italic format.
Monospace Represents any text that appears on the computer screen or text that you should type. It is also used for filenames, functions, and examples.
Monospace
oblique Represents variable text where you would type in a specific value.
> The chevron indicates a menu option in a procedure. For example, click File > Open, means “on the File menu, click Open.”

3
Chapter 1 – Introduction
Introduction to VisualFlonet VisualFlonet brings speed and reliability to the process of modelling liquid and gas
distribution networks. The network is drawn with Microsoft Visio using a specially
designed template for specifying nodes, pumps and pipes in the layout.
It calculates single phase liquid or vapour flow rates and pressure drops in piping
systems. These may consist or piping loops or be "tree-like" in form. Pumps and non-
return valves can be included in the system.
VisualFlonet performs two types of calculation:
Pressure mode. Given the flows at the input and output nodes and one pressure
in the system, VisualFlonet calculates all other flows and pressures.
Flow mode. Given the pressures and flow direction at the input and output
nodes, VisualFlonet calculates all the other flows and pressures. In this mode
expert users can also use it to calculate systems given other valid combinations of
flowrates and pressures.
This guide explains how to use VisualFlonet to set up a VisualFlonet model. It
provides an example of how to use the capabilities of the program while pointing out
suggestions for best practice in both constructing and validating a model.
VisualFlonet network properties
A VisualFlonet network can contain:
Compressible or incompressible fluids.
Loops and tree-like structures.
Pumps and non-return valves.
Turbulent, transitional and laminar flow regimes.
Pipes of any dimension and reasonable roughness.
Pressure loss data due to fittings.
Moderate temperature variations.
Gravity heads due to sloping pipes.

VisualFlonet User Guide
4
VisualFlonet network configurations
A VisualFlonet network consists of nodes and pipes. Nodes are points where pipes
begin or end: pipes run between nodes.
In the VisualFlonet stencil, nodes are represented by red circles. As you add nodes or
pumps to the drawing grid, straight pipes appear as the connecting lines between them.
The following information is required to specify a VisualFlonet network:
A name, length, bore, roughness, and mean temperature for each pipe.
A label and height for each node.
Details of pressure losses due to fittings in the form of K-values.
Details of the capability of any pumps in the system in the form of Head (m)
versus Flow (m3/s) characteristics. The pump curve can be defined using between
1 and 20 points (see the curve in the Quick tour for an example).
Density and viscosity data for the fluid in the network (a value for Cp/Cv is
required for gases).
A datum pressure at some point in the network.
VisualFlonet calculation assumptions
The following assumptions are made in VisualFlonet calculations:
1) The flow/pressure equations in VisualFlonet work on an isothermal basis.
2) VisualFlonet calculations are only valid for low Mach numbers, that is, around
0.2 Ma. At high Mach numbers the internal energy changes become important
and the isothermal model is less valid.
3) VisualFlonet fittings are modelled using a single K-value. This represents all the
fittings and no provision is made for the order in which fittings occur.
4) The K-value calculator allows detailed information about the fittings in a pipe to
be stored although a single value is used for calculations. The calculator stores
the information that the K-value comprises, for example, three tight radius 90°
bends, one long radius 180° bend and a 4 inch NB circular port plug valve.
5) The network description is not directed (unlike the VisualAdrian program). This
means that, even though a particular pipe starts at node A and ends at node B, it
does not follow that the fluid can only flow in the direction of A to B.

Chapter 1 – Introduction
5
Overview of PEL PEL is a collection of tools to enable process engineers to carry out their day-to-day
tasks more quickly and reliably. The software includes purpose built programs to
generate datasheets, perform engineering calculations of liquid and / or gas flow,
investigate physical properties and create fault tree diagrams. Designed by engineers
for engineers, the tools are intuitive and easy to use. They can be used to work out
every day calculations, for troubleshooting issues such as bottlenecks, or when making
plant modifications. This low cost solution will enable engineers to design processes
more quickly and reliably with up-to-date and permanently available design data.
Benefits
Allows engineers to be more efficient and productive. With fewer manual
calculations to do, tasks are carried out quicker;
Improves QA and standardises procedures, through everyone using same set of
data and calculations;
Human errors in calculations are reduced;
Improves production as bottlenecks can be identified quickly so a solution can be
sought;
Allows operators to get the best out of their existing assets by carrying out
modifications rather than designing new ones.
Programs for fluid flow
VisualFlonet is one of a suite of fluid flow applications built on the drawing
functionality of Microsoft Visio. Together with the calculations provided by PEW,
these Visual applications allow you to quickly and reliably calculate the correct size of
every part of pipelines, equipment and pressure relief systems.
VisualFlonet – for fluid flow in networks
VisualFlonet calculates the flows and pressure drops throughout your gas or liquid
network.

VisualFlonet User Guide
6
VisualAdrian – for pressure relief
VisualAdrian calculates flows and pressures for high velocity, compressible gases
allowing the capacity of relief streams and sizing of associated equipment to be
assessed.
VisualPiper – for two-phase fluid flow
VisualPiper calculates the pressure change or flowrate of a liquid, two-phase mixture,
or gas through an unbranched closed conduit system.
PEW
PEW is a collection of validated chemical engineering calculations relating to fluid
flow, heat transfer, mixing, and vessel calibration.

7
Chapter 2 – Getting started
This chapter shows you how to start VisualFlonet and introduces the user interface for
the application.
Starting VisualFlonet The most common way of starting VisualFlonet is from the Windows Start menu, but
you can also run it from a desktop shortcut.
VisualFlonet uses Microsoft Visio as a drawing tool to create a diagram of your piping
network.
To start VisualFlonet from the Start menu:
Click Start > All Programs > PEL > VisualFlonet > VisualFlonet.
If using the classic Start menu or earlier versions of Windows, click Start >
Programs...
The application launches Microsoft Visio using the VisualFlonet template.
Starting VisualFlonet with a Visio drawing file
Once you have saved your piping network diagram as a Visio drawing file, you can
start VisualFlonet by double-clicking the drawing file in Windows Explorer, or in the
most recent versions of Windows from the Documents Library.
To start VisualFlonet with a Visio drawing file:
Double-click your Visio drawing file in Windows Explorer or your Documents
Library.
Note In more recent versions of Windows if you point at VisualFlonet in the Start
menu, you can select your drawing file from the list of recent files.
You can also open a recent file from the File menu in Visio.
Quitting VisualFlonet
To quit VisualFlonet:
1) Do one of:
On the File menu, click Exit.
Click the Close (X) button.
If you haven't saved any data on the current drawing, a message asks if you want
to save your changes.
2) Click Save.

VisualFlonet User Guide
8
User interface Once you have started VisualFlonet and Microsoft Visio has opened, you see the
following, or similar, user interface. As VisualFlonet is installed as an Add-In for
Microsoft Visio, the look of the user interface will depend on which version of Visio
is installed on your computer. This is how it looks in Visio 2007 (or earlier).
The following main features are apparent:
Menu bar. The standard Microsoft Visio menu contains an added menu for
VisualFlonet.
Tool bar. Under the Visio toolbar (or toolbars) you see an added toolbar containing
buttons for accessing the VisualFlonet tools. Move the mouse pointer over a button to
see its name.
Shapes window. This standard Microsoft Visio feature shows the loaded
VisualFlonet stencil, which contains the various shapes you can drag onto the drawing
page.
Visio drawing page. The main area of the screen contains your piping
networkdiagram. You can view this either as a floating window or maximised (as
shown above).

Chapter 2 – Getting started
9
Accessing VisualFlonet features in Visio 2010
If you have Microsoft Office Visio 2010 installed on your computer, this uses the
ribbon interface introduced for most of the other Office applications in Microsoft
Office 2007. VisualFlonet opens Visio with an extra Add-Ins tab on the ribbon. This
contains the VisualFlonet menu and the VisualFlonet toolbar.
The functions are the same whether accessed from the ribbon or from the menu and
toolbar.
Editor (data entry) dialogs
The various editor dialogs let you add or change the modelling data for your piping
networkdiagram. The dialogs are called up from either the commands on the
VisualFlonet menu or by clicking the buttons on the toolbar.
The topological data (that is the various nodes, pipes and pumps) are automatically
picked up from the Visio diagram. You use the forms to enter physical data, such as
pipe lengths, and conditions, such as temperature and pressures.
Many of the dialogs let you enter values for all the nodes, pipes and pumps on your
diagram: other dialogs let you enter or change values for a single component. These
are called either by the Edit command on the right-click context menu or by double-
clicking the component.
Standard calculator dialogs
Secondary to the editor dialogs are a number of standard piping calculator dialogs.
These are standard tools provided in all the PEL programs to complete various piping

VisualFlonet User Guide
10
parameters. The dialogs are generally called by right-clicking the field that will
contain the value in the editor dialog. The editor dialogs for individual components
have one or more buttons for calling the calculator next to the appropriate field. The
calculator then returns a single resultant value to the field.
There are standard calculators for pipe inner diameters, pipe roughness and for
calculating the fittings loss (k-value).
User assistance VisualFlonet has the following forms of user assistance:
Online help
Online documentation
PEL Support Services
Online help
VisualFlonet has an integrated online help system, which provides clear reference
information and step-by-step instructions for tasks. This is an online help version of
this guide.
To open the help system:
On the VisualFlonet menu, click Help – User Guide.
The help opens in a separate window.

Chapter 2 – Getting started
11
Online documentation
Documentation is provided for PEL products on the website. The documents are
provided as PDF files for you to download and print. These include:
60 second guides
Online user guides
PEL Support Services
This program is developed, maintained and supported by PEL Support Services, ABB.
We run a Hotline telephone and email service to answer any queries about
VisualFlonet.
Please let us have any suggestions on how you feel we could improve VisualFlonet.
You can contact us by any of the following routes:
By Telephone: +44 (0)1925 74 1126
By Fax: +44 (0)1925 74 1265
By email: [email protected]
By Post: PEL Support Services
ABB Limited.
Daresbury Park
Daresbury
Warrington
Cheshire WA4 4BT
United Kingdom.


13
Chapter 3 – VisualFlonet Quick Tour
This short self-paced tutorial will show you how to
begin to use VisualFlonet to calculate pressure drops
and flow rates for liquids or gases in piping networks.
Within seconds from now you will have learned how
to use VisualFlonet to calculate the pressures and
flowrates in the network given the inlet and exit
pressures shown on the right:
Flow diagram
P2
0.4 bar
N1
N2
N3 N4
N6N5
1.0 bar0.6 bar
P3
P6
P4
P1
pmp1
P5
Pipe data
Pipe Length Bore Fittings Temp
P1 50 m 2” 4 x 90° bend, radius 500mm 40°C
P2 50 m 2” 1 x T-junction type 2 40°C
P3 50 m 1” 1 x 1” globe valve – cast 40°C
P4 30 m 1.5” 7 x 90° bend, radius 300mm 30°C
P5 50 m 1” 1 x 1” globe valve – forged 40°C
P6 30 m 1.5” 2 x T-junction type 3 30°C
All pipes are Schedule 40, mild steel and slightly corroded.
Pump curve
0 0.002 0.004 0.006 0.008 0.01 0.012 0.014
20
21
22
23
24
25
26
Flow [m3/s]
Head [m
]
Starting VisualFlonet
1) Click Start > All Programs > PEL > VisualFlonet > VisualFlonet. Click
Enable Macros twice and the VisualFlonet splash screen appears briefly.
The first thing to do is to specify we want to do a Flow Calculation from the
pressures that we have been given.
2) Click the Options button on the VisualFlonet toolbar. On the Project tab under
Calculation Mode, click Flow.
While the VisualFlonet Options is open, let’s check that automatic naming of
nodes, pipes and pumps is switched on, and auto-connect is the default.
3) Click the Application tab. Clear the Prompt for Object Name on Drop check
box, and select Switch on auto-connect by default. Then click OK.
Now we are ready to draw the network.
4) Make sure the Connector tool on the Visio standard toolbar is selected.
5) Using the flow diagram, drag node N1, pump pmp1, and nodes N2, N3 and N4.
VisualFlonet connects the items and automatically names them. Before adding
node N5, click node N2 to make sure node N5 is connected to N2 and not N4.
Complete the drawing by adding N6.
That was easy wasn’t it? Next we need to enter the process data. Let’s begin by
adding the inlet and outlet pressures using the Node Conditions Editor

VisualFlonet User Guide
14
6) Click the Edit Nodes button on the toolbar to open the Edit Nodes dialog. Enter
the pressures as defined in the flow diagram: 1 bar at N1, 0.4 bar at N4, and 0.6
bar at N6. In the Height column, type 5 for the height above the datum point for
each of the nodes N3, N4, N5 and N6. Click OK to save the data.
The Edit Pipes dialog lets you specify the pipe data. VisualFlonet add the
connections automatically. You can rename pipes but you can’t add or delete
them. Let’s start by adding the data for the first pipe and find out about the
various tools for helping us. There are calculators for Pipe Inner Diameters, Pipe
Roughness, and K-Values.
7) Click the Edit Pipes button on the toolbar to open the Edit Pipes dialog. Click the
Length cell for P1 and enter 50. Click the Inner Diameter cell for P1, right-click
and click Pipe Inner Diameter Calculator. When the calculator appears select a
2” Schedule 40 / STD / 40S pipe and click OK to return the result to the cell.
Click the Roughness cell, right-click and click Roughness Calculator. Select
Mild Steel (slightly corroded) and click OK to return the value to the cell. Click
the Fittings Loss Coefficient cell, right-click and click K-Value Calculator.
When the calculator opens, click the Bends tab, type 500 in the radius box and 4
in the Quantity box and click Add. Click the Summary tab to see the K-Value
summary and then click OK to return the result to the cell. Click the
Temperature cell and type in 40.
That’s the first pipe done. Now add the data for the other five pipes using the
information in the above table. Try using the special Cut & Paste commands on
the shortcut menu to paste the Roughness into all the pipe roughness cells.
Remember to double-click the valves in the K-Value Calculator to show the
required options. Why not try adding the data for one of the pipes by double-
clicking the pipe in the drawing; you will still have access to all the calculators.
We’ve entered a lot of data now so it’s a good idea to save the drawing at this
stage.
8) Click the Save button on the toolbar and save the data in VisualFlonet.VSD on
the C:\ drive
Next we need to enter the Pump characteristics. We could use the Pump Editor on
the VisualFlonet toolbar but there is only one pump so we will use the editor for a
single pump.
9) Double-click the pump pmp1 in the drawing to open the Edit Pump dialog. Click
the Characteristic Pump Curve tab and set the Number of points to 3. Using
the graph above, type in the following three pairs of values for Head and Flow:
25.0, 0.0 24.0, 0.006 21.0, 0.012
Finally, we need to add the physical properties. To do this we need the Physical
Properties Editor dialog.
10) Click the Physical Properties button on the VisualFlonet toolbar to display the
Physical Properties dialog. Select Liquid as the Fluid Type then enter the
following 3 pairs of temperatures and pressures: 0.1bar & 10°C, 1bar & 20°C,
2bar & 40°C. Next click Calculate to calculate liquid density and viscosity.
The Physical Property Calculator opens.
11) First select the components. (If some are already present, click Clear Worksheet
to remove them.) Click Add Component and type W in the Search for Name
box. Four components are found beginning with the letter W. Click Water and
then click Add to Stream. Next, delete W from the Search box and type in ET
for Ethanol. Select Ethanol from the results and click Add to Stream then Close.

Chapter 3 – VisualFlonet Quick Tour
15
The last thing we need to do for the physical properties is to specify the
composition. You can use the spreadsheet to specify the stream composition, both
in terms of moles or mass, and as quantities or fractions.
12) Click the Mass Fraction cell for Water to give it “focus”. Enter 0.5 for both
Ethanol and Water. The Physical Property Calculator updates the spreadsheet. If
you wish, the Calculator will also normalise the values if they do not add up to 1.
All that’s all the input we need to calculate the physical property data so …
13) Click Calculate to calculate the liquid densities and viscosities at each of the 3
sets of pressure and temperature. Click OK to close the Physical property
calculator and automatically transfer the results back to the Physical Properties
Editor. Finally, click OK to close the Physical Properties window
That’s it for the input data for VisualFlonet. Now we’re ready to run the
calculation.
14) Click the Calculate button on the VisualFlonet toolbar. The hourglass appears
until the calculations are complete when the hourglass disappears and the results
appear in the Results window.
You will see that the calculated flowrates are 2.55 kg/s at the inlet, and 1.33 kg/s
and 1.22 kg/s at the outlets N4 and N6 respectively.
And that’s it! If you still have some time, try doing a Pressure calculation by
specifying the inlet and outlet flows.


17
Chapter 4 – VisualFlonet basics
This chapter describes the overall process in running a calculation, shows you how to
create a basic piping network diagram and tells you how to enter data in VisualFlonet.
Calculation overview The overall process in running a VisualFlonet calculation involves creating a piping
diagram in Visio, entering data using the various editor dialogs and then clicking the
Calculate button on the VisualFlonet toolbar to generate the results.
The main steps in the process are as follows:
Create the Visio diagram. Drag the various shapes from the stencil to form your
piping diagram. See “Creating a VisualFlonet piping diagram” on page 18.
Set Calculation mode. Use the options dialog to set the calculation mode as either
Flow mode (default) or Pressure mode. See “Setting the calculation mode” on page
21.
Enter node conditions. For a Flow calculation, you define the pressures at the inlet
and outlet nodes, with the direction of flow taken from the diagram topology. For a
Pressure calculation, you define the flow rates for the inlet and outlet nodes and one
set pressure. See “Entering node conditions for a flow calculation” on page 22.
Enter data for pipes. Enter physical data for each pipe, namely pipe length, inner
diameter, roughness and fittings loss coefficient. Use the standard piping calculators to
enter these values. Then specify the pipe temperatures. See “Entering data for pipes”
on page 26.
Enter data for pumps. For each pump in your system, enter the number of points
on the manufacturer’s pump curve, specifying the head and flow rate for each point.
See “Entering data for pumps” on page 28.
Enter physical properties data. Enter three separate temperature/pressures points
to span the operating range of the pipe network. Use the PPDS calculator tool to
compute the density and viscosity of the fluid in the network for each of these points.
See “Entering physical properties data” on page 29.
Calculate. Click the Calculate button on the toolbar to generate the results for the
network. On completion, the results dialog opens automatically. See “Running the
calculation and viewing the results” on page 30.

VisualFlonet User Guide
18
View the results. You can also open the results dialog manually. The dialog shows
the computed inlet and outlet pressures and flow rates for each pipe and each pump in
the network. Commands on the dialog let you print the results or save them as a tab
delimited text file that can be input into any spreadsheet program.
Loading a CAD drawing VisualFlonet lets you import a sketch or an engineering drawing to use as a template
for creating your piping network diagram. The loaded image is held as a separate
CAD drawing layer that you can show or hide as needed.
Loading a drawing as a template
To load a drawing as a template:
1) In the VisualFlonet menu, click Load CAD drawing.
2) Navigate to select the file and click Open.
The image appears behind the Visio drawing layer.
To replace the drawing image:
1) In the VisualFlonet menu, click Load CAD drawing.
A prompt asks you if you want to replace the current CAD layer.
2) Click Yes.
3) Navigate to select the file and click Open.
The image appears behind the Visio drawing layer.
Showing or hiding the CAD drawing layer
To hide the CAD drawing layer:
In the VisualFlonet menu, click Toggle CAD layer.
The image no longer appears.
To show the CAD drawing layer:
In the VisualFlonet menu, click Toggle CAD layer again.
The image reappears behind the Visio drawing layer.
Creating a VisualFlonet piping diagram Basic VisualFlonet diagrams show the primary pieces of your piping system and how
those pieces are connected. This article describes how to quickly create a basic
VisualFlonet diagram in Microsoft Office Visio.
For full information on creating diagrams, press F1 to open the standard Visio Help.
To create a piping network diagram:
1) In Visio open a new drawing file.

Chapter 4 – VisualFlonet basics
19
(In Visio 2007, click File > New > New Drawing.)
2) Make sure the Visio Connector tool on the Visio toolbar is selected.
3) Drag the first shape you want from the VisualFlonet stencil onto your drawing
page.
The shape will be selected in the drawing with selection handles around it.
4) With the shape still selected, drag a second shape onto your drawing page.
The second shape is automatically connected to the first shape.
5) Continue to add shapes to complete your diagram.
Entering and editing data fields The Editor dialogs contain a grid of small data fields. A few of these will be text
fields, but most are for entering numeric values, with or without units.
Entering data fields
To enter text or a value:
1) Double-click the field you want to change. Type the new text or number and then
click on another cell.
An alert appears if numeric data is not entered in the correct format. Click OK
and correct the entry.
2) Repeat for other fields as required.
3) When you have finished, click OK.
Converting units and values
The units for any field appear on the dialog. These are defined on the VisualFlonet
options dialog. Sometimes the source data to be entered may be in different units. For
example, if a pressure is shown in bar, while the source data is in psi. Rather than have
to convert the value in another application, you can enter the value with the units and
VisualFlonet will do the conversion inline.
To convert a value inline:
Enter the data in the format:
Value <space> units

VisualFlonet User Guide
20
and then press Enter (or click another field).
The value is converted to the units shown on the dialog.
Example:
For a pressure in bar, entering “50 psi” converts to 3.4474.
Saving your VisualFlonet diagram When you have completed your VisualFlonet diagram, you will need to save your
diagram as a Visio file. When you have added data to the diagram, you will need to
save the file again to save the data.
To save your diagram in Visio 2007 or earlier:
Do one of:
Click the Save button on the toolbar.
On the File menu, click Save.
Press Ctrl+S.
To save your diagram in Visio 2010:
Do one of:
Click the Save button on the Quick Access toolbar.
On the File ribbon, click Save.
Press Ctrl+S.

21
Chapter 5 – Running a calculation
When you have created your piping network diagram in VisualFlonet, you are ready to
enter modelling data to calculate pressure and flow data. Before you enter the data you
have to set the calculation mode. This chapter shows you how to set the calculation
mode, enter data and calculate the results. It also shows you how to save and print the
results and how to view results data on your network diagram.
Setting the calculation mode The VisualFlonet Options dialog contains a number of settings for determining how
VisualFlonet runs. Most of these settings should only be changed by advanced users.
The one option, which is suitable for all users, is setting the Calculation mode. This
option determines the conditions data you need to enter. For Flow mode, you enter the
inlet and outlet pressures. You can add estimated flowrates, though these are optional.
For pressure mode, you enter the inlet and outlet flowrates and a single reference
pressure for the system.
To set the calculation mode:
1) Do one of:
In the VisualFlonet menu, click Options.
On the VisualFlonet toolbar click the Options button.
The VisualFlonet Options dialog opens.
2) Under Calculation Mode click Flow or Pressure.
3) Click OK.

VisualFlonet User Guide
22
Entering node conditions for a flow calculation Once you have set the calculation mode you have to define the conditions for all the
nodes in the system. You can do this in either of two ways: use a single dialog to enter
all the conditions, or double-click each node to define in turn.
Entering data for all the nodes in the system
The Edit Nodes dialog lets you define conditions for all the nodes in the system. For a
Flow calculation, you define the pressures at the inlet and outlet nodes, with the
direction of flow taken from the diagram topology.
To enter node data:
1) Do one of:
In the VisualFlonet menu, click Edit Nodes.
On the VisualFlonet toolbar click the Edit Nodes button.
The Edit Nodes dialog opens with the calculation mode on the title bar and
listing the nodes from your piping diagram.
2) Specify the pressures for each inlet or outlet node.
3) For the Height, enter the height of each node above some known reference point.
The best values to use are the elevation levels from the piping isometrics.
Note. Remember that ground level may not be constant if using it as a datum.
This is especially true with networks spread over a large area.
4) Click OK.
Entering data for an individual inlet or outlet node
The Edit Node dialog lets you define an individual node in the system.You enter the
pressure at the node and the height above a fixed reference point. For an external
node, that is a mode with inlet or outlet flow, you can also add an estimated flow in or
out of the system. The direction of flow is picked up from the diagram topology.
To enter or change node data:
1) Double-click the inlet or outlet node shape in the diagram.
The Edit Node dialog opens.

Chapter 5 – Running a calculation
23
2) Enter or change the Pressure, if required.
3) Enter or change the Height (above some known reference point).
The best values to use are the elevation levels from the piping isometrics.
4) Click OK.
Entering data for an individual internal node
To enter or change node data:
1) Double-click the internal node shape in the diagram.
The Edit Node dialog opens.
2) Enter or change the Height (above some known reference point).
The best values to use are the elevation levels from the piping isometrics.
3) Click OK.

VisualFlonet User Guide
24
Entering node conditions for a pressure calculation Once you have set the calculation mode you have to define the conditions for all the
nodes in the system. You can do this in either of two ways: use a single dialog to enter
all the conditions, or double-click each node to define in turn.
Entering data for all the nodes in the system
The Edit Nodes dialog lets you define conditions for all the nodes in the system. For a
Pressure calculation, you define the flow rates for the inlet and outlet nodes and one
set pressure.
To enter node data:
1) Do one of:
In the VisualFlonet menu, click Edit Nodes.
On the VisualFlonet toolbar click the Edit Nodes button.
The Edit Nodes dialog opens with the calculation mode on the title bar and
listing the nodes from your piping diagram.
2) Specify the Flowrate for each inlet or outlet node.
Note The total flowrate into the system must equal the total flowrate out.
3) Specify a single Pressure for one of the nodes.
4) For the Height, enter the height of each node above some known reference point.
The best values to use are the elevation levels from the piping isometrics.
Note. Remember that ground level may not be constant if using it as a datum.
This is especially true with networks spread over a large area.
5) Click OK.
Entering data for an individual inlet or outlet node
The Edit Node dialog lets you define an individual node in the system.You enter the
pressure at the node and the height above a fixed reference point. For an external
node, that is a mode with inlet or outlet flow, you can also add an estimated flow in or
out of the system. The direction of flow is picked up from the diagram topology.
To enter or change node data:
1) Double-click the inlet or outlet node shape in the diagram.

Chapter 5 – Running a calculation
25
The Edit Node dialog opens.
2) Enter or change the Flowrate, if required.
3) Enter or change the Pressure, if required. Only enter one reference pressure.
4) Enter or change the Height (above some known reference point).
The best values to use are the elevation levels from the piping isometrics.
5) Click OK.
Entering data for an individual internal node
To enter or change node data:
1) Double-click the internal node shape in the diagram.
The Edit Node dialog opens.
2) Enter or change the Height (above some known reference point).
The best values to use are the elevation levels from the piping isometrics.
3) Click OK.

VisualFlonet User Guide
26
Entering data for pipes Once you have entered the node conditions you have to enter the physical data for
each pipe. Like the node data you can enter the data with a single dialog, or double-
click each pipe to define in turn.
Entering data for all the pipes in the system
The Edit Pipes dialog lets you enter physical data for all the pipes in the system. The
parameters include pipe length, inner diameter, roughness and fittings loss coefficient.
Use the standard piping calculators to enter many of these values.
Note This dialog is the same for flow and pressure calculations.
To enter pipe data:
1) Do one of:
In the VisualFlonet menu, click Edit Pipes.
On the VisualFlonet toolbar click the Edit Pipes button.
The Edit Pipes dialog opens.
2) Enter the Length of each pipe.
3) To specify the Inner Diameter, right-click the field and click Pipe Inner
Diameter Calculator to open the calculator. See “Pipe inner diameter calculator”
on page 37.
4) To specify the Roughness, right-click the field and click Roughness
Calculator to open the calculator. See “Pipe roughness calculator” on page 38.
5) To specify a Friction Loss Coefficient (K value), right-click the field and click
KValue Calculator to open the calculator. See “K-value calculator” on page 39.
6) Enter the Temperature.
7) Click OK.

Chapter 5 – Running a calculation
27
Entering data for an individual pipe
The Edit Pipe dialog lets you enter or change values for an individual pipe.
Note This dialog is the same for flow and pressure calculations.
To enter or change pipe data:
1) Do one of:
Double-click the connecting line in the diagram.
Right-click the connecting line in the diagram and click Edit.
The Edit Pipe dialog dialog opens.
2) Enter or change the length of the pipe, if required.
3) To specify the pipe inner diameter, click the button on the right to open the
calculator. See “Pipe inner diameter calculator” on page 37.
4) To specify the pipe roughness, click the button on the right to open the calculator.
See “Pipe roughness calculator” on page 38.
5) To specify a friction loss coefficient, click the button on the right to open the
calculator. See “K-value calculator” on page 39.
6) Enter or change the temperature, if required.
7) Click OK.

VisualFlonet User Guide
28
Entering data for pumps Once you have entered the pipe data you have to enter the data for each pump. Like
the node and pipe data you can enter the data with a single dialog, or double-click
each pump to define in turn.
Entering data for all pumps in the system
The Edit Pumps dialog lets you define all the pumps in the system. For each pump,
you enter the number of points on the manufacturer’s pump curve and specify the head
and flow rate for each point.
Note This dialog is the same for flow and pressure calculations.
To edit pump data:
1) Do one of:
In the VisualFlonet menu, click Edit Pumps.
On the VisualFlonet toolbar click the Edit Pumps button.
The Edit Pumps dialog opens.
2) In CPC Points, select the number of points on the manufacturer’s pump curve.
3) For each point, enter the head and the flow rate.
4) Repeat for each pump.
5) Click OK.

Chapter 5 – Running a calculation
29
Entering data for an individual pump
The Edit Pump dialog lets you enter or change values for an individual pump.
Note This dialog is the same for flow and pressure calculations.
To enter or change pump data:
1) Do one of:
Double-click the pump shape in the diagram.
Right-click the pump shape in the diagram and click Edit.
The Edit Pump dialog dialog opens.
2) Click the Characteristic Pump Curve tab.
3) For Number of Points, select the number of points on the manufacturer’s pump
curve.
4) For each point, enter the head and the flow rate.
5) Click OK.
Entering physical properties data The Physical Properties dialog lets you enter three separate temperature/pressure
points to span the operating range of the pipe network. You use the PPDS calculator
tool to compute the density and viscosity of the fluid in the network for each of these
points.
Note This dialog is the same for flow and pressure calculations.

VisualFlonet User Guide
30
To enter physical properties data:
1) Do one of:
In the VisualFlonet menu, click Physical Properties.
On the VisualFlonet toolbar click the Physical Properties button.
The Physical Properties dialog opens.
2) Enter three different temperatures and three different pressures that span the
operating range of the pipe network.
3) Click Calculate to run the PPDS Calculator.
The density and viscosity for each pressure/temperature pair are added to the
table.
4) Click OK.
Running the calculation and viewing the results When you have entered all the data for your calculation you are ready to run the
calculation and view your results.
To run the calculation:
Do one of:
On the VisualFlonet toolbar, click the Calculate button.
On the VisualFlonet menu, click Calculate.
When the calculations are complete, the results appear in the Results dialog.
The dialog shows the computed inlet and outlet pressures and flow rates for each pipe
and each pump in the network. The Results tab let you see values for pipes, such as
inlet and outlet pressure, flowrate and mean velocity of the flow. The Pumps tab
shows values for pumps, such as mass / volumetric flowrates and differential
head/pressure.
Note This dialog is the same for flow and pressure calculations.
The toolbar at the top provides options for saving and printing the results and for
viewing graphs of the static pressure and mass quality changes along the pipe.

Chapter 5 – Running a calculation
31
Viewing pump results
The Pump Details tab shows calculated values (such as mass and volumetric
flowrates, density, and differential head/pressure) for all pumps in the network.
Viewing the results manually
You can also open the results dialog without running the calculation. This opens the
Results dialog, showing the last set of calculated results.
To view results (without running the calculation):
Do one of:
On the VisualFlonet toolbar, click the Results button.
On the VisualFlonet menu, click Results.
The Results dialog opens showing the last run results.
Saving and printing your results The Results dialog contains command options to let you print the results or export the
results data to a tab delimited text file that can be imported into an Excel spreadsheet.
Printing results
You can print the results of your calculation on the Results dialog. The full results are
sent to the printer, that is the summary information, the conditions for each pipe
section and the detailed physical properties of each pipe section.
To print the results:
1) On the Results dialog, click the Print button.
2) Choose you printer and click OK.
The results are sent to the printer.
Saving results
You can save the results of your calculation on the Results dialog. The full results are
saved, that is the summary information, the conditions for each pipe section and the
detailed physical properties of each pipe section.
By default, you save the results as a tab delimited file. You can also save the results as
an Excel spreadsheet or as an XML or HTML file.

VisualFlonet User Guide
32
To save the results:
1) On the Results dialog, click the Save button.
2) Enter a name for the file, browse to where you want to save the file and click
Save.
A message tells you the file has been sucessfully saved.
3) Click OK.
Viewing results data on your network diagram Once you have run either a flow or a pressure calculation on your network, you may
want to see the pressure and flow data in one or more specific pipes. You can do this
graphically on the Visio diagram by opening the Shape Data window.
To open the shape data window:
1) In Visio 2007 or earlier, on the View menu click Shape Data Window.
In Visio 2010, open the View ribbon and in the Show section click Task Panes
and then Shape Data.
The Shape Data window opens floating on top of your diagram.
2) Right-click the window and click Dock Window. You can also drag the window
to the shape window to dock
The window is docked to the Shapes Window above the VisualFlonet stencil.
You may want to move the mouse pointer over the edge and drag to adjust the
size.
3) Click any pipe or pump in your diagram to see the results data.

Chapter 5 – Running a calculation
33
Finding items on a large network diagram
If you are trying to locate a particular node or pipe, for example, on a typically large
network diagram you can use the standard Visio Find command.
To find an item on a large diagram:
1) In Visio 2007 or earlier, on the Edit menu click Find (or press Ctrl+F).
In Visio 2010, in the Edit section of the Home ribbon click Find (or press
Ctrl+F).
2) Enter the identifier of the item in the Find what box, for example P102.
3) Select the Shape Name check box and clear Shape Text. This lets you find the
shape and not the label.
4) Click Find Next.
The identified item is selected in the diagram.


35
Chapter 6 – Standard calculators
VisualFlonet contains a number of calculators that are used to complete various
process values for you. The PPDS calculator provides extensive physical properties
data for fluids, performing process calculations involving this data. The standard
piping calculators provide physical data and calculations for standard pipes and
fittings. This chapter shows you how to use these calculators. They are common to all
of the PEL applications.
PPDS calculator The PPDS calculator helps you complete physical characteristics (namely the density
and viscosity) of the fluid (liquid or gas) in your network.
The upper part of the dialog contains a stream composition worksheet, which lets you
define the constituent parts of the process stream. Whenever you open the calculator
the table always contains the last values used. This lets you run multiple calculations
on the same fluid without having to specify or load the stream each time.
You can add components to the stream and then specify the molar and/or mass
quantities in the stream.
To calculate physical characteristics fields:
1) On the Physical Properties dialog, click Calculate.
2) Add the various components, as described in “Adding Components” on page 36.
The molecular weight of each component and the average molecular weight for
the stream appear in the Mol Wt column on the worksheet.

VisualFlonet User Guide
36
If you want to remove a component from the worksheet, click the component
name to select the whole row, right-click the row and click Remove Selected
Components.
3) Specify the quantities or realtive amounts of each component in one of the other
four columns:
Molar – the molar quantity of each component.
Mol Fraction –the mole fraction of each component.
Mass – the mass of each component
Mass Fraction – the mass fraction of each component
The worksheet calculates the values in the other three columns and the totals. If
you enter fraction values, you must ensure that they total to 1.
If you need to restart the calculation, right-click the worksheet and click Zero All
Cells.
4) Click Calculate.
The density and viscosity values for each pressure/temperature pair are
completed. You can click on any calculated value to see its accuracy.
5) Click OK to return the values to the Physical Properties dialog.
To clear all components:
Click Clear Worksheet.
All of the components are removed from the table.
Adding Components
To add a component:
1) Click Add Component.
The Select Components dialog opens.
2) Click the Databank in the list and start typing a search string.
Matching entries appear in the Search Results pane as you type.
3) Select the component you want and click Add to Stream.

Chapter 6 – Standard calculators
37
4) Add all the components you want and then click Close.
Saving the current stream
The Files tab lets you save the current stream on the Feeds tab as a file or recall a
previously saved stream file. The saved file (.psm) contains the components and the
calculated molar/mass quantities, fractions and totals.
To save the current stream:
1) Do one of:
On the File menu, click Save Stream File.
Right click the worksheet and click Save current Feed.
2) Change the file name and location, if required, and click Save.
To open a saved stream:
1) On the File menu, click Click Open Stream File.
2) Browse to select the stream file and click Open.
The recalled stream now appears on the Feeds tab.
Pipe inner diameter calculator This calculator returns a pipe’s inner diameter (in mm) based on the standard pipe size
and the available pipe schedules for that pipe size. The calculator supports both the
American (ANSI/ASME/API) pipe sizes standard, which is in imperial units, and the
European (DIN) system which uses metric units. The calculator also derives the
external diameter and the wall thickness.
The American standard pipe sizes range from 1/8 inch up to 36 inch. The schedules,
which give the pipe thickness, range from 5S up to XXS (Double Extra Strong).
To calculate a pipe internal diameter:
1) Do one of:

VisualFlonet User Guide
38
On the Edit Pipes dialog, click the field that is to contain the pipe inner
diameter. Right-click the field and click Pipe Inner Diameter.
On a component editor dialog, click the button next to the field.
2) Click the required standard in the drop-down list, select the required pipe size in
the left pane and then select the schedule in the right pane.
The calculated values appear in the three boxes at the bottom of the dialog, with
the inner diameter selected for return.
3) Click OK.
The inner diameter value is returned to the datasheet field.
Pipe roughness calculator This calculator is used to return an absolute roughness value for a pipe’s internal
surface. A smooth surface such as glass or plastic has a low roughness value, while
badly corroded metal or brick has a high roughness. The values are in millimeters.
To calculate a pipe roughness:
1) Do one of:
On the Edit Pipes dialog, click the field that is to contain the absolute
roughness. Right-click the field and click Pipe Roughness.
On a component editor dialog, click the button next to the field.
2) Select the required Surface Type in the list and click OK.
The absolute roughness value is returned to the datasheet field.

Chapter 6 – Standard calculators
39
K-value calculator The Fittings Loss (K-value) calculator is a multi-stage tool that enables a process
engineer to enter details of all the various fittings, such as bends, valves and t-
junctions, that contribute to pressure drop in a piping system. The total loss calculation
appears on the Summary tab, which is the default view when you call the calculator.
To calculate the fittings loss (K-value):
1) Do one of:
On the Edit Pipes dialog, click the field that is to contain the fittings loss.
Right-click the field and click K Value Calculator.
On a component editor dialog, click the button next to the field.
2) Add the various fittings on the other tabs as defined in the following sections.
As you add details on a tab, the total loss for that tab appears on the summary tab.
3) If you need to enter any Manual Adjustment, enter the value and add a reason
for the adjustment (optional).
The manual adjustment field is for entering miscellaneous fittings not covered on
the other tabs. You can also use it to manually adjust the model in the validation
stage or for studying the effect of changes, such as a control valve position.
4) When you have completed the calculation click OK.
The total loss value is returned to the datasheet field.
Note As the calculator retains the values last used, you can click OK to save the
calculation at any stage and then restart the calculator to continue.

VisualFlonet User Guide
40
Adding tee junctions
The Tee Junctions calculation takes into account any blanked off junctions. This can
also be a line where the dead leg is isolated at a valve further downstream.
To add tee junctions:
1) On the Fittings Loss Calculator dialog, click the Tee Junctions tab.
2) Click the Tee Junction Type in the list, enter the Quantity and click Add.
The items are added to the table at the bottom of the tab, with the loss shown for
each addition. The total for all junctions appears on the Summary tab.
To delete tee junctions:
Select the entry in the table and click Delete.
The entry is removed from the calculation.
Adding bends
Bends are added in a similar way to tee-junctions.
To add bends:
1) On the Fittings Loss Calculator dialog, click the Bends tab.
2) Click the Bend Type in the list, enter the Radius (of the bend) and the Diameter
(of the pipe), enter the Quantity and click Add.

Chapter 6 – Standard calculators
41
Note You can enter any two of the radius, the diameter and the ratio of the two.
If you enter the radius and the diameter, the ratio is calculated. If you enter the
ratio and one other parameter, the omitted parameter appears as “unspecified”.
The items are added to the table at the bottom of the tab, with the loss shown for
each addition. The total for all bends appears on the Summary tab.
To delete bends:
Select the entry in the table and click Delete.
The entry is removed from the calculation.
Adding valves
Valves are defined by type and by one or more categories within the type. For
example, the Globe Valve type has two categories – cast valves and forged valves.
To add valves:
1) On the Fittings Loss Calculator dialog, click the Valves tab.
2) Double-click the Valve Type in the list and select the category you want.
3) Click the Pipe Size in the list, enter the Quantity and click Add.
The items are added to the table at the bottom of the tab, with the loss shown for
each addition. The total for all valves appears on the Summary tab.
To delete valves:
Select the entry in the table and click Delete.
The entry is removed from the calculation.

VisualFlonet User Guide
42
Adding expansions/contractions
This tab is for adding expansion and contraction joints to the calculation.
For exit losses: Select an expansion with a small/large area ratio of zero.
For entry losses: Select a contraction with a small/large area ratio of zero.
To add expansions or contractions:
1) On the Fittings Loss Calculator dialog, click the Expansions/contractions tab.
2) Click Contraction or Expansion, as appropriate, enter the Large Area, the
Small Area, enter the Quantity and click Add.
Note You can enter any two of the large area, the small area and the ratio of the
two. If you enter the two areas, the ratio is calculated. If you enter the ratio and
one other parameter, the omitted parameter appears as “unspecified”. You can
also edit the calculated ratio for entry and exit losses.
The items are added to the table at the bottom of the tab, with the loss shown for
each addition. The total for all expansions appears on the Summary tab.
To delete expansions or contractions:
Select the entry in the table and click Delete.
The entry is removed from the calculation.
Adding User Defined (Process Equipment) items
The easiest way to model process equipment (for example, heat exchangers and
filters) is as a section of pipe with a fitting loss coefficient. The pipe length needs to be
short so that the pressure drop is solely due to the fittings –1m is generally used.

Chapter 6 – Standard calculators
43
The values for mass flow, pressure drop etc. can be obtained from the process data
sheet. Static head changes between inlet and outlet should not be taken into account as
the node information deals with this.
To add process equipment:
1) On the Fittings Loss Calculator dialog, click the User Defined tab.
2) Enter a name for the item and specify the following items:
Pipe Inner Diameter
Flow Rate
Density
Pressure drop
3) Enter the Quantity and click Add.
The items are added to the table at the bottom of the tab, with the loss shown for
each addition. The total for all process equipment appears on the Summary tab.
To delete a process equipment item:
Select the entry in the table and click Delete.
The entry is removed from the calculation.

45
Chapter 7 – VisualFlonet options
This chapter describes how you can change the various options settings that determine
how VisualFlonet works.
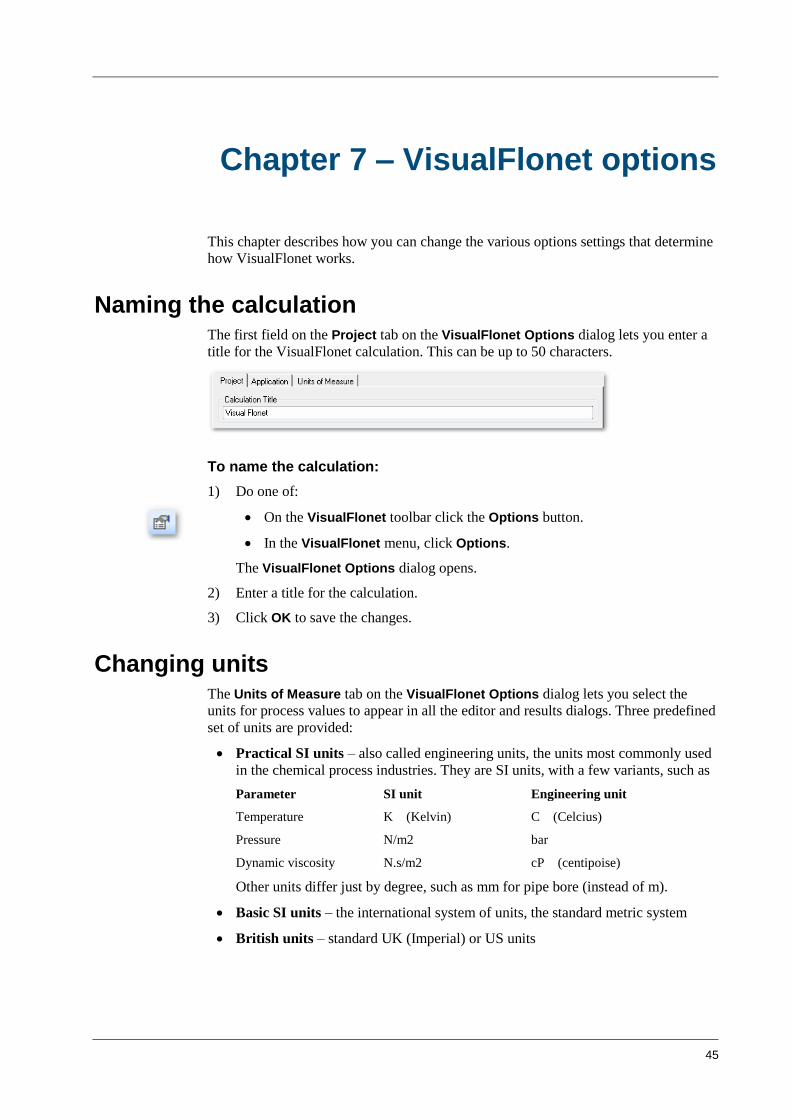
Naming the calculation The first field on the Project tab on the VisualFlonet Options dialog lets you enter a
title for the VisualFlonet calculation. This can be up to 50 characters.
To name the calculation:
1) Do one of:
On the VisualFlonet toolbar click the Options button.
In the VisualFlonet menu, click Options.
The VisualFlonet Options dialog opens.
2) Enter a title for the calculation.
3) Click OK to save the changes.
Changing units The Units of Measure tab on the VisualFlonet Options dialog lets you select the
units for process values to appear in all the editor and results dialogs. Three predefined
set of units are provided:
Practical SI units – also called engineering units, the units most commonly used
in the chemical process industries. They are SI units, with a few variants, such as
Parameter SI unit Engineering unit
Temperature K (Kelvin) C (Celcius)
Pressure N/m2 bar
Dynamic viscosity N.s/m2 cP (centipoise)
Other units differ just by degree, such as mm for pipe bore (instead of m).
Basic SI units – the international system of units, the standard metric system
British units – standard UK (Imperial) or US units

VisualFlonet User Guide
46
Practical SI units are the default set when you install VisualFlonet.You can set one of
the other predefined sets as the default or compile your own set.
To change the units to a predefined set:
1) Do one of:
On the VisualFlonet toolbar click the Options button.
In the VisualFlonet menu, click Options.
The VisualFlonet Options dialog opens.
2) Click the Units of Measure tab.
3) Click the option for the set you want to use, such as British.
4) Click OK to save the changes.
Creating your own set of units
The Units tab on the VisualFlonet Options dialog lets you set up your own set of
units. These are then saved by the application and reloaded when you restart.
To create a new set of units:
1) On the Units tab on the VisualFlonet Options dialog, click User defined.
The table of units becomes available, showing the current default units.

Chapter 7 – VisualFlonet options
47
2) If you want to use one of the predefined sets as a basis for your set click the
appropriate Reset button.
3) Double-click the unit you want to change. Type the new unit and then click on
another cell.
An alert appears if VisualFlonet cannot convert from the existing unit to the unit
entered. Click OK and correct the unit.
4) Repeat for other units as required to complete your set.
5) Click OK to save the changes.
Changing decimal places The Application tab on the VisualFlonet Options dialog contains a section that lets
you select the number of decimal places to be shown for various process values on all
the editor and results dialogs.
To change the settings:
1) Do one of:
On the VisualFlonet toolbar click the Options button.
In the VisualFlonet menu, click Options.
The VisualFlonet Options dialog opens.
2) Click the Application tab.
3) Change the number of decimal places for a particular parameter as required.
4) Click OK to save the changes.
Changing calculation options The central part of the Project tab on the VisualFlonet Options dialog lets you set
various control parameters that determine how the calculations are run.
Note It is recommended that these setting are only changed by advanced users, or if
directed by PEL Support Services. The calculation time can be increased significantly
if you make a mistake.

VisualFlonet User Guide
48
To change the settings:
1) Do one of:
In the VisualFlonet menu, click Options.
On the VisualFlonet toolbar click the Options button.
The VisualFlonet Options dialog opens.
2) Change the values, as required:
Monitoring Level. Determines the level of monitoring information included in
the results. You should only change this if directed by by PEL software support
personnel.
Calculation Accuracy. Defines the accuracy to which final results are to be
calculated as a percentage. Identical results for 0.05% and 0.01% indicate
adequate convergence.
T Junctions. Calculates any T Junction losses (if present in the network).
If the check box is cleared, VisualFlonet assumes that there is no pressure
drop across branching modes within the network.
If the check box is selected, VisualFlonet makes assumptions about the
configuration of the T junction at that node based on pipe diameters and flow
directions and will calculate the pressure drop/recovery accordingly.
Calculating T junction losses in cases where the flow direction may reverse can
cause problems.
Damping Factor. The Damping Factor applied to the recalculation of pipe
resistance at each step. This parameter can be changed if a calculation is proving
difficult to converge.
It is useful when losses are very significant as small changes in flow can produce
disproportionate changes in the pressure profile. The damping factor reduces the
change the solving algorithm would otherwise attempt to apply. Zero (no
damping) is usually suitable as a default. A value between 20% to 50% should be
sufficient if damping is required.
3) Click OK to save the changes.
Changing iteration limits The last field of the Project tab on the VisualFlonet Options dialog lets you set limits
for the number of recalculations that can occur in a flow calculation.
Note This is only relevant for flow calculations.
The number of iterations determine the number of recalculations of the network. The
number of iterations for one recalculation is approximately equal to the number of
unknown external flows and pressures. Ten recalculations usually suffice, so it is
recommended that the number of iterations is set to 10 x the number of unknown
external flows and pressures but you can increase this for a model that is proving
difficult to converge.

Chapter 7 – VisualFlonet options
49
To change the iteration limits:
1) Do one of:
On the VisualFlonet toolbar click the Options button.
In the VisualFlonet menu, click Options.
The VisualFlonet Options dialog opens.
2) Change the number of Maximum Iterations.
3) Click OK to save the changes.
These settings affect the solvers that perform the calculations. Contact the PEL
support desk on the Hotline telephone service if you want to make changes.
Changing applications options The upper part of the Application tab on the VisualFlonet Options dialog lets you
change various options that affect how the program works within Visio.
To change the settings:
1) Do one of:
In the VisualFlonet menu, click Options.
On the VisualFlonet toolbar click the Options button.
The VisualFlonet Options dialog opens.
2) Click the Application tab.
3) Change the values, as required:
Prompt for object name on drop. If the check box is cleared (default), your
nodes, pipes and pumps are automatically named as you add them. If the check
box is selected, a dialog will prompt you to change this automatic name as you
add each shape.
Default object name base. Gives the naming convention of nodes, pipes and
pumps as you add shapes to your diagram.
Validate data before an editor is displayed. Runs a validation check on the
shape before opening the editor dialog.
Switch on auto-connect by default. If this check box is selected the Connector
tool on the Visio standard toolbar is automatically selected when you start
VisualFlonet so that shapes are connected automatically when you drag them
onto the drawing area.

VisualFlonet User Guide
50
Highlight pipes with reverse flow. If the calculation evaluates a negative flow
in a pipe, the pipe appears on the diagram in a different colour.
4) Click OK to save the changes.

51
Quick reference
The following tables define the commands on the VisualFlonet menu system and the
VisualFlonet toolbar.
VisualFlonet menu
Command Action See
Load CAD Drawing
Load an image file as a template for your diagram
“Loading a drawing as a template” on page 18
Toggle CAD Layer
Show/hide drawing template layer
“Showing or hiding the CAD drawing layer” on page 18
Edit Nodes Open the Edit Nodes dialog “Entering node conditions for a flow calculation” on page 22
Edit Pipes Open the Edit Pipes dialog “Entering data for pipes” on page 26
Edit Pumps Open the Edit Pumps dialog “Entering data for pumps” on page 28
Physical Properties
Open the Physical Properties
dialog “Entering physical properties data” on page 29
Calculate Run the calculation and open the results dialog
“Running the calculation and viewing the results” on page 30
Results View the last results “Viewing the results manually” on page 31
Options Open the VisualFlonet Options
dialog “VisualFlonet options” on page 45
Check Updates Check if you have the latest version of the software
Help – User Guide
Open the online help version of the VisualFlonet User Guide
About VisualFlonet
Open the About VisualFlonet
dialog

VisualFlonet User Guide
52
VisualFlonet toolbar
Command Action See
Open the Edit Nodes dialog “Entering node conditions for a flow calculation” on page 22
Open the Edit Pipes dialog “Entering data for pipes” on page 26
Open the Edit Pumps dialog “Entering data for pumps” on page 28
Open the Physical Properties
dialog “Entering physical properties data” on page 29
Run the calculation and open the results dialog
“Running the calculation and viewing the results” on page 30
View the last results “Viewing the results manually” on page 31
Open the VisualFlonet Options
dialog “VisualFlonet options” on page 45

53
Glossary
60 Second Guide
A short self-paced tutorial that takes you through the main features of a PEL
application.
ANSI
American National Standards Institute – a voluntary organization in the U.S. that
creates standards for the computer industry.
API
American Petroleum Institute – U.S trade association for the oil and gas industry.
Provides over 500 operating standards for the industry, many of them adopted by ISO
as international standards.
ASME
American Society of Mechanical Engineers. One of the oldest standards organisations
in the world, providing over 600 standards and codes covering areas such as boiler
components and the measurement of fluid flow in closed systems.
BIP
Binary Interaction Parameters. Interactions between components in the mixture which
cause deviations from ideal behaviour.
CSV file
A Comma-separated values file stores tabular data in plain text form.
Discharge coefficient
In fluid mechanics, the ratio of actual flow rate to the theoretical discharge for an ideal
liquid.
Head
A way of representing pressure for a pump. The head is the equivalent height in
meters of water with specific gravity of 1.
IGE
Ideal gas enthalpy.

VisualFlonet User Guide
54
insert mode
Normal text entry mode for large description fields – text is added from the insertion
point as you type.
LLE
Liquid-Liquid Equilibrium.
Mach number
In fluid mechanics, Mach number is a dimensionless number representing the speed of
the fluid divided by the speed of sound, that is .
NB
Nominal Bore. Alternative term for Nominal Pipe Size.
ND
Nominal Diameter. The term used to classify pipe sizes accord to it diameter used in
European (DIN) standards.
NPS
Nominal Pipe Size. The term used to classify pipe sizes accord to it diameter used in
American standards (ANSI, ASME, API).
pipe schedule
The thickness of a standard pipe
PPDS
Physical Properties Data Service. A software suite used extensively in the chemical
production, oil & gas, pharmaceutical, fine chemical, power generation and process
industries. It allows users to perform calculations and simulations across a wide range
of process and engineering applications. PPDS facilities are included in VisualFlonet.
The software is maintained by NEL (formerly the National Engineering Laboratory),
part of the German-owned TÜV SÜD group.
VLE
Vapour-Liquid Equilibrium. A condition for a two-phase fluid, where the rate of
evaporation (liquid to vapour) is the same as the rate of condensation (vapour to
liquid).

55
Index
A
Accessing VisualFlonet features in Visio 2010 9
Adding bends 40
Adding Components 36
Adding expansions/contractions 42
Adding tee junctions 40
Adding User Defined (Process Equipment) items 42
Adding valves 41
C
Conventions 2
Converting units and values 19
Creating your own set of units 46
E
Entering data fields 19
Entering data for all pumps in the system 28
Entering data for all the nodes in the system 22, 24
Entering data for all the pipes in the system 26
Entering data for an individual inlet or outlet node
22, 24
Entering data for an individual internal node 23, 25
Entering data for an individual pipe 27
Entering data for an individual pump 29
F
Finding items on a large network diagram 33
K
K-value calculator 39
L
Loading a drawing as a template 18
P
Pipe inner diameter calculator 37
Pipe roughness calculator 38
Printing results 31
S
Saving results 31
Saving the current stream 37
Showing or hiding the CAD drawing layer 18
Starting VisualFlonet with a Visio drawing file 7
V
Viewing pump results 31
Viewing the results manually 31
VisualFlonet calculation assumptions 4
VisualFlonet menu 51
VisualFlonet network configurations 4
VisualFlonet network properties 3
VisualFlonet toolbar 52

ABB Limited
PEL Support Services Daresbury Park, Daresbury, Warrington, Cheshire, WA4 4BT United Kingdom Tel: +44 (0) 1925 741126 Fax: +44 (0) 1925 741265 Email: [email protected] www.pelsoftware.com