Visual stability across saccades while viewing complex ...
48
H 1 - I LLJNOJ S UNIVERSITY OF ILLINOIS AT URBANA-CHAMPAIGN PRODUCTION NOTE University of Illinois at Urbana-Champaign Library Large-scale Digitization Project, 2007.
Transcript of Visual stability across saccades while viewing complex ...

H 1 -I LLJNOJ SUNIVERSITY OF ILLINOIS AT URBANA-CHAMPAIGN
PRODUCTION NOTE
University of Illinois atUrbana-Champaign Library
Large-scale Digitization Project, 2007.


370 .152 STFT2261No. 609 COPY 2
Center for the Study of Reading
TECHNICALREPORTS
College of EducationUNIVERSITY OF ILLINOIS AT URBANA-CHAMPAIGN
174 Children's Research Center51 Gerty Drive
Champaign, Illinois 61820
Technical Report No. 609
VISUAL STABILITY ACROSS SACCADESWHILE VIEWING COMPLEX PICTURES
George W. McConkieChristopher B. Currie
Center for the Study of Readingand The Beckman Institute for
Advanced Science and TechnologyUniversity of Illinois at Urbana-Champaign
April 1995


CENTER FOR THE STUDY OF READING
Technical Report No. 609
VISUAL STABILITY ACROSS SACCADESWHILE VIEWING COMPLEX PICTURES
George W. McConkieChristopher B. Currie
Center for the Study of Readingand The Beckman Institute for
Advanced Science and TechnologyUniversity of Illinois at Urbana-Champaign
April 1995
College of EducationUniversity of Illinois at Urbana-Champaign
174 Children's Research Center51 Gerty Drive
Champaign, Illinois 61820
MANAGING EDITORTechnical Reports
Fran Lehr
MANUSCRIPT PRODUCTION ASSISTANTDelores Plowman

McConkie & Currie Visual Stability Across Saccades - 1
Abstract
As people visually examine their world, the proximal stimulus pattern changes position on their retinaewith every saccade, but they still perceive the world as being stable. This phenomenon of spaceconstancy or visual stability was explored by making changes in natural, full-color pictures duringselected saccades as observers examined them for 20 s in preparation for a recognition test. InExperiment 1, the pictures were displaced up, down, left, or right by 03, 0.6, or 1.2 deg. In Experiment2, the pictures were expanded or contracted in size by 10% or 20%. As a secondary task, subjectspressed a button whenever they detected a change in the picture. Three results from previous studieswith simpler stimuli did not generalize to this situation. Evidence suggests that subjects' detection ofimage displacements as they examine complex pictures primarily involves the use of local informationin the region of the saccade's landing position. A saccade target theory of visual stability is proposed.

Visual Stability Across Saccades - 2
VISUAL STABILITY ACROSS SACCADESWHILE VIEWING COMPLEX PICTURES
Making a saccadic eye movement causes a displacement of the light pattern across the retinae. If asimilar retinal displacement occurs during an eye fixation, there is perception of movement: that is, theworld appears to jump. However, the same pattern of motion on the retinae, occurring as aconsequence of making a saccade, is not perceived and the world appears stable.1 This phenomenon,referred to traditionally as space constancy, and which we will call visual stability, permits people tovisually explore the world with a moving sensory matrix without mis-attributing self-induced stimulusmotion on the matrix to the world itself. How the visual system achieves this stability has been a matterof speculation and research since Helmholtz (1866/1963) discussed the problem.
Two classes of theories have been proposed to explain this visual stability. One class of theoriesassumes that the characteristics of the proximal stimulus alone are sufficient to distinguish betweenretinal change resulting from saccadic eye movements and change resulting from movement in the world.The other class of theories assumes that some additional, non-retinal information is required, thoughindividual theories differ in the nature of the information proposed.
Proximal Stimulus Alone: Gibson
Gibson (1966) argued that the transformation of the visual array over time that results from making asaccade is different from that which typically results from motion in the world. A saccadic eyemovement produces a rigid displacement of the entire light pattern on the retinae. Thus, this type oftransformation specifies a self-induced stimulus displacement rather than a change in the world.Furthermore, though not stated by Gibson, saccadic suppression (Volkman, Schick, & Riggs, 1968),together with visual masking from pre- and post-saccadic visual fields, prevents the perception of thestimulus motion on the retinae that results from a saccade-produced stimulus displacement. Thus, arigid stimulus transformation, together with no direct sensation of the motion that typically accompaniesstimulus transformations, affords the perception of a stable world.
Two types of evidence argue against Gibson's explanation. First, as MacKay (1973) and Bridgeman(1981) point out, pressing the side of the eyeball while fixating a constant position produces a perceptionof world motion even when the light pattern remains stable on the retina. Second, if the stimulus isphysically displaced during a saccade this can be detected (Bridgeman, Hendry, & Stark, 1975) eventhough the stimulus change consists of a rigid transformation during a saccade. These two observationsindicate that the experience of world motion can arise without stimulus transformation on the retina,and in spite of a rigid transformation. Thus, additional information is required in distinguishing betweenworld- and self-motion.
Theories Postulating a Secondary Factor
There are currently three classes of theories that postulate the use of something else beyond thetransformation of the retinal stimulus pattern itself in achieving the perception of a stable visual worldas saccades are made. They will be referred to as cancellation theories, "taking-into-account" theories,and target object theories.
Cancellation Theories
Von Hoist and Mittelstaedt (1950/1971) proposed that when the visual system produces a neural signalto cause a saccadic eye movement, an efference copy is also generated that is used to cancel theresulting retinal displacement. This efference copy, or corollary discharge, is strictly correlated with theoriginal signal. The retinal image, or afferent signal, is retinally displaced by a distance equal to that
McConkie & Currie

Visual Stability Across Saccades - 3
of the saccade, but in the opposite direction. Thus, by combining the efference copy and the post-saccadic afferent signal, the saccade-produced displacement is cancelled and is not perceived.
Breitmeyer, Kropfl, and Julesz (1982) suggested further detail for such a mechanism, resulting in anintegration, or spatiotopic fusion, of the successive images. Their proposed mechanism would operateearly in vision to eliminate the retinal displacement produced by a saccade, thus yielding a stable,continuous internal signal from which continuous vision proceeds.
Cancellation theories predict that a mismatch between the efference copy and the afferent signal willbe attributed to movement in the world. Such mismatches can be produced by physically moving thestimulus during saccades, so its position in the world is different following the saccade than it was priorto the saccade. Extensive psychophysical research has been conducted to examine the sensitivity of thevisual system to these types of intra-saccadic stimulus displacements, as a way of studying the mechanismunderlying space constancy. Most of this research has been conducted in complete darkness with stimuliconsisting of dots or simple light patterns that are displaced different distances and directions duringsaccades. The subjects' task is to detect the stimulus displacements when they occur. The primaryfindings from these studies can be summarized as follows:
Saccade length function: If the stimulus shift magnitude is held constant, displacement detection dropsas saccade length increases (Bridgeman et al., 1975; Li & Matin, 1990; Mack, 1970).
Displacement threshold level: Displacements can be reliably detected when the magnitude of the shiftis about 10% to 20% of the length of the saccade (Mack, 1970; Whipple & Wallach, 1978).
Constant detection/saccade length ratio: A constant detection level is maintained as saccade lengthincreases if the magnitude of the stimulus displacement is a constant proportion of the saccade length(Li & Matin, 1990).
Direction independence: Detection likelihood is independent of relative saccade direction, where thisis defined as the angle between the saccade and stimulus shift vectors (Mack, 1970; Bridgeman et al.,1975). One exception to this is reported by Macknik, Fisher, and Bridgeman (1991).
The typical interpretation of the above findings is that the extraretinal information concerning eyeposition is somewhat imprecise, and that this imprecision increases with saccade length (Li & Matin,1990). Skavenski (1990) suggests that there is a need for some mechanism to determine how much ofthe mismatch between efference copy and afferent signal is to be attributed to error in the system andhow much is due to movement in the world.
Recent physiological research by Duhamel, Colby, and Goldberg (1992) provides support for theexistence of a remapping of retinal space with each saccade, as cancellation theory suggests. However,two lines of research have raised questions about cancellation theories. First, Matin (1986) hasattempted to measure the accuracy of the extraretinal in formation concerning eye position that isproduced in making a saccade, and has concluded that the accuracy is too low to account for researchresults on visual stability. Second, a number of studies have failed to find evidence for the integrationor spatiotopic fusion of images from successive eye fixations that cancellation theories suggest (for areview, see Irwin, 1992).
Finally, it appears that even if the cancellation mechanism is the basis for visual stability when examiningsimple stimuli in the dark, its role may be severely reduced when viewing more complex stimuli. Matin,Picoult, Stevens, Edwards, and MacArthur (1982) studied perception in subjects with partially paralyzedoculomotor muscles. In this condition, it was assumed that attempting to make a saccade produced alarge deviation between the efferent signal, indicating the intended length of the saccade, and theafferent signal, indicating where the eyes actually positioned themselves. When subjects were asked, in
McConkie & Currie

Visual Stability Across Saccades - 4
the dark, to saccade away from illuminated points set directly ahead at eye level, they perceived thepoints of light to move even though they did not. This illusion of stimulus movement was attributed tothe mismatch between efferent and afferent signals. However, when the same task was performed ina normally illuminated room, no motion was perceived. Stark and Bridgeman (1983) obtainedcompatible results with another method. If the results of studies investigating intrasaccadicdisplacements of simple stimuli in the dark do not generalize to more normal viewing situations, thiscalls into question the assumption that the mechanism being studied underlies visual stability. A primarygoal of the experiments presented below was to determine whether these results do generalize to theviewing of complex pictures in a natural perceptual task.
Taking-into-account theories: A second class of theories also postulates the existence of retinal andextra-retinal signals but without assuming a cancellation or remapping process. MacKay (1973) assumesthe existence of a spatiotopic map, and argues that the efferent command to make a saccade is also asignal to the visual system to begin evaluating the retinal signal for "map-changing information-content"(p. 314). If the retinal signal contains information that the world has changed, and the evaluationmechanism detects this, then the system decides that the world is different from the internal map, andproceeds to update that map. Furthermore, the evaluation mechanism must decide, by some criteria,whether or not the retinal image displacement "is significantly different from that which the saccade wascalculated to bring about" (p. 318). MacKay does not propose the exact mechanism by which thisevaluation is carried out, and leaves open the possibility that it is flexible and varies under differentconditions. However, it seems that it must involve a comparison of the retinal stimulus pattern withinformation retained from prior fixations, together with some basis for judging whether the stimuluspattern is where it is expected to be. The latter judgment could involve an efference copy, as withcancellation theory. However, in MacKay's theory, the efference copy would simply be "taken intoaccount" (Bridgeman, van der Heijden, & Velichkovsky, 1994) in judging whether the world has changed,rather than being the basis for a cancellation process.
Bridgeman et al. (1994) abandon the use of an efference copy in achieving visual stability, and deny thatany type of perceptual instability is produced by the displacement of the retinal signal across saccades.They argue that while it is true that a displaced pattern on the retina is reflected by a change in positionof the retinal pattern in the various cortical retinotopic maps (e.g., the LGN, V1, V2, etc.), the positionof any cortical pattern in a map is itself not a code for position. Rather, it is the particular pattern itselfthat is a code for position, and this pattern of activation is invariant across eye movements. (Forneurophysiological and modeling evidence on this point, see Andersen, Essick, & Siegel, 1985, andZipser & Andersen, 1988).
While Bridgeman et al.'s position explains the existence of space constancy, it raises the question of howthe visual system detects rigid stimulus displacements across saccades. To deal with this problem,Bridgeman et al. (1994) postulate a mechanism that derives anew, with each fixation, the visual directionof the world from both extra-retinal (i.e., efferent and proprioceptive) and retinal sources of information.A comparison process across eye movements then detects any change in direction. This comparisonprocess tolerates mismatches up to a point; beyond this point, the mismatch produces a perception ofstimulus displacement.
In contrast to cancellation theories, which assume that a low-level visual process automatically cancelsout the stimulus displacement by remapping retinal space, MacKay (1973) and Bridgeman et al. (1994)presume the existence of higher level mechanisms that are able to detect and make use of cuesindicating that a stimulus change has occurred. If no such cues are detected, then space constancy isexperienced. The use of available cues, including the weighting of retinal and extra-retinal informationin detecting stimulus displacements, is likely to depend on characteristics of the visual stimulus, the taskand the observers. Such flexibility would limit the generalizability of the psychophysical results fromearly studies of detectability (Mack, 1970; Bridgeman et al., 1975; Stark, Kong, Schwartz, Hendry, &Bridgeman, 1976; Whipple & Wallach, 1978). However, there are no published studies that report
McConkie & Currie

Visual Stability Across Saccades - 5
psychophysical functions for detection rates of stimulus displacements with complex stimuli in morenaturalistic tasks, in order to determine whether the earlier results generalize well to other conditions.
Target-object theories. A third type of theory is suggested in a "localist" or "retinotopic error"explanation that Bridgeman and Stark (1979) give to results obtained by Whipple and Wallach (1978),though they do not develop the theory further. Whipple and Wallach asked subjects to saccade betweentwo sides of a large circle, 7 deg in diameter, and they shifted the circle different distances horizontallyor vertically during the saccades. The ratio of the displacement size to the saccade length is called the"displacement ratio." The displacement was either parallel to the direction of the saccade, or wasorthogonal to it. Whipple and Wallach discovered that displacements in the orthogonal direction mustbe twice as great as displacements in the parallel direction to produce equal detection frequency.Furthermore, the displacement ratio necessary for orthogonal displacements to be detected was muchgreater than that observed by other investigators (Mack, 1970; Bridgeman et al., 1975; Stark et al., 1976).
Bridgeman and Stark (1979) observed that, because the stimulus was a circle, the distance that the eyeslanded from the edge of the circle was much greater when a parallel displacement occurred than whenan orthogonal displacement occurred. Therefore, they reanalyzed the data using the distance of the eyesfrom their target, the edge of the circle (operationalized as the distance to the nearest point of thecircle), as a predictor of detection frequency, rather than the displacement distance itself. Using thislocal information as a predictor eliminated the difference between parallel and orthogonaldisplacements, and brought the detection thresholds for orthogonal displacements into linewith those obtained for other conditions, as well as with results from previous studies.
Bridgeman and Stark's observation suggests that the critical variable in detecting displacements couldbe the distance of the eye from its target at the beginning of the new eye fixation. In most research,this variable has been largely confounded with the size of the displacement itself: larger displacementstake the eyes farther from their target. A target-object theory, then, would propose that the detectionof displacements is based, not on an efference copy of the saccade signal, nor on global properties ofthe visual stimulus itself, such as general stimulus direction, but strictly on local information; forexample, the distance of the intended target, at the beginning of the new fixation, from some anticipatedretinal location, probably the center of vision.
The above review of the literature highlights two issues to be addressed in the studies described below:(a) do the psychophysical functions of intra-saccadic displacement detection that have been obtained instudies with simple stimuli presented in the dark generalize to the more normal condition of viewingcomplex, naturalistic stimuli, and (b) is the detection of such displacements based in some way on theglobal retinal pattern, or only on local aspects of the pattern in the region of the object to which theeyes were being sent?
Two experiments are reported below, in which subjects were asked to examine colored photographs ofhouses in natural settings in preparation for a recognition test. During selected saccades in the viewing,pictures were horizontally or vertically displaced (Experiment 1), or were increased or decreased in size(Experiment 2). As a secondary task, subjects were asked to press a button when they detected any typeof change in the picture. Actually, the data for both studies were collected simultaneously, from thesame subjects viewing the same pictures. Mathematical modelling of the data is used to address the twoissues mentioned above. It should be noted that the experiments were not designed to investigatemaximal detection under conditions optimized for that purpose. Rather, they were designed to provideinformation on the degree to which certain display changes, that are assumed in cancellation theory tointerfere with the processes underlying space constancy, disrupt processing in a natural ongoingperceptual task to the extent that people notice, or detect, the disruption.
McConkie & Currie

Visual Stability Across Saccades - 6
EXPERIMENT 1
The first experiment was conducted to examine the functional relationships between several variablesand the likelihood of detecting an intra-saccadic displacement of a complex picture.
Method
Stimuli
Forty pictures of houses were digitized from photographs at 617 x 398 pixels with 16 bits of color perpixel. At a viewing distance of 27 inches, each image subtended an area of 22 x 15 deg.
Apparatus
The pictures were displayed on a Princeton Ultra-Synch monitor in 756 x 486 pixel mode, controlled byan ATVista display controller card in a 386 computer and refreshed at 60 Hz. To hide the edge of thedisplay screen, the plastic molding of the monitor was blackened and a large (44 x 39 deg) glare filterwas placed in front. This effectively hid the edge of the display screen and of the monitor itself, causingthe pictures to appear on a large, darkened field.
In the ATVista display controller, four images can be stored in the image memory. This makes itpossible to quickly switch from one image to another, simply by switching to a different region in imagememory. This change can occur at the end of any horizontal scan, so the change can be initiated at anypoint during a vertical refresh of the image, and is completed in 16.7 ms.
The observer's eyes were tracked with a fifth-generation Dual Purkinje Image Eyetracker, sampling eyeposition every msec and producing 12-bit data values for horizontal and vertical position. Theequipment was adjusted so that a 1 deg movement produced about a 200 value change in the eyetracksignal. Occasionally, successive samples differed by as much as 5 values, suggesting a noise level ofabout + /- 1 min of arc. Saccades were identified within 10 ms of their initiation, and on criticalsaccades an image change was initiated immediately upon detection. Saccade onset was detected onlineas a difference of 10 values or more (3 min of arc) between the current sample and that taken 4 msearlier, followed by 4 additional samples indicating movement in the same direction. Because imagechanges can begin at any point during a vertical refresh cycle, the display of the old image wasdiscontinued by no more than 10 ms after the onset of the saccade, and the new image was completelywritten on the monitor 16.7 ms later.
Subjects
Subjects were 18 members of the University of Illinois community who were paid to participate.
Task
Subjects examined the set of 40 pictures twice, the first time to study the pictures, and second time toindicate whether each picture was the same as one seen on the first viewing. Each picture was shownfor 20 s on each presentation. As a secondary task, subjects were told to press a button immediatelyif they detected any change take place in a picture. During 4 warm-up pictures, they were shown thetypes of display changes that could occur. They were not told the frequency with which changes wouldoccur.
Three types of changes occurred during the presentation of 32 of the pictures: horizontal or verticaldisplacements, changes in the size of the picture, and appearance or disappearance of an object for a
McConkie & Currie

Visual Stability Across Saccades - 7
single fixation. Data from the last type of change are not reported in this paper. The display changeswere made possible by storing four variations of a picture in the image memory: (1) the base image, (2)the same base image displaced horizontally or vertically from its original location, (3) an enlarged orreduced version of the base image, and (4) a version of the base image with an added or deleted object.Picture changes then occurred by switching among the four images. Subjects were not asked todiscriminate among the different types of changes, but simply to indicate when any change was detected.
During the second viewing of the pictures, the only pictures that were different from the first viewingwere 8 in which no display changes occurred during the viewing. The modifications to these picturesincluded left-right picture reversal or large object removal. Subjects indicated whether each picture wasthe same as one in the earlier viewing, following its 20 s viewing period.
Stimulus Displacement Conditions
The stimulus displacements used in this experiment included horizontal shifts of the entire image by 1.2or 0.6 deg, either left or right, and vertical shifts of 0.6 or 0.3 deg either up or down. The choice of shiftsizes was made on the basis of pilot data, indicating a wide range of detection frequencies, and inanticipation of analyses planned for Experiment 2.
Design
Of the 40 pictures, 8 were shown with no display changes, thus serving as a control condition. Duringthe viewing of the other 32 pictures, the image was displaced on the screen on either the 2nd, 9th, 16th,23rd or 30th saccade (in some cases, for reasons unrelated to the present study, a displacementscheduled later than the 2nd saccade was delayed by one saccade). A second displacement thenoccurred exactly 7 saccades later, bringing the picture back to its original position. Thus, during theviewing of each experimental picture, there were exactly two image displacements, except in cases wheretoo few saccades were made to reach a critical saccade on which a displacement was planned. The 7-saccade difference between display changes was selected on the basis of pilot data that indicated subjectsvery seldom pressed their button in response to a stimulus change later than 7 saccades following thechange. Typically, the response was within 2 or 3 saccades of the one on which the change occurred.
During another of the critical saccades, no display change occurred, thus providing a second controlcondition. Finally, during the remaining critical saccades, the other types of changes in the displayoccurred, as described above.
The order of the different types of display changes (displacement, size change, objectappearance/disappearance, and no change) varied from picture to picture and was balanced insofar aspossible. Furthermore, subjects were assigned to one of four groups, with groups differing in the orderin which they saw the pictures, the order of the conditions on each picture, and the particular value ofa condition for a given picture. Thus, if a picture were shifted upward by 0.6 deg for one group on the2nd saccade, this same condition occurred for different pictures on other critical saccades for the othergroups. Type of change and order of change were completely counterbalanced within each group. Anexample of the occurrence of the different conditions during the viewing of a single picture is shown inFigure 1.
[Insert Figure 1 about here.]
McConkie & Currie

Visual Stability Across Saccades - 8
Phosphor Persistence Concerns
Phosphor persistence is a concern in this study. If phosphor decays slowly enough, a change in thestimulus during a saccade can be detected on the basis of seeing the persistence during the followingfixation. To determine whether this could be the basis for detecting changes in the current study, afollow-up experiment was conducted using a "shutter test" (Irwin, 1994). Four subjects viewed 6 of theimages used in Experiment 1 monocularly through a shuttered aperature, controlled by computer, withviewing distance and lighting conditions similar to Experiment 1.
The shutter opened with a delay of 2 ms and remained open for 100 ms. The viewed image shiftedhorizontally or vertically by the same distances as the maximum shifts used in Experiment 1. The timeof the shift varied with respect to the opening of the shutter: the shift occurred 30 ms after the openingof the shutter (condition 30), at the time of the opening of the shutter (condition 0) or 10, 20 or 30 msprior to the opening of the shutter (conditions -10, -20, and -30).
Each subject had 96 trials in each shift condition, randomly mixed with 360 trials in a no shift controlcondition. On each trial subjects indicated whether or not they detected a change, and were encouragedto use a liberal criterion. In the control condition, detection (false alarm) likelihood was .26 acrosssubjects. For the other conditions, detection rates were: .99, .36, .30, .27 and .24 for conditions 30, 0,-10, -20 and -30. Thus, changes made while the shutter was open were highly detectable. In the otherconditions, the standard error used for comparisons with the control condition ranged from .025 to .026.Condition 0 differed from the control condition by more than twice the standard error. No othercondition approached this criterion.
These results show that persistence is rarely, if ever, detected at or beyond 12 msec (i.e., 10 ms plus 2ms shutter delay) following the initiation of a display change, thus being within the period of even shortsaccades.
Results
Each shift condition did not occur equally often for three reasons: sometimes a subject made insufficientsaccades on a picture to cause all scheduled display changes to occur, sometimes data were lost due toblinks and eyetracking difficulties, and sometimes the last critical saccade was not followed by at least7 fixations, in which case the data for that display change was not included because there may not havebeen adequate time for the subject to respond. Out of a possible 2,304 planned image displacements(18 subjects by 32 pictures by 2 displacements per picture), good data were obtained for 1,490.
False Alarms and Late Responses
In this study, positive responses could include two types of errors: false alarms, and late responses(responses to one display change that actually occurred after the next display change occurred). Thefrequency of these can be estimated using data from the two control conditions included in the study.
The frequency of false alarms was estimated using data from control pictures in which no displaychanges occurred. The saccades on these pictures that corresponded to the critical saccades in theexperimental pictures were identified, and the frequency of pressing the button during the following 7fixations was calculated. This gave the frequency of responding during this interval when no displaychange occurred. The response rate was 0.6%.
A second estimate was made by calculating the frequency of responding to the control condition (nodisplay change) on experimental pictures when that condition occurred on the 2nd saccade. In this case,
McConkie & Currie

Visual Stability Across Saccades - 9
there were no preceding display changes on that picture to which the subject might be giving a lateresponse. The frequency of responding was quite similar, 1.0%.
In cases in which the control condition occurred later than the 2nd saccade, it was always preceded bya display change seven saccades earlier. In these cases, it is possible that the response to the earlierchange was late enough to occur following the critical saccade for the control condition. Therefore, thefrequency of responding during the interval following the control condition in these cases gives anindication of the frequency of late responses plus false alarms. This frequency was 1%, which is lowenough to allow false alarms and late responses to be ignored in the remaining analyses.
Saccade Length Function
The major goal of the Experiment 1 was to determine whether certain relations among saccade length,shift size, and shift detection, observed in prior studies, hold true while viewing complex pictures. Toaccomplish this goal, it was necessary to quantify the relations among these variables. The first step indoing this was to establish the relationship between saccade length and shift detection. The data werereduced to a list of cases, each consisting of a dyad: the length of the saccade during which the picturewas shifted and whether or not the shift was detected. Thus, data were collapsed across subjects andshift size. The cases were sorted by the length of the saccade. Because the dependent variable wasbinary (detect or no detect), the relationship between saccade length and detection likelihood wasplotted using a sliding window technique. A window was defined on the sorted data that included theshortest 100 saccades, and for these cases a detection likelihood and a mean saccade length werecalculated. The window was then stepped in increments of 50 saccades, and at each new position, adetection likelihood and mean saccade length were obtained for the 100 cases contained within thewindow. Figure 2 shows the relation between these two variables, indicating that detection likelihooddrops in a negatively accelerated manner as saccade length increases. The data are well fit by thefunction:
(1) f(s) = A * e( 'K)
where f(s) is the likelihood of detection, A is a parameter indicating the intercept of the function, K isa parameter controlling the rate of change, and s is the saccade length.
[Insert Figure 2 about here.]
Non-linear regression was used to obtain maximum likelihood estimates for the parameters A and K,using the Nonlin module of SYSTAT (Wilkinson, 1989). This was done by minimizing the sum of thevalues obtained by taking the negative of the log of the difference between the model's prediction foreach individual data point and the obtained binary data value (i.e., detection or non-detection on thattrial), the negative log-likelihood difference. Because the data set was larger than SYSTAT couldhandle, the 151 longest saccades were removed from the data set, which consisted of all saccades over7.25 deg. These cases showed a 2% detection rate, and would play little role in the ultimate fit of themodel. The remaining 1,339 cases yielded estimates of .863 for A, the intercept parameter, and -.591for K, the slope parameter, with a loss value of 619.642, shown as Model A in Table 1. A graph ofequation (1) with these parameter values is included with the windowed data in Figure 2. It should benoted that the model-fitting process was carried out using data for individual saccades, and not usingthe "binned" data from which Figure 2 was constructed. Thus, the figure provides only an approximateindication of the actual fit, which cannot be presented graphically.
[Insert Table 1 about here.]
McConkie & Currie

Visual Stability Across Saccades - 10
Goodness of fit was tested with a chi-square test. Doubling the negative log likelihood loss value yieldsan index that is chi-square distributed. By this test, the obtained loss value is not statistically significant[X2 (1337, N = 1339) = 1239.484, p = .977]. Thus, the data do not deviate significantly from themodel's predictions. In fact, only one of the models presented below is statistically rejected by this test,so the results of this test are not reported further unless noted.
The excellent fit of equation (1) replicates and quantifies the saccade length function obtained in earlierstudies, as described above.
Experiment 1 used 4 groups of subjects, and each group saw the entire set of stimulus pictures twice.Crossing these two variables, labeled "group" and "view," yields 8 conditions. To determine whetherthese variables influence detection rate, Equation (1) was fit to the data from each of these conditionsseparately, and the resulting 8 loss values were summed. This is the equivalent to fitting a 16-parametermodel (i.e, 8A and 8 K parameters) to the entire data set, with parameters varying with group and viewvariables. In cases where the value of A exceeded 1.0, a cap of 1.0 was placed on the value of thatparameter in calculating the loss value. Thus, even when the intercept parameter was greater than 1.0,the model's prediction for the likelihood of detection at any point was constrained to lie between 1.0and 0. This is equivalent to assuming that the observer's internal signal for stimulus movement mayexceed 1.0, but when this occurs the resulting response rate can not exceed 100%. This constraint wasused in all model-fitting in both Experiments 1 and 2. The total loss value for this 16-parameter model,labelled Model A' in Table 1, was 611.365.
A chi-square test was used to test the null hypothesis that Model A" fits the data no better than theoriginal 2-parameter Model A. Model A" was considered to be a "full" model, and Model A to be areduced version of that model in which certain parameters from the full model have been dropped.Under these conditions, the difference between the loss value of the full model, which will never be lessthan that of the reduced model, and the loss value for the reduced model is chi square distributed withdegrees of freedom being equal to the difference between the number of parameters of the two models.This test [X2 (14, N = 1339) = 16.754, p = .73] did not find the difference to be statistically significant.The A parameters had a mean of 0.844 and SD of 0.148; the K parameters, -0.622 and 0.104. Thus,adding the 14 extra parameters failed to significantly improve the fit of the model to the data, indicatinga lack of evidence that the group and view variables and their interaction influenced the likelihood ofdetecting the shifts of the images. These variables are ignored in further analyses.
The statistical test between the models described above, comparing full and reduced models, is referredto as a reduced model test. It was described in detail because it is used throughout the remainder ofthis report to test proposed hypotheses.
Influence of Shift Size on Detection
The experiment employed 3 shift sizes: 0.3, 0.6 and 1.2 deg. Because of unequal cell sizes a repeatedmeasures, general linear model analysis was employed to test whether this variable influences detectionfrequency. A significant effect was obtained [F(2,17) = 3.97, p < .0004], and a post hoc test found thatdetection rates for all three conditions were significantly different (11%, 28% and 37% for the threeconditions, Duncan Multiple-range Test, df=3, MSE = 0.0095). Thus, subjects are able to detect theshifts, and larger shifts are more detectable.
A second test of the effect of shift size on detection was conducted using the reduced model test. Thedata were partitioned into 3 sets corresponding to the three shift sizes, and equation (1) was fit to eachseparately. This yielded estimates of 6 parameters, an A and K parameter for each shift size, shown asModel B in Table 1. The loss values were summed for the three conditions, yielding an overall lossvalue of 571.971. Because Model A is a reduced version of Model B, the reduced model test was again
McConkie & Currie

Visual Stability Across Saccades - 11
employed, showing that the 6-parameter, full Model B fit the data significantly better than the reduced,2-parameter Model A [W(4, N = 1339) = 95.822, p < .001]. This result confirmed the fact that shiftsize affects the likelihood of detection.
The next test asked whether shift size actually affects only one of the two parameters being studied. Itwas hypothesized that increasing the shift size would elevate the function, increasing the interceptparameter, A, without changing its shape, indexed by the slope parameter, K. To test this hypothesis,two additional models were fit to the data: Model C, in which parameter K was held constant, andModel D, in which parameter A was held constant, while, in each case, letting the other parameter varywith shift size. The parameter estimates for these 4-parameter models are shown in Table 1. The lossvalue for constant slope Model C was 573.346 and for constant intercept Model D, 577.980. Bothmodels were significant improvements over Model A [KX (2, N = 1339) = 83.324, p < .0001, X2 (2, N= 1339) = 92.592, p < .0001]. The 6-parameter Model B was a significant improvement over theconstant intercept Model D [X2 (2, N = 1339) = 12.018, p = .002] but did not differ significantly fromthe constant slope Model C [X2 (2, N = 1339) = 2.750, p = .25].
Because neither Model C nor Model D was a reduced version of the other, there is not an appropriatemeans of testing for a significant difference between them. However, because the constant slope ModelC has a lower loss value than Model D, and is not significantly different from the 6-parameter ModelB, it is accepted as equivalent to Model B and becomes the basis for further work. In accepting ModelC, it is concluded that shift size affects the intercept of the saccade length function, and not its slope.The fit of Model C to the data from the three shift size conditions is shown in Figure 3, using the samesliding window method that was used for preparing Figure 2.
[Insert Figure 3 about here.]
Within Trial Serial Position Effects on Detection
In Experiment 1, the experimental pictures were each shifted twice during the 20 s viewing period, andthese shifts could occur at different times during this period. This raises two questions. First, does thelikelihood of detection change across the viewing period for a picture? And second, is there anydifference in the likelihood of detection of the first vs. second picture shift.
Concerning the first question, researchers have often suggested that processing during the initial fixationson a picture is different from that occurring later: during initial eye fixations the general, low spatialfrequency characteristics of the scene (global, holistic, or background features) are acquired, with greaterdetail being picked up during later fixations (Buswell, 1935; Loftus, Nelson, & Kallman, 1983). Inaddition, it is possible that, given the nature of the recognition task used, subjects might attend carefullyto the picture during the first part of a viewing trial in order to store its characteristics (first viewing withthe picture) or to determine whether anything had changed (second viewing), and then turn greaterattention to the detection task during the latter part.
Concerning the second issue, because an initial shift of the picture was always followed 7 saccades laterwith an opposite shift of equal length (here called a shift-back), the occurrence of the first shift mightprime sensitivity to the second. This could particularly occur if the internal response to the first shiftwas not large enough to lead to detection, but was large enough to sensitize the observer to the shift-back.
To test the hypothesis that detectability is greater to shift-backs than to shifts, the data were partitionedaccording to three variables: shift size (3 conditions), shift vs. shift-back (2 conditions), and serialposition (6 positions: saccade 2, 9, 16, 23,30 and 38). Crossing these variables yields 36 conditions, butonly 30 actually exist: no shift-backs could occur on the 2nd saccade, and all changes on the 38th saccade
McConkie & Currie

Visual Stability Across Saccades - 12
were shift-backs. Equation (1) was separately fit to data from each of these conditions, and the lossvalues summed across conditions. With 2 parameters per condition, this effectively created a 60-parameter model, Model E, which yielded a loss value of 533.184. A reduced model, Model F, was thenconstructed by eliminating the distinction between shift and shift-back, resulting in 18 conditions (3 shiftsizes by 6 serial positions). Equation (1) was fit separately to the data of each of these conditions, andthe loss values summed for a total of 546.447 for this 36-parameter model. The chi square test failedto show a significant difference between Models E and F [X2 (24, N = 1339) = 26.526, p = .327]. Thus,the hypothesis that subjects are more sensitive to shift-backs than to shifts is not supported.
Turning next to the question of whether the likelihood of detecting a shift varies across the course ofviewing a picture, the 36-parameter Model F was compared to Model B, the 6-parameter model thatincluded only the shift size conditions and ignored serial position of the saccade on which the shiftoccurred. Thus, a test between Models B and F is a test of significance for serial position effects. Thistest yielded a significant difference [X2 (30, N = 1339) = 51.048, p < .01], indicating the presence ofserial position effects.
To test the hypothesis that this effect is due to processing differences during the initial fixations on apicture, a reduced version of the 36-parameter Model F was produced in which data for all serialpositions greater than the 2nd saccade were collapsed into a single set for each shift size. This left onlytwo values on the serial position factor, the 2nd saccade vs. other saccades, which, when crossed withshift size, resulted in a total of 6 conditions. Equation (1) was fit separately to data from each of theseconditions and the summed loss value for this new model, Model G, with 12 parameters, was 560.536.Applying the reduced model test between the 36-parameter Model F and the 12-parameter Model Gfound no significant difference [X2 (24, N = 1339) = 28.176, p = .253], nor does Model G differsignificantly from the 60-parameter Model E [X2 (48, N = 1339) = 54 .7 02 , p = .235]. Thus, collapsingthe data across all serial positions following the 2nd saccade did not decrease the fit of the modelsignificantly. On the other hand, a test between Model B, which did not include serial position effects,and Model G, which maintains the distinction between 2nd and later saccades, did produce a significantresult [X2 (6, N = 1339) = 95.506, p < .005]. This pattern of results indicates that the likelihood ofdetection is different for shifts that occur during the 2nd saccade than during later saccades. Thelikelihood of detection is quite low early in the viewing sequence. The A parameter estimates indicatethe maximum level of detection for each condition: for the 0.3 deg condition, this reached only 5% forshifts occurring during the 2nd saccade in contrast to the 47% on later saccades.
In conclusion, detection is low on the initial fixations on a picture, but no further change in detectionrate occurs across the sequence of later fixations. Thus, there is no evidence for increased sensitivityon change-backs, nor for greater attention to the secondary task later in the viewing period for a picture.
Influence of Relative Shift Direction
Previous investigators report that relative shift direction, the direction of a shift relative to the directionof the saccade during which it occurs, has no effect on the likelihood of detecting the shift. Todetermine whether a relation between these variables exists in the data from Experiment 1, two indiceswere created concerning the angular distance between the direction of a saccade and the direction ofthe shift that occurred during that saccade. First, the value of the internal angle between the directionof the saccade and the direction that the picture moved during the saccade, was calculated. This value,which ranges from 0 deg to 180 deg, served as the first relative shift direction index. The second relativeshift direction index, ranging from 0 deg to 90 deg, was constructed by taking the value of thecomplementary angle of any angle greater than 90 deg. The first index would be related to detectabilityif it changes as the direction of image movement deviates from shift direction over a full 180 deg; thesecond index, if detectibility changes as the shift direction deviates from the line of saccade motion,ignoring direction, causing orthogonal motion to be either most or least detectable.
McConkie & Currie

Visual Stability Across Saccades - 13
Because the A parameter was influenced by shift size, it was hypothesized that this same parametermight also be affected by relative shift direction. Therefore, Model B, which assumed a constant valuefor the K parameter across shift sizes, was expanded by writing A as a linear function of relative shiftdirection, as shown in Equation (2):
(2) f(rsds) = (AI + AS * rsd) * e(K *
In Equation (2), f(rsd,s) is the likelihood of detection, Al is a parameter indicating the intercept of thelinear function, AS is the slope of the linear function, K is a parameter controlling the rate of changewith saccade length, rsd is the relative shift direction and s is the saccade length.
The data from Experiment 1 were partitioned into three sets, based on the shift size (0.3, 0.6 and 1.2deg). Equation (2) was fit separately to each of these sets of data using the 180 deg relative shiftdirection index. Summing the resulting loss values yielded a total loss value of 541.103 for this 9-parameter model, Model H. Estimated parameter values are given in Table 1. Since Model B is areduced version of Model H, including shift size differences but ignoring relative shift direction, thereduced model test was applied, yielding a significant difference [X2 (3, N = 1339) = 61.7 36 , p < .005].Since the two models differ strictly in terms of whether relative shift direction is included, this resultsupports the hypothesis that relative shift direction affects shift detection. The parameter estimates inTable 1 show that theAS parameter is negative, indicating that detection likelihood decreases as relativeshift direction increases; that is, with shift length and saccade direction held constant, shifts in the samedirection as the saccade are more detectable than shifts in the opposite direction of the saccade.
A second test was made to determine whether the 90 deg relative saccade direction index is related todetectability. This was done in the same way as the application of Model H, except that the 90 degrelative shift direction index was used as the rsd variable. This model, Model I, produced a loss valueof 556.755 which was also significantly different from Model B [X2 (3, N = 1330) = 30.432, p < .005].Notice, however, that the loss value produced by the 180 deg index was substantially lower than thatproduced by the 90 deg index. This observation leads to the conclusion that the effect of relative shiftdirection is less related to the degree of orthogonality of the shift from the line along which the eyesmove, than to the degree to which the shift direction deviates from the actual direction of the saccade.
An attempt was made to further simplify Model H by holding different parameters constant across shiftsize. Holding K constant produced a 7-parameter model, Model J, with loss value of 543.159 that is notsignificantly different from the 9-parameter Model H [X2 (2, N = 1339) = 4.112, p = .128], againindicating that the variables are affecting the intercept rather than the slope of the basic saccade lengthfunction. Holding the AS parameter constant as well produced a 5-parameter model, Model K, withloss value of 560.556 that is significantly different from the 9-parameter Model H [X2 (4, N = 1339) =38.906, p < .005]. Model K, with the AS parameter constant, is also significantly different from the 7-parameter Model J in which the AS parameter varies with shift size [X2 (2, N = 1339) = 34.794, p <.005]. These findings confirm that relative shift direction affects the intercept parameter, A, rather thanthe slope, K, of the saccade length function.
Discussion
The goal of Experiment 1 was to determine whether the likelihood of detecting intra-saccadic shifts ofa naturalistic scene while examining it over time would show four characteristics observed with thedetection of intra-saccadic shifts in much simpler displays. Only one of these characteristics wasobserved in the current data: the saccade length function (i.e., drop in the likelihood of detecting a shiftas saccade length increases). In contrast, displacement threshold levels were much higher in the currentstudy, as can be seen in Table 2 which compares current detection rates from Experiment 1, asestimated from the appropriate models, to those of prior studies having sufficiently overlapping
McConkie & Currie

Visual Stability Across Saccades - 14
conditions. Detection rates in the present study were much lower than in previous studies that used verysimple stimuli, but more similar to those of Bridgeman et al. (1975) who used the most complexstimulus pattern and relatively free viewing. The constant detection/saccade length ratio was notconfirmed, as shown in Figure 4. And the current data did not show direction independence: rather,detection rate varied with relative saccade direction being greatest for shifts in the direction of thesaccade, which is opposite the direction reported by Macknik et al. (1991). An interpretation for thisresult is given in the general discussion.
[Insert Table 2 and Figure 4 about here.]
In answer to the first question posed in the introduction of this report, it appears that findings fromearlier studies with simpler stimuli do not generalize very well to a more naturalistic situation. Imageshifts of sizes that can be detected under optimal conditions do not necessarily disrupt processing to anextent that they are noticed during normal viewing of complex scenes. This raises doubts about whetherthe earlier studies were investigating a fundamental mechanism by which visual stability is achieved inall visual perception, as cancellation theory would suggest. Rather, the fact that different situations notonly change the level of detection, but even properties of the psychophysical functions themselves, ismore consistent with theories that suggest that, while there is some basis for registering an intra-saccadicspatial displacement of the image, this does not necessarily disrupt on-going processing, and the degreeto which the displacement is detected varies with the task and stimulus conditions. This is consistentwith the observations of Matin et al. (1982) and Bridgeman and Graziano (1989) that the basis on whichstimulus shifts are detected is different under illuminated conditions and with more complex stimuli thanfor simple stimuli in the dark.
The second question posed in the introduction concerns the functional stimulus region issue fordetection of intra-saccadic shifts: is this detection based on a global assessment of stimulus position ordirection, or only on some local information. This question cannot be addressed with data fromExperiment 1, because local and global displacement properties are entirely confounded: the size of thedisplacement of the picture as a whole is the same as the size of the displacement of every object withinthe picture. Thus, a second experiment was conducted to investigate this second issue.
EXPERIMENT 2
To investigate the functional stimulus region issue for detecting stimulus shifts, and to test the target-object theory, it is necessary to create an intrasaccadic stimulus manipulation in which there is nounidirectional shift of the entire image, but the absolute position of objects in the region of the eyes'landing site varies. This was accomplished by expanding or contracting the picture from its centerduring selected saccades. With this manipulation, the image as a whole is not moved in any singledirection, as it is when shifted, but the local objects do move, with direction and distance varying withposition in the picture. There is little or no spatial displacement of objects near the center of thepicture; magnitude of displacement increases with distance from the center, with direction ofdisplacement determined by the direction of the object from the picture center. Thus, a localdisplacement size metric (Ids) can be defined that is the distance that the eyes land from the point inthe picture where they would have been had the image not changed size.
Detection of a change in the size of a picture might occur in any of three ways. First, detection mightbe based strictly on the local object displacements that result from changing the size of the picture,rather than on the size change itself. This will be called the Displacement Only Hypothesis. If this werethe case, the likelihood of detecting a change would vary with local displacement size, and should becompletely predictable by a generalization of the type of model developed for data in Experiment 1 withno additional effect of the magnitude of the size change. Second, it might actually be the size changeitself that is detected, either perceiving a change in the size of the entire picture or some variable, such
McConkie & Currie

Visual Stability Across Saccades - 15
as total luminance, that varies with it, or perceiving a change in the size of local objects within thepicture. This will be called the Size Only Hypothesis. Because amount of change in size is constantacross the picture, both locally and globally (that is, with a 10% increase the entire picture and everypart of it increase by 10%), the likelihood of detecting a change would not vary with local displacementsize but only with the magnitude of the size change itself. Third, detection might be based on somecombination of these two types of information, which will be called the Combination Hypothesis. In thiscase, detection should vary with local displacement size in a manner that could be captured with the typeof model developed for Experiment 1, but this model should require an additional parameter that varieswith size change, independent of eye position within the picture. The goal of Experiment 2 was todetermine which of these three hypotheses best account for detection of intrasaccadic changes in thesize of a picture.
Method
The method used in Experiment 2 was identical to that in Experiment 1, with the data being acquiredduring the same picture viewings by the same subjects. A change in picture size was implemented byreplacing the base picture, during one of the critical saccades, with an alternative version of the samepicture that was either 10% or 20% larger or smaller, by volume, than the base version. Seven saccadeslater, the base picture was returned to the screen, producing a size change in the opposite direction ofabout the same amount. The base image was approximately 22 deg by 15 deg in size at the displayeddistance, and the alternatives were approximately 24 x 17, 23 x 16, 21 x 14 and 20 x 13. The five versionswere created by enlarging or shrinking the base image using the Truevision ATVista TIPS imagingsoftware package v2.0. One change and change back was scheduled on each experimental picture, butwhether these occurred depended on the number of saccades that were made. The four resulting sizechange conditions were counterbalanced across picture, critical saccade and picture sequence positionin the same way as shift conditions were in Experiment 1. Subjects were not asked to determine whattype of change occurred as they were viewing the pictures, but only to press their button if they detecteda change of any type.
Two additional variables were attached to each saccade. The first, local displacement size (lds),indicates the absolute distance between the point in the picture where the eyes would have been directedhad the picture size not changed, and the actual eye position. The second, relative displacementdirection (rdd), indicates the angle in degrees, from 0 to 180, between the direction of the saccade andthe direction of the local displacement.
Results
With 16 subjects, 32 experimental pictures, 2 presentations of each picture and 2 image size changesscheduled for each picture, there was a total of 2,048 changes possible; of these, good data, as definedin Experiment 1, were obtained from 1,543 changes, which were used in the following analyses.
For each subject, the percent of cases in which the display change was detected was computed for eachof 8 conditions: the initial size change vs. the change back, and 4 different initial degrees of size change:large and small size increase, and large and small size decrease. A repeated measures analysis ofvariance on these data found a significant effect for size of change [F(3,51) = 19.67, p < .0002], but notfor change vs. change back nor for any interaction. The detection rates for size change conditions arepresented in Table 3, together with mean values for saccade length, local displacement size (lds), andrelative displacement direction (rdd). As indicated earlier, the frequency of false alarms and lateresponses was very low, around 1%. Detection rates when the picture size was changed were muchhigher than these control condition rates, and differed significantly with condition with larger changesbeing associated with more frequent detection. The direction of the size change (expansion vs.contraction of the picture) had no effect on detection, a fact that was replicated in several attempts to
McConkie & Currie

Visual Stability Across Saccades - 16
include this variable in models that are reported below, and so this variable is ignored in furtheranalyses.
[Insert Table 3 about here.]
To test among the three alternate hypotheses stated above, a series of models was developed and fit tothe data, similar to the exploration reported for Experiment 1. Parameter values are presented inTable 4. As a first step, three models were developed. Model L assumed that only size change affecteddetection: a single parameter varied with size change (10% or 20% change), producing a loss value of957. A chi-square test rejected this model as an adequate description of the data [X2 (1541, N = 1543)= 1914, p = < .0005]. Thus, a simple version of the Size Only Hypothesis is rejected.
Model M was created to determine whether the length of the saccade affects detection of changes inthe size of a picture. It was identical to Model A of Experiment 1, fitting Equation (1) to the data. Theloss value was 698, which was not rejected by chi-square test [X2 (1541, N = 1543) = 1396, p = .997].This result indicates that the detection of a change in the size of a picture, like the detection of a pictureshift, is greatly affected by the length of the saccade during which the change occurred. Changes aredetected more frequently when they occur during short saccades.
The third model uses the results of Model M to test whether the magnitude of the size change has aneffect on its detection, once the effect of saccade length is taken into account. To do this, Model N wascreated by fitting Equation (1) separately to the two size change conditions, producing a 4-parametermodel. The resulting loss value was 654, which is a significant improvement over Model M [X2 (2, N= 1543) = 88, p < .0001]. This result indicates that both saccade length and the magnitude of the sizechange affect the likelihood of detecting the change.
Having established that the magnitude of the size change affects its detection, the issue addressed in thenext set of models concerns whether this is due directly to the detection of the change in size itself, asrepresented by a more complex version of the Size Change Hypothesis which allows saccade length toalso have an effect, or is due to the local displacement of eye position that is produced by the sizechange manipulation (Local Displacement Hypothesis). The first step in this process was to developEquation (3) which makes detection likelihood a function of both saccade length and local displacementsize (Ids).
(3) f(lds,s) = (AI, + AS, * Ids) * e" * s
Because prior models have found that other variables primarily have their effect on the intercept of thedetection function, Equation (3) makes the intercept a linear function of Ids.2 If the size of the localdisplacement is not having an effect on detection, then Equation (3) should fit the data no better thanEquation (1).
To test for an effect of Ids, two further models were created: Model 0 in which Equation (3) wasapplied to the total data set, collapsed across size change, and Model P in which Equation (3) was fitseparately to data from the two size change conditions. Model 0 had a loss value of 682, and ModelP, 645. The test of whether Equation (3), containing the Ids variable, fits the data better than Equation(1), which does not, was accomplished in two steps. First, Model O was compared to Model M, anda significant difference was obtained [X2(1, N = 1543) = 32, p < .0001]. Adding the Ids parametersignificantly improved the fit of the model. Second, Model N and Model P were compared. Model Napplies Equation (1) to the data from the two size changes separately, and Model P does the same forEquation (3). Thus, this comparison tested the question of whether, after taking size change intoaccount, adding the Ids parameter still improves the fit of the model. A significant difference was againfound [X2 (2, N = 1543) = 88, p < .0001] with Model P fitting the data better. Thus, the local
McConkie & Currie

Visual Stability Across Saccades - 17
displacement size has an effect on detection likelihood, over and above any effect of size change itself.This effectively rules out the Size Change Only Hypothesis.
A choice between the Local Displacement Only Hypothesis and the Combination Hypothesis can bemade by examining the loss values of Models N and 0. If the effect of size change on detection wereentirely due to the local displacements that are produced, as the Local Displacement Only Hypothesisassumes, then the fit of Model 0 should be at least as good as that of Model N. Having the Idsparameter in Model 0, which does not distinguish between size change conditions, should allow it tofit the data at least as well as Model N, which takes size change into account directly but has no idsparameter. This prediction is not supported by the data: the loss value for Model 0 is much higher thanthat for Model N, thus failing to support the Local Displacement Only Hypothesis. Thus, size changeis producing an effect on detection likelihood beyond effects of saccade length and local displacementsize.
If size change is producing an independent effect, this suggests that a model in which the effect of sizechange is represented by a separate parameter should give a more adequate description of the data.Equation (4) captures this assumption by adding a size change parameter, Cc, to Equation (1), wherethe C parameter varies as a function of size change, sc.
(4) f(s,sc) = A * e ' + C
Model Q consists of fitting Equation (4) to the data from Experiment 2, thus having 4 parameters, A,K and two values of C, one for the 10% change and one for 20% change data. A and K are assumednot to vary with size change. The loss value for Model Q is 636, which is significantly lower than thatof Model M [X2 (2, N = 1543) = 124, p < .0001]. It is also much lower than the loss value for ModelN, which has the same number of parameters, but which attempts to capture the difference between sizechange conditions by varying the A and K parameters. Thus, there is an effect of size change that isbest represented by a separate parameter.
Given that Model Q gives a more adequate representation of the effect of size change on detection, itis necessary to determine whether local displacement size still affects detection. This was done bycreating Equation (5), which makes the intercept parameter, A, from Equation (4) a linear function ofIds.
(5) f(s,sc,lds) = (AIi + AS, * Ids) * e(Ks) + C,
Model R consisted of fitting Equation (5) to the data, thus producing a 5-parameter model, and yieldinga loss value of 631, which is a significant improvement over Model Q [X2 (1, N = 1543) = 10, p < .002].Thus, local displacement size is still found to produce an effect on detection, further ruling out the SizeChange Only Hypothesis. The fact that contrary evidence has been found for both the Size ChangeOnly and Local Displacement Only Hypotheses leads to the acceptance of the Combination Hypothesis:both local displacement size and magnitude of size change are affecting detection likelihood.
A further model tested whether relative displace direction, rdd, produces an additional effect ondetection, as it did in Experiment 1. Model S was created by replacing the AI, parameter in Equation5 with a linear function of rdd. This did not significantly improve the fit of the model, as compared toModel R [loss value = 630, [X2 (1, N = 1543) = 0.8,p < .371]. Thus, there is no evidence that relativedisplacement direction influences the frequency of detecting the picture size changes in Experiment 2.
In Equation (5), Model R, the estimates for parameters Cxo and C20 directly indicate the size of theincrement in detection likelihood due to size change after the effects of saccade length and localdisplacement size are taken into account. As Table 4 indicates, the estimates for these parameters are
McConkie & Currie

Visual Stability Across Saccades - 18
0.024 and 0.160. The size of the increment for 10% size changes is very small, which raises the questionof whether this is a statistically significant increment. This question was tested by modifying Model Rto force the C10 = 0, producing Model T having 4 parameters. The loss value for Model T is 650, whichis a significantly poorer fit than that for Model R [X2 (1, N = 1543) = 39.8, p < .0001]. This findingleads to the conclusion that even the 10% size change is being detected directly to some degree, beyonddetection based on local displacements.
Discussion
Experiment 2 was conducted to determine whether the detection of intrasaccadic shifts of pictures,studied in Experiment 1, is based on local displacements of eye position within the pictures. The resultsindicate that the size of the local displacement does provide a signal on which detection of intrasaccadicchange is based, but that, in addition, change in picture size itself makes a unique contribution to thisdetection, as suggested by the Combination Hypothesis. This result is evidence that at least part of thepicture shift detection in Experiment 1 was based on local displacement size, rather than on a detectionof the global displacement of the picture as a whole.
The finding that the size of the local displacement affects detection raises a final question concerningwhether this was the only basis for shift detection in Experiment 1, or whether detection was based bothon this factor and some more global perception of the displacement of the picture as a whole. To testfor the detection of picture shifts based on global stimulus characteristics, a final pair of models wasdeveloped and fit simultaneously to data from Experiments 1 and 2. The data consisted of a 6-tuple foreach critical saccade in which the image was either shifted or changed in size. The 6-tuple consistedof (1) whether the change was detected (the dependent variable); (2) the saccade size, s; (3) the localdisplacement size, Ids, which, in the case of Experiment 1, consisted of the shift size; (4) the relativedisplacement direction, rdd, similar to relative shift direction in Experiment 1; (5) the global shift size,gss, which had a value equal to the shift size for data from Experiment 1 and a value of zero for datafrom Experiment 2; and (6) the global size change, sc, which had a value of the size change for datafrom Experiment 2 and a value of zero for data from Experiment 1. The first model, Model U, wasconstructed by combining Equations (2) and (3) to make the intercept an additive function of both idsand rdd, and adding terms for global shift size and size change, as shown in Equation (6):
(6) f(s,sc,lds,rddgss) = (AI + ASL * Ids + ASR * rdd) * e ) + Cs + Gv,
This model assumes that there is a common factor that contributes to detection likelihood in bothexperiments, namely, local displacement size and direction. In addition, there is a unique factor inExperiment 2, global size change, and another unique factor in Experiment 1, global shift size.
With 2 size changes and 3 global shift sizes, Model U has a total of 9 parameters. A reduced model,Model V, was formed by deleting the G parameter. Testing the difference between the fit of these twomodels constitutes a test for whether the size of picture shifts in Experiment 1 influenced detectionlikelihood in a manner not captured by local displacement size. A significant difference between thesetwo models would serve as evidence that a global influence of shift size is producing an effect on thelikelihood of detecting the intrasaccadic changes, above and beyond that resulting from the localdisplacements of the eyes' landing position that results.
Loss values for Models U and V were 1257 and 1271, successively, which are significantly different [X2(3,N = 3033)= 28.4, p < .0001]. This difference leads to the conclusion that the detection of shift size isnot based entirely upon local displacement size, indicating the presence of a more global effect, as well.Estimated parameter values are presented in Table 5.
McConldkie & Currie

Visual Stability Across Saccades - 19
GENERAL DISCUSSION
Two experiments were performed to study the phenomenon of space constancy or visual stability, thetendency to perceive the world as stable even though its position is displaced on the retinae with everysaccadic eye movement. The studies focused on two issues that arise from a review of current theoriesof visual stability: whether results from earlier studies involving the detection of intrasaccadic shifts ofsimple stimuli in the dark generalize to a more naturalistic stimulus and task, and whether shifts in thestimuli are detected on the basis of local information in the region of the saccade's landing position, oron the basis of more global information about the position of the image as a whole. A visual world wascreated with naturalistic, full-color images on a computer screen, in which the pictures being examinedoccasionally changed position (shifted) or changed size during saccades as the observers were examiningthe pictures either to remember them or to determine whether they were the same as in an earlierviewing. The observers indicated when they detected a change, thus noting a violation of visual stability.Experiment 1 investigated the issue of generalizability of results. Of the four primary results fromearlier research, only one, the tendency for detection to drop as saccade length increases, was replicatedhere. The other three results did not generalize: displacement thresholds were much higher in thenaturalistic situation than in earlier studies, there was not a constant ratio between detection likelihoodand saccade length as saccade length varied, and it was not true that the shift direction, relative to thesaccade direction, had no effect. Rather, shifts that went in the direction of the saccade were detectedmore frequently than shifts in the opposite direction, though this result was not replicated with thesmaller local shifts in Experiment 2. Thus, it is concluded that detection frequency and its relationshipto other variables is not constant across stimulus and task conditions.
Experiment 2 addressed the issue of whether the detection of image shifts is based on local vs. moreglobal information. The results indicate that detection of intrasaccadic changes in the size of picturesis a function of the local displacement size, or how far the eyes land from the picture location wherethey would normally have landed had the change not occurred. This is taken as evidence for detectionbased to a large extent on local information, namely, where the eyes land with respect to their target.Evidence was also found for the direct detection of size change, though the study did not permitdistinguishing between whether this was based on local information, such as the change in size of, orin distance between, objects in the region of the eyes' landing position, or global information, the overallchange in size of the picture.
In a final attempt to simultaneously model data from both experiments, the model did not account forall of the effect of shift size on detection observed in Experiment 1. This indicates either an inadequacyin the model or that some factor other than local displacement size also contributes to the detection ofthe shifts in that experiment. These possibilities require further investigation.
The observations above have implications for each of the four types of theories of visual stabilityoutlined in the introduction. The fact that observers detect intrasaccadic shifts in pictures, even whenthis is not their primary task, once again argues against Gibson's (1966) account of visual stability asbeing the result of properties of the proximal stimulus alone: rigid, discrete retinal displacements duringperiods of saccadic suppression. The image shifts used in Experiment 1 largely met that criterion, yetwere detected about as well as the size changes occurring in Experiment 2, which did not. Onequalification on this conclusion results from the fact that, although the pictures appeared on a large,dark surface and in semi-darkness, there were two aspects of the visual field that did not shift when apicture shifted, thus resulting in a lack of a completely rigid transformation from fixation to fixation: dimpatterns in the far periphery, and part of the eyetracking equipment itself which was visible. Still, thefact that other investigators, working in complete darkness, have found intrasaccadic stimulus shifts thatconstitute rigid transformations to be detected argues against a strictly stimulus-based explanation ofvisual stability.
McConkie & Currie

Visual Stability Across Saccades - 20
The current results are compatible with other recent observations that the perception of stability isdifferent with complex stimulus patterns than with simple patterns in the dark (Bridgeman & Graziano,1989). This suggests that the mechanism postulated by cancellation theory, and studied in many earlierexperiments, is either not fundamental to the maintenance of visual stability in normal viewing, or thatthe signal produced by across-saccadic image misalignment plays a decreasing role in vision as imagecomplexity increases. In the current study, it can be further argued that the signal produced bymisalignment is less likely to be noticed when its detection is not the observer's primary task, thusaccounting for the low detection levels relative to those found in previous experiments. However, takingthis position raises serious questions about how fundamental the cancellation process really is inmaintaining visual stability: apparently, normal perceptual processing can proceed smoothly in the faceof stimulus displacements that are much larger than those that can be detected with simple stimuli inthe dark.
Finally, the current results indicate a need for cancellation theory to be revised to give priority to thealignment of local information in the region of the eyes' landing position following a saccade.
Postulating a process that does not cancel out discrepancies between the retinal locations of the stimuluspattern between fixations, but that provides a signal concerning the extent to which the image on onefixation is at the location where it would be expected, given the intervening saccade, leads naturally tothe third type of theory. MacKay's (1973) "cognitive approach," and Bridgeman et al.'s (1994) "takinginto account" theory, suggest that various types of information are evaluated in determining whether achange has occurred in the stimulus. Unless evidence is present suggesting otherwise, the visual systemassumes that the world has remained stable from one fixation to the next. This type of theory seemsto accommodate the results from Experiments 1 and 2 most easily, because the information examinedand the nature of the tests made could vary with stimulus and task characteristics. Thus, differences indetection frequency and psychophysical functions across tasks are to be expected, and greaterconsideration could be given to information near the eyes' landing position than to the global stimuluspattern. The primary problem with this type of theory is that it lacks specificity-, the nature of themechanism that takes information into account, the nature of the information used, and the rules ofoperation have not yet been specified sufficiently well to permit strong tests of the approach. Inparticular, it is not clear what the information and mechanism might be that detects intrasaccadic shiftsof pictures. In this case, the interpretation given to the picture, the objects contained in it and thespatial relations among them, remain invariant, thus providing no indication of stimulus change. Theonly thing that is changed is the spatial relation between the observer and the stimulus. Thus,Bridgeman et al. (1994) propose that, on each fixation, a calculation is made concerning the "directionof the world." This vector can be compared from fixation to fixation, and a discrepancy in direction isdetected if it is sufficiently large.
Irwin, McConkie, Carlson-Radvansky, and Currie (1994) have criticized Bridgeman et al.'s explanationof detecting stimulus shifts by pointing out that the world, in fact, has no direction; only objects orregions have direction with respect to the observer. Furthermore, each object or region has a differentdirection. This raises the question of whether the visual system calculates a direction for each, or fora subset of, objects or regions, and then detects shifts on the basis of changes in all or some of thesedirections. In particular, the finding that local discrepancies in landing positions predict shift detectionsuggests that the direction of the object to which the eyes are being sent may play a key role in detectingstimulus shifts.
Closely related to the interpretation of taking-into-account theory is the fourth type of theory discussedabove, the saccade target theory, which postulates that a shift of the stimulus is detected on the basisof the post-saccadic retinal location of the object to which the eyes are sent. This theory appears toovercome the limitations of the Bridgeman et al. proposal and to be quite compatible with many of thecurrent results. Because this type of mechanism has only been alluded to indirectly in previous literature
McCondkie & Currie

Visual Stability Across Saccades - 21
(Bridgeman & Stark, 1979), an elaboration of it is attempted here. It is referred to as the saccade targettheory of visual stability (Irwin et al., 1994).
The proposed theory makes the following basic assumptions:
Assumption 1. The visual system assumes that the world remains consistent during the period of asaccade (Bridgeman et al., 1994; MacKay, 1973). This assumption is accepted unless there isdisconfirmatory evidence. Of course, a key issueconcerns the nature of such evidence and how itbecomes available.
Assumption 2. There is no carry-over of the retinal image from the end of one eye fixation to thebeginning of the next (Irwin, 1991; O'Regan, 1992; Pollatsek & Rayner, 1992). Hence, there is nointegration of successive images, as Breitmeyer et al., (1982) and others have assumed. The onlyinformation that survives a saccade is that which has been specifically selected for encoding and storagein a more abstract form. From an evolutionary perspective, there is no need for an organism to havea memory for the full complexity of the visual stimulus, since the full set of information is containedwithin the world itself and is continuously projected to the retina of the observer whose eyes are open(O'Regan, 1992).
Assumption 3. There exists a mental representation of selected information from the scene beingviewed, which includes information about the properties and locations of objects and regions within thescene that have been previously attended, as well as more global information about the nature, structureand characteristics of the scene as a whole. The nature of this representation is, of course, much indispute.
Assumption 4. The early visual processes parse a complex stimulus configuration into a hierarchicalstructure of regions, together with their features or properties, that will be referred to as an objecthierarchy (Palmer, 1977).
Assumption 5. On each eye fixation, a mapping function is established between the stimulusconfiguration provided by the retina, and the mental representation. This mapping function makes itpossible, from any region in either of these two spaces, to locate the corresponding region in the otherupon request.
Assumption 6. Each saccade is normally an attempt to direct the eyes toward some selected entity inthe retinally provided stimulus structure, thus bringing it onto a part of the fovea that provides higherspatial resolution. The selected entity will be referred to as the target object.
With these basic assumptions about visual perception, we now propose a mechanism by which stimulusdisplacements may be detected.
Step 1. During each eye fixation, a target object (see Assumption 6) is selected from the retinallyprovided object hierarchy as the goal of the following saccade. While the process by which thisselection is made is of great interest, it will not be dealt with further at this time.
Step 2. The location of the saccade target in the mental representation is noted.
Step 3. Certain features or information about the target object are selected and stored, in order tofacilitate its identification at the onset of the following fixation. This is referred to as the locatinginformation. The nature of the locating information, and whether it varies by task, stimulus, oreccentricity of the saccade target, are issues that require further research.
McConkie & Currie

Visual Stability Across Saccades - 22
Step 4. A saccade is initiated to bring the target object into central vision. The accuracy of the saccadecan be compromised by various influences such as the global effect (Findlay, 1982), range effect(Kapoula, 1985) and perceptual inaccuracy (Coeff6 & O'Regan, 1987).
Stp 5.. As new visual information begins to become available following the saccade, a fast, probablyparallel, search is made in an attempt to find the locating information that indicates the retinal locationof the saccade target. This scan is made within a limited region, referred to as the saccade target searchregion, probably determined by past experience with the distribution of retinal locations of saccadetargets. We will refer to this as the saccade target locating process.
Step 6. When the saccade target is located in the stimulus array, the relationship between its retinallocation and the previously noted location (see Step 2) in the mental representation is identified. Thisgives rise to a bi-directional mapping function between these two spaces. Given a location in eitherspace, the approximate corresponding location in the other space is specified. Thus, this function is thebasis for identifying the appropriate location in the mental representation for information obtained froma stimulus object or region, and for identifying where in the retinally provided stimulus array attentionshould be directed to obtain further information about some object or region already included in themental representation.
Step 7. Having established the mapping relationship between retinal space and the mentalrepresentation, normal perceptual activity (i.e., acquiring and using visually-provided information for thetask at hand) is able to proceed normally during that fixation.
By the saccade target theory, the sense of a stable visual world occurs when the locating process issuccessful; that is, when, at the onset of each fixation, the saccade target is found within the initial searchregion. It is postulated that a failure of the saccade target locating process is evidence for instability inthe stimulus array, contradicting the assumption of a stable visual world. When the image is shiftedduring a saccade, this increases the likelihood that the saccade target will not lie within the searchregion, thus increasing the likelihood that the locating process will not succeed. When the locatingprocess initially fails, a wider search must be initiated in an attempt to find the target. Normalperception proceeds only when the target is found, or it is concluded that it no longer exists andprocessing must continue on some other basis.
The saccade target theory provides explanations for several of the observations from Experiments 1 and2. First, the conclusion that image shifts are detected on the basis of local information is consistent withthis theory, which depends specifically on the saccade target locating process to maintain visual stability,rather than on any sort of global image integration across saccades. Second, larger image shifts aremore likely to be detected because they are more likely to move the saccade target out of the searcharea for the following fixation. Third, image shift detection drops with longer saccades because, sincethe distribution of landing sites following longer saccades is more variable (McConkie, Kerr, Reddix,& Zola, 1988), a larger search region is probably employed under these conditions. The larger searchregion reduces the likelihood that a shift of a given size will take the target outside the region, thusreducing the likelihood of detecting the shift. It should also be noted that in viewing naturalistic sceneslike those used in the above experiments, longer saccades are, on the average, probably taking the eyesto larger saccade targets, and larger targets are less likely to move out of the search region with a shiftof a given size. Fourth, if target object size is a factor in the frequency of detecting stimulus shifts, thiscould explain why detection is so much poorer for shifts made early in the viewing of a picture. Duringthe first few fixations, the observer probably attends broadly to the picture, identifying its theme andgeneral structure; during this process, the eyes are sent to the largest objects and regions in the picture,resulting in reduced likelihood that a target object will lie outside the search region. During laterfixations, as smaller objects and details are attended, the frequency of shift detection is increased. Fifth,the fact that shifting the image in the same direction as the saccade results in higher detection than
McConkie & Currie

Visual Stability Across Saccades - 23
shifting opposite that direction results from a characteristic of saccadic movements: when makingsaccades to a target, there is a tendency to undershoot that target, though the actual error is dependentupon the launch site of the saccade, as well (Kapoula, 1985). Thus, on average, shifting the image inthe direction of the saccade would have a tendency to exacerbate such an undershoot, whereas shiftingthe image opposite the direction of the saccade will often reduce this type of error. Assuming that thereis a tendency for the search region to be biased toward the center of the fovea, this would result in agreater likelihood of the saccade target lying outside the search region, and, hence, of detecting the shift,when the image is shifted in the direction of the saccade than when it is shifted against that direction.This is the pattern observed in Experiment 1. The fact that no effect of relative displacement directionwas found in Experiment 2 could be due to the smaller displacements involved in that study.
Finally, while a failure in the locating process is one indication of instability in the stimulus world, otherindications can also exist. First, the saccade target model did not succeed in accounting for the entireshift size effect in Experiment 1. It is not clear at this point whether this result is due to inadequaciesin the formalism of the model developed in this paper (e.g., using non-optimal functions, or notincluding critical interaction terms in the model), or to the existence of a true, non-local imagedisplacement effect. Further investigation and modeling will be required to resolve this issue. If a non-local effect is indeed documented, as suggested by the present study, it will be necessary to investigateits nature, and particularly to determine whether it has properties expected by a form of cancellationtheory.
Second, Experiment 2 found that changes in the size of the image contribute to detection, independentof the accompanying local shift in the image. However, this experiment did not provide appropriate datafor identifying the basis on which this detection occurred. Some possible bases for detection that mustbe investigated in future studies include the following: a change in the total illumination from thepicture, a change in the global size of the illuminated region of the picture, a change in the size of thesaccade target, or a change in the distance of the saccade target from nearby objects.
Future work is also needed to identify other sources of evidence for instability in the stimulusconfiguration from one fixation to the next. As a conceptual framework for this work, we suggest thefollowing bases for the detection of change between fixations: (a) failure to locate the saccade target,which can result either from its not being in the search area, or from a change in the locatinginformation; (b) an abrupt change in certain low-level perceptual characteristics of the stimulus field,such as total luminance, brightness, or dominant hue, which may disturb the system, perhaps even duringthe saccade itself; (c) change in properties of some object or region of the stimulus field that has beenpreviously coded and included in the mental representation, other than the locating information, so arecoding of that information leads to a discrepancy between newly-acquired and previously representedinformation. It should be noted that these three bases for detection of change would be expected tooccur at quite different levels of processing, and hence at different times following the onset of an eyefixation. Whereas failure to locate the saccade target and changes in low-level perceptual characteristicsshould be noted early in the fixation, changes in a previously coded object should only be noticed laterwhen information from that object is specifically attended and brought into contact with its previouslystored representation. A possible procedure for distinguishing among such different sources of effectsby comparing frequency distributions of fixation durations has been suggested by McConkie, Reddix,and Zola (1992).
The saccade target theory of visual stability, as stated above, does not postulate a role for a corollarydischarge signal in achieving visual stability. Future work is needed to address the issue of whether thistype of theory can account for results from studies involving the detection of intrasaccadic displacementsof simple stimuli in the dark, or whether under these conditions a corollary discharge signal must beassumed as suggested by recent work by Bridgeman and his associates (Bridgeman & Graziano, 1989;Bridgeman & Stark, 1991).
McConkie & Currie

McConkie & Currie Visual Stability Across Saccades - 24
There are two limitations of these experiments that should be noted. First, all conclusions come fromdata pooled across subjects, and single subject replication is needed. Second, it is possible that subjectsare less sensitive to changes in raster-refreshed computer displays, such as those used in the presentexperiments, than they are to steady displays (Kennedy & Murray, 1991).

McConkie & Currie Visual Stability Across Saccades - 25
Acknowledgements
The studies described in this report were a fully collaborative effort on the part of the two authors.Equipment necessary to conduct this research was purchased with funds from American Telephone andTelegraph, Center for the Study of Reading, and the Research Board of the University of Illinois atUrbana-Champaign. The research was supported by the Center for the Study of Reading, and usedsoftware developed by Gary Wolverton. Part of the data analyses in the studies were conducted whilethe first author was on sabbatical leave at the University of Leuven, Belgium, supported by a SeniorInternational Fogarty Fellowship from the Public Health Service and a Research Fellowship from theBelgian Government. Thanks are expressed to Gery d'Ydewalle and members of the Eye MovementLaboratory at the University of Leuven for their support and encouragement. Ehtibar Dzhafarov wasvery helpful in suggesting appropriate statistical tests. The authors thank David Irwin for providingfeedback on an earlier version of this report and Alexander Pollatsek, John Findlay, and BruceBridgeman for their helpful reviews. Correspondence concerning this report should be addressed toGeorge McConkie, 2251 Beckman Institute, 405 N. Mathews, Urbana, IL 61801.

Visual Stability Across Saccades - 26
References
Andersen, R. A., Essick, G. K., & Siegel, R. M. (1985). The encoding of spatial location by posteriorparietal neurons. Science, 230, 456-458.
Breitmeyer, B. G., Kropfl, W., & Julesz, B. (1982). The existence and role of retinotopic and spatiotopicforms of visual persistence. Acta Psychologica, 52, 175-196.
Bridgeman, B. (1981). Cognitive factors in subjective stabilization of the visual world. Acta Psychologica,48, 111-121.
Bridgeman, B., & Graziano, J. A. (1989). Effect of context and efference copy on visual straight ahead.Vision Research, 29, 1729-1736.
Bridgeman, B., Hendry, D., & Stark, L. (1975). Failure to detect displacements of the visual worldduring saccadic eye movements. Vision Research, 15, 719-722.
Bridgeman, B., & Stark, L. (1979). Omnidirectional increase in threshold for image shifts duringsaccadic eye movements. Perception and Psychophysics, 25(3), 241-243.
Bridgeman, B., & Stark, L. (1991). Ocular proprioception and efference copy in registering visualdirection. Vision Research, 31, 1903-1913.
Bridgeman, B., van der Heijden, A., & Velichkovsky, B. (1994). A theory of visual stability acrosssaccadic eye movements. Behavioral and Brain Sciences, 17, 247-292.
Buswell, G. (1935). How people look at pictures. Chicago: University of Chicago Press.
Co6ff6, C., & O'Regan, J. K. (1987). Reducing the influence of nontarget stimuli on saccade accuracy:Predictability and latency effects. Vision Research, 27(2), 227-240.
Duhamel, J. R., Colby, C. L., & Goldberg, M. E. (1992). The updating of the representation of visualspace in parietal cortex by intended eye movements. Science, 255, 90-92.
Findlay, J. M. (1982). Global visual processing for saccadic eye movements. Vision Research, 22, 1033-1045.
Gibson, J. J. (1966). The senses considered as perceptual systems. Boston: Houghton Mifflin.
Helmholz, H., Von. Hanbuch der Physiologischen Optik. Leipzig: Voss, 1866. (English trans. from 3rd.ed., 1925.) J. P. C. Southall (Ed.), A treatise on physiological optics (Vol. 3). New York: Dover,1963.
Irwin, D. E. (1991). Information integration across saccadic eye movements. Cognitive Psychology, 23,420-456.
Irwin, D. E. (1992). Perceiving an integrated visual world. In D. E. Meyer & S. Kornblum (Eds.),Attention and performance XIV: Synergies in experimental psychology (pp. 121-142). Cambridge,MA: MIT Press.
Irwin, D. E. (1994). On the measurement of phosphor persistence in oscilloscopic displays. VisionResearch, 34, 1623.
McConkie & Currie

Visual Stability Across Saccades - 27
Irwin, D. E., McConkie, G. W., Carlson-Radvansky, L., & Currie, C. (1994). A localist evaluationsolution for visual stability across saccades. Behavioral and Brain Sciences, 17, 265-266.
Kapoula, Z. (1985). Evidence for a range effect in the saccadic system. Vision Research, 25, 1155-1157.
Kennedy, A., & Murray, W. S. (1991). The effects of flicker on eye movement control. Quarterly Joumalof Experimental Psychology, 43A, 79-99.
Li, W., & Matin, L. (1990). The influence of saccade length on the saccadic suppression of displacementdetection. Perception and Psychophyics, 48(5), 453-458.
Loftus, G. R., Nelson, W. W., & Kallman, H. J. (1983). Differential acquisition rates for different typesof information from pictures. Quarterly Journal of Experimental Psychology, 35A, 198-198.
Mack, A. (1970). An investigation of the relationship between eye and retinal image movement in theperception of movement. Perception and Psychophyics, a 379-384.
MacKay, D. M. (1973). Visual stability and voluntary eye movements. In R. Jung (Ed.), Handbook ofsensory physiology (Vol. 8/3, pp. 307-331). Berlin: Springer-Verlag.
Macknik, S. L., Fisher, B. D., & Bridgeman, B. (1991). Flicker distorts visual space constancy. VisionResearch, 31(12), 2057-2064.
Matin, L. (1986). Visual localization and eye movements. In K. R. Boff, L. Kaufman, & J. P. Thomas(Eds.), Handbook of perception and human performance (Vol. 1, pp. 20.1-20.45). New York: Wiley.
Matin. L., Picoult, E., Stevens, J., Edwards, M., & MacArthur, R. (1982). Oculoparalytic illusion: Visual-field dependent spatial mislocations by humans partially paralyzed with curare. Science, 216, 198-201.
McConkie, G. W., Kerr, P. W., Reddix, M. D., & Zola, D. (1988). Eye movement control duringreading: I. The location of initial eye fixations on words. Vision Research, 28, 1107-1118.
McConkie, G. W., Reddix, M. D., & Zola, D. (1992). Perception and cognition: Where is the meetingpoint? In K. Rayner (Ed.), Eye movements and visual cognition: Scene perception and reading (pp.293-303). New York: Springer-Verlag.
O'Regan, J. K. (1992). Solving the "real" mysteries of visual perception: The world as an outsidememory. Canadian Journal of Psychology, 46(3), 461-480.
Palmer, S. E. (1977). Hierarchical structure in perceptual representation. Cognitive Psychology, 9, 441-474.
Pollatsek, A., & Rayner, K. (1992). What is integrated across fixations? In K. Rayner (Ed.), Eyemovements and visual cognition: Scene perception and reading (pp. 161-191). New York: Springer-Verlag.
Skavenski, A. (1990). Eye movements and visual localization of objects in space. In E. Kowler (Ed.),Eye movements and their role in visual and cognitive processes (pp. 263-287). Elsevier SciencePublishers BV (Biomedical Division).
McConkie & Currie

Visual Stability Across Saccades - 28
Stark, L., & Bridgeman, B. (1983). Role of corollary discharge in space constancy. Perception andPsychophyics, 34(4), 371-380.
Stark, L., Kong, R., Schwartz, S., Hendry, D., & Bridgeman, B. (1976). Saccadic suppression of imagedisplacement. Vision Research, 14 1185-1187.
Volkman, F., Schick, A., & Riggs, L. (1968). Time course of visual inhibition during voluntary saccades.Journal of the Optical Society of America, 54 1310-1414.
Von Hoist, E., & Mittelstaedt, H. (1971). The principle of reafference: Interactions between the centralnervous system and peripheral organs. In P. C. Dodwell (Ed.), Perceptual processing: Stimulusequivalence and pattern recognition (pp. 41-72). New York: Appleton. (Original work published1950).
Whipple, W. R., & Wallach, H. (1978). Direction-specific motion thresholds for abnormal image shiftsduring saccadic eye movements. Perception & Psychophysics, 24, 1349-355.
Wilkinson, L. SYSTAT.: The System for Statistics. Evanston, IL: SYSTAT, Inc., 1989.
Zipser, D., & Andersen, R. A. (1988). A back-propagation programmed network that simulates responseproperties of a subset of posterior parietal neurons. Nature, 331, 679-684.
McConkie & Currie

Visual Stability Across Saccades - 29
Footnotes
'It should be noted that except in highly controlled circumstances, the change in the pattern of lighton the retina that results from making a saccade is not identical to that produced by shifting a two-dimensional image the same distance in the opposite direction. However, the small differences thatmight result, given the circumstances of the experiments reported below, will be ignored in this report.
2As an alternative to Equation (3), a model was also created in which k, rather than A, was writtenas a function of Ids. This model yielded a loss value of 678.13, which is significantly better than thatfrom Model M [X2(1, N = 1543) = 39.04, p < .0001]. This model fit the data slightly better than Model0. Because these are not nested models, there is no good method of statistically testing whether theydiffer, but they are so close that it is unlikely that the obtained difference is reliable. Because in priormodels, having variables affect the intercept parameter led to better fitting models, we chose to continuethe analysis based on Equation (3), rather than on this alternative equation.
3The Saccade Target Theory of Visual Stability was first presented by the first author at the 6thEuropean Conference on Eye Movements, Leuven, Belgium, in September 1991, in a paper entitled"Perceiving a Stable Visual World."
McConkie & Currie

Table 1
Models Tested in Experiment 1
No.Model A Parameters (Intercept) K Parameters (Slope) ra~ n Ls Tests
A Base Model (Equation 1)
A 0.863 K -.591 2 620
A' Base model fit separately to each Group by View subset of data (Equation 1)
A 0.685 to 1.096 K -0.473 to -0.890 16 611 A
Effect of Shift Size
B Base Model (Eq 1) fit separately to each Shift size
Ao0 0.383 Ko, -0.698 6 572 A*
Ao. 0.922 Ko6 -0.621
A1. 1.141 KI2 -0.518
C Base Model (Eq 1) modified: Shift size affects intercept only
Ao3 0.332 K -0.581 4 573 B
AO4 0.894
A1. 1.194
D Base Model (Eq 1) modified: Shift size affects slope only
A 0.912 Ko3 -1.310 4 578 B*
Ko.6 -0.614
Ki2 -0.411

Table 1 (Continued)
No.Model A Parameters (Intercept) K Parameters (Slope) Params Loss Tests
Effect of Shift/Shiftback and Serial Position
E Base Model (Eq 1) fit separately to each Shift/shift-back by Serial position subset of data
60 533 B*
F Base Model (Eq 1) fit separately to each SerialPosition
G Base Model (Eq 1) fit separately to each SerialPosition
36 546 E,F*,B*
12 561 E,F,B*
Effect of Shift Direction
H Relative Shift Direction (180 deg) included in model (Eq 2)
AIlo 0.759 ASo3 -0.004 Ko3 -0.711 9
AIo 1.001 ASo6 -0.003 Ko.6 -0.506
AIU 1.713 AS1 -0.005 K1. -0.493
I Relative Shift Direction (90 deg) included inmodel (Eq 2) 9
J Intercept as function of Relative Shift Direction (180 deg) (Eq 2)
AIo0 0.661 ASo0 -0.004 Ko0 -0.573 7
AI0 1.249 ASo.6 -0.005
AI1 1.764 AS1 -0.006
K Only intercept is function of Relative Shift Direction (180 deg) (Eq 2)
Alo03 0.933 ASo3 -0.005 Ko.3 -0.591 5
Alo.61.100
AIM 1.785
541
557
543 H
560 H*J*
*Statistically significant difference between models using the reduced model test. Codes only indicate testsagainst earlier models.

Table 2
Between-Study Comparisons of Average Detection Rates (Detect) as a Function ofSaccade Length (SacLen) and Shift Size (ShftS)
Prior Study Experiment 1
SacLen ShftS Detect SacLen ShftS Detect,
Li & Matin (1990) 40-7° 0.5° 60% 40-7 0.45p 9%
Whipple & Wallach (1978) 7° 0.7° 80% 7° 0.60 0%
Li & Matin (1990) 40-70 1.50 60% 40-70 1.2° 12%
Mack (1970) 30 0.60 50% 30 0.60 15%
Bridgeman, Hendry, & Stark (1975) 30-50 10 0% 4° 10 12%
Note:
"These values are derived from the exponential functions in Figure 2.
This is an average of the 0.3° and 0.60 shift size condition.

Table 3
Likelihood of Detecting Changes in Picture Size (Detect), Together With Mean LocalDisplacement Size (lds) Saccade Length (sl) and Relative Displacement Direction (rdd)
Average Values
Picture Change Ids sl rdd Detect
10% Increase M 0.250 3.00° 60.77° .253
(SD) (0.150) (2.780) (52.260)
10% Decrease M 0.240 2.990 61.27° .238
(SD) (0.140) (2.57°) (52.810)
20% Increase M 0.450 3.03° 68.07° .469
(SD) (0.290) (2.91°) (55.17°)
20% Decrease M 0.49° 3.40° 60.160 .431
(SD) (0.340) 3.100) (53.22°)

00
Ir 5
QC;0 0
0000
024)
U00
02*.64)
024)
4)
0
0 r
o4 5
- 0.
.4 z 0 .
o d
0 0
02
o8 O
.II
o (S S a
0 ,- 0
oq
(S
I50S r,
!
0
0
Cu
s.9
7W^PC
0*'-4

V0
0
02
4)
Q00
02I.44)
02'.44)
4)
0
0
ý02
00 00
IfW)
; 0 Q 0
900
o 0 ? 0 C
§ EM
S^ &
E02
00I II
a"Cl a" C
<y5 &-
14
4)
00
awl

PC
1-
V4
E
U,U,0
U,U)
0
~0
0
I-0
0
0
a/ 0 0 0-
g 0
I I
e ea
a a
§ §
C/2 W
2 I
(U 0* '-
Us
& *S ? *9 »
8 53d 2dI I 5I
o >
'4
(A
0
U)
•DM
*3
o|l

Figure Captions
Figure 1. Schematic example of the sequence of changes taking place in a picture during the 20 sec viewingperiod. Each change occurs during the indicated saccade.
Figure 2. Relationship between saccade length (s) and proportion of detections of intrasaccade shifts of thepicture (f(s)). Each proportion and mean saccade length is based on 100 cases (see text).
Figure 3. Relation between saccade length (s) and proportion of detections of intrasaccadic shifts of thepicture (f(s)), for shifts of different distances. Each proportion and mean saccade length is based on 100cases (see text).
Figure 4. Shift magnitudes that result in three constant detection rates for three saccade lengths, asestimated from Model K. If detection were a constant function of the ratio of shift magnitude to saccadelength, these curves would be linear.

0
CONCD
C1
-n
Cl
0»0
-n
CO
0
-no
-n00>
0)
0 -
CD on0«-»*o
0=r) mCDCT 0*
0)0
I --
0
CoC0CDcr2)00T
0=3C,)CD
-*
0)=r
CoCDCT0)0
00u-4'
0
Figure 1
CIOI 0DAvli
I Ip
Cl)
CA2I I
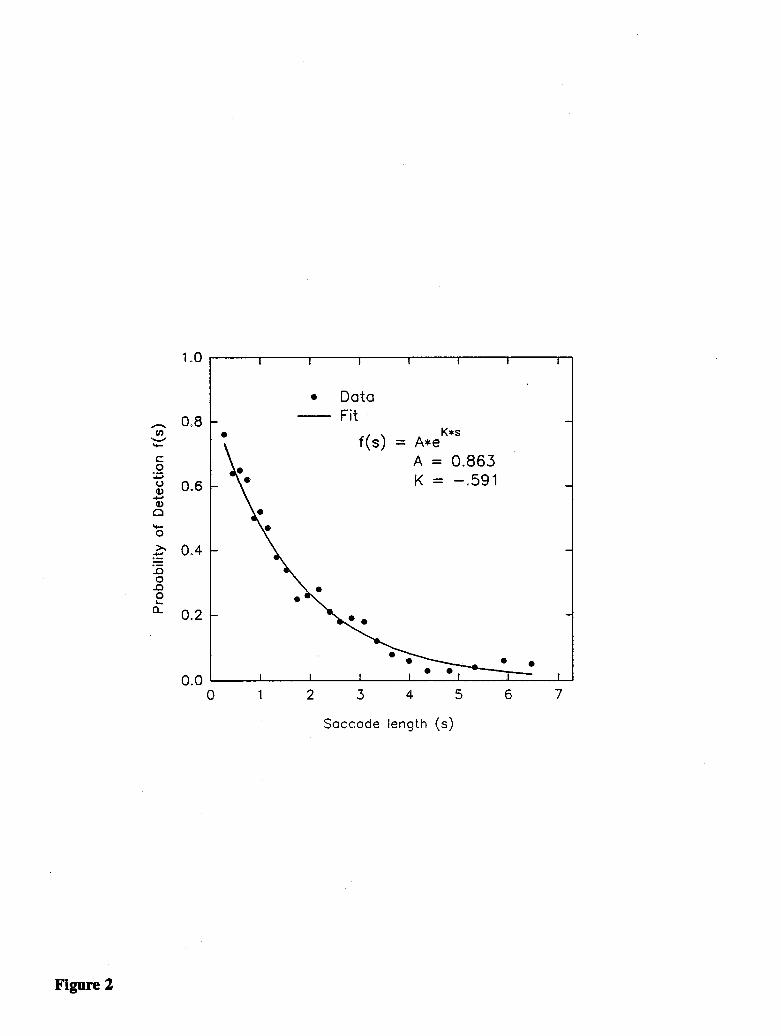
1.U
0.8
O
g 0.6
> 0.40
0.20
a. 0.2
n)0 1 2 3 4
Saccade length (s)
3 6 7
Figure 2
4

0 1 2 3 4 5 6 7
Soccade length (s)
Figure 3
1.0
A Data (1.2° shift)Fit:-.581sf(s) = 1.194*e-
581
0 o Data (0.6° shift)S- Fit:
Sf(s) = .894*e* Data (0.30 shift)
A Fit:581sf(s) = .322*e
0
- K x0 0
0 0 .....
(j?)
04-,U
ci)0
0
0-o0
0.8
0.6
0.4
0.2
0.0

1 2 3 4 5
Saccade length
0 30% detect rate* 20% detect ratev 10% detect rate
C
.-
(1)
1.6
1.4
1.2
1.0
0.8
0.6
0.4
0.20
Figure 4
a I I a