Visual Analysis of Topic Competition on Social...
10
Visual Analysis of Topic Competition on Social Media Panpan Xu, Yingcai Wu, Member, IEEE, Enxun Wei, Tai-Quan Peng, Shixia Liu, Senior Member, IEEE, Jonathan J. H. Zhu, and Huamin Qu, Member, IEEE 6/5/2012 6/12/2012 6/19/2012 6/26/2012 7/3/2012 7/10/2012 DEFENSE.INTERNATIONAL.ISSUES ECONOMY LAW.SOCIAL.RELATIONS ELECTION.GENERAL WELFARE.SOCIETY Politicial figures Grassroots Media HORSE.RACE solyndra teachers firefighters pres student cops aides loan police video health energy care press visits visit conference surprise axelrod presser college aide policemen season loans green preparedness congress feared school team conspiracy plan attack hits firemen gop hurricane students disaster house hire epa george camp dems dir las car cut teachers firefighters cops energy socialism epa dependency stamp setting pushes record nanny loans oil green food fewer dependence cspanwj julia promotes care student coal openly police jobs life solyndra firemen keystone pipeline gas plan spies college spill gov naturally disaster video president government rights talks gulf control kills cares farmers birth job pres van fund fire aid war ibd cut Fig. 1. The grassroots and the media played the major roles in recruiting public attention to the topic welfare / society on Twitter. The trending keywords related to the topic were not the same at different times. Around June 5th, there was a trending discussion on solyndra, while around June 12th, the keywords “teachers” and “firefighters” gained more significance. The sparklines underlying the keywords have their peaks on the selected time interval, indicating potential correlation between those topics to the recruitment effects observed. The tweets containing the keywords can also be examined to find the actual events that trigger the discussions. Abstract—How do various topics compete for public attention when they are spreading on social media? What roles do opinion leaders play in the rise and fall of competitiveness of various topics? In this study, we propose an expanded topic competition model to characterize the competition for public attention on multiple topics promoted by various opinion leaders on social media. To allow an intuitive understanding of the estimated measures, we present a timeline visualization through a metaphoric interpretation of the results. The visual design features both topical and social aspects of the information diffusion process by compositing ThemeRiver with storyline style visualization. ThemeRiver shows the increase and decrease of competitiveness of each topic. Opinion leaders are drawn as threads that converge or diverge with regard to their roles in influencing the public agenda change over time. To validate the effectiveness of the visual analysis techniques, we report the insights gained on two collections of Tweets: the 2012 United States presidential election and the Occupy Wall Street movement. Index Terms—Social media visuaization, topic competition, information diffusion, information propagation, agenda-setting 1 I NTRODUCTION As an influential theory in mass communication research, agenda- setting asserts that the emphasis of certain topics (issues) in news media determines their saliency as perceived by the general public [28]. In other words, by telling people what to think about, news media influences the salience of topics on the public agenda. Nowadays, news media are not the only agenda setters in society. The advent of social media, such as Twitter and Facebook, has empowered ordinary users to influence media emphasis and the perceived saliency of certain topics among the general public. Social media users can generate voluminous • Panpan Xu and Huamin Qu are with Hong Kong University of Science and Technology. E-mail: {pxu, huamin}@cse.ust.hk. • Yingcai Wu and Shixia Liu are with Microsoft Research Asia. Y. Wu is the correspondence author. E-mail: {yingcai.wu, shixia.liu}@microsoft.com. • Enxun Wei is with Shanghai Jiao Tong University. E-mail: [email protected]. • Tai-Quan Peng is with Nanyang Technological University. E-mail: [email protected]. • Jonathan J.H. Zhu is with City University of Hong Kong. E-mail: [email protected]. Manuscript received 31 March 2013; accepted 1 August 2013; posted online 13 October 2013; mailed on 4 October 2013. For information on obtaining reprints of this article, please send e-mail to: [email protected]. information and disseminate them to a huge number of people, thus having the opportunity to influence the saliency of a topic on the public agenda. Almost 90% of public relations practitioners believe that social media has become a new form of media to set the public agenda [47]. The Egyptian Revolution of 2011 is an example of how Twitter users employed social media to establish the agenda of the news media and the public. When the revolution started, Americans paid little attention to the event. To seek support, revolution leaders started promoting topics, such as “#jan25”, on Twitter, which spread quickly and attracted the attention of the mass media. United States (US) President Barack Obama subsequently showed his support to the revolution through a speech, which significantly increased media attention on the event. Ultimately, the Egyptian Revolution became popular news worldwide and salient on the public agenda. The rapid development of social media does not only provide new opportunities, but also poses challenges in agenda-setting. The abun- dance of information available on social media exceeds the limited carrying capacity of the public agenda [45, 50]. As such,topics have to compete for the scarce public attention [50]. The saliency of topics is directly influenced by the simultaneously available competing top- ics [4, 48]. The more competing topics on social media, the less salient an individual topic is likely to be. Moreover, prior research reveals that most people on social media acquire information from a group of elite users (i.e., opinion leaders), based on the two-step flow of communication theory [17, 49]. Opinion 2012 1077-2626/13/$31.00 © 2013 IEEE Published by the IEEE Computer Society IEEE TRANSACTIONS ON VISUALIZATION AND COMPUTER GRAPHICS, VOL. 19, NO. 12, DECEMBER 2013
Transcript of Visual Analysis of Topic Competition on Social...

Visual Analysis of Topic Competition on Social Media
Panpan Xu, Yingcai Wu, Member, IEEE, Enxun Wei, Tai-Quan Peng,Shixia Liu, Senior Member, IEEE, Jonathan J. H. Zhu, and Huamin Qu, Member, IEEE
6/5/2012 6/12/2012 6/19/2012 6/26/2012 7/3/2012 7/10/2012
DEFENSE.INTERNATIONAL.ISSUES
ECONOMY
LAW.SOCIAL.RELATIONS
ELECTION.GENERAL
WELFARE.SOCIETY
Politicial figuresGrassrootsMedia
HORSE.RACE
solyndrateachers
firefighterspres
student
cops aides
loan
police
video
health
energy
care press
visits
visit conference
surprise axelrod
presser
college
aide
policemen
season
loans
green
preparedness
congress
feared
school
team
conspiracy plan
attack hits
firemen
gop
hurricane
students
disaster
house
hire
epa
george
camp
dems
dir
las
car
cut cnn
teachersfirefighters
copsenergy
socialism
epa
dependency
stamp
setting
pushes record
nanny loans
oil
green
food
fewer
dependence
cspanwj
julia
promotes
care
student
coal
openly
police
jobs life
solyndra
firemen
keystone pipeline
gas
plan
spies
college
spill
gov
naturally
disaster
video
president government
rights
talks
gulf
control
kills
cares
farmers
birth
job
pres
van
fund
fireaid
war
ibd
cut
Fig. 1. The grassroots and the media played the major roles in recruiting public attention to the topic welfare / society on Twitter. Thetrending keywords related to the topic were not the same at different times. Around June 5th, there was a trending discussion onsolyndra, while around June 12th, the keywords “teachers” and “firefighters” gained more significance. The sparklines underlying thekeywords have their peaks on the selected time interval, indicating potential correlation between those topics to the recruitment effectsobserved. The tweets containing the keywords can also be examined to find the actual events that trigger the discussions.
Abstract—How do various topics compete for public attention when they are spreading on social media? What roles do opinionleaders play in the rise and fall of competitiveness of various topics? In this study, we propose an expanded topic competition modelto characterize the competition for public attention on multiple topics promoted by various opinion leaders on social media. To allowan intuitive understanding of the estimated measures, we present a timeline visualization through a metaphoric interpretation of theresults. The visual design features both topical and social aspects of the information diffusion process by compositing ThemeRiver withstoryline style visualization. ThemeRiver shows the increase and decrease of competitiveness of each topic. Opinion leaders aredrawn as threads that converge or diverge with regard to their roles in influencing the public agenda change over time. To validate theeffectiveness of the visual analysis techniques, we report the insights gained on two collections of Tweets: the 2012 United Statespresidential election and the Occupy Wall Street movement.
Index Terms—Social media visuaization, topic competition, information diffusion, information propagation, agenda-setting
1 INTRODUCTION
As an influential theory in mass communication research, agenda-setting asserts that the emphasis of certain topics (issues) in newsmedia determines their saliency as perceived by the general public[28]. In other words, by telling people what to think about, news mediainfluences the salience of topics on the public agenda. Nowadays, newsmedia are not the only agenda setters in society. The advent of socialmedia, such as Twitter and Facebook, has empowered ordinary users toinfluence media emphasis and the perceived saliency of certain topicsamong the general public. Social media users can generate voluminous
• Panpan Xu and Huamin Qu are with Hong Kong University of Science andTechnology. E-mail: {pxu, huamin}@cse.ust.hk.
• Yingcai Wu and Shixia Liu are with Microsoft Research Asia. Y. Wu is thecorrespondence author. E-mail: {yingcai.wu, shixia.liu}@microsoft.com.
• Enxun Wei is with Shanghai Jiao Tong University. E-mail:[email protected].
• Tai-Quan Peng is with Nanyang Technological University. E-mail:[email protected].
• Jonathan J.H. Zhu is with City University of Hong Kong. E-mail:[email protected].
Manuscript received 31 March 2013; accepted 1 August 2013; posted online13 October 2013; mailed on 4 October 2013.For information on obtaining reprints of this article, please sende-mail to: [email protected].
information and disseminate them to a huge number of people, thushaving the opportunity to influence the saliency of a topic on the publicagenda. Almost 90% of public relations practitioners believe that socialmedia has become a new form of media to set the public agenda [47].
The Egyptian Revolution of 2011 is an example of how Twitterusers employed social media to establish the agenda of the news mediaand the public. When the revolution started, Americans paid littleattention to the event. To seek support, revolution leaders startedpromoting topics, such as “#jan25”, on Twitter, which spread quicklyand attracted the attention of the mass media. United States (US)President Barack Obama subsequently showed his support to therevolution through a speech, which significantly increased mediaattention on the event. Ultimately, the Egyptian Revolution becamepopular news worldwide and salient on the public agenda.
The rapid development of social media does not only provide newopportunities, but also poses challenges in agenda-setting. The abun-dance of information available on social media exceeds the limitedcarrying capacity of the public agenda [45, 50]. As such,topics haveto compete for the scarce public attention [50]. The saliency of topicsis directly influenced by the simultaneously available competing top-ics [4, 48]. The more competing topics on social media, the less salientan individual topic is likely to be.
Moreover, prior research reveals that most people on social mediaacquire information from a group of elite users (i.e., opinion leaders),based on the two-step flow of communication theory [17, 49]. Opinion
2012
1077-2626/13/$31.00 © 2013 IEEE Published by the IEEE Computer Society
IEEE TRANSACTIONS ON VISUALIZATION AND COMPUTER GRAPHICS, VOL. 19, NO. 12, DECEMBER 2013

leaders act as intermediate layers through which information is filteredand interpreted based on their own perceptions. They can potentiallyalter the saliency of a topic as perceived by other users; thus, opinionleaders play a gate-keeping role in the agenda-setting process. Thecompetitive relations among topics and the involvement of opinionleaders complicate the dynamics of agenda-setting, which is rarelyaddressed in current research.
In the context of agenda-setting on social media, the dynamicsof topic competition occur at a larger scale with multiple topics andamong different groups of opinion leaders. In particular, multipletypes of time-varying relations accompany the agenda-setting process,including the competition among topics and the agenda-setting effectof different groups of opinion leaders on the topics. Dynamic multiple-type relationships compound the difficulties in creating a concise andreadable visual representation. Apart from providing an overviewof the evolving relations, seeking explanations for the ebb and flowof the competitiveness of topics, and formulating interpretations forthe commonalities and differences among the agenda-setting effectsof different opinion leaders are challenging. These tasks require thesystem to provide a mechanism for investigative analysis, for whichthe contents of tweets must be made accessible. Currently availablesystems [41, 8] are limited to a single post or topic. To our knowledge,none of the existing studies has helped analyze agenda-setting and topiccompetition effects on social media, particularly the roles played byopinion leaders in the dynamics of agenda-setting.
In this study, we propose a visual analysis framework to studyagenda-setting and topic competition effects on social media. Unlikeprevious literature on social media analytics, our approach analyzes thefollowing patterns on social media: (1) the dynamic competition amongvarious topics to gain public attention and (2) the roles that opinionleaders play in the process. We designed a timeline visualization toprovide an overview of the competitiveness and saliency of topics overtime, the commonalities and differences of the roles played by opinionleaders in the agenda-setting process, and the transition of topicalfocus of opinion leader groups. Based on the (temporal) correlationpatterns revealed in the overview, several hypotheses are formed.Investigative analysis and result validation are supported by wordclouds. To illustrate the usefulness of our approach, we applied visualand analytical methods on two collections of tweets: the 2012 U.S.presidential election and the Occupy Wall Street movement. We alsointerviewed sociologists and provided a summary of their feedback.
The contributions of the study presented in this paper include:• An expanded topic competition model of agenda-setting to char-
acterize the dynamics of topic competition and the roles playedby opinion leaders.
• A set of techniques for visualizing the temporal and heteroge-neous relationships identified by the expanded model.
• Two case studies to explore the complex dynamics of agenda-setting and topic competition on social media.
2 RELATED WORKS
This section briefly discusses related literature on information diffusion,social media visualization, and temporal data visualization.
2.1 Information DiffusionVarious models, such as the linear threshold model and the independentcascade model [13], have been used to characterize the diffusionof information on social networks. However, the models view thediffusion of each topic to be independent. Multiple topics mayinfluence each other when they are disseminated on social networks.Several studies have also shown that increasing the number ofcompeting topics results in decreasing popularity of the topics [4, 48].
Researchers have only recently studied the diffusion of multipletopics. Myers and Leskovec [31] developed a probabilistic model toreflect the interactions of different topics when they are diffused in thenetwork. Weng et al. [45] proposed a parsimonious agent-based modelto examine the relationship between competition and the popularity,diversity, and lifetime of a topic. Our work also studies the problem ofcharacterizing the diffusion of multiple topics. Compared with existing
research, this study models the diffusion process with no assumptionabout the existence of an underlying network. It also analyzes thecompetition for the aggregated public attention (i.e., how the opinionleaders set the public agenda), instead of modeling how individualusers are affected by the contagions. Moreover, we derive metrics thatcharacterizes the time varying competiveness of temporal salient topics(e.g., economics), different from the related research that models thediffusion of more volatile contagions (i.e., memes). We also identifyand evaluate the roles of different groups of opinion leaders in theprocess of setting the public agenda.
2.2 Social Media VisualizationResearchers have developed various visualization methods to help usersunderstand social media data by providing aggregated information [10,11, 26].Diakopoulos et al. [10] presented a visual analytics tool withmultiple linked views to aid journalists and media professionals inanalyzing social media content. Marcus et al. [26] developed TwitInfoto automatically detect and display peaks of high tweet activity. Dorket al. [11] introduced a web-based system that can provide a visualsummary of large-scale Twitter data streams.
Previous research has also used clustering to reduce data complexityand to facilitate analysis [3, 14]. Gansner et al. [14] described a textstream visualization method that initially groups tweets by “countries”and then generates a dynamic map. ThemeCrowds[3] displays topictrends on Twitter over time using multi-scale tag clouds. Twitter usersare clustered hierarchically and then visualized based on the topicsthey discuss. Recently, several visualizations [41, 1, 2] have beendesigned to show the spread of information on social media. Nan etal. [8] developed Whisper to visualize the spatio-temporal process ofinformation diffusion on Twitter. Nevertheless, these systems mainlyfocus on visualizing the diffusion process of a typical event on socialmedia. Visualizing the simultaneous dissemination of multiple eventsusing these systems is extremely difficult, if not impossible. By contrast,our study aims to visualize the dynamics of multiple competing topics.
2.3 Temporal Data VisualizationThere have been various approaches for visualizing and analyzingtemporal data. Comprehensive surveys could be found in [21] [29].Researchers have extended visualization techniques such as parallelcoordinate plots for visualizing time variant multivariate data [18]and histograms for time varying data distributions [20]. Time is oftenrepresented by the horizontal axis [21, 29], or spirals to highlight theperiodical patterns [44]. Aggregation by clustering similar time serieshas been used to visualize a large number of time series [40]. In thiswork, we analyze a large volume of tweets, which are semantically richtextual data linked to the temporal dimension. We attempt to unearththe dynamics of agenda-setting and topic competition process fromthe data by applying time series modeling techniques and visualize thetime varying metrics and relations based on the estimated model. Wediscuss the most related temporal data visualization techniques below.
ThemeRiver [16] is the first system to automatically create a smoothstacked graph layout that can handle many time series. The approachhas been adopted by NameVoyager [43] to visualize baby name popu-larity. Byron and Wattenberg [7] introduced methods to create aesthet-ically appealing stacked graph layouts using optimization. Recently,researchers have also extended Streamgraph to support visual analysisof large-scale text corpora [9, 11, 24, 38]. Rose et al. [35] introduced“story flow” visualization for tracking the evolution of themes in textstreams. Cui et al. [9] introduced TextFlow to show the relationshipsamong topics in text corpora. RankExplorer [37] adds color bars andglyphs to stacked graphs to display changes in item values and theirranking. EventRiver [25] extracts and visualizes the events withintext collections with temporal reference. Outflow [46] applied sankeydiagram to visualize temporal event sequence.
Storyline visualization, as inspired by Munroe’s movie narrativecharts [30], can intuitively convey relationships among entities overtime. PlotWeaver [33] is a Web-based system that allows users to inter-actively create storylines from scratch. Ogawa and Ma [32] presented aset of design criteria and derived a greedy algorithm to create a layout
2013XU ET AL: VISUAL ANALYSIS OF TOPIC COMPETITION ON SOCIAL MEDIAVISUAL ANALYSIS OF TOPIC COMPETITION ON...

that satisfied the criteria. Yuzuru and Ma [39] refined the design criteriaand used a genetic algorithm to generate an aesthetically-appealing andlegible storyline layout. A different layout algorithm has also been pro-posed by Liu et al. [23]. The storyline style visualization has also beenapplied in different applications such as genealogical data analysis [19]and community detection [34].
Our timeline method also conveys converging and diverging be-haviors among entities, which is similar with storyline visualization.However, opinion leaders can exert influence on multiple topics at atime interval and their topical focus can shift among multiple topics astime progresses. Therefore, the dynamic relation that can be expressedusing storylines needs to be extended in our case. We subsequentlyemploy a composite visual design that integrates the dynamics of theinfluences of opinion leaders with the ebb and flow of competitivenessand saliency of topics. The composite style is similar with TextFlow [9]which draws keywords as threads over sankey graphs to depict theirco-occurrence in time-varying topic clusters. In our case, the branchingand merging of threads on ThemeRiver encode the semantic meaningof topical transition, which is different from that on TextFlow.
3 SYSTEM OVERVIEW
The visual analysis framework is illustrated in Figure 2. The frame-work has three major components: data storage and preprocessing,data analysis, and interactive visualization. The data preprocessingcomponent employs Apache Lucene, a high-performance text searchengine 1, to enable text indexing and searching. This search enginelibrary allows the data analysis component to extract time-series dataefficiently to model topic competition. It also supports dynamic queryas user interacts with the visualization.
Data Analysis InteractiveVisualization
Data Storage andPreprocessing
search engine
competitiveness
topic transition
time series
Query: temporal, topical, social dimensions
topics opinion leaders tweets
timeline
word cloud
Return: raw tweets, word frequencyData flow View linking
Fig. 2. System overview. The system consists of three major parts: datastorage and preprocessing, data analysis, and interactive visualization.
The data analysis component characterizes the dynamic competitionof several important topics, such as economy and welfare, based on anexpanded competition model. More importantly, this component canquantitatively estimate the influence of an opinion leader group, such as“media” and “politicians”, on each topic for each time interval using theaforementioned model. The topic transition trend of each opinion leadergroup (that is, the degree of their attention switching from one topicto another) is also evaluated by the component for each time interval.
The visualization component accepts input from the analysis model,including: (1) the competitiveness of each topic over time, (2) theinfluence exerted by an opinion leader group on the competitivenessof each topic over time, and (3) the trend of topic transition over time.The data can be regarded as the co-evolutionary relations betweentopics and opinion leader groups. The component employs a timelinedesign which overlays threads, which represent opinion leaders,on a stacked graph, which represents topics, to intuitively revealco-evolutionary relations. Analysts can select any time interval fromthe timeline visualization to perform investigative analysis throughdetails-on-demand. In particular, a radial graph is used to revealpairwise competition relation among the topics for the selected timeinterval. A more in-depth investigative analysis of the tweet contentis supported by displaying a word cloud within the radial graph.
1http://lucene.apache.org/core/
4 MODELING TOPIC COMPETITION ON SOCIAL MEDIA
In this section, we introduce background knowledge on agenda-settingtheory and briefly describe the original topic competition model appliedin the study of mass media [50]. After that, we propose the expandedmodel with multiple influence sources, such that the effect of differentopinion leader groups could be differentiated for the study of the topiccompetition on social media. Based on the expanded quantitativemodel, we derive some intuitive measures on the competitiveness ofa topic and on the parts that are contributed by each opinion leadergroup. The resulted measures enable our visualization system to createa comprehensive view of the dynamic competition process.
4.1 Agenda-setting and Topic Competition4.1.1 Media vs. Public AgendaAgenda-setting research starts with the definition of two agendas, calledmedia agenda and public agenda, respectively. The former refers to a setof topics that are prominently reported by the mass media whereas thelatter refers to a set of topics that are considered important by majorityof the public in a society. Agenda-setting research focuses on the causalrelationship between the two sets of topic salience. In a seminal study,McCombs and Shaw [28] found a strong correlation between mediaagenda and public agenda. They call this correlation as an agenda-setting effect, suggesting that the media set the agenda for the public byemphasizing certain topics in news coverage while downplaying others.
4.1.2 Topic CompetitionIn agenda-setting, multiple topics have to compete for media coverageand public attention, as the addition of any new topic onto the publicagenda comes at the cost of other topic(s) [50]. The competition amongthe topics is necessarily caused by structural constraints on a wide rangeof stakeholders, including the limited capacity of the public to processinformation, the limited space or time of the media to cover news events,and the limited attention or resources of politicians, interest groups, andthe entire social system at large to deal with competing topics. Zhu [50]developed a difference equations system (Equation 1) to model twocompetition mechanisms: 1) recruitment effect for attracting followersof topic j to i and 2) defection effect for distracting followers of i to j.
∆pti = mt−1
i
k∑
j=1, j 6=iβi j pt−1
j − pt−1i
k∑
j=1, j 6=iβ jimt−1
j , for ∀i ∈ {1, . . . ,k} (1)
In Equation 1, the independent variables include mt−1i , the media
coverage on topic i at t−1, and pt−1i , the perceived salience of topic
i by the public at t− 1. The parameters to be estimated are βi j. Thedependent variable ∆pt
i describes the change in the perceived salienceof topic i by the public, as measured by the difference (pt
i − pt−1i )
between the proportion of the public considering i to be important attwo adjacent time points t and t − 1. The change is assumed to becaused by the two competing forces as described by the terms on theright side of Equation 1: the recruitment effect by media coverage of i(i.e., mt−1
i ) on the followers of j (i.e., pt−1j ) and the defection effect by
media coverage of j (i.e., mt−1j ) on the followers of i (i.e., pt−1
i ). Thereare k topics and therefore k parallel equations in total. Assuming bothmedia coverage and public perception of the topics are measured alongdiscrete time points, which is usually the case, the parameters βi j andβ ji can be directly estimated by a standard regression system.
An empirical test of the model with three public topics in the U.S.in 1990-91 shows three possible outcomes of topic competition: one-way attraction, mutual competition, and independent coexistence [50].Subsequent studies have shown a variety of long-term consequencesof topic competition. For example, McCombs and Zhu [27] found thatthe competition among topics becomes increasingly tough over time,which leads to a faster rate of topic turnover on the public agenda.
4.2 Expanded Model: Multiple Influence SourcesThe model as described by Equation 1 assumes homogeneity amongthe mass media agendas, thus treating them as a whole as they influence
2014 IEEE TRANSACTIONS ON VISUALIZATION AND COMPUTER GRAPHICS, VOL. 19, NO. 12, DECEMBER 2013

the competition among the topics and consequently the shaping ofpublic agenda. However, in the social media setting, there could beconsiderable diversity in the agendas of different opinion leaders andin their impact on the public agenda. Therefore, a fine-grained modelwhich differentiates various types of opinion leaders is desirable for thestudy of agenda-setting and topic competition effect on social media.The original model is thus expanded, where the term mt−1
i , representingthe overall media coverage on topic i at time t− 1, is replaced withterms representing the coverage on the topics of different opinion leadergroups (i.e., mt−1
i,g in Equation 2). With the new terms, we could modelthe recruitment effect by opinion leader group g’s coverage on topici on the followers of j and the defection effect by opinion leader groupg’s coverage on topic j on the followers of i. An autoregressive term isalso added to account for the carry over effect from the last time point.
pti = αi pt−1
i +n∑
g=1mt−1
i,g
k∑
j=1, j 6=iβi, j,g pt−1
j − pt−1i
k∑
j=1, j 6=i(
n∑
g=1β j,i,gmt−1
j,g ) (2)
Figure 3 is a conceptual diagram which illustrates the model byhighlighting the engagement of two opinion leader groups (markedwith different colors) in topic i (i.e., mi,g0 and mi,g1 ) and their effect indrawing public attention away from topic j. The edges between topici and j correspond to the recruitment effect by opinion leader groups’engagement in topic i on the followers of topic j, which is reflected inthe model as product terms mi,g0 p j and mi,g1 p j . In the original model,mass media is treated as a single agenda setter.
topics opinion leader groups
pi
pj
m
m
i g
i g
,
,
0
1 m p
m p
i g j
i g j
,
,
0
1
×
×
Fig. 3. Illustration of the model with two groups of opinion leaders’ en-gagement in topic i drawing the attention of the public away from topic j.
4.3 Measuring CompetitivenessThe model in Equation 1 and the expanded model in Equation 2 forsocial media can be estimated by treating the product terms of theindependent variables (e.g. mt−1
i pt−1j and mt−1
i,g pt−1j ) as individual
independent variables and solving a (consequently) linear regressionsystem. However, it is still needed to derive reliable and intuitivelyinterpretable quantitative measures for the competitiveness of the topicsand the recruitment effect that could be attributed to each opinion leadergroup, such that they could be mapped to visual variables.
Measuring recruitment effects. Conceptually, the competitivenessof topic i refers to the total effect size of the recruitment effects (i.e.,mt−1
i,g pt−1j ) by the opinion leader groups advocating i on the followers
of other competing topics. How then will recruitment effects be quanti-tatively measured? The answer is not as straightforward as it appears.It is not because of the lack of relevant parameters from empirical tools(e.g., regression analysis). On the contrary, the difficulty rises from theexistence of several measures of effects, each with its strengths andshortcomings, such as unstandardized regression coefficient (b), stan-dardized regression coefficient (β ), squared partial correlation (pr2),and squared semipartial correlation (sr2). Of the parameters, we chooseto use sr2 to measure topic competitiveness in the current study becausesr2 is the most stringent measure by describing the unique proportion ofthe variance in the dependent variable (pt
i in Equation 2) that is solelyexplained by an independent variable (i.e., mt−1
i,g pt−1j in the context
of Equation 2) after removing not only the unique variance explainedby competing independent variable (e.g., mt−1
j,g pt−1i ) for the defection
effect but also the joint variance explained by all independent variablesdue to the multicollinearity among them.
As such, sr2 is a conservative measure that denotes the lower boundof the effect size of any independent variable (i.e., mt−1
i,g pt−1j ). However,
the unique-effect nature makes sr2 to possess two desirable properties:it is additive so that sr2 from multiple equations of an equation systemfor a given independent variable can be summed to form an overallmeasure of effect size; and it is normalized so that they are directlycomparable within an equation or over all equations of a system.
Measuring the effect of multiple influence sources and topics.Since sr2 as measure for the effect of individual independent variablesis additive and comparable, it serves our purpose particularly well, asillustrated with the following procedure to obtain quantitative measuresfor the competitiveness of each topic and the part that is contributed byeach opinion leader group:
For each of the recruitment terms (i.e., mt−1i,g pt−1
j ) in Equation 2,we can obtain a corresponding piece of sr2, denoted as sr2
i, j,g. Sum-ming the pieces with the same subscript g (i.e., ∑
kj=1, j 6=i sr2
i, j,g), weobtain the competitiveness contributed by opinion leader group g totopic i (i.e., the recruitment effect of opinion leader group g with re-spect to topic i); summing the pieces with the same subscript i (i.e.,∑
ng=1 ∑
kj=1, j 6=i sr2
i, j,g), we obtain the overall competitiveness for eachof the k topics; summing the pieces with the same subscript i and j, weobtain the pairwise competitiveness among the topics.
The resulting measures of topic competitiveness provides the empir-ical basis for comparisons, analytically or visually, among the n groupsof opinion leaders within each topic over time, or among the k topicsacross all groups of opinion leaders over time. The measures of com-petitiveness and recruitment effect all characterize the agenda-settingprocess. They describe the mechanism of how the topic agendas ofthe opinion leaders shape the public agenda by transferring the publicattention among the topics, increasing the popularity of some whiledeemphasizing others. We will also use the terms such as “attract”,“influence” to describe recruitment effect in the rest of the paper as theyare more intuitive to interpret.
5 VISUAL DESIGN
This section briefly discusses the design process and the concrete designgoals , and then describes the interactive visual analysis system.
5.1 Design ProcessWe work closely with two domain experts on media study who arealso co-authors of this paper. A wide range of decisions crucial fordata analysis and modeling, and for the subsequent visual designs areformulated through frequent exchange of opinions and extensive exper-imentation on both sides. These include the choice of the regressionmodel, the topics and opinion leader groups that are involved in theanalysis. The discussions have gradually lead to a concrete projectwith clearer design goals. An iterative process is also adopted in thedesign of the system: an initial prototype with synthetic data, and anumber of subsequent visual design mockups have been demonstratedto collaborators to gather feedback.
5.2 Design GoalThe visualization should display the competition for public attentionamong multiple topics promoted by multiple types of opinion leadersin agenda-setting on social media, based on quantitative measuresobtained from the expanded model (Equation 2). The quantitativemeasures include the time varying competitiveness of each topic, thecontribution made by each opinion leader group to the competitivenessof the topics, and the pairwise competition among the topics. Thesystem should also enable in-depth analysis to gain insight into thepotential causes of the observed competition effect. We have identifieda set of research problems , which are listed as follows:Q1 Which opinion leader groups contribute most to the competitive-
ness of a topic?Q2 What are the commonalities and differences among opinion leaders
with regard to their time-varying influences on the public agenda?How do their influences converge and diverge over time?
2015XU ET AL: VISUAL ANALYSIS OF TOPIC COMPETITION ON SOCIAL MEDIAVISUAL ANALYSIS OF TOPIC COMPETITION ON...

8/28/2012 9/4/2012 9/11/2012 9/18/2012 9/25/2012 10/2/2012 10/9/2012 10/16/2012
DEFENSE.INTERNATIONAL.ISSUES
ECONOMY
HORSE.RACE
ELECTION.GENERAL
WELFARE.SOCIETY
LAW.SOCIAL.RELATIONS
a
conventioncampaign
presidentiowa
video
paul augustcharlotte
democratic
road gop
carolina ryan
speaks national
join
massachusetts
govgaryjohnson
ballot
huge
america watch
americans
washington
outraised
time
grassroots
ron
photo
north
dictated louisiana
florida
day
republican
live
future talking
rerun
people
failure
raised
johnson
ohio
virginia
fundraising victory
reelect
move
team
gov
campaigning
aprilstake
proof
january
jobs
clinton
delegates
access
elect
2011
closer
hear
paulryanvp janesville
nomination
record
donation
news
minaj
emptydebate
nicki
marvelous
texas
reasons
term
success
win
office
floor
lot
fall
joe
rep
rncliar
air
sen
htt
fill
debatecampaign
cnnohio
debates cbs
cspanwj
wbbm wealth
wttw
bush won
performance
pres
wgnnews
people promises
connewsnow
video
tweeters media
vote
tonight
win
npr
gop
virginia
night
spreads
presidential
ratios
chant
lost
mideast
jobs
handouts
victory 2008
reagan
plan
worldwide
nobel
president prize
death
america
time
gdp
voters
post
msnbc
record
empty
hell
florida
redistribution
failed
abc
lehrer
wld
teleprompter
poll
deficit
peace
muslims
attack news
clinton wins
john
plain
notes
speeches
colorado
iowa
denver
washington
reallies
newsninja2012
team
supporters
watch
debating
2012
tired
zingers
abcnews
lie
cbsnews
day
chris
winning
jim
jihad
mark
blames
barack
polls
fundraising
loss
endorses
calls
check
election
prep
libyan
donations famblog
leads
wisconsin
campaigning
rally
kerry failures
iran
losing
race
campaigns
slamming
ads
qaeda
bad
paul
matthews
wiped
exact
chicago
happened
nbc
bird
failure
broken
government
debater
admits
hundreds
truth
tax
top
elway
spin
live
job
game
newt
libya
lady
kill
lol
Politicial figuresGrassrootsMedia LAW.SOCIAL.RELATIONS
c
Source TargetELECTION.GENERAL ELECTION.GENERAL
b
Fig. 4. In Election data, interesting patterns were observed around August 28th and September 4th, which could be related to Republican andDemocratic national conventions. Other patterns could also be observed around the time of Presidential debates.
Q3 How do the influence and topical focus of opinion leaders evolve?How do they co-evolve with the competitiveness of the topics?
Q4 How do the topics compete with each other pairwisely?Q5 Given the temporal trend in the rise and fall of the competitiveness
of the topics, could plausible explanations be formed? For example,is it possible that the occurrence of an event would trigger anincrease in the competitiveness of a topic?
Q6 For the evolutionary and co-evolutionary patterns discovered,could preliminary hypotheses be formed on the possible causes?The contents of tweets could be analyzed to generate explanatoryhypotheses for the patterns, such as the simultaneous influenceof multiple opinion leader groups on the same topic, the absenceof influence of some opinion leaders, and the transition of interestof the opinion leaders.
The above questions have framed the scope and serve as inspirationsfor the visual designs. They also pose challenges on the design ofeffective visual presentations. For example, to enable efficient tempo-ral correlation pattern detection (Q1, Q2, Q3), our collaborators haveintended for the related data to be integrated in one view. These datainclude the time varying competitiveness and saliency of the topics(Q1, Q3), the competitiveness contributed by each group to the topics(Q1, Q2 and Q3), and the transition of topical focus of each opinionleader group (Q3). Although each piece of information can be dis-played separately using existing visualization techniques (such as linechart and ThemeRiver for multiple time series, node-link diagram ofdirect acyclic graphs (DAG) for topical transition over time), compos-ing them into a single display in a meaningful and readable mannerwill be difficult. In searching the design space, we should also considerthe dynamic relation among different types of entities (i.e., topics andopinion leader groups), as implied by the semantic relations amongthe temporal data (such as the competitiveness of each topic vs. thecompetitiveness attributed to each opinion leader group). To formulateexplanatory hypotheses for the observed patterns (Q5, Q6), it is also cru-cial to provide a concise visual summary for the contents of the tweets,which can be dynamically queried and compared along temporal, social(i.e., different opinion leader groups) and topical dimensions.
5.3 Visual Encodings
In this section, we describe the visual encoding scheme and how eachresearch question can be explored using the visual designs.
5.3.1 Timeline view
The timeline visualization provides an intuitive means of integratingthe multiple types of temporal data (section 5.2). The theme of thedesign is to display the co-evolutionary relations between the topicsand the opinion leader groups. A composite style is employed: thesurge and decline of the competitiveness of the topics and the temporalvarying salience are depicted using ThemeRiver, while the opinionleader groups are drawn as threads that are placed at the layers in theThemeRiver given that they pose influence on the corresponding topic.These threads will switch to different layers as opinion leaders changetheir topical focus and began to play a major role in recruiting audiencesfor those topics as they set the public agenda. Figure 4 shows a timelinevisualization based on the design.
The threads can appear bundled or separated as the opinion leaders’roles in influencing the public agenda change over time. The visualdesign employs the analogy of the diverging and converging behaviorof social entities. Bundling of the lines indicates commonality, whereasseparation indicates the contrary. The metaphor has been used in numer-ous visual designs, where the behavior can be the affiliation to socialcommunities [34] or its presence in different events [39]. In this case,it is the role that the opinion leaders play in the agenda-setting process.
The composite visual design which integrates various types of tem-poral data will make identifying temporal correlation patterns moreefficient than when data are depicted separately [5]. Several patterns canbe identified from the visual design, such as: 1) the correlation betweenthe topical transition of one or more opinion leader groups and the in-creasing or decreasing competitiveness of the topics; 2) temporal salientcorrelation patterns such as the competitiveness of a topic is mostlyrelated to a constant set of opinion leader groups for a long duration; 3)two or more opinion leader groups contribute to the competitiveness ofthe same topic at a certain time but diverges afterwards (Q1, Q2, Q3).We describe the details of the visual encoding scheme as follows:
Layers in the ThemeRiver Each layer corresponds to a topic thatconstantly engages the attention of the public. The height of each layeris proportional to the competitiveness of the topic, which is the mostimportant dimension in the analysis. Given that the measure of compet-itiveness is directly comparable in multiple topics, the accumulatedheight can reveal the overall intensiveness of the competition amongthem. Color intensity encodes the percentage of public engagement(i.e., saliency of the topic). Topics that engage more public attentionwill be assigned higher values.
2016 IEEE TRANSACTIONS ON VISUALIZATION AND COMPUTER GRAPHICS, VOL. 19, NO. 12, DECEMBER 2013

Line segments During each time interval, a line segment is drawnon the layers if the recruitment effect of an opinion leader group onthe corresponding topics (defined in section 4.2) is upon a threshold onadjacent timeframes, thus playing a (relatively stable) role in drawingthe attention of the public from other topics as they set the publicagenda. The width of the lines is proportional to the competitivenesscontributed by each opinion leader group to the topic. Thicker lineindicates a more important role. Categorical colors differentiate theopinion leader groups.
Transition lines The transition lines which connect the threads ondifferent layers encode topical transition, which could aid in the expla-nation of the dynamically changing roles that the opinion leaders playin the agenda-setting process.
How to measure the amount of topic transition is one problem thathas to be addressed. We use a soft matching approach, inspired by[15] which uses transition matrix to measure the flow of people amongevolutionary social communities. Our method estimates the averagetrend of topical focus transition for a group of people at neighborhoodtime intervals between every pair of topics. Through the following leastsquares formulation the average transition, described as a k× k matrix(i.e., A in Equation 3), can be estimated:
min∑l
ωl ||mt−1l A−mt
l ||2
subject to :k∑
j=1ai j = 1 and ai j ≥ 0
(3)
In equation 3, mt−1l is a vector with values describing the engagement
of an opinion leader l in the k topics (i.e., the percentage of tweetsposted on each topic) at time t−1. In matrix A, each entry ai j describesthe trend of topic transition (i.e., “permutation”) from topic i to jbetween adjacent time interval t−1 and t for a group of opinion leaders.If aii is close to 1, the engagement of the opinion leader group on topici remains stable. The entries in A are estimated such that the sum ofthe squared error between mt−1
l A and mtl is minimized. ai j should also
satisfy the constraints presented in Equation 3 such that the result willbe interpretable. ωl is the weight related to opinion leader l, for whichthe number of tweets is used in the current implementation.
The transition matrix is estimated for each opinion leader group atadjacent time intervals with a standard linear constrained quadraticprogramming procedure [6]. The entry ai j denotes the amount oftopical focus transition from topic i to topic j for a group of people. Ifthe amount of transition between t−1 and t is larger than a specifiedthreshold, and in the meanwhile the opinion leader group’s influenceon i exists on t−1 but switch to j on time t, the entry will be drawnsuch that it could explain the change in the role of the opinion leadergroup. To encode the values of ai j, we use dashed lines with varyingdensity of dots. The density of the dots is proportional to the strengthof the transition. The dotted line still preserves visual continuity whilevisually diminishes according to the Gestalt principle [42], indicating amore vague relation when the transition does not appear to be evident.
5.3.2 Radial view and word cloud
The radial view displays pairwise competition among topics in a se-lected time interval (Q4). This view extends the graphical notation orig-inally used in the research domain [50] to include additional competingtopics. Figure 4(c) shows an example of the radial view displaying
pairwise competitiveness. The topics are arranged as nodes on a circle,whereas pairwise competition among the topics is displayed as edgesrouted within the circle. The width of the edge indicates the strength ofinteraction. The direction of the color gradient indicates the directionof recruitment effect. The size of each node is proportional to thecompetitiveness of the corresponding topic. Color intensity encodesthe saliency, which is the same in the timeline view for consistency.
Each node also provides information on the competitiveness con-tributed by each opinion leader group in the selected time interval by dis-playing a color-coded pie chart upon user selection. In other words, thepie chart displays the proportion of the competitiveness contributions ofdifferent opinion leader groups to the corresponding topic. The radial
view also serves as a widget for exploring tweet contents. A word cloudis displayed as user interacts with the nodes and pie charts to queryon multiple facets, including the opinion leader groups, and the topics.The user can seek for the underlying causes for the patterns observedin the timeline view (e.g. topic transition, increase in competitiveness)with the widget. The radial view and the word cloud are displayed ondemand as users make selections on the timeline view. Multiple wordclouds can be pinned on the display to allow efficient comparison acrossmultiple dimensions thus enabling the user to explore Q5 and Q6.
The size of each word in the word cloud is proportional to the tf-idf (term-frequency inverse-document-frequency) measure [36]. Themethod takes the raw frequency of the terms in the selected collectionof Tweets and down-weight them by the total amount of occurrences ofthe terms in the documents, thus more unique and salient terms will begiven more weight. The temporal dimension is considered by treatingthe tweets posted in each time range (days or weeks) as a documentwhen computing the idf. Words that only appear during specific timeintervals are assigned higher importance. It would make comparativeanalysis across the temporal dimension easier. To facilitate the analysisof the correlation of keywords to the observed recruitment effects, wedraw a sparkline [22] denoting the temporal variation of the keywords’occurrences for the entire time range under analysis upon user selection.
5.4 InteractionsVarious interactive features are provided in the system to support inves-tigative analysis and the exploration of the research questions (Q5,Q6).
Detail-on-demand There are multiple levels of detail available tothe users. The word cloud in the radial view gives a summary of thetextual contents of the tweets in a selected time range and facilitatesthe identification of significant topics. In the word cloud, a sparklinedenoting the temporal variation of the keywords occurrences will alsoshow up upon user selection. A list of raw tweet records us alsoprovided to the users such that they can gain contextual understandingfor the keywords in the wordcloud by reading the tweets.
Comparative analysis In the radial view, the user could select onthe nodes correspond to the topics and the segments on the pie chartscorrespond to the opinion leader groups. The word clouds would thenprovide a visual summary of the textual contents of tweets filtered fromthe two dimensions. As multiple word clouds can be simultaneouslybrought forth, side-by-side comparison is possible.
6 IMPLEMENTATION
In this section, we describe the technical details in implementing thecomponents of the visual analysis framework as illustrated in section 3.
Data analysis. By submitting keywords and time range queries tothe search engine and by recording the number of matches, the timevariant saliency of the topics (i.e. mi,g and pi in Equation 2) can beobtained. Given the m and p time series, we perform an ordinary leastsquares estimation using the vars2 package in R which generates theestimated coefficients (i.e., βi, j,g ) in Equation 2 and the R2, whichdescribes the overall fitness of the model. A stepwise regression isperformed thereafter to obtain the effect for each recruitment term(i.e., sr2
i, j,g for mi,g p j), which are aggregated to obtain the measureson the competitiveness of each topic and the recruitment effect ofeach opinion leader group with respect to the topics. To obtain timevarying measures, we use a sliding window with a fixed number of timepoints. The data for estimating topic transition is also obtained throughkeyword queries. Given the corresponding recruitment effect of eachopinion leader group, and the topic transition trend at each time point, aDAG structure that encodes the varying roles and the topical transitionof the opinion leaders is derived, which are then displayed with thetimeline view. The word cloud is constructed by fetching informationfrom the search engine upon user interaction.
Timeline view. Two steps are used to create the timeline view: toorder the layers and threads and to derive their exact geometry.
To order the layers, we adopt the approach mentioned in the paper[7], which places the layer with the least amount of change (variance in
2http://cran.r-project.org/web/packages/vars/
2017XU ET AL: VISUAL ANALYSIS OF TOPIC COMPETITION ON SOCIAL MEDIAVISUAL ANALYSIS OF TOPIC COMPETITION ON...
layer123
A BC
Fig. 5. The gray rectangle marked out a segment in layer 2. The order ofinsertion in the greedy scheme will be (A, C, B), as in descending orderof the number of transition lines. After the rearrangement, the order ofthe threads from top to bottom will be (C, B, A).
competitiveness) at the center, and gradually add the layers with largervariance from inside out. After fixing the order of the layers, the orderof the threads which co-exist in the same layer needs to be decided.Here a simple strategy can be used to reduce the resulted crossingsand generate a more aesthetic layout. The method is illustrated inFigure 5. Here we define a continuous time interval when multiplethreads co-exist in a layer as a segment. Within each segment, the orderof the threads is decided with a greedy scheme by adding the threadsone-by-one. As the crossings would be caused by the transition linesgoing to other layers, the threads with more transition lines are addedfirst. Each time a new thread is added to the ordering, the place ofinsertion is determined through minimizing the resulted new crossings.
After the orderings have been decided, the exact geometry of thelayers and the threads can be derived. The baseline (i.e., the bottomof the lowest layer) in the ThemeRiver is computed by minimizing thewiggles [7]. The threads are drawn close to the midpoints of each layerthus they appear bundled when multiple opinion leader groups exertinfluence on the same topics.
7 EVALUATION
To evaluate the effectiveness of the model and to demonstrate the ana-lytical and visualization techniques, we apply them on two data sets re-trieved from Twitter and discuss our findings. We also demonstrated theprototype visualization system to domain experts who are the coauthorsof this paper and gathered feedback on the effectiveness of the system.
7.1 Data PreparationWe use two Twitter data sets for our study: the 2012 US presidentialelection and the Occupy Wall Street movement (OWS). Both data setswere obtained by retrieving tweets with related keywords or hashtagssuch as “election2012” and “occupywallst”. The time duration forretrieving the US election data was from May 01, 2012 to November20, 2012, which covered the major events related to presidentialelection. A total of 89,174,308 tweets were obtained for the electiondata. The OWS data set contained 3,201,119 tweets posted fromSeptember 17, 2011 to November 25, 2011.
We worked closely with domain experts to determine the categoriesof opinion leaders and to identify the most important topics in the twodata sets. The opinion leaders were detected through the number ofretweets. For the election data set, the 200 most retweeted users, whosetweets accounted for 0.75% of the total tweets, were regarded as theopinion leaders in our study. The opinion leaders were manually clas-sified by collaborating with domain experts into three groups, namely,political figures, media, and grassroots for the comparative study oftheir influences on the public agenda. Our collaborators also identifiedsix general topics, namely, welfare/society, defense/internationalissues, economy, election (general), election (horse race), law/socialrelations considering their relevance to agenda-setting research [27]and to the dataset. Keywords related to the topics were collectedthrough an iterative process which attempted to balance the percentageof tweets related to any of the six topics at different times whilemaximizing the overall coverage of the tweets. This process is suitablefor studying the competition effect among the topics, as suggested byour collaborators. The final set of keywords covered 51.2% of the totaltweets (averaged over all the four-hour intervals) with std = 0.08. Thesaliency of the topics on the public agenda was computed by dividingthe number of tweets related to a particular topic by the total number oftweets posted by all users at a certain time. The agenda of each groupof opinion leaders was obtained in a similar manner by counting only
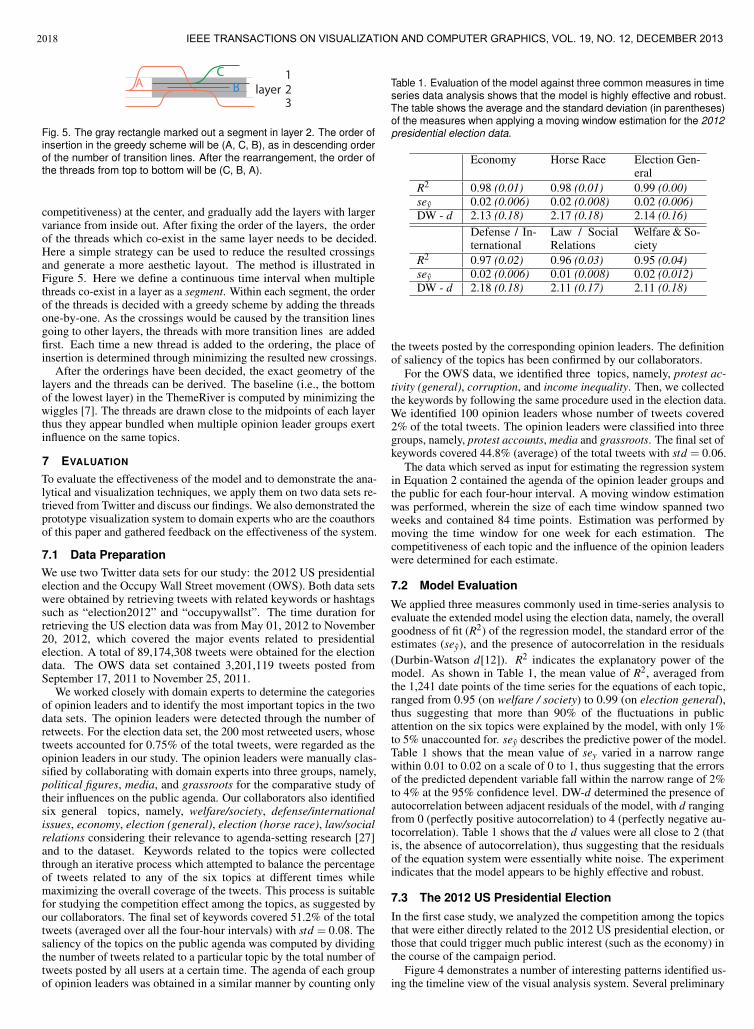
Table 1. Evaluation of the model against three common measures in timeseries data analysis shows that the model is highly effective and robust.The table shows the average and the standard deviation (in parentheses)of the measures when applying a moving window estimation for the 2012presidential election data.
Economy Horse Race Election Gen-eral
R2 0.98 (0.01) 0.98 (0.01) 0.99 (0.00)sey 0.02 (0.006) 0.02 (0.008) 0.02 (0.006)DW - d 2.13 (0.18) 2.17 (0.18) 2.14 (0.16)
Defense / In-ternational
Law / SocialRelations
Welfare & So-ciety
R2 0.97 (0.02) 0.96 (0.03) 0.95 (0.04)sey 0.02 (0.006) 0.01 (0.008) 0.02 (0.012)DW - d 2.18 (0.18) 2.11 (0.17) 2.11 (0.18)
the tweets posted by the corresponding opinion leaders. The definitionof saliency of the topics has been confirmed by our collaborators.
For the OWS data, we identified three topics, namely, protest ac-tivity (general), corruption, and income inequality. Then, we collectedthe keywords by following the same procedure used in the election data.We identified 100 opinion leaders whose number of tweets covered2% of the total tweets. The opinion leaders were classified into threegroups, namely, protest accounts, media and grassroots. The final set ofkeywords covered 44.8% (average) of the total tweets with std = 0.06.
The data which served as input for estimating the regression systemin Equation 2 contained the agenda of the opinion leader groups andthe public for each four-hour interval. A moving window estimationwas performed, wherein the size of each time window spanned twoweeks and contained 84 time points. Estimation was performed bymoving the time window for one week for each estimation. Thecompetitiveness of each topic and the influence of the opinion leaderswere determined for each estimate.
7.2 Model EvaluationWe applied three measures commonly used in time-series analysis toevaluate the extended model using the election data, namely, the overallgoodness of fit (R2) of the regression model, the standard error of theestimates (sey), and the presence of autocorrelation in the residuals(Durbin-Watson d[12]). R2 indicates the explanatory power of themodel. As shown in Table 1, the mean value of R2, averaged fromthe 1,241 date points of the time series for the equations of each topic,ranged from 0.95 (on welfare / society) to 0.99 (on election general),thus suggesting that more than 90% of the fluctuations in publicattention on the six topics were explained by the model, with only 1%to 5% unaccounted for. sey describes the predictive power of the model.Table 1 shows that the mean value of sey varied in a narrow rangewithin 0.01 to 0.02 on a scale of 0 to 1, thus suggesting that the errorsof the predicted dependent variable fall within the narrow range of 2%to 4% at the 95% confidence level. DW-d determined the presence ofautocorrelation between adjacent residuals of the model, with d rangingfrom 0 (perfectly positive autocorrelation) to 4 (perfectly negative au-tocorrelation). Table 1 shows that the d values were all close to 2 (thatis, the absence of autocorrelation), thus suggesting that the residualsof the equation system were essentially white noise. The experimentindicates that the model appears to be highly effective and robust.
7.3 The 2012 US Presidential ElectionIn the first case study, we analyzed the competition among the topicsthat were either directly related to the 2012 US presidential election, orthose that could trigger much public interest (such as the economy) inthe course of the campaign period.
Figure 4 demonstrates a number of interesting patterns identified us-ing the timeline view of the visual analysis system. Several preliminary
2018 IEEE TRANSACTIONS ON VISUALIZATION AND COMPUTER GRAPHICS, VOL. 19, NO. 12, DECEMBER 2013

explanations could be formed. The timeline visualization indicates thatfor most of the time, the political figures group played a prominent rolein attracting public attention to the topic election (general) in settingthe agenda of the discussion on Twitter. During the time interval aroundAugust 28 and September 4, the threads are relatively thicker, indicat-ing a stronger recruitment effect. The potential cause for the observedeffects was likely to be the occurrence of some important events relatedto the topic. Therefore, we explored by examining the textual contentsof the tweets during that time interval posted by the political figureson the topic election (general) with the word cloud. In the word cloud,the keyword “convention” was the most salient among all. Hoveringover the keyword, a sparkline summarizing the temporal variation forthe occurrence of the keyword “convention” was displayed. It couldbe identified that the occurrence of the keyword rose to its peak in theselected time interval (i.e., around September 4th). By examining thetweets that contains the keyword “convention”, we hypothesized thatthe recruitment effect of the political figures with respect to the topicelection (general) was very likely to be related to the events Republicanand democratic national convention, both took place during that time.
During the time interval around October 2, the grassroots startedto play a major role in recruiting public attention to the topic election(general) as they set the public agenda. In the meanwhile, it startedto affect multiple other topics including economy, welfare/societyand defense/international issues, which was very likely to be causedby the presidential debates that took place around that time, whenvarious issues were brought to discussion. In the figure, we couldalso observe a stronger transition to the topic welfare/society than todefense/international issues as indicated by the two transition linesa and b. We speculated that since the main topic of the first TV debatewas on domestic issues, there could be relatively less topic focustransferring to defense/international issues. The figure also depictsthe intensive competition among the topics during the presidentialdebates. The grassroots and the media were the two driving forcesin attracting public attention for multiple topics. The radial view cin Figure 4 demonstrates that the topic law/social relations was the“victim” of some other topics around September 25.
Figure 6 illustrates another observation. The media exerted a long pe-riod of influence on the topic of election (horse race). However, whenthe content of the discussion was displayed, we determined that thecause for the observed recruitment effect was actually different. AroundJuly 10, a trending discussion on Bain Capital, a company of which can-didate Mitt Romney is a cofounder, was observed. After we examinedthe tweets posted by the media, we found that it was likely related tothe news reports on the inconsistency between Mitt Romneys statementon the duration he served the company and what have been filed.
Figure 1 also illustrates different causes for the recruitment effect.From the timeline view, it could be identified that the grassroots andthe media played the major roles in recruiting public attention to thetopic welfare/society around June 5 and 12. Although around June
5, the trending discussion was on “solyndra”, while around June 12,the keywords “teachers” and “firefighters” gained more significance.
Figure 7 illustrates how transition lines could hint on the switch intopical focus. It could be observed that the topical focus of the mediatransfers from multiple other topics to law/social relations around July24. The keyword “gun” became increasingly important. After examin-ing the tweets, we found that this was possibly caused by the Orlandogun shooting event, which raised a lot of discussion on gun laws.
7.4 Occupy Wall StreetFigure 8 illustrates a number of findings when we used the system tostudy the OWS data. We observed that the overall competitiveness ofthe three topics remained steady during the first two weeks of October,then increased rapidly after October 15, reached its peak aroundOctober 22, and gradually decreased. Such results aroused our interestin finding the reason for the sudden increase in overall competitiveness.We used our radial graph and other detailed views to dig deeper intothe data, and discovered that numerous tweets referred to the supportof President Obama to the protesters, such as “the White House issueda statement saying Obama is working for the interests of the 99%” on
6/26/2012 7/3/2012 7/10/2012 7/17/2012
bain1999
capital
returnspoll tax
ann
attacks
biden
left
2002 releasevideo ceo
running
globe
questionsmichelle
joe
camppolls
kill
campaign papers
listed
retroactively
boston
team
answer kristol
role tpm
leave mate
presidentmanagement
olympics
cnn retired
naacp media
apology
2001
interview
question
tenure
managing
muslim
changed joneasley
palin
jtsthehill
false
voters
horse
gop
lead
forms
february
jobs
partner
bill
disclosure
condi
tpmlivewire
report
pres
leaving
outsourcing
feb abc
responsible
prove
manage
leads
felony
tied
legally
calls
demands
ahead
veep
fox
stuff
gallup
rides
swing
docs
time
lying
tells
ads
cop
cat
hill
lies
ira
HORSE.RACE
pollann
bainpolls
bidenbattleground
wsj swing
michelle nbcski gallup
jet kill
leading cookie
ruling scotus
palinneck
video
joneasley
horse
lead
cnn
key
majority
attacks
jtsthehill rides
photo
campaign leads
joe
left
obamacare
stark
tied
kristol
news
polling tpm
sarah
rasmussen strategy
pure
fox
running
gold
ride husband
americans
cream
aliciacohn
aca
hill
taxedge
alien
returns
ice
outsourcing offshoring
dysfunction
worse
women
pressuited
camp
eating
holds
decision
jobs
documents
bill
claims
tells
invented
caught
realize
coverage
capital
changed
adscharlesdharapak
race
ahead
invasion
voters
mates
bump
wapo
plan
team
health
expanding
wow
tpmlivewire
riding
independents
court
warfare
grows
political
pick
piecealiens
dems
slams
koch
vote
cone
talk
gop
job bit
lot
fall
yrs
car
HORSE.RACE Politicial figuresGrassroots
Media
HORSE.RACE
Fig. 6. A long time of influence exerted by the media on the topic election(horse race), although with very different trending keywords.
7/17/2012 7/24/2012
DEFENSE.INTERNATIONAL.ISSUES
LAW.SOCIAL.RELATIONS
HORSE.RACE ELECTION.GENERAL
WELFARE.SOCIETY
naacpbain
taxcampaign
returns
pres video
welfare reformfelon
release
1999
colorado
careful charge
cocaine president
booed
china
speech
attacks taxes
felonypatdollard
capital
outsourcing
shooting
clinton gun
warns
security
people
poll
2002
convention
business
jobs
israel
gutslaw
attack
aide
leftcalls
call
gop
ann
defense
biden
stuff released
health
trip
team
care
medicare
boos
obamacare
bush
cheneyarpaio
college
money
war
address
week
lashes
watch
voters
control
cut
camp
free
tells
companies buzzfeed
abortion repeal
column
afghanistan
military
tpm
event
firms
life
uniforms
black
support
visit
live
issue
threat
return
national
solyndra
homeland
news
american
time
plan
house
olympics mccain
records
day
olympic
florida questions
held
adviser
aides
media
story
white
fox
hhs
cuts
john
oil
pick
era
lie
ron
gunisrael
prestax
campaign
returns controliran bain
video release
colorado shooting
ann
poll foreign
aides
violence
abortion
president
calls oil
fundraiser olympics
aurora policy
business
people aide
bloomberg
security
guns
life
trip visit
israeli
speech
war
solyndra
hands
laws
taxes
attack
announces
anglo
press
london michelle
medicare
issue
olympic
voters
nbc
mayor
money buzzfeed
47s
education
tells
national
time
hhs military
spokeswoman breaking
economy
gop
felon
invested
welfare
house
call
attacks
jerusalem
reform
rights
administration
mccain
care
defense
palin
day
address
supporters
saxon
vfw
week
slams
leaks
innovative
meeting
report
companies
event
law
american
spent
mormon
victims
candidate
florida
read
jobs
tpm
health
office
belong
mandate
remarks
billion
build
african
poland
john
china
criminals
media
racist
nyc
watch
bill
dick
nyt
cbs
cut
ceo sen
fil
reasonsawwww
ECONOMY
7/10/2012 7/31/2012
Politicial figuresGrassrootsMedia
Fig. 7. Transition of topical focus of the media from multiple topics to law/ social relations around July 24th. The keyword “gun” had an increasingimportance when the word clouds based on all the tweets posted by themedia were compared before and after the transition.
October 16. Thus, the support of President Obama could have encour-aged the OWS movement and attracted public attention, which directlyled to the increase in the overall competitiveness of all main topics.
We could clearly see that protest accounts played a major role indriving the public attention at all times. We examined the contentsposted by the accounts of the protesters (bottom right word cloud inFigure 8), which featured the keywords “photo” and “posted”, indicat-ing the active involvement of these accounts in spreading the news andreporting the most recent protest activities. Another interesting patternidentified from Figure 8 was that “protest accounts” and “grassroots”dominated the discussion at the beginning. After a certain period,particularly after President Obamas statement of support, media groupsbegan to play a more important role in leading the discussion.
Among the three topics, protest activity was the most salientbecause its corresponding layer in ThemeRiver has the darkest color.At the beginning of October, the grassroots were also quite active inprotest activities. After examining the word cloud, we found that thekeywords “arrested”, “nypd”, “police”, “brooklyn”, and “bridge” wereamong the most frequent. We further checked the Tweets and newsreports around that period, and found that the observed recruitmenteffect was related to the arrest of protesters at Brooklyn Bridge on
2019XU ET AL: VISUAL ANALYSIS OF TOPIC COMPETITION ON SOCIAL MEDIAVISUAL ANALYSIS OF TOPIC COMPETITION ON...

October 2, which attracted much public interest during that time.
10/1/2011 10/8/2011 10/15/2011 10/22/2011 10/29/2011
CORRUPTION
photoposted
marchpolice
protest occupycity arrests
oakland
park
2011 square
arrested
total
join
protesters
tonight
solidarity
camp tent
arrest
gas chicago
occupywallstnyc
hall
october
boston
people raid
street
tents
cops
peaceful
tear
wall
video
oct
occupyoakland
eviction
day plaza
night
riot
marching
support
rubber
occupysf
war
nypd rally
mayor
attempt
san
bullets
francisco
justin
peace
washington
live
occupation
breaking
protester
grant
attack
protestors
call
crowd
news
stay
action
time
photos
occupywallst
ows
occupiers
toronto
herman
blankets
tomorrow
national
injured
flash
los
evict
angeles
global
morning
strong
word
sign
food
stands retweet
scott
ave
iraq
kick
nyc
vet
pic
PROTEST_ACTIVITY
INCOME_INEQUALITY
PROTEST_ACTIVITY
Protest accounts
GrassrootMedia
nypdpolice
arrestedprotesters
live
wall
streetbridge march
arrests
ericallenbell
protest org
brooklyn video
occupy protests
union parkarrest
people
morgan
pepperjoin
occupywallstnyc
chase
brutality
cops square
jeffrae cont
mass
occupywallst
peaceful
nyc
mediaspray
watch
protestors
cop
marching
york
protester
exiledsurfer
city
news
violence
team zuccotti
support
women
videos
day
arresting
sprayed owsbot
plaza
msnbc
reporter
tonight
violent
report
bitcall
joins
feed
ppl
jail
bus
oct
mace
lot
PROTEST_ACTIVITY
Fig. 8. Exploration of the Occupy Wall Street movement data. The protestaccounts played the major role in recruiting public attention.
7.5 Expert ReviewTo evaluate the effectiveness of the visual analysis system, we inter-viewed two domain experts from two universities, A and B, regard-ing agenda-setting research and media theory, respectively. We firstexplained the visual encoding scheme used in the system and demon-strated its interactive features. We also demonstrated the patterns foundin the case study. The initial feedback is summarized as follows.
Visual design. The domain experts were impressed with the visualdesign. Expert A commented “It is quite powerful and help in myresearch. The visualization can help reveal the complex, dynamicrelationships among topics and opinion leaders visually. The visualrepresentation appears intuitive to me”. He further highlighted theusefulness and intuitiveness of the transition lines for connectingopinion leaders in his analysis. Expert B also appreciated our timelinevisualization system and acknowledged its usefulness and effectiveness.He further added “The radial view is easy to understand as it iscommonly used in my field to represent the pairwise competition”. Healso pointed out that the tweet list will be helpful for in-depth analysisof certain patterns identified from other visualizations.
Interactive features. The interactive features were also wellreceived . They both appreciated using our system. Expert Aacknowledged the intuitiveness of the interactions provided by thesystem. He said “I like interacting with the data and seeing the resultsimmediately. The interactions are very smooth”. He also consideredthe interactions to be engaging. Expert B particularly liked the featureof generating a radial visualization by clicking any part of the timelinevisualization. He also believed that the interactive comparative analysissupported by our system is useful and intuitive.
Improvements. The experts recommended several potential im-provements, including adding more legends and textual explanationsto the quantities encoded in the system. They also suggested that thevisualization system be released to the public via a Web-based envi-ronment. Expert A commented “While the current system looks niceand comprehensive, it may not fully meet my requirements. I wouldlike to customize the system if possible. For example, I might be onlyinterested in fewer topics and so other topics could be removed fromthe visualization”. Expert B also highlighted the idea that the systemshould start simple and hide unnecessary details. He suggested thatthe system should initially show basic information (such as the com-petitiveness of each topic) with ThemeRiver. The threads representingthe opinion leader groups can be displayed upon user request. Allsuggested improvements were integrated in the current system.
8 DISCUSSION
The case studies demonstrate the advantages of combining aquantitative competition model and interactive visualization techniques
to discover interesting patterns. The model is capable of extractingstructured relation information from massive unstructured tweets,providing analysts with a new method for gleaning insight. Neverthe-less, the modeled information is dynamic and poses an obstacle to theunderstanding. Our interactive visual analysis technique can convey in-formation in an intuitive manner, mainly through timeline visualization.This study mainly analyzes the dynamic relationship between opinionleaders and various topics in the agenda-setting process. However, themajor component of the visual design (that is, the timeline view) canalso be applied to other scenarios when a time-varying relation existsbetween two different entities. For example, the relationship betweensocial network users and time-evolving communities, wherein eachuser switches their affiliation with the communities.
In our study, six broad topics are extracted from millions of tweets onTwitter for the presidential election data. Considering the relative pro-portion of the topics under the analysis, we measure the saliency of thetopics as a normalized score (i.e., the percentage of public engagementin those topics) rather than a raw count (i.e., number of tweets aboutthose topics). The normalization of the data structurally determinesthe agenda-setting process to be a competition process. Therefore, it isquite reasonable for us to focus on the competitive relationship amongtopics only in our study. Although competition has been a popularframework in the study of information diffusion [4, 45, 48, 50], it isworth noting here that there might be other forms of relationships suchas cooperation between topics [31]. To detect other forms of rela-tionships, a feasible direction is to zoom into these six broad topicsidentified in the study and decompose them into several sub-topics.When more subtle topics included in the study, it is more likely to finddifferent forms of relationships among the topics.In the current studywe mainly analyze the competitive relationship. In the future, we planto extend the model to include other forms of relationships.
Our research on the phenomenon of topic competition in agenda-setting is still in progress. Two weaknesses in this work need to beaddressed. First, data is still far from perfect and may lead to biasedconclusions. Second, opinion leader groups and topics are defined andprovided by our domain experts for both data sets. To apply the modelto other data sets, we also need to define topics and opinion leadergroups, which is time-consuming and tedious. It is certainly possibleto classify the tweets and extract opinion leaders automatically or semi-automatically using data mining approaches. However, automatic tweetclassification and opinion leader detection is beyond the focus of thiswork. We will study this problem and integrate the data mining tech-niques into the current system to automate the data collection process.
9 CONCLUSION
This paper describes a visualization system for facilitating the analysisof the competition effect among multiple topics in agenda-setting onsocial media. We introduce a model for characterizing the dynamics oftopic competition and for estimating the influence of different opinionleaders. The system employs a timeline design which integrates stackedgraph and storyline visualizations. The system allows analysts to in-teractively and visually trace and analyze the estimated dynamic rela-tionships among competing topics, as well as the relationships betweenopinion leaders and the topics over time. A set of detailed views, such asradial graph and word cloud, is provided for in-depth analysis of the pat-tern discovered from timeline visualization. In the future, we will testour models and techniques on more data sets. Our system is currentlyoff-line. An interesting direction will be extending it to support real-time Twitter data streaming. We plan to conduct a formal user study toassess the effectiveness of the visual design and the utility of the system.
ACKNOWLEDGMENTS
We would like to thank Professor Lu Wei from Zhejiang University forsuggesting the chance of interdisciplinary collaboration, the anonymousreviewers for their valuable and constructive comments, Fangzhao Wuand Hong Zhou for their help. This work is partially supported by agrant from MSRA and RGC GRF 618313.
2020 IEEE TRANSACTIONS ON VISUALIZATION AND COMPUTER GRAPHICS, VOL. 19, NO. 12, DECEMBER 2013

REFERENCES
[1] Project cascade. http://nytlabs.com/projects/cascade.html, Sept. 2011.
[2] Revisit. http://moritz.stefaner.eu/projects/revisit/, Sept. 2012.
[3] D. Archambault, D. Greene, P. Cunningham, and N. Hurley. Theme-Crowds: Multiresolution summaries of twitter usage. In Proceedings ofthe Workshop on Search and Mining User-generated Contents, pages 1–20,2011.
[4] S. Asur, B. A. Huberman, G. Szabo, and C. Wang. Trends in socialmedia: Persistence and decay. In Proceedings of the International AAAIConference on Weblogs and Social Media, pages 434–437, 2011.
[5] M. Q. W. Baldonado, A. Woodruff, and A. Kuchinsky. Guidelines forusing multiple views in information visualization. In Proceedings ofAdvanced Visual Interfaces, pages 110–119, 2000.
[6] S. Boyd and L. Vandenberghe. Convex Optimization. Berichte uberverteilte messysteme. Cambridge University Press, 2004.
[7] L. Byron and M. Wattenberg. Stacked graphs - geometry & aesthetics.IEEE Transactions on Visualization and Computer Graphics, 14(6):1245–1252, 2008.
[8] N. Cao, Y.-R. Lin, X. Sun, D. Lazer, S. Liu, and H. Qu. Whisper: Tracingthe spatiotemporal process of information diffusion in real time. IEEETransactions on Visualization and Computer Graphics, 18(12):2649–2658,2012.
[9] W. Cui, S. Liu, L. Tan, C. Shi, Y. Song, Z. Gao, H. Qu, and X. Tong.Textflow: Towards better understanding of evolving topics in text. IEEETransactions on Visualization and Computer Graphics, 17(12):2412–2421,2011.
[10] N. Diakopoulos, M. Naaman, and F. Kivran-Swaine. Diamonds in therough: Social media visual analytics for journalistic inquiry. In Proceed-ings of IEEE Symposium on Visual Analytics Science and Technology,pages 115–122, 2010.
[11] M. Dork, D. Gruen, C. Williamson, and S. Carpendale. A visual backchan-nel for large-scale events. IEEE Transactions on Visualization and Com-puter Graphics, 16(6):1129–1138, 2010.
[12] J. Durbin and G. S. Watson. Testing for serial correlation in least squaresregression. Biometrika, 37(3/4):409–428, 1950.
[13] D. Easley and J. Kleinberg. Networks, Crowds, and Markets: ReasoningAbout a Highly Connected World, volume 1. Cambridge University Press,2010.
[14] E. R. Gansner, Y. Hu, and S. C. North. Visualizing streaming text datawith dynamic graphs and maps. In Proceedings of Graph Drawing, pages439–450, 2012.
[15] M. Gupta, J. Gao, Y. Sun, and J. Han. Integrating community matchingand outlier detection for mining evolutionary community outliers. InProceedings of the ACM SIGKDD international conference on Knowl-edgediscovery and data mining, pages 859–867, 2012.
[16] S. Havre, E. Hetzler, P. Whitney, and L. Nowell. ThemeRiver: Visualizingthematic changes in large document collections. IEEE Transactions onVisualization and Computer Graphics, 8(1):9–20, 2002.
[17] M. Hu, S. Liu, F. Wei, Y. Wu, J. Stasko, and K.-L. Ma. Breaking news ontwitter. In ACM CHI, pages 2751–2754, 2012.
[18] J. Johansson, P. Ljung, and M. Cooper. Depth cues and density in temporalparallel coordinates. In Proceedings of EuroVis, pages 35–42, 2007.
[19] N. W. Kim, S. K. Card, and J. Heer. Tracing genealogical data withtimenets. In Proceedings of Advanced Visual Interfaces, pages 241–248,2010.
[20] R. Kosara, F. Bendix, and H. Hauser. Time histograms for large, time-dependent data. In Proceedings of EuroVis, pages 45–54, 2004.
[21] S. Laxman and P. Sastry. A survey of temporal data mining. Sadhana,31(2):173–198, 2006.
[22] B. Lee, N. H. Riche, A. K. Karlson, and M. S. T. Carpendale. Sparkclouds:Visualizing trends in tag clouds. IEEE Transactions on Visualization andComputer Graphics, 16(6):1182–1189, 2010.
[23] S. Liu, Y. Wu, E. Wei, M. Liu, and Y. Liu. Storyflow: Tracking theevolution of stories. IEEE Transactions on Visualization and ComputerGraphics, 19(12), 2013.
[24] S. Liu, M. X. Zhou, S. Pan, Y. Song, W. Qian, W. Cai, and X. Lian. Tiara:Interactive, topic-based visual text summarization and analysis. ACMTransactions on Intelligent Systems and Technology, 3(2):25:1–25:28, Feb.2012.
[25] D. Luo, J. Yang, M. Krstajic, W. Ribarsky, and D. A. Keim. EventRiver:
Visually exploring text collections with temporal references. IEEE Trans-actions on Visualization and Computer Graphics, 18(1):93–105, 2012.
[26] A. Marcus, M. Bernstein, O. Badar, D. Karger, S. Madden, and R. Miller.Twitinfo: aggregating and visualizing microblogs for event exploration.In ACM CHI, pages 227–236, 2011.
[27] M. Mccombs and J. Zhu. Capacity, diversity, and volatility of the publicagenda: Trends from 1954 to 1994. Public Opinion Quarterly, 59(4):495–525, 1995.
[28] M. E. McCombs and D. L. SHAW. The agenda-setting function of massmedia. Public Opinion Quarterly, 36(2):176–187, 1972.
[29] W. Muller and H. Schumann. Visualization methods for time-dependentdata - an overview. In Proceedings of the Simulation Conference, volume 1,pages 737–745 Vol.1, 2003.
[30] R. Munroe. Xkcd #657: Movie narrative charts. http://xkcd.com/657, December 2009.
[31] S. Myers and J. Leskovec. Clash of the contagions: Cooperation andcompetition in information diffusion. In Proceedings of IEEE InternationalConference on Data Mining, pages 539 –548, 2012.
[32] M. Ogawa and K.-L. Ma. Software evolution storylines. In Proceedingsof the international symposium on Software visualization, pages 35–42,2010.
[33] V. Ogievetsky. Plotweaver. http://ogievetsky.com/PlotWeaver/.
[34] K. Reda, C. Tantipathananandh, A. E. Johnson, J. Leigh, and T. Y. Berger-Wolf. Visualizing the evolution of community structures in dynamic socialnetworks. Computer Graphics Forum, 30(3):1061–1070, 2011.
[35] S. Rose, S. Butner, W. Cowley, M. Gregory, and J. Walker. Describingstory evolution from dynamic information streams. In Proceedings ofIEEE Symposium on Visual Analytics Science and Technology, pages 99–106, 2009.
[36] G. Salton, A. Wong, and C. S. Yang. A vector space model for automaticindexing. Commun. ACM, 18(11):613–620, Nov. 1975.
[37] C. Shi, W. Cui, S. Liu, P. Xu, W. Chen, and H. Qu. RankExplorer: Visual-ization of ranking changes in large time series data. IEEE Transactions onVisualization and Computer Graphics, 18(12):2669–2678, 2012.
[38] L. Shi, F. Wei, S. Liu, L. Tan, X. Lian, and M. X. Zhou. Understandingtext corpora with multiple facets. In Proceedings of IEEE Symposium onVisual Analytics Science and Technology, pages 99–106, 2010.
[39] Y. Tanahashi and K.-L. Ma. Design considerations for optimizing story-line visualizations. IEEE Transactions on Visualization and ComputerGraphics, 18(12):2679–2688, 2012.
[40] J. van Wijk and E. Van Selow. Cluster and calendar based visualizationof time series data. In Proceedings of IEEE Symposium on InformationVisualization, pages 4–9, 140, 1999.
[41] F. Viegas, M. Wattenberg, J. Hebert, G. Borggaard, A. Cichowlas, J. Fein-berg, J. Orwant, and C. Wren. Google+ ripples: A native visualization ofinformation flow. In Proceedings of the international conference on WorldWide Web, pages 1389–1398, 2013.
[42] C. Ware. Information Visualization: Perception for Design (InteractiveTechnologies). Morgan Kaufmann, 1st edition, Feb. 2000.
[43] M. Wattenberg and J. Kriss. Designing for social data analysis. IEEETransactions on Visualization and Computer Graphics, 12(4):549–557,2006.
[44] M. Weber, M. Alexa, and W. Muller. Visualizing time-series on spirals.In Proceedings of IEEE Symposium on Information Visualization, pages7–13, 2001.
[45] L. Weng, a. Flammini, a. Vespignani, and F. Menczer. Competition amongmemes in a world with limited attention. Scientific reports, 2:335, Jan.2012.
[46] K. Wongsuphasawat and D. Gotz. Exploring flow, factors, and outcomesof temporal event sequences with the outflow visualization. IEEE Transac-tions on Visualization and Computer Graphics, 18(12):2659–2668, 2012.
[47] D. K. Wright and M. D. Hinson. How blogs and social media are changingpublic relations and the way it is practiced. Public Relations Journal,2(2):1–21, 2008.
[48] F. Wu and B. A. Huberman. Novelty and collective attention. Proceedingsof the National Academy of Sciences, 104(45):17599–17601, 2007.
[49] S. Wu, J. M. Hofman, W. A. Mason, and D. J. Watts. Who says what towhom on twitter. In Proceedings of the international conference on WorldWide Web, pages 705–714, 2011.
[50] J. Zhu. Issue competition and attention distraction: A zero-sum theory ofagenda-setting. Journalism & Mass Communication Quarterly, 69(4):825–836, 1992.
2021XU ET AL: VISUAL ANALYSIS OF TOPIC COMPETITION ON SOCIAL MEDIAVISUAL ANALYSIS OF TOPIC COMPETITION ON...