Visual Analysis of Historic Hotel Visitation Patterns · Visual Analysis of Historic Hotel...
8
IEEE TRANSACTIONS ON VISUALIZATION AND COMPUTER GRAPHICS, VOL. 12, NO. 5, SEPTEMBER/OCTOBER 2006 Visual Analysis of Historic Hotel Visitation Patterns Chris Weaver, David Fyfe, Anthony Robinson, Deryck Holdsworth, Donna Peuquet, and Alan M. MacEachren Abstract—Understanding the space and time characteristics of human interaction in complex social networks is a critical component of visual tools for intelligence analysis, consumer behavior analysis, and human geography. Visual identification and comparison of patterns of recurring events is an essential feature of such tools. In this paper, we describe a tool for exploring hotel visitation patterns in and around Rebersburg, Pennsylvania from 1898-1900. The tool uses a wrapping spreadsheet technique, called reruns, to display cyclic patterns of geographic events in multiple overlapping natural and artificial calendars. Implemented as an Improvise visualization, the tool is in active development through a iterative process of data collection, hypothesis, design, discovery, and evaluation in close collaboration with historical geographers. Several discoveries have inspired ongoing data collection and plans to expand exploration to include historic weather records and railroad schedules. Distributed online evaluations of usability and usefulness has resulted in numerous feature and design recommendations. Index Terms—Geovisualization, exploratory visualization, historical geography, coordinated multiple views, travel pattern analysis. ✦ 1 I NTRODUCTION As a part of the research and development agenda for visual analyt- ics [15], the development of integrated software for rapid construction of visual data analysis tools is a recent focus of research in both infor- mation and geographic visualization [11]. The goal is to allow users to explore information that contains geospatial, temporal, and abstract components in a flexible, integrated, interactive graphical environment that requires minimal training to use. In pursuit of this goal, Impro- vise [17] is an exploratory visualization software application that is written entirely in Java and is freely available on the web under an open source license. In Improvise, analysts rapidly build and browse multiple coordinated views of their data. What makes Improvise spe- cial is that it provides precise control over how interaction affects the presentation of space, time, and abstract data attributes in and be- tween multi-layer maps, scatter plots, parallel coordinate plots, tables, spreadsheets, and other views. Most importantly, Improvise visualiza- tions can be rapidly modified and extended to develop hypotheses and exploit discoveries during ongoing geovisual exploration and analysis. This paper describes the evolutionary process of developing a visual tool for exploring visitation patterns in hotel guest registers. Genealo- gists and autograph collectors have long valued information found in the registers of historic hotels. Academic researchers can also extract a wealth of information about commercial and cultural connectivity patterns from these archival documents. Most registers contain a date, name, and home town for each visitor. They may also include in- • Chris Weaver is with the GeoVISTA Center and the Department of Geography at The Pennsylvania State University, E-Mail: [email protected]. • David Fyfe is with the Department of Geography at The Pennsylvania State University, E-Mail: [email protected]. • Anthony Robinson is with the GeoVISTA Center and the Department of Geography at The Pennsylvania State University, E-Mail: [email protected]. • Deryck Holdsworth is with the GeoVISTA Center and the Department of Geography at The Pennsylvania State University, E-Mail: [email protected]. • Donna Peuquet is with the GeoVISTA Center and the Department of Geography at The Pennsylvania State University, E-Mail: [email protected]. • Alan M. MacEachren is with the GeoVISTA Center and the Department of Geography at The Pennsylvania State University, E-Mail: [email protected]. Manuscript received 31 March 2006; accepted 1 August 2006; posted online 6 November 2006. For information on obtaining reprints of this article, please send e-mail to: [email protected]. formation such as whether the guest represented a business, minstrel show, or baseball team, whether they were traveling with a spouse, or whether they stabled a horse in the livery. Starting with data transcribed from the guest register for the Re- bersburg Hotel in Rebersburg, PA from 1898-1900, the visualization evolved through an iterative process of creating views, populating them with data, and coordinating them in terms of user interaction. This tightly integrated method of building and browsing visualizations in Improvise makes it possible to realize and experiment with different displays of the hotel data in a matter of hours, including a multi-layer map of guest hometowns along railroads and rivers, table views con- taining nested bar plots of visits over time for individual guests and their residences, and an arc diagram showing sequences of visits by guests individually and in groups. The key component of the visualization is a glyph-based technique called reruns that displays temporal information in the cells of a wrap- ping spreadsheet, thereby allowing exploration of cyclic temporal pat- terns across multiple natural and artificial calendars. Using glyphs rather than pixels (as in visualization of infant sleep cycles [18]) al- lows encoding of more than two cyclic timescales in a single view. In- teractive adjustment of period length using reruns enables visual iden- tification of cyclic behavior of varying duration, much the same as in spiral-based visualizations of periodic data [2]. Extensive cross-filtering between the reruns view, map, and other views allows analysts to follow chains of evidence involving complex groupings of people, dates, and places. Moreover, the data domain, rapid design approach, and analysis process appear to be directly ap- plicable to current efforts to develop visual tools for use in intelligence analysis and emergency response management. Using the visualization, historical geographers have discovered nu- merous interesting patterns that prompt a large increase in data collec- tion and a desire to expand exploration to include weather and trans- portation information. Evaluation of the tool suggests strong support for continued efforts along these avenues as well. 2 DATA COLLECTION AND TRANSCRIPTION The register for the Rebersburg Hotel [3] lists daily guests at a small hotel in Rebersburg, a village in the Brush Valley region of Centre County, Pennsylvania, between June 1898 and November 1900. All told there are 2411 guest entries. Some 219 different places of ori- gin are recorded, including 162 towns and cities in Pennsylvania, 14 in New York, and seven in Ohio, as well as 36 places in 13 other states, plus Canada and a visitor from London, England. With nearly a hundred guests each month signing the register from this wide vari- ety of places, thousands of data points represent patterns of local and regional connectivity. However, when analyzing the actual archival document (figure 1), patterns were not immediately apparent. Barely legible signatures and cryptic notations were bewildering and the eye
Transcript of Visual Analysis of Historic Hotel Visitation Patterns · Visual Analysis of Historic Hotel...

IEEE TRANSACTIONS ON VISUALIZATION AND COMPUTER GRAPHICS, VOL. 12, NO. 5, SEPTEMBER/OCTOBER 2006
Visual Analysis of Historic Hotel Visitation Patterns
Chris Weaver, David Fyfe, Anthony Robinson, Deryck Holdsworth, Donna Peuquet, and Alan M. MacEachren
Abstract—Understanding the space and time characteristics of human interaction in complex social networks is a critical componentof visual tools for intelligence analysis, consumer behavior analysis, and human geography. Visual identification and comparison ofpatterns of recurring events is an essential feature of such tools. In this paper, we describe a tool for exploring hotel visitation patternsin and around Rebersburg, Pennsylvania from 1898-1900. The tool uses a wrapping spreadsheet technique, called reruns, to displaycyclic patterns of geographic events in multiple overlapping natural and artificial calendars. Implemented as an Improvise visualization,the tool is in active development through a iterative process of data collection, hypothesis, design, discovery, and evaluation in closecollaboration with historical geographers. Several discoveries have inspired ongoing data collection and plans to expand explorationto include historic weather records and railroad schedules. Distributed online evaluations of usability and usefulness has resulted innumerous feature and design recommendations.
Index Terms—Geovisualization, exploratory visualization, historical geography, coordinated multiple views, travel pattern analysis.
!
1 INTRODUCTION
As a part of the research and development agenda for visual analyt-ics [15], the development of integrated software for rapid constructionof visual data analysis tools is a recent focus of research in both infor-mation and geographic visualization [11]. The goal is to allow usersto explore information that contains geospatial, temporal, and abstractcomponents in a flexible, integrated, interactive graphical environmentthat requires minimal training to use. In pursuit of this goal, Impro-vise [17] is an exploratory visualization software application that iswritten entirely in Java and is freely available on the web under anopen source license. In Improvise, analysts rapidly build and browsemultiple coordinated views of their data. What makes Improvise spe-cial is that it provides precise control over how interaction affects thepresentation of space, time, and abstract data attributes in and be-tween multi-layer maps, scatter plots, parallel coordinate plots, tables,spreadsheets, and other views. Most importantly, Improvise visualiza-tions can be rapidly modified and extended to develop hypotheses andexploit discoveries during ongoing geovisual exploration and analysis.
This paper describes the evolutionary process of developing a visualtool for exploring visitation patterns in hotel guest registers. Genealo-gists and autograph collectors have long valued information found inthe registers of historic hotels. Academic researchers can also extracta wealth of information about commercial and cultural connectivitypatterns from these archival documents. Most registers contain a date,name, and home town for each visitor. They may also include in-
• Chris Weaver is with the GeoVISTA Center and the Department ofGeography at The Pennsylvania State University, E-Mail:[email protected].
• David Fyfe is with the Department of Geography at The PennsylvaniaState University, E-Mail: [email protected].
• Anthony Robinson is with the GeoVISTA Center and the Department ofGeography at The Pennsylvania State University, E-Mail:[email protected].
• Deryck Holdsworth is with the GeoVISTA Center and the Department ofGeography at The Pennsylvania State University, E-Mail:[email protected].
• Donna Peuquet is with the GeoVISTA Center and the Department ofGeography at The Pennsylvania State University, E-Mail:[email protected].
• Alan M. MacEachren is with the GeoVISTA Center and the Department ofGeography at The Pennsylvania State University, E-Mail:[email protected].
Manuscript received 31 March 2006; accepted 1 August 2006; posted online 6November 2006.For information on obtaining reprints of this article, please send e-mail to:[email protected].
formation such as whether the guest represented a business, minstrelshow, or baseball team, whether they were traveling with a spouse, orwhether they stabled a horse in the livery.
Starting with data transcribed from the guest register for the Re-bersburg Hotel in Rebersburg, PA from 1898-1900, the visualizationevolved through an iterative process of creating views, populatingthem with data, and coordinating them in terms of user interaction.This tightly integrated method of building and browsing visualizationsin Improvise makes it possible to realize and experiment with differentdisplays of the hotel data in a matter of hours, including a multi-layermap of guest hometowns along railroads and rivers, table views con-taining nested bar plots of visits over time for individual guests andtheir residences, and an arc diagram showing sequences of visits byguests individually and in groups.
The key component of the visualization is a glyph-based techniquecalled reruns that displays temporal information in the cells of a wrap-ping spreadsheet, thereby allowing exploration of cyclic temporal pat-terns across multiple natural and artificial calendars. Using glyphsrather than pixels (as in visualization of infant sleep cycles [18]) al-lows encoding of more than two cyclic timescales in a single view. In-teractive adjustment of period length using reruns enables visual iden-tification of cyclic behavior of varying duration, much the same as inspiral-based visualizations of periodic data [2].
Extensive cross-filtering between the reruns view, map, and otherviews allows analysts to follow chains of evidence involving complexgroupings of people, dates, and places. Moreover, the data domain,rapid design approach, and analysis process appear to be directly ap-plicable to current efforts to develop visual tools for use in intelligenceanalysis and emergency response management.
Using the visualization, historical geographers have discovered nu-merous interesting patterns that prompt a large increase in data collec-tion and a desire to expand exploration to include weather and trans-portation information. Evaluation of the tool suggests strong supportfor continued efforts along these avenues as well.
2 DATA COLLECTION AND TRANSCRIPTION
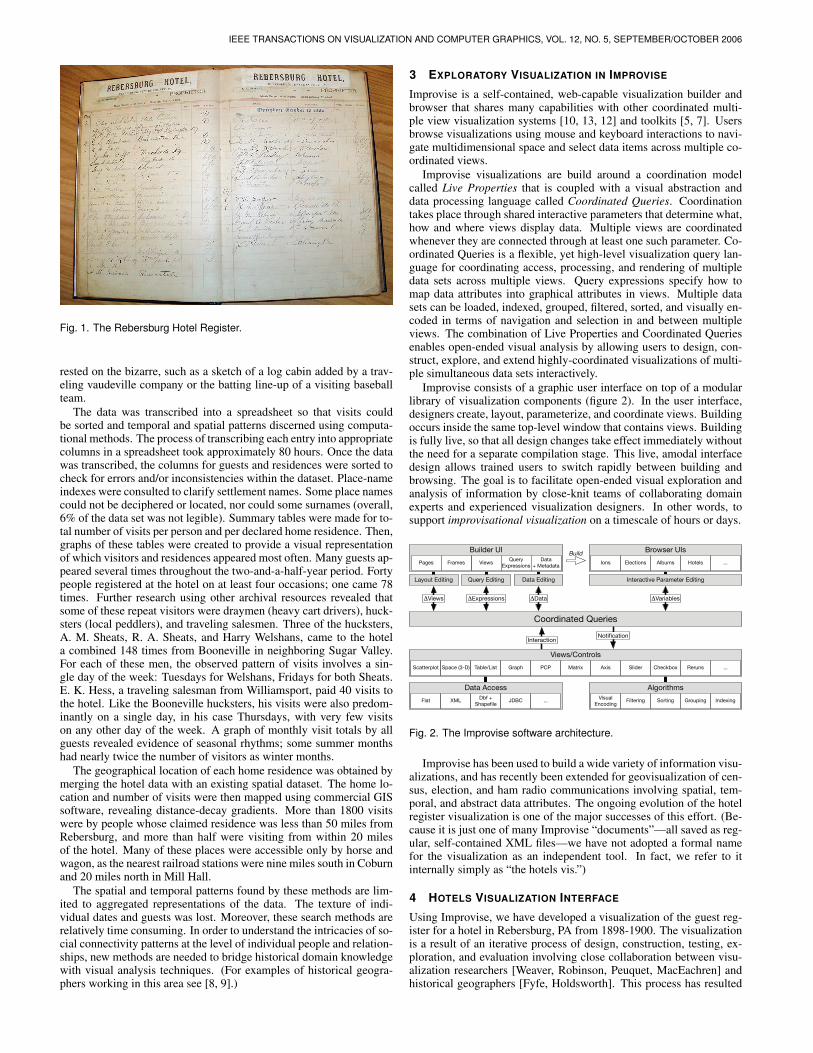
The register for the Rebersburg Hotel [3] lists daily guests at a smallhotel in Rebersburg, a village in the Brush Valley region of CentreCounty, Pennsylvania, between June 1898 and November 1900. Alltold there are 2411 guest entries. Some 219 different places of ori-gin are recorded, including 162 towns and cities in Pennsylvania, 14in New York, and seven in Ohio, as well as 36 places in 13 otherstates, plus Canada and a visitor from London, England. With nearlya hundred guests each month signing the register from this wide vari-ety of places, thousands of data points represent patterns of local andregional connectivity. However, when analyzing the actual archivaldocument (figure 1), patterns were not immediately apparent. Barelylegible signatures and cryptic notations were bewildering and the eye
IEEE TRANSACTIONS ON VISUALIZATION AND COMPUTER GRAPHICS, VOL. 12, NO. 5, SEPTEMBER/OCTOBER 2006
Fig. 1. The Rebersburg Hotel Register.
rested on the bizarre, such as a sketch of a log cabin added by a trav-eling vaudeville company or the batting line-up of a visiting baseballteam.
The data was transcribed into a spreadsheet so that visits couldbe sorted and temporal and spatial patterns discerned using computa-tional methods. The process of transcribing each entry into appropriatecolumns in a spreadsheet took approximately 80 hours. Once the datawas transcribed, the columns for guests and residences were sorted tocheck for errors and/or inconsistencies within the dataset. Place-nameindexes were consulted to clarify settlement names. Some place namescould not be deciphered or located, nor could some surnames (overall,6% of the data set was not legible). Summary tables were made for to-tal number of visits per person and per declared home residence. Then,graphs of these tables were created to provide a visual representationof which visitors and residences appeared most often. Many guests ap-peared several times throughout the two-and-a-half-year period. Fortypeople registered at the hotel on at least four occasions; one came 78times. Further research using other archival resources revealed thatsome of these repeat visitors were draymen (heavy cart drivers), huck-sters (local peddlers), and traveling salesmen. Three of the hucksters,A. M. Sheats, R. A. Sheats, and Harry Welshans, came to the hotela combined 148 times from Booneville in neighboring Sugar Valley.For each of these men, the observed pattern of visits involves a sin-gle day of the week: Tuesdays for Welshans, Fridays for both Sheats.E. K. Hess, a traveling salesman from Williamsport, paid 40 visits tothe hotel. Like the Booneville hucksters, his visits were also predom-inantly on a single day, in his case Thursdays, with very few visitson any other day of the week. A graph of monthly visit totals by allguests revealed evidence of seasonal rhythms; some summer monthshad nearly twice the number of visitors as winter months.
The geographical location of each home residence was obtained bymerging the hotel data with an existing spatial dataset. The home lo-cation and number of visits were then mapped using commercial GISsoftware, revealing distance-decay gradients. More than 1800 visitswere by people whose claimed residence was less than 50 miles fromRebersburg, and more than half were visiting from within 20 milesof the hotel. Many of these places were accessible only by horse andwagon, as the nearest railroad stations were nine miles south in Coburnand 20 miles north in Mill Hall.
The spatial and temporal patterns found by these methods are lim-ited to aggregated representations of the data. The texture of indi-vidual dates and guests was lost. Moreover, these search methods arerelatively time consuming. In order to understand the intricacies of so-cial connectivity patterns at the level of individual people and relation-ships, new methods are needed to bridge historical domain knowledgewith visual analysis techniques. (For examples of historical geogra-phers working in this area see [8, 9].)
3 EXPLORATORY VISUALIZATION IN IMPROVISE
Improvise is a self-contained, web-capable visualization builder andbrowser that shares many capabilities with other coordinated multi-ple view visualization systems [10, 13, 12] and toolkits [5, 7]. Usersbrowse visualizations using mouse and keyboard interactions to navi-gate multidimensional space and select data items across multiple co-ordinated views.
Improvise visualizations are build around a coordination modelcalled Live Properties that is coupled with a visual abstraction anddata processing language called Coordinated Queries. Coordinationtakes place through shared interactive parameters that determine what,how and where views display data. Multiple views are coordinatedwhenever they are connected through at least one such parameter. Co-ordinated Queries is a flexible, yet high-level visualization query lan-guage for coordinating access, processing, and rendering of multipledata sets across multiple views. Query expressions specify how tomap data attributes into graphical attributes in views. Multiple datasets can be loaded, indexed, grouped, filtered, sorted, and visually en-coded in terms of navigation and selection in and between multipleviews. The combination of Live Properties and Coordinated Queriesenables open-ended visual analysis by allowing users to design, con-struct, explore, and extend highly-coordinated visualizations of multi-ple simultaneous data sets interactively.
Improvise consists of a graphic user interface on top of a modularlibrary of visualization components (figure 2). In the user interface,designers create, layout, parameterize, and coordinate views. Buildingoccurs inside the same top-level window that contains views. Buildingis fully live, so that all design changes take effect immediately withoutthe need for a separate compilation stage. This live, amodal interfacedesign allows trained users to switch rapidly between building andbrowsing. The goal is to facilitate open-ended visual exploration andanalysis of information by close-knit teams of collaborating domainexperts and experienced visualization designers. In other words, tosupport improvisational visualization on a timescale of hours or days.
Layout Editing Query Editing Interactive Parameter Editing
!Views !Expressions !Variables
InteractionNotification
Albums Hotels
Browser UIs
Ions Elections
Build
Coordinated Queries
Views/Controls
Space (3-D)Scatterplot Table/List Graph PCP RerunsMatrix Axis Slider Checkbox
Data Access
IndexingVisualEncoding
Filtering Sorting Grouping
Algorithms
Flat Dbf +Shapefile
JDBCXML ...
...
...
Builder UI
ViewsPages Frames QueryExpressions
Data Editing
!Data
Data+ Metadata
Fig. 2. The Improvise software architecture.
Improvise has been used to build a wide variety of information visu-alizations, and has recently been extended for geovisualization of cen-sus, election, and ham radio communications involving spatial, tem-poral, and abstract data attributes. The ongoing evolution of the hotelregister visualization is one of the major successes of this effort. (Be-cause it is just one of many Improvise “documents”—all saved as reg-ular, self-contained XML files—we have not adopted a formal namefor the visualization as an independent tool. In fact, we refer to itinternally simply as “the hotels vis.”)
4 HOTELS VISUALIZATION INTERFACE
Using Improvise, we have developed a visualization of the guest reg-ister for a hotel in Rebersburg, PA from 1898-1900. The visualizationis a result of an iterative process of design, construction, testing, ex-ploration, and evaluation involving close collaboration between visu-alization researchers [Weaver, Robinson, Peuquet, MacEachren] andhistorical geographers [Fyfe, Holdsworth]. This process has resulted
WEAVER et al.: VISUAL ANALYSIS OF HISTORIC HOTEL VISITATION PATTERNS
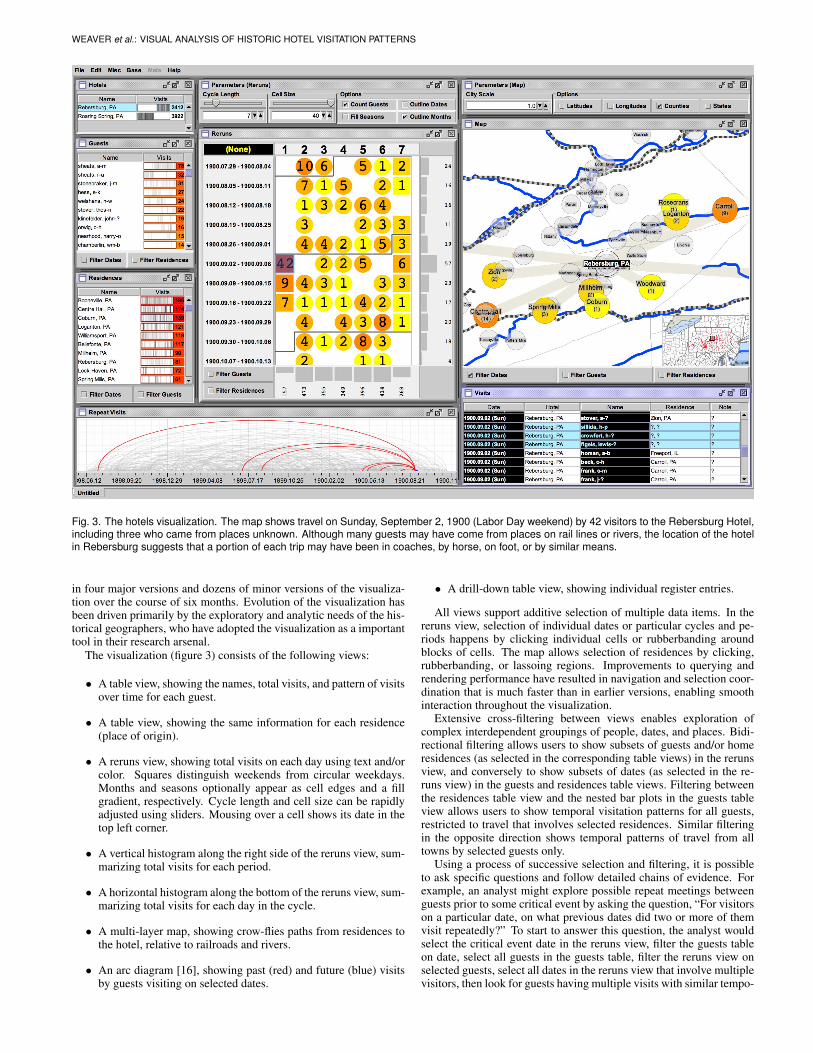
Fig. 3. The hotels visualization. The map shows travel on Sunday, September 2, 1900 (Labor Day weekend) by 42 visitors to the Rebersburg Hotel,including three who came from places unknown. Although many guests may have come from places on rail lines or rivers, the location of the hotelin Rebersburg suggests that a portion of each trip may have been in coaches, by horse, on foot, or by similar means.
in four major versions and dozens of minor versions of the visualiza-tion over the course of six months. Evolution of the visualization hasbeen driven primarily by the exploratory and analytic needs of the his-torical geographers, who have adopted the visualization as a importanttool in their research arsenal.
The visualization (figure 3) consists of the following views:
• A table view, showing the names, total visits, and pattern of visitsover time for each guest.
• A table view, showing the same information for each residence(place of origin).
• A reruns view, showing total visits on each day using text and/orcolor. Squares distinguish weekends from circular weekdays.Months and seasons optionally appear as cell edges and a fillgradient, respectively. Cycle length and cell size can be rapidlyadjusted using sliders. Mousing over a cell shows its date in thetop left corner.
• A vertical histogram along the right side of the reruns view, sum-marizing total visits for each period.
• A horizontal histogram along the bottom of the reruns view, sum-marizing total visits for each day in the cycle.
• A multi-layer map, showing crow-flies paths from residences tothe hotel, relative to railroads and rivers.
• An arc diagram [16], showing past (red) and future (blue) visitsby guests visiting on selected dates.
• A drill-down table view, showing individual register entries.
All views support additive selection of multiple data items. In thereruns view, selection of individual dates or particular cycles and pe-riods happens by clicking individual cells or rubberbanding aroundblocks of cells. The map allows selection of residences by clicking,rubberbanding, or lassoing regions. Improvements to querying andrendering performance have resulted in navigation and selection coor-dination that is much faster than in earlier versions, enabling smoothinteraction throughout the visualization.
Extensive cross-filtering between views enables exploration ofcomplex interdependent groupings of people, dates, and places. Bidi-rectional filtering allows users to show subsets of guests and/or homeresidences (as selected in the corresponding table views) in the rerunsview, and conversely to show subsets of dates (as selected in the re-runs view) in the guests and residences table views. Filtering betweenthe residences table view and the nested bar plots in the guests tableview allows users to show temporal visitation patterns for all guests,restricted to travel that involves selected residences. Similar filteringin the opposite direction shows temporal patterns of travel from alltowns by selected guests only.
Using a process of successive selection and filtering, it is possibleto ask specific questions and follow detailed chains of evidence. Forexample, an analyst might explore possible repeat meetings betweenguests prior to some critical event by asking the question, “For visitorson a particular date, on what previous dates did two or more of themvisit repeatedly?” To start to answer this question, the analyst wouldselect the critical event date in the reruns view, filter the guests tableon date, select all guests in the guests table, filter the reruns view onselected guests, select all dates in the reruns view that involve multiplevisitors, then look for guests having multiple visits with similar tempo-

IEEE TRANSACTIONS ON VISUALIZATION AND COMPUTER GRAPHICS, VOL. 12, NO. 5, SEPTEMBER/OCTOBER 2006
ral patterns in the guests view. Filtering the residences table and mapview on dates and guests during this process would provide increas-ingly specific information about travel from particular cities, possiblyrevealing overlapping origins, destinations, or paths for guests underscrutiny.
Moreover, this process can involve unknown or uncertain people,places, and times by selecting similar names, nearby residences (asindicated in the map), and preceding or following dates. The abilityto visualize uncertainty is critical for dealing with noise in the originaldata and errors in the transcription process. In the visualization, uncer-tain guest (44%) and place (14%) names are indicated with questionmarks. Uncertain portions of such names are similarly indicated (e.g.“?, PA”). Because all views can display all register entries—includinguncertain ones—it is possible to explore patterns involving unidenti-fied persons across time and space. The exception is the map view,which does depict uncertain guests from certain places but does notdepict any guests (certain or otherwise) from uncertain places. Manyinstances of possible errors in the transription process were discov-ered using the visualization itself. In particular, the ability to selectand filter on multiple guests and residences gave us a means to explorewhether similar names in fact refer to the same person or place.
5 VISUAL ANALYSIS
Visual exploration has been a key factor in the discovery of severalspatiotemporal patterns of social relationships at a time when travelwas by horse and buggy locally, or along specific railroad corridorsover longer distances. In particular, the visualization has providedsignificant evidence in support of hypotheses regarding cooperationbetween travelling merchants, the effects of weather and seasonal cli-mate variations, circuitous routes taken by salesmen, and gatheringson holidays, as well as a variety of idiosyncratic travel patterns involv-ing individuals, families, and other groups.
5.1 Organized Groups
When examining the visitation patterns of the hucksters fromBooneville, relative consistency in weekday visits for each hucksteris immediately identifiable (figure 4). Filtering the reruns view on thethree selected guests reveals alternating visits on Tuesday and Friday.Rapidly switching which of the three is selected reveals that Welshansstays on Tuesday and that Friday visits by R. A. Sheats transition toFriday visits by A. M. Sheats in March 1898. The latter is also sug-gested by per-guest charts of visits over time in the guests table view.
Hotels
Name VisitsRebersburg, PA 2412Roaring Spring, PA 3922
Residences
Filter GuestsFilter Dates
Name VisitsBooneville, PA 196Centre Hall, PA 174Coburn, PA 159Loganton, PA 121Williamsport, PA 118Bellefonte, PA 117Millheim, PA 90Rebersburg, PA 81Lock Haven, PA 72Spring Mills, PA 61
Guests
Filter ResidencesFilter Dates
Name Visitssheats, a-m 78sheats, r-a 32stonebraker, j-m 31hess, e-k 27welshans, h-w 24stover, thos-n 22klinefelder, john-? 19orwig, c-h 16nearhood, harry-o 15chamberlin, wm-b 14
Parameters (Reruns)Options
Outline DatesCount GuestsFill Seasons Outline Months
Cell Size
14
Cycle Length
21
Reruns
Filter Residences
Filter Guests
33 3133 12 935 31 4 1810 1 1
(None)
3
4
44
52353
4
4
34
44
6365465243
3333
3
2
1899.04.23 - 1899.05.13
1899.06.25 - 1899.07.15
1898.09.25 - 1898.10.151898.10.16 - 1898.11.05
1898.11.27 - 1898.12.171898.12.18 - 1899.01.071899.01.08 - 1899.01.281899.01.29 - 1899.02.181899.02.19 - 1899.03.11
1900.02.11 - 1900.03.03
1900.05.27 - 1900.06.16
1899.03.12 - 1899.04.011899.04.02 - 1899.04.22
1899.05.14 - 1899.06.031899.06.04 - 1899.06.24
1899.07.16 - 1899.08.051899.08.06 - 1899.08.261899.08.27 - 1899.09.161899.09.17 - 1899.10.071899.10.08 - 1899.10.281899.10.29 - 1899.11.181899.11.19 - 1899.12.091899.12.10 - 1899.12.301899.12.31 - 1900.01.201900.01.21 - 1900.02.10
1900.03.04 - 1900.03.241900.03.25 - 1900.04.141900.04.15 - 1900.05.051900.05.06 - 1900.05.26
1900 06 17 1900 07 07
1898.11.06 - 1898.11.26
026 13 19715 12 1211 8142 103 9 16
1
1
111
1
111
11
111
111
11
11
2
1
1
111
1 1
11
111
11
11
111
11
111
11
1
111
111
11
111
111
1 1
1 1 1
111
111
111
1 1
1 1 1
1
111
11
11
1
1
1
1
1
11
11
111
1 1
1
1
1
1
1
1
11
1
1
1
1
Fig. 4. Alternating visits on Tuesdays and Fridays by an organized groupof hucksters.
Prior to the use of the visualization, each register entry for thesevisitors had to be manually added to a calendar. In this cumbersomeprocess, the individuals’ visitation patterns could not be compared inthe context of all the other guests. In addition, the original calendardid not have the ability to change the cycle length for exploration ofdifferent cyclic temporal patterns.
5.2 Weather and Climatic EffectsFinding the regular pattern of Friday visits by A. M. Sheats promptedus to look for deviations from this routine. By setting the reruns viewto a 14-day cycle then scrolling to earlier dates, we were able to deter-mine that there were two periods when his scheduled visits were noton Fridays. It was only after the seasons option was turned on that wenoticed that the only times he did not arrive on a Friday was duringwinter months (figure 5). This has led us to believe that the weathermay have had something to do with these variations. While the exactreason for these deviations has not yet been determined, the tool hasnow guided us to examine historical climate data to test this hypoth-esis. Such records indicate that February 5-14, 1899 included “thearrival of the greatest Arctic outbreak in United States meteorologicalrecords.” [6]
Hotels
Name VisitsRebersburg, PA 2412Roaring Spring, PA 3922
Residences
Filter GuestsFilter Dates
Name VisitsBooneville, PA 196Centre Hall, PA 174Coburn, PA 159Loganton, PA 121Williamsport, PA 118Bellefonte, PA 117Millheim, PA 90Rebersburg, PA 81Lock Haven, PA 72Spring Mills, PA 61
Parameters (Reruns)Options
Outline DatesCount GuestsFill Seasons Outline Months
Cell Size
21
Cycle Length
14
Guests
Filter ResidencesFilter Dates
Name Visitssheats, a-m 78sheats, r-a 32stonebraker, j-m 31hess, e-k 27welshans, h-w 24stover, thos-n 22klinefelder, john-? 19orwig, c-h 16nearhood, harry-o 15chamberlin, wm-b 14
Reruns
Filter Residences
Filter Guests
49483 383 121 12 1
(None)
2
1
2
2
2
1
2
2
1
2
2
4
2
2
2
2
2
3
2
1899.04.16 - 1899.04.29
1898.08.21 - 1898.09.031898.09.04 - 1898.09.171898.09.18 - 1898.10.011898.10.02 - 1898.10.151898.10.16 - 1898.10.29
1898.11.27 - 1898.12.101898.12.11 - 1898.12.241898.12.25 - 1899.01.071899.01.08 - 1899.01.211899.01.22 - 1899.02.041899.02.05 - 1899.02.181899.02.19 - 1899.03.041899.03.05 - 1899.03.181899.03.19 - 1899.04.011899.04.02 - 1899.04.15
1899.04.30 - 1899.05.131899.05.14 - 1899.05.271899 05 28 1899 06 10
1365 1210 414 72 93 11
1
1111111
1
1111
11 1
1111
1 11
1111
11
1111
1
1
1
11
1 1 1
Fig. 5. Variation in regular visits due to weather. The days highlightedin the reruns view involve recorded extreme winter conditions.
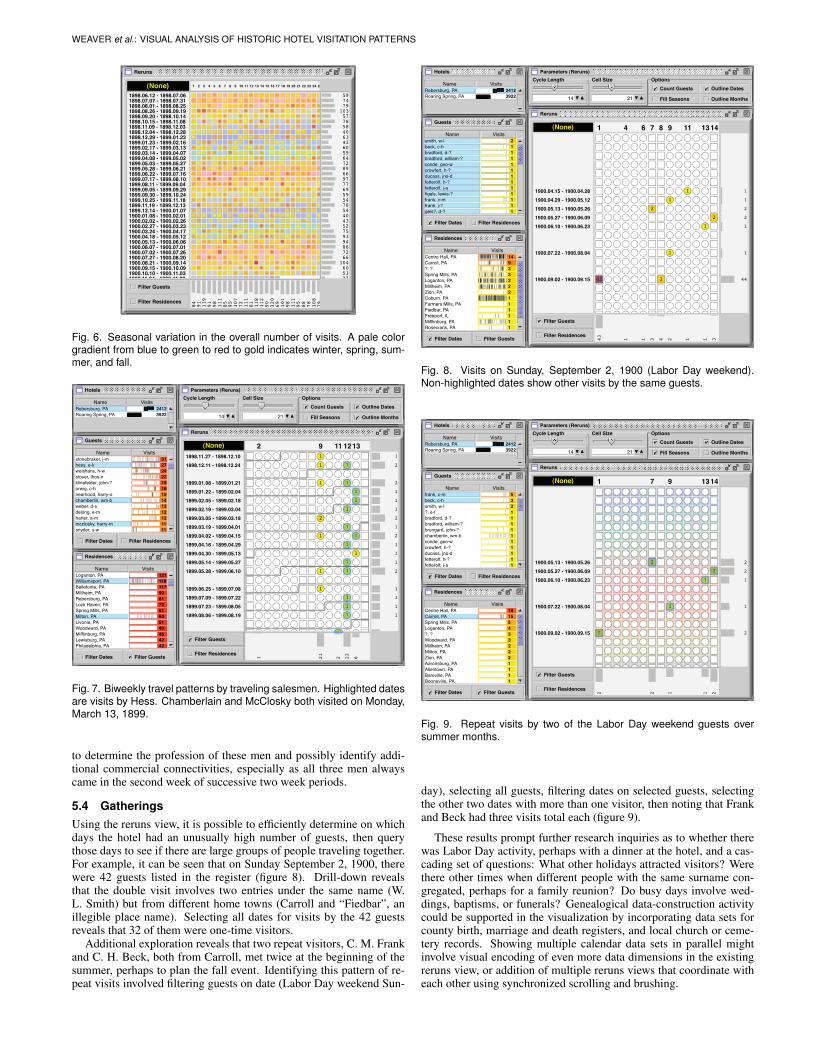
The visualization also reveals how time of year strongly correlateswith the overall number of visits, possibly due to seasonal variationsin climate that affect travel. In the vertical histogram (figure 6), totalnumber of visits is highest during the summer and lowest during thewinter, with the exception of major holidays.
5.3 Biweekly CircuitsWhile exploring the travel patterns of frequent visitors, selecting trav-eling salesman E. K. Hess of Williamsport led to the discovery of visi-tation patterns spanning multiple weeks (figure 7). Changing the cyclelength of the reruns view to 14 days reveals that Hess visits stronglycorrelate with the second Thursday in this cycle, suggesting that hevisited every other week. Perhaps more interesting is that there are sev-eral cases in which he did not return until the fourth or even sixth week,always maintaining an even number of weeks between visits. Thispattern suggests that salesmen from larger cities such as Williamsportmay have had larger circuits than those of the local hucksters, thus pre-venting them from coming every week. The visualization also showsthat two other guests, William B. Chamberlain of Milton and HarryMcClosky of Williamsport, also adhered to similar schedules, alwaysvisiting an even number of weeks after their previous visit and on thesame day of the week. This pattern prompts further research inquiries
WEAVER et al.: VISUAL ANALYSIS OF HISTORIC HOTEL VISITATION PATTERNS
Reruns
Filter Residences
Filter Guests
84 119
91 95 108
81111
95 88118
78112
98 79111
98 7291 120
90107
101
6985 111
(None)59
52
94
69
86
79
59
72
103
66
104
54
74
6343
60
6459
40
78
77
78
40
57
66
60
8972
58
43
54
7593
97
5322
1898.06.12 - 1898.07.06
1900.02.27 - 1900.03.23
1900.05.13 - 1900.06.06
1899.09.05 - 1899.09.29
1900.06.07 - 1900.07.01
1898.08.01 - 1898.08.25
1899.09.30 - 1899.10.24
1900.07.02 - 1900.07.26
1898.08.26 - 1898.09.19
1899.06.22 - 1899.07.16
1900.08.21 - 1900.09.14
1899.12.14 - 1900.01.07
1898.07.07 - 1898.07.31
1898.12.29 - 1899.01.221899.01.23 - 1899.02.16
1900.09.15 - 1900.10.09
1899.04.08 - 1899.05.021899.03.14 - 1899.04.07
1900.01.08 - 1900.02.01
1898.10.15 - 1898.11.08
1899.08.11 - 1899.09.04
1899.11.19 - 1899.12.13
1898.12.04 - 1898.12.28
1898.09.20 - 1898.10.14
1900.07.27 - 1900.08.20
1899.02.17 - 1899.03.13
1899.05.28 - 1899.06.211899.05.03 - 1899.05.27
1898.11.09 - 1898.12.03
1900.02.02 - 1900.02.26
1899.10.25 - 1899.11.18
1900.03.24 - 1900.04.171900.04.18 - 1900.05.12
1899.07.17 - 1899.08.10
1900.10.10 - 1900.11.031900 11 04 - 1900 11 28
4212431 12 2286 3231 14 19 25205 10 612 15 819 177 11
Fig. 6. Seasonal variation in the overall number of visits. A pale colorgradient from blue to green to red to gold indicates winter, spring, sum-mer, and fall.
Hotels
Name VisitsRebersburg, PA 2412Roaring Spring, PA 3922
Parameters (Reruns)Options
Outline DatesCount GuestsFill Seasons Outline Months
Cell Size
21
Cycle Length
14
Guests
Filter ResidencesFilter Dates
Name Visitsstonebraker, j-m 31hess, e-k 27welshans, h-w 24stover, thos-n 22klinefelder, john-? 19orwig, c-h 16nearhood, harry-o 15chamberlin, wm-b 14weber, d-s 13delong, e-m 12harter, a-m 12mcclosky, harry-m 11snyder, s-w 11
Reruns
Filter Residences
Filter Guests
211 6222
(None)
2
2
2
1
2
2
1
1
1
1
1
1
1
1
1
1
1
1
1899.03.05 - 1899.03.18
1899.04.02 - 1899.04.15
1899.05.28 - 1899.06.10
1899.06.25 - 1899.07.08
1898.12.11 - 1898.12.24
1899.01.08 - 1899.01.211899.01.22 - 1899.02.041899.02.05 - 1899.02.181899.02.19 - 1899.03.04
1899.03.19 - 1899.04.01
1899.04.16 - 1899.04.29
1899.05.14 - 1899.05.27
1899.07.09 - 1899.07.221899.07.23 - 1899.08.051899.08.06 - 1899.08.19
1899 09 03 1899 09 16
1898.11.27 - 1898.12.10
1899.04.30 - 1899.05.13
9 312 1211
2
1
1
1
1
111
1
1
1
11
111
1
11
1
1
1
1
111
1
11
1
11
111
1
Residences
Filter GuestsFilter Dates
Name VisitsLoganton, PA 121Williamsport, PA 118Bellefonte, PA 117Millheim, PA 90Rebersburg, PA 81Lock Haven, PA 72Spring Mills, PA 61Milton, PA 60Livonia, PA 51Woodward, PA 49Mifflinburg, PA 46Lewisburg, PA 42Philadelphia, PA 42
Fig. 7. Biweekly travel patterns by traveling salesmen. Highlighted datesare visits by Hess. Chamberlain and McClosky both visited on Monday,March 13, 1899.
to determine the profession of these men and possibly identify addi-tional commercial connectivities, especially as all three men alwayscame in the second week of successive two week periods.
5.4 GatheringsUsing the reruns view, it is possible to efficiently determine on whichdays the hotel had an unusually high number of guests, then querythose days to see if there are large groups of people traveling together.For example, it can be seen that on Sunday September 2, 1900, therewere 42 guests listed in the register (figure 8). Drill-down revealsthat the double visit involves two entries under the same name (W.L. Smith) but from different home towns (Carroll and “Fiedbar”, anillegible place name). Selecting all dates for visits by the 42 guestsreveals that 32 of them were one-time visitors.
Additional exploration reveals that two repeat visitors, C. M. Frankand C. H. Beck, both from Carroll, met twice at the beginning of thesummer, perhaps to plan the fall event. Identifying this pattern of re-peat visits involved filtering guests on date (Labor Day weekend Sun-
Hotels
Name VisitsRebersburg, PA 2412Roaring Spring, PA 3922
Guests
Filter ResidencesFilter Dates
Name Visitssmith, w-l 2beck, c-h 1bradford, d-? 1bradford, william-? 1conde, geo-w 1crowfert, h-? 1ducass, jno-d 1fetterolf, h-? 1fetterolf, j-a 1figels, lewis-? 1frank, c-m 1frank, j-? 1geis?, d-? 1
Parameters (Reruns)Options
Outline DatesCount GuestsFill Seasons Outline Months
Cell Size
21
Cycle Length
14
Reruns
Filter Residences
Filter Guests
43 3 3124 111
(None)
44
2
2
1
1
1
1
1900.09.02 - 1900.09.15
1900.05.13 - 1900.05.261900.05.27 - 1900.06.091900.06.10 - 1900.06.23
1900.07.22 - 1900.08.04
1900.04.29 - 1900.05.121900.04.15 - 1900.04.28
1 7 141398 1164
42
22
1
1
2
11
42
Residences
Filter GuestsFilter Dates
Name VisitsCentre Hall, PA 14Carroll, PA 9?, ? 3Spring Mills, PA 3Loganton, PA 2Millheim, PA 2Zion, PA 2Coburn, PA 1Farmers Mills, PA 1Fiedbar, PA 1Freeport, IL 1Mifflinburg, PA 1Rosecrans, PA 1
Fig. 8. Visits on Sunday, September 2, 1900 (Labor Day weekend).Non-highlighted dates show other visits by the same guests.
Hotels
Name VisitsRebersburg, PA 2412Roaring Spring, PA 3922
Residences
Filter GuestsFilter Dates
Name VisitsCentre Hall, PA 18Carroll, PA 15Spring Mills, PA 5Loganton, PA 4?, ? 3Woodward, PA 3Millheim, PA 2Milton, PA 2Zion, PA 2Aaronsburg, PA 1Allentown, PA 1Bareville, PA 1Booneville, PA 1
Parameters (Reruns)Options
Outline DatesCount GuestsFill Seasons Outline Months
Cell Size
21
Cycle Length
14
Reruns
Filter Residences
Filter Guests
2 22 11
(None)
2
2
2
1
1
1900.05.13 - 1900.05.261900.05.27 - 1900.06.09
1900.09.02 - 1900.09.15
1900.06.10 - 1900.06.23
1900.07.22 - 1900.08.04
7 14311 9
22
2
1
1
22
1
1
2
Guests
Filter ResidencesFilter Dates
Name Visitsfrank, c-m 5beck, c-h 3smith, w-l 2?, e-f 1bradford, d-? 1bradford, william-? 1brungard, john-? 1chamberlin, wm-b 1conde, geo-w 1crowfert, h-? 1ducass, jno-d 1fetterolf, h-? 1fetterolf, j-a 1
Fig. 9. Repeat visits by two of the Labor Day weekend guests oversummer months.
day), selecting all guests, filtering dates on selected guests, selectingthe other two dates with more than one visitor, then noting that Frankand Beck had three visits total each (figure 9).
These results prompt further research inquiries as to whether therewas Labor Day activity, perhaps with a dinner at the hotel, and a cas-cading set of questions: What other holidays attracted visitors? Werethere other times when different people with the same surname con-gregated, perhaps for a family reunion? Do busy days involve wed-dings, baptisms, or funerals? Genealogical data-construction activitycould be supported in the visualization by incorporating data sets forcounty birth, marriage and death registers, and local church or ceme-tery records. Showing multiple calendar data sets in parallel mightinvolve visual encoding of even more data dimensions in the existingreruns view, or addition of multiple reruns views that coordinate witheach other using synchronized scrolling and brushing.

IEEE TRANSACTIONS ON VISUALIZATION AND COMPUTER GRAPHICS, VOL. 12, NO. 5, SEPTEMBER/OCTOBER 2006
5.5 Interesting General RelationshipsIn addition to enabling specific discoveries, the visualization revealsgeneral relationships in the data that uphold prior observations andhypotheses. For example, we knew from transcribing that the numberof guests on weekend days was much lower than during the week, aresult reaffirmed in the horizontal histogram when showing all visitsover cycle lengths that are multiples of seven.
In another case, several different guests were registered at the ho-tel who shared the same surname, Nearhood, as the proprietor of thehotel. When querying all guests with this last name (figure 10), it ap-pears that, unlike most guests of the hotel, Nearhoods frequent the ho-tel mainly on weekends. All but three are from Centre Hall, a town tenmiles to the west, serving as another reminder that roads were unim-proved and thus places were too far away to allow for a daytime visitwithout an overnight stay.
5.6 Future QueriesResearch in historical geography is much like intelligence analysis inthe sense that it involves careful detective work to coax answers tohighly specific questions from sparse and often extremely noisy data.For instance, women appear very infrequently throughout the register.When they do appear, most often they are listed as coming with menunder the terms “and wife” or “Mr. and Mrs.” In some cases, “andlady” appears next to a guest’s name—though we never found “Mr.and Mrs. Smith”! Only eleven women registered by themselves underthe titles “Mrs.” or “Miss”. This prompts further research inquiriesconcerning where these women came from, what means and patternsof travel were involved, and whether associated males registered bythemselves on other occasions.
Some guests note when they sign the register that they are trav-eling with one or two horses (housed in the livery stable behind thehotel). This prompts further inquiries as to who these people wereand where they came from. For guests not listing a horse, how didthey arrive at the hotel? One means of transportation may have beenthe stagecoach—the block for which still sits in front of the buildingtoday–but this does not account for the lack of a horse annotation byour local hucksters (who by definition would have the goods they wereselling with them, and hence likely a wagon). Does two horses signifya freight wagon, whereas one horse implies a buggy? A search of cen-sus records for all names of people traveling with a horse might reveala specific occupational sector. The literature on hucksters suggeststhey often had a weekly circuit, only returning to their “home” placeon weekends to refill their wagon at their store. In such cases, the ob-vious question is: What hotels were frequented the night prior and thenight following their stay at the Rebersburg Hotel? In other registersbeing analyzed, notations sometimes give instructions for forwardingmail, and invariably it is to a named hotel in another town. Towardanswering these questions, we have recently added a second hotel reg-ister data set to the visualization and are currently transcribing severalmore.
6 EVALUATION
We conducted a series of formative evaluations of the visualization.These evaluations targeted two goals: to solicit ideas for improvementsand enhancements, and to evaluate the toolkit in terms of how well itsatisfies a set of precepts for the design of visualization tools.
Twelve Penn State graduate students participated in the evaluation.All were enrolled in a graduate seminar on geovisual analytics. Allbut two were enrolled for graduate studies in Geography that focus onemerging issues in GIScience. The other two students came from re-lated fields in the school of Information Science & Technology. Mem-bers of the user group possess varied knowledge of GIS systems andare familiar with research priorities for the advancement of visual an-alytics.
6.1 Distributed Usability AssessmentSoftware evaluation activities often require significant investment ofhuman and financial capital to develop and organize activities and pro-cure technology to capture data. To facilitate assessment of the ho-
Hotels
Name VisitsRebersburg, PA 2412Roaring Spring, PA 3922
Guests
Filter ResidencesFilter Dates
0Name Visitsnearhood, ?-c 1nearhood, H-? 1nearhood, e-? 5nearhood, e-L 1nearhood, e-c 8nearhood, g-e 1nearhood, geo-e 1nearhood, h-o 7nearhood, harry-? 2nearhood, harry-d 1nearhood, harry-o 15nearhood, j-d 1nelson, h-r 3
Parameters (Reruns)Options
Outline DatesCount GuestsFill Seasons Outline Months
Cell Size
21
Cycle Length
14
Residences
Filter GuestsFilter Dates
Name VisitsCentre Hall, PA 41Freeport, IL 1Rock Springs, PA 1Washington, PA 1?, ? 0?, PA 0Aaronsburg, PA 0Albertis, PA 0Albion, MI 0Alina, ? 0Alina, PA 0Allentown, PA 0Altoona, PA 0
Reruns
Filter Residences
Filter Guests
7 1 665 2 2 13 1 23 2
(None)
3
1
2
4
1
2
1
7
2
1
1899.12.10 - 1899.12.23
1900.06.24 - 1900.07.07
1900.05.13 - 1900.05.26
1899.12.24 - 1900.01.06
1900.01.21 - 1900.02.031900.02.04 - 1900.02.17
1900.03.18 - 1900.03.311900.04.01 - 1900.04.141900.04.15 - 1900.04.28
1899.10.15 - 1899.10.281 6 1487 1011 122 9 134 5
1
1
2
1 11 1 2
12
12 1 1 1 1 1
1 1
1
2
12 1 1 1 1 1
1 1
2
Fig. 10. Travel from Centre Hall by possible members of the hotel pro-prietor’s family. Nine of 15 visits by Harry O. Nearhood (highlighted)occurred sporadically over a three week period in April 1900.
tels visualization, we adapted e-Delphi, a web-based toolkit designedto support Delphi exercises. The Delphi method [4] was devised bythe RAND Corporation shortly after World War II as a way for struc-turing group decisions in a manner that ensures personality conflictsand power relationships do not taint the presentation of ideas. The e-Delphi toolkit has been used in the past in consensus building exerciseswith climate change scientists [14]. Evaluation sessions take place inan online collaboratory in which moderators can quickly initiate andlead multiple rounds of discussion and other activities. Round-basedactivities include surveys, metrics, free responses, voting, threadeddiscussions, or a mixture of these methods.
We adapted the e-Delphi toolkit as a means to support group inputto software evaluations. We did not apply the Delphi Method per se;we were not focused specifically on building a consensus among ourusers, developing a forecast, or setting policy, which are the typicaluses of the Delphi method. The toolkit allows us to conduct qualitativeevaluations via the web with little investment in time and effort byeither researchers or participants. The flexible design of the toolkitallows us to support a distributed, asynchronous, user centered designprocess.
6.2 ProcessWe conducted three rounds of evaluation using e-Delphi. In Round1, we asked users to imagine extensions to the visualization tool. InRound 2, we had users indicate their opinions on the fit of the tool toa set of design precepts. Round 3 had users discuss the responses theyprovided in Round 2.
6.2.1 Round 1We asked users to complete two short tasks to become familiar withthe capabilities of the visualization. We then asked them to respond tofour short answer questions in e-Delphi:
1. Briefly describe a scenario in which a historian might use a visu-alization tool like the one you have tested.
2. What other types of data would be interesting to examine withthe tools you used today? Why?
3. Assume your task is to design one additional visualization toolto work with the set you have used today. Describe what youwould add next and why.

WEAVER et al.: VISUAL ANALYSIS OF HISTORIC HOTEL VISITATION PATTERNS
4. Imagine you work at a newspaper and you have been given thissoftware to develop story ideas for future articles. What toolsand interactions would you need to do your job?
These questions were designed to provoke suggestions for situa-tions in which the visualization might be useful, additional kinds ofdata that might be required to tell a story using the visualization, andextensions that could be incorporated into the visualization to enhanceexploration and analysis. We asked users to avoid critiquing basic ap-pearance and behavior aspects of the visualization interface in favorof focusing attention on higher-level ideas and goals for future proto-types. Users had 90 minutes (as part of seminar class time) to completethe sample tasks and answer these prompts. We allowed users to re-turn to their responses for three days afterward in case they wished torevise their answers.
6.2.2 Round 2Amar and Stasko [1] identify six precepts that can be used to evalu-ate the design of information visualizations in terms of how well theybridge Worldview and Rationale gaps:
• Provide facilities for creating, acquiring, and transferring knowl-edge or metadata about important domain parameters within adataset. [Worldview]
• Support discovery (automated or manual) of useful correlativemodels and constraints. [Worldview]
• Support the interactive formulation and verification of user hy-potheses. [Worldview]
• Expose uncertainty in data measures and aggregations and showpossible effects of uncertainty on outcomes. [Rationale]
• Clearly present what comprises the representation of a relation-ship and present concrete outcomes when appropriate. [Ratio-nale]
• Clarify possible sources of causation. [Rationale]
In Round 2 we assessed the visualization in terms of these precepts.We asked users to indicate their level of agreement that the visualiza-tion satisfied these precepts on a five-point Likert scale. We also re-quested a short text response to provide justification for their choices.The instructions suggested that they re-examine the toolkit as neces-sary to refresh their memory. The activity took 90 minutes and weagain provided several days for revision.
6.2.3 Round 3In Round 3, we asked users to examine a major theme that we noticedin the results from Round 2: the Worldview precepts were more satis-fied by the visualization than the Rationale precepts. The instructionswere to discuss this dichotomy in terms of which things should be im-plemented next to introduce a more appropriate balance to the design.Users had another 90 minute session during class time and a few daysafterward for revision. We extended response time an additional weekto compensate for spring break.
6.3 Results6.3.1 Round 1Round 1 provided a great deal of valuable feedback on potential ex-tensions to the visualization, additional data sources, and situations inwhich it might be particularly useful. One proposed extension was theaddition of a geographically-based filtering capability, to allow the useof the map as the primary interface for selecting guest visits with abounding box over cities of interest. Another user suggested the needfor a means to help find groups of people who travelled together onthe same day, perhaps from different places and for different lengthsof stay. Several users mentioned a desire to drill down to greater detailfor each guest, to view a profile for each person. This profile would
contain personal information such as their workplace, address, birth-day, and other details. Other suggestions for additional data sourcesinclude: transportation schedules, letters and other personal communi-cation, bank transactions, hospital records, and the ability to integratethe results of Google searches for dates and names.
Users also requested sophisticated capture and annotation tools aspart of the visualization so that they could develop stories about whatthey were seeing. Suggestions for situations in which such tools mightbe useful included: tracking the impact of a major event (such as aflood or hurricane), analyzing the travel behavior of a specific individ-ual or group of people, and characterizing hotels in terms of the typesof people they typically attract.
6.3.2 Round 2The agreement between responses we received in Round 2 indicatedthat our users generally agreed that the visualization works to bridgethe three Worldview gaps to create knowledge, support discovery ofcorrelative models, and support the interactive formulation of hypothe-ses. On the other hand, users generally disagreed that it satisfies thethree Rationale gap precepts to expose uncertainty, present concreteoutcomes, and clarify causation.
The biggest weakness noted by users was the inability to expose un-certainty in data and indicate its effect on outcomes. This was the onlyprecept of the six that received all negative or neutral responses. Userspointed out that there was no explicit visual indication of uncertaintyin the data. A few noted that the only way for uncertainty to enter thepicture in the current design was if the user could infer it from priorintimate knowledge of the data.
6.3.3 Round 3Round 3 provided further clarification of the survey responses receivedin Round 2. To better expose uncertainty and show its effects on data,users suggested the creation of a visual summary for register entriesthat are incomplete or otherwise uncertain. Because the register data iscoded with question marks where names or places are uncertain, it willbe relatively easy to implement a summary table that either containsall such records or tags each record with a more obvious indication ofuncertainty.
In order to better satisfy the need to present what comprises a rela-tionship and to suggest concrete outcomes, users suggested we workfirst on clarifying the tasks that might be accomplished using the visu-alization. This request stemmed from the fact that some users were un-clear about the relationships they should be looking for, so they couldnot confidently define better ways to suggest outcomes.
To clarify causation, the visualization could provide details on de-mand for individual dates, guests, and residences. Users expected tosee ancillary information like holidays, special events, and weather inthe reruns view. In the map, the number of guests and their namescould appear as a popup when mousing over residences and paths oftravel. The guests view could provide an option to further visuallyhighlight individuals or groups using avatars to better break down pat-terns viewed in the reruns and map views.
7 CONCLUSIONS
Exploratory visualization provides a faster and more productive meansof analysis than previous methods of examining historic hotel visits.By coordinating the reruns view with map and tabular displays, thehotels visualization allows detailed and contextualized queries regard-ing cyclic temporal patterns (in days, weeks, months, and years), sea-sonal temporal patterns with corresponding climate indications, socialgrouping patterns, spatial patterns of travel from particular places orregions, and complex combinations of all of these. Although the visu-alization focuses on historical travel patterns in a specific social con-text, application to current problems of interest in the intelligence anal-ysis and emergency response communities—the behavior, movement,and communication of persons, groups, vehicles, and resources underthe influence of terrain, climate, and weather—is an obvious next step.In fact, we anticipate that guest databases for multiple modern hotels(or other nexus points in travel networks) could be incorporated into

IEEE TRANSACTIONS ON VISUALIZATION AND COMPUTER GRAPHICS, VOL. 12, NO. 5, SEPTEMBER/OCTOBER 2006
the visualization in a short time. Future plans involve increasing theusefulness of the visualization by adding historical weather recordsand railroad schedules in order to analyze actual means and paths oftravel by hotel visitors.
The e-Delphi evaluations resulted in overall positive feedback aswell as concrete suggestions for design improvements and extensionsto the visualization. As we implement these changes we will continueto solicit feedback from both domain experts and general users. Thee-Delphi toolkit allows us to quickly conduct evaluations that can berepurposed for multiple user groups with little effort on our part. Asthe visualization matures, we will transition our evaluation efforts totechniques such as verbal protocol analysis and formal focus groupscomposed of professional analysts.
By creating innovative ways of examining spatiotemporal data, thevisualization aids significantly in exploration of historical hotel regis-ter data, providing an opportunity to see travel patterns that had previ-ously gone unrecognized. Data for other hotels in other places, oncetranscribed, can be quickly incorporated, and spatiotemporal patternsand irregularities can be quickly discerned. As a result, hypothesisgeneration and testing has accelerated over the traditional techniquesutilized in historical geography. Visual analysis has led to multiplediscoveries that have triggered new thought processes and shaped newresearch questions about social connectivity relationships in rural ar-eas at the turn of the twentieth century.
ACKNOWLEDGEMENTS
Thanks to Bill Pike at the Pacific Northwest National Laboratory(PNNL) for creating e-Delphi and helping us adapt it for our evalu-ation work. Thanks also to Scott Pezanowski and Ritesh Agrawal forpreparation of the geospatial layers used in the map display.
This study was supported and monitored by the Advanced Researchand Development Activity (ARDA) and the Department of Defense.The views and conclusions contained in this document are those of theauthor(s) and should not be interpreted as necessarily representing theofficial policies or endorsements, either expressed or implied, of theNational Geospatial-Intelligence Agency or the U.S. Government.
REFERENCES
[1] R. A. Amar and J. T. Stasko. Knowledge precepts for the design and eval-uation of information visualizations. IEEE Transactions on Visualizationand Computer Graphics, 11(4):432–442, July 2005.
[2] J. V. Carlis and J. A. Konstan. Interactive visualization of serial peri-odic data. In Proceedings of User Interface Software Technology (UIST),pages 29–38, San Francisco, CA, 1998. ACM Press.
[3] H. Collections and S. C. L. Labor Archives. Rebersburg Hotel GuestRegister, Rebersburg, PA, 1898-1900. The Pennsylvania State UniversityLibraries, University Park, PA.
[4] N. C. Dalkey. The Delphi method: An experimental study on group opin-ion. Technical Report RM-5888-PR, The Rand Corporation, 1969.
[5] J.-D. Fekete. The infovis toolkit. In Proceedings of the IEEE Symposiumon Information Visualization, pages 167–174, Austin, TX, October 2004.IEEE.
[6] B. Gelber. Pocono Weather. Uriel Publishing, December 1992.[7] J. Heer, S. K. Card, and J. A. Landay. prefuse: A toolkit for interactive
information visualization. In Proceedings of CHI, Portland, OR, April2005. ACM.
[8] D. W. Holdsworth. Historical geography: New ways of imaging andseeing the past. Progress in Human Geography, 27(4):486–493, 2003.
[9] A. K. Knowles, editor. Past Time, Past Place: GIS for History. ESRIPress, Redlands, CA, 2002.
[10] M. Livny, R. Ramakrishnan, K. Beyer, G. Chen, D. Donjerkovic,S. Lawande, J. Myllymaki, and K. Wenger. DEVise: Integrated queryingand visualization of large datasets. In Proceedings of SIGMOD, pages301–312, Tucson, AZ, 1997. ACM.
[11] A. M. MacEachren, M. Gahegan, W. Pike, I. Brewer, G. Cai,E. Lengerich, and F. Hardisty. Geovisualization for knowledge construc-tion and decision support. IEEE Computer Graphics and Applications,24(1):13–17, January 2004.
[12] C. North and B. Shneiderman. Snap-together visualization: A user in-terface for coordinating visualizations via relational schemata. In Pro-
ceedings of the Working Conference on Advanced Visual Interfaces (AVI),pages 128–135, New York, NY, USA, May 2000. ACM Press.
[13] C. Olston, M. Stonebraker, A. Aiken, and J. M. Hellerstein. VIQING: Vi-sual Interactive QueryING. In Proceedings of the 14th IEEE Symposiumon Visual Languages, Halifax, Nova Scotia, Canada, September 1998.IEEE.
[14] W. Pike, B. Yarnal, A. M. MacEachren, M. Gahegan, and C. Yu. Infras-tructure for human-environment collaboration: Building a prototype forthe future of science. Environment, 47(2):8–21, 2005.
[15] J. J. Thomas and K. A. Cook, editors. Illuminating the Path: The Re-search and Development Agenda for Visual Analytics. IEEE ComputerSociety, August 2005.
[16] M. Wattenberg. Arc diagrams: Visualizing structure in strings. In Pro-ceedings of the IEEE Symposium on Information Visualization, pages110–116, Boston, MA, October 2002. IEEE.
[17] C. Weaver. Building highly-coordinated visualizations in Improvise. InProceedings of the IEEE Symposium on Information Visualization, pages159–166, Austin, TX, October 2004. IEEE.
[18] A. T. Winfree. When Time Breaks Down: The Three-Dimensional Dy-namics of Electrochemical Waves and Cardiac Arrhythmias. PrincetonUniv Press, October 1987.