Gateways The Civic Gateway The Learning Gateway The Environmental Gateway The Information Gateway
VisIVO Science Gateway: a CollaborativeEnvironment for the Astrophysics Community
Eva Sciacca ∗, Marilena Bandieramonte ∗‡, Ugo Becciani ∗, Alessandro Costa ∗, Mel Krokos †, Piero Massimino ∗,Catia Petta ‡, Costantino Pistagna ∗, Simone Riggi ∗ and Fabio Vitello ∗
∗ INAF-Osservatorio Astrofisico di Catania, Italy† University of Portsmouth, United Kingdom
‡ Dipartimento di Fisica e Astronomia, Universita di Catania, ItalyEmail: [email protected]
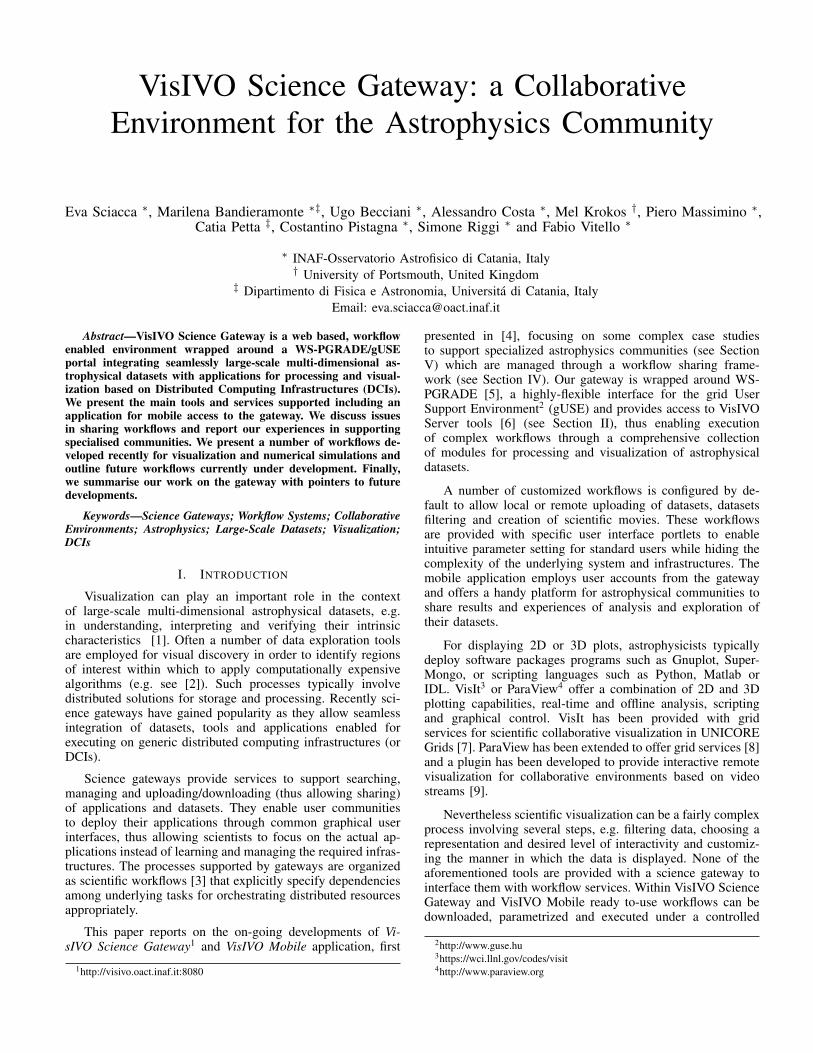
Abstract—VisIVO Science Gateway is a web based, workflowenabled environment wrapped around a WS-PGRADE/gUSEportal integrating seamlessly large-scale multi-dimensional as-trophysical datasets with applications for processing and visual-ization based on Distributed Computing Infrastructures (DCIs).We present the main tools and services supported including anapplication for mobile access to the gateway. We discuss issuesin sharing workflows and report our experiences in supportingspecialised communities. We present a number of workflows de-veloped recently for visualization and numerical simulations andoutline future workflows currently under development. Finally,we summarise our work on the gateway with pointers to futuredevelopments.
Keywords—Science Gateways; Workflow Systems; CollaborativeEnvironments; Astrophysics; Large-Scale Datasets; Visualization;DCIs
I. INTRODUCTION
Visualization can play an important role in the contextof large-scale multi-dimensional astrophysical datasets, e.g.in understanding, interpreting and verifying their intrinsiccharacteristics [1]. Often a number of data exploration toolsare employed for visual discovery in order to identify regionsof interest within which to apply computationally expensivealgorithms (e.g. see [2]). Such processes typically involvedistributed solutions for storage and processing. Recently sci-ence gateways have gained popularity as they allow seamlessintegration of datasets, tools and applications enabled forexecuting on generic distributed computing infrastructures (orDCIs).
Science gateways provide services to support searching,managing and uploading/downloading (thus allowing sharing)of applications and datasets. They enable user communitiesto deploy their applications through common graphical userinterfaces, thus allowing scientists to focus on the actual ap-plications instead of learning and managing the required infras-tructures. The processes supported by gateways are organizedas scientific workflows [3] that explicitly specify dependenciesamong underlying tasks for orchestrating distributed resourcesappropriately.
This paper reports on the on-going developments of Vi-sIVO Science Gateway1 and VisIVO Mobile application, first
1http://visivo.oact.inaf.it:8080
presented in [4], focusing on some complex case studiesto support specialized astrophysics communities (see SectionV) which are managed through a workflow sharing frame-work (see Section IV). Our gateway is wrapped around WS-PGRADE [5], a highly-flexible interface for the grid UserSupport Environment2 (gUSE) and provides access to VisIVOServer tools [6] (see Section II), thus enabling executionof complex workflows through a comprehensive collectionof modules for processing and visualization of astrophysicaldatasets.
A number of customized workflows is configured by de-fault to allow local or remote uploading of datasets, datasetsfiltering and creation of scientific movies. These workflowsare provided with specific user interface portlets to enableintuitive parameter setting for standard users while hiding thecomplexity of the underlying system and infrastructures. Themobile application employs user accounts from the gatewayand offers a handy platform for astrophysical communities toshare results and experiences of analysis and exploration oftheir datasets.
For displaying 2D or 3D plots, astrophysicists typicallydeploy software packages programs such as Gnuplot, Super-Mongo, or scripting languages such as Python, Matlab orIDL. VisIt3 or ParaView4 offer a combination of 2D and 3Dplotting capabilities, real-time and offline analysis, scriptingand graphical control. VisIt has been provided with gridservices for scientific collaborative visualization in UNICOREGrids [7]. ParaView has been extended to offer grid services [8]and a plugin has been developed to provide interactive remotevisualization for collaborative environments based on videostreams [9].
Nevertheless scientific visualization can be a fairly complexprocess involving several steps, e.g. filtering data, choosing arepresentation and desired level of interactivity and customiz-ing the manner in which the data is displayed. None of theaforementioned tools are provided with a science gateway tointerface them with workflow services. Within VisIVO ScienceGateway and VisIVO Mobile ready to-use workflows can bedownloaded, parametrized and executed under a controlled
2http://www.guse.hu3https://wci.llnl.gov/codes/visit4http://www.paraview.org
environment. The visualization and filtering parameters canbe chosen interactively and the workflow configuration andsubmission to DCIs is performed without exposing technicaldetails so that end users can focus on their applications insteadof devoting efforts in learning and managing the underlyinginfrastructures.
II. VISUALIZATION TOOLS
VisIVO [6] is an integrated suite of tools and servicesfor effective visual discovery within large-scale astrophysicaldatasets. VisIVO is realised as:
• VisIVO Desktop [10], a stand alone application forinteractive visualizations running on standard PCs;
• VisIVO Server, a grid-enabled high performance visu-alization platform, and
• VisIVO Library [11] developed specifically to portVisIVO Server on gLite middleware5.
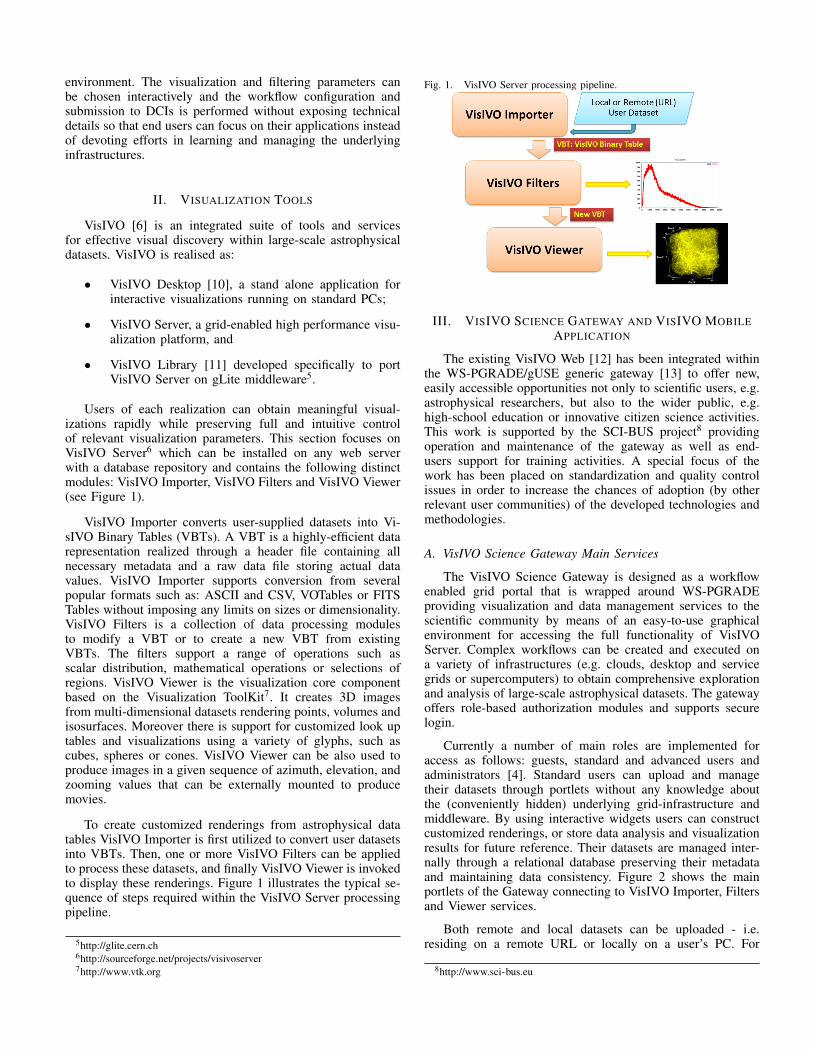
Users of each realization can obtain meaningful visual-izations rapidly while preserving full and intuitive controlof relevant visualization parameters. This section focuses onVisIVO Server6 which can be installed on any web serverwith a database repository and contains the following distinctmodules: VisIVO Importer, VisIVO Filters and VisIVO Viewer(see Figure 1).
VisIVO Importer converts user-supplied datasets into Vi-sIVO Binary Tables (VBTs). A VBT is a highly-efficient datarepresentation realized through a header file containing allnecessary metadata and a raw data file storing actual datavalues. VisIVO Importer supports conversion from severalpopular formats such as: ASCII and CSV, VOTables or FITSTables without imposing any limits on sizes or dimensionality.VisIVO Filters is a collection of data processing modulesto modify a VBT or to create a new VBT from existingVBTs. The filters support a range of operations such asscalar distribution, mathematical operations or selections ofregions. VisIVO Viewer is the visualization core componentbased on the Visualization ToolKit7. It creates 3D imagesfrom multi-dimensional datasets rendering points, volumes andisosurfaces. Moreover there is support for customized look uptables and visualizations using a variety of glyphs, such ascubes, spheres or cones. VisIVO Viewer can be also used toproduce images in a given sequence of azimuth, elevation, andzooming values that can be externally mounted to producemovies.
To create customized renderings from astrophysical datatables VisIVO Importer is first utilized to convert user datasetsinto VBTs. Then, one or more VisIVO Filters can be appliedto process these datasets, and finally VisIVO Viewer is invokedto display these renderings. Figure 1 illustrates the typical se-quence of steps required within the VisIVO Server processingpipeline.
5http://glite.cern.ch6http://sourceforge.net/projects/visivoserver7http://www.vtk.org
Fig. 1. VisIVO Server processing pipeline.
III. VISIVO SCIENCE GATEWAY AND VISIVO MOBILEAPPLICATION
The existing VisIVO Web [12] has been integrated withinthe WS-PGRADE/gUSE generic gateway [13] to offer new,easily accessible opportunities not only to scientific users, e.g.astrophysical researchers, but also to the wider public, e.g.high-school education or innovative citizen science activities.This work is supported by the SCI-BUS project8 providingoperation and maintenance of the gateway as well as end-users support for training activities. A special focus of thework has been placed on standardization and quality controlissues in order to increase the chances of adoption (by otherrelevant user communities) of the developed technologies andmethodologies.
A. VisIVO Science Gateway Main Services
The VisIVO Science Gateway is designed as a workflowenabled grid portal that is wrapped around WS-PGRADEproviding visualization and data management services to thescientific community by means of an easy-to-use graphicalenvironment for accessing the full functionality of VisIVOServer. Complex workflows can be created and executed ona variety of infrastructures (e.g. clouds, desktop and servicegrids or supercomputers) to obtain comprehensive explorationand analysis of large-scale astrophysical datasets. The gatewayoffers role-based authorization modules and supports securelogin.
Currently a number of main roles are implemented foraccess as follows: guests, standard and advanced users andadministrators [4]. Standard users can upload and managetheir datasets through portlets without any knowledge aboutthe (conveniently hidden) underlying grid-infrastructure andmiddleware. By using interactive widgets users can constructcustomized renderings, or store data analysis and visualizationresults for future reference. Their datasets are managed inter-nally through a relational database preserving their metadataand maintaining data consistency. Figure 2 shows the mainportlets of the Gateway connecting to VisIVO Importer, Filtersand Viewer services.
Both remote and local datasets can be uploaded - i.e.residing on a remote URL or locally on a user’s PC. For
8http://www.sci-bus.eu
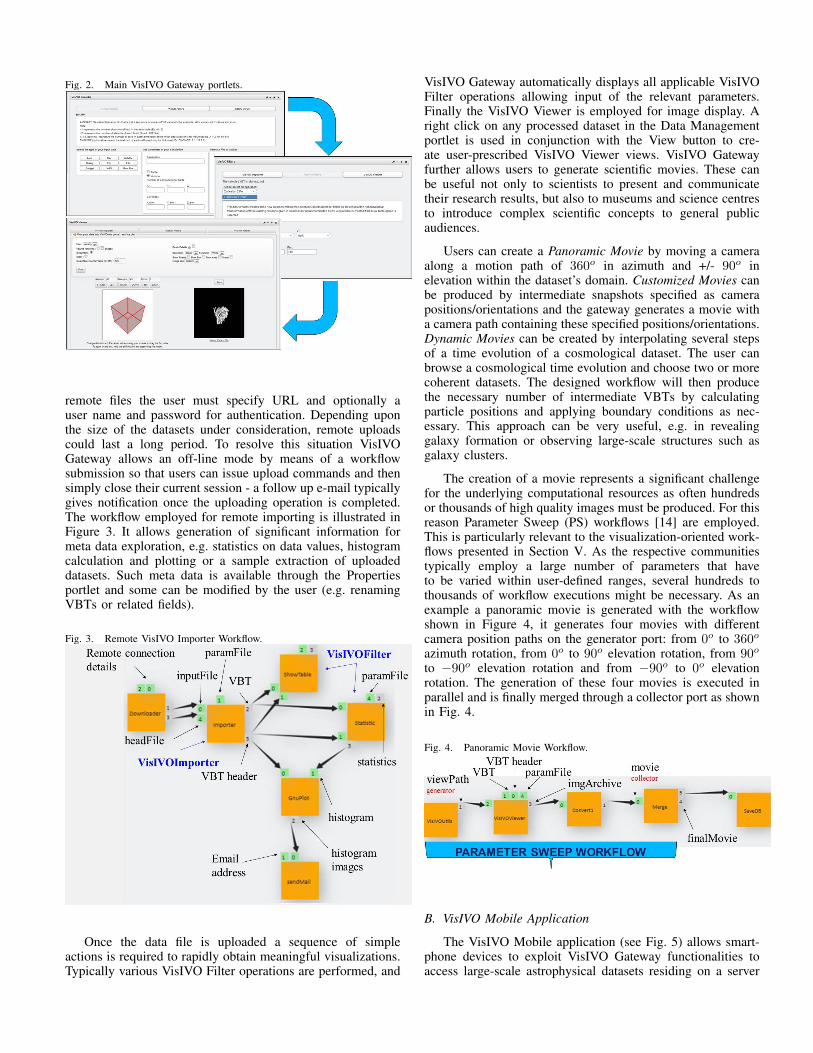
Fig. 2. Main VisIVO Gateway portlets.
remote files the user must specify URL and optionally auser name and password for authentication. Depending uponthe size of the datasets under consideration, remote uploadscould last a long period. To resolve this situation VisIVOGateway allows an off-line mode by means of a workflowsubmission so that users can issue upload commands and thensimply close their current session - a follow up e-mail typicallygives notification once the uploading operation is completed.The workflow employed for remote importing is illustrated inFigure 3. It allows generation of significant information formeta data exploration, e.g. statistics on data values, histogramcalculation and plotting or a sample extraction of uploadeddatasets. Such meta data is available through the Propertiesportlet and some can be modified by the user (e.g. renamingVBTs or related fields).
Fig. 3. Remote VisIVO Importer Workflow.
Once the data file is uploaded a sequence of simpleactions is required to rapidly obtain meaningful visualizations.Typically various VisIVO Filter operations are performed, and
VisIVO Gateway automatically displays all applicable VisIVOFilter operations allowing input of the relevant parameters.Finally the VisIVO Viewer is employed for image display. Aright click on any processed dataset in the Data Managementportlet is used in conjunction with the View button to cre-ate user-prescribed VisIVO Viewer views. VisIVO Gatewayfurther allows users to generate scientific movies. These canbe useful not only to scientists to present and communicatetheir research results, but also to museums and science centresto introduce complex scientific concepts to general publicaudiences.
Users can create a Panoramic Movie by moving a cameraalong a motion path of 360o in azimuth and +/- 90o inelevation within the dataset’s domain. Customized Movies canbe produced by intermediate snapshots specified as camerapositions/orientations and the gateway generates a movie witha camera path containing these specified positions/orientations.Dynamic Movies can be created by interpolating several stepsof a time evolution of a cosmological dataset. The user canbrowse a cosmological time evolution and choose two or morecoherent datasets. The designed workflow will then producethe necessary number of intermediate VBTs by calculatingparticle positions and applying boundary conditions as nec-essary. This approach can be very useful, e.g. in revealinggalaxy formation or observing large-scale structures such asgalaxy clusters.
The creation of a movie represents a significant challengefor the underlying computational resources as often hundredsor thousands of high quality images must be produced. For thisreason Parameter Sweep (PS) workflows [14] are employed.This is particularly relevant to the visualization-oriented work-flows presented in Section V. As the respective communitiestypically employ a large number of parameters that haveto be varied within user-defined ranges, several hundreds tothousands of workflow executions might be necessary. As anexample a panoramic movie is generated with the workflowshown in Figure 4, it generates four movies with differentcamera position paths on the generator port: from 0o to 360o
azimuth rotation, from 0o to 90o elevation rotation, from 90o
to −90o elevation rotation and from −90o to 0o elevationrotation. The generation of these four movies is executed inparallel and is finally merged through a collector port as shownin Fig. 4.
Fig. 4. Panoramic Movie Workflow.
B. VisIVO Mobile Application
The VisIVO Mobile application (see Fig. 5) allows smart-phone devices to exploit VisIVO Gateway functionalities toaccess large-scale astrophysical datasets residing on a server
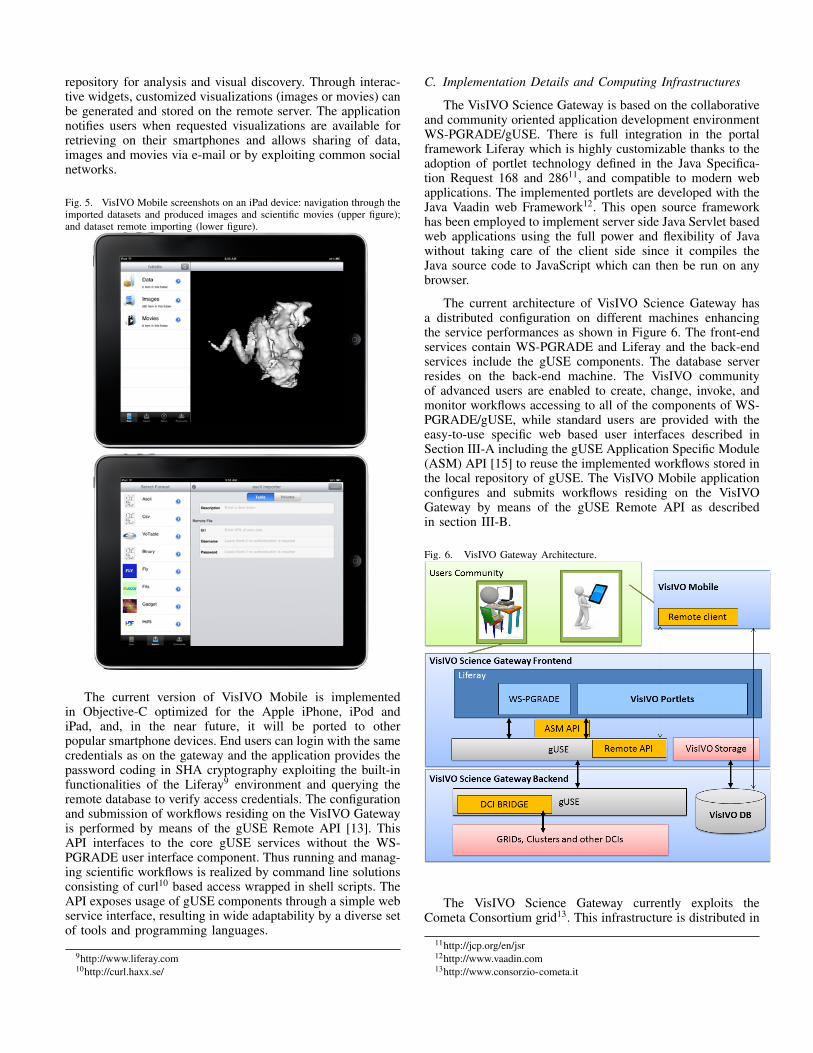
repository for analysis and visual discovery. Through interac-tive widgets, customized visualizations (images or movies) canbe generated and stored on the remote server. The applicationnotifies users when requested visualizations are available forretrieving on their smartphones and allows sharing of data,images and movies via e-mail or by exploiting common socialnetworks.
Fig. 5. VisIVO Mobile screenshots on an iPad device: navigation through theimported datasets and produced images and scientific movies (upper figure);and dataset remote importing (lower figure).
The current version of VisIVO Mobile is implementedin Objective-C optimized for the Apple iPhone, iPod andiPad, and, in the near future, it will be ported to otherpopular smartphone devices. End users can login with the samecredentials as on the gateway and the application provides thepassword coding in SHA cryptography exploiting the built-infunctionalities of the Liferay9 environment and querying theremote database to verify access credentials. The configurationand submission of workflows residing on the VisIVO Gatewayis performed by means of the gUSE Remote API [13]. ThisAPI interfaces to the core gUSE services without the WS-PGRADE user interface component. Thus running and manag-ing scientific workflows is realized by command line solutionsconsisting of curl10 based access wrapped in shell scripts. TheAPI exposes usage of gUSE components through a simple webservice interface, resulting in wide adaptability by a diverse setof tools and programming languages.
9http://www.liferay.com10http://curl.haxx.se/
C. Implementation Details and Computing Infrastructures
The VisIVO Science Gateway is based on the collaborativeand community oriented application development environmentWS-PGRADE/gUSE. There is full integration in the portalframework Liferay which is highly customizable thanks to theadoption of portlet technology defined in the Java Specifica-tion Request 168 and 28611, and compatible to modern webapplications. The implemented portlets are developed with theJava Vaadin web Framework12. This open source frameworkhas been employed to implement server side Java Servlet basedweb applications using the full power and flexibility of Javawithout taking care of the client side since it compiles theJava source code to JavaScript which can then be run on anybrowser.
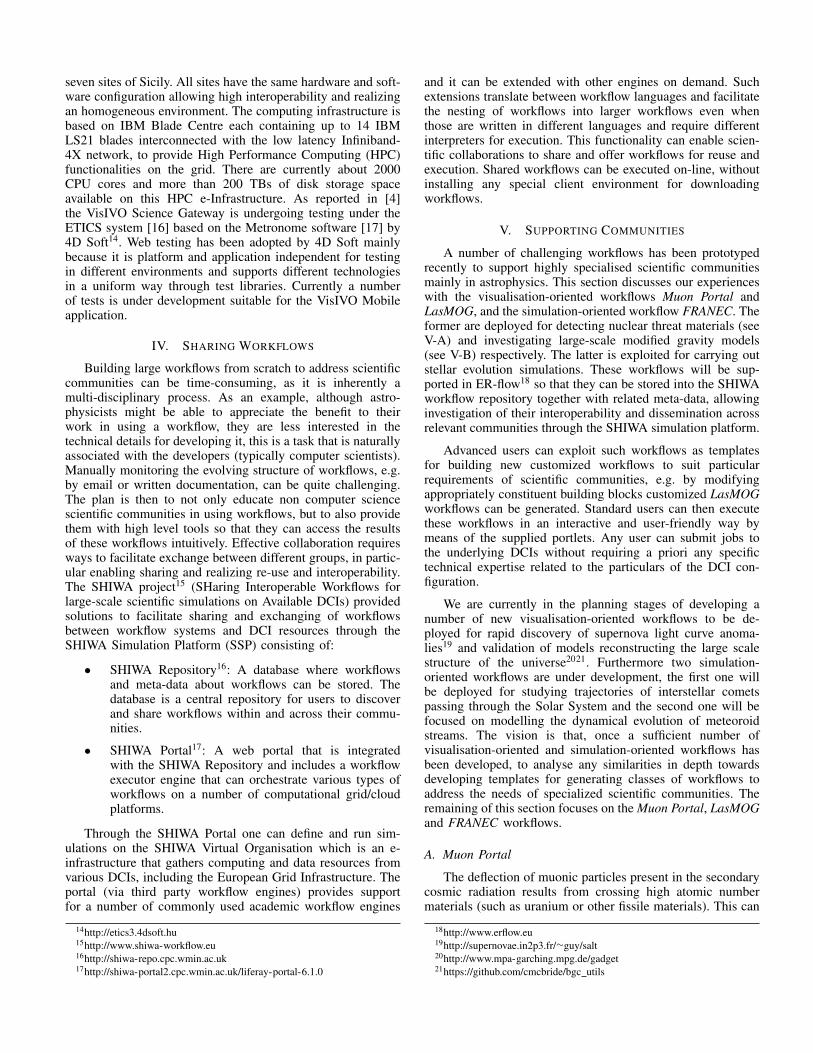
The current architecture of VisIVO Science Gateway hasa distributed configuration on different machines enhancingthe service performances as shown in Figure 6. The front-endservices contain WS-PGRADE and Liferay and the back-endservices include the gUSE components. The database serverresides on the back-end machine. The VisIVO communityof advanced users are enabled to create, change, invoke, andmonitor workflows accessing to all of the components of WS-PGRADE/gUSE, while standard users are provided with theeasy-to-use specific web based user interfaces described inSection III-A including the gUSE Application Specific Module(ASM) API [15] to reuse the implemented workflows stored inthe local repository of gUSE. The VisIVO Mobile applicationconfigures and submits workflows residing on the VisIVOGateway by means of the gUSE Remote API as describedin section III-B.
Fig. 6. VisIVO Gateway Architecture.
The VisIVO Science Gateway currently exploits theCometa Consortium grid13. This infrastructure is distributed in
11http://jcp.org/en/jsr12http://www.vaadin.com13http://www.consorzio-cometa.it
seven sites of Sicily. All sites have the same hardware and soft-ware configuration allowing high interoperability and realizingan homogeneous environment. The computing infrastructure isbased on IBM Blade Centre each containing up to 14 IBMLS21 blades interconnected with the low latency Infiniband-4X network, to provide High Performance Computing (HPC)functionalities on the grid. There are currently about 2000CPU cores and more than 200 TBs of disk storage spaceavailable on this HPC e-Infrastructure. As reported in [4]the VisIVO Science Gateway is undergoing testing under theETICS system [16] based on the Metronome software [17] by4D Soft14. Web testing has been adopted by 4D Soft mainlybecause it is platform and application independent for testingin different environments and supports different technologiesin a uniform way through test libraries. Currently a numberof tests is under development suitable for the VisIVO Mobileapplication.
IV. SHARING WORKFLOWS
Building large workflows from scratch to address scientificcommunities can be time-consuming, as it is inherently amulti-disciplinary process. As an example, although astro-physicists might be able to appreciate the benefit to theirwork in using a workflow, they are less interested in thetechnical details for developing it, this is a task that is naturallyassociated with the developers (typically computer scientists).Manually monitoring the evolving structure of workflows, e.g.by email or written documentation, can be quite challenging.The plan is then to not only educate non computer sciencescientific communities in using workflows, but to also providethem with high level tools so that they can access the resultsof these workflows intuitively. Effective collaboration requiresways to facilitate exchange between different groups, in partic-ular enabling sharing and realizing re-use and interoperability.The SHIWA project15 (SHaring Interoperable Workflows forlarge-scale scientific simulations on Available DCIs) providedsolutions to facilitate sharing and exchanging of workflowsbetween workflow systems and DCI resources through theSHIWA Simulation Platform (SSP) consisting of:
• SHIWA Repository16: A database where workflowsand meta-data about workflows can be stored. Thedatabase is a central repository for users to discoverand share workflows within and across their commu-nities.
• SHIWA Portal17: A web portal that is integratedwith the SHIWA Repository and includes a workflowexecutor engine that can orchestrate various types ofworkflows on a number of computational grid/cloudplatforms.
Through the SHIWA Portal one can define and run sim-ulations on the SHIWA Virtual Organisation which is an e-infrastructure that gathers computing and data resources fromvarious DCIs, including the European Grid Infrastructure. Theportal (via third party workflow engines) provides supportfor a number of commonly used academic workflow engines
14http://etics3.4dsoft.hu15http://www.shiwa-workflow.eu16http://shiwa-repo.cpc.wmin.ac.uk17http://shiwa-portal2.cpc.wmin.ac.uk/liferay-portal-6.1.0
and it can be extended with other engines on demand. Suchextensions translate between workflow languages and facilitatethe nesting of workflows into larger workflows even whenthose are written in different languages and require differentinterpreters for execution. This functionality can enable scien-tific collaborations to share and offer workflows for reuse andexecution. Shared workflows can be executed on-line, withoutinstalling any special client environment for downloadingworkflows.
V. SUPPORTING COMMUNITIES
A number of challenging workflows has been prototypedrecently to support highly specialised scientific communitiesmainly in astrophysics. This section discusses our experienceswith the visualisation-oriented workflows Muon Portal andLasMOG, and the simulation-oriented workflow FRANEC. Theformer are deployed for detecting nuclear threat materials (seeV-A) and investigating large-scale modified gravity models(see V-B) respectively. The latter is exploited for carrying outstellar evolution simulations. These workflows will be sup-ported in ER-flow18 so that they can be stored into the SHIWAworkflow repository together with related meta-data, allowinginvestigation of their interoperability and dissemination acrossrelevant communities through the SHIWA simulation platform.
Advanced users can exploit such workflows as templatesfor building new customized workflows to suit particularrequirements of scientific communities, e.g. by modifyingappropriately constituent building blocks customized LasMOGworkflows can be generated. Standard users can then executethese workflows in an interactive and user-friendly way bymeans of the supplied portlets. Any user can submit jobs tothe underlying DCIs without requiring a priori any specifictechnical expertise related to the particulars of the DCI con-figuration.
We are currently in the planning stages of developing anumber of new visualisation-oriented workflows to be de-ployed for rapid discovery of supernova light curve anoma-lies19 and validation of models reconstructing the large scalestructure of the universe2021. Furthermore two simulation-oriented workflows are under development, the first one willbe deployed for studying trajectories of interstellar cometspassing through the Solar System and the second one will befocused on modelling the dynamical evolution of meteoroidstreams. The vision is that, once a sufficient number ofvisualisation-oriented and simulation-oriented workflows hasbeen developed, to analyse any similarities in depth towardsdeveloping templates for generating classes of workflows toaddress the needs of specialized scientific communities. Theremaining of this section focuses on the Muon Portal, LasMOGand FRANEC workflows.
A. Muon Portal
The deflection of muonic particles present in the secondarycosmic radiation results from crossing high atomic numbermaterials (such as uranium or other fissile materials). This can
18http://www.erflow.eu19http://supernovae.in2p3.fr/∼guy/salt20http://www.mpa-garching.mpg.de/gadget21https://github.com/cmcbride/bgc utils

significantly improve on the success rate of current nuclearthreat detection methods which are based on X-ray scan-ners [18], especially in terms of capacity for identificationand location of illicit materials inside cargo containers, evenconsidering the possibility of screens designed to mask theirexistence [19].
We have developed a visualisation-oriented workflow suit-able for inspection of cargo containers carrying high atomicnumber materials, by displaying tomographic images [20].Preliminary results of this workflow have been reported in [4].The datasets containing coordinates of the muon tracker planesare first uploaded to our gateway and filtered by using thePoint of Closest Approach (POCA) algorithm [21] to createa representation containing the scattering deflection of cosmicradiations. The result is then visualized using point rendering.
Further processing is then applied based on user-definedthresholds, followed by conversion into data volumes using thedeflection angle field distribution by employing the 3D Cloud-in-Cell (CIC) [22] smoothing algorithm. Finally, a tomographyis performed for inspection. Figure 7 shows the most recentdevelopment and results of the entire computational processstarting from: a) parameter setting through the supplied portlet,then b) submitting the implemented workflow, and finally c)outputting resulting images obtained using isosurface render-ing for the filtered (top image) and raw (bottom image) datasetsrespectively.
Fig. 7. Muon Portal processing: portlet interface, workflow and selectedresults.
B. LasMOG
The acceleration of the Universe is one of the most chal-lenging problems in cosmology. In the framework of generalrelativity (GR), the acceleration originates from dark energy.However, to explain the current acceleration of the Universe,the required value of dark energy must be incredibly small.Recently efforts have been made to construct models for
modified gravity (i.e. without introducing dark energy) as analternative to dark energy models [23].
Observing the large scale structure of the universe couldin principle provide new test of GR on cosmic scales. Thiskind of test cannot be done without the help of simulations asthe structure formation process is highly non-linear. Large-scale simulations are thus performed for modified gravitymodels, e.g. from the Large Simulation for Modified Gravity(LaSMoG) consortium.
Fig. 8. LasMOG processing: portlet interface, workflow and selected results.
The workflow shown in Figure 8 implements a customisedvisualization for aiding analysis of modified GR simulations,more specifically inspecting datasets to discover anomalies bycomparing appropriately with datasets coming from standardGR models. The main computational steps are summarised asfollows:
• Two datasets corresponding to snapshots of standardgravity (DS) and modified gravity (DM ) model sim-ulations are processed.
• Sub-samples of the point distributions with a reducednumber of points in the two datasets are generated.Then, for each of these sub-samples a panoramicmovie is created (as shown in the resulting top imageof Figure 8).
• A point distribute operation is performed on DS andDM to create new volume datasets (VS and VM
respectively) using a field distribution algorithm ona regular mesh.
• A volume property on the same computational domainis distributed on a regular mesh producing a densityfield.
• A new volume V∆ is computed where each of itsvoxels shows a difference of values in the densitybetween VS and VM . It is then filtered with a lowerbound threshold and all the voxels satisfying the filters
are saved in a text file for further analysis purposes(as shown in the resulting bottom image of Figure 8).
• Several renderings of V∆ are performed:◦ Volume rendering;◦ Isosurface rendering of the density field to
produce panoramic movies using different iso-values (as shown in the resulting bottom imageof Figure 8);
◦ Ortho-slice rendering i.e. orthogonal sliceplanes through the volume dataset.
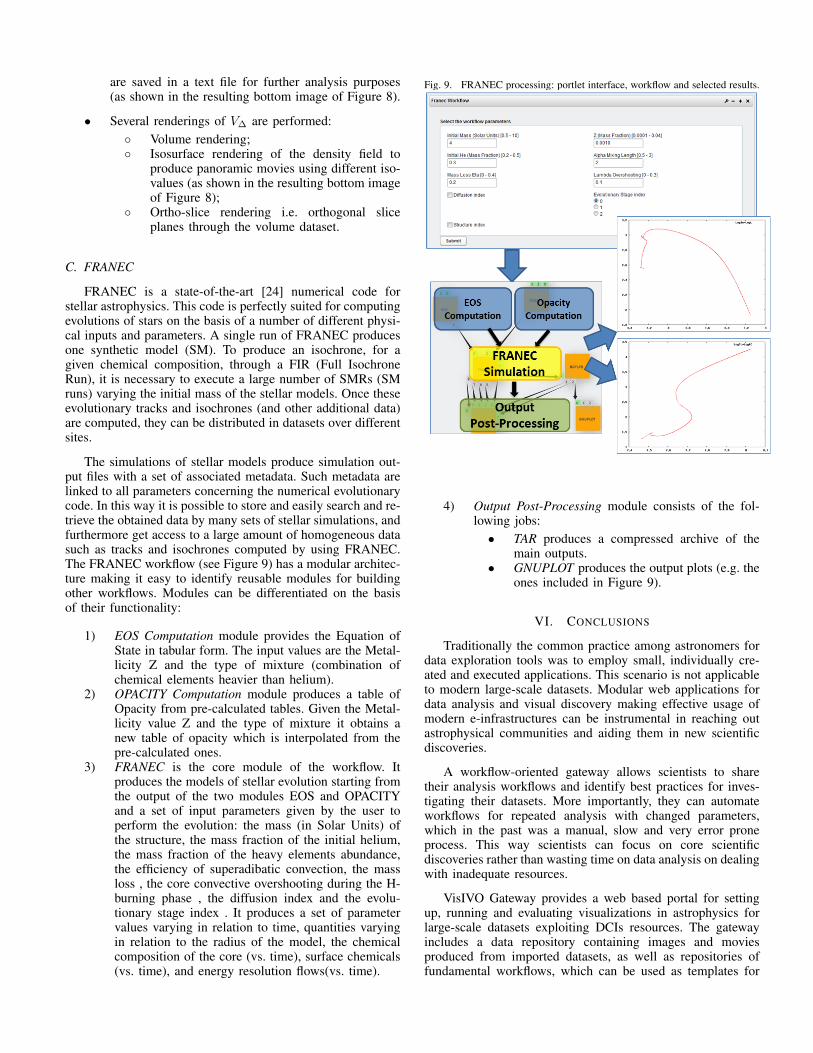
C. FRANEC
FRANEC is a state-of-the-art [24] numerical code forstellar astrophysics. This code is perfectly suited for computingevolutions of stars on the basis of a number of different physi-cal inputs and parameters. A single run of FRANEC producesone synthetic model (SM). To produce an isochrone, for agiven chemical composition, through a FIR (Full IsochroneRun), it is necessary to execute a large number of SMRs (SMruns) varying the initial mass of the stellar models. Once theseevolutionary tracks and isochrones (and other additional data)are computed, they can be distributed in datasets over differentsites.
The simulations of stellar models produce simulation out-put files with a set of associated metadata. Such metadata arelinked to all parameters concerning the numerical evolutionarycode. In this way it is possible to store and easily search and re-trieve the obtained data by many sets of stellar simulations, andfurthermore get access to a large amount of homogeneous datasuch as tracks and isochrones computed by using FRANEC.The FRANEC workflow (see Figure 9) has a modular architec-ture making it easy to identify reusable modules for buildingother workflows. Modules can be differentiated on the basisof their functionality:
1) EOS Computation module provides the Equation ofState in tabular form. The input values are the Metal-licity Z and the type of mixture (combination ofchemical elements heavier than helium).
2) OPACITY Computation module produces a table ofOpacity from pre-calculated tables. Given the Metal-licity value Z and the type of mixture it obtains anew table of opacity which is interpolated from thepre-calculated ones.
3) FRANEC is the core module of the workflow. Itproduces the models of stellar evolution starting fromthe output of the two modules EOS and OPACITYand a set of input parameters given by the user toperform the evolution: the mass (in Solar Units) ofthe structure, the mass fraction of the initial helium,the mass fraction of the heavy elements abundance,the efficiency of superadibatic convection, the massloss , the core convective overshooting during the H-burning phase , the diffusion index and the evolu-tionary stage index . It produces a set of parametervalues varying in relation to time, quantities varyingin relation to the radius of the model, the chemicalcomposition of the core (vs. time), surface chemicals(vs. time), and energy resolution flows(vs. time).
Fig. 9. FRANEC processing: portlet interface, workflow and selected results.
4) Output Post-Processing module consists of the fol-lowing jobs:
• TAR produces a compressed archive of themain outputs.
• GNUPLOT produces the output plots (e.g. theones included in Figure 9).
VI. CONCLUSIONS
Traditionally the common practice among astronomers fordata exploration tools was to employ small, individually cre-ated and executed applications. This scenario is not applicableto modern large-scale datasets. Modular web applications fordata analysis and visual discovery making effective usage ofmodern e-infrastructures can be instrumental in reaching outastrophysical communities and aiding them in new scientificdiscoveries.
A workflow-oriented gateway allows scientists to sharetheir analysis workflows and identify best practices for inves-tigating their datasets. More importantly, they can automateworkflows for repeated analysis with changed parameters,which in the past was a manual, slow and very error proneprocess. This way scientists can focus on core scientificdiscoveries rather than wasting time on data analysis on dealingwith inadequate resources.
VisIVO Gateway provides a web based portal for settingup, running and evaluating visualizations in astrophysics forlarge-scale datasets exploiting DCIs resources. The gatewayincludes a data repository containing images and moviesproduced from imported datasets, as well as repositories offundamental workflows, which can be used as templates for
generating new workflows to be distributed by the users of thesystem.
We presented several portlets running in a Liferay portalenvironment together with a mobile application making thegateway accessible from modern mobile platforms. For anumber of specialised astrophysical communities we havediscussed workflows and the issues involved in developingthem. The modularity achieved by subdividing workflows intoa number of core tasks ensures re-usability and provides highflexibility. End users do not need to be aware of set-up optionsor be aware of the computing infrastructure operating behindthe scenes.
We envisage building a specialized repository of astro-physics workflows core modules to share them among com-munities using the SHIWA platform. Our vision for these isto be used not only by astrophysical communities but to alsobe potentially exploited within other scientific contexts. Thisactivity will also be instrumental in future work for creating anAstro-Gateway Federation establishing a network of ScienceGateways to benefit astrophysical communities sharing toolsand services, data, repositories, workflows and computinginfrastructures.
ACKNOWLEDGMENT
The research leading to these results has received fundingfrom the European Commission’s Seventh Framework Pro-gramme (FP7/2007-2013) under grant agreement no 283481SCI-BUS (SCIentific gateway Based User Support) and theFP7 project under contract no 312579 ER-flow (Buildingan European Research Community through InteroperableWorkflows and Data).
REFERENCES
[1] A. Hassan and C. Fluke, “Scientific visualization in astronomy: Towardsthe petascale astronomy era,” Publications of the Astronomical Societyof Australia, vol. 28, no. 2, pp. 150–170, 2011.
[2] M. Borkin, S. Offner, E. Lee, H. Arce, and A. Goodman, “Visualiza-tion and analysis of synthetic observations of embedded protostellaroutflows,” in Bulletin of the American Astronomical Society, vol. 43,2011, p. 25813.
[3] A. Belloum, M. Inda, D. Vasunin, V. Korkhov, Z. Zhao, H. Rauwerda,T. Breit, M. Bubak, and L. Hertzberger, “Collaborative e-science ex-periments and scientific workflows,” Internet Computing, IEEE, vol. 15,no. 4, pp. 39–47, 2011.
[4] E. Sciacca, M. Bandieramonte, U. Becciani, A. Costa, M. Krokos,P. Massimino, C. Petta, C. Pistagna, S. Riggi, and F. Vitello, “Visivoworkflow-oriented science gateway for astrophysical visualization,” in21st Euromicro International Conference on Parallel, Distributed andNetwork-Based Computing (PDP’13). IEEE Computer Society Press,2013.
[5] P. Kacsuk, “P-grade portal family for grid infrastructures,” Concurrencyand Computation: Practice and Experience, vol. 23, no. 3, pp. 235–245,2011.
[6] U. Becciani, A. Costa, V. Antonuccio-Delogu, G. Caniglia, M. Com-parato, C. Gheller, Z. Jin, M. Krokos, and P. Massimino, “Visivo–integrated tools and services for large-scale astrophysical visualization,”Publications of the Astronomical Society of the Pacific, vol. 122, no.887, pp. 119–130, 2010.
[7] M. Riedel, W. Frings, S. Dominiczak, T. Eickermann, D. Mallmann,P. Gibbon, and T. Dussel, “Visit/gs: Higher level grid services forscientific collaborative online visualization and steering in unicoregrids,” in Parallel and Distributed Computing, 2007. ISPDC’07. SixthInternational Symposium on. IEEE, 2007.
[8] G. Song, Y. Zheng, and H. Shen, “Paraview-based collaborative visu-alization for the grid,” Advanced Web and Network Technologies, andApplications, pp. 819–826, 2006.
[9] M. Hereld, E. Olson, M. Papka, and T. Uram, “Streaming visualizationfor collaborative environments,” in Journal of Physics: ConferenceSeries, vol. 125, no. 1. IOP Publishing, 2008.
[10] M. Comparato, U. Becciani, A. Costa, B. Larsson, B. Garilli, C. Gheller,and J. Taylor, “Visualization, exploration, and data analysis of complexastrophysical data,” Publications of the Astronomical Society of thePacific, vol. 119, no. 858, pp. 898–913, 2007.
[11] U. Becciani, A. Costa, N. Ersotelos, M. Krokos, P. Massimino, C. Petta,and F. Vitello, “Visivo: A library and integrated tools for large astro-physical dataset exploration,” in Astronomical Data Analysis Softwareand Systems XXI, vol. 461, 2012, p. 505.
[12] A. Costa, U. Becciani, P. Massimino, M. Krokos, G. Caniglia,C. Gheller, A. Grillo, and F. Vitello, “Visivoweb: a www environmentfor large-scale astrophysical visualization,” Publications of the Astro-nomical Society of the Pacific, vol. 123, no. 902, pp. 503–513, 2011.
[13] P. Kacsuk, Z. Farkas, M. Kozlovszky, G. Hermann, A. Balasko,K. Karoczkai, and I. Marton, “Ws-pgrade/guse generic dci gatewayframework for a large variety of user communities,” Journal of GridComputing, vol. 10, no. 4, pp. 601–630, 2012.
[14] P. Kacsuk, K. Karoczkai, G. Hermann, G. Sipos, and J. Kovacs, “WS-PGRADE: Supporting parameter sweep applications in workflows,” inWorkflows in Support of Large-Scale Science, 2008. WORKS 2008.Third Workshop on. Ieee, 2008, pp. 1–10.
[15] A. Balasko, M. Kozlovszky, A. Schnautigel, K. Karockai, I. Marton,T. Strodl, and P. Kacsuk, “Converting p-grade grid portal into e-sciencegateways,” International Workshop on Science Gateways, pp. 1–6, 2010.
[16] A. Meglio, M. Begin, P. Couvares, E. Ronchieri, and E. Takacs, “Etics:the international software engineering service for the grid,” in Journalof Physics: Conference Series, vol. 119. IOP Publishing, 2008, p.042010.
[17] A. Pavlo, P. Couvares, R. Gietzel, A. Karp, I. Alderman, M. Livny, andC. Bacon, “The NMI build & test laboratory: Continuous integrationframework for distributed computing software,” in The 20th USENIXLarge Installation System Administration Conference (LISA), 2006, pp.263–273.
[18] J. Katz, G. Blanpied, K. Borozdin, and C. Morris, “X-radiography ofcargo containers,” Science and Global Security, vol. 15, no. 1, pp. 49–56, 2007.
[19] S. Riggi, V. Antonuccio, M. Bandieramonte, U. Becciani, F. Belluomo,M. Belluso, S. Billotta, G. Bonanno, B. Carbone, A. Costa et al.,“A large area cosmic ray detector for the inspection of hidden high-zmaterials inside containers,” in Journal of Physics: Conference Series,vol. 409, no. 1. IOP Publishing, 2013, p. 012046.
[20] M. Bandieramonte, “Muon tomography: tracks reconstruction and vi-sualization techniques,” Nuovo Cimento C - Colloquia and Communi-cations in Physics, to appear.
[21] D. Sunday, “Distance between lines and segments with their closestpoint of approach,” 2004. [Online]. Available: http://softsurfer.com/Archive/algorithm 0106/algorithm 0106.htm
[22] R. Hockney and J. Eastwood, Computer simulation using particles.Taylor & Francis, 1992.
[23] G.-B. Zhao, B. Li, and K. Koyama, “N-body simulations for f (r) gravityusing a self-adaptive particle-mesh code,” Physical Review D, vol. 83,no. 4, p. 044007, 2011.
[24] A. Pietrinferni, S. Cassisi, M. Salaris, and F. Castelli, “A large stellarevolution database for population synthesis studies. i. scaled solarmodels and isochrones,” The Astrophysical Journal, vol. 612, no. 1,p. 168, 2008.