VISITOR MONITORING IN NATURE AREAS - Naturvårdsverket · Swedish Environmental Protection Agency...
207
VISITOR MONITORING IN NATURE AREAS – a manual based on experiences from the Nordic and Baltic countries
Transcript of VISITOR MONITORING IN NATURE AREAS - Naturvårdsverket · Swedish Environmental Protection Agency...

VISITOR MONITORING IN NATURE AREAS – a manual based on experiences from the Nordic and Baltic countries

Swedish Environmental Protection Agency
Visitor monitoring in nature areas
– a manual based on experiences from the Nordic and Baltic countries

Copyright © by Swedish Environmental Protection Agency, Nordic Council of Ministers and authors
The full reference to this publication is: Kajala, L., Almik, A., Dahl, R., Dikšaitė, L, Erkkonen, J., Fredman, P.,
Jensen, F. Søndergaard, Karoles, K., Sievänen, T., Skov-Petersen, H., Vistad, O. I. and Wallsten, P. 2007.
Visitor monitoring in nature areas – a manual based on experiences from the Nordic and Baltic countries.
TemaNord 2007:534
Editor: Liisa Kajala
ISBN 91-620-1258-4
To order:Tel. +46/(0)8 505 933 40
Fax +46/(0)8 505 933 99
E-mail: [email protected]
Postal address: CM-gruppen
Box 11093, S-161 11 Bromma, Sweden
Internet: http://www.naturvardsverket.se/Documents/bokhandeln/bokhandeln.htm
Swedish Environmental Protection AgencyNaturvårdsverket, S-106 48 Stockholm, Sweden
Tel. +46/(0)8 698 10 00
Cover photo (main): Hiking in the Jämtland
region of Northern Sweden. Photo: Peter Fredman
Other cover photos: Lars Wallsten
Back cover photo: Hiking in Pyhä-Luosto National Park, Finland. Photo: Kimmo Kuure
Graphic design: IdéoLuck AB #60933
Print run: 2000
Printing: Alfa Print, 2007
3
Foreword
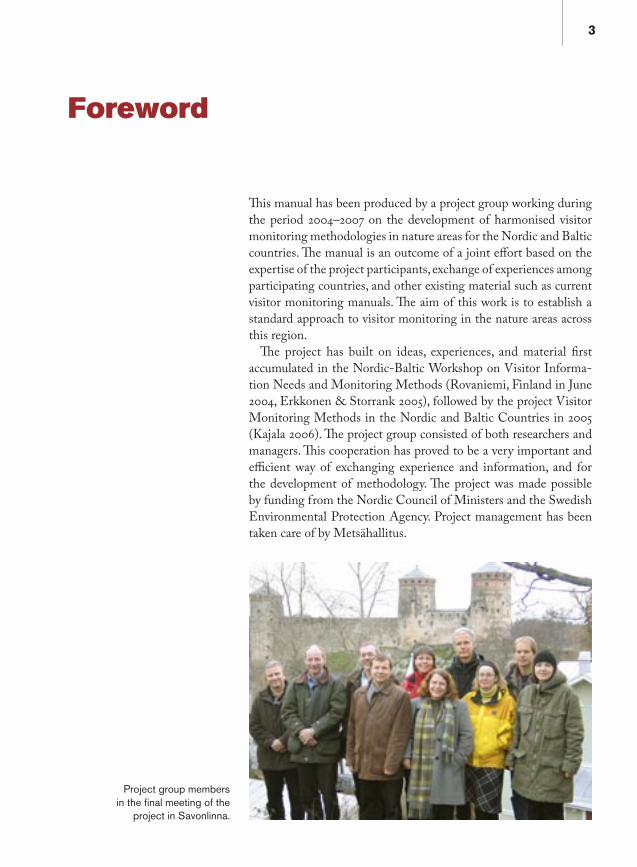
This manual has been produced by a project group working during the period 2004–2007 on the development of harmonised visitor monitoring methodologies in nature areas for the Nordic and Baltic countries. The manual is an outcome of a joint effort based on the expertise of the project participants, exchange of experiences among participating countries, and other existing material such as current visitor monitoring manuals. The aim of this work is to establish a standard approach to visitor monitoring in the nature areas across this region. The project has built on ideas, experiences, and material first accumulated in the Nordic-Baltic Workshop on Visitor Informa-tion Needs and Monitoring Methods (Rovaniemi, Finland in June 2004, Erkkonen & Storrank 2005), followed by the project Visitor Monitoring Methods in the Nordic and Baltic Countries in 2005 (Kajala 2006). The project group consisted of both researchers and managers. This cooperation has proved to be a very important and efficient way of exchanging experience and information, and for the development of methodology. The project was made possible by funding from the Nordic Council of Ministers and the Swedish Environmental Protection Agency. Project management has been taken care of by Metsähallitus.
Project group members in the final meeting of the
project in Savonlinna.

4
The manual is targeted at managers of Nordic and Baltic nature areas. It includes guidelines, recommendations and examples on visi-tor monitoring methodologies applicable to nature areas in Nordic and Baltic countries. The purpose of the manual is to provide meth-ods, tools and ideas for learning more about outdoor recreationists and their use of the nature. This knowledge can be used for various purposes, from increasing the experience value of those who visit the areas to the management of the areas and to national or inter-national comparisons. The long-term vision of the project group is that, through harmonised visitor monitoring methodology for the nature areas of Nordic and Baltic countries, we will eventually create a common basis for visitor information statistics. In compiling this manual the project’s participants acknowledge the valuable inputs from other handbooks and reports on visitor monitoring. Especially important in this respect were the Finnish and Swedish handbooks on both visitor counting and visitor sur-veys (Horne et al. 998, Erkkonen & Sievänen 200, Lindhagen & Ahlström 2005, Naturvårdsverket 2005a, 2005b) together with visitor monitoring applications from Fulufjället (Fredman et al. 2005, 2006) and numerous forest areas in Denmark (Koch 980, 984, Jensen 2003). The participating organisations can translate the manual into the language(s) of each participating country. During 2007, the Swedish Environmental Protection Agency (Naturvårdsverket) expects to publish the manual in Swedish and Metsähallitus in Finnish. The project group consisted of the following organisations and representatives:
• Denmark: º Frank Søndergaard Jensen, Skov & Landskab (Danish Centre
for Forest, Landscape and Planning, University of Copenhagen), [email protected]
º Hans Skov-Petersen, Skov & Landskab (Danish Centre for Forest, Landscape and Planning, University of Copenhagen), [email protected]
• Estonia: º Anu Almik, Riigimetsa Majandamise Keskus, RMK (Estonian
State Forest Management Centre), [email protected]º Kalle Karoles, Metsakaitse- ja Metsauuenduskeskus (Ministry
of Environment, Centre of Forest Protection and Silviculture), [email protected]

5
• Finland: º Joel Erkkonen, Metsähallitus, [email protected]º Liisa Kajala, Metsähallitus, [email protected] (project man-
ager)º Tuija Sievänen, Metsäntutkimuslaitos (The Finnish Forest
Research Institute, Metla), [email protected]
• Lithuania: º Lina Dikšaitė, Kuršių nerijos nacionalinio parko direkcija (Cu-
ronian Spit National Park Administration), [email protected]
• Norway: º Odd Inge Vistad, Norsk Institutt for Naturforskning,
NINA (Norwegian Institute for Nature Research), [email protected]
º Reidar Dahl, Direktoratet for naturforvaltning (Directorate for Nature Management), [email protected]
• Sweden: º Per Wallsten, Naturvårdsverket (Swedish Environmental Protec-
tion Agency), from September st, 2006 Tyresta National Park, [email protected]
º Peter Fredman, Mid-Sweden University, Etour, peter.fredman@ etour.se
º Anna Fritiofson Naturvårdsverket, anna.f ritiofson@ naturvardsverket.se
BJÖRN RISINGER RAUNO VÄISÄNENDirector Director Swedish Environmental Metsähallitus, Protection Agency, Natural Heritage ServicesNatural Resources Department

6
Recreational use of parks and protected areas is a fundamental com-ponent of society’s reason for the creation of such areas. A citizen’s visit to sites containing natural and cultural heritage often results in an increased personal appreciation of both the heritage and the insti-tution that provided the opportunity for such visitation. This concept is well known, because each of us has gone through the process of visitation, appreciation and a heightened sense of place. Any phenomenon that is not measured and reported does not ex-ist politically. Governments, societies, communities and individuals place more value on that which is documented. The importance of parks and protected areas to the creation of economic value, to the outdoor recreation industry and to national tourism accounts is often undervalued. This is usually due to a paucity of data. Strangely, some park and resource management agencies have been slow to develop procedures for the ongoing monitoring and reporting of visitor use, thus leading to a lowered level of societal appreciation of these sites. The absence of visitor use data of many of the world’s protected areas is a major policy problem. The lack of such data results in tourism being undervalued in public policy. It is difficult to under-stand the scale of the world’s tourism use of protected areas without standard measurement units, collection procedures or integrated data management systems. The absence of visitor use data also makes the assessment and management of tourism-related impacts on com-munities, economics and ecosystems difficult. The Tourism Task Force of the World Commission on Protected Areas recognized the need for a standard approach to visitor use monitoring and reporting. With the help of the National Park Service of the United States of America, the Task Force prepared and published in 999 the document, Guidelines for Public Use Measurement and Reporting at Parks and Protected Areas. This document was written by Ken Hornback and Paul Eagles. It was originally published in English, and later in Chinese. It was widely-adopted internationally. It is electronically available at: http://www.ahs.uwaterloo.ca/~eagles/parks.pdf. These guidelines encourage each government and each protected area to move forward with a standard approach to the collection and publication of visitor use data.
Foreword by Paul F. J. Eagles
7
The Nordic Council of Ministers and the Swedish Environmental Protection Agency are to be commended for the funding of this current visitor monitoring document. Special thanks should go to Metsähallitus for its leadership in the coordinated effort to produce this highly useful work. Finland has shown high degrees of interest and competence in the field. This document is the first time that a coordinated effort amongst a large number of countries has been undertaken. It can be expected that this effort will provide leadership for similar efforts elsewhere. One would hope that these Guidelines will be widely-adopted and implemented throughout the Nordic and Baltic Countries. It would be ideal if after five years of use, an effort would be made to evaluate the use of the Guidelines. This would be an ideal time to make refinements based upon the experience gained by the many individuals and agencies who work on visitor use monitoring in this important area of the world. The United Nations List of National Parks and Protected Areas is the global data base of protected areas. The World Conservation Monitoring Centre manages this data base. The World Commission on Protected Areas and the World Conservation Monitoring Center agreed that visitor use data will now be added to the data report for each protected area. It would be outstanding if the Nordic and Baltic countries could be the first area of the world to report visitor use data to the United Nations List of National Parks and Protected Areas. This manual provides the direction and the means. A coordinated approach and structure is in place. What is needed next is a shared decision to lead the world in visitor use monitoring and reporting, both nationally and internationally. We encourage the Nordic and Baltic countries to accept this global leadership role.
PAUL F. J. EAGLESChairTask Force on Tourism and Protected AreasWorld Commission on Protected AreasWorld Conservation Union (IUCN)
Paul F. J. Eagles

8
Summary in English . . . . . . . . . . . . . . . . . . . . . . . . . . . 11
Dansk sammendrag . . . . . . . . . . . . . . . . . . . . . . . . . . . 12
Eestikeelne kokkuvõte . . . . . . . . . . . . . . . . . . . . . . . . . . 13
Suomenkielinen tiivistelmä . . . . . . . . . . . . . . . . . . . . . . . 14
Santrauka lietuvių kalba . . . . . . . . . . . . . . . . . . . . . . . . . 15
Norsk samandrag. . . . . . . . . . . . . . . . . . . . . . . . . . . . . 16
Svensk sammanfattning . . . . . . . . . . . . . . . . . . . . . . . . . 17
1. Introduction to visitor monitoring . . . . . . . . . . . . . . . 19
1.1. Why measure outdoor recreational use? . . . . . . . . . . . . . . 21
1.2. Why is harmonised methodology needed in Nordic and Baltic countries? . . . . . . . . . . . . . . . . . . . . . . . . 24
1.3. Approach of this manual . . . . . . . . . . . . . . . . . . . . . . 251.3.1. Onsite monitoring or general population surveys? . . . . . 251.3.2. The importance of a visitor monitoring programme . . . . 261.3.3. The influence of different area types on applicable
methodology . . . . . . . . . . . . . . . . . . . . . . . . 281.3.4. Structure and purpose of the manual . . . . . . . . . . . . 30
2. Key terms . . . . . . . . . . . . . . . . . . . . . . . . . . . . . . 33
3. Visitor counting . . . . . . . . . . . . . . . . . . . . . . . . . . 37
3.1. Introduction to visitor counting. . . . . . . . . . . . . . . . . . . 39
3.2. Selecting methods . . . . . . . . . . . . . . . . . . . . . . . . . 39
3.3. Visitor counting based on automatic registration . . . . . . . . . . 453.3.1. Stages of visitor counting by counters. . . . . . . . . . . . 453.3.2. Planning: General matters to be considered when
selecting counters . . . . . . . . . . . . . . . . . . . . . . 453.3.3. Planning: Technical principles and alternatives available . . 463.3.4. Installation of the counters . . . . . . . . . . . . . . . . . 573.3.5. Monitoring the counters . . . . . . . . . . . . . . . . . . 583.3.6. Defining correction coefficients for counters . . . . . . . . 593.3.7. Calculating the number of visits . . . . . . . . . . . . . . 61
3.4. Estimating the number of visits to an area . . . . . . . . . . . . . 613.4.1. Introduction . . . . . . . . . . . . . . . . . . . . . . . . 613.4.2. Technique of comprehensive counting . . . . . . . . . . . 623.4.3. Examples of extrapolating number of visits to an area . . . 70
Table of contents

9
4. Visitor surveys . . . . . . . . . . . . . . . . . . . . . . . . . . . 77
4.1. The visitor survey process . . . . . . . . . . . . . . . . . . . . . . 79
4.2. Initial planning phases . . . . . . . . . . . . . . . . . . . . . . . 814.2.1. What to measure? . . . . . . . . . . . . . . . . . . . . . 814.2.2. Selecting a suitable method of data collection . . . . . . . 834.2.3. Planning folder . . . . . . . . . . . . . . . . . . . . . . . 844.2.4. Determining what resources are necessary . . . . . . . . . 86
4.3. Planning the collection of the survey data . . . . . . . . . . . . . 894.3.1. How many does one need to ask? . . . . . . . . . . . . . . 894.3.2. Obtaining contact information in the case of a postal survey . 904.3.3. Designing a sampling framework in the case
of onsite guided surveys . . . . . . . . . . . . . . . . . . . 944.3.4. Sampling methods for onsite guided surveys . . . . . . . . 964.3.5. Survey schedule in the case of onsite guided surveys . . . . 984.3.6. Training the survey personnel. . . . . . . . . . . . . . . 100
4.4. Planning the questionnaire . . . . . . . . . . . . . . . . . . . . 1014.4.1. Wording. . . . . . . . . . . . . . . . . . . . . . . . . . 1024.4.2. Appearance of the questionnaire . . . . . . . . . . . . . 1034.4.3. Variables, model questions and example questionnaire . . 1054.4.4. Testing the questionnaire . . . . . . . . . . . . . . . . . 107
4.5. Collecting the data: the case of onsite surveys . . . . . . . . . . 1084.5.1. Let’s implement the plan! . . . . . . . . . . . . . . . . . 1084.5.2. Equipment . . . . . . . . . . . . . . . . . . . . . . . . 1084.5.3. Meeting the visitor . . . . . . . . . . . . . . . . . . . . 1094.5.4. Survey diary . . . . . . . . . . . . . . . . . . . . . . . 1114.5.5. Further steps . . . . . . . . . . . . . . . . . . . . . . . 111
4.6. Collecting the data: the case of postal surveys . . . . . . . . . . 112
4.7. Data entry and processing . . . . . . . . . . . . . . . . . . . . 115
4.8. When things do not go as planned . . . . . . . . . . . . . . . . 116
5. Reporting the results of visitor monitoring . . . . . . . . 119
5.1. General instructions . . . . . . . . . . . . . . . . . . . . . . . 120
5.2. Contents of the visitor monitoring report . . . . . . . . . . . . . . . . . . .121
5.3. Introduction. . . . . . . . . . . . . . . . . . . . . . . . . . . . 122
5.4. Implementation of visitor monitoring . . . . . . . . . . . . . . .1235.4.1. Description of the area . . . . . . . . . . . . . . . . . . 1235.4.2. Data and methods . . . . . . . . . . . . . . . . . . . . 124
5.5. Results . . . . . . . . . . . . . . . . . . . . . . . . . . . . . . 125
5.6. Discussion and conclusions . . . . . . . . . . . . . . . . . . . 126
5.7. Summary . . . . . . . . . . . . . . . . . . . . . . . . . . . . . 127
6. Interpreting visitor information . . . . . . . . . . . . . . . . 129
6.1. Identifying the visitors . . . . . . . . . . . . . . . . . . . . . . 1306.1.1. Visitor and/or visitor group profiles. . . . . . . . . . . . 1306.1.2. Types of visitors . . . . . . . . . . . . . . . . . . . . . . 132

10
6.2. Identifying visitor satisfaction. . . . . . . . . . . . . . . . . . . 132
6.3. Motives for, experiences with, and benefits of, outdoor recreation . 134
6.4. Congestion as an aspect of evaluation of visitor satisfaction . . . 135
6.5. Conflicts between and within visitor groups . . . . . . . . . . . 136
6.6. Economic values and impact assessments. . . . . . . . . . . . . 136
6.7. Spatial and temporal distribution of visitor flows/visitation . . . 137
7. How to use visitor information? . . . . . . . . . . . . . . . 139
7.1. Planning of management and use. . . . . . . . . . . . . . . . . 141
7.2. Integrating visitor survey results into a participatory planning process . . . . . . . . . . . . . . . . . . . . . . . . . 143
7.3. Targeting resources for the area’s maintenance and management . 143
7.4. Marketing and communications . . . . . . . . . . . . . . . . . 144
7.5. Evaluating the impact of actions and monitoring changes . . . . 144
7.6. Estimating local and regional economic and social impacts . . . 145
7.7. Planning of operations at nature centres or service points . . . . 145
7.8. Strategic planning within the agencies or organisations . . . . . 146
7.9. Utilising area-specific data nationwide and internationally . . . . 146
7.10. Examples of how visitor information has been used . . . . . . . 1477.10.1. Denmark . . . . . . . . . . . . . . . . . . . . . . . . . 1477.10.2. Estonia . . . . . . . . . . . . . . . . . . . . . . . . . . 1477.10.3. Finland . . . . . . . . . . . . . . . . . . . . . . . . . . 1477.10.4. Lithuania . . . . . . . . . . . . . . . . . . . . . . . . . 1487.10.5. Norway . . . . . . . . . . . . . . . . . . . . . . . . . . 1487.10.6. Sweden . . . . . . . . . . . . . . . . . . . . . . . . . . 148
8. References . . . . . . . . . . . . . . . . . . . . . . . . . . . . 149
8.1. Denmark . . . . . . . . . . . . . . . . . . . . . . . . . . . . . 150
8.2. Estonia . . . . . . . . . . . . . . . . . . . . . . . . . . . . . . 151
8.3. Finland . . . . . . . . . . . . . . . . . . . . . . . . . . . . . . 152
8.4. Norway . . . . . . . . . . . . . . . . . . . . . . . . . . . . . . 152
8.5. Sweden . . . . . . . . . . . . . . . . . . . . . . . . . . . . . . 153
8.6. Other countries or publications related to several countries . . . 154
Appendices . . . . . . . . . . . . . . . . . . . . . . . . . . . . . 157
1. Examples of counter manufacturers and their contact information . 158
2. Counter specific check form . . . . . . . . . . . . . . . . . . . 159
3. Comprehensive roadside counting data form . . . . . . . . . . . 161
4. Variables and questions for onsite visitor monitoring of nature areas in the Nordic and Baltic countries . . . . . . . . 163
5. Example of a questionnaire . . . . . . . . . . . . . . . . . . . . 198
6. Estimates of resources needed for implementing a survey . . . . 202
7. Survey diary. . . . . . . . . . . . . . . . . . . . . . . . . . . . 205

11
Summary in English
Nature tourism and outdoor recreation are important uses of nature areas in the Nordic and Baltic countries, and the popularity of these activities seems to be constantly increasing in modern society. Infor-mation on visitors to nature areas is essential for managing outdoor recreation to ensure quality recreation experiences, tourism develop-ment, the promotion of public health and well-being, and efficient protection of nature and cultural heritage in a sustainable way. Visitor information is important at different levels. At a local level, it is essential for land managers, for tourism development, and for participatory planning in areas where there is significant recreational use. At regional, national, and international levels, visitor information is needed for policy, planning, reporting and comparisons. This manual has been produced by a Nordic-Baltic project group working during the period 2004–2007 on developing harmonised visitor monitoring methodologies in nature areas for the Nordic and Baltic countries. In collecting visitor information, a wide range of methodology has been applied and there is a need to obtain more comparable and reliable visitor information across different nature areas and across time in the Nordic and Baltic countries. This manual represents an effort to put harmonised methods into practice in the Nordic and Baltic circumstances. It is a first step towards obtaining uniform visitor monitoring information, creating a common basis for visitor information statistics and databases in these countries. The main focus of the manual is on practical matters: how to carry out visitor counting and visitor surveys, how to report the results and how to make use of the information obtained. The manual includes guidelines, recommendations and examples on visitor monitoring methodologies applicable to nature areas in the Nordic and Baltic countries. The approach focuses on onsite visitor monitoring meth-ods, which yield information about the actual users of the area. To obtain information on non-visitors, e.g. potential visitors, one needs to make use of general population surveys, which is beyond the primary scope of this manual.

12
Naturturisme og friluftsliv er vigtige anvendelser af naturområder i de nordiske og baltiske lande, og betydningen af disse aktiviteter synes at være i konstant vækst. Information, om de besøgende i naturområderne, er essentiel for at forvaltningen kan sikre frilufts-livet bæredygtige kvalitetsoplevelser, turismeudvikling, fremme af folkesundhed og livskvalitet, samtidig med en effektiv beskyttelse af natur- og kulturmiljøet. Viden om de besøgende er vigtig på forskellige niveauer. På det lokale niveau − specielt i områder hvor friluftslivet har høj prioritet − er der tale om grundlæggende viden til gavn for såvel landskabsfor-valtere som for turismeudvikling og borgerinddragelse. På regionalt, nationalt og internationalt niveau, er der behov for besøgsinformation i forbindelse med eksempelvis politikudvikling, planlægning samt statistikindberetning. Denne manual er produceret af en Nordisk-Baltisk projektgruppe i perioden 2004-2007. Projektgruppen har fokuseret på at udvikle mere ensartede metoder til indsamling af besøgsinformation i de nordiske og baltiske landes naturområder. Der har over årene været anvendt en bred vifte af forskellige indsamlingsmetoder i de enkelte lande, og der er behov for at nå frem til mere sammenlignelige og pålidelige informationer − såvel på tværs af forskellige naturområder, som over tid, i de nordiske og baltiske lande. Denne manual er et udtryk for bestræbelserne på at få harmoniserede metoder til at virke i praksis under nordiske og balti-ske forhold. Der er tale om det første trin i retning af at opnå ensartet information om den rekreative brug af naturområder og at skabe en fælles basis for friluftslivs-statistik og -databaser i disse lande. Manualens hovedfokus er af praktisk karakter: hvordan gennem-føres besøgs-tællinger og -undersøgelser, hvordan afrapporteres resultater, og hvordan kan den opnåede information anvendes. Manualen indeholder retningslinier, anbefalinger og eksempler på metoder til indsamling af friluftslivs-informationer, der er anvende-lige i naturområder i de nordiske og baltiske lande. Indfaldsvinklen fokuserer på dataindsamlingsmetoder der foregår direkte ude i det konkrete naturområde hvorom der ønskes viden. Herved opnås der viden om områdets egentlige besøgende, hvorimod information om ikke-besøgende/potentielle besøgende, må indsamles ved hjælp af befolkningsundersøgelser (f.eks. som telefoninterviews eller post-spørgeskemaer), hvilket er uden for denne manuals rammer.
Dansk sammendrag

13
Loodusturism ja rekreatsioon on Põhjamaade ja Balti riikide loo-dusalade olulised kasutusvaldkonnad ning nende tegevuste popu-laarsus näib kaasaegses ühiskonnas pidevalt kasvavat. Informatsioon loodusalade külastajate kohta on väga tähtis puhkevõimaluste korraldamiseks, et tagada kvaliteetsed puhkuseelamused, turismi areng, rahvatervise edendamine ning tõhus ja säästlik looduse ja kultuuripärandi kaitse. Informatsioon külastajate kohta on tähtis mitmel tasandil. Kohalikul tasandil on see esmatähtis loodusalade majandajate jaoks, turismiarenduseks ning olulise rekreatiivse kasutusega alade osalusplaneerimiseks. Piirkondlikul, riiklikul ja rahvusvahelisel ta-sandil on andmeid külastajate kohta vaja poliitika väljatöötamiseks, planeerimiseks, aruandluseks ja võrdlemiseks. Käesoleva käsiraamatu on koostanud Põhjamaade ja Balti projekt-grupp ajavahemikul 2004—2007 ning see käsitleb loodusalade üht-lustatud külastajaseire metoodika väljatöötamist Põhjamaades ja Balti riikides. Külastajainformatsiooni kogumisel on kasutatud erinevaid meetodeid, kuid vaja on paremini võrreldavaid ja usaldusväärsemaid andmeid külastajate kohta nii erinevate loodusalade kui ka aja lõikes Põhjamaades ja Balti riikides. Käesolev käsiraamat kujutab endast püüet rakendada ellu ühtlustatud meetodid Põhjamaade ja Baltimaa-de tingimustes. See on esimene samm külastajaseirest ühtlustatud andmete saamiseks, et luua ühtne baas külastajainfo statistikale ja andmebaasidele neis riikides. Käsiraamatus on põhitähelepanu pööratud praktilistele küsimuste-le: kuidas viia läbi külastajate loendust ja külastajauuringuid, kuidas anda aru tulemustest ja kuidas kasutada saadud informatsiooni. Käsiraamat sisaldab juhiseid, soovitusi ja näiteid külastajaseire meeto-ditest, mis on rakendatavad Põhjamaade ja Balti riikide loodusaladel. Selle lähenemise puhul on rõhk külastajate kohapealse seire meetodi-tel, mis annavad teavet ala tegelike kasutajate kohta. Informatsiooni saamiseks mitte-külastajate, s.t potentsiaalsete külastajate kohta tuleb kasutada üldisi elanikkonna uuringuid, mis aga ei kuulu käesoleva käsiraamatu raamesse.
Eestikeelne kokkuvõte

14
Luontomatkailu ja luonnon virkistyskäyttö ovat tärkeitä suojelu- ja virkistysalueiden käyttömuotoja Pohjoismaissa ja Baltian maissa ja niiden suosio näyttää olevan nyky-yhteiskunnassa jatkuvasti kasva-massa. Suojelu- ja virkistysalueiden kävijätieto on olennainen työkalu virkistysalueiden hoidossa ja hallinnoinnissa, jotta kävijöille voidaan varmistaa laadukkaita virkistyskokemuksia, kehittää luontomatkai-lua, edistää kansanterveyttä ja hyvinvointia sekä suojella luonto- ja kulttuuriarvoja kestävällä tavalla. Kävijätieto on tärkeää usealla eri tasolla. Paikallisella tasolla tieto on keskeistä suojelu- ja virkistysalueiden hoidossa, matkailun ke-hittämisessä ja osallistavassa suunnittelussa niillä alueilla, joilla on merkittävää virkistyskäyttöä. Alueellisella, kansallisella ja kansainvä-lisellä tasolla kävijätietoa tarvitaan päätöksentekoon, suunnitteluun. raportointiin ja erilaisiin vertailuihin. Tämä opas on tuotettu vuosina 2004–2007 työskennelleen poh-joismaisbaltialaisen projektiryhmän yhteistyönä. Työssä pyrittiin yhtenäistämään suojelu- ja virkistysalueiden kävijäseurannan me-netelmiä Pohjoismaissa ja Baltian maissa. Kävijätiedon keräämi-sessä on käytetty hyvin erilaisia menetelmiä ja luotettavamman ja vertailukelpoisemman kävijätiedon saamiseen on ollut suuri tarve. Tässä oppaassa on pyritty esittämään yhtenäisiä menetelmiä, jotka voitaisiin viedä käytäntöön pohjoismaisbaltialaisissa olosuhteissa. Tämä on ensimmäinen askel yhtenäisen kävijätiedon hankkimiseksi näissä maissa ja luo perustan kävijätilastoinnille sekä erilaisille tie-tokannoille. Oppaan päähuomio kohdistuu käytännön seikkoihin: kuinka kävijälaskentaa ja kävijätutkimuksia tehdään, kuinka tuloksia ra-portoidaan ja kuinka kerättyä tietoa hyödynnetään. Opas sisältää ohjeita, suosituksia ja esimerkkejä kävijäseurannan menetelmistä, jotka soveltuvat Pohjoismaiden ja Baltian maiden suojelu- ja virkis-tysalueille. Opas keskittyy maastossa tapahtuvaan kävijäseurantaan, joka tuottaa tietoa alueiden todellisista käyttäjistä. Mikäli alueiden potentiaalisilta käyttäjiltä halutaan saada vastaavia tietoja, tarvitaan laajempia väestötutkimuksia, joiden menetelmiä ei tässä oppaassa käsitellä.
Suomenkielinen tiivistelmä
15
Šiaurės Europos bei Baltijos regiono gamtinės teritorijos yra labai svarbios pažintiniam turizmui ir rekreacijai. Jų reikšmingumas šiuolaikinėje visuomenėje nuolat auga. Todėl informacija apie šių teritorijų lankytojus yra būtina kokybiškos rekreacinės veiklos planavimui ir vystymui, o taip pat propaguojant visuomenės sveikatinimą, užtikrinant efektyvią gamtinių ir kultūrinių vertybių apsaugą. Informacija apie lankytojus yra svarbi visais lygmenimis. Vietiniame lygmenyje ji būtina turizmo vystymo bei intensyviai naudojamų rekreacinių zonų teritoriniam planavimui. Regioniniame, nacionaliniame ir tarptautiniame lygmenyse informacija apie lankytojus naudojama politikos formavime, planavime, o taip pat lyginamajai lankytojų srautų analizei atlikti. Šis vadovas parengtas 2004-2007m. vykdant projektą „Lankytojų monitoringo metodai Šiaurės Europos ir Baltijos šalyse“. Projekto darbo grupė remdamasi įvairių tyrimo metodų derinimu, siekė sukurti vieningą lankytojų monitoringo metodiką, kuri leistų kaupti statistiškai patikimą informaciją, bei sudarytų galimybes palyginti įvairių šalių gamtines teritorijas. Vadovas atspindi pastangas praktiškai diegti vieningą lankytojų srautų tyrimo metodiką ir formuoti bendrą duomenų bazę Šiaurės Europos bei Baltijos šalyse. Pagrindinis dėmesys vadove skiriamas praktiniams patarimams: kaip atlikti lankytojų skaičiavimus ir apklausas, kaip pateikti darbo rezultatus, kaip panaudoti sukauptus duomenis ir informaciją. Lankytojų monitoringo metodinės gaires, rekomendacijos bei pavyzdžiai yra pritaikyti Šiaurės Europos ir Baltijos šalių gamtinėms teritorijoms. Pateikti tyrimo metodai leidžia kaupti ir sisteminti informaciją apie faktinius teritorijos lankytojus. Potencialių lankytojų tyrimai yra jau kitų, platesnių viešosios nuomonės apklausų objektas ir nėra įtraukti į šį vadovą.
Santrauka lietuvių kalba

16
Naturturisme og friluftsliv er viktige delar av naturbruken i dei nordiske og baltiske landa, og slike aktivitetar ser ut til å bli stadig meir populære i det moderne samfunnet. Kunnskap om desse bru-karane av naturen er heilt nødvendig: Den trengst for å sikre gode opplevingar og forvalte friluftslivet på ein god måte, naturturismen vil ha stor nytte av slik brukarkunnskap, og den vil vere til god hjelp i arbeidet med å betre folkehelse og livskvalitet. Slik kunnskap vil også betre grunnlaget for effektivt forvaltning og berekraftig bruk av naturen og kulturminna. Kunnskap om brukarane er viktig på fleire nivå. Lokalt er det viktig for dei som forvaltar areala, for reiselivsutvikling, og for deltakande planlegging av område som vert brukt til friluftsliv eller der frilufts-liv/naturbruk er viktige brukarinteresser. På regionalt, nasjonalt og internasjonalt nivå treng ein slik kunnskap for politikkutvikling, planlegging, rapportering og samanlikning. Denne handboka er utvikla av ei nordisk-baltisk prosjektgruppe som i perioden 2004-2007 har arbeidd med å utvikle samkøyrde metodar og variablar for gjentakande brukarundersøkingar i naturområde (dvs. overvaking eller ”monitoring”) i Norden og Baltikum. Tidligare har slik kunnskap blitt samla gjennom mange ulike tilnærmingar. Det er behov for å samle kunnskap på eit slikt vis at ein kan samanlikne fakta om brukarane i ulike naturområde, og over tid. Med denne handboka har ein samordna både metodar og spørsmålsstillingar til bruk i alle desse landa. Den er fyrste steg mot ei meir einsarta innsamling av informasjon om brukarar av na-turområde. Det vil gje eit felles grunnlag for statistikk og databasar om friluftsliv mm i Norden og Baltikum. Handboka legg mest vekt på praktiske spørsmål ved brukarun-dersøkingar: Korleis skal vi gjennomføre ferdselsteljing og brukarin-tervju, korleis skal vi rapportere resultata og korleis kan vi nytte den informasjonen som blir samla. Handboka inneheld retningsliner, gode råd og eksempel på metodar som er tilpassa for undersøkingar i naturområde i våre land. Det er lagt vekt på arbeidet i ”felten” og korleis ein når fram til og får samla informasjon om dei som faktisk brukar eit område. For å samle informasjon om ikkje-brukarar (men som kan vere potensielle brukarar) må ein bruke generelle utvalsun-dersøkingar blant innbyggarane (lokalt, regionalt eller nasjonalt). Dette ligg utanfor ramma for denne handboka.
Norsk samandrag

17
Friluftsliv och naturturism är två viktiga sätt att nyttja naturen i de nordiska och baltiska länderna som blir allt populärare. Information om besökare i naturområden är betydelsefull för förvaltning av fri-luftslivet, för att säkerställa rekreationsupplevelser av hög kvalitet, för utveckling av turismen och för effektivt och hållbart skydd av natur och kulturarv. Information om besökare är viktig på olika nivåer. På lokal nivå är den betydelsefull för markförvaltare, för utveckling av turismen och för delaktighet i planeringen i områden som är viktiga för rekreation. På regional, nationell och internationell nivå behövs besöksinforma-tion för policyfrågor, planering, rapportering och jämförelser. Denna manual har tagits fram av en nordisk-baltisk projektgrupp som under åren 2004-2007 arbetat med att utveckla överensstäm-mande metoder för besökarundersökningar i naturområden för de nordiska och baltiska länderna. Vid insamlandet av besöksinforma-tion har ett brett spektrum av metoder tillämpats och det finns ett behov av att erhålla mer jämförbar och tillförlitlig besöksinformation från olika naturområden över tiden. Denna manual är ett försök att få till stånd en användning av överensstämmande metoder under nordiska och baltiska förhållanden. Den är ett första steg mot att erhålla enhetlig information från besökarundersökningar och skapa av en gemensam grund för statistik och databaser med besöksinfor-mation i dessa länder. Manualen fokuserar huvudsakligen på praktiska frågor: hur be-söksräkning och besökarstudier utförs, hur resultaten redovisas och hur den erhållna informationen kan användas. Manualen omfattar riktlinjer, rekommendationer och exempel på metoder för besökar-undersökningar som lämpar sig för naturområden i de nordiska och baltiska länderna. Fokus ligger på metoder för besökarundersök-ningar på plats i ett naturområde, vilka ger information om områdets faktiska användare. För att erhålla information om icke-besökare, t ex potentiella besökare, behöver man använda sig av generella befolkningsstudier, vilket ligger utanför ramen för denna manual.
Svensk sammanfattning

18

19
1. Introduction to visitor monitoring

20
SU M MARY
Information on visitors is essential for managing outdoor recrea-tion to ensure • quality recreation experiences• sustainable use of the area (e.g. knowing and managing impacts
on terrain, wildlife, etc.)• promotion of public health and well-being• tourism planning• efficient protection of nature and cultural heritage• sufficient financing.
Visitor information is important at different levels. It is essential for local land managers and for local tourism development, as well as for regional, national and international policy, planning, report-ing, research and comparisons. Moreover, visitors themselves are often interested in such information and as citizens they have a right to know about visitation to the areas. Harmonised visitor information should be gathered because there is a need to obtain comparable and reliable visitor informa-tion across different areas and across time. Ad hoc information gathering can lead to inaccurate and non-comparable results. A good visitor monitoring programme consists of visitor surveys and visitor counting, because knowledge of both the numbers of visitors and their characteristics are complementary to each other and both kinds of knowledge are important in planning and management processes. The choice of methods in any particular case depends on the aim of visitor monitoring, the questions to be asked, the type of area, the extent of various activities, the number and types of visitors, and so on. This manual focuses on onsite visitor monitoring methods, which yield information about the actual users of the area. With the methodology presented in this manual, one does not obtain information on non-visitors, e.g. potential visitors.
1. Introduction to visitor monitoring

21
1.1. Why measure outdoor recreational use?
The popularity of nature tourism and outdoor recreation is increas-ing in the Nordic and Baltic countries. Information on visitors to nature areas is essential for planning and managing recreation and tourism in order to provide for good experiences, and also for the promotion of public health and well-being, as well as for protecting nature and cultural heritage in an efficient way. Even in those nature areas where recreation is allowed but is not the primary societal interest in the area, it is important to know about visitation to these areas and to ensure quality visitor experiences. In the case of protected areas, the major task is to protect ecosystems and vulnerable nature qualities – while at the same time giving visi-tors an instructive experience. An uncontrolled increase in the use of such areas can lead to the endangering of ecological and cultural values, trampling and other disturbances in the terrain, in addition to negative social impacts like crowding. The management of nature is not the only means of protecting nature. Visitor management is also required: managing people is an important aspect of managing protected areas. One might even say that in most cases the man-agement problem cannot be solved by managing the nature, but by managing people. Consequently, social monitoring, including visitor monitoring, is an essential part not only of monitoring nature areas in general, but also of monitoring protected areas. Several of the Nordic and Baltic countries are encountering simi-lar challenges and problems related to nature tourism and outdoor recreation, and visitor monitoring is considered to be of growing importance. For ecological monitoring data we require reliability and
Nature areas often include cultural
values. Arctic Circle Hiking Area, Finland.
(PHOTO: JUHA PASO)

22
accuracy. The same requirements apply to social monitoring and to visitor use data. The main reason for visitor monitoring is the need to have com-parable and reliable social information from a single type or differ-ent types of areas, and in the long run we need to know the trends regarding the number and characteristics of the visitors. Besides being an important tool for the land managers, the reliable estimates are also of regional, national, and international significance. Such knowledge is also basic for those wishing to develop sustainable tourism products in certain areas. To be more specific, visitor information is important because: • All management depends on knowledge and information. The
better the quality of the information, the better the opportunity for good management. Efficient and harmonised monitoring methods and practices can contribute to efficient visitor management and administration of the areas. Consequently, information on visitors to nature areas is important, since visitors have political, economic, social and ecological impacts. For example, knowledge of visits and visitors can be used to stimulate, guide or regulate certain types of use. Information on visitors’ preferences combined with managers’ knowledge of the nature areas permits the management of different areas for different users.
• In order to make efficient and well-founded management de-cisions, managers need to know why visitors choose to visit a particular area, and what makes that area attractive. How does management of the area affect its attractiveness? What expecta-tions do visitors have with regard to the quantity and quality of the attractions, the experience opportunities and the services, and how well do the services satisfy the visitors’ needs? How does a nature area best produce benefits for the individual and society?
• Visitor data is useful in understanding and managing conflicts. Conflicts can occur between different types of recreational uses or users and/or between recreation and other types of land use.
• To provide quality recreation opportunities, land managers must know their customers, i.e. visitors. Managers need to know at a minimum how many people use the areas, when, and in what ac-tivities, people participate. This helps balance supply and demand for recreation in relation to other resources and enables managers to provide what people desire.
• With continuous up-to-date visitor information, managers get a grasp on changes and trends occurring in recreational use. Being prepared for future changes is naturally the point of departure for planning the area’s use.
• Visitor data will promote sustainable development of recreation

23
areas. Knowing the number of visits, the geographical distribution of visits, as well as types of visitors, is of great significance in promoting sustainable tourism, as reliable data on the number of visits and also on visitor characteristics, is a prerequisite for estimating the ecological, social and economic impacts of recreation. For example, the key figures for most of the impacts of nature and culture tourism are calculated in proportion to the number of visits to the area: e.g. amount of waste, consumption of firewood, wear on the terrain, various costs, or impacts of nature and culture tourism on the regional economy and culture.
• The responsible manager needs to know how efficient a chosen management measure is for guiding and regulating the use of an area and how the visitors respond to the measure. In order to protect vulnerable nature qualities (animals and plants), cultural heritage, or user qualities (e.g. silence, special experiences, avoiding user conflicts), certain management actions might be implemented (establish or close trails, parking areas, information efforts, etc.).
• A visitor survey is one means of carrying out so-called partici-patory planning. Through the survey, visitors can convey their wishes and viewpoints on the planning process and thus have an impact on the development of the area. Of course, the visitor survey does not replace other methods of participatory planning, but it is one possible way of achieving participation in addition to other available methods. A visitor survey generally reaches a significantly broader and more representative group of the area’s users than can be reached, for instance, through public programmes or representation in different organisations.
• Visitors themselves need information on the use of the areas. Communication with the visitors is a two-way street, where infor-mation obtained from visitors is shared among all visitors, among others. Moreover, in the Nordic and Baltic countries, most of the tourists are national visitors and are therefore the owners of the land. It is only right that the owners are given information on the use of their own land.
• A high quality recreation environment benefits the tourism industry. If the aim of the tourism industry is to increase the number of tourists to a certain extent, it is important to monitor what kinds of impacts such an increase will have on the recreation environment. Information on how the amount and type of visits are developing constitutes important data for estimating this kind of impact.
• The regional, national and international administration, politi-cians and non-governmental organisations need information for decision making. Visitor monitoring is not only a management tool, it is also about building strategic knowledge on visitors – who

24
they are, what they do, what they want – and communicating that information to politicians and other decision makers at the regional, national and international levels. This enables the devel-opment of sustainable tourism and the strengthening of regional development. Ensuring a supply of recreation services, trails, and recreation areas that serves the entire country and all segments of the population is the basic objective of policy on outdoor recreation. Together, recreation services, trails, and recreation areas constitute recreation area systems, whose systematic development nationwide requires a comprehensive database on how recreation areas and services are used, and who uses them.
1.2. Why is harmonised methodology needed in Nordic and Baltic countries?
There has been quite a bit of visitor monitoring going on in the Nordic and Baltic countries, both at population level and onsite, in some countries for several decades. Since many visitor studies in the Nordic countries were carried out as independent research projects there is a general lack of national guidelines. Thus, methodological development has also been proceeding for a long time. However, the situation varies across the Nordic and Baltic countries. Conse-quently, a wide range of methodology has been applied, as differ-ent countries have taken somewhat different approaches to visitor monitoring (Kajala 2006). This has been influenced by e.g. different land ownership and management situations. Some countries have placed relatively more focus on urban forests, while others have con-centrated more on remote nature areas. Together, this Nordic-Baltic experience forms a large knowledge base on applicable methodology in various situations. The drawback of having used a wide range of methodologies, even within one country, is that there is therefore often no strictly compa-rable data across sites, within countries and between countries. How-ever, the situation seems to be changing: in many Nordic and Baltic countries there is a growing interest and need toward developing a cooperative national visitor monitoring programme which would yield comparable long-term data. At the same time, in most of the countries there seems to be increasing awareness of the advantages of visitor data for local, regional, national and international purposes. Moreover, it has been recognised that the harmonisation of single studies is not only beneficial to national and international comparisons. It also adds value to the single study itself, allowing for comparisons with other single studies or a national or international situation.

25
There are no European standards for visitor monitoring that could be applied to Nordic and Baltic circumstances, which is another reason for the need to harmonise visitor monitoring methodology in the Nordic and Baltic countries. Consequently, this work can be helpful to other European countries as well. There are a number of handbooks on visitor monitoring available (e.g. Dales et al. 993, Yuan et al. 995, Hornback & Eagles 999, Watson et al. 2000, National Visitor Use Monitoring Handbook 2006, English Nature 2006). Most of them, however, come from countries other than Nordic or Baltic ones, particularly from the United States, Canada and the United Kingdom. Because the Nordic and Baltic countries have some special circumstances, especially the traditional right of common access (Nordisk Ministerråd 997), the methodological expertise is not directly transferable to these countries. In the Nordic and Baltic countries only Finland and Sweden have produced handbooks on both visitor counting and visitor surveys (Lindhagen & Ahlström 2005a, 2005b, Naturvårdsverket 2005a, 2005b, 2007, Erkkonen & Sievänen 200, Horne et al. 998). Because these handbooks have been developed for Scandinavian circumstances, they include material that has been very useful when compiling this manual.
1.3. Approach of this manual
1.3.1. Onsite monitoring or general population surveys?There are two main approaches to visitor monitoring: onsite monitor-ing of visitors (surveying and counting of visitors to a specific area), and general population surveys (studying individuals or households at their home). Both approaches have advantages and disadvantages which are related to factors such as representativeness, feasibility and cost. One important difference is that onsite studies include all categories of visitors regardless of their country of residence, interests, and so forth, while general population studies are limited to specific subgroups, such as residents of a certain country, region or community. On the other hand, the general population surveys most likely always include people who do not visit the nature areas under study. Both approaches are needed and are complementary to each other, but they respond to different information needs, serve different functions and utilise different methodology. Onsite monitoring of visitors is needed to provide information on visitors and their interaction with a particular nature area. Further-more, visitor monitoring can provide information related to visitor encounters and social conflicts. One reason why it is particularly important to develop and harmonise onsite visitor monitoring meth-
26
odology is that area managers are the ones who most commonly implement these. In order to secure quality results, managers need uniform information and instructions on how to implement visi-tor monitoring in practice. General population surveys are usually conducted by research agencies, often at a national level, based on well-established research protocols. However, even in the case of general population surveys there is a need for international develop-ment of methodology and harmonisation, although this goes beyond the scope of this manual. This manual focuses on onsite visitor monitoring methods, which yield information about the actual users of the area. This limitation should be kept in mind: with the methodology presented in this manual, one does not obtain information on non-visitors, e.g. po-tential visitors. To estimate these, one needs to use the methodology of population surveys. Moreover, cooperation with national tourism bodies is often necessary, if one wishes to understand the recreation demand developing in foreign target markets.
1.3.2. The importance of a visitor monitoring programme A good visitor monitoring programme consists of visitor surveys and visitor counting, because an awareness of both the numbers of visitors and their characteristics is important in planning and management processes. In fact, visitor counts and visitor surveys are complementary to each other and they should – whenever possible – be carried out simultaneously (Erkkonen & Sievänen 200). For example, such a combination gives information on both the number of visitors and/or visitor days, in addition to the number of visits. There are three critically important areas within any visitor monitoring programme. The first is the use of standard definitions of terms. Consistent application of terms such as visitor, tourist and visit is essential. The second is the use of harmonised approaches to measurement. Issues such as the timing of field measurement, sample size, degree of effort, type of technology and amount of effort will determine the relative accuracy of the measurement. The third is the scope and level of effort. It is important for the level of effort to be appropriate to the potential uses for the data, the resources available and the field circumstances (Hornback and Eagles 999). When estimating the scope and level of effort put into the visi-tor monitoring programme, we should remember that it should be in proportion to the requirement of area managers to provide data for general management, natural resource protection, maintenance operations and protection. Moreover, it is a balance of precision and practicality. If a programme is too complicated to be practically applied in an area, it cannot be sustained (Hornback & Eagles 999).
27
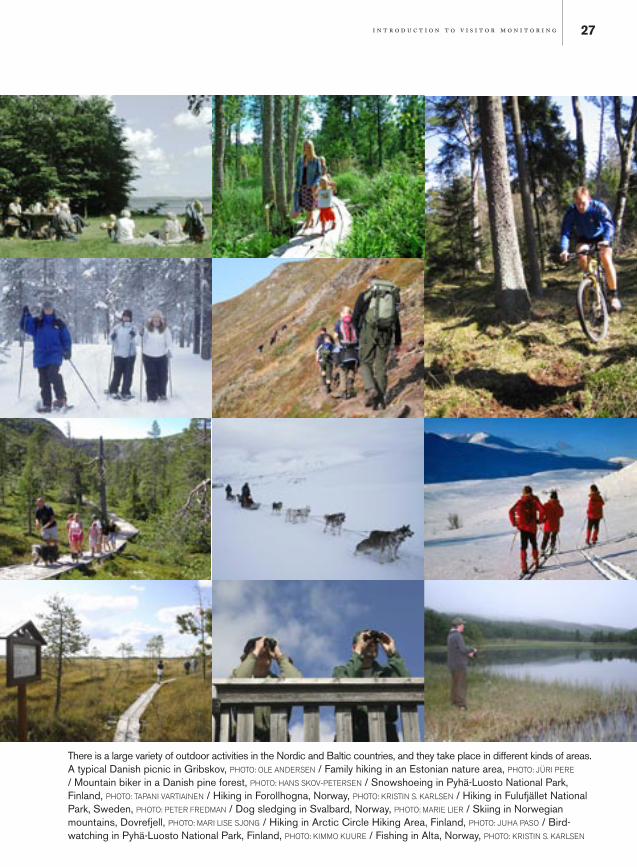
There is a large variety of outdoor activities in the Nordic and Baltic countries, and they take place in different kinds of areas.A typical Danish picnic in Gribskov, PHOTO: OLE ANDERSEN / Family hiking in an Estonian nature area, PHOTO: JÜRI PERE / Mountain biker in a Danish pine forest, PHOTO: HANS SKOV-PETERSEN / Snowshoeing in Pyhä-Luosto National Park, Finland, PHOTO: TAPANI VARTIAINEN / Hiking in Forollhogna, Norway, PHOTO: KRISTIN S. KARLSEN / Hiking in Fulufjället National Park, Sweden, PHOTO: PETER FREDMAN / Dog sledging in Svalbard, Norway, PHOTO: MARIE LIER / Skiing in Norwegian mountains, Dovrefjell, PHOTO: MARI LISE SJONG / Hiking in Arctic Circle Hiking Area, Finland, PHOTO: JUHA PASO / Bird-watching in Pyhä-Luosto National Park, Finland, PHOTO: KIMMO KUURE / Fishing in Alta, Norway, PHOTO: KRISTIN S. KARLSEN
28
1.3.3. The influence of different area types on applicable methodology
The manual covers a whole spectrum of areas varying from nature conservation areas to outdoor recreation areas, from remote back-country areas to close-to-urban areas. In this manual the term nature areas is used to mean all these areas. Thus, nature areas cover areas all the way from wilderness to urban areas, independent of the area’s protection status. Nature areas very often include cultural values. In presenting the methodology, the aim has been to word it so that it can be applied to all the nature areas of the Nordic and Baltic countries. It is clear that areas and population structures differ inside one country and across countries. Significant variations do exist in settings, use, remoteness, and so forth, which sometimes call for different monitoring methods. Where there are clearly problems or limitations making the method applicable only to certain types of areas, this has been brought up. Due to urbanisation, recreation areas close to urbanised centres are becoming increasingly important to the society, as they contribute significantly to city dwellers’ well-being. Nevertheless, city parks inside cities are excluded from this manual. This is because, although many of the methods are likely to be applicable, subject to certain adaptations, to the city parks, there is not enough common Nordic-Baltic experience in this respect to make recommendations.
Counting visits and interviewing visitors to a natural area are often more complicated undertakings than one might think. Among the complicating factors are variations in visiting patterns (time, location, activities, etc.), and differences between areas which are related to access, geography and other natural conditions. To deal with such data-gathering problems, a number of alternative methods have been developed, including the use of: • mechanical and electronic counting devices• visual observations• self registration of visitors• personal interviews• questionnaire surveys• camera or video monitoring• indirect measures (e.g. environmental impact, number of cars,
water/firewood consumption, etc.)• focus groups and expert panels.
This wide variety of methods is also a consequence of the broad range and dynamics of outdoor recreation activities. Since such recreation involves both a psychological experience and participation in a specific activity in a specific area, studying outdoor recreation

29
usually requires more than simply counting the number of visits, like gathering information about the perceived outcomes of visits, the prior expectations of visitors, the journey to and from the area, and the memories that visitors take away with them from the area. Among other things, the choice of method depends on the aim of the study, the questions to be asked, the type of area, the extent of various activities, the number and types of visitors, and so on. An important initial step is to decide which questions to ask – based on the purpose of the study. For questions relating to attitudes toward management measures in a certain area, onsite data collection is preferred. But for a study of constraints for visiting a certain area, interviews with a population sample (national, regional and/or local) would most likely be more appropriate. Additional considerations are the geographical and natural char-acteristics of the area, and the behaviour patterns of the visitors who make various uses of it. Those uses can be concentrated or widely dis-tributed, different activities may involve different movement patterns, and there can be many or only a few natural points of entry. Many studies are based on data gathered from a so-called representative sample of visitors. However, statistical representativeness may be difficult to achieve, since the size of the total research population is seldom known exactly. This is due to the fact that, in order to count or interview all visitors, the entire boundary of the area must be monitored, which is costly and often not feasible. However, most visitors keep to the trails and paths; and especially in more remote areas, the majority of visitors enter via a main entrance. Given knowledge of which paths are usually followed, general patterns of movement, and the locations of natural entry points, it is usually possible to select a number of strategic data-gathering locations which together provide an accept-able level of representativeness.
Different settings provide different outdoor recreation opportunities. The visitor monitoring should also be able to handle the differences. (DRAWING FROM CANGER & KOCH 1986).

30
In addition to affecting the applicable visitor monitoring method-ology, different area types appeal to different kinds of recreationists. For managers, it is important to both recognise the characteristics of the area and to be aware of the preferences of various user types present in the area. It is important for the managers to take into consideration the variety of visitors to the area. Managing for “the average hiker” who does not exist can lead to situations where none of the user groups is satisfied (Shafer 969, Canger & Koch 986, Wallsten 988).
1.3.4. Structure and purpose of the manualThis manual is an effort to put harmonised methods into practice in the Nordic and Baltic circumstances. It represents a first step towards the Nordic and Baltic countries obtaining uniform visitor monitor-ing information, creating a common basis for visitor information statistics and databases in these countries. The main focus of the manual is on “how to do it”. There are four main parts to this manual: . Introduction and key terms (chapters and 2), 2. Methodology of visitor counting (chapter 3), 3. Methodology of visitor surveys (chapter 4) and 4. Reporting, interpretation and utilisation of the results (chapters
5, 6 and 7).
The structure of the manual.
Methods presented in this manual are based on well-tested tech-niques and experience. Harmonisation of visitor data means that in areas for which regionally, nationally, or internationally comparable data are desired, similar, uniform ways and processes of measure-ment are recommended. If harmonisation has not been carried out, there will be great difficulties when comparing, for example, data
Introduction
Key terms
VisitorCounting
• Why• What• When
• Methodology• Planning • Data collection• Data entry
VisitorSurveys
Reporting
Interpretation
Utilisation

31
gathered at different areas, or even data collected at the same area at different times. The measurement need not take place at every location in exactly the same way, but the more uniform the better, and it is important that at least the measurement method, variables, and indicators are compatible so that they can be classified in com-mensurable terms afterwards. Finally, we offer a word of consideration. Before setting up a visitor monitoring programme, one must analyse what kinds of policy and management issues there are in a particular area, and consequently what kind of knowledge is needed. Even though the manual recommends certain methods, one should not forget critical thinking as a means to ensuring the best possible solution given the current circumstances.

32

33
2. Key terms

34
2. Key terms
In order to know what it is we are going to measure, we first need to clarify the key terms used. The terms presented below are a result of a process combining and developing previous terminology of various kinds (e.g. Hornback & Eagles, 999, Erkkonen & Sievänen 200, Lindhagen & Ahlström 2005b, Naturvårdsverket 2005b). This list includes only the key terms used in this manual, and should one need to go into more details, we recommend Hornback & Eagles (999), which has good and much more detailed definitions of the related terminology.
Typography: Swedish Danish Finnish Lithuanian Estonian Norwegian
Visitor [Besökare, Gæst/Besøgende, Kävijä, Lankytojai, Külasta-ja, Brukar/besøkande] is someone who visits a nature area for the primary purpose of recreation, for example hiking, berry picking or mountain biking. A visitor is a person not working in the area. The origin of the visitor can range between anywhere from the local community to foreign countries. In some contexts, a visitor can also be called a user, customer, guest or tourist.
Visitor monitoring [Besökarundersökningar (besöksräkningar och/eller besökarstudier), Friluftsovervågning/Gentagne be-søgsstudier, Kävijäseuranta, Lankytojų stebėsena, Külastajate seire, Brukar-/ferdselsovervaking eller gjentakande brukarundersøking] means all the different counting and survey exercises that are imple-mented in order to obtain systematic, repeated and reliable informa-tion about visitors and/or visits which is comparable across time.
Visitor counting [Besöksräkning, Tælling af besøgende, Kävi-jälaskenta, Lankytojų skaičiavimas, Külastajate loendus, Ferdselsteljing] means monitoring of area use by one or several methods, e.g. direct observation and immediate recording, measurement by instru-ment, or recording by registration form (such as fee collections).
Visitor survey [Besökarstudie, Brugerundersøgelse, Kävijätut-kimus, Lankytojų tyrimai, Külastajauuring, Brukarundersøking/brukarintervju] is a study by means of which researchers or manag-ers obtain up-to-date information about an area’s visitors and their

35
opinions, expectations, and behaviour. The survey is performed on an area’s visitors, using questionnaire or interview methods.
Visitor flow [Besöksmönster, Besøgsmønster, Kävijävirta, Lankytojų srautas, Külastajavoog, Bruksmønster] describes the spatial and temporal distribution of visitors in a particular area.
Visit [Besök, Besøg, Käynti, Apsilankymai, Külastus/Külas-tuskord, Tur/Besøk] is a measurement unit involving a person (visitor) going on to the lands and waters of an area for the purposes mandated for the area. Typically, the mandated purpose for the visit is outdoor recreation for nature areas and cultural appreciation for historic sites. Definitions of recreation are many.
Number of visits (Visitation) [Antal besök, Antal besøg, Käyn-timäärä, Apsilankymų skaičius, Külastuste/Külastuskordade arv, Tal besøk/turar] is the sum of visits during a period of time. Visitation is usually summed for use during periods, such as daily, monthly, quarterly or annually.
In a population consisting of five individuals (A, B, C, D and E) 80% (4/5) of the individuals are forest visitors in a given period. In that period they make a total of six visits to the forest, adding up to 10 visitor-hours, spent in the for-est. A makes 50% (3/6) of the visits, B 17% (1/6), and E 0%. A is therefore the one who, in the given period, has made the most frequent visits to the forest. B, however, with 50% (5/10) of the visitor-hours, is the one who has used the forest most intensively. Source: Koch 1978.
The situation is described for example by Driver et al. (99, p. 7): “We are /…/ left with varied definitions and orientations. We do not see this as a serious problem because of the rather commonly held intuitions and understandings of what leisure and recreation are which seem to differ more in nuance than substance and which seem to serve rather specific purposes for different people.”
x hours per visit
A
B
C
D
E
½½
1
5
1
2
X
36
Number of visitors [Antal besökare, Antal gæster/besøgende, Kävijämäärä, Lankytojų skaičius, Külastajate arv, Brukartal] describes how many visitors visit the area per time unit.
Duration of visit (Length of stay) [Besökets längd, Besøgs-varighed, Käynnin kesto (Viipymä), Apsilankymo trukmė, Külas-tuse kestvus, Besøkslengde (i tid)] describes the length of time a visit lasts. Duration of visit is measured in minutes, hours, or days. The measurement begins at the moment of arrival at the area and ends at the moment of departure (c.f. visitor hour). Many times, the visit statistic has no length of stay data associated with it. However, the collection of additional data on the length of stay of a visit allows for the calculation of visitor hour and visitor day figures (see below).
Visitor hours [Besökstimmar, Besøgstimer, Kävijätunti, Lankymo trukmė valandomis, Külastustund, Besøkstimar] or Visitor days [Besöksdag, Besøgsdage, Kävijävuorokausi, Lankytojų dienų skaičius, Külastuspäev, Besøksdagar] describes the total amount of time either in hours or in days (2 h) that all the visitors stay in the area while visiting for a purpose mandated for the area.
Visitor nights [Övernattningar, Besøgsovernatninger, Yöpyjien määrä, Lankytojų nakvynių skaičius, Ööbijate hulk, Overnat-tingar] is the count of persons staying overnight in an area for a purpose mandated for the area.
Visitor profile [Besökarprofil, Brugerprofil/-karakteristik, Kävi-järakenne, Lankytojų struktūra, Külastajate profiil, Brukarprofil/-karakteristikk] depicts the distribution of visitors according to gender, age, educational level, place of residence and other personal factors.
Counter [Räknare, Tæller, Laskuri, Skaičiuoklis, Loendur, Teljar] is a mechanical or electronic device for registering (counting) people, animals, vehicles, etc. which pass by a given location. A counter may include several components, but the usual configuration consists of a transmitter and a receiver or reflector. Unless otherwise specified, the term “counter” in this manual refers to equipment consisting of both a receiver and a transmitter.
Logger=Data collector [Logger/Datasamlare, Datalogger, Tie-donkeruuyksikkö, Duome-nų kaupiklis, Loger/Andmekogumis-seade, Datasamlar] is a small apparatus which can be programmed to record and store data at specific time intervals.
Sensor [Sensor, Sensor, Sensori, Sensorius, Andur, Sensor] is the component that registers the signals which activate the counter.

37
3. Visitor counting

38
3. Visitor counting1
SU M MARY
Visitor counts produce data on the amount of recreational use (visits), and on the temporal and geographical distribution of those visits. This kind of information may be needed on an hourly, daily, weekly, monthly, seasonal or yearly basis, depending on the area.
Visitor numbers can be gathered using various methods, including: . Indirect methods:
• Signs of use: tracks, wear and tear on vegetation and terrain • Guest books in cabins, trail logs, and other self registration
methods • Fishing and hunting licenses, permits, parking and entrance
fees, statistics, and other documents • Information from other agencies or companies
2. Direct methods: • Manual observation by personnel at ground level • Observations from the air
3. Automatic methods: mechanical and electronic counters, • Vehicle counters • Person counters • Electronic counters combined with digital or video cameras.
Each of these methods has its strengths and weaknesses. Only in the case of counters can the weaknesses be compensated by systematic procedures which allow reliable, accurate and consistent estimates of the number of visits.
Counter readings do not directly give the number of visits to a certain area. In order to obtain an estimate of the actual number of visits, all the counters have to be calibrated, after which the counter readings are corrected with the calibration coefficient obtained.
With single counters, one reaches only that proportion of the visitors who go past those counting points. If there is a need for information on the area’s total number of visits, as is often the case, this can be estimated on the basis of the point-counting results by using the area’s correction coefficient as follows: one day’s number of visits for the whole area = counter’s observation x counter’s correction coefficient x area’s correction coefficient
1 This chapter includes some parts from Horne et al. 998 and is printed with the kind permission of the authors.
Fishing licenses purchased can give a rough estimate of the number of fishermen in an area. Norway. (PHOTO: JOSTEIN SKURDAL)

39
3.1. Introduction to visitor countingVisitor counts produce data on the amount of use (visits), and on the temporal and geographical distribution of those visits. This chapter will familiarise the reader thoroughly with the performance of visitor counting.
Visitor counting begins with the need to have more information on the number of visitors and visits to a particular area or zones within an area. Depending on the area, the information on the amount of visits may be needed on an hourly, daily, weekly, monthly, seasonal or yearly basis.
Knowing the amount of visitation provides a good start for decision making related to visitors, services, and environmental management. Information obtained by visitor counting is important in prioritising development of the area’s structures and service facilities, for example. For the areas’ managers or planners, there is more benefit in having even an approximate knowledge of the amount of visitation than in trying to guess those numbers.
Visitor counting combined with knowledge obtained from visitor surveys (e.g. visitor characteristics, group size, mode of travel; see chapter 4) gives more detailed information about the volumes of dif-ferent types of visitors. Another way of obtaining more information than merely the numbers of visits are visitor counting techniques using video monitoring. This kind of detailed information gives management a more solid knowledge base than mere information on the numbers of visits and their spatial and temporal distribution.
3.2. Selecting methods In selecting suitable visitor counting methods, one should take into account the goals of the counting (accuracy, visits by activities, etc.), type of area, seasons to be covered and the resources available. Well chosen methods yield accurate and detailed enough results in rela-tion to the costs. It is important that counting is done systematically, while recognising the sources of error. The staff of the area forms a crucial factor in regard to how carefully and systematically the measurements are being made. For example, the counters need to be read regularly and according to the schedule.
The amount of staff and other resources available restricts the choice of method and the extent of the counting. For example, the available resources limit the number of entrance points at which counting can be carried out. If counting is to be done on a constant basis, it is advisable to use a method requiring little resources. The results can be checked every few years (2–5 years), or if the number of visitors is likely to have changed significantly, with another – pos-sibly more resource intensive – method. For example, one year of
40
Visits can be counted using more or less technology, and it is often advisable to combine two or even several methods in order to be cost efficient and to increase the reliability of the results. Earlier, the estimates were based on trail logs, the examination of footprints and deterioration of the trails, various permits and best estimates made by personnel working in the areas. However, with visitor counters it has become possible to arrive at more systematic and reliable estimates of the number of visits to the areas in question.
Nowadays, it is most common to calculate visits on mechanical or electronic counters suitable for the particular circumstances, and to correct them based on direct observations. In addition to these, trail logs, in which the visitor can write comments, remain useful tools for estimating the number of visits. Visitor surveys implemented in the same area yield additional information on visits (duration, spatial distribution, and so on).
The collection of visitor data can take place either continually, on the basis of an annual cycle, or at an interval of some years. The area’s development needs will determine how intensively visitor informa-tion is gathered. In an area whose usage is growing vigorously and changing quickly, ongoing yearly monitoring may be necessary. At areas where use is stable and the changes are slow, a less frequent intensity of measurement (preferably at least as often as every 2–5 years, however) is adequate.
The choice of counter model and type is influenced by the character-istics of the site and the amount and quality of the information needed. The features of the installation site to be considered include the width
intensive counting, aiming at covering all the entrance points, can be carried out. During the less intensive years of visitor counting, just a few counters will allow extrapolation of the results to the rest of the entrances, assuming that the visitor flow patterns remain the same.
EXAM PLE
Pallas-Ounastunturi National Park (Northern Finland) is a long but narrow park with plenty of entrance points. In 2003 intensive counting was implemented with 20 counters aimed at covering all the entrance points.
In 2004, only a few counters were used, and the results were extrapolated to the rest of the entrances, assuming that the visitor flow patterns remained the same as in 2003.
In 2005, Pallas-Ounastunturi National Park was enlarged, be-coming part of Pallas-Yllästunturi National Park. Consequently, a new period of intensive counting was required.
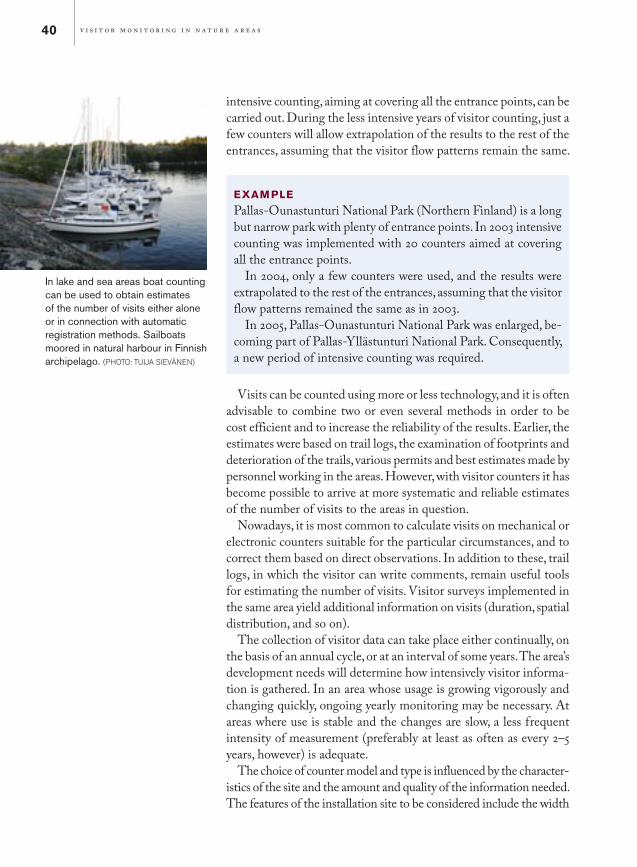
In lake and sea areas boat counting can be used to obtain estimates of the number of visits either alone or in connection with automatic registration methods. Sailboats moored in natural harbour in Finnish archipelago. (PHOTO: TUIJA SIEVÄNEN)
41
of the passage, the possibilities for reading, monitoring and installing the counter, and the electricity supply available. Another consideration in selecting the counter model is whether the information is needed all year round or not. The sites for installing visitor counters should be chosen so that they give the most representative picture of the movements of visitors in the area. In selecting the site, the focuses of visitor traffic in the area must first be defined. At the beginning this is accomplished using the best available local knowledge of personnel.
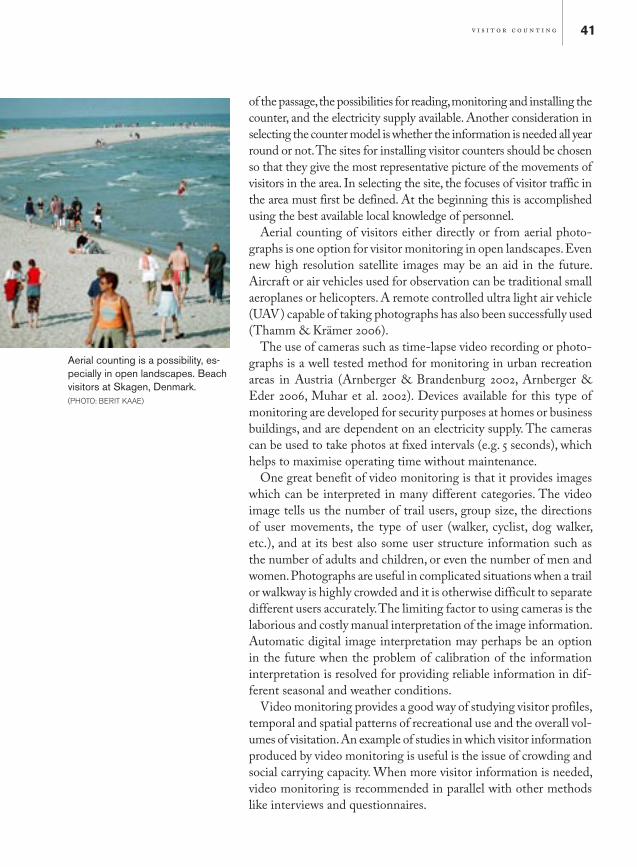
Aerial counting of visitors either directly or from aerial photo-graphs is one option for visitor monitoring in open landscapes. Even new high resolution satellite images may be an aid in the future. Aircraft or air vehicles used for observation can be traditional small aeroplanes or helicopters. A remote controlled ultra light air vehicle (UAV) capable of taking photographs has also been successfully used (Thamm & Krämer 2006).
The use of cameras such as time-lapse video recording or photo-graphs is a well tested method for monitoring in urban recreation areas in Austria (Arnberger & Brandenburg 2002, Arnberger & Eder 2006, Muhar et al. 2002). Devices available for this type of monitoring are developed for security purposes at homes or business buildings, and are dependent on an electricity supply. The cameras can be used to take photos at fixed intervals (e.g. 5 seconds), which helps to maximise operating time without maintenance.
One great benefit of video monitoring is that it provides images which can be interpreted in many different categories. The video image tells us the number of trail users, group size, the directions of user movements, the type of user (walker, cyclist, dog walker, etc.), and at its best also some user structure information such as the number of adults and children, or even the number of men and women. Photographs are useful in complicated situations when a trail or walkway is highly crowded and it is otherwise difficult to separate different users accurately. The limiting factor to using cameras is the laborious and costly manual interpretation of the image information. Automatic digital image interpretation may perhaps be an option in the future when the problem of calibration of the information interpretation is resolved for providing reliable information in dif-ferent seasonal and weather conditions.
Video monitoring provides a good way of studying visitor profiles, temporal and spatial patterns of recreational use and the overall vol-umes of visitation. An example of studies in which visitor information produced by video monitoring is useful is the issue of crowding and social carrying capacity. When more visitor information is needed, video monitoring is recommended in parallel with other methods like interviews and questionnaires.
Aerial counting is a possibility, es-pecially in open landscapes. Beach visitors at Skagen, Denmark. (PHOTO: BERIT KAAE)

42
Technical development in cameras promises a wider application range for this methodology in the future. For example, solar panels equipped with buffer batteries offer an opportunity to use cameras also in areas where a standard electricity supply is not available. Wireless reading of the observations with the aid of mobile phones is already available.
Methods for inventorying visitor numbers and visits can be divided into indirect methods, direct observation methods and automatic registration methods. These work in different situations and all have their advantages and disadvantages (Table ).
Table 1. Summary of methods used to count visits to nature areas. Expanded from Lindhagen and Ahlström 2005b, Table 9.
Method Type of area Advantages Disadvantages Examples
Indirect methodsSigns of use: tracks, wear and tear on vegetation and terrain
All kinds of land areas
Can be used as a first indication of use.
Reactive and inaccurate method.
*For an example of a recent setup to estimate use level from the degree of impact on the ground see http://www.friluftseffekter.dk/fviewer, only in Danish.*Trampling impact on soil, vegetation etc., is being used intensively for monitoring general effects on paths and camping sites. Application of this sort of recording estimating use levels (number of tents per year, number of crossings per day) is more questionable. It can be ex-pected that relative use levels within a narrow environmental setting (i.e. similar weather, soil and vegetation type) can be assessed by means of trampling levels – but not in general over larger areas or for diverse nature types (Skov-Petersen 2006, Cole & Bayfield 1993, Cole 2006).
Guest books in cabins, trail logs, and other self registration methods
Large areas where use is scattered, and where it is difficult and expen-sive to otherwise observe visits.
Inexpensive. Self-selection bias. *Trail logs in Fulufjället NP, Rogen-Långfjället Nature Reserve, Pallas-Yllästunturi NP *Guest books in large Finn-ish National Parks.
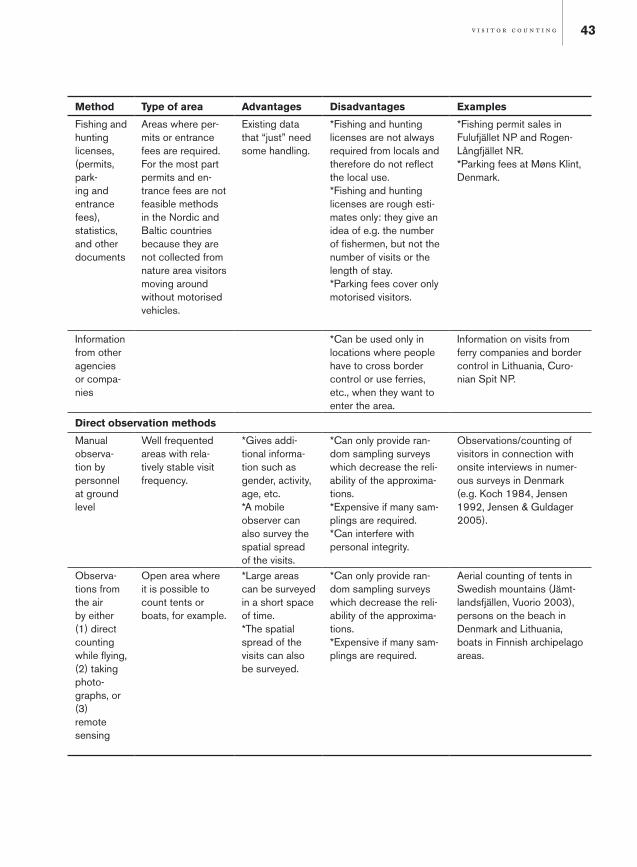
43
Method Type of area Advantages Disadvantages Examples
Fishing and hunting licenses, (permits, park-ing and entrance fees), statistics, and other documents
Areas where per-mits or entrance fees are required. For the most part permits and en-trance fees are not feasible methods in the Nordic and Baltic countries because they are not collected from nature area visitors moving around without motorised vehicles.
Existing data that “just” need some handling.
*Fishing and hunting licenses are not always required from locals and therefore do not reflect the local use.*Fishing and hunting licenses are rough esti-mates only: they give an idea of e.g. the number of fishermen, but not the number of visits or the length of stay.*Parking fees cover only motorised visitors.
*Fishing permit sales in Fulufjället NP and Rogen-Långfjället NR.*Parking fees at Møns Klint, Denmark.
Information from other agencies or compa-nies
*Can be used only in locations where people have to cross border control or use ferries, etc., when they want to enter the area.
Information on visits from ferry companies and border control in Lithuania, Curo-nian Spit NP.
Direct observation methods
Manual observa-tion by personnel at ground level
Well frequented areas with rela-tively stable visit frequency.
*Gives addi-tional informa-tion such as gender, activity, age, etc.*A mobile observer can also survey the spatial spread of the visits.
*Can only provide ran-dom sampling surveys which decrease the reli-ability of the approxima-tions.*Expensive if many sam-plings are required.*Can interfere with personal integrity.
Observations/counting of visitors in connection with onsite interviews in numer-ous surveys in Denmark (e.g. Koch 1984, Jensen 1992, Jensen & Guldager 2005).
Observa-tions from the air by either (1) direct counting while flying, (2) taking photo-graphs, or (3)remote sensing
Open area where it is possible to count tents or boats, for example.
*Large areas can be surveyed in a short space of time. *The spatial spread of the visits can also be surveyed.
*Can only provide ran-dom sampling surveys which decrease the reli-ability of the approxima-tions.*Expensive if many sam-plings are required.
Aerial counting of tents in Swedish mountains (Jämt-landsfjällen, Vuorio 2003), persons on the beach in Denmark and Lithuania, boats in Finnish archipelago areas.

44
Method Type of area Advantages Disadvantages Examples
Automatic registration methods: mechanical and electronic counters, combined or not with digital or video camerasVehicle counters
Areas to which most visitors arrive by car and where visitors’ cars can be distinguished from other cars.
*Measures continually over time and sup-plies measure-ment values per time interval.*A relatively large market for vehicle counters makes it easier to get service, support, etc.
*Additional informa-tion on the number of visitors per car, as well as ensuring that visitors actually visited the area, is needed to obtain reli-able approximations.
*Traffic (car) counting at four forest parking areas since 1977 in Denmark (Koch 1980).*Car counting at some of the destinations in RMK recreational areas
Person counters
Especially areas where significant amount of travel is on terrain as opposed to water travel, and at some points most of the travel is concen-trated on a narrow path, stairs or bridge.
*Measures continually over time and sup-plies measure-ment values per time interval.
*Additional information on the number of visitors who have gone past the equipment, entrance and exit visitors, etc., is needed to obtain reliable approximations on the total number of visits, i.e. for calibration.*Technical failure due to weather, sabotage etc.
*Numerous examples in the Nordic and Baltic countries (see Kajala 2006, Appen-dices).
Electronic counters combined with dig-ital or video cameras
Especially urban settings.
Good way of studying visitor profiles, temporal and spatial patterns of recreational use and the overall volumes of visitation.
*Laborious and costly manual interpretation of the image information.*Can interfere with personal integrity.
Monitoring in urban recrea-tion areas in Austria (e.g. Arnberger & Brandenburg 2002, Arnberger & Eder 2006).
After this overview of the various methods available, the manual focuses on methodology related to automatic registration methods, especially electronic counters, and on how to calibrate and calculate the final results with the aid of manual observations. The other meth-ods have, of course, their justifications, and they may be the optimal solution in certain situations. However, in most cases the automatic registration methods allow for the most systematic procedures which are able to produce reliable, accurate and consistent estimates of the number of visits at a given point.
Descriptions of counting methods in practice other than automatic registration methods combined with observations is available in English, for example in Lindhagen and Ahlström (2005b, also avail-able in Swedish, Lindhagen and Ahlström 2005a), American visitor survey manuals (Yuan et al. 995, Watson et al. 2000), and a Scottish

45
manual on visitor monitoring (Dales et al. 993). In Finnish there is a description of methods other than counters in Horne et al 998. In Danish some other methods are described in e.g. Koch (980, 984), Jensen (992, 2003) and Jensen & Guldager (2005).
3.3. Visitor counting based on automatic registration
3.3.1. Stages of visitor counting by countersAll in all, visitor counting includes several successive and in part overlapping phases (see attached figure). The phases generally pertain to all visitor counts and they follow each other more or less chronologically. However, once the planning and installation of counters has been done with care, these tasks need not be repeated on an annual basis.
The stages of visitor counting when using counters.
3.3.2. Planning: General matters to be considered when selecting counters
A basic requirement for any piece of technical equipment intended to be used for counting visitors outdoors is that it is dependable and will run without interruption. It should be able to work regardless of season or weather conditions. Out in the field it should be easy to handle, install and calibrate and it should enable readings to be taken or data to be downloaded without the checker needing to possess specialised skills.
Other aspects of significance are:• What is the purpose of the counting, and the selection of the
counting site• What should the counter be measuring – vehicles or people?• The amount and quality of the information needed. The need for
continuous and/or year-round information is greater the more fre-quently visited the area is. Related to the quality of the information
Installation of the counters
Monitoring the counters
Correction coefficients
Calculations
Reporting
Utilising results
Planning

46
needed, the number of expected entries can affect the applicable technology, e.g. by affecting the degree of spatial accuracy (the number of passages per time unit that can be registered) and in terms of the optimal setting of time intervals.
• The need for distinguishing between in- vs. out-going passages• Features of the installation site:
o the width of the passage o possibilities for minimising the error effects by choice of instal-
lation site (so that e.g. birds, leaves, and other debris which flash past are not registered)
o the possibilities for calibrating, reading, monitoring and install-ing the counter
o the electricity supply available vs. the energy source needed. The battery number and type is not only significant in relation to the power consumption and lifespan between battery changes but also in regard to the size and weight of the equipment itself.
• The possibility to hide or camouflage the equipment to avoid vandalism, interference and bogus registration.
Each type of system has advantages and disadvantages and different capabilities under different conditions. Consequently, it is important to make the choice based on the specific conditions prevailing, such as climate and expected weather conditions, terrain, accessibility of the measuring point, routine maintenance, purpose of measurement, type of object to be measured (persons travelling on foot, on horseback, by snowmobile, bicycle, car, etc.), level of accuracy needed, and so forth.
In the following chapter some general guidelines are given re-garding the applicability of different technical solutions to various situations. For more technical details, one should consult the manu-facturer’s manual in each individual case.
3.3.3. Planning: Technical principles and alternatives available2
There is a fairly large selection of both electronic and mechanical counters available for visitor counting. The mechanical counters are far more simple and cheaper than the electronic ones. Generally, mechanical counters are stroke counters, which can be built into the structure of a door or its lock (bolt), on turnstiles or under steps or boardwalks.
The electronic counters comprise a power source, a sensor that reacts when someone or something passes by, and a counter that
2 This chapter is slightly modified from Lindhagen and Ahlström 2005, and is printed with the kind permission of the author.
Mechanical counters require an innovative approach from the managers. Mechanical counters can be built in a boardwalk or even to a door of an outhouse. (PHOTOS:
HEIKKI IISALO)

47
registers the number of passers-by. The power source is generally an enclosed lead or nickel battery, which is selected to suit the counter and its application.
Generally, in modern equipment the counter is integrated into a data collection unit that registers, saves and sorts the measurement data. The following functions are usually available for these types of counters:• The data collector can be programmed with start times and meas-
urement intervals spanning periods from minutes to days.• The collected data can either be copied to a memory card for fur-
ther processing, or it can be transferred to a stationary computer or directly to a laptop onsite.
• Software for the data collector• Software and computer for reporting the measurement results.
Schematic illustration of an outdoor counting system for visitors. (modi-fied and redrawn from Lindhagen and Ahlström 2005b, p. 29)
One advantage of having a counter integrated in a data collector is that measurements are automatically made per time unit, for instance per hour. This reduces the need to read the counter very often, and allows for tracking down any inconsistencies and check-ing them out.
Nowadays, many systems can be combined with a camera or video camera connected to the sensor. However, the risk of vandalism increases when expensive equipment is left unattended outdoors. Another consideration is that in the Nordic and Baltic countries there are laws regulating camera surveillance, and one should check that usage of this kind of device is not in violation of those laws.
3.3.3.1. Sensors A variety of sensor types are found in counting equipment:• Optic sensor. A beam of light (normally infrared) that is broken
when someone passes it, or which is reflected towards the passer-by.
DATA-COLLECTOR
COUNTER
TRANSMITTERRECEIVER
SENSOROpticPyroelectricUltrasoundRadioSeismicInductive
DISPLAY

48
• Pyroelectric sensor. A lens that reacts to infrared radiation emitted by the human body.
• Ultrasound. A sound cone that is broken when someone passes it or which is reflected towards the passer-by.
• Radio transmitter. A “radio wave” between sender and transmitter which is broken when someone passes through it.
• Seismic sensor. A cable or pressure pads reacting to pressure or vibration.
• Inductive sensor. A buried copper cable whose electromagnetic field reacts to passing metal (e.g. cars or bicycles).
Optic sensorsOptic sensors work using a transmitter and receiver for light. The lower temperature limit for most of these sensors is around -20 C, but there are those that can manage cold down to -40 C. For all optic sensor based systems there is a risk that the sensor lens can become dirty, foggy or covered in snow, which affects the function and limits their usability. The risk can be minimised by using a cover of some sort. The problem with fogging up of the lens is greatest during wet weather and temperatures of around 0 C. The effect can be minimised by shortening the distance between the sensor and reflector or receiver, whereby the beam of light becomes stronger and has more penetration.
Optic sensors work according to one of three different principles:• Direct sensing of one-way light. A beam of light from a trans-
mitter is reflected from the measured object back to a receiver. Both the transmitter and receiver are contained in the sensor unit. Normally used for distances of less than 5 metres.
• Mirror reflecting light (retro-reflective). A beam of light from the sensor unit’s transmitter is reflected from an opposite reflector back to the sensor unit’s receiver. The distance from transmitter/receiver to reflector is less than 35 metres
• Separate transmitter and receiver. The beam of light goes from the transmitter to an opposite receiver. Allows long measurement distances, in certain cases of up to 90 metres. The system requires either separate batteries for the transmitter and receiver or a power cable between the two units.
Optic sensors work using different kinds of light:• Visible white light is often used for opening doors, for example
entrances to shops, but it is sensitive to disturbance and can react to fog, snowfall and rain, making it less suitable for equipment that is to be used outdoors for a longer period of time.
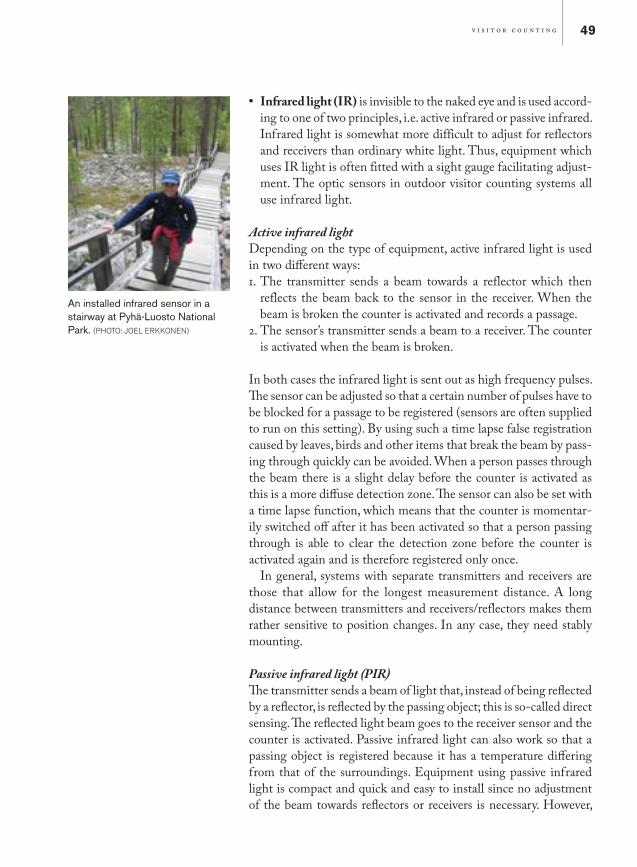
49
• Infrared light (IR) is invisible to the naked eye and is used accord-ing to one of two principles, i.e. active infrared or passive infrared. Infrared light is somewhat more difficult to adjust for reflectors and receivers than ordinary white light. Thus, equipment which uses IR light is often fitted with a sight gauge facilitating adjust-ment. The optic sensors in outdoor visitor counting systems all use infrared light.
Active infrared lightDepending on the type of equipment, active infrared light is used in two different ways:. The transmitter sends a beam towards a reflector which then
reflects the beam back to the sensor in the receiver. When the beam is broken the counter is activated and records a passage.
2. The sensor’s transmitter sends a beam to a receiver. The counter is activated when the beam is broken.
In both cases the infrared light is sent out as high frequency pulses. The sensor can be adjusted so that a certain number of pulses have to be blocked for a passage to be registered (sensors are often supplied to run on this setting). By using such a time lapse false registration caused by leaves, birds and other items that break the beam by pass-ing through quickly can be avoided. When a person passes through the beam there is a slight delay before the counter is activated as this is a more diffuse detection zone. The sensor can also be set with a time lapse function, which means that the counter is momentar-ily switched off after it has been activated so that a person passing through is able to clear the detection zone before the counter is activated again and is therefore registered only once.
In general, systems with separate transmitters and receivers are those that allow for the longest measurement distance. A long distance between transmitters and receivers/reflectors makes them rather sensitive to position changes. In any case, they need stably mounting.
Passive infrared light (PIR)The transmitter sends a beam of light that, instead of being reflected by a reflector, is reflected by the passing object; this is so-called direct sensing. The reflected light beam goes to the receiver sensor and the counter is activated. Passive infrared light can also work so that a passing object is registered because it has a temperature differing from that of the surroundings. Equipment using passive infrared light is compact and quick and easy to install since no adjustment of the beam towards reflectors or receivers is necessary. However,
An installed infrared sensor in a stairway at Pyhä-Luosto National Park. (PHOTO: JOEL ERKKONEN)

50
direct sensing is less precise than other methods. The approaching light is weaker in comparison to a system with active infrared light. This gives an increased risk of incorrect registration as a result of light and temperature changes in the surrounding environment. For example, the sensor may be activated by rain, snow and fog. There is also the risk of the light beam being reflected in the wrong direction due to shiny parts of clothing or items carried. Furthermore, the pas-sive system uses a wider detection zone, which needs a longer time lapse. There is a chance that not everyone gets registered if they pass the beam close to one another. The passive infrared system is most suitable when a small light system that is quick to install is called for and/or the demand for measurement accuracy is not too high. LaserIn addition to visible white light and infrared light, laser beams do function technically in optic sensors. A laser transmitter has a much longer reach and the thin laser beam is able to penetrate dirt and fog on the sensor lens, as well as to cope with snow, rain and fog, better than infrared light. Lasers are available featuring both visible and invisible red light. A visible laser puts a sharp red dot on the person passing it, a characteristic that can make it less suitable for counting visitors. Moreover, laser beams are not entirely safe; it can be hazardous to one’s eyesight to look directly into a sensor. In addi-tion, a laser sensor and receiver require a very high setting precision which can be difficult to achieve in the field.
Pyroelectric sensorsA pyroelectric sensor contains a lens that is sensitive to infrared radiation emitted by the human body. The lens detects each time a person passes. Where the passage at the installation site is narrow, two people following each other closely can be counted correctly. For wide passages, two lenses can be placed facing in opposite directions. It is also possible to differentiate the direction of the person with certain types of sensors/data collectors.
Since no reflector is necessary (the body passing the device is the reflector), the pyroelectric sensor has an advantage in open spaces without trees, bushes, or other vertical features (e.g. in an open mountain landscape). Pyroelectric sensors have a wide temperature range of from -40 °C to + 50 °C and their minimum sensibility is a °C difference between the body and the outdoor temperature. Pyroelectric technology and optical counting technologies in gen-eral must comply with installation requirements that are stricter than for other types of sensors such as acoustic slabs. (http://www. eco-compteur.com/Pyroelectric-Sensor.html?wpid=5387).
An example of camouflaging a Pyroelectric sensor, Arctic Circle Hiking Area, Finland. (PHOTOS: JOEL
ERKKONEN)

51
EXAMPLE
Using electronic counters in Pallas-Yllästunturi National Park, Finland Eco-counter (model: Eco Twin + Middle range Pyro Lens)
In Finland, Metsähallitus observes and reports the number of visits to national parks annually. Pallas-Yllästunturi National Park, established in 2005, is a relatively narrow, but more than 00 km long, park stretching from north to south. Due to its shape and the large amount of entrance points, it is a very challenging area as regards covering strategic points with counters. All in all, 0 counters were set up in 2005 in the most critical locations in the park. Some of the counters (especially pressure mat counters) were suitable only for summer use, while some other counters were able to work all year round.
Four Eco-counters (model: Eco Twin + Middle range Pyro Lens) were chosen to work all year round in order to produce a more reliable estimate of the number of visits and seasonal changes in the recreational use volume within the park. Counters of this type are especially suitable for trails which are less than 4 metres wide. Even though they are relatively expensive, there were several important reasons why they were chosen: • Waterproof and a wide operating temperature for demanding
weather conditions (from – 40 °C to + 50 °C)• The direction of approach of visitors can be observed separately
(two sensors ‡ in and out of the park)• Data can be stored for each hour in a data collector (‡ numbers
are also visible on the display) • Maintenance is easy and cost effective (a counter should work
for as long as 0 years without the need to change its batteries ‡ a very important advantage in remote conditions)
The number of visits to Pallas-Yllästunturi National Park in 2006 was 30,000. This was estimated using 0 visitor counters. Based on the experience from Pallas-Yllästunturi National Park, Eco-counters seem to have great potential in visitor monitoring and the park personnel are satisfied with them, although some problems caused by extreme weather conditions such as snowstorms have occurred.
It takes some time for the park personnel to get used to the new technology. However, once park personnel have learned to make the most of the possibilities of such counters, it is very likely that this kind of visitor counting technology will also increase in other nature areas in Finland.

52
UltrasoundUltrasound systems function much in the same way as infrared light sys-tems. Instead of a light beam the transmitter sends out a high frequency sound cone, either through direct sensing or to a separate receiver. Once the sound cone is reflected by a passing object the counter is activated. Just as with an IR system one can adjust the sensor with a time delay to avoid false registration of birds, leaves, and so on passing through the sound cone. The sound cone has a wider spread than an infrared beam and can accept a larger recipient area for reflection than a light beam. The ultrasound signal intensity can be affected by air temperature and ultrasound sensors are more sensitive to cold than IR sensors. Generally, they tend to function poorly in temperatures of below 0ºC. However, there are sensors for direct sensing of ultrasound with a range of 6 metres that can cope with temperatures down to -25ºC.
Radio transmittersEquipment incorporating a radio transmitter uses radio waves instead of light or sound but the principle is roughly the same. A transmitter sends out radio waves to a receiver. The radio signals are sent as a stream between the transmitter and receiver. When someone passes through the radio stream, the change in signal strengths causes the receiver sensor to activate and register a passage. One advantage of radio waves compared to IR equipment is that radio waves can pass through materials such as plastic, plywood, or a thin wooden wall, which means that the equipment can be hidden in a box or camouflaged behind signs, etc.
There is a detailed manual in Swedish and in English on using a Radio Beam Counter, the only counter commercially produced and approved by the EU transmission directive, based on radio signals, that was available in 2005 for counting visits to natural areas (Natur-vårdsverket 2005a, 2005b).
EXAMPLE
Using electronic counters in Fulufjället, SwedenChambers Radio Beam 2000 (Fredman et al. 2005, 2006)
For counting the number of visitors to Fulufjället National Park, four automatic people counters of type Chambers Radio Beam 2000 were set up at four different locations near the self registra-tion boxes. The counters are based on radio waves that can pass through thin layers of materials such as plastic, plywood and solid wood. A casing made of polycarbonate was used to protect and
A well camouflaged radio beam transmitter in Fulufjället Na-tional Park, Sweden. (PHOTO: PETER
FREDMAN)

53
conceal the counters. A radio wave of about one decimetre (approx. four inches) in width passes between a transmitter and a receiver facing each other on opposite sides of a path or trail.
When the radio signal is interrupted by a passing object, the receiver is activated to register the event. The maximum distance between the transmitter and receiver is twenty metres. The receiver is calibrated to exclude birds, leaves, branches and other extraneous objects that may pass through the radio wave. The receiver cannot interpret the direction of travel of those passing by. The data are collected in a computerised data collector in the receiver, which is programmed for the starting and stopping times (and thus the length) of the counting period. Since each counting period is limited to a maximum of 255 registrations, its length of time must be adjusted in relation to the anticipated rate of traffic at each counting site. The data can be transferred on site to a portable computer, or the data collector can be removed for data transfer to a stationary computer.
The data from the people counter include details on date, length of counting period, and numbers of passers-by during each counting period. Implausibly high figures are sometimes recorded, e.g. individual registrations or counting periods with totals of exactly 255. Such results can be a consequence of visitors pausing directly in the path of the radio signal, or of some other lengthy and/or repeated interruption of the signal. Long con-tinuous periods with 255 registrations have been coded as errors. Individual anomalous figures have been changed to the mean value for the corresponding time period during the week immediately before and after. Based on data from the counters the number of visitors to Fulufjället in the summer of 2003 has been estimated at 53,000, which is an increase of almost 40% compared to the 38,000 visitors logged in 200.
Seismic sensorsSeismic systems comprise a counter connected to a sensor reacting to vibration or pressure. Since sensor sensitivity can be adjusted along with time delay, the system can be adapted to what is being counted whilst avoiding double counting. Basically there are two kinds of seismic sensors. In one system the sensor is in the form of a plate with a built-in sensor element which reacts to pressure (a so-called pressure mat), for example when someone steps on it. The sensor plate and counter can be buried so that they are totally hidden from sight, thereby eliminating the risk of vandalism and bogus recordings. The sensor can be influenced by changes in the ground such as coldness or
54
when the ground is covered by snow that in turn affects reliability. It can also prove quite difficult to calibrate the equipment, as well as to decide on the right size of plate so that this registers only one step per passing person. The price of the mats varies depending on their size.
The other type of seismic sensor is the so-called traffic counter. The sensor is composed of a long hose which reacts to pressure. These are models that have very low power consumption, a battery lasting for up to five years. The counter can be set for different time intervals and the data can be read from a display. This type of equipment is usually used to measure vehicular traffic and to count axle pairs. If necessary, the sensor’s sensitivity can be adjusted, for example, to disregard the registration of very light vehicles such as bicycles or mopeds.
EXAMPLE
Using electronic pressure mat counters in Järvafältet, Sweden (Naturvårdsverket 2007)
In conjunction with the Swedish Environmental Protection Agency’s project Counting Visits to Natural Areas, there were three electronic pressure mat counters tested at two different locations in the Järvafältet Recreation Area. At both locations the pressure mat counters were installed just in front of a passage through a fence where people pass one at a time. All the counters in the project have a timer system, which means that only one count is recorded even if a person should happen to step on the mat twice. A pressure mat counter consists of a sensor and a pressure mat connected by a cable to a display unit and a data collector. The pressure mat is installed in an excavated hole about 0 centimetres in depth and then covered with gravel and soil, for instance. The depth of the hole will be 5–0 centimetres, plus the thickness of the pad. The ground underneath the pad has to be even, smooth, firm and properly drained. A groove is dug for the cable from the pressure mat to the display unit/data collector.
The Schmidt Electronics Pressure Pad works by means of a rubber tube which is compressed by the weight of a person walking over the mat. The displacement of air triggers a sensitive pressure sensor activating the display unit. The counter is available with a data collector.
The Eco Slab Counter and the Chambers Pressure Mat Coun-ter were installed close together at the same location. The Eco Slab Counter system consists of a pressure mat with a sensor, a data collector/display unit and a pocket PC which is synchronised with the office PC. The sensitivity of the sensor and the timer are

55
preset at the factory. The sensor is connected to a sealed display and data collector unit with battery power sufficient for 0 years. The data collector is initialised with the pocket PC. The pocket PC is also used to retrieve stored data from the data collector and to transfer the data to the office PC, where it will subsequently be processed in different ways.
The Chambers Pressure Mat Counter consists of a pressure mat/sensor connected with a cable to a protective box containing a control box and a data collector. The control box contains the display unit and has LED indicators for battery condition and sensitivity control which are activated by a magnet. The counter runs on PP3 or AA lithium batteries which will last for 4 years. The data collector is connected to the control box. The data col-lector will be connected to a PC or Laptop for downloading. The data can be read and presented on the PC in accordance with the time interval chosen when setting up the data collector.
The results from the outdoor tests have not yet been published. Tested in “laboratory conditions” all the pressure mat counters ap-pear to count with reasonable accuracy. Pressure mat counters are not recommended for use in the winter. Hard and frozen ground, ice and snow affect the sensibility of the pressure mat.
Inductive sensorsInductive systems are in principle made up of a counter connected to a buried copper cable sensor. When a metal object passes through the electromagnetic field of the cable, it activates the counter. Inductive sensors can be used to count, for instance, bicycles, cars, ATVs and snowmobiles. The cable and counter can be buried underground or in snow, thereby eliminating the risk of vandalism and bogus registra-tions. Inductive sensors can be constructed to make them capable of detecting the direction of the passing vehicles.
3.3.3.2. Technical solutions for data retrievalIn general, all types of sensors can be connected to counters and to data collectors where the gathered data can be processed. Measurement data can be read from the counter itself, or on a display, or transferred to a computer. Simpler models of IR equipment, for instance, have accumulating counters in the transmitter/receiver unit which can be read prior to and after the counting period. On the more advanced models, one can set the registration interval to hours, days, or weeks. Data is collected by a built-in data collector readable from a display showing the total number registered and the total number per interval, in chronological order. There are also IR models providing the option
An example of how well hidden an inductive sensor is: only the lines where the cables have been buried in the ground are noticeable. Photo from Store Dyrehave in Denmark, where inductive sensors have been in continuous use since 1977. (PHOTO: FRANK S. JENSEN)
Transferring data from the data col-lector to a hand computer. (PHOTO: LARS WALLSTEN)

56
of transferring data from the data collector to a PC and then setting the data out on a form or graphically illustrated. Once data is transferred to a PC, some software packages permit exporting it to e.g. spreadsheet files or other software. This can be a very useful feature, as it enables the data to be used in further statistical analyses.
The data from equipment based on radio waves cannot be read directly on a display and instead needs to be transferred from the data collector to a PC. A practical disadvantage with models where data can only be read from the display is that mist can form on the inside of the display and this can make reading difficult.
Electronic counter types based on a data collector and wireless gsm data transfer technology are also available. The counter is equipped with a gsm phone for the data collector’s data transfer. The recorded data can be read via a data interface in office conditions, or the counter can be read automatically by computer servers at the desired intervals. When choos-ing the transfer technology, one should consider the technical transfer modes available. A range of counting equipment which is available only allows transfer by serial connection, which can create problems since most present day, standard PCs are not equipped with RS232 serial ports.
3.3.3.3. The marketDue to the greater demand and easier implementation, there are many more counters intended for use indoors than there are for use outdoors. However, technical development has also been steadily progressing in conjunction with counters suitable for outdoor applications. Future prospects include e.g. mobile phone technology and a Geographi-cal Positioning System (GPS). As the technology develops and the markets grow, the tendency will be for managers to be able to increas-ingly rely on the producer without the need for developing technical expertise or employing specialised technical staff of their own.
Pressure mats work well during summer season and especially well on solid surfaces such as boardwalks. Inari Hiking Area, Finland. (PHOTOS: JOEL ERKKONEN)
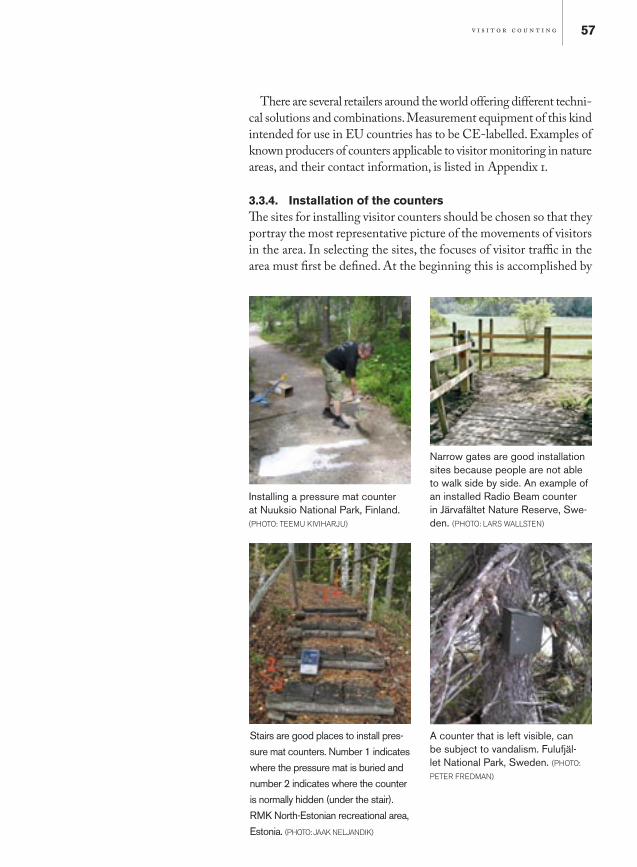
57
Installing a pressure mat counter at Nuuksio National Park, Finland. (PHOTO: TEEMU KIVIHARJU)
Narrow gates are good installation sites because people are not able to walk side by side. An example of an installed Radio Beam counter in Järvafältet Nature Reserve, Swe-den. (PHOTO: LARS WALLSTEN)
Stairs are good places to install pres-
sure mat counters. Number 1 indicates
where the pressure mat is buried and
number 2 indicates where the counter
is normally hidden (under the stair).
RMK North-Estonian recreational area,
Estonia. (PHOTO: JAAK NELJANDIK)
A counter that is left visible, can be subject to vandalism. Fulufjäl-let National Park, Sweden. (PHOTO:
PETER FREDMAN)
There are several retailers around the world offering different techni-cal solutions and combinations. Measurement equipment of this kind intended for use in EU countries has to be CE-labelled. Examples of known producers of counters applicable to visitor monitoring in nature areas, and their contact information, is listed in Appendix .
3.3.4. Installation of the countersThe sites for installing visitor counters should be chosen so that they portray the most representative picture of the movements of visitors in the area. In selecting the sites, the focuses of visitor traffic in the area must first be defined. At the beginning this is accomplished by

58
TIP
It may be important to know the exact starting time of the regis-tration intervals (whether the intervals are 9:08–9:38, 9:38–0:08, etc. or 9:00–9:30, 9:30–0:00, etc.) for the purposes of calibrating the counters (see chapter 3.3.6). This is particularly important when the calibration is made in time intervals as they often are when high use levels are anticipated.
3.3.5. Monitoring the countersThe accuracy of readings is significantly influenced by equipment selection. By selecting equipment that allows for setting the regis-tration interval, the reading process becomes easier and the reading accuracy is significantly improved compared to counters that do not allow for setting the registration interval.
using the best available local knowledge. The aim should be for the counters to cover most of the visits to the area. Sometimes there can also be a good reason to locate counters in areas that are less visited, e.g. in the case of sensitive habitats.
The counters should be located so that they are not readily dis-cernible to the public, and counters should be as protected as far as possible. Vandalism directed at counters or intentional manipula-tion of the statistics can at worst render the count useless and cause considerable financial loss.
The judicious installation of counters, combined with careful servicing and reading, is the cornerstone of visitor counting. With all counters it is best to install the counter at a place where the visitors do not usually make a stop and where they are not able to walk side by side. The best installation sites are often found at gates, duckboards, or other narrow passages. On the other hand, for example, gates can simultaneously constitute both good and very bad locations, if people move back and forth when closing the gate.
Other more technical requirements for the installation site depend on the type of counter to be used. One should therefore refer to the manufacturer’s instructions in each individual case.
EXAMPLE
In Fulufjället National Park there was a problem with people catching sight of the counters and approaching them to figure out what they were. After a few days “social trails” leading to the counters had formed, drawing even more attention to them. Con-sequently, the counters had to be moved to another location.

59
When the information produced by counters is collected on site and there is no possibility of setting the registration interval for the coun-ter, it is especially important for the counters to be read and serviced regularly. When reading the counter on site, the time of day, date and reading are recorded. The difference between successive readings constitutes the reading interval i.e. the information on the number of visits between readings. The reading interval is influenced directly by the accuracy of the available information or the data needed. The more accurate the required data, the more frequently the counter must be read. For collecting particularly accurate information the counter should be read at the same time of day on different days.
In connection with reading, the functioning of the counters, the direction and camouflaging of the sensors are checked, and batteries are changed where necessary. The interval for changing batteries depends greatly on the power consumption of the equipment used, and on the capacity of the batteries. During servicing, possible sources of error are also checked. There should be no branches, grass or brushwood in the line of the optic sensors, ultrasound sensors or radio beam transmitters, for instance. Errors in readings have often been found to be due to grass or brush that has grown during the summer. In practice, the data for such an interval has to be discarded, or an estimate made of the visits during that period.
In order to ensure quality and commensurability of the results, the personnel participating in the counts should be trained to deal with the basic elements and aims of visitor counting, as well as counter technology and installation techniques. In the context of basic elements and aims, training should also aim to influence attitudes. Positive attitudes in personnel are very important for the success and development of visitor counting. The training can also include teamwork covering the installation of various counters, calculation of coefficients and checking of results when using visitor counting.
EXAMPLE
In Finland, 50 rangers employed by Metsähallitus all round the coun-try went through a 2-day training session in 2004. This was seen as a necessity to ensure quality counting results. A necessary prerequisite for a successful training session is that there are established guidelines for the agency and informative training material.
3.3.6. Defining correction coefficients for countersCalibration is needed because each counter calculates visitors some-what differently, depending on the installation of the counter, its placement and the quality of the counter. Secondly, different weather
60
conditions may affect the counters. For these reasons, each counter must be calibrated independently, after which each counter has its own coefficient. After calibration one can calculate the counter’s final result. Thereafter it is possible to calculate the estimated total number of visitors to a specific area (see chapter 3.4).
The readings given by counters describe the number of visits at best as relative changes in readings between counting intervals. In order to establish the actual number of visits, all the counters have to be calibrated. A qualitative and technical correction coefficient is defined for each counter separately because the counters give er-roneous readings. Technical errors are caused by characteristics of the counter and the installation site. Such errors are caused, for example, when visitors are side by side or too close to each other, especially when the passage is wide. In addition, weather conditions (misting or ice) may cause technical problems. Qualitative errors are caused by movements that do not represent real customers or visitors. These include movements of servicing and other personnel and animals, for example birds, or reindeer in northern areas.
The counters are calibrated by observing the counting stations at different times of day (and at different times of year, if the area is one that is used all the year round). It is advisable to use a standardised observation form so that every counter is calibrated on the same basis (Appendix 2). During observations, the times at which the observa-tion period began and ended, the passers-by, their number and direc-tion of movement and (other) factors that might affect the counter’s results (such as visitors going round or passing the counter several times or walking side by side with another person) are recorded. All factors that have been observed are recorded during specific observa-tion periods (e.g. one hour). For each calibration interval there should be at least 4–6 hours of observation. In order to calculate correction coefficients, several calibration intervals are required, preferably 4–6, yielding at least 30 hours per season. The more calibration intervals that are included in the coefficient, the more accurate the results. The calibration periods should include different weekdays, times of day, visits by different groups, and so forth.
The correction coefficient is defined for each counter on the principle that, as far as possible, only real visitors are registered and preferably only once. Visits of servicing and other personnel, or animals, etc., should be excluded from the final estimates of the number of visits. The correction coefficients help to eliminate sources of error. The counter-specific coefficient is made up of technical and qualitative factors, for example, as follows:

61
3.3.7. Calculating the number of visitsThe daily number of visits for any given location is counted by mul-tiplying the counter reading for that day by the correction coefficient described above. Weekly, monthly, seasonal or annual numbers of visits are calculated by summing up the daily numbers of visits to that location. If the counter has not functioned on certain days, estimates for those days can be calculated.
3.4. Estimating the number of visits to an area
3.4.1. Introduction With point counting (such as electronic-counter counting), one reaches only that proportion of the visitors who go past the counting points. Most of the time there is also a need for information on the area’s total number of visits. This can be estimated on the basis of the point-counting results by using the area’s correction coefficient. The number of visits to the area is calculated with the aid of the counters and the area’s correction coefficient, as follows:
Correction coefficient 0.51 = 1.12 (technical correction coefficient)× 0.92 (other than personnel – qualitative factor)× 0.96 (no passing back and forth – qualitative factor)× 0.52 (visitors entering – qualitative factor)
TIP
Depending on the need for accuracy and the resources available, calibration can analytically be devised by regression analysis. This enables analysis of the effects of weekday, year and weather condi-tions (Ploner & Brandenburg 2004, Skov-Petersen et al. 2007).
When choosing the locations for the counters, the goal has been to obtain good coverage of the area. If this is the case, the area’s correction coefficient may be relatively easy to estimate by people who know the area well. It is the percentage of visits covered by the counters.
one day’s number of visits for the whole area = counter’s observation × counter’s correction coefficient × area’s correction coefficient

62
EXAMPLE
In the Arctic Circle Hiking Area, Finland, most of the people have to cross one of two narrow bridges (Vikaköngäs or Vaat-tunkiköngäs) in order to gain access to or leave the area. These two entrance and exit points are estimated to cover 90 percent of the use. (For more details, see Kajala 2006, Appendix 3)
However, in many cases there is reason to suspect that counters are either overlooking a substantial proportion of the visitors, or there is an overlap between the counters. In these cases, the area’s correction coefficient can be estimated with the aid of comprehensive count-ing days, on which all of the area’s visitors are counted manually by observation. In this way the number of persons who do not pass through the counters’ locations also becomes clear. By relating the total number for the area, thus calculated, to the number obtained by the point counting, one can calculate the area’s correction coef-ficient for the same observation period. Using this coefficient, one can calibrate the daily figure, corrected by the counter’s correction coefficient, in order to clarify the number of visits to the entire area. All the comprehensive counting methods tend to be labour-intensive, so they are primarily worth using in support of automatic registration.
Another way of estimating the total number of visits to an area is to use visitor survey information on visitor flows (see example from RMK, Estonia in chapter 3.4.3). This approach requires among other things that the survey includes a question about destinations visited within one visit to the area, and that the list of destinations is as comprehensive as possible. This yields information about the percentage of visits to all the destinations in the recreation area. When the percentages of visits to all the destinations in the recrea-tion area have been found, it is possible to calculate the percentage of visits to the area’s destinations recorded by counters.
3.4.2. Technique of comprehensive countingComprehensive counting is based on direct observation. This can be done by the manual or visual observation of all persons entering or leaving the area, or by using an aeroplane as an aid. Table showed a comparison of the applicability, advantages and disadvantages of these methods.
This chapter describes in more detail one way of carrying out comprehensive counting with the aim of estimating the area’s cor-rection coefficient, i.e. manual observation using car-counting. The latter is a suitable method for comprehensive counting in areas where

63
visitors arrive at the area in their own cars; comprehensive counting can be performed by observing cars and their occupants either along the area’s entry roads or in car parks. In those areas (e.g. many urban recreation areas), where a significant amount of visitors arrive on foot or by bike, the car-count methodology is not as readily applicable a method for comprehensive counting.
The observations are noted on a form, for the subsequent calcula-tion of results. Observation thus requires as many people as the area has entry routes. Members of various youth organisations, such as the scouts, 4-H clubs, and sports clubs, are well suited to the task.
The same method described here in detail (manual observation using car-counting) can be used alone to estimate the number of visits to the area, but many more observation days are then called for (see chapter 3.4.3, Bogesundslandet example).
3.4.2.1. Planning of comprehensive countingThe observers are situated alongside the roads and other routes ap-proaching the area. The purpose is to observe all the visitors entering and leaving the area.
The days should be chosen so that they represent the different seasons in the area’s use (for example, school groups in spring, families in the middle of summer, berry-gatherers in autumn). In estimating the numbers of visits, one must use the knowledge and experience of the personnel as an aid and take the nature of the area into con-sideration. If they exist, visitor-count figures for the area from prior
Pyhä-Luosto National Park. (PHOTO: KIMMO KUURE)

64
years will reveal the fluctuation in visitor numbers from day to day and month to month.
EXAMPLE
At Seitseminen National Park, Finland, the observers were placed, for the first observation period, on nearly all the routes leading to the area. There were eight such routes – seven roads and one trail. On subsequent occasions, those locations which were not used in practice were omitted (three locations).
3.4.2.2. ImplementationSince in many cases visitors arrive at the area in their own cars, com-prehensive counting can be performed by observing cars and their occupants along the area’s entry roads or in the car parks. If no roads go right through the area, comprehensive counting is very simple to perform on the basis of cars driving into or leaving the car parks, and on people arriving by some other type of vehicle. Then again, if vehicular roads do go through the area and visitors also park at places other than car parks – beside the road, for example – the traffic has to be observed on each entry route. During the observation period, the following tasks are performed:
) Persons entering and leaving the area are observed at each car park, or on each entry road. In practice this is accomplished by ob-serving the number of persons in or on the vehicle, and the vehicle’s direction, licence number, colour, and type (personal car, coach, lorry, bicycle, etc.). The licence number, vehicle type, and colour are used to identify the car for potential further analysis.
2) The electronic counters in use are inspected in the manner described in the preceding chapter. The counters’ observation period has to be the same as that of the comprehensive observation, so that the figures can be related to each other.
3) The cars in the car parks are counted and identified at the beginning and end of the observation period.
Appendix 3 presents a model and an example for the comprehen-sive counting form.
If the number of occupants in the same car varies between dif-ferent observations, it is best to use the figure most often noted, or to use an average. If the number of persons in the car has not been recorded at all, an average of the observations made on other cars can be used.

65
EXAMPLE
At Seitseminen National Park, visitor counts taken at the two locations in the two previous years were used to select the com-prehensive counting days.
Three comprehensive counting days were held during one summer season:• one day in mid-July was selected to represent the most popular
period for holidays• two weekend days at the beginning of August represented the
end of the holiday season, when visits are concentrated at the weekends.
• one day in mid-September, when larger groups and mushroom-gatherers visit the park.
The observation period ran from 8 a.m. to 8 p.m. in July and August, and from a.m. to 5 p.m. in September.
3.4.2.3. Computing results of comprehensive countingSources of error and their checking and correctionWhen making the observations, only persons who can be considered visitors should be included; i.e. the same principle applies as for cali-brating the counters. In other words, some of the travellers observed on comprehensive counting days may not be actual visitors to the area. As defined in chapter 2, “a visitor is someone who visits a nature area for the primary purpose of recreation, for example hiking, berry picking or mountain biking. A visitor is a person not working in the area. The origin of the visitor can range between anywhere from the local community to foreign countries…”
EXAMPLE
of how to distinguish between different travellers in compre-hensive car countingHere we will discuss certain special groups of travellers and how they are handled in connection with the calculation of results. In order to clarify the number of these groups in roadside counting, the observer records the cars’ colours and licence numbers on a form, so that observations made at different points can be compared to each other and it becomes possible to identify a given car’s route through the area. The comments respecting certain groups apply especially to comprehensive observation alongside entry routes.
The area’s personnel must be distinguished from the visitors. The personnel can place some clearly distinguishing mark on their cars during the observation period, so that the observers are able

66
to make the distinction.Through traffic is distinguished from car traffic in general. A
car is recorded as through traffic if it is observed only to be driving through the park. This conclusion can be reached on the basis of observations, if the vehicle’s route goes past different observation points and the time between the observations is so short that the car could not have had time to stop along the way. At the beginning and end of a roadside count, through traffic cannot be distinguished from the general traffic. The proportion of the total that those uncertainties represent is relatively small, however. Through traffic must be omitted from the results. If there are residences or summer cottages within the area, the observers must consider whether the associated traffic should be distinguished from the visitors. If the residents are to be recorded as through traffic, their cars’ licence numbers can be requested and deleted from the observations. On the other hand, people who live within the area may also use if for recreation.
The observers can also make a separate note of cars that are found simply to have stopped briefly in the park. Visitors stop at kiosks, for example, then leave the area after completing their purchases. Those who make these very brief visits can be included in the overall results as their own group.
Because the observation is based on visitors entering or leaving the park at the time of observation, visitors who do not cross the park’s border during the observation period are not included in the data. For example, on the basis of the number of cars present in car parks at the beginning and end of the observation period, one can estimate the volume of this type of internal traffic by ap-plying the average number of occupants per car as a coefficient. The internal traffic is included in the overall results.
Some of the cars at Seitseminen National Park were observed to be driving into and out of the area repeatedly. In computing the results, the later, repetitious crossings of the area’s boundaries have to be omitted from observations of this sort.
Differences exist between the number of cars that have en-tered the park and the number that have left. Some of the cars are observed only in one direction, either entering or leaving. For example, hikers spending a summer’s day at the area do not leave until after the counting period, or arrive before the counting begins. Visitors travelling in one direction or the other are used as the basis for computing the results, and to this figure one adds those who have been travelling only in the other direction. In other words, those cars that have only left are counted together, in the calculated result, with those entering.

67
Beginning with the interpretation of the car observations, and with the choice of a way of counting, one has to make choices and compromises and come up with solutions all the time. By noting only the arrivals or only the departures, one clearly takes a step in the direction of mere estimation. On the other hand, the error would certainly be greater if those cars failed to be taken into consideration at all. Estimating the actual number of cyclists, and especially pedestrians, is by no means as simple as estimating the number of cars. A percentage of the pedestrians might have entered the park away from the observation points. Those car travellers who have visited the park briefly can be interpreted as visitors to the park, as above, but some of them may only be bringing other people to, or taking other people from, the area.
In the case of cyclists and pedestrians, combining those arriv-ing and departing can be difficult, since there is no identifying mark available comparable to a licence number. In those areas (e.g. many urban recreation areas), where significant numbers of visitors arrive on foot or by bike, the car-count methodology is not a method applicable to comprehensive counting.
EXAMPLE
At Seitseminen National Park, the following definitions were used.
THROUGH TRAFFICA car was interpreted as being through traffic if the driving time between the points on the park’s boundary was less than a certain predefined time.
INTERNAL TRAFFICCars were classified as internal traffic if they were not observed crossing the park’s boundaries at the time of observation, but were observed elsewhere.
VERY BRIEF VISITSThe car was placed in this category if it stopped in the park for under 20 minutes with only a momentary stop somewhere.
REPEATED ENTRY AND DEPARTUREIf the car crossed the park’s boundary several times, for example, entering, leaving, and returning, the temporary absences and return entries were noted as redundant driving.

68
EXAMPLE
The table presented here summarises the four comprehensive observation days at Seitseminen National Park. The motorists include internal traffic, visitors who have entered the park, and visitors who have only driven out of the park. Persons making very brief visits have been classified separately. Pedestrians, etc. also includes bicycles and mopeds. The percentage of visitors represented by each group appears in parenthesis.
Table. Percentage of visitors represented by motorists, pedestrians, and persons making very brief visits (explanation in text).
12/7/95 5/8/95 17/8/95 16/9/95Motorists 352 (95) 392 (90) 415 (90) 315 (91)Persons makingbrief visits
10 (3) 25 (6) 29 (6) 17 (5)
Pedestrians, etc. 9(2) 20 (4) 19 (4) 16 (4)Total 371 437 463 348
In order to determine the cumulative correction coefficient for each respective electronic counter, counter readings and the com-prehensive counting days’ results for the total numbers of visits were compared. At both observation locations, the coefficient varied according to the day of observation. Kovero’s cumulative correction coefficient was 0.82–.36; the nature centre’s was 2.–3.4. In subsequent counts, averages were used, viz. – 2.79 for Kovero and .76 for the nature centre.
Computing the area’s correction coefficientOn the basis of the comprehensive counts, the area’s total number of visitors during the observation period is computed. Through traffic, personnel and, for instance, commercial traffic travelling through the area, are thus not included in the results.
The area’s correction coefficient is computed by relating the number of visitors observed by an electronic counter on each com-prehensive counting day to the area’s total number of visitors on the day in question.
total number of visitsparea’s correction coefficientjp = −−−−−−−−−−−−−−−−−− visits observed by counterjp
where j = electronic counter, p = comprehensive counting day
If there are several comprehensive counting days, the cumulative correction coefficient for each electronic counter is computed as the average of the coefficients obtained.

69
Calculating the daily and yearly number of visits with the area’s correction coefficientWith the area’s correction coefficient, observations made on passing traffic with each electronic counter are converted to the number of visits for the whole area. The area’s total daily number of visits is obtained from the equation
area’s number of visitors = number of visits according to electronic counter × counter’s correction coefficient × area’s correction coefficient
The yearly total number of visits is obtained by adding up the cor-rected daily numbers of visits.
If the comprehensive observation days are only from a certain period of time, the use of the area’s correction coefficient outside that period is unreliable.
EXAMPLE
At Seitseminen National Park, the area’s correction coefficient was used only for the estimated number of visits during the summer season. The table here presents the electronic counter’s technical and qualitative correction coefficients and the area’s correction coefficients for the summer season.
In the winter season, the counting was performed in the same way, except that the area’s correction coefficient was not used because there were no comprehensive counting results for the winter season.
Because one of the counters (in Kovero) was in operation only for the summer season, the nature centre’s counter was used as a basis for estimating the annual number of visits at Seitseminen National Park. The full-year estimate, based on the nature cen-tre’s counter and computed with the correction coefficients, is 49,000 visits.
Table. Determination of correction coefficients for the summer season.
Technicalcorrectioncoefficient
Qualitative correction coefficient
Area’scorrection coefficient
Kovero 1 0,46 2,79Nature centre 1,2 0,43 1,76

70
EXAMPLE
of onsite Danish visitor counting based on manual car-countingPart II of the “Forest and Folk”-projectTo give exact data for the manager of the specific forest areas in Denmark, Part II of the “Forest and Folk”-project was initiated (Koch 980).
The yearly number of visitor hours and visits was estimated for 446 forest areas with a total area of 87,000 ha in 976/77. Nearly all state forests and many private forest properties participated voluntarily in the basic data collection. In addition, questionnaire results for the car-borne use regarding length of stay, group size, activities, travelling time and distance were obtained as well.
The basic data collection consisted of 28,652 instantaneous, manual counts of parked cars and the delivering of 44,846 question-naires. The response percentage for the questionnaires was 53.7% (impossible to use follow-ups).
Thorough written instructions were given before the counting was initiated. The fieldwork was organised in such a way that all the places where visitors could park their car (at a given forest/na-ture area) could be inventoried in the course of hour (counting the number of parked cars and delivery of questionnaires under their windscreen). The staff used varied from forest supervisors to forest workers.
The time for manual counting at specific registration periods had been selected by stratified random sampling. The counting was carried out at 20 stratified randomly selected moments of max. hour and at 2 subjectively selected times at peak use. The stratification took the seasonally, weekly and daily variation into account (e.g. there are more registrations accomplished during summertime compared with wintertime, and more registrations in the middle of the day compared with mornings and evenings). At each specified site, all cars were counted (divided into domestic and foreign cars).
Two ways of enumeration to annual figures based on the sam-pling were undertaken: a) Relationship between the 20+2 random samplings and four permanent automatic counting stations by multiple linear regression (see e.g. pp. 79–85 in Kajala (2006) for more information on the permanent automatic counting), and b) Sample estimation (weighting).
The advantages of this method include the benefit that, based on a relatively manageable fieldwork effort, information regarding
3.4.3. Examples of extrapolating number of visits to an area
By car counting, information regard-ing the number of users can be obtained simultaneously for a large number of areas by a relatively man-ageable fieldwork effort. Car borne visitors in Rude Skov, Denmark. (PHOTO: FRANK S. JENSEN)

71
the number of users is obtained simultaneously for a large number of forest/nature areas. Its weaknesses include the problem that only the recreational use of the car-borne visitors is included in the actual counting. Based on information from other surveys it is possible to estimate the total number of all types of visitors. This is possible based on general knowledge of the relationship between travelling distance and use of car as a means of transportation.
The results display considerable variation in the intensity of use. In most counties it is found that some forests are used up to about a thousand times more intensively than others. In Koch (980) detailed descriptions of the different methodological aspect are presented in addition to the results.
The “Outdoor Life ‘98”-projectA need for updating the results from the 970s was found – as well as looking at trends for the use of the specific forest areas. Due to this, the “Outdoor Life ‘98”-project was initiated and the data collection accomplished in 996/97.
The data collection in the “Outdoor Life ‘98”-project follows the same outline as described above, although some extensions and limitations were introduced:- Nature areas other than forests were included (e.g. beach ar-
eas).- Instead of 446 areas divided into ,49 sub-areas, the surveyed
area consisted of 592 forest/nature areas (of 2,59 sub-areas), with an area totalling approx. 20,000 ha (74,000 ha forests).
- A total of 85,673 questionnaires were delivered and 46.7% were returned.
- The questionnaire-based information was enlarged to include e.g. aspects of crowding as well as use of, and preferences for, a number of visitor facilities.
- Due to economic constraints, only sample estimates by weight-ing were performed.
The comparison between the two surveys shows the same tendency as found in the national household surveys of the general public ( Jensen & Koch 997, Jensen 999): an increase in the number of forest visits. For more detailed results and more methodological aspects, see Koch (980) and Jensen (2003).

72
EXAMPLE
of comprehensive counting based on car-counting: Bogesundslandet, Sweden (Kardell 2003)Bogesundslandet is a 35 km2 large urban proximate peninsula about 5 km north-west of central Stockholm. It is a mixture of farm and forest land with a strategic location for outdoor rec-reation among the residents of Stockholm. The area has several nature trails, a day use recreation area, a golf course (built in 994), a camping ground, and horse back riding trails and it has been used for recreational swimming and hiking since the 920s.
Visitor counting at Bogesundslandet has been accomplished three times; ) February 969 – January 970; 2) July 98 – June 982; and 3) June 999 – May 2000. Data collection is based on the counting of parked cars while driving along a 29 km long loop in the area. Cars were counted on 56 systematically selected days each year (30 workdays and 26 Saturdays or Sundays), including every tenth workday and every fourth Saturday or Sunday. Each day cars were counted five times along the loop between 0 a.m. and 7 p.m. All parked cars visible from the observation car were recorded. In 98 and 999 the counting also included hikers, cyclists and horseback riders. The number of people in each car was also recorded (at fixed points) to estimate the total number of visitors in the area (the majority of all visitors to the area will arrive by car). All observations were recorded on a map of the area, and for each year 280 maps were produced (56 days times 5 counts a day). In addition to the car counting in 969 and 98, visitor surveys were conducted at a visitor centre (Ellboda friluftsgård) located along the car counting loop.
The amount of working time required was 2 persons for 56 days, plus planning, data analysis and reporting. The costs (at the current price-level) total approximately 30,000 EUR per year (2 persons times 56 days, plus additional expenses).
Results from the study show that visitation in the area has been relatively constant during the study period. The estimated number of visitors to Bogesundslandet was: 27,000 in 970, 0,000 in 982 and 49,000 in 999. The increase is due to a new restaurant and golf course. There has been a shift in activity participation away from forest hiking to golf, horse-back riding and visiting restaurants. The number of bikers, hikers and horseback riders has increased from 9,000 (970) to 0,000 (999). A look at forest visits reveals they have decreased from 29,000 (970) to 25,000 (982) to ,500 (999). Considering the doubling of the population in the adjacent suburban areas of Stockholm, the relative use of the area has decreased over time.

73
EXAMPLE
of comprehensive counting using a combination of stationary and moving observers (Lindhagen 996) The Stadsliden forest in the town of Umeå is the most popular forest recreation area in the region, with 200,000–300,000 visits per year. More than 80 % of the visitors to Stadsliden live within 2 km of the forest border.
In a study by Lindhagen (996), a combination of stationary and moving observers was used to estimate the amount of outdoor recreation in the Stadsliden forest area from November 990 to October 99. Forty-four observation hours were systematically selected during the year with the same proportion during all day-light hours between 7 a.m. and 0 p.m. The daylight hour frame was reduced during the dark seasons. An attempt to estimate the number of visits to the illuminated trail during the dark hours was made, but it is not described here.
A couple of university students were engaged and carefully instructed to conduct the observations in a similar way. The observers run along a 0 km long trail through the forest for ap-proximately one hour. The trails were exactly the same during all observations and went through all parts of the forest. All visitors observed during the run were noted on a map covering the forest. The observed visitors’ approximate age was noted, as well their gender and whether they were walking, running, cross-country skiing or biking. The size of groups of visitors going together and the number of dogs and prams were recorded as well. The weather was briefly noted and entered in one of three classes. The time used for the run was noted.
On four occasions 5–20 students were placed around the forest to count all the visitors arriving at and leaving the area. Simul-taneously with this counting of the total number of visitors, an observer ran along the observation trail. In this way, it was possible to correlate the number of observed visitors along the trail with the total number of visitors.
Based on the field observations, the number of visits in Stadsli-den was estimated as 28,000 ± 53,000 visits per year, not including visits to the illuminated track after dark.

74
EXAMPLE
of extrapolating the results of point counting based on visitor survey information on visitor flows: RMK (Estonian State For-est Management Centre) recreation areas, EstoniaIn order to discover the number of visits to the whole recreation area, it is possible to extrapolate the results of point counting based on visitor survey information on visitor flows. The manager of Estonian state forests RMK has conducted visitor counting since 2002. Visits are counted in all ten RMK recreation areas during the period when the land is not constantly frozen. As of 2005, there were 29 electronic counters installed in RMK recreation areas (for the current situation respecting visitor monitoring in RMK recreation areas, see Kajala 2006, Rammo et al. 2004, Rammo et al. 2006). Because there are dozens of entrances to RMK recreation areas, in order to determine the number of visits to a particular recreation area, counters are installed at the area’s destinations, and to extrapolate the number of visits counted at single points, visitor survey information on visitor flows is used.
The number of visits to the whole recreation area is calculated as follows:
b × ca = −−−−−− × e d
in whicha = number of visits to the whole recreation area per annumb = total counter readings processed with calibration correction coefficientc = correction coefficient of percentage of visits to area’s destina-tions monitored by countersd = average number of destinations visited during one visit to the recreation areae = correction coefficient of the proportion of counting period.
The total counter readings processed with the calibration cor-rection coefficient is achieved in such a way that the reading of each counter is multiplied by the correction coefficient found at the time of calibrating the counter (counter calibration is accom-plished according to the method described in chapter 3.3.6) and thereafter the corrected readings of all counters are added up.
The correction coefficient of the percentage of visits to the area’s destinations monitored by counters is calculated on the basis of visitor survey information on visitor flows (visitor surveys in RMK recreation areas are conducted as described in the paragraphs on onsite surveys in chapter 4). The visitor survey includes a question about the desti-nations in the recreation area that are visited during one visit, where

75
the list of destinations needs to be as comprehensive as possible. Thereby information is achieved about the percentage of visits to all the destinations in the recreation area. When the percentages of visits to all the destinations in the recreation area have been found, it is possible to calculate the percentage of visits to the area’s destinations observed using counters. The correction coefficient of the percentage of visits to recreation area destinations observed using counters is a figure obtained when the total of the percentages of visits to all the recreation area’s destinations is divided by the total proportion of visits to the recreation area’s destinations observed using counters.
fc = −−− g
in whichc = correction coefficient of the percentage of visits to the recrea-tion area’s destinations observed with countersf = total of percentages of visits to all the recreation area’s des-tinationsg = total of percentages of visits to the recreation area’s destina-tions observed using counters
The average number of destinations visited during a visit to the recreation area can be revealed with a visitor survey by finding the average number of destinations visited during all visits to the recreation area.
If we multiply the total counter readings processed with the calibration correction coefficient by the correction coefficient of the percentage of visits to the recreation area’s destinations ob-served with counters, we will obtain the number of visits to the destinations in the recreation area. In order to discover the number of visits to the recreation area, the previously found figure must be divided by the average number of destinations visited on one visit to the recreation area. In this way we arrive at the number of visits to the recreation area during the counting period.
If the percentage of visits to a recreation area during the count-ing period is known, it is possible to calculate the number of visits to the whole recreation area per annum.
Correction coefficient of the proportion of the counting period is calculated as follows:
he = −−− i
in whiche = correction coefficient of the proportion of the counting periodh = i = proportion of counting period visits to the recreation area in a year

76
At the moment, RMK has no information about the seasonal distribution of visits to recreation areas, but this should later be available from the 2006 visitor survey results.
Owing to the fact that during the visitor survey only visitors to the recreation area (as defined in chapter 2) are interviewed and by counter calibration the non-visitors (e.g. the staff ) are excluded, the potential sources of error for the calculation of visits to the recreation area are minimised.
The method described above can also be applied in a case where counters are installed at entrances to the recreation area and visits are counted all the year round.

77
4. Visitor surveys

78
SUMMARY
Visitor surveys are studies designed to collect detailed informa-tion on visitors.
Surveys are typically undertaken in such a way as to represent all visitors within a certain time span.
Survey objectives need to be identified and kept in mind at all times.
There are many survey methods available, from which one can choose the most appropriate to fit the area and its circumstances, survey objectives and budget. The survey methods include:• Onsite interviews• Onsite guided surveys• Postal surveys• Telephone interviews• Internet surveysEach of these methods has its strengths and weaknesses. The experience has shown that, if one is to study actual visitors to na-ture areas, two of the above methods function best, viz. the onsite guided survey and the postal survey. Therefore, this manual focuses on how to implement these two data collection methods.
Surveys use questionnaires to produce sets of data that ac-curately describe the visitors and their visits. Surveys can yield information e.g. on the visitor profile, activities, mode of travel, the geographical distribution of visits, the duration and repetition of visits, expenditure, visitor satisfaction, motives of the visitors and arrival at the area. In addition, there may be some special issues that the managers wish to clarify through a visitor survey in a particular area.
Careful questionnaire design is essential to quality answers. Questionnaires need to be short, especially if they are answered onsite.
No matter which method is selected, experience and motivation are very important characteristics for the person collecting the
4. Visitor surveys1
This chapter has made extensive use of the publication Erkkonen & Sievänen 200 with the kind permission of the authors.

79
data (the interviewer). Well-prepared interviewers are necessary for the collection of high-quality data.
A word of warning: Although the use of questionnaires is considered one of the most usable and fruitful data acquisition techniques in the social sciences – on condition that the tech-nique is applied with reason – the disadvantages should not be neglected2.
2 Experience of this can be summarised with a quotation from an extensive study of the literature and methods, conducted for the U.S. Forest Service in the early 970s: “... the complexities of using questionnaires for research are often vastly underrated. The popularity of the method often rests on ignorance of associated problems of data analysis, bias, reliability, and validity of results.” (Potter et al. 972, p. ).
4.1. The visitor survey processThere are a variety of methods available for obtaining in-depth visi-tor information. This chapter will thoroughly familiarise the reader with the performance of visitor surveys. Nevertheless, one should not forget e.g. observational methods with the aid of which one may find ways of solving many practical problems easier and faster than with a visitor survey.
Surveys are studies designed to collect detailed information on visitors. Surveys are typically undertaken in such a way as to represent all visitors within a certain time span. Surveys use questionnaires to produce sets of data that accurately describe the visitors, their visits, and their mode of travel to the park. Surveys can be implemented with potential visitors before their visits, with actual visitors during their visit, or with past visitors once they leave the area.
Detailed and accurate data about visitor use obtained from onsite visitor surveys can help determine the most cost-effective locations where counting instruments should be placed, as well as to measure factors needed to convert instrument counts to estimates of use. The survey can measure the patterns of use (from point of entry to exit), identify the statistical relationships between the basic areas of use (visitor centre, camping ground, overlook, trail head, and entrances), and produce factors needed for reporting (identification of the amount of excluded use as well as measuring entries). The survey will also indicate areas and patterns of use having important similarities or differences, e.g., day users and overnighters, local visi-tors or non-local visitors, large versus small groups.
The entire visitor survey process begins with the need to give closer consideration to the opinions and behaviour of the recreation area’s
Waterfalls are attractive destina-tions. Mollisfossen in Reisadalen National Park, Norway. (PHOTO:
KRISTIN S. KARLSEN)

80
visitors. The opinions of visitors are important in developing the area’s structures and service facilities, for example. For the area’s managers or planners, there is more benefit in having even an approximate knowledge of visitors’ opinions respecting an area and factors bear-ing on recreation, than in trying to guess those opinions. The visitor survey provides a good basis for decision-making related to visitors, services and environmental management (see also chapter .).
All in all, a visitor survey is a long process with several successive and in part overlapping phases. Depending on the area’s character-istics, the number of visitors, etc., completing the various phases takes from a few months up to a year or more. Sometimes it may be difficult in practice to distinguish the visitor survey’s phases from each another.
The stages of a visitor survey in more or less chronological order.
The phases presented in figure generally pertain to all visitor surveys. Some phases are performed quickly as matters of routine, but some must be gone into very thoroughly. With time and growing experi-ence, completing the different phases of a visitor survey becomes noticeably easier.
Just as with monitoring visitor numbers, the collection of visitor survey data can also take place either continually, on the basis of a yearly cycle, or at an interval of some years. The area’s development needs will determine how often visitor information is gathered. In an area whose usage is growing vigorously or impacts are changing quickly, ongoing yearly monitoring may be necessary. In areas where use is stable and the changes slow, a less frequent measurement (preferably at least as often as every five or ten years, however) is adequate.
Planning the datacollection
Planning thequestionnaire
Collecting the data
Data entry
Processing andanalysis Reporting
Utilisation
Initial planningphases
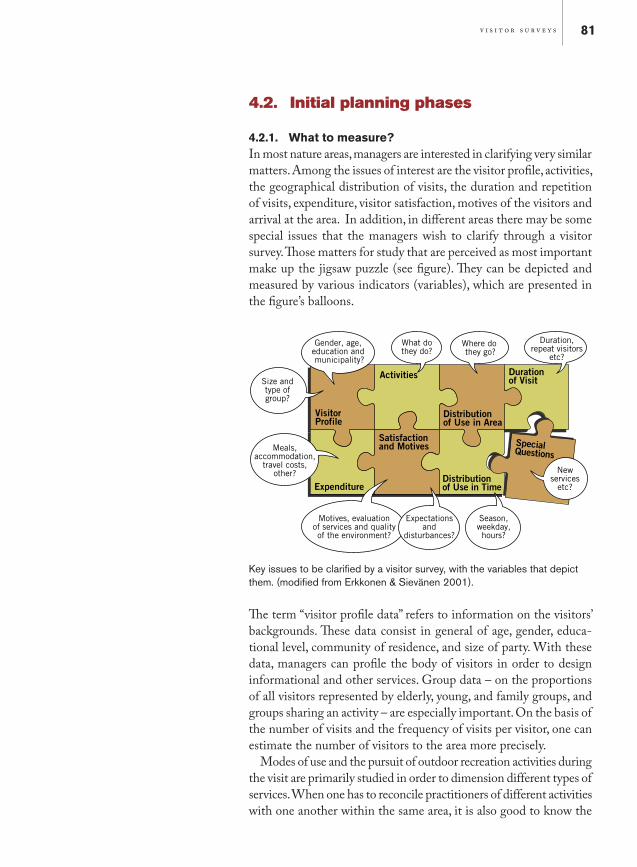
81
4.2. Initial planning phases
4.2.1. What to measure? In most nature areas, managers are interested in clarifying very similar matters. Among the issues of interest are the visitor profile, activities, the geographical distribution of visits, the duration and repetition of visits, expenditure, visitor satisfaction, motives of the visitors and arrival at the area. In addition, in different areas there may be some special issues that the managers wish to clarify through a visitor survey. Those matters for study that are perceived as most important make up the jigsaw puzzle (see figure). They can be depicted and measured by various indicators (variables), which are presented in the figure’s balloons.
Gender, age,education andmunicipality?
What dothey do?
Where dothey go?
Duration,repeat visitors
etc?
Size andtype ofgroup?
Meals,accommodation,travel costs,other?
Motives, evaluationof services and qualityof the environment?
Expectationsand
disturbances?
Season,weekday,hours?
Expenditure
Satisfactionand Motives
Distributionof Use in Area
Durationof Visit
Distributionof Use in Time
Activities
VisitorProfile
SpecialQuestions
Newservicesetc?
Key issues to be clarified by a visitor survey, with the variables that depict them. (modified from Erkkonen & Sievänen 2001).
The term “visitor profile data” refers to information on the visitors’ backgrounds. These data consist in general of age, gender, educa-tional level, community of residence, and size of party. With these data, managers can profile the body of visitors in order to design informational and other services. Group data – on the proportions of all visitors represented by elderly, young, and family groups, and groups sharing an activity – are especially important. On the basis of the number of visits and the frequency of visits per visitor, one can estimate the number of visitors to the area more precisely.
Modes of use and the pursuit of outdoor recreation activities during the visit are primarily studied in order to dimension different types of services. When one has to reconcile practitioners of different activities with one another within the same area, it is also good to know the
82
relative numbers of visitors interested in different forms of outdoor exercise. It is also important to investigate the visitor’s motivations, expectations, satisfaction, and hopes, as well as factors that interfere with recreational experience. Clarification of visitor satisfaction is often one of the most important objectives of a visitor survey. In addition, the money flows associated with a visit are sometimes a key research subject. In many cases, research into regional economic impacts is needed in order to justify the establishment and upkeep of publicly maintained nature areas.
Questions of visitor satisfaction and experiences are of central importance in attitude surveys. Too often research deals with participation in various outdoor recreation activities rather than the significance of visitors’ interests or activities to the participants themselves. One disadvantage with focusing too heavily on an activity is that it is easy to forget or ignore the fact that various activities are interchangeable and thus able to fulfil the same need or interest of participants. The attitudes of visitors are also believed to influence their reactions to various management measures (Kaltenborn & Vorkinn 993). Categorising visitors on the basis of their attitudes can be helpful in planning the spatial differentiation of activities, and in satisfying various types of visitors.
When planning a particular visitor survey, one must first identify both what sort of visitor information is important from the stand-point of the specific area, and what one wants to clarify and monitor for various purposes at a local, regional, national or international level. In doing this work, it is important to start with defining the objectives of the survey. These help significantly in keeping the survey to the point, thus avoiding the gathering of too much either irrelevant or “nice to know” data. It then becomes possible to weigh how the important issues can best be depicted so as to put together the “jigsaw puzzle” as well as possible.
It is also a good idea to consider beforehand the form in which one wishes to present the results, so that they will serve future plan-ning and decision-making for the area to the fullest possible extent. The most usable data for management and statistical purposes, which are at the same time the data most easily computed from the material, are the direct distributions, mean figures, and, as needed, cross-table data. These are easy to present in the form of tables or figures, for example.
Normally the material is processed through a spreadsheet program (such as MS-Excel) or a statistical program (such as SPSS). Statistical programs make it possible to analyse the material in diverse ways quickly and easily, but one can also adequately compute diverse data with spreadsheet programs.

83
4.2.2. Selecting a suitable method of data collectionOnce those performing the survey know what they want to investi-gate, they must choose the most suitable method for producing the desired data. Several methods exist for clarifying visitor information, and they can also be combined. Although this manual concentrates mainly on more general guidance for the visitor survey, other methods can also be used for data collection, depending on the case.
TIP
For some problems other, and sometimes easier, solutions than an extensive visitor survey may be available. In addition to visitor surveys, methods of collecting visitor information include, for example • observation• in-depth interviews• group discussions• idea-trading sessions• examination of existing data• diaries
There are also several ways of collecting survey data from nature area visitors that can be classified based on the amount of guidance provided by the interviewers, and the means of answering (Table 2). This manual focuses on methods that yield information on the actual users of the area, so that it does not include general population surveys. Consequently, all these methods include obtaining contact information onsite in one way or another, and this will be dealt with later in this chapter. Thus, the reason why postal and telephone sur-veys are also covered here is because they can be used in connection with making additional contact with visitors.
In an interview, the person gathering the survey data interviews visitors using the questions on a questionnaire form. When doing this onsite, various means of observation – such as tables, figures, and a map of the area – can be used as aids. In the case of a telephone interview, such aids are not available.
With the guided survey approach, the person gathering the information gives the questionnaire form to the visitor to fill in himself or herself, and supplies further instructions as necessary. The completed questionnaire is returned to an agreed-upon place (or by post in a reply envelope). In the case of a postal or Internet survey based on contact information obtained onsite, the respondents reply at their homes and receive guidance only if they contact the persons mentioned in the cover letter of the survey.

84
Table 2. A simplified classification of survey data collection methods in the case of nature area visitors.
Survey method Amount of guidance by the interviewer
Location
Onsite interview plenty OnsiteOnsite guided survey some OnsitePostal survey* little At respondent’s homeTelephone interview* plenty At respondent’s homeInternet survey* little At respondent’s home
or some other place where he/she has the internet access
* based on onsite collection of contact information (i.e. mail address or telephone number)
To make the choice easier, Table 3 lists a few of each survey tech-nique’s strengths and weaknesses. No matter which method is se-lected, experience and motivation are very important characteristics for the person collecting the data (the interviewer). Well-prepared interviewers are necessary for the collection of high-quality data.
In practice the experience has shown that, if one is to study actual visitors to nature areas, two of the above methods function best, viz. the onsite guided survey and the postal survey. Consequently, this manual focuses on how to implement these two data collection methods.
The model questions (Appendix 4) and the example of a basic visitor survey form (Appendix 5) act both as a guided questionnaire in interview situations and as a postal survey questionnaire.
One method found to work well is to use a combination of the guided questionnaire and an interview onsite. In other words, the survey is for the most part conducted in a guided fashion, but when the visitors so desire they can also be interviewed. Visitors generally seem to prefer being able to take their time to fill in the form, asking the data collector for further information as needed. Completing the form in guided questionnaire fashion takes less time than interview-ing the respondent. It is also possible to distribute the questionnaires at an information or nature centre service point, but in that case the provision of guidelines and the sampling plan must be very precise. In most cases post-visit surveys are preferable, but in a few cases pre-visit surveys can be applied, especially if the focus is on expectations rather than actual experiences.
4.2.3. Planning folderSome sort of documentation is advisable for every visitor survey, even when the visitor survey has no “scientific” goals. As a matter of fact, it is a good idea to assemble all the essential matters pertaining to the visitor survey in a planning folder, recording the tasks and

85
3 Even in the case of telephone interviews, the first contact and sampling has been done on-site.4 The first contact and sampling has been done on-site.
Table 3. Advantages and disadvantages of different survey data collection methods.
Interview, either onsite or by telephone3
Advantages Disadvantages
Personal contact increases responsiveness and reduces the number of unanswered questions.
Distortions originating with the interviewer can appear to the extent that he or she selects the interviewees subjectively.
If necessary, the interviewer can supply directions and clarifications orally, thus avoiding misunder-standings.
The interviewer’s manner and behaviour can affect the inter-viewee (annoying the latter, for example); this can have an impact on the answers.
Vague answers can be clarified to make them easier to interpret.
Using several interviewers can be expensive.
It is easier to make sure that visitors only respond at or near the end of their visits, when they are more able to answer the questions.
Telephone response rates tend to be lower than onsite response rates.
Telephone interviews do not allow for using illustrations such as pictures or maps.
Crowding onsite can bias the sample, because on busy days a smaller proportion of the visitors are sampled.
Onsite guided surveyAdvantages Disadvantages
It is possible to distribute and collect a larger number of questionnaires quickly and economi-cally compared to an interview.
It is difficult to clarify vague answers afterwards.
Respondents can fill in the form at their own pace, when it is most convenient for them.
More unanswered questions occur than in an interview.
Distortions originating with the interviewer do not appear in the answers.
The time of the response may be more difficult to control than in an interview.
Respondents are more courageous about writing down their own thoughts in free-form fashion compared to an interview.
The method limits the length of the survey form to a maximum of around 4 to 5 pages.
Postal or Internet survey4
Advantages Disadvantages
The questionnaires can be longer, allowing for more detailed questions.
Recollection bias.
Allows for collecting large numbers of question-naires, especially compared to an interview.
Lower response rates (often).
Respondents can fill in the form at their own pace, when it is most convenient for them.
Less control over who replies to the questionnaire.
Distortions originating with the interviewer do not appear in the answers.
In the case of Internet surveys, the technique sets certain limitations on the format of the questionnaire.
Respondents are more courageous about writing down their own thoughts in free-form fashion compared to an interview.
In the case of Internet surveys, no data entry phase as Internet answers can be directed to a database. Consequently, there is no input error either and the data analysis can be almost instantaneous.

86
responsibilities of different individuals, schedules, sampling arrange-ments, and directions for data collectors.
During the implementation phase one can go back to the folder to check various items, and the method enables repetition of the survey later on, for instance.
In cases where the folder has been in use, it has been found to be a very handy document, from which one can easily check details related to a specific visitor survey (Erkkonen & Sievänen 200, English Nature 2006).
4.2.4. Determining what resources are necessaryA visitor survey is a specialised research instrument. The design and implementation of visitor surveys should be supervised by a person with specialised training in this field. Some resource and park man-agement agencies have a specialised visitor monitoring group. This group has the responsibility of coordinating national efforts and of ensuring appropriate and consistent field methods.
EXAMPLE
In Finland, Metsähallitus has a team of visitor survey specialists in the agency. They keep survey guidelines up-to-date for the agency, arrange training sessions and assist with each individual survey design. This has proven to be a functional arrangement to ensure quality survey results.
In Denmark, there is close contact in these matters between Skov- og Naturstyrelsen (the Danish Forest and Nature Agency) and the outdoor recreation research group at Skov & Landskab.
The different sorts of resources needed for performing a visitor survey vary according to the goals of the survey, as well as the area’s location, size, and other characteristics. It is recommended that at least one person in each area be assigned the responsibility for car-rying out the visitor survey. He or she should be aware of the factors bearing on the area’s management and planning as fully as possible. The person responsible for the visitor survey can assemble a visitor survey team to help out. The team’s members participate in different phases of the survey.
Personnel resources, time, and money must always be reserved for the visitor survey. The time that the personnel devote to the survey represents its greatest expense. That time is spent on the different phases of planning and practical implementation. The time spent by the personnel should be planned precisely and realistically in advance, so as to avoid unpleasant surprises later on. As an experientially based
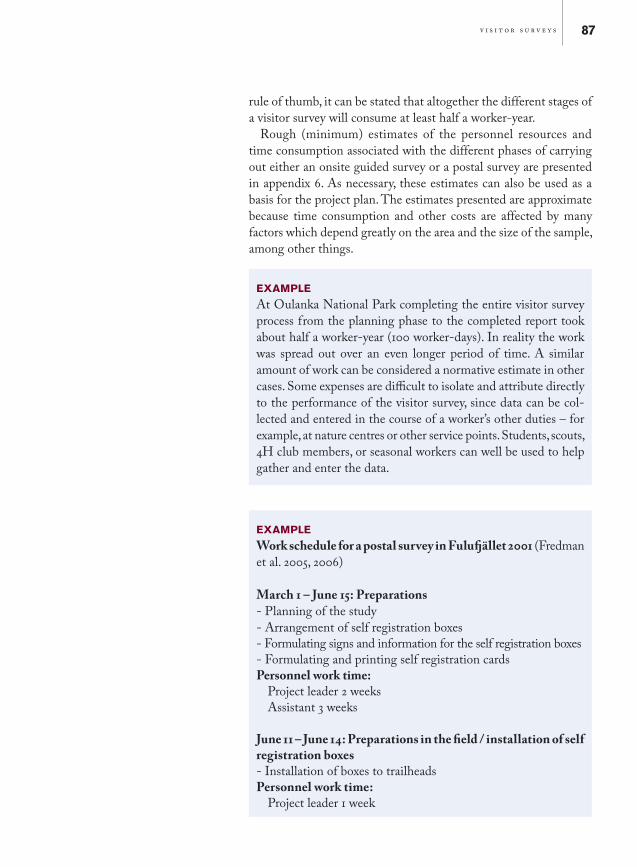
87
rule of thumb, it can be stated that altogether the different stages of a visitor survey will consume at least half a worker-year.
Rough (minimum) estimates of the personnel resources and time consumption associated with the different phases of carrying out either an onsite guided survey or a postal survey are presented in appendix 6. As necessary, these estimates can also be used as a basis for the project plan. The estimates presented are approximate because time consumption and other costs are affected by many factors which depend greatly on the area and the size of the sample, among other things.
EXAMPLE
Work schedule for a postal survey in Fulufjället 2001 (Fredman et al. 2005, 2006)
March 1 – June 15: Preparations- Planning of the study - Arrangement of self registration boxes - Formulating signs and information for the self registration boxes- Formulating and printing self registration cardsPersonnel work time: Project leader 2 weeks Assistant 3 weeks
June 11 – June 14: Preparations in the field / installation of self registration boxes - Installation of boxes to trailheadsPersonnel work time: Project leader week
EXAMPLE
At Oulanka National Park completing the entire visitor survey process from the planning phase to the completed report took about half a worker-year (00 worker-days). In reality the work was spread out over an even longer period of time. A similar amount of work can be considered a normative estimate in other cases. Some expenses are difficult to isolate and attribute directly to the performance of the visitor survey, since data can be col-lected and entered in the course of a worker’s other duties – for example, at nature centres or other service points. Students, scouts, 4H club members, or seasonal workers can well be used to help gather and enter the data.
88
Assistant (local) week Additional help from local management agency (Länsstyrelsen)
June 15 – October 1: Self registration, non-response studies, coding- Maintenance of the boxes (clean and tidy, signs not broken,
adding cards, emptying, etc.)- Computer-coding of the filled out registration cards into a
data matrix- Non-response studies. Implemented twice during the self
registration period- Removal of registration boxes at the end of the season.Personnel work time: Project leader 2 weeks (instructions, supervision, non-response
observations and analysis) Assistant week (non-response observations) Assistant (local) 7 weeks (maintenance, coding, non-response
observations)
June 1 – October 15: Preparations for postal survey- Developing the questionnaire- Testing the questionnaire- Controlling the data from the registration cards- Preparations for mailing (address stickers, return envelopes,
cover letter, etc.)- Printing of questionnaires and cover letterPersonnel work time: Project leader 3 weeks Assistant 2 weeks
October 15 – January 15 (2002): Postal survey- 5/0: first mailing- 4/: reminder - 25/: reminder 2- /2: data entry starts- 5/: data entry ends; 04 Swedish and 483 Germans answers
were entered, representing a response rate of 80% and 74% respectively.
Personnel work time: Project leader week Assistant 7 weeks
January 15 – March 1 (2002): Control and analysis of data. Work with reporting starts.- From February on, the preliminary results are forwarded to the

89
Swedish Environmental Protection Agency for input to the management plan.
Personnel work time: Project leader 3 weeks Assistant 2 weeks
March 1 (2002): First part of reporting- First report, including results from self registration cards and
preliminary analysis of questionnaires. Published as Working Papers.
March 1 – August 1 (2002): Working with final report- More detailed analysis of the data. Final report completed by
August 2002.Personnel work time: Project leader 3 weeks Assistant 2 weeksN.B. The amount of work spent on the final report in reality turned out to be double. This, of course, hinges on how large the report needs to be.
Seminars In relation to the publishing of reports, seminars are arranged both on site at the Fulufjället National Park visitor centre and at the Swedish Environmental Protection Agency headquarters in Stockholm. The results are also presented at several research seminars and workshops. A fact sheet based on the report is dis-tributed free of charge. Results from the study were used in the preparation of the Fulufjället National Park management plan.
Personnel work time: Project leader -3 weeks Assistant week
4.3. Planning the collection of the survey data
4.3.1. How many does one need to ask?Generally, the numbers and structure of visitors at nature areas are not well enough known to define the size of the sample to ensure that it represents all the visitors within some specified margin of error. It is often thought that the accuracy of a survey is determined by the proportion of the total population represented by the sample.

90
However, this is not the case, but rather what matters is the absolute size of the sample and how it is selected. An “adequate” number of observations is needed to be able to compute parameters from the data by statistical methods. As a rule of thumb, the following figures can be considered (English Nature 2006): 00 is a reasonable mini-mum overall sample size if one just wants straightforward analyses of total responses (assuming the sample is a random sample) and 50 is the preferred minimum sample size of a sub-group (for example, female visitors) one wishes to analyse. 30 is the smallest sample size with which one can draw any statistical conclusions. All in all, the size of the sample generally represents some sort of compromise between statistical reliability and the available resources.
It can thus be recommended as a rule of thumb that, under most Nordic and Baltic conditions, about 300 observations per visitor survey should be collected at the nature areas. If there are several different strata (sub-samples), the sample’s size must be increased in its entirety. In other words, we could take 300–500 observations as a target sample size, depending of course on the area and time frame (i.e. seasonality), number of visitors, and available resources. The sam-ple must be distributed so that it covers the area, and so that at least the most important concentrations of visitors come under scrutiny. Very often, those performing the survey take too optimistic a view of the sample size during the planning stage. Sometimes 40 collecting days are by no means adequate for collecting 500 observations.
4.3.2. Obtaining contact information in the case of a postal survey
The most cost-efficient and common way of getting in contact with visitors in a nature area for carrying out a postal survey is self registration. Self registration has been successfully used in remote recreation areas. Both registration boxes at main access points (Rogen-Långfjället Nature Reserve, Hultman & Wallsten 988, Femundsmarka National Park, Vistad 995, Fulufjället National Park, Fredman et al. 2007), and self registration booklets at cabins (Käsivarsi Wilderness Area, Kajala 2000) have been used. Usually this kind of pre-contact with the visitor yields a high response rate in the follow-up postal survey, as visitors giving their names and contact information are already expecting that they might receive a survey. The disadvantage is that the bias caused by self registration needs to be estimated and can be significant. Moreover, registration boxes do not treat locals and non-locals equally as the locals tend to register less often than non-locals (Fredman et al. 2005).
It is also possible to obtain contact information by an interviewee asking for an address onsite, but in most cases this option is too costly

91
merely for the purpose of obtaining contact information; one has to pay both for the person to be out in the field and the extra costs of the postal survey. Where an interviewer is spending a significant amount of time out in the field it is worth asking the contacted visitors to fill in a short survey onsite. A combination of onsite and postal surveys has also been useful.
TIP
In Finland Metsähallitus (land management agency) and Met-säntutkimuslaitos (Finnish Forest Research Institute, Metla) are cooperating in such a way that the land management agency asks the visitors to fill out a 4-page survey form onsite, after which the respondents are given a longer and more research oriented form by the research institute to be returned by mail. A similar approach has demonstrated its value in a Danish river study ( Jensen 200, Kajala 2006).
EXAMPLE
Self registration method at Fulufjället National Park (Fred-man et al. 2005, 2006, 2007)Data on individual visits to Fulufjället National Park were gath-ered with the help of eight self-registration boxes at seven different locations, and also with a follow-up questionnaire distributed by post. The collection boxes were placed along trails at locations where there is sufficient space for several people to linger. A sign with the word “VIKTIGT” (IMPORTANT) on the outside of the box urged passers-by to open the box and fill out a registration card. Each box contained a supply of registration cards and pens, along with a map of the Fulufjället National Park area. The front of the box could be folded down to form a writing surface.
The registration cards included five questions relating to the individual’s visit: the current date and time, home address, activities engaged in during the visit, previous visits to the area, and how the visitor had learned about Fulufjället. The completed card was then inserted in a slot on the inside of the box and dropped into a locked lower compartment. In order to limit the number of filled in cards, the busiest boxes were in operation only every third day from late June to the beginning of August in both 200 and 2003.
A total of 4,448 cards were collected from the self registration boxes during the summer of 200, and 6,5 during the summer of 2003. The number of visitors who passed by the boxes varied

92
widely, and most of the self registrations were completed at loca-tion A, on the old trail to the Njupeskär waterfall.
Table. Number of completed registration cards, 2001 and 2003.
LocationNumber of completed cards
2001 2003A) Njupeskär loop trail (old trail to waterfall)
2,356 4,093
B) Trail to Lake Rösjön 1,463 1,350C) Brottbäckstugan 221 236D) Morbäckssätern 128 123E) Björnholmssätern 129 150F) Västertangen (Norwegian border) 63 98G) Gördalen Valley 88 101TOTAL 4,448 6,151
Estimating the bias caused by self registrationThe main purpose of the registration system was to enable the selection of a representative sample of visitors to Fulufjället Na-tional Park who self-registered their presence and left their names and addresses for the subsequent postal questionnaires. Since it was not possible to provide registration boxes on all trails in the park, it is likely that some visitors never had an opportunity to register and thus be included in the study. Furthermore, there are always some who enter an area by routes that do not follow existing paths and trails.
Consequently, a selection of those who left completed regis-tration cards is probably not representative of all visitors to the area. This problem is believed to be relatively small for the study reviewed here, since visitors tend to be heavily concentrated along the trail to and from Njupeskär, and the placement of the other registration boxes was accomplished in consultation with park managers and others with a good knowledge of visiting patterns in the park. Fulufjället National Park is also an integral and clearly delineated mountain area with relatively few and distinct points of entry – all of which makes the methods described above more suitable at Fulufjället than at other areas with more complex visiting patterns.
Another problem is that there is a risk of queuing at registra-tion boxes at locations where many visitors pass by, so that some do not see them or do not bother to wait their turn to fill out a card, continuing on without registering. As long as such “non-responses” do not follow any particular pattern and are evenly
Self registration boxes at work in Fulfufjället National Park, Sweden. (PHOTOS: PETER FREDMAN)

93
distributed among all visitors, they do not affect the representa-tiveness of the sample. In order to determine if that applied in this case, studies of non-responses were conducted at the self registration locations. The purpose of these studies was to esti-mate the number of visitors who did not register and, by means of interviews, determine whether those individuals differed from the visitors who did register.
For the non-response studies, the registration boxes were monitored by an observer from a position selected so as not to influence the decision to fill out a card or not. Those who chose not to register were noted and, when they came to the observation point, were interviewed about their reasons for not doing so. The non-respondents were asked to complete a registration card of the same type provided at the boxes.
A total of 3 non-respondents were interviewed in 200 and an analysis of the information they provided indicated that factors such as nationality or previous visits to the park did not differ significantly from those who did register. Since the number of non-respondents interviewed in 200 was relatively small, a more extensive study was conducted in 2003. The choice of location was based on experience gained from the 200 study, and on the large number of passers-by, which probably resulted in a smaller proportion stopping to complete a registration card.
Estimates in 2003 indicated that some 50–80 per cent of those who pass along the Njupeskär trail did not complete a registration card. Of the individuals who passed here without self-register-ing, 236 agreed to complete a card at the urging of the research personnel. All of them subsequently received the same postal questionnaire as the others included in the study.
Completed questionnaires were returned by 206 of the non-respondents (65 Swedish and 4 German), and these were compared with the questionnaires returned by visitors who had self registered. The answers to about 5 per cent of the questions differed between the two subgroups, which indicates that the non-responses may have affected the representativeness of the sample selected for the main study.
The results indicate that (a) whether or not someone passing by a registration box chooses to complete a card is related to how many other visitors are present at the time, and (b) those who do not self register are more likely to live in the nearby counties, are more positively disposed to the development of tourism in the Fulufjället area, and feel that the national park needlessly restricts human uses of the area within its boundaries.

94
4.3.3. Designing a sampling framework in the case of onsite guided surveys
Many nature areas receive tens of thousands of visits yearly, and interviewing or assessing the opinions of every visitor is completely impossible in practice. A desire does exist, however, to evaluate pa-rameters and draw conclusions that can at least to some extent be generalised so as to apply to all visitors during a given period of time. The matter is resolved so that a set of visitors is assembled whose answers are subjected to statistical analyses. The question here is one of sampling: the group assembled is referred to as the sample whose parameters will be calculated.
The most representative sample of all the visitors in the area must be taken, so as to make the conclusions based on the sample as reli-able as possible. From the standpoint of sampling, it is important for the visitors in the sample to be chosen independently of the data collector and other visitors. This independence is ensured by using random selection in at least one phase of the sampling. The question of how well the sample represents all the visitors always involves some uncertainty, which can to some extent be controlled by means of a large sample, and by planning and organising the canvassing of the sample with all possible care.
The experience of the area’s personnel is very helpful in the sam-pling’s planning stage – that is, when consideration is being given to who will be asked, and when and where. Generally, a reason exists for stratifying the sample on some sound basis, so that it corresponds to the area’s actual use. Data collection points and the number of observations sought at them can be distributed in proportion to the number of visitors and their geographical distribution. In addition to geographical coverage, the division of the sample into strata may be based on gender, group pursuing a given activity, vehicle, and time. Often a good reason also exists to examine weekend/weekdays and summer/winter visitors separately, since both the pursuit of different activities and those who pursue them can vary greatly according to the time of the week and year.
In order to assemble the most representative sample of visitors, a sampling framework must be designed. Those performing the survey work within the framework, which is a list of the units (visitors or visitor groups) from which they intend to select the sample. With-out a proper sampling framework (and schedule), the interviewer (the data collector) may gather a large number of observations and everything may appear to be going well otherwise – but the obser-vations will have been gathered from the same place within a day or two, and it will no longer be possible to say that the observations represent all the area’s visitors.
Good places for data collection are locations where visitors naturally stop. Fireplace and shelter at Korouoma protected area, Finland. (PHOTO: TUIJA
SIEVÄNEN)

95
The person who drafts the sampling framework should have at least a general idea of the numbers of visitors, and of where in the area the visitors circulate, so that the sampling will be comprehensive. If available, a basic description of the body of visitors, developed through observations beforehand, as well as data on visitor and traffic counts, is very helpful in this work.
Place Target group Observations (target) Collection daysHarrisuvanto Pool (HS) Back-country hikers and backpackers 50 6Hautajärvi Lake Cabin (HL) Backpackers 40 ongoingKiutaköngäs Falls (KIU) Day visitors, groups, and anglers 60 7Camping Ground (LA) Overnighters 40 3Nature Centre (LK) Day visitors and groups 100 7Jäkälämutka (JM) Canoe-campers and anglers 40 4Savilampi Pond (SL) Backpackers and day visitors 30 3Siilas Cabin (ST) Anglers and back-country hikers 100 7Taivalköngäs Falls (TK) Backpackers and day visitors 40 5Total 500 42
EXAMPLE
Sampling framework for Oulanka National Park The target size of the sample is 500 observations. On the basis of experience and visitor-count data, the area’s personnel have acquired a good idea of where in the park the visitors make their visits. On that basis, certain data collection points have been cho-sen that cover the area and are naturally suited to data collection. The target sample of 500 observations is divided up among the survey points essentially in proportion to the number of visitors. From this starting-point situation, the Oulanka personnel have decided to define the following sampling framework.
The later during the course of their visits that the visitors are interviewed, the more thorough the responses they can give about their visits. For this reason the objective is for the visitors to have been at the area for some time already before they answer the questions on the form. This has to be considered in deciding where and when data are to be collected. Ideally, visitors should in most cases answer the questions at the time of leaving the area. One disadvantage then can, however, be that they are in a hurry to leave and consequently will not take time to answer properly. In some cases, if expectations rather than experiences are being focused on, it is more appropriate for interviews to be carried out before the visit.

96
On the basis of experience, it can be said that the data collection point should be somewhere where visitors naturally stop. Good places for data collection include exit/entrance points, various resting points, such as fire sites and lean-tos, wilderness cafés, nature centres, and so forth. It is difficult to get cross-country skiers or mountain bikers to stop in the middle of a trail to fill in a form. Changing weather conditions must also be taken into account – it is nicer to fill in a form out of the rain.
In some cases the area’s service entrepreneurs can also be utilised for data collection. In this case one needs to pay particular attention to supplying the entrepreneurs with guidelines, and to the practicality of the sampling plan. The requirements are that they themselves be interested in the matter, and that the data collection can somehow be controlled. It is not worthwhile involving unwilling outsiders in data collection.
In this connection it should be mentioned that, in visitor surveys, the demands of statistical science are met modestly, since the number of visitors and the visitor profile are often unknown in advance and the sampling cannot be performed with complete randomness, given the available resources. In addition, the areas generally have numerous entrance points, making completely systematic sampling difficult. For this reason it may be justified to speak more of a specimen than a sample, but for the sake of consistency we will continue to use the terms sampling and sample.
4.3.4. Sampling methods for onsite guided surveysA number of alternative sampling methods exist for the actual col-lection of visitor data. Below we present three different alternatives. Naturally, many factors will influence which of those alternatives one chooses. Their adaptability will vary from case to case. Gener-ally, only persons 5 years old5 and older are picked for the sample, since the visitors should understand all the questions on the form. Sometimes it may be justifiable to select younger people, too, for the sample. Random sampling can be recommended as a universal sampling method, if some other reason does not argue more for other sampling methods.
4.3.4.1. Random sampling In random sampling, all individuals who come past the survey point are selected as they arrive; that is, as the data collector finishes with
5 In interviewing children, national regulations may apply. For example in Finland, one needs to have a permission of the parents if one is to interview children under 5 years of age.

97
TIP
If a group of two to four persons arrives at the location, the data collector can choose the person who has the next birthday to be the respondent. That person must, however, give his or her personal answers. Two forms may be given to a large group (five to ten individuals) to be filled in on the same basis as with small groups – according to birthday. This is an easy and unambiguous rule through which one ensures that the choice of respondent is independent of the data collector and the group. If the group’s members are allowed to select the respondent from among themselves, it will often be only the group’s most active members who are chosen.
4.3.4.2. Systematic sampling In systematic sampling, every third visitor, for instance, is picked for the sample at a given point on a given collection day. In principle, the first person picked for the sample is selected randomly. Agreement must be reached in advance as to which person in order (third, fourth, or whatever) will be given the form. If there are a lot of visitors at the area, the form can, for instance, be given to every fifth person. This is a fairly clear way of controlling the data collection and removes, at least in principle, the possibility of the data collector making the choice. Minor problems may arise if the data collector becomes mixed up in counting when a lot of visitors suddenly appear at the spot. In this case he or she has to use common sense and continue the sampling as systematically as possible.
TIP
Systematic sampling can be applied well when a lot of people visit the area. If visitors are few, the data collection will proceed slowly and laboriously.
the preceding respondent. Some visitors may pass the survey point without being picked for the sample – that is, while the data collector is dealing with other visitors (during an interview, for example).
Random sampling may be applied with particular effectiveness when people are scarce at the area or survey point and there is no crowding.

98
TIP
Stratified sampling can be applied when the area’s visitor profile (gender and age group) is known in advance or is clarified by observation as data are being collected. In this case visitors can be picked for the sample so that it corresponds roughly to the known visitor profile. Observation forms can be used as an aid.
EXAMPLE
Stratified sampling has been used in several studies in Denmark – “stratified sampling with optimal variance and cost allocation”. Based on previous knowledge, this sampling procedure has been used to stratify the survey points as well as survey periods (dates) (e.g. Koch 980, 984; Jensen 992, 2003; Jensen & Guldager 2005).
4.3.4.3. Stratified samplingIn stratified sampling, a decision has been reached during the sample definition phase to divide the sample, on the basis of prior information, into various strata – for example, on the basis of gender or age group. The objective is to pick a given number of males and females for the sample from every age group. At the survey point, the data collector can in this case interview every visitor, or give a form for filling in to every person meeting the pre-established sampling criteria. When the desired number of observations has been collected, or when the collec-tion time has expired, that data collection session comes to an end.
4.3.5. Survey schedule in the case of onsite guided surveysThe collection days should be chosen randomly in advance, and a precise collection schedule should be drawn up. Data collection for the visitor survey should be timed so that the observations collected depict the area’s true usage and number of visitors as well as possible.
EXAMPLE
This procedure has been utilised, for instance, in heavily used for-ests and beaches in Denmark. The data collection was performed by delivering questionnaires to cars at parking lots in nature areas during preset time periods. To overcome the delivery of a large number of questionnaires in peak situations, the following pro-cedure was applied: if more than 50 cars are present, only every second car should receive a questionnaire; if more than 00 cars, then every third car, etc. (Koch 980, Jensen 2003).
Questionnaires can also be deliv-ered on windscreens of the cars. (PHOTO: FRANK S. JENSEN)

99
During the summer, for example, this means that the collection days are to be spread over a period of three to four months, depending on the length of the busy season, so that the different days of the week and times of day (morning and afternoon) are comprehensively surveyed. If the area sees its greatest number of visitors at weekends, the weekend days can be given more emphasis than weekdays, so that, for example, there are two collection days a week – one on a weekday and one at the weekend. Knowing or estimating the numbers of visitors helps a lot in determining the number of collection days, as well as the time and duration of the data collection period.
The number of observations made in one day of collecting data varies a great deal, depending on the number of visitors, the area, and the data collection point. If no preliminary information on the number of visitors is available, pre-testing is very helpful and recom-mendable for elucidating the number of sampling days needed to obtain the desired sample size.
TIP
The schedule can be prepared by a drawing – for example by picking the data collection days by lot for each week and, as necessary, each weekend. The drawing can be performed by first cutting out two small pieces of cardboard for each day of the week. One piece is for the morning, one for the afternoon. The pieces of cardboard are in this instance marked “Monday morn-ing”, “Monday afternoon”, and so forth, until all the days of the week have been covered. Then the first collection day is picked (from a given week) and, with the aid of a calendar, it is marked on the schedule. If the survey-takers wish to treat the weekends separately, the weekday pieces are separated from the weekend pieces, and the pieces are placed in different containers. In other cases all the pieces can be kept in the same container. If the day drawn is for some reason not feasible (a special event), the next appropriate day drawn is used.
Drawing random numbers (=daynumber) is another alternative for selecting unbiased collection days.
EXAMPLE
A data collection schedule at Oulanka National ParkThe timetable was drafted on the assumption that an average of 5 forms would be collected on a collection day. The collection days (morning and afternoon) were chosen by drawing separately for

100
each collection point. (The number of collection days for a given point is obtained from the sampling framework.) The drawing was performed so that, within the framework of resources, the specific weeks when the data would be collected were first determined. Collection points were then determined for those weeks, and the actual collection days were drawn. In this fashion an attempt was made to increase the randomness of the sampling and reduce the chance of influence by subjective factors. The schedule incorporated all the collection days and points for the Oulanka visitor survey.
The number of respondents on each collection day is noted in an empty cell in the table. In this way the number of observations can easily be controlled. If it appears that an adequate number of observations has not accumulated, some additional days may be drawn, as the need arises, for the data collection period.
In actuality, 586 forms were collected at Oulanka National Park over a period of 4 months, which was on average 4 forms per collection day.
June 2005 (Example of one week)
Day Tue 14.6. Fr 17.6. Sa 18.6. Mo 20.6. Tue 21.6. Wd 22.6. Mo 27.6.Place HS KIU LK NS LA TK SLTime afternoon morning afternoon afternoon afternoon morning afternoonGoal 15 15 15 15 15 15 15Actual 13 14 16 10 11 12 3Total forms 79
4.3.6. Training the survey personnelGenerally, many people participate in the different phases of a visitor survey, so that a joint orientation programme is essential. In addition to the area’s own personnel, it is possible to use helpers (students and summer workers), who must also receive thorough orientation. The contribution of every person participating in the survey is im-portant, and this should be emphasised to the participants. At the orientation the entire visitor survey process is reviewed, the purpose being to motivate those taking part in the survey, and to ensure that everyone knows why and how the visitor survey is being performed. One must also make sure that all parties understand how to act in various situations.
During the orientation programme, those taking part settle on the sampling method – that is, the basis on which visitors will be selected for the survey. It is a good plan for the data collectors to practice meeting visitors beforehand to enable them to discover for themselves how best to bring up their matter. This can well be practised on other
101
workers or acquaintances, for example. A friendly, motivated person who knows his or her subject also elicits the respondent’s motivation for the survey appreciably better than does a person who simply slaps a questionnaire into the visitor’s hand while mumbling something vague. It also makes sense to be prepared for a range of unexpected situations, such as refusals and questions from the respondent.
During orientation, it is also a good idea to agree on where the filled-in forms will be returned to, and where to ask for advice if prob-lems should arise. Good training safeguards the representativeness of the data and avoids errors originating with the interviewers and sampling. In order to ensure the activity’s uniformity, the person in charge of the survey will also do well to draft written instructions for everyone participating in the data collection. This is especially sensi-ble if temporary workers are being used for the data collection.
During the visitor survey’s different stages, it is useful to meet regularly with those participating in the survey, in order to keep eve-ryone abreast of the situation. If necessary, one can in certain respects change how things are being done. Regular contact keeps everyone’s motivation high, and one can learn a lot from the whole process, with future visitor surveys in mind. If regular contact is not possible, the importance of staff keeping a diary should be emphasised.
4.4. Planning the questionnaireThe planning and design of the questionnaire should be accomplished very carefully. If at this phase mistakes are made, the impacts on the processing of the data, on the interpretation of the results, and on reliability may be tremendous. If one asks well-designed questions that are easy to understand and to reply to, one obtains high quality answers and fewer refusals. On the other hand, bad question word-ing can at worse render the responses useless. In other words, the importance of this stage of the work must not in any instance be underestimated.
If those involved begin the survey form’s design from a blank piece of paper – from the zero point, without prior experience – several weeks will be consumed. Those involved must decide what questions are essential, how they will be presented so as to be understood clearly, and how they will be measured and coded. In addition, the person-nel implementing the study must decide what the natural order is for presenting the questions, and how to fit all the questions into a couple of pages. Planning a questionnaire requires many experiments, compromises, and decisions.
The model questions presented in this manual (Appendix 4) have been planned carefully and tested in practice at several areas. It must

102
be remembered, however, that it is impossible to create a perfect questionnaire. There will always be someone who understands a question differently from what was intended. Below, we nonethe-less present a few general viewpoints to be taken into consideration when the questionnaire is being planned. The same concerns have also been incorporated in the model questions (Appendix 4) and the example of a questionnaire (Appendix 5).
4.4.1. WordingPhrasing of the questions must be precise, since not all visitors will necessarily understand a question as intended. The questions should be posed so that they are easy to understand and can be answered clearly. The questions should be presented in the same form to all visitors. It is best to use ordinary, literate language in the questions and to avoid expressions that are foreign or otherwise difficult to interpret.
Some visitors become annoyed about questions that are imprecisely phrased. This may have an impact on their answers. Various designa-tions of time, such as recently, can be interpreted in a great number of ways; for some, recently will mean about the same thing as two weeks ago, while for others it will mean the same thing as last year.
For this reason it is extremely important to anchor all questions precisely to a certain subject, a certain time, the proper context, and a certain form of behaviour, if that is possible. One thus avoids overly general opinions that are difficult to interpret.
As an example we can take a question that inquires into motives for recreation. One can ask about the matter in this fashion: Which of the following things do you consider important? This phrasing of the question leaves too much room for interpretation, however; it is not known with certainty whether the responses apply to a specific area and point in time, or to recreation and life values in general. One can pose the same question more precisely as follows: Which of the following things do you consider important when visiting here right now? In this manner the answers are tied to a specific place and point in time. The responses can be interpreted as applying specifically to the particular study area, and to no other area, and to this very visit and not prior visits. The point is also essential from the respondent’s perspective: the answer for recreation generally may differ a lot from an answer that expressly concerns recreation at this moment in this particular area.
Responding becomes easier and faster if the form offers multiple, alternative answers. This always requires advance testing of the form to ensure that the options are meaningful and complete. Prior experience is also useful in weighing up the alternatives. If the form has a lot of open-ended questions, to which the respondent has to
Phrasing the questions can be a difficult task if all visitor groups – including children – should be able to give valid answers. Boy fishing in a Danish forest stream. (PHOTO: OLE ANDERSEN)

103
write out an answer in his or her own words, one can expect plenty of questions to be skipped. It is nonetheless advantageous for the form to include some empty space in which the visitors are encouraged to write their thoughts in free-form fashion. The comments can bring out issues that the form itself does not deal with at all.
The problem with providing fixed response alternatives (classes or categories) from which the respondent checks one or all that apply, is that it reduces the possibility for comparing the data. Hence, it is better to ask the precise year of birth or age rather than age classes, for example, if one is to obtain data that is comparable across areas. Otherwise, one runs a risk that the classes used in another study are different. It is always possible to classify afterwards, whereas the reverse is not possible.
It is an advantage to design the form so that it will work whether filled in by the visitor personally, or by the interviewer. When the latter fills in the form, it makes sense to use question cards as an aid, so that the respondent sees the alternatives easily.
The order in which the questions are presented on the form is of great importance. It is not tactful to ask first off, “How old are you”? To begin with, it is a good idea to bring up a few questions that lead into the matter, and are interesting and relatively easy to answer, in order to get the ball rolling. At first the data collector can ask, for example, when and by what sort of vehicle the visitor arrived at the area, what part of the area he or she visited or will visit during this visit, and so forth. These questions warm up the visitors so that they notice that answering is easy and meaningful. Next one can progress to questions that require more consideration. Personal questions can be left until the end of the form, at which point the respondent can decide whether he or she wants to provide personal information. At that point, however, the other information has already been collected.
4.4.2. Appearance of the questionnaireThe questionnaire must be clear and easy to understand and fill in. The form’s cover page has to make it evident that a visitor survey for a specific area is involved. It is also a good thing for the cover page to offer clear directions in respect of answering, returning the form, and further information, as well as the name and contact information of the survey’s author or commissioner.
4.4.2.1. Coding of questions Coding refers to the transformation of responses into a simple numerical form to allow for their processing by computer. The re-spondent’s gender can serve as a simple example of coding: there are two alternatives, male and female. This can be coded, for instance, so that male is entered using the code and female using the code 2.
It is not always easy to foresee all possible response alternatives when providing fixed categories for e.g. activities or motives. Wedding procession in Latvia. (PHOTO: FRANK
S. JENSEN)

104
Depending on the method of data collection and entry, the alterna-tives’ codes can either be visible on the form or not. If the codes are not visible, the questionnaire will have a more spacious appearance and be more pleasant to read. In any event it is good to consider, when the questionnaire’s appearance is being defined, how the forms will be entered and whether the codes will need to be concealed rather than visible.
4.4.2.2. Layout and copyingOnsite interviewsA total of four or fewer A4-sized pages has been found to be a good length for questionnaires implemented onsite. The type of area affects the amount of time that respondents are usually willing to spend on answering onsite. For example, after a one week backpacking trip to a remote area, spending 5 minutes for filling in a questionnaire is more acceptable than if the visit was to a more urban area, lasting less than half an hour.
A good means of getting all the most important questions to fit in is to divide the form into two columns. Alternative fonts and point sizes allow one to influence the questions’ space requirement. When the necessary questions have been arranged to fit on four A4 pages, the actual questionnaire should be produced so that the four original pages are copied on to the two sides of an A3 sheet, which is then folded in the middle. This way there is no need to staple pages together, and the form is easy to handle both outdoors and indoors. In some cases the managers may want to attach a number of special questions, in which case not all the questions will fit on to four pages. This sort of space problem can be resolved by tucking one loose insert sheet into the folded A3 sheet.
The form’s paper can well be something a bit heavier than ordinary copying paper, which weighs 80 g/m2. For example, paper weighing 20 or 40 g/m2 will be strong enough and will withstand somewhat rougher handling than normal copying paper. Some of the forms can also be printed on weatherproof paper, which admittedly is a bit more expensive, but which will prove very useful under wet conditions.
For the convenience of the respondents, a small font size should be avoided at all costs. However, to alleviate this potential problem it is always a good idea for the interviewers to have a few reading glasses with different strengths available for loan.
Postal surveysWhen the data is collected by a postal survey, a somewhat longer questionnaire is applicable. A total of some 8–2 pages generally still yields a good response rate. A nice, clear layout which is not crammed

105
too full is important in encouraging the respondents to fill out the survey on their own.
It is also nice in the case of postal questionnaires, if one can produce a folded A3; in the case of 8 pages two A3s and in the case of 2 pages three A3s stapled as a folder in the middle. However, a double-sided A4 sheet format, stapled in the left upper corner works well in the case of postal surveys.
Internet surveysWhen collecting data by an Internet survey, there are numerous handy commercial software applications available for both question-naire design and data entry. All the software tends to have some limitations on questionnaire format.
4.4.3. Variables, model questions and example questionnaire
The variables and model questions presented in appendix 4 have taken shape through a long process at a variety of nature areas. They combine experiences from various surveys implemented in the countries that have been involved in the project. In particular, the variables and questions used in the following studies have been utilised in shaping the model questions:• Fulufjället postal survey 2003, Sweden (Fredman et al. 2005)• Metsähallitus standard questionnaire (Erkkonen & Sievänen
2001)• Danish material from several onsite studies (e.g. Koch 980, 984;
Jensen 992, 2003; Jensen & Guldager 2005)
The idea of the model questions is to provide operationalisation of variables that are of interest in as ready a form as possible. Adapting the questions to a specific area is relatively easy and fast compared to the situation where one has to start developing a survey from the very beginning. The intention is to retain a certain number of ques-tions as standard questions, so that managers and researchers obtain comparable information from the areas.
The following principles were applied when formulating the questions:• Where an open-ended question is feasible and yields reliable results
(e.g. length of stay in hours or days, age/year of birth), the open-ended question is used. This has several advantages: () we avoid the problem of results being incomparable due to the use of different response classes, (2) it saves space in the final questionnaire blanket and (3) it (often) yields a so-called continuous variable, opening up opportunities for better statistical analysis, if needed.
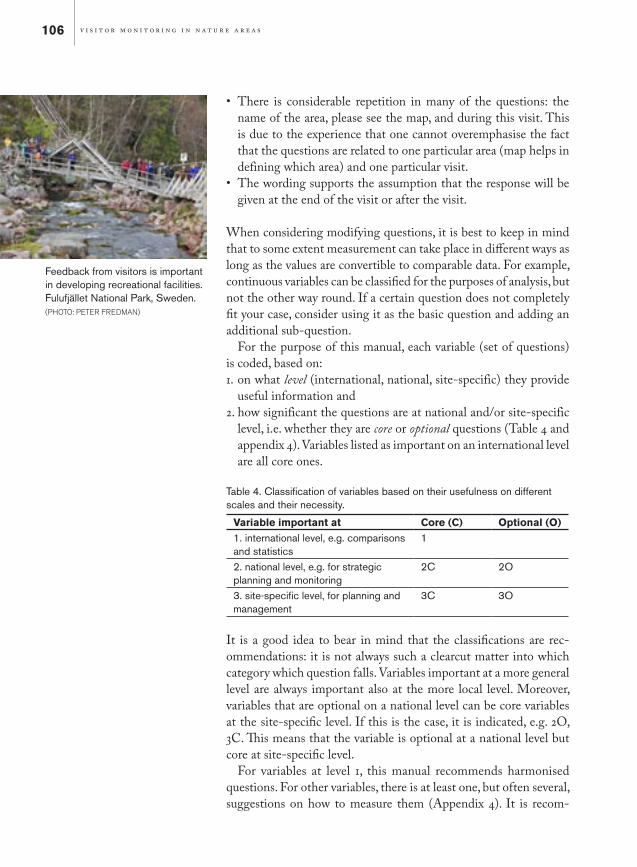
106
• There is considerable repetition in many of the questions: the name of the area, please see the map, and during this visit. This is due to the experience that one cannot overemphasise the fact that the questions are related to one particular area (map helps in defining which area) and one particular visit.
• The wording supports the assumption that the response will be given at the end of the visit or after the visit.
When considering modifying questions, it is best to keep in mind that to some extent measurement can take place in different ways as long as the values are convertible to comparable data. For example, continuous variables can be classified for the purposes of analysis, but not the other way round. If a certain question does not completely fit your case, consider using it as the basic question and adding an additional sub-question.
For the purpose of this manual, each variable (set of questions) is coded, based on:. on what level (international, national, site-specific) they provide
useful information and2. how significant the questions are at national and/or site-specific
level, i.e. whether they are core or optional questions (Table 4 and appendix 4). Variables listed as important on an international level are all core ones.
Table 4. Classification of variables based on their usefulness on different scales and their necessity.
Variable important at Core (C) Optional (O)1. international level, e.g. comparisons and statistics
1
2. national level, e.g. for strategic planning and monitoring
2C 2O
3. site-specific level, for planning and management
3C 3O
It is a good idea to bear in mind that the classifications are rec-ommendations: it is not always such a clearcut matter into which category which question falls. Variables important at a more general level are always important also at the more local level. Moreover, variables that are optional on a national level can be core variables at the site-specific level. If this is the case, it is indicated, e.g. 2O, 3C. This means that the variable is optional at a national level but core at site-specific level.
For variables at level , this manual recommends harmonised questions. For other variables, there is at least one, but often several, suggestions on how to measure them (Appendix 4). It is recom-
Feedback from visitors is important in developing recreational facilities. Fulufjället National Park, Sweden. (PHOTO: PETER FREDMAN)

107
mended for questions at level 2C (i.e., core questions nationally) to be harmonised at a national level.
In addition, the type of area and the methodology (e.g. onsite vs. postal survey) affects the applicability of certain questions. Common sense should be used when estimating the applicability of a single question in a particular case. In an urban recreation area, a somewhat different choice of questions is more meaningful than in a remote area. On the other hand, in terms of methodology, the total number of questions on the survey form affects the feasibility of a single ques-tion in an onsite survey; some lengthy questions not recommended for onsite surveys in general can work well if some other questions are not included. Another example is that one does not need to ask the respondent’s place of residence if one is doing a postal survey, as the respondent’s address is clearly already known.
At a minimum the following adaptations apply to the questions:• The name of the area must be indicated; each question must refer
specifically to the study area. • The questions on the basic form are not in the order in which they
should appear in the questionnaire, because here they are structured based on the variables they are measuring. Good judgement should be used to make the order of the questions logical and meaningful for the respondent (see chapter 4.4.). To assist with this work, an example questionnaire is included (Appendix 5).
4.4.4. Testing the questionnaireThe model questions presented in this manual have been tested in advance and found to be fairly functional. Even when only these model questions are being used, they need to be edited so as to be appropriate for another area, and therefore it makes sense to have the new form read by at least a few people who know the area well.
When the form is being produced for the first time and its planning begins from a blank piece of paper, without any help along the lines of the model questions, for example, those performing the survey must place especially great emphasis on the testing phase. Even a questionnaire that “feels” good is worth testing before it is used as a means of collecting visitor data. The purpose of the advance testing is to clarify whether the form works as planned, and whether the visitors will understand the questions as intended. The testing can be carried out with a fairly small group (0–20 persons, for example). Testing should be preferably done onsite. The answers should be analysed critically. If one question elicits a lot of unusable responses, or often goes unanswered, it should be redesigned or simply deleted from the questionnaire. During the testing stage, visitors can also be asked for general feedback concerning the form and the visitor
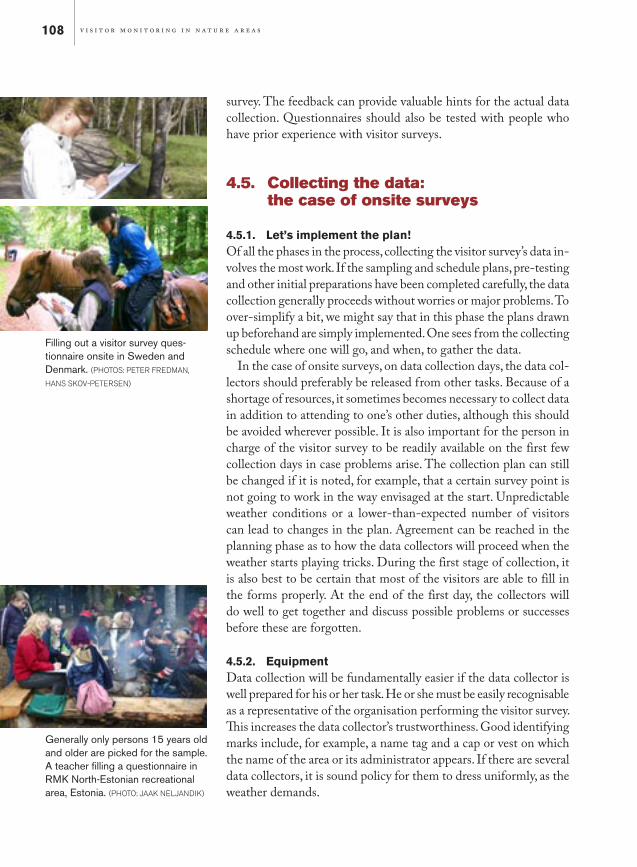
108
survey. The feedback can provide valuable hints for the actual data collection. Questionnaires should also be tested with people who have prior experience with visitor surveys.
4.5. Collecting the data: the case of onsite surveys
4.5.1. Let’s implement the plan!Of all the phases in the process, collecting the visitor survey’s data in-volves the most work. If the sampling and schedule plans, pre-testing and other initial preparations have been completed carefully, the data collection generally proceeds without worries or major problems. To over-simplify a bit, we might say that in this phase the plans drawn up beforehand are simply implemented. One sees from the collecting schedule where one will go, and when, to gather the data.
In the case of onsite surveys, on data collection days, the data col-lectors should preferably be released from other tasks. Because of a shortage of resources, it sometimes becomes necessary to collect data in addition to attending to one’s other duties, although this should be avoided wherever possible. It is also important for the person in charge of the visitor survey to be readily available on the first few collection days in case problems arise. The collection plan can still be changed if it is noted, for example, that a certain survey point is not going to work in the way envisaged at the start. Unpredictable weather conditions or a lower-than-expected number of visitors can lead to changes in the plan. Agreement can be reached in the planning phase as to how the data collectors will proceed when the weather starts playing tricks. During the first stage of collection, it is also best to be certain that most of the visitors are able to fill in the forms properly. At the end of the first day, the collectors will do well to get together and discuss possible problems or successes before these are forgotten.
4.5.2. EquipmentData collection will be fundamentally easier if the data collector is well prepared for his or her task. He or she must be easily recognisable as a representative of the organisation performing the visitor survey. This increases the data collector’s trustworthiness. Good identifying marks include, for example, a name tag and a cap or vest on which the name of the area or its administrator appears. If there are several data collectors, it is sound policy for them to dress uniformly, as the weather demands.
Generally only persons 15 years old and older are picked for the sample. A teacher filling a questionnaire in RMK North-Estonian recreational area, Estonia. (PHOTO: JAAK NELJANDIK)
Filling out a visitor survey ques-tionnaire onsite in Sweden and Denmark. (PHOTOS: PETER FREDMAN,
HANS SKOV-PETERSEN)

109
TIP
Onsite survey equipmentIn general, the following pieces of equipment belong in every data collector’s map case onsite: - an adequate number of survey forms (including some weath-
erproof forms) - clipboards - pencils - (pencil sharpener) - (eraser) - a few reading glasses of different strengths (needed surpris-
ingly often!) - (calculator) - map of the area - a few reply envelopes (bearing the address, with the postage
prepaid) - survey diary - written data collection instructions (for sampling) - (question cards for interviews) - protection against rain, sun, mosquitoes etc. (shelter, um-
brella…)
4.5.3. Meeting the visitorWhen addressing the visitor, the data collector must introduce him-self or herself politely and explain the matter at hand. A friendly, supportive attitude towards the visitor contributes to the motivation to respond and helps a great deal in collecting the visitor data. The survey generally comes to the visitors as a surprise for which they have not prepared themselves in advance. Generally visitors take a very positive attitude towards the visitor survey, especially when informed that, through their opinions, they can have an impact on the area’s future development.
When there is awareness at the outset that the questionnaire con-tains difficult questions, it is worthwhile informing the visitors more thoroughly about the principles for answering certain questions. In this fashion the data collector strives for consistency and correctness in the answers. Money usage associated with the visit might be mentioned as an example of a difficult subject to ask about: although the question invites the visitor to disclose his or her personal expenses, visitors fairly often state the costs for their groups (especially when it comes to travel expenses). Mistakes of this sort have to be corrected afterwards, but one can also try consciously to minimise them in advance by emphasising how certain questions are to be answered.
Interviewers should be prepared for changing weather conditions. (PHOTO: HANS SKOV-PETERSEN)
110
EXAMPLES
When a visitor chosen according to the sampling principle arrives at the spot, one can act as follows:F Present yourself in a friendly manner and inform the visitor
of your business – for example, depending on the time of day, in this fashion:
Hello! I’m Kasperi Majava from Metsähallitus. We’re conducting a visitor survey here at the national park. Could you spare a mo-ment to answer a questionnaire like this? The information will be utilised in improving this park.
As necessary the data collector informs the visitor that filling in the form takes about 0 to 5 minutes.F When the visitor agrees to complete the questionnaire, the data
collector gives him or her verbal instructions for so doing (those instructions are also written on the front of the questionnaire) and supplies additional directions as needed. The data collector also provides the visitor with a pencil and a clipboard. Some respondents may also need reading glasses. Finally, the visitor is told where to return the completed form.F Afterwards the data collector takes back the completed form
and the writing implements. If possible, he or she checks to determine whether the questions have been answered. Where necessary, the collector asks the visitor to complete the form. He or she notes on the front of the form whether the visitor has filled it in personally or has been interviewed, writes down where the observation was obtained, and adds his or her own initials. F If the visitor hesitates or considers the questionnaire too long,
the data collector can try in a friendly way to encourage him or her to fill it in. If the latter continues to refuse to answer the survey, there is no reason to take offence; instead, the data
If the visitor for some reason does not want to answer the survey, his or her opinion is to be respected. There is no point in arguing the toss. It is worth remembering that there is room for all sorts of visitors, so that sometimes the data collector gets to hear some sharp feedback about problems weighing on a visitor’s mind. It is worthwhile making a note of the feedback for possible action later. The data collector has no reason to get upset about such things, since the feedback is rarely directed at him or her personally
Below we give several examples of how the data collector (the interviewer) can approach the visitor.

111
collector politely wishes the person Good day or the like and does not pressure him or her further. When the visitor is out of sight, the data collector records the information on the list of refusals. (See appendix 7).
If the area’s managers wish, for example, to improve the agency’s image, everyone who responds to the survey can be given, say, a voucher for a cup of coffee and a bun, or some other small token of appreciation for the person’s participation in the survey. This is a good, economical means of getting visitors to participate while also leaving them with a favourable image of the area manager. It makes no sense, however, to overemphasise the possible coffee vouchers – in that case it would have too much impact on the visitors’ response behaviour. A good method is to give the respondent the coffee voucher at the end of the process, in return for the completed questionnaire.
4.5.4. Survey diary It is useful for the data collector to maintain a separate survey diary for each day of data collection and each site. The survey diary can be utilised in a wide variety of ways. One can use it to note factors bearing on the data collection – such as the weather, the duration of the collection, large groups, the direction of travel along trails, the number of visitors at the collection site, the number of questionnaires collected, the number and reasons for refusal, and the collector’s own feelings and observations respecting factors affecting the collection. One can also record things in the diary that emerge in free-form discussions with visitors.
The diary’s information can be compared to the data collection plan. Information assembled in the diary can be of immense use – for example, when the representativeness of the material is being exam-ined. In future visitor surveys, earlier diaries can be utilised to plan the data collection so that at least old mistakes will not be repeated in a subsequent survey. If the response rate seems to remain unac-ceptably low, it is important to conduct studies of possible sampling errors in addition to keeping the survey diary.
Appendix 7 presents a sample survey diary that can easily be kept on file. As the need arises, other matters needing to be examined can be attached to the survey diary, too.
4.5.5. Further stepsPrecise agreement has to be reached with the data collectors as to what to do with the completed forms. It is a good idea for the forms to be collected in a centralised fashion by a specific person at a spe-

112
cific place. Again, it is worthwhile marking on the data collection schedule the number of forms collected on each day of collection. In this way the progress of the data collection and the meeting of the collection goals can easily be monitored.
4.6. Collecting the data: the case of postal surveys
In some cases, data collection on site will not provide enough, or the right kind of, information required for the purpose of a visitor study. When asking people onsite, the time you can keep the visitors’ attention on a survey is usually limited. Most people are outdoors for purposes other than answering questions and they are not al-ways willing to make a stop in order to fill out questionnaires, and especially not lengthy ones. Crowding, bad weather and remoteness are other factors that might limit the possibilities of distributing questionnaires on site.
Yet another potential disadvantage of asking people questions onsite is that some respondents will provide their answers at the beginning or during their visit, which may cause some bias to ques-tions about experiences of the area, expenditure, etc. When questions are asked after the visit is over, respondents are able to recollect their complete set of experiences and behaviour during their visit.
One way of solving the problems mentioned above is to collect visi-tors’ contact information (i.e. telephone numbers, postal addresses, or e-mail addresses) onsite and then to do a follow-up telephone, postal or Internet survey. Here the focus is on postal surveys based on onsite collection of contact information (i.e. mail follow-up surveys), which is the most common method used. In the Fulufjället visitor surveys, for example (Fredman et al. 2005), respondents were asked to answer a one page self administered questionnaire onsite, which included their name and address for use in a postal survey (see example).
The procedure of administrating a postal survey based on addresses collected onsite is not much different from doing a traditional mail survey based on a general population sample. A normal procedure would be to first send out the questionnaire, including a prepaid reply envelope and a cover letter explaining the purpose of the survey and the importance of answering all the questions as well as possible. One should not forget to provide contact information in case the respondents have any questions about the survey.
Based on experiences from Sweden, the first answers start to come in after 4–5 days. The number will peak after about 0 days and significantly drop off after about three weeks. Now is the time to send out the first reminder to those who have not answered. This

113
reminder can be a simple card kindly asking the addressee to return the filled in questionnaire. After another 2–3 weeks a third reminder is usually sent out which will include a new copy of the questionnaire. The number of reminders is naturally a matter of what response rate one is aiming for, but it is also a question of money and time. In some cases, a small incentive (i.e. lottery ticket) can be used to increase response rates. For more detailed information on the implementation of postal surveys, one should see e.g. Dillman (999).
There are two observations to make regarding postal surveys in outdoor recreation compared to general population surveys. First of all, visitors who have agreed onsite to give their address for the purpose of a postal survey are often more willing to return their answers than people who receive a mailed questionnaire at their home without any previous contact. Consequently, postal surveys based on onsite collection of contact information usually get quite good response rates. Secondly, it is important to distribute the postal survey as soon as possible after collecting the addresses onsite in order to minimise recollection bias. As time passes, people forget the details of their visit, leading to possible biases in their answers, especially in relation to more detailed questions.
In the case of a postal survey, it is also important to develop a timeta-ble of the steps of the survey indicating on what dates the various tasks are to be performed and listing the supplies that will be needed so that the process proceeds smoothly. As is always the case in visitor surveys, both on and off site, high response rates are critical for their validity. For postal surveys based on onsite collection of contact information a response rate of 60 percent is usually considered acceptable, but the rate should preferably be in the 70–80 percent range.
EXAMPLE
Fulufjället National Park (Fredman et al. 2007)In November of both 200 and 2003, postal questionnaires were sent to a sample of Swedish and German visitors, the two most frequently represented nationalities among visitors to Fulufjället National Park.
The sample for the postal questionnaire was systematically se-lected from the registration cards after they were sorted by comple-tion date. Certain cards were excluded from the selection process, i.e. double registrations (individuals for whom there were two or more registration cards), cards with an unusable address, and per-sons under age 5. Since the number of registrations at the different locations varied widely questionnaires were sent to all Swedes and
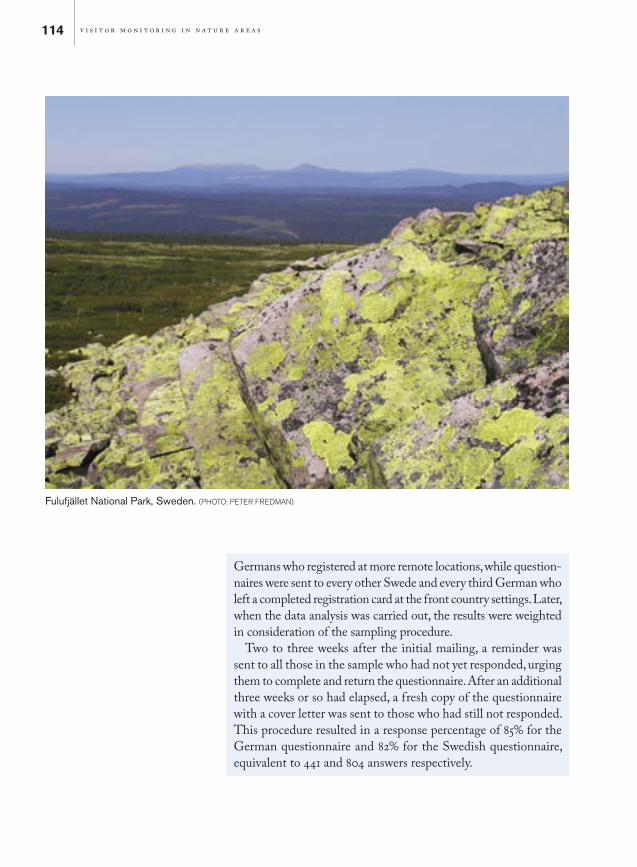
114
Germans who registered at more remote locations, while question-naires were sent to every other Swede and every third German who left a completed registration card at the front country settings. Later, when the data analysis was carried out, the results were weighted in consideration of the sampling procedure.
Two to three weeks after the initial mailing, a reminder was sent to all those in the sample who had not yet responded, urging them to complete and return the questionnaire. After an additional three weeks or so had elapsed, a fresh copy of the questionnaire with a cover letter was sent to those who had still not responded. This procedure resulted in a response percentage of 85% for the German questionnaire and 82% for the Swedish questionnaire, equivalent to 44 and 804 answers respectively.
Fulufjället National Park, Sweden. (PHOTO: PETER FREDMAN)

115
4.7. Data entry and processingFor the entry and processing of visitor survey data one can use any statistical software, such as SPSS or SAS. For basic data analysis, MS Excel is often sufficient.
When data is gathered by printed questionnaires, the procedures described in this chapter are needed. One of the significant ad-vantages of Internet surveys is that the labour-intensive data entry phase is avoided.
Before data entry takes place, every form has to be numbered consecutively, for example in a place reserved for that purpose on the cover page. Data entry can as necessary begin at the end of the first day of collection, for example, or it can be left until all the data have been gathered.
The visitor data collected on the survey forms can be recorded and processed with either a variety of statistical programs or spreadsheet programs. For the purpose of entry, a data entry form based on the questionnaire must be created (for instance with Excel). Every vari-able in the data entry form is identified by the most illustrative pos-sible name. For the sake of clarity, it is best to attempt to refer, with each variable’s name, to a certain question and, as necessary, subsidiary point on the questionnaire. For example, ARRIVx might refer to arrival in the area and the first point under the first question.
This work continues until all the questionnaire’s variables have been marked on the data entry form. In all, some questionnaires can have more than 00 variables, so that the creation and reworking of the data entry form demands a lot of work and extreme precision.
It is worthwhile practising the data entry with a few actual question-naires and checking that the data entry’s logic works. Changes are then made as called for. When the data entry form is completely ready, one can begin the actual entry from the questionnaires. In data entry one uses either the ready-to-go codes on the questionnaire or the prepared coding guide. In some instances the codes have to be drawn up on a case-by-case basis. Answers to open-ended questions have to be writ-ten in the cells reserved for them. The codes’ legends should be noted carefully. This will help appreciably in interpreting the results.
It is possible that some questionnaires have to be rejected completely as late as at the data entry phase, for instance when the questionnaire has been filled in very scantily. It is difficult to give any real rule of thumb here: rejections have to be made by considering each case.
Scanning the completed questionnaires is also worth considering. In that case it is important to clarify with the scanning company what is required regarding design and layout. If using scanning as the method of data entry, the number of open-ended questions should preferably be restricted.
116
All in all, data entry is a labour-intensive phase, and there are no tricks that will make it appreciably nicer. Entering the data from one questionnaire can take as long as ten minutes at first, but with routine and experience the pace picks up to about five minutes, depending on the number of variables and the swiftness of the data entry worker’s fingers.
Once the data have been entered, it is time to check the material, since mistakes inevitably crop up. The checking must be done with care and patience. It is annoying if mistakes are left in the data at this stage, since a lot of time and trouble has gone into the visitor survey. Material that is completely free of mistakes will scarcely be obtained: one hopes, however, that the mistakes will cancel each other out, and that no systematic error will remain in the data. Generally, checking the data takes a few days.
If a very high level of precision of data entry is required, a double-entry procedure can be performed. This means that two independent persons are entering the data. Then the two datasets are compared for discrepancies – meaning that the two persons should make the same mistake at the same place in order not to be detected.
Sometimes the visitors’ responses are not logical and consistent. It is worthwhile at first examining the results’ distributions or the data-base, in order to detect extraordinary or divergent observations there. These observations need to be checked against the questionnaires and, where necessary, corrections have to be made in the database.
The question on the use of money, for example, generally demands the most adjustments and corrections afterwards. Often expenses (travel expenses particularly) have to be divided by the size of a group, if the questionnaire asks about personal expenses. In checking, it makes sense to seek consistent solutions with the aid of the questionnaire’s other questions (duration of visit, municipality of residence, activities, vehicle, size of party, etc.). It has to be remembered, however, that some of the extraordinary observations, too, may be absolutely correct, and that sometimes there is no reason to change them.
Further analysis, reporting, interpretation and utilisation of visitor survey data is presented in chapters 5, 6 and 7 of this manual.
4.8. When things do not go as planned What happens if everything does not succeed as planned? Despite careful planning, it may happen in different phases of a visitor survey that even the best intentions do not seem to be realised in practice. This is by no means particularly extraordinary, since the plans are in fact objectives whose realisation is always somewhat uncertain. The realisa-tion of plans may be hampered by many factors which the managers

117
were not able to take into account beforehand, and chance can play its own role in matters, too. In this case it is best to consider first where the surprises originated, and then to take the necessary steps.
Generally one uses common sense to cope with changed situations. It is useful to make a note of divergences from the plan, so as not to run into the same problems in the next round of the visitor survey. Below we list a few things that do not necessarily always go quite as planned.
The data collection sites do not work in practice. It is highly possible that the collection of visitor information will not succeed at certain sites. This may become obvious when people take no interest in filling in the form (lots of refusals), or the location has few visitors. This kind of thing may occur where the visitors are half-forced to stop (alongside a cross-country ski trail, for instance) or the visitors are in such a hurry to leave the area that they do not have time to answer the survey (in a car park, for example). In such cases the data collection plan can either be changed so that a site that works poorly is rejected entirely, or the data collector moves to another location where it is more natural for people to stop.
Bad weather. Sometimes unexpected weather conditions make it necessary to cancel a planned day of data collection at a certain loca-tion. In stormy weather, for example, one can diverge from the col-lection plan and move the survey point temporarily, as circumstances permit, to an indoor space – a nature centre, for instance. If relocation is impossible, the survey personnel can prepare for such an eventuality by adding days to the collection plan. But mere unpleasant weather should not, of course, be allowed to prevent data collection. It is also important to register visitors under such circumstances since they might show a different pattern compared to sunshine visitors.
Lack of visitors at the area. Bad weather conditions can also mean that there will be few visitors at the area throughout the data collection period. In the summer of 998, for instance, it rained so much in Finland as to be evident in the visitor numbers at several areas. Collection days can be added to the data collection plan so that the data will include enough observations for the purpose of statistical analysis.
Too many visitors at the area. Great surprises can be avoided by pre-testing. If, despite pre-testing, this becomes a problem, the sampling procedure can be adjusted by e.g. increasing the sampling interval (i.e. instead of sampling every second visitor, one samples every fourth visitor). This situation is most problematic when the use density is uneven, as is often the case.
Lots of refusals. Often people take a favourable attitude towards visitor surveys and only a small percentage of visitors refuse to take part. If, however, an appreciable number of visitors refuse to respond
Some visitors might be more dif-ficult to stop for an interview than others. Live-Action-Roleplaying in Gribskov, Denmark. (PHOTO: OLE
ANDERSEN)

118
to the survey, one should consider why. In the case of an onsite survey, at this point it makes sense to seek the help of the survey diary’s list of refusals where the type of visitor and preferably also the reason for refusal is recorded. The reason may lie in the questionnaire and its questions (too long or unclear a questionnaire); or the problem may originate with the data collector, or a badly chosen survey point, or the type of visitor (fast moving visitors like mountain bikers). Once the main reason for the refusals is clear, it becomes possible to make the necessary changes to the questionnaire, to modify the data col-lection plan, or to acquaint the data collector better with his or her task. In the case of a postal survey, additional follow-ups and/or more in-depth non-response studies should be considered.
Fewer observations than sought, at the end of the data collec-tion period. If, in spite of all the preparations, fewer questionnaires than were sought have accumulated by the end of the data collec-tion period, and data collection can no longer be continued, a good reason again exists to consider why. Even with a modest amount of material (00–50 questionnaires, for example) it is possible to do the work and process the material statistically. In this case, too, one can peruse the survey diary’s information for possible explanations for the shortage of observations. In the reporting phase, one should treat the limitations and reservations associated with the material’s representativeness with particular care, if valid conclusions are to be drawn from the results.
Vandalism of equipment (e.g. self registration boxes). Actions to reduce vandalism include moving equipment to more remote loca-tions, more frequent check-ups, and better information signs in the case of self registration boxes.

119
5. Reporting the results of visitor monitoring

120
5.1. General instructionsThe way in which a report is presented depends largely on how it is intended to be used; that is, will the report be solely for the internal use of a given organisation, or will it be published for other people to read in some publication series? In some instances a PowerPoint presentation will well suffice for a report, while in most cases at least a written report is justifiable. The advantage of a published report is that it is available not only to the people who are aware they can request it, but also to anybody else interested in it.
The simplest reporting can be to the visitors themselves. This might involve summary statistics. More complex reporting might be intended for outside groups that are marginally interested, such as allied government agencies. Full reports will be needed by managers, by planners, and by allied researchers. Specialised reports may be necessary for specialised groups like tourism companies. Thus, it is important to consider the market for the report when formulating the structure of the report.
Increasingly the Internet provides the potential to deliver real time data and survey results to planners and managers almost as soon as the data is collected. For example, electronic data collection in the field or internet based survey data collection can be analysed and reported very quickly. In theory, it is possible for senior managers
5. Reporting the results of visitor monitoring
SUMMARY
In most cases, a report with clear interpretation of the findings should be produced after the visitor monitoring data has been analysed to make the information available to those interested in it.
A visitor monitoring report usually includes a short descrip-tion of the methodology, results illustrated by tables and graphs, and conclusions.
The report format and the amount of work needed for report-ing largely depends on the target group and whether the report is intended to be published or not. In some cases a PowerPoint presentation will well suffice for a report, as long as it includes the main points (i.e. methodology, results and conclusions) to make the findings interpretable and understandable.
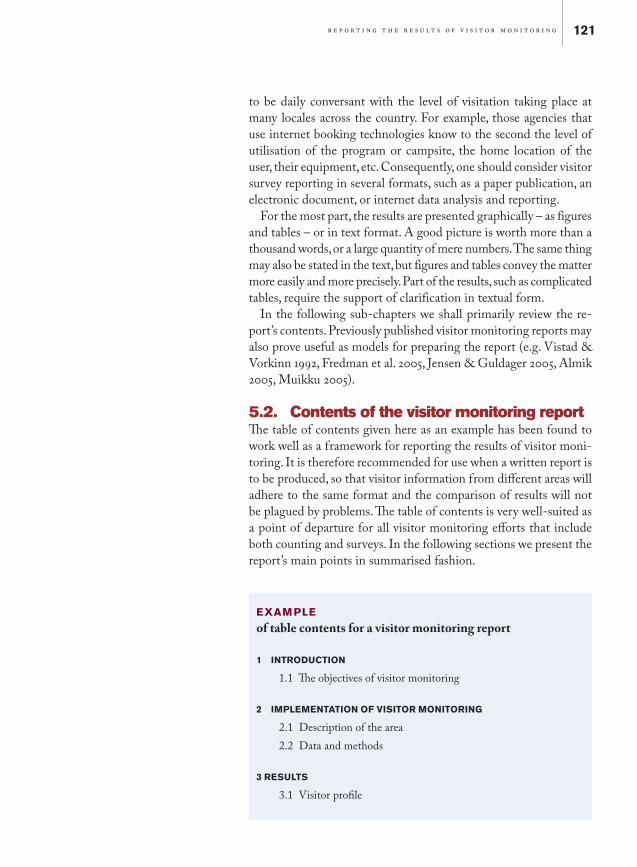
121
to be daily conversant with the level of visitation taking place at many locales across the country. For example, those agencies that use internet booking technologies know to the second the level of utilisation of the program or campsite, the home location of the user, their equipment, etc. Consequently, one should consider visitor survey reporting in several formats, such as a paper publication, an electronic document, or internet data analysis and reporting.
For the most part, the results are presented graphically – as figures and tables – or in text format. A good picture is worth more than a thousand words, or a large quantity of mere numbers. The same thing may also be stated in the text, but figures and tables convey the matter more easily and more precisely. Part of the results, such as complicated tables, require the support of clarification in textual form.
In the following sub-chapters we shall primarily review the re-port’s contents. Previously published visitor monitoring reports may also prove useful as models for preparing the report (e.g. Vistad & Vorkinn 992, Fredman et al. 2005, Jensen & Guldager 2005, Almik 2005, Muikku 2005).
5.2. Contents of the visitor monitoring reportThe table of contents given here as an example has been found to work well as a framework for reporting the results of visitor moni-toring. It is therefore recommended for use when a written report is to be produced, so that visitor information from different areas will adhere to the same format and the comparison of results will not be plagued by problems. The table of contents is very well-suited as a point of departure for all visitor monitoring efforts that include both counting and surveys. In the following sections we present the report’s main points in summarised fashion.
EXAM PLE
of table contents for a visitor monitoring report
1 INTRODUCTION
1.1 The objectives of visitor monitoring
2 IMPLEMENTATION OF VISITOR MONITORING
2.1 Description of the area 2.2 Data and methods
3 RESULTS
3.1 Visitor profile

122
5.3. IntroductionSince a visitor monitoring report may have a variety of readers, a short introductory paragraph is necessary. The introduction should explain concisely why visitor monitoring was performed. In addition, the introduction can, for instance, describe:• the status of the management-and-use plan• what sort of planning methods have been used (participatory
planning, etc.) • what sort of counting and surveys have been performed at the area
in the past• the need that the new data to be produced by visitor monitoring
is to satisfy for the area in question right now.
The thoroughness of the introductory paragraph depends largely on how large and diverse a readership the report can be expected to have, and how well those readers know the area.
3.1.1 Basic visitor data 3.1.2 Data on the visitors’ parties
3.2 The visit to the nature area 3.2.1 Importance of the destination 3.2.2 Visitors’ outdoor-exercise and nature-related activities 3.2.3 Geographical distribution of visitors 3.2.4 Duration and repetition of the visit 3.2.5 Arriving at the area 3.2.6 Money usage 3.2.7 Source of information
3.3 Visitors’ attitudes and values 3.3.1 Purpose of the visit 3.3.2 Visitors’ opinions about the area, services, and
environmental quality 3.3.3 Visitors’ expectations 3.3.4 Factors detracting from the visit 3.3.5 Visitor satisfaction index
3.4 Questions specific to the area 3.4.1 New recreational services 3.4.2 Free-form thoughts
4 DISCUSSION AND CONCLUSIONS
5 SUMMARY
SOURCES
Appendices (sampling framework; data collection schedule; questionnaires, and free-form thoughts, categorised)

123
5.4. Implementation of visitor monitoring
5.4.1. Description of the areaThe area under study can be described concisely in tabular form: the table will make the most important parameters evident at a quick glance. The extent of the text section depends largely on the report’s intended use. A map indicating the counting and survey points can also be presented.
EXAMPLE
of a table presenting background information about the study area (Muikku 2005):
Key parameters depicting Oulanka National Park.
Oulanka National Park
Date of founding 1956, expanded in 1982 and 1989
Location Oulu and Lapland Provinces, municipalities of Kuusamo and Salla
Surface area of national park 27,700 ha, administered by Metsähallitus
Functional surface area On the basis of hiking and travel outdoors, the national park is divided into four zones:Core area, 16,900 ha (61 % of surface area)Wilderness area, 7,800 ha (28 % of surface area ) Restricted area, 800 ha (3 % of surface area)Frontier zone, 2,200 ha (8 % of surface area)
Land use zones
22 nature types according to Nature Directive, out of which 6 are prioritised40 species under special protectionAreas being restored to natural state, 50 ha Heritage environments, 15,8 ha
Number of visits (estimated) c. 160,000 visits/year
Services Oulanka Nature Centre, established 1988Hautajärvi Lake Cabin, established 1992Trail network, approx. 79 km (Karhunkierros Trail, among others); cross-country ski trail, 25 km5 nature trails2 car parks8 wilderness cabins33 camping sites and 37 fire sites2 boat landings and harboursCafé servicesCamping ground
Modes of use Conservation, research, nature study instruction, ecotourism
Special The University of Oulu’s Oulanka Biological Station is located at the park.
Management-and-use plan Drafted in 2000, approved by the Ministry of the Environment 2003.

124
5.4.2. Data and methodsIt is a good idea to tell readers how the data were collected and proc-essed. From this section, conclusions can be reached as to the repre-sentativeness of the data. In addition, visitor monitoring can later be repeated in the same way, if so desired. This section documents:• the implementation of visitor counting, e.g. in the case of counting
implemented by counters:o number and type of counters o counter locationso reading and maintenance intervalso counting period
• the implementation of the visitor survey o the survey’s population (the sampling framework, which makes
evident what sort of group the observational data were assembled from; table attached as appendix).
o limitations related to visitors and time of data collection (it is a good idea to note changes in the data collection plan; schedule attached as appendix)
o the sampling method used o the temporal and geographical distribution of survey responses
(see example)o the discussion of the data’s representativeness (the manner in
which the plans were implemented can be examined with the aid of the survey diary)
o how the data were processed and what sorts of analyses were performed
o how the questionnaires were filled in and how well they workedo if a lot of people refused to take the survey, an attempt can be made
to analyse the loss of responses (with the aid of the survey diary).
EXAMPLE
of reporting distribution of survey responses
Distribution of survey responses at Oulanka National Park.
Place of observation n %Siilas Cabin 108 18Kiutaköngäs Falls 107 18Harrisuvanto Pool 78 13Nature Centre 74 13Taivalköngäs Falls 60 10Camping ground 33 6Savilampi Pond 30 5Other 6 locations, or no information on location 96 16Total 586 100

125
5.5. ResultsThis chapter will form the main contents of the report. Here the key findings of the visitor survey and counting implemented in the area in the form of graphs, charts and tables should be described. Some examples of graphs and charts are given here.
Female Male53 %(n=308)
47 %(n=275)
Gender distribution of the respondents in Oulanka National Park Visitor Survey, 2005.
Domestic visitors to Oulanka National Park by their municipality of origin.

126
Proportions of the most common foreign visitors to Oulanka National Park by country of residence (n=117).
0 5 10 15 20 25 30 35
Sweden
Canada
Switzerland
Czech Republic
Poland
Belgium
Italy
France
Slovakia
Great Britain
Netherlands
Germany
%
Visitor counting data at front country site (trail to Njupeskär waterfall, Sweden).
5.6. Discussion and conclusionsAt the end of the visitor monitoring report, it is worthwhile examin-ing the results, considering, for example, the following matters:• the conclusions to be drawn from those results• possible recommendations for action• the representativeness of the material and the susceptibility of the
results to generalisation (if these issues have not been dealt with in the section on data and methods)
• possible follow-up measures.
The examination of the results is generally presented in text form.
Njupeskär waterfall old trail
0
200
400
600
800
1000
1200
June
18
June
25Ju
ly2
July
9
July
16
July
23
July
30
Augu
st6
Augu
st13
Augu
st20
Augu
st27
Septem
ber 3
Septem
ber 1
0
Septem
ber 1
7
Septem
ber 2
4
2001 2003

127
5.7. SummaryAt the very end or beginning of the visitor monitoring report there should be a concise summary giving the main contents of the report in a short and concise manner. The purpose of the summary is to indicate the main points of the report to the reader. The summary must generally be presented in text form. If the report is in a local language it is also a good idea to add a summary in English.

128

129
6. Interpreting visitor information

130
6.1. Identifying the visitors
6.1.1. Visitor and/or visitor group profilesDescribing the nature area’s visitor profile – that is, the background data on the visitors – is one of the visitor survey’s basic tasks. In-formation is especially needed respecting the visitor profile when planning the breadth of services and their targeting at visitor groups which differ from one another on the basis of their various needs. Among other things, gender, age, municipality of residence, educa-tional level, and information on the visitor’s party depict the visitor profile. Based on this information, the area’s visitors can be grouped, at which point the composition of the various visitor groups, and the size and proportion of the latter relative to the entire body of visitors, become clear. In respect of the visitor profile, it is a good idea to examine groups that are especially dependent on the serv-ices that the area offers. From the standpoint of providing services, one needs to know, for example, how large a percentage of visitors are accompanied by small children, or how many groups include motion-impaired individuals. Through such grouping, one can also analyse both who engages in various outdoor activities, and what service needs those individuals have. It is important to identify and
6. Interpreting visitor information
SUMMARY
Once the results of the visitor survey and visitor counting have been analysed and reported, they can be utilised in a variety of ways.
To begin with, the managers can consider what conclusions the visitor data might lead to in respect of visitor management objec-tives, as well as the management objectives of the nature area.
Depending on the nature of the area, the objectives can vary a great deal. At conservation areas, for example, the managers may draw conclusions and decide upon measures that are very different from those at designated hiking areas.
The conclusions to be reached on the basis of the visitor survey and counting must always be keyed to a given area, and to the objectives for that area’s management and use.

131
observe the groups that should be receiving special attention in management-and-use planning.
At first the survey material needs to be fashioned into a compre-hensive picture of the body of visitors. The mean figures and direct distributions that depict the visitor profile provide a picture of what sort of people visit the area. One notes whether the visitor profile is weighted towards the young, the middle-aged, or the elderly, and towards males or females. Are most of the visitors regular visitors, or are they visiting the area for the first time? Do the visitors come to the area for just a brief visit, or to camp out? What activities are especially emphasised? What is the overall mark for visitor satisfaction?
After this basic examination, the results can be studied in detail. What groups stay the longest? Who have most often mentioned some factor that interfered with their visits? Who have been es-pecially satisfied with the camping ground and who have been dissatisfied with the information services and signs? On the other hand, some visitors may want only a minimum of service facilities, and an excess of such fixtures will leave them dissatisfied. How are those visitors identified? In terms of socio-economic characteristics, an examination can also be made of visitor groups that occur in a proportion greater than average in the population base.
Within the body of visitors, there may be a number of visitor groups whose needs and expectations diverge greatly from one another. The conclusions reached and the actions decided upon on the basis of those groups will diverge in the same fashion. Those decisions and actions in turn depend to a significant degree on whether they involve a conservation area, or, for example, a hiking area. Actual rules of thumb are thus difficult to provide. The important visitor groups may, for instance, include the following: • people who go in for a certain activity (such as backpacking, biking,
fishing, etc.)• first time visitors / repeat visitors• domestic / international visitors• people staying overnight• people travelling alone / in groups • males / females• retired people• schoolchildren• families • disabled individuals.
However, when grouping visitors, one should bear in mind that there is a lot of overlap between groups which often makes this kind of segmentation not so clearcut.

132
6.1.2. Types of visitorsThe basic visitor-information reporting described in this manual does not include analyses of visitor types: those analyses require the use of multiple-variable statistical methods. Here we do, however, present some ideas about how visitor data can be refined with the aid of typing, which often succeeds even by means of simple cross-tabulation. Typing breaks visitor data down into compact packets, so that the visitors’ needs become more clearly visible.
For managers, it is important to take the variety of visitors to the area into consideration and to be aware of the preferences of the various user types present. Managing for “the average hiker” who does not exist can yield to situations where none of the user groups is satisfied (Shafer 969, Canger & Koch 986, Wallsten 988). Typing divides the visitors into groups differing in terms of both personal pursuits and environmental expectations. Measuring and interpreting the satisfaction level of those using the services become easier when the visitors can be divided into small subgroups. The grouping will probably enable one to identify both those groups that are demanding and critical in respect of the services, and, on the other hand, those visitor groups that do not need the services.
Typing criteria can include ) recreation activity, 2) social group, 3) place of origin or 4) attributes related to experiences, expecta-tions and preferences. The typing is usually done first based upon socio-economic attributes and activity factors. A more sophisticated analysis can take into account experiences, expectations and prefer-ences as typing criteria. These can include e.g. the degree of purism or wildernism (Stankey 973, Wallsten 988, Vistad 995).
With the aid of key background variables and group-specific variables, profiles are constructed for the visitor groups. Finding the key factors that distinguish each area’s users from one another is central to developing the profile. Age, educational level, social group (party), level of environmental preferences or standards (satisfaction, purism) and possibility for mobility (vehicle) are most often the distinguishing factors.
6.2. Identifying visitor satisfactionFrom the standpoint of the area’s management and use, it is useful to know why visitors come specifically to the area in question, and what are the key motivations for visiting. The area’s different functions can be developed in the direction that the visitors consider important. A conscious attempt can be made to offer the visitors a chance for experiences that they consider important and expect from their visits (admiring the scenery, for example).
Some visitor types are belonging to organised groups. Scouts camping by Esrum Sø, Denmark (PHOTO: OLE
ANDERSEN)

133
On the basis of both the utilisation of the different services, and assessments presented respecting the services, it is possible to note how good or bad the visitors consider a specific service. The reali-sation of advance expectations and the various factors that detract from a visit also say a lot about visitor satisfaction. Changes that take place in visitor satisfaction can be examined through repeated visitor surveys.
Measuring visitor satisfaction is a very difficult task, since one must always be able to compare the results of the indicators with the services available. Behind the visitor satisfaction lie expectations based on the visitor’s previous experiences, contact with others, and personal physical condition or state of knowledge. Satisfaction is also influenced by the attraction or power of the experience that has prompted the visitor to come to the area. Conditions associated with the visit (time of year, weather, trail conditions, the café’s being open) also affect satisfaction. Satisfaction depends heavily on the difference between expectations and experiences.
The results of satisfaction measurements are difficult to interpret if there is no other reference point to which to compare them. Satisfac-tion must be examined in relation to what people expect to experience or are accustomed to getting. If the visitors have no prior experience with the hiking areas and their services, they will greet even minor services with satisfaction. If, however, the visitor is accustomed to an abundance of services, the standard rises and satisfaction is reached at a higher level of services than previously.
It is as well to remember that a group of visitors always includes a small number of individuals who find a reason to complain even when most of the visitors are satisfied. How large a portion of the visitors have to express dissatisfaction in order to warrant a serious reaction to the drawback or deficiency mentioned? Here there is no clear rule; rather, interpretation must rely on the relativity of mat-ters. A rule of thumb can be, for example: if every fifth visitor (20 %) has observed deficiencies or is for some reason dissatisfied with the quality of services, this indicates a problem that calls for attention. Depending on the situation, the threshold may be a lot lower, even. One is always justified in evaluating negative feedback seriously, but it is also sensible to proportion it to other feedback.
Among those who take part in visitor surveys, one always finds both individuals who have visited the area earlier – experienced individuals – and first-timers who are just getting acquainted with the area. If measurements of visitor satisfaction have not been taken at the area previously, it will be difficult to say what portion of the satisfaction or dissatisfaction is explained by the visitors’ prior experiences at the same area – or by various experiences and expec-

134
tations at other areas. One obtains the best idea of the satisfaction level through repeated measurements, in which case one can note changes in relation to how various actions taken at the area have been received among visitors.
For long-term monitoring of satisfaction, some sort of satisfaction indicator is a good tool for getting the total picture of the visitor sat-isfaction levels over time. Developing a satisfaction indicator/s needs some research work at the agency, regional or national level. When such an indicator has a basic structure among several or all nature areas the indicator also serves as a mean for making comparisons between different areas.
6.3. Motives for, experiences with, and benefits of, outdoor recreation
The benefits of recreation are psychological, social, and physical. Ex-amined from the society’s standpoint, the benefits are also economic, but that is more seldom true for individuals, except indirectly (for example, in the form of reduced medical expenses). Although it is difficult to measure the mental benefits, methods for doing so have been developed. The concept of benefit is close to the recreational motive. Benefits can be evaluated by measuring recreational experi-ences and motives for the visit, in relation to expectations. The visitor gains the greatest benefits from experiences that satisfy the need for outdoor exercise in accordance with expectations – or even exceed the expectations.
A set of measurements including more than 40 different sub-factors has been developed for measuring recreational motives. The measurements’ key dimensions are experiences of nature (admira-tion of scenery, observation of animals), social experiences (quality time shared with one’s family, the chance to be alone), personal learning and development objectives (learning new skills, testing one’s limits), and physical needs (exercise and fresh air) (Driver et al. 99, Moore & Driver 2005).
No pattern of motive measurements provides a direct, easily inter-preted answer. However, together with the other variables measured, the measurement of motives for a visit provides an opportunity to give more depth to the visitor profile data, and at the same time depicts those expectations with which measurements of satisfaction with the quality of services and the pleasantness of the environment should be compared. By way of example we might mention a result that discloses that the visitor on the one hand emphasises, in rela-tion to his or her motives for the visit, the chance to be alone and enjoy the peace and quiet of nature, and, on the other hand, awards
One of the main motives for visiting nature areas are sceneries. (PHOTO:
PETER FREDMAN)
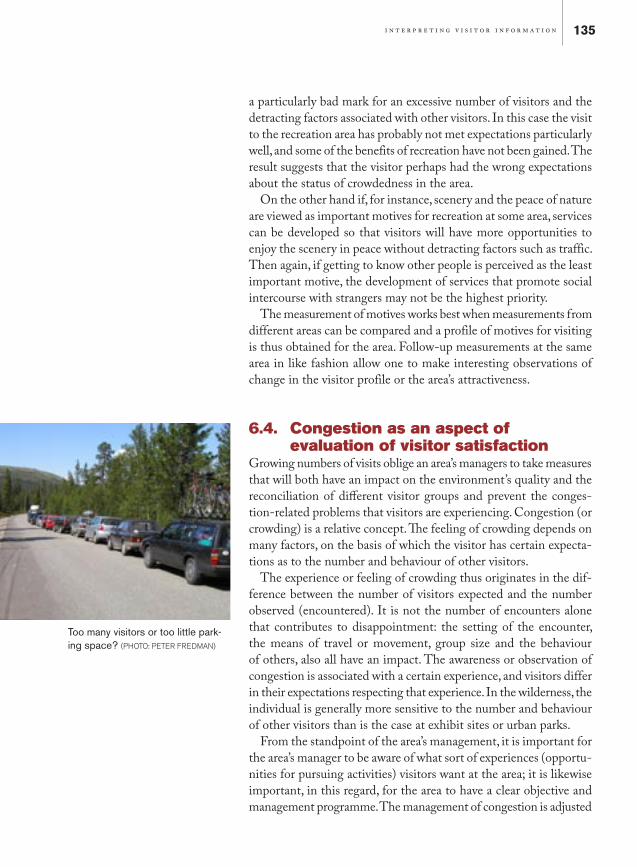
135
a particularly bad mark for an excessive number of visitors and the detracting factors associated with other visitors. In this case the visit to the recreation area has probably not met expectations particularly well, and some of the benefits of recreation have not been gained. The result suggests that the visitor perhaps had the wrong expectations about the status of crowdedness in the area.
On the other hand if, for instance, scenery and the peace of nature are viewed as important motives for recreation at some area, services can be developed so that visitors will have more opportunities to enjoy the scenery in peace without detracting factors such as traffic. Then again, if getting to know other people is perceived as the least important motive, the development of services that promote social intercourse with strangers may not be the highest priority.
The measurement of motives works best when measurements from different areas can be compared and a profile of motives for visiting is thus obtained for the area. Follow-up measurements at the same area in like fashion allow one to make interesting observations of change in the visitor profile or the area’s attractiveness.
6.4. Congestion as an aspect of evaluation of visitor satisfaction
Growing numbers of visits oblige an area’s managers to take measures that will both have an impact on the environment’s quality and the reconciliation of different visitor groups and prevent the conges-tion-related problems that visitors are experiencing. Congestion (or crowding) is a relative concept. The feeling of crowding depends on many factors, on the basis of which the visitor has certain expecta-tions as to the number and behaviour of other visitors.
The experience or feeling of crowding thus originates in the dif-ference between the number of visitors expected and the number observed (encountered). It is not the number of encounters alone that contributes to disappointment: the setting of the encounter, the means of travel or movement, group size and the behaviour of others, also all have an impact. The awareness or observation of congestion is associated with a certain experience, and visitors differ in their expectations respecting that experience. In the wilderness, the individual is generally more sensitive to the number and behaviour of other visitors than is the case at exhibit sites or urban parks.
From the standpoint of the area’s management, it is important for the area’s manager to be aware of what sort of experiences (opportu-nities for pursuing activities) visitors want at the area; it is likewise important, in this regard, for the area to have a clear objective and management programme. The management of congestion is adjusted
Too many visitors or too little park-ing space? (PHOTO: PETER FREDMAN)

136
to these consciously set objectives. Knowledge of detracting factors (congestion or other detracting factors associated with visitor groups) is necessary in order to guide recreational use. For more discussion on congestion/crowding and visitor satisfaction see e.g. Shelby & Heberlein 986 and Manning 999.
6.5. Conflicts between and within visitor groups
Conflicts caused by factors other than the numbers of users can occur between recreational visitors or between visitors and other users or uses of the area. Perhaps the most common and basic definition of recreation conflict is goal interference attributed to another’s behav-iour ( Jacob & Schreyer 980). The presence or behaviour of other recreationists may lead to a discrepancy between these desired or expected goals and those that are actually achieved; this discrepancy may reduce experience quality and thereby lead to dissatisfaction. Many times conflicts between recreationists are interactivity conflicts, e.g. conflicts between motorised vs. non-motorised recreation. How-ever, intra-activity conflicts exist as well, e.g. due to the misbehaviour of other users or mismatching interests.
Visitor studies can help in learning about conflicts between user groups. From the area management point of view, it can be very useful to learn more about the different types of conflict and the extent of those conflicts. In addition, visitor surveys can help in understand-ing the reasons for conflict, which can be important when designing potential management actions.
6.6. Economic values and impact assessments
If the visitor information includes measurements of trip/visit expenditure, that information offers opportunities for estimating local or regional economic impacts. There are methodologies and calculation tools available for producing economic impact informa-tion based on the number of visitors, average spending per visitor, and economic multipliers (Stynes et al. 2000) The first two variables are gained from visitor monitoring at the site or area, and the third variable, the economic multipliers, can be gained from general eco-nomic statistical sources concerning the county/state/region. The Money Generation Model (MGM2) (Stynes et al. 2000) developed by Americans, provides four different kinds of impact: ) sales of firms within the region to park visitors, 2) jobs supported or gener-ated by the visitor spending, 3) personal income in terms of wages
Some conflicts can be foreseen here – especially if other visitors not are informed about the event. Mountain bike race in Gribskov, Denmark. (PHOTO: OLE ANDERSEN)

137
and salaries, and 4) value added, which is a commonly used measure of the contribution of an industry or a region to the gross national product (GNP). This kind of analysis needs some help from special-ists for developing region specific multipliers and the procedure of calculations for obtaining estimations of economic impacts related to the park or recreation area in question.
The value of an outdoor recreation experience is, however, more than simply the out of pocket expenditures paid to participate. This is only the lower boundary of the value which often has little to do with the total value individuals place on goods or services. While visitor expenditure is the primary economic force behind regional tourism impacts and represents an influx of new money to the economy, the consumer surplus measures the benefits to the primary users of the recreation site. Such measurements will be useful when, for example, the benefits of providing recreational services in a given area are to be balanced against associated costs or other land use (Loomis & Walsh 997).
6.7. Spatial and temporal distribution of visitor flows/visitation
Systematic and continuous visitor counting provides information which can be used to describe the spatial and temporal distribution of visitor flows in the area. The spatial and temporal information based on fairly exact estimates of numbers will help to solve many planning issues. Information on the numbers of visits distributed over different locations within the area will help in the recognition of areas of heavy use and low use, and the relative importance of different access points, parking places and other service points. Information on the temporal variation of visits assists in the elucidation of busy hours, days, weeks, and seasons, and in particular reveals the relative demand of services between busy and quiet periods.
Counting the number of visits over the years naturally provides information about any changes in recreational use. The interpretation of the number of visits over time must be made with care, and the process calls for strict analysis of the comparability of the informa-tion. Measurements of visits must be made in a consistent manner over the time period to be compared. If this requirement cannot be applied to all visitation data, some of the gathered data may offer a chance for reliable comparisons, from which a wider comparison can be achieved by modelling or other means of information transfer.

138

139
7. How to use visitor information?

140
SUMMARY1
Visitor information is needed and useful at various levels from local to international, from planning to management in, for example:• management planning and targeting resources to management
and useo land use management planningo visitor management, e.g. to manage conflicts both between
visitors, and between visitors and other users or uses of the area (including nature protection)
o providing satisfactory experiences for visitorso allocation of resources, money, time and spaceo follow up and increasing the efficiency of management o development of infrastructureo comparisons between areas or locationso balancing between supply and demand, increasing economic
efficiency • marketing and communications• evaluating the impacts of actions and monitoring changes
o optimising ecological, social and economic impacts o monitoring changes related to natural resource protectiono monitoring impacts and estimating sustainability of nature
tourism• estimating local and regional economic and social impacts
o estimating impacts on regional economy• maintenance operations
o planning of operations in nature areas o planning of operations at Visitor Centres and Customer
Service Points• visitor services and protection
o e.g. environmental interpretation material o estimating recreation demando infrastructureo safety
• promotion of tourism development potentialo developing nature tourism entrepreneurshipso improving marketing
• monitoring, reporting and statisticso indicators o e.g. annual national and international reportso fulfilling legislative mandateso prognoses of future development
• research cooperation• teaching and training• information for establishing new areas, including urban forests.
7. How to use visitor information?
A number of the items listed above are further elaborated in the following chapters (mostly modified from the translated text of Erkkonen & Sievänen 200).

141
7.1. Planning of management and useIn the drafting of management-and-use plans, visitor monitoring is one of a number of basic studies made during the initial phase of the process. The visitor survey and assessment of the numbers of visits produce basic data of the utmost importance – information with which the managers can get a grasp of the current situation, analyse problems, look for solutions, and, finally, establish objectives. However, the visitor survey by no means yields readymade solutions to the eventual problems: at best, it supports planning and decision-making by referring to suitable solutions.
The visitor data help in perceiving and analysing problems, and in understanding the connections between whole entities and individual elements. The advantage of systematic data lies in their being com-prehensive and susceptible to generalisation. They thus afford a more justified picture of issues and phenomena than random observation and day-to-day experiences do.
A visitor survey is by nature a basic study that produces data for the solution of practical planning and management problems. Depending on the nature of the area, the decisions can vary a great deal: on the basis of a visitor survey, managers of national parks may decide upon measures very different from those taken at a municipal recreation area. At its best, a visitor survey supports decision-making in the planning of management and use, but does not actually direct that planning. Depending on the area, a visitor survey yields a large vol-ume of such easily interpreted and adaptable information as will help directly in the placement, dimensioning, timing, and maintenance of services. This is all very important when aiming at a balance between supply and demand, providing what people desire.
EXAMPLE
The case of wild reindeer in a Norwegian mountain area (Evensen 998)The Norwegian mountain area Rondane is one of the most im-portant areas for the wild reindeer. In Europe, the wild reindeer only lives in Norway and thus the Norwegian authorities have a special responsibility for protecting this species. The most important measures to protect the wild reindeer are to keep the living areas either entirely free from technical constructions and encroachments, or at most to permit only a minimum of these, as well as to ensure that disturbances by hikers and others visiting the areas are within acceptable limits. The Rondane area is the oldest national park in Norway and is traditionally one of the
In visitor surveys there can be ques-tions asking visitors’ opinions about area’s services, such as car parks. At the same time it is important for the manager of the area to consider the number of visitors when de-veloping the area and the specific destination. RMK North-Estonian recreational area, Estonia. (PHOTO:
JAAK NELJANDIK)

142
most important areas in Norway for mountain hiking, during both the summer and winter seasons. The Norwegian Trekking Association (DNT) has several lodges and self service cabins and marked trails in the area. There are several tourist resorts, hotels, and hundreds of private cabins in the surroundings.
In 994–96, DNT launched a project aimed at ensuring that their activities should not exceed acceptable limits of impact in the areas in which they operate. In this project both social and ecological data were collected as a basis for assessing the impacts of the association’s activities. Some of the association’s activities have been adjusted according to the conclusions from the project.
In Rondane, the impacts on wild reindeer were considered to be the most important negative effects to be assessed. The traffic along some of the association’s trails (summer and winter trails) and the disturbances caused by this to the wild reindeer were considered to reduce the area used by the wild reindeer. As a result of the project, DNT has removed the signposts along some trails and new trails with signposts are being established in order to lead the traffic away from the critical areas, hence to reduce disturbances to the wild reindeer. DNT also closes the cabins and lodges in the area in springtime (from the st of May) when the reindeer are calving.
DNT is also making efforts to inform, in a variety of ways, their members and other hikers about the wild reindeer, the species’ need for living areas, and how not to disturb these animals and to avoid other negative impacts on them.
Wild reindeer, Norway. (PHOTO: KRISTIN S. KARLSEN)

143
Reliable estimates of the number of visitors and/or visits are extremely important for planning and managing the use of the areas in question. On the basis of such estimates, it is possible to gain a clearer picture of the use of the area and the sites where visitor traffic is heaviest. Informa-tion on visitor numbers helps the people responsible for managing the areas to control the flow of visitors, for example, by directing them to routes that cause less deterioration to vegetation and the landscape and decrease the sense of crowding. In addition, visitor counts also help to maintain and develop services so that they better correspond to the real number of visitors to the area (e.g. firewood supply and waste disposal). Furthermore, reliable visitor statistics are needed, together with other information gathered from visitor surveys, for evaluating the effective-ness of the area’s own activities and for monitoring changes.
7.2. Integrating visitor survey results into a participatory planning process
Visitor surveys constitute one means of carrying out participatory planning. Through the survey, visitors can bring up their wishes and viewpoints on the planning process and thus have an impact on the development of the area. The visitor survey does not replace other methods of participatory planning, but it is one possible way of ac-complishing participation in addition to the other available methods. A visitor survey generally reaches a significantly broader and more representative group of the area’s users than can be reached, for instance, through public programmes or representation in different organisations.
7.3. Targeting resources for the area’s maintenance and management
On the basis of visitor satisfaction data, one can target resources at the improvement of a service with which visitors are dissatisfied. Here one must first consider what are the satisfaction or dissatisfaction thresholds upon reaching which measures should be initiated.
Information on outdoor activities can be applied when a need exists to guide the visitors in those pursuits, one way or the other, in the area. The need may arise from congestion, conflicts between groups who pursue different activities, or unacceptable impacts on the natural environment. By guiding usage, it is possible to attract visitors to such activities as suit the area best from the standpoint of ecological and social carrying capacity. Sometimes it may be necessary to direct resources to support the prerequisites for a certain activity, or to shift those resources from one activity to another.
By directing visitor flows system-atically, managers can attempt to avoid congestion and the dete-rioration of the terrain. Fulufjället National Park, Sweden. (PHOTO:
PETER FREDMAN)

144
Information on when and how people arrive at an area can, for example, be utilised in planning work shifts for personnel at nature and information centres, and in recruiting seasonal labour. From the perspective of traffic arrangements, it is good to know when and by what type of vehicle visitors come to the area. The arrival information can be utilised in planning parking places and directing traffic, for instance.
Identifying the geographical distribution of visits is useful in plan-ning services, trails, rest spots, and wood and waste management, among other things. By directing visitor flows systematically, man-agers can also attempt to avoid congestion and the deterioration of the terrain. In addition, the number and geographical distribution of visitors can be used to justify new investments to a project’s financial backers, for example, and to direct labour and other resources more effectively at different targets.
Information respecting the use of money by visitors can be utilised, for example, in planning services subject to charges (various accom-modation and restaurant services), and in developing new services (new activities and programme services).
7.4. Marketing and communicationsFrom the standpoint of marketing the area’s services and the recrea-tional possibilities the area offers, it is useful to have knowledge of the visitors’ background information, and of where the visitors live. On the basis of the visitors’ home communities, one can obtain an idea of whether the area is important in local, regional, national or international terms.
Possible marketing efforts can be targeted more effectively when the visitors (or customers) are familiar in terms of their backgrounds and opinions. If managers wish to profile the area somehow, the visitor survey information will provide marketing tools. Through knowledge gained from visitor surveys, managers can do better at providing information about the services for the visitors.
7.5. Evaluating the impact of actions and monitoring changes
The usefulness of hiking and recreation services, like that of any other publicly funded activity, must usually be justified. In the manage-ment of an individual area, too, one can evaluate the benefits that follow from the activity and accrue to the society. The systematic and routine performance of visitor surveys at regular intervals makes it possible to monitor changes related to the area’s recreational use.

145
The uniform counting of visitors is also fundamentally related to the monitoring of changes.
The changes can affect both the structure of the area’s body of visitors and their opinions (in terms of visitor satisfaction) of the area’s pleasantness, or of the quality of services. Monitoring the changes helps to evaluate the impacts that changes made in the service structure, or the addition or termination of services, have had on visitor satisfaction. Monitoring also helps in assessing whether changes in management policy have led to clear changes in the structure of the body of visitors. For example, have formerly regular visitors disappeared and been replaced by new visitors? Or do the same people always visit the area, without there being any success in attracting new visitors?
7.6. Estimating local and regional economic and social impacts
When similar measures, questions and indicators are applied to the monitoring of usage, comparison between areas becomes possible even if the areas are very different in nature. In addition to qualitative visitor information, comparable quantitative data on the number of visits to the areas (visitor counts) should be obtained. Land manag-ers, regardless of the ownership of the land, need comparable data in order to monitor the areas’ usage and costs.
Public financing sources also need comparable data and monitor-ing data in order to direct resources to meet the populace’s needs for outdoor recreation. For example, on the basis of the amount of use and data on the usage of money by visitors, one can perform calcula-tions and reach decisions on the local or regional economic impacts of a national park or recreation area. Economic impact studies also provide information on employment generated by nature tourism, and the information implies also the economic and social security of the community. Moreover, monitoring data is also useful for comparisons of management costs of outdoor recreation services versus the costs of other leisure services, e.g. indoor sport facilities on a larger scale.
7.7. Planning of operations at nature centres or service points
Visitor monitoring data concerning nature areas can also be utilised as such at nature centres or service points either in the area or in its vicinity. The results can yield important basic information for determining opening hours, various exhibit themes, and the need for
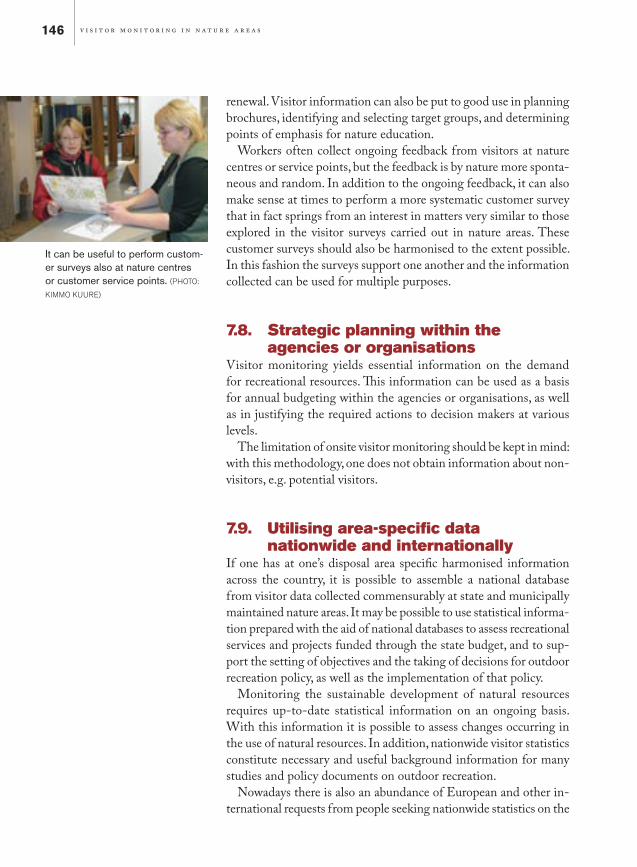
146
renewal. Visitor information can also be put to good use in planning brochures, identifying and selecting target groups, and determining points of emphasis for nature education.
Workers often collect ongoing feedback from visitors at nature centres or service points, but the feedback is by nature more sponta-neous and random. In addition to the ongoing feedback, it can also make sense at times to perform a more systematic customer survey that in fact springs from an interest in matters very similar to those explored in the visitor surveys carried out in nature areas. These customer surveys should also be harmonised to the extent possible. In this fashion the surveys support one another and the information collected can be used for multiple purposes.
7.8. Strategic planning within the agencies or organisations
Visitor monitoring yields essential information on the demand for recreational resources. This information can be used as a basis for annual budgeting within the agencies or organisations, as well as in justifying the required actions to decision makers at various levels.
The limitation of onsite visitor monitoring should be kept in mind: with this methodology, one does not obtain information about non-visitors, e.g. potential visitors.
7.9. Utilising area-specific data nationwide and internationally
If one has at one’s disposal area specific harmonised information across the country, it is possible to assemble a national database from visitor data collected commensurably at state and municipally maintained nature areas. It may be possible to use statistical informa-tion prepared with the aid of national databases to assess recreational services and projects funded through the state budget, and to sup-port the setting of objectives and the taking of decisions for outdoor recreation policy, as well as the implementation of that policy.
Monitoring the sustainable development of natural resources requires up-to-date statistical information on an ongoing basis. With this information it is possible to assess changes occurring in the use of natural resources. In addition, nationwide visitor statistics constitute necessary and useful background information for many studies and policy documents on outdoor recreation.
Nowadays there is also an abundance of European and other in-ternational requests from people seeking nationwide statistics on the
It can be useful to perform custom-er surveys also at nature centres or customer service points. (PHOTO:
KIMMO KUURE)
147
recreational use of nature, e.g. the World Commission on Protected Areas, Ministerial Conference on Protected Forest Environment (MCPFE), and EUROSTAT Environmental Statistics. MCPFE indicators of sustainable use of forest resources include criterion 6.0: Accessibility for recreation: Area of forest and other wooded land where public has right of access for recreational purposes and indication of intensity of use. To fulfil the information needs of this criterion, systematic and continuous monitoring of visitor flows in nature areas need to be conducted and the estimates of intensity of use provided, for example.
7.10. Examples of how visitor information
has been usedHere are some brief examples on how visitor information has been used in Nordic and Baltic countries. More examples can be found e.g. in Kajala 2006, appendices.
7.10.1. DenmarkIn the forest area Gl. Kjøgegaard, collected visitor information gave cause for closing down, as well as establishing, a number of paths. And, at a more general level, the results from monitoring the rec-reational visits in state forest areas have formed parts of the basis for budget allocation to the local districts from the central office of the Danish Forest and Nature Agency.
7.10.2. EstoniaIn the Kiidjärve-Taevaskoja recreation area several implementations have been or are planned based on visitor surveys implemented in the area: ) In consideration of people with special needs a path is being planned to the most visited site, 2) To raise the level of commercial services in the recreation area, co-operation with businessmen will be improved, 3) To improve the condition of toilets and the general cleanliness, and 4) to manage and to decrease the littering of the environment, monitoring of the condition of the recreation area sites and a ranger project were implemented.
7.10.3. FinlandOne of the first visitor surveys in Finland was made in Koli National Park in 993 (Sievänen 993). It was made to serve the needs of the planning process to develop services in the park. One question con-sidered traffic arrangements. More than half of visitors who accepted the closing of car access to the top of the hill preferred to have a lift instead. A lift was built some years later.
148
In another case, in the Käsivarsi Wilderness area in northwestern Lapland, visitor survey data was used as one central data source in the participatory management planning process. The results of the survey were presented to the interest groups in the form of graphs and maps at local task force and public meetings, after which the information and its indications for the management planning process were discussed at the meetings. Knowledge on conflicts between visitor types as well as visitor flows was used when establishing use zones for the area.
7.10.4. LithuaniaThe first survey of holidaymakers in the Curonian Spit National Park was conducted by the Lithuanian Agriculture Academy in 99–993. The data were used especially for preparing the first management plan for the National Park. The researchers analysed the character of holidaymakers’ activity. Since 996 the Administration of the National Park has been collecting information about the numbers of persons and transport entering the Park and the number of visi-tors to the National Park Visitor centres. The data serve for park management and help to coordinate activities.
7.10.5. NorwayIn a research project on Nature Tourism and Nature Management in the early 990s, several sub-projects included visitor surveys. For example, in Stabbursdalen National Park (in Finnmark) a visitor study combined with field studies were central elements in evaluat-ing the implementation of the management plan for the park. And in the popular valley – Sjodalen – in southern Norway, a visitor study was important in evaluating the regulation of free camping (or wild camping) along the road (caravans and camper vans). Both sub-projects are reported in Vistad & Vorkinn (995).
7.10.6. SwedenIn the Southern Jämtland Mountain area, visitor data on recreation conflict (i.e. disturbance of skiing by snowmobiling) has been used by the county administration board in their work on trail separation in the area. Information on trail preferences has also been com-municated to, and utilised by, local and national snowmobile and skiing organisations. The study is reported in Lindberg et al. (200). In the Fulufjället National Park establishment process, visitor data was helpful for the work with the management plan, including the information structure (Fredman et al. 2005).

149
8. References

150
This list of references has been arranged by countries. References coming from other than Nordic or Baltic countries, together with references that cover several countries are found under the subhead-ing “Other countries or publications related to several countries”. For more examples on visitor studies, see the reference list of the final report of the project Visitor Monitoring Methods in the Nordic and Baltic Countries (Kajala 2006).
8.1. DenmarkCanger, S. & Koch, N. Elers 986. Skovopbygning til glæde for
friluftslivet – et arbejdsnotat. Marginaljorder og miljøinteresser, Miljøministeriets projektundersøgelser 986, teknikerrapport nr. 8, Skov- og Naturstyrelsen, København. 239 p.
Jensen, F. Søndergaard 992. Vestamagers besøgstal, 985–988. Forskningscentret for Skov & Landskab, Lyngby. 57 p.
Jensen, F. Søndergaard 999. Forest Recreation in Denmark from the 970s to the 990s. Forskningsserien nr. 26–999. Forskningscentret for Skov & Landskab, Hørsholm. 56 p.
Jensen, F. Søndergaard 200. Trængsel eller trivsel på Gudenåen. In: Hels, Tove, Nilsson, K., Frandsen, J.N., Fritzbøger, B. & Olesen, C.R. (ed.), 200: Grænser i landskabet. Odense Universitetsforlag. pp. 75–92.
Jensen, F. Søndergaard 2003. Friluftsliv i 592 skove og andre naturområder. Skovbrugsserien nr. 32–2003. Forskningscentret for Skov & Landskab, Hørsholm. 335 p. (http://www.sl.kvl.dk/Publikationer/Udgivelser/RaadgivningsPublikationer/SKB32.aspx?katid=43FD7CA7-82F0-4B2F-90EF-8E22835AECC)
Jensen, F. Søndergaard & Guldager, S. 2005. Den rekreative brug af tre parker i Københavns Kommune – Enghaveparken, Fælledparken og Amager Fælled, 2003–2004. Københavns Kommune, Vej & Park, København. 93 p. http://www.vejpark.kk.dk/publikationer/pdf/408_KBH_rapport_netversion.pdf
Jensen, F. Søndergaard & Koch, N. Elers 997. Friluftsliv i skovene 976/77–993/94. Forskningsserien nr. 20. Forskningscentret for Skov & Landskab, København. 25 p.
Koch, N. Elers 978. Skovenes friluftsfunktion i Danmark. I. del. Befolkningens anvendelse af landets skove. (Forest Recreation
8. References
151
in Denmark. Part I: The Use of the Country’s Forests by the Population). Forstl. Forsøgsv. Danm., København, 35 (978): 285–45.
Koch, N. Elers 980. Skovenes friluftsfunktion i Danmark. II. del. Anvendelsen af skovene, regionalt betragtet. (Forest Recreation in Denmark. Part II: The Use of the Forests Considered Regionally). Forstl. Forsøgsv. Danm., København, 37(980): 73–383.
Koch, N. Elers 984. Skovenes friluftsfunktion i Danmark. III. del. Anvendelsen af skovene, lokalt betragtet. (Forest Recreation in Denmark. Part III: The Use of the Forests Considered Locally). Forstl. Forsøgsv. Danm., København, 39(984): 2–362.
Skov-Petersen, H. 2006. Genesis of Trails in Nature: Monitoring of Visitors’ Effect on Nature. In: Siegriest,D., Clivaz, C., Hunziker, M. & Iten, S. (eds.) Exploring the Nature of Management. Proceedings of the Third International Conference on Monitoring and Management of Visitor Flows in Recreational and Protected Areas. September 3–7, 2006, Rapperswil, Switzerland. p. 5–6 http://www.wsl.ch/mmv-3/publications/proceedings.ehtml.
Skov-Petersen, H., Meilby, H. & Jensen, F. Søndergaard 2007. Applying data from automatic counters to agent-based models. In: Gimblett, R. & Skov-Petersen, H. (eds.) Monitoring, Simulation and Management of Visitor Landscapes. (In press).
8.2. EstoniaAlmik, A. 2005. RMK Kiidjärve – Taevaskoja puhkeala külastajauuring
2003. Riigimetsa Majandamise Keskus. 22 p. + app.Rammo, M., Karoles, K., Maran, K., Jansen, J. Almik, A. &
Rammo, R. 2004. Visitor surveys and visitor impact monitoring in recreational areas in state forests of Estonia. In: Sievänen, T., Erkkonen, J., Jokimäki, J., Saarinen, J., Tuulentie, S. & Virtanen, E. (eds.). Policies, methods and tools for visitor management – proceedings of the second International Conference on Monitoring and Management of Visitor Flows in Recreational and Protected Areas, June 6–20, 2004, Rovaniemi, Finland.
Rammo, M., Maran, K., Almik, A. & Karoles, K. 2006. Visitor and environmental impact monitoring as basis for sustainable nature tourism in Estonian recreational areas. In: Siegriest,D., Clivaz, C., Hunziker, M. & Iten, S. (eds.) Exploring the Nature of Management. Proceedings of the Third International Conference on Monitoring and Management of Visitor Flows in Recreational and Protected Areas. September 3–7, 2006, Rapperswil, Switzerland. p. 62–63 http://www.wsl.ch/mmv-3/publications/proceedings.ehtml.

152
8.3. FinlandErkkonen, J. & Sievänen, T. 200. Kävijätutkimusopas. [Translated
for this project as “The Visitor Survey Manual”] Metsähallituksen luonnonsuojelujulkaisuja. Sarja B: 62. 63 p. + app.
Horne, P., Sievänen, T., Alenius, V., Iisalo, H. & Friman, T. 998. Kävijälaskentaopas. [Partly translated for this project as “The Visitor Counting Manual”] Metsähallituksen luonnonsuojelujul-kaisuja. Sarja B: 45. 68 p. + app.
Kajala, L. 2000. Käsivarren erämaa-alueen virkistyskävijät kesäkuusta 996 toukokuuhun 997. Metsähallituksen luonnonsuojelujulkaisu-ja. Sarja A. No. 25. 95 p.
Muikku, M. 2005. Oulangan kansallispuisto. Kävijätutkimus 2005. 43 p. http://www.metsa.fi/binary.aspx?Section=2869&Item=4598 (last accessed Jan. 5th, 2007)
Sievänen, T. 993. Kolin kansallispuiston kävijät [Summary: Visitors in Koli National Park]. Metsäntutkimuslaitoksen tiedonantoja 465. [The Finnish Forest Research Institute. Research papers 465.] 56 p.
8.4. NorwayEvensen, T. 998. DNTs virksomhet i forhold til naturens tålegrenser.
Den Norske Turistforening, Oslo. ISBN 82–90339–57–7Kaltenborn, B. & Vorkinn, M. 993. Vårt friluftsliv: Aktiviteter,
miljøkrav og forvaltningsbehov. Temahefte 3. NINA.Vistad, O. I. 995. I skogen og i skolten – Ein analyse av friluftsliv,
miljøoppleving, påverknad og forvaltning i Femundsmarka, med jamføringar til Rogen og Långfjället. (In the forest and in the head. An analysis of outdoor recreation, recreational experiences, recreational impacts and management in Femundsmarka, compared to Rogen and Långfjället – PhD Thesis in Human Geography – In Norwegian). – Dr.gradsavhandling i geografi, Universitetet i Trondheim.
Vistad, O.I. & Vorkinn, M. 992. Bruk og forvaltning av Stabbursdalen Nasjonalpark – Resultat frå ei før-undersøking. (Use and management of Stabbursdalen National Park) – NINA Utredning 36.
Vistad, O. I. & Vorkinn, M. 995. Naturturisme og naturforvaltning – Resultater fra et forskningsprosjekt. (Nature Tourism and Nature Management – Results from a research project, In Norwegian). NINA-NIKU/Østlandsforskning, Lillehammer

153
8.5. SwedenFredman, P., Hörnsten-Friberg, L. & Emmelin, L. 2005. Friluftsliv
och turism i Fulufjället. Före – efter nationalparksbildningen. Naturvårdsverket, rapport 5467. Dokumentation av de svenska nationalparkerna, nr 8.
Fredman, P., Hörnsten-Friberg, L. & Emmelin, L. 2006. Visitor Surveys at Fulufjället – Before and After National Park Establishment. European Tourism Research Institute, WP 2006:.
Fredman, P., Hörnsten-Friberg, L. & Emmelin, L. 2007. Increased Visitation from National Park Designation. Current Issues in Tourism, 0():87–95.
Hultman, S-G. & Wallsten, P 988. Besöksmönstret i Rogen-Långfjället sommaren 985. Kommit-rapport 988:3, Universitetet i Trondheim. 54 p.
Kardell, L. 2003. Rörligt friluftsliv på Bogesundslandet 969–200. Institutionen för skoglig landskapsvård, Sveriges lantbruksuniversitet, rapport 92 (Department of Environemntal Forestry, Swedish University of Agricultural Sciences, report 92)
Lindberg, K., Denstadli, J.M., Fredman, P., Heldt, T. & Vuorio, T. 200. Skiers and Snowmobilers in Södra Jämtlandsfjällen: Are there Recreation Conflicts? European Tourism Research Institute, working paper 200:2.
Lindhagen, A. 996. Forest Recreation by the Inhabitants of Umeå with Application to a Forest Totally Surrounded by the Town. In: Lindhagen, A. 996. Forest Recreation in Sweden. Four Case Studies Using Qualitative and Quantitative Methods. Swedish University of Agricultural Sciences, Department of Environmental Forestry, Uppsala, report 64.
Lindhagen, A. & Ahlström, I. 2005a. Besökarstudier i naturområden – en handbok. Skogsstyrelsen, rapport 4.
Lindhagen, A. & Ahlström, I. 2005b. Visitor studies in nature areas – a manual. Skogsstyrelsen, rapport 4.
Naturvårdsverket 2005a. Räkna friluftslivet – en vägledning i användningen av elektronisk radioräknare Radio Beam. Naturvårdsverket.
Naturvårdsverket 2005b. Counting Visits to Natural Areas. User handbook for the Radio Beam Counter. Swedish Environmental Protection Agency.
Naturvårdsverket 2007. Räkna friluftslivet 2. En vägledning i användandet av IR-räknare och trampräknare. Naturvårdsverket.
Wallsten, P. 988 Rekreation i Rogen. Tillämpning av en planeringsmetod för f riluftsliv. Kommit-rapport 988:2, Kommiteen for miljövern, Universitetet i Trondheim.

154
8.6. Other countries or publications related to several countries
Arnberger, A. & Brandenburg, C. 2002. Visitor Structure of a Heavily Used Conservation Area: The Danube Floodplains National Park, Lower Austria. In: Arnberger, A., Brandenburg, C. & Muhar, A. (eds.). Monitoring and Management of Visitor Flows in Recreational and Protected Areas. Conference Proceedings. p.7–3.
Arnberger, A. & Eder, R. 2006. Assessing User Conflicts in an Urban Forest by Long-Term Video Monitoring. In: Siegriest,D., Clivaz, C., Hunziker, M. & Iten, S. (eds. ) Exploring the Nature of Management. Proceedings of the Third International Conference on Monitoring and Management of Visitor Flows in Recreational and Protected Areas. September 3–7, 2006, Rapperswil, Switzerland. p. 352–353. http://www.wsl.ch/mmv-3/publications/proceedings.ehtml.
Cole, D. 2006. Personal Communication. David N. Cole Aldo Leopold Wilderness Research Institute, USA. [email protected]
Cole, D.N. & Bayfield, N.G. 993. Recreational Trampling of Vegetation: Standard experimental Procedures. In: Biological Conservation (63), p 209–25.
Dales, M., Foley, M. & Macgregor, C. 993. Manual. Scottish Natural Heritage, Research and Advisory Services, Recreation and Access Branch, Edinburgh. 25 p.
Dillman, D.A. 999. Mail and Internet Surveys: The Tailored Design Method, 2nd Ed. John Wiley Company, New York.
Driver, B.L., Tinsley, H.E.A. & Manfredo, M.J. 99. The Paragraphs about Leisure and Recreation Experience Prefrence Scales: Results from Two Inventories Designed to Assess the Breadth of the Perceived Psychological Benefits of Leisure. In: Benefits of Leisure. Driver, B.L., Brown, P.J. & Peterson, G.L. (ed.). Venture Publishing Inc., State College, Pennsylvania, pp. 263–286.
English Nature 2006. Visitor surveys. A guide to undertaking visitor surveys on National Nature Reserves. External Relations Team. English Nature. 3 p.
Erkkonen, J. & Storrank, B. 2005. Nordic and Baltic Workshop on Visitor Information Needs and Monitoring Methods (NBW) Final Report. ANP 2005:728. 69 p. www.norden.org/publications
Hornback, Kenneth E. & Eagles, Paul F. J. 999. Guidelines for public use measurement and reporting at parks and protected areas. IUCN, Gland, Switzerland and Cambridge, UK. iv + 90 pp. www.iucn.org ISBN: 2–837–0476–6
Jacob, G.R. & Schreyer, R. 980. Conflict in outdoor recreation: A theoretical perspective. Journal of Leisure Research 2(4): 363–380.

155
Kajala, L. (ed.) 2006. Monitoring Outdoor Recreation in the Nordic and Baltic Countries. TemaNord 2006:530. 2 p. www.norden.org/publications
Loomis, J.B. & Walsh, R.G. 997. Recreation Economic Decisions. Venture Publishing, Pennsylvania.
Manning, Robert E. 999. Studies in outdoor recreation: Search and research for satisfaction. Corvallis, OR. Oregon State University Press, 2nd edit. 374 p.
Moore, R.L. & Driver, B.L. 2005. Introduction to outdoor recreation. Providing and managing natural resource based opportunities. Venture Publishing Inc. State College Pennsylvania, xvi+339 s.
Muhar, A., Arnberger, A. & Brandenburg, C. 2002. Methods for Visitor Monitoring in Recreational and Protected Areas: An Overview. In: Arnberger, A., Brandenburg, C. & Muhar, A. Monitoring and Management of Visitor Flows in Recreational and Protected Areas. Conference Proceedings, p. –6.
National Visitor Use Monitoring Hand Book July 2006. National Visitor Use Monitoring Program. USDA Forest Service, Washington D.C. Available: http://www.fs.fed.us/recreation/programs/nvum/
Nordisk Ministerråd, 997. Allemansrätten i Norden. TemaNord 997:50. 42 p. + 9 p. appendix.
Ploner, A. & Brandenburg, C. 2004. Modelling visitor attendance levels subject to day of the week and weather: a comparison between linear regression models and regression trees: Journal for Nature Conservation, Volume , Number 4, January 2004, pp. 297–308(2)
Potter, D.R., Sharpe, K.M., Hendee, J.C., and Clark, R.N. 972. Questionnaires for Research: An Annotated Bibliography on Design, Construction, and Use. U.S. For. Serv. Res. Pap. Pacif. Nthwest For. Range Exp. Sta., no. PNW–50.
Shafer, E.L., Jr. 969. The Average Camper Who Doesn’t Exist. USDA Forest Service Northeast Forest Experimental Station, Upper Darby, Pennsylvania, Research Paper NE–42, 27 p.
Shelby, Bo & Heberlein, Thomas A. 986. Carrying capacity in recreation settings. Corvallis, OR. Oregon State University Press, 64 pp.
Stankey, G. H. 973. Visitor Perception of Wilderness Recreation Carrying Capacity. USDA Forest Service. Intermountain Forest & Range Experiment Station. Ogden, Utah. Research Paper INT–42.
Stynes, D.J., Propst, D.P., Chang, W-H. & Sun, Y.Y. 2000. Estimating National Park Visitor Spending and Economic Impacts; The MGM2 Model. Michigan State University. Available: http://www.prr.msu.edu/MGM2/MGM2.pdf. [Referred Oct. 9, 2006].

156
Thamm, H-P. & Krämer, A. 2006. Application of a remote controlled ultra light air vehicle (UAV) for park management and visitor monitoring. In: Siegriest,D., Clivaz, C., Hunziker, M. & Iten, S. (eds.) Exploring the Nature of Management. Proceedings of the Third International Conference on Monitoring and Management of Visitor Flows in Recreational and Protected Areas. September 3–7, 2006, Rapperswil, Switzerland. p. 496–497. http://www.wsl.ch/mmv-3/publications/proceedings.ehtml.
Watson, Alan E., Cole, David N., Turner, David L. & Reynolds, Penny S. 2000. Wilderness Recreation Use Estimation: A Handbook of Methods and Systems. USDA Forest Service Rocky Mountain Research Station. General Technical Report RMRS–GTR–56. 98 p. http://www.fs.fed.us/rm/pubs/rmrs_gtr56.html
Yuan, S., Maiorano, B., Yuan, M., Kocis, Susan M. & Hoshide, G.T. 995. Techniques and Equipment for Gathering Visitor Use Data on Recreation Sites. USDA Forest Service. Technology & Development Program. 9523–2838–MTDC.

157
Appendices

1. Examples of counter manufacturers and their contact information
158
Exam
ple
s o
f co
un
ter
man
ufa
ctu
rers
an
d t
heir
co
nta
ct in
form
ati
on
SE
NS
OR
TY
PE
CO
UN
TER
MA
NU
FAC
TUR
ER
CO
NTA
CT
INF
OR
MA
TIO
NO
ther
rem
arks
Opt
ic s
enso
rTe
knov
isio
t Oy
ww
w.v
isit.
fiU
sed
by M
etsä
halli
tus,
Fin
land
Use
d by
RM
K, E
ston
iaG
oods
on &
Ass
ocia
tes
Inc.
ww
w.tr
ailm
aste
r.com
MD
Mic
ro D
etec
tors
ww
w.d
iell.
com
Use
d by
Nat
urvå
rdsv
erke
t, S
wed
enD
iam
ond
Traf
fic P
rodu
cts
ww
w.d
iam
ondt
raffi
c.co
mIn
fo-s
can
inst
rum
ents
Sel
mer
svej
20,
DK-
826
0 Vi
by J
., D
enm
ark
Use
d by
Sko
v &
Lan
dska
b, D
enm
ark
Pyr
oele
ctric
sen
sor
Eco
Com
pteu
rw
ww
.eco
-com
pteu
r.com
Use
d by
Met
säha
llitu
s, F
inla
ndU
sed
by S
kov
& L
ands
kab,
Den
mar
kU
sed
by S
tate
ns N
atur
opps
yn (S
NO
), N
orw
ayIs
land
Res
earc
hw
ww
.isla
ndre
sear
ch.c
om.a
uU
sed
by M
etsä
halli
tus,
Fin
land
Ultr
asou
ndR
adio
tran
smitt
erA
& P
Cha
mbe
rs L
tdw
ww
.cha
mbe
rs-e
lect
roni
cs.c
omU
sed
by N
atur
vård
sver
ket,
Sw
eden
Use
d by
Sko
v &
Lan
dska
b, D
enm
ark
Sei
smic
sen
sor
Tekn
ovis
iot O
yw
ww
.vis
it.fi
Use
d by
Met
säha
llitu
s, F
inla
ndU
sed
by R
MK
, Est
onia
Eco
Com
pteu
rw
ww
.eco
-com
pteu
r.com
A &
P C
ham
bers
Ltd
ww
w.c
ham
bers
-ele
ctro
nics
.com
Use
d by
Nat
urvå
rdsv
erke
t, S
wed
enS
chm
idt E
lect
roni
csr.s
chm
idt@
zetn
et.c
o.uk
Use
d by
Nat
urvå
rdsv
erke
t, S
wed
enIn
duct
ive
sens
orTe
knov
isio
t Oy
ww
w.v
isit.
fiU
sed
by M
etsä
halli
tus,
Fin
land
Vejd
irekt
orat
et (T
80)
vd@
vd.d
kU
sed
by S
kov
& L
ands
kab,
Den
mar
kE
co C
ompt
eur
ww
w.e
co-c
ompt
eur.c
omG
olde
n R
iver
Tra
ffic
Ltd.
ww
w.g
olde
nriv
er.c
omD
iam
ond
Traf
fic P
rodu
cts
ww
w.d
iam
ondt
raffi
c.co
mN
u-m
etric
sw
ww
.nu-
met
rics.
com

2. Counter specific check form
159
Counter specific check form
Area:_____________________________________
Name of the observer Date
Location of the counter Time period —
Weather, other notes Number of the form
Time(on the hour)
Direction of travel
in out
Passers-by altogether
Counter reading
Service, personnel,
etc.
Exceptions (going back and forth,
disturbances)
NOTES!

160
Example: Counter specific check form
Area: Pyhätunturi National Park
Name of the observer Erckie The Example Date 18.6.2007Location of the counter Nature trail Time period 12 – 15Weather, other notes Sun is shining, a fair amount of hikers passing by
Number of the form 1
Time(on the hour)
Direction of travel
in out
Passers-by altogether
Counter reading
Service, personnel, etc.
Exceptions (going back and forth, disturbances)
NOTES!
12:00 20141 1 Service personnel
2223
4 1413:00 2028
23
21 1 Service personnel1
4 1 Guide2
1 16 1 Waiwing hand once14:00 204215:00 2050 One hour break!
223
3 1016:00 2059
This is an example and a model of how to fill out the form!
Own observations(in and out)
Write herecounter readingupon starting
Write herecounter readingat the secondhour
Visits that arenot supposedto be recorded
Here comes anydisturbances to thecounter, dog etc.
Mark here anexplanation forany abnormalities

3. Comprehensive roadside counting data 161
Comprehensive roadside counting data form
Area:_____________________________________
Name of the observer Date
Location of the counter Time period —
Weather, other notes Number of the form
Time Direction No. of persons Type Colour Registration number
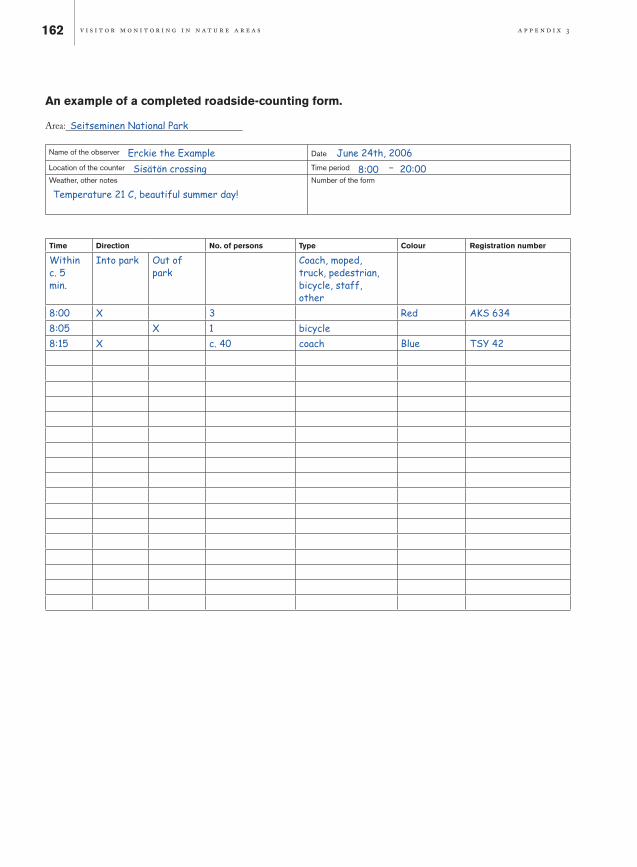
162
An example of a completed roadside-counting form.
Area: Seitseminen National Park
Name of the observer Erckie the Example Date June 24th, 2006Location of the counter Sisätön crossing Time period 8:00 — 20:00Weather, other notes Temperature 21 C, beautiful summer day!
Number of the form
Time Direction No. of persons Type Colour Registration number
Within c. 5 min.
Into park Out of park
Coach, moped, truck, pedestrian, bicycle, staff, other
8:00 X 3 Red AKS 6348:05 X 1 bicycle8:15 X c. 40 coach Blue TSY 42
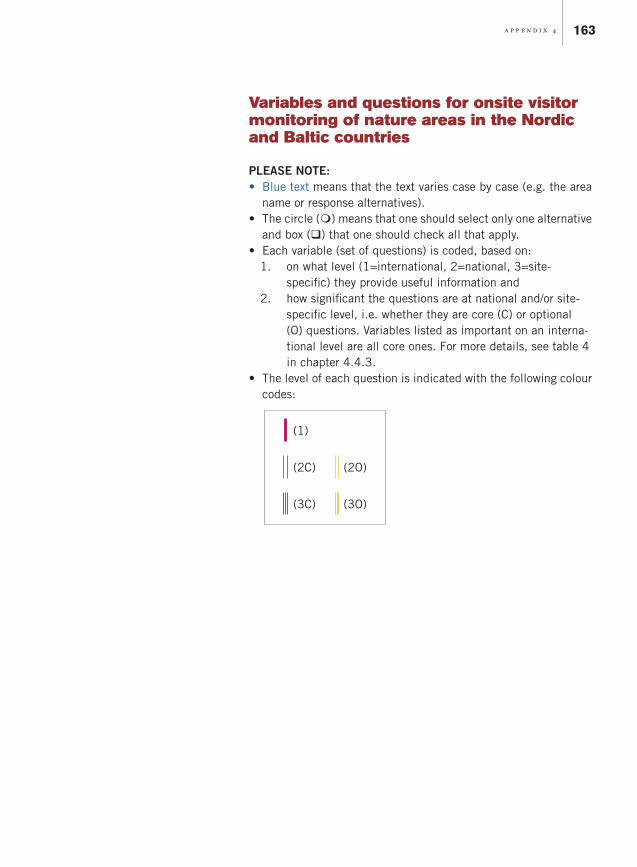
163
Variables and questions for onsite visitor monitoring of nature areas in the Nordic and Baltic countries
PLEASE NOTE:• Blue text means that the text varies case by case (e.g. the area
name or response alternatives). • The circle (m) means that one should select only one alternative
and box (q) that one should check all that apply.• Each variable (set of questions) is coded, based on: 1. on what level (1=international, 2=national, 3=site-
specific) they provide useful information and 2. how significant the questions are at national and/or site-
specific level, i.e. whether they are core (C) or optional (O) questions. Variables listed as important on an interna-tional level are all core ones. For more details, see table 4 in chapter 4.4.3.
• The level of each question is indicated with the following colour codes:
4. Variables and questions for onsite visitor
(1)
(2C)
(3C)
(2O)
(3O)

164
Contents1. The visit to the area . . . . . . . . . . . . . . . . . . . .1651.1. Arriving at the area (3O) . . . . . . . . . . . . . . . .1651.2. Distribution of use in the area (3O) . . . . . . . . . . .1651.3. Duration of the visit (1) . . . . . . . . . . . . . . . . .1681.4. Frequency of visits (1) . . . . . . . . . . . . . . . . .1681.5. Travel to the area . . . . . . . . . . . . . . . . . . . .170
1.5.1. Means of transportation (2O / 3C) . . . . . . . . . . . 1701.5.2. Length of travel to the area (2O) . . . . . . . . . . . . 171
1.6. Mode of travel in the area (2O) . . . . . . . . . . . . .1721.7. Length of travel in the area (3O) . . . . . . . . . . . . .1721.8. Group characteristics (1) . . . . . . . . . . . . . . . .172
1.8.1. Size of the group (1) . . . . . . . . . . . . . . . . . 1721.8.2. Type of the group (1) . . . . . . . . . . . . . . . . . 173
1.9. Overnighting in the area or in its vicinity (2O) . . . . . .1731.10. Activities (1) . . . . . . . . . . . . . . . . . . . . . .1751.11. Importance of the destination (3C) . . . . . . . . . . .1761.12. Source of information (2O) . . . . . . . . . . . . . . .1771.13. Expenditures (2O) . . . . . . . . . . . . . . . . . . .177
2. Visitor satisfaction / recreational experience . . . . . . . . .1802.1. Purpose of the visit / motives (2C) . . . . . . . . . . . .1802.2. Importance of specific area characteristics (2O) . . . . .1822.3. Recreational experience (2O) . . . . . . . . . . . . . .1832.4. Visitors’ expectations and perceptions about the area (3O) .1842.5. Use of facilities and opinions about services, facilities
and the environment (2O, 3C) . . . . . . . . . . . . . .1852.6. Disturbing factors (2O, 3C) . . . . . . . . . . . . . . .1872.7. Free-form thoughts (3C). . . . . . . . . . . . . . . . .189
3. Visitor profile . . . . . . . . . . . . . . . . . . . . . . .1903.1. Socio-demographics . . . . . . . . . . . . . . . . . .190
3.1.1. Age (1) . . . . . . . . . . . . . . . . . . . . . . . . 1903.1.2. Gender (1) . . . . . . . . . . . . . . . . . . . . . . 1903.1.3. Country of residence (1) and place of residence (2C) . . 1903.1.4. Education (1) . . . . . . . . . . . . . . . . . . . . . 1913.1.5. Income (2O) . . . . . . . . . . . . . . . . . . . . . 1913.1.6. Size of household (2O) . . . . . . . . . . . . . . . . 1923.1.7. Childhood (2O) . . . . . . . . . . . . . . . . . . . . 1923.1.8. Membership of associations (2O) . . . . . . . . . . . . 193
3.2. Visitors´ previous outdoor recreational experience / How active the visitor is in outdoor recreation in general (2C) .193
3.3. Visitors´ knowledge (3O) . . . . . . . . . . . . . . . .1943.4. Wilderness purism (2O) . . . . . . . . . . . . . . . . .1963.5. Examples of other questions e.g. on area specific
management issues (3O) . . . . . . . . . . . . . . . .196

165
1. The visit to the area
1.1. Arriving at the area (3O)
What to measure: Arrival timeUnit of measurement: Date and timeAdvice/recommendation: ---
Example 1:When did you arrive at Pyhä-Luosto National Park (please see the map)?date _______________ and time of day _______________
1.2. Distribution of use in the area (3O)What to measure: Spatial distribution of recreational use in the areaUnit of measurement: Number of places / trails visitedAdvice/recommendation: • Instead of or in addition to places, one can also ask trails
or nature types visited. • The trails can be named or numbered • Map increases the reliability of the results and is often
necessary
Example 1:Which part of the Pyhä-Luosto National Park did you visit this time? (Select more than one alternative if applicable)
q Pyhätunturi Nature Centre q Isokuru q Karhunjuomalampi q Pyhätunturi nature trail q Noitatunturi q Huttuloma q Destinations at Luosto q elsewhere, please specify_________________________

166
Example 2:During your visit to Fulufjället, did you visit any of the following places? (The map on page 2 of the questionnaire may be helpful.)
(Check off one or more alternatives)
c Göljådalen (area severely affected by great storm in autumn of 1997)
c Klordalen c Rörsjöstugan c Girådalen c Harrsjöstugan c Bergådalsstugan c Tangsjöstugan c Tangåstugan c Altar ring (west of Tangsjöstugan) c Göljåstugan c Björnholmsstugan c Café beside trail to Njupeskär waterfall c Njupeskär waterfall
Example 3:Did you walk along any of the following trails? (The map on page 2 of the questionnaire may be helpful.)
(Check off one or more alternatives, regardless of the direction travelled)
c Trail from parking area to Njupeskär waterfall c Trail over the mountain and around Njupeskär waterfall c Parking area – Rörsjöstugorna c Rörsjöstugan – Harrsjöstugan c Gördalen – Harrsjöstugan c Rörsjöstugan – Tangsjöstugan c Tangsjöstugan – Göljåstugan c Trail through Göljådalen Valley c Tangsjöstugan – Tangåstugan c Björnholmssätern – Tangåstugan c Morbäckssätern – Tangåstugan c Trail over Västertangen (crosses Norwegian border)

167
Example 4:Will you please on this map show/draw where in the area you have been during your visit?
Example 5:Advice: This question can also be more detailed, so the respondents split up the visiting time between the different area typesa. What areas did you visit during your visit here today?(tick box(es) - please tick all that apply) c Field (agriculture landscape) c Meadow c Heathland c Bog c Lake c River/stream c Forest c Beach c Sea/ocean c Other placesIf other places, please state: ________________________
b. Which area was the primary goal for your visit? Circle the area above that was the primary goal of your visit.
Example 6:Did you leave the roads and paths on your visit here today?(tick one box only) c Yes c No
- If Yes: where did you go outside the roads and paths?(tick box(es) - please tick all that applies) c In fields c Along hedges/boundaries c Along streams c On forest floor c In meadow, heath, moor or the like c On beach c Other places If other places, please state: ________________________

168
1.3. Duration of the visit (1)
What to measure: Duration of the current visit Unit of measurement: days (24 hours), hours and/or minutes • You should use the smallest applicable unit as the measure-
ment. For example, if the area is a day use area, use hours and minutes. In backcountry settings, use days and hours.
Advices: • define the area clearly e.g. by map
Recommendation (level 1):How long did you stay during this visit in the Pyhä-Luosto National Park (see map)? (answer in days, hours and/or minutes)
About ___ days (24 hours) and/or ____ hours and/or ____ minutes
Example 1 (level 2O):How long did you stay during this visit altogether in the Pyhä-Luosto National Park or in its vicinity, for example in the Luosto tourist centre (see map)? (answer in days, hours and/or minutes)
About ___ days (24 hours) and/or ____ hours and/or ____ minutes
Example 2 (level 2O):How many days did your trip last? (Include the total number of days from the time you left home until the time of your return.)
Answer: ______ days.
1.4. Frequency of visits (1)
What to measure: Frequency of visits Unit of measurement: Number of previous visits during the past 12 months (not including the current visit)Advices: ---
Recommendation (level 1):How often have you visited in the Pyhä-Luosto National Park before this visit? (Please answer all that apply)This is my first visit q ‡ move on to question xx
During past 12 months _____________times

169
Example 1 (level 3O):Advices: Select the suitable time period for asking how many times. In most frequently visited areas shorter time (e.g. 12 months as above or 2 years as below) is more applicable than in remote areas where e.g. 5 years can be a useful time period.How often have you visited in the Pyhä-Luosto National Park before this visit?During past 2 years ____________ times
When was your first visit? In ____________ (year)
When was your last visit? In ____________ (year)
Example 2 (level 3O):Advices: This can be very useful if visitor counting is not done year round.
How many times have you visited Fulufjället National Park during the past five years?
Summer (June - August): ______ times
Autumn (September – November): ______ times
Winter (December – March): ______ times
Spring (April – May): ______ times
Example 3 (level 3O):When did you last visit this forest area? m Have not visited it before m Less than 1 week ago m 1 to 2 weeks ago m 2 to 4 weeks ago m 1 to 2 months ago m 2 to 4 months ago m 4 to 12 months ago m More than 1 year ago m Don´t remember / don´t know
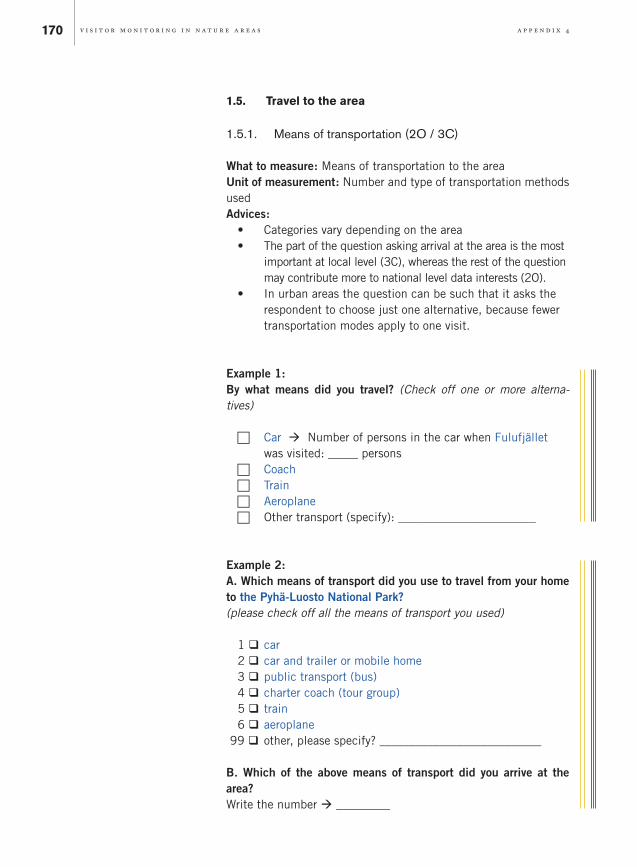
170
1.5. Travel to the area
1.5.1. Means of transportation (2O / 3C)
What to measure: Means of transportation to the areaUnit of measurement: Number and type of transportation methods used Advices: • Categories vary depending on the area • The part of the question asking arrival at the area is the most
important at local level (3C), whereas the rest of the question may contribute more to national level data interests (2O).
• In urban areas the question can be such that it asks the respondent to choose just one alternative, because fewer transportation modes apply to one visit.
Example 1:By what means did you travel? (Check off one or more alterna-tives)
c Car ‡ Number of persons in the car when Fulufjället was visited: _____ persons
c Coach c Train c Aeroplane c Other transport (specify): _______________________
Example 2:A. Which means of transport did you use to travel from your home to the Pyhä-Luosto National Park? (please check off all the means of transport you used)
1 q car 2 q car and trailer or mobile home 3 q public transport (bus) 4 q charter coach (tour group) 5 q train 6 q aeroplane 99 q other, please specify? ___________________________
B. Which of the above means of transport did you arrive at the area?Write the number ‡ _________

171
Example 3:Which means of transport did you use on the actual journey to the forest area? (If more than one, tick the one used for the longest stretch) m On foot m Horse m Bike m Moped m Motorbike/scooter m Car m Bus m Train/tube
1.5.2. Length of travel to the area (2O)
What to measure: Length of travel to the area Unit of measurement: Kilometres or time unitsAdvices: The starting point should be defined so that it fits the particular situation. E.g. from your home or from where you stayed last night (e.g. in case there are plenty of foreign visitors).
Example 1:How long did the actual journey to the forest area take?
_____ hours and/or ____ minutes
Example 2:What was the distance from your starting point to this forest area? _____ km
Example 3:Advice: One can also ask in addition to this question the type of the address: is it the permanent address or summer cottage or other overnight facility.
Where did you start from?
______________________________________(only street name necessary)
_____________________________________(postal code) (town)
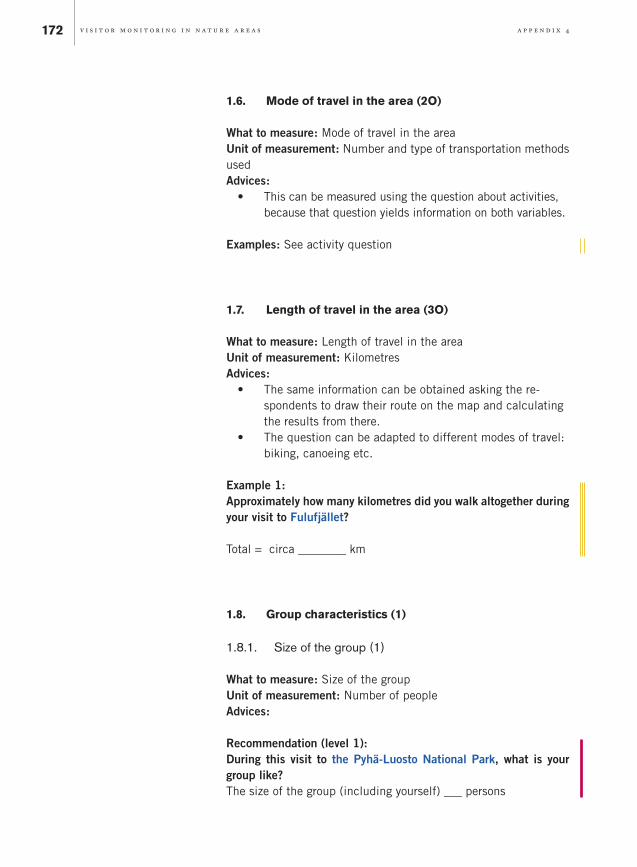
172
1.6. Mode of travel in the area (2O)
What to measure: Mode of travel in the area Unit of measurement: Number and type of transportation methods used Advices: • This can be measured using the question about activities,
because that question yields information on both variables.
Examples: See activity question
1.7. Length of travel in the area (3O)
What to measure: Length of travel in the area Unit of measurement: KilometresAdvices: • The same information can be obtained asking the re-
spondents to draw their route on the map and calculating the results from there.
• The question can be adapted to different modes of travel: biking, canoeing etc.
Example 1:Approximately how many kilometres did you walk altogether during your visit to Fulufjället?
Total = circa ________ km
1.8. Group characteristics (1)
1.8.1. Size of the group (1)
What to measure: Size of the groupUnit of measurement: Number of peopleAdvices: Recommendation (level 1):During this visit to the Pyhä-Luosto National Park, what is your group like? The size of the group (including yourself) ___ persons

173
Example 1 (level 3O):During this visit to the Pyhä-Luosto National Park, what is your group like?I´m alone q ‡ move on to question x.The size of the group (including yourself) _________ persons
of which under 15 years of age? _________ persons
1.8.2. Type of the group (1)
What to measure: Type of the groupUnit of measurement: Predefined classesAdvices:
Recommendation:During this visit to the Pyhä-Luosto National Parka. your group consists of… (please choose all that apply)
1 q members of own family 2 q other relatives 3 q friends 4 q co-workers 5 q school class 6 q kindergarten children 7 q student group 8 q senior citizens 9 q clients of an enterprise offering organised programmes of
activities 10 q club, association, etc. (which?) __________________ 99 q others (what?) _________________________________
b. Which of the above groups is most significant to you on this tripWrite the number ‡ _________
1.9. Overnighting in the area or in its vicinity (2O)
What to measure: Overnight useUnit of measurement: Predefined classesAdvices: ---
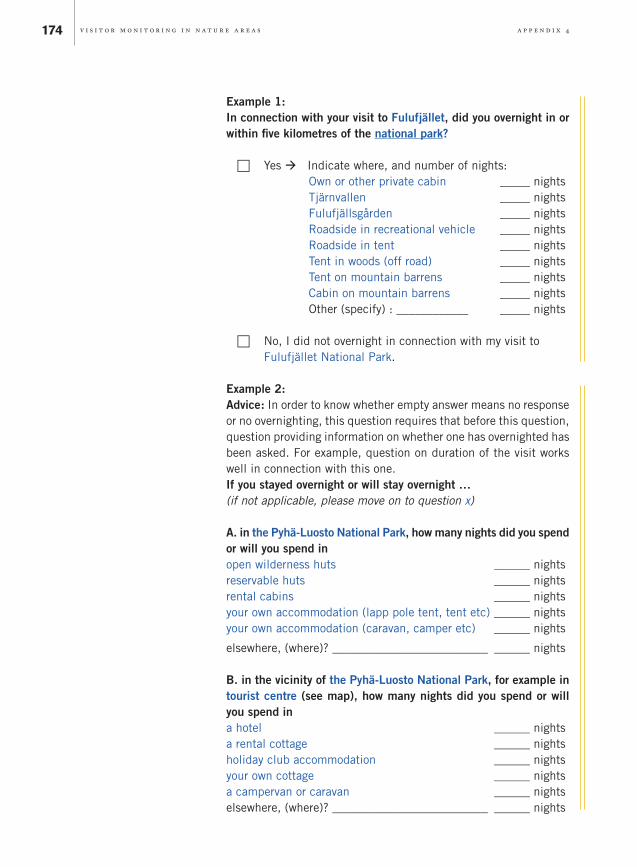
174
Example 1:In connection with your visit to Fulufjället, did you overnight in or within five kilometres of the national park?
c Yes ‡ Indicate where, and number of nights: Own or other private cabin _____ nights Tjärnvallen _____ nights Fulufjällsgården _____ nights Roadside in recreational vehicle _____ nights Roadside in tent _____ nights Tent in woods (off road) _____ nights Tent on mountain barrens _____ nights Cabin on mountain barrens _____ nights Other (specify) : ____________ _____ nights
c No, I did not overnight in connection with my visit to Fulufjället National Park.
Example 2:Advice: In order to know whether empty answer means no response or no overnighting, this question requires that before this question, question providing information on whether one has overnighted has been asked. For example, question on duration of the visit works well in connection with this one.If you stayed overnight or will stay overnight …(if not applicable, please move on to question x)
A. in the Pyhä-Luosto National Park, how many nights did you spend or will you spend inopen wilderness huts ______ nightsreservable huts ______ nightsrental cabins ______ nightsyour own accommodation (lapp pole tent, tent etc) ______ nightsyour own accommodation (caravan, camper etc) ______ nights
elsewhere, (where)? __________________________ ______ nights
B. in the vicinity of the Pyhä-Luosto National Park, for example in tourist centre (see map), how many nights did you spend or will you spend ina hotel ______ nightsa rental cottage ______ nightsholiday club accommodation ______ nightsyour own cottage ______ nightsa campervan or caravan ______ nightselsewhere, (where)? __________________________ ______ nights

175
Example 3: Did you stay somewhere overnight in connection with your visit here in Fulufjället today?(e.g. on a camping site, in a weekend cottage, at a hotel or the like)(tick one box only) c Yes What kind? _______________________________ c No
Example 4:Indicate below where you stopped the night before and the night after your visit to Fulufjället.
The night before I visited Fulufjället, I overnighted: c At home c Elsewhere (specify): _______________________________
The night after I visited Fulufjället, I overnighted:
c At home c Elsewhere (specify): _______________________________
1.10. Activities (1)
What to measure: Participation in activities (measures also the mode of travel in the area)Unit of measurement: Activities participated in during the current visitAdvices: • Choose the activities that are relevant in that particular
situation • Try to provide a comprehensive list, but maximum of 30
activities is recommended • When repeating this question in the area, one should keep
the same activities as before. Adding new activities is necessary to keep the relevance, but it is possible that it reduces comparability.
• We recommend that the list in most cases includes the first 16 variables as core variables – not forgetting the first advice mentioned.
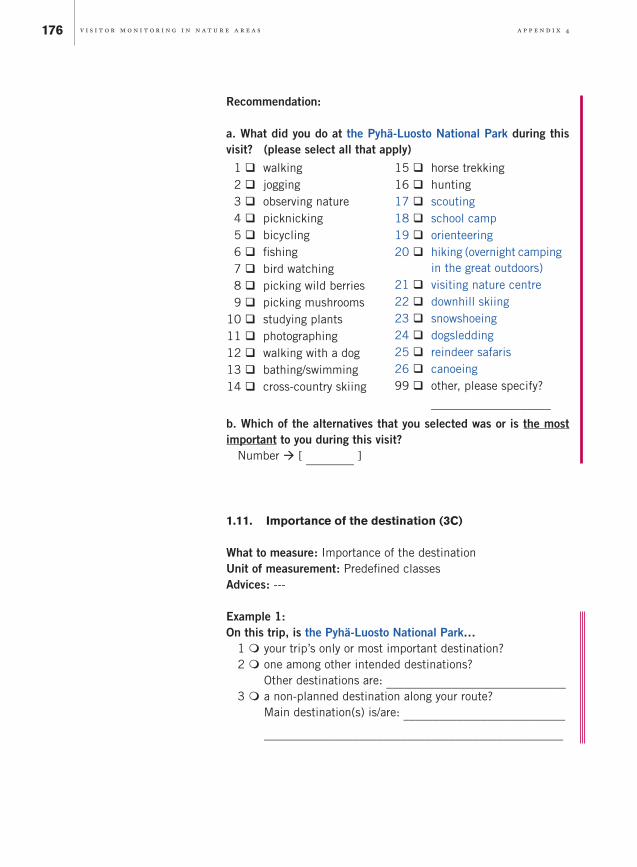
176
Recommendation:
a. What did you do at the Pyhä-Luosto National Park during this visit? (please select all that apply)
1 q walking2 q jogging3 q observing nature4 q picknicking5 q bicycling6 q fishing7 q bird watching8 q picking wild berries9 q picking mushrooms
10 q studying plants11 q photographing12 q walking with a dog13 q bathing/swimming14 q cross-country skiing
15 q horse trekking16 q hunting17 q scouting18 q school camp19 q orienteering20 q hiking (overnight camping
in the great outdoors)21 q visiting nature centre 22 q downhill skiing 23 q snowshoeing24 q dogsledding25 q reindeer safaris26 q canoeing99 q other, please specify?
____________________
b. Which of the alternatives that you selected was or is the most important to you during this visit? Number ‡ [ ________ ]
1.11. Importance of the destination (3C)
What to measure: Importance of the destinationUnit of measurement: Predefined classesAdvices: ---
Example 1: On this trip, is the Pyhä-Luosto National Park… 1 m your trip’s only or most important destination? 2 m one among other intended destinations? Other destinations are: ______________________________ 3 m a non-planned destination along your route? Main destination(s) is/are: ___________________________ __________________________________________________

177
1.12. Source of information (2O)
What to measure: Source of information about the areaUnit of measurement: Predefined classesAdvices: ---
Example 1: Where did you find information about the the Pyhä-Luosto National Park? (you may choose several alternatives) 1 q in the visitor centre or customer service point of
Metsähallitus 2 q from relatives, friends, acquaintances 3 q the internet pages of Metsähallitus (www.metsa.fi or
www.outdoors.fi) 4 q other internet sites 5 q from brochures or guidebooks (hiking guidebook etc.) 6 q from TV /radio programmes or newspaper articles 7 q in the regional tourist agency or tourist information 8 q from the enterprises of the area (for instance organised
activity programmes, accommodation) 9 q the place is familiar to me from before 99 q elsewhere (where?) _________________________________
1.13. Expenditures (2O)
What to measure: Amount of expenditures in predefined areasUnit of measurement: Monetary unitsAdvices: • Expenditures are very difficult issue to measure. If ex-
penditures are of particular interest, one should consult experts.
• Sometimes it is very complicated for visitors to identify which settlement is in the park and which is outside. Map can be very useful in increasing the reliability of the results.
Example 1: Approximately what were the total expenses connected with your visit to Fulufjället (for lodging, food, souvenirs, etc.)?(If you were accompanied on your visit, indicate only your share of expenses)
My total expenses were approx. __________ kr

178
Example 2: Taking into account the various expenses incurred during the entire journey and during your visit to the Fulufjället area, indicate the amounts for each area in the chart on the following page.
In completing the chart, please keep in mind the following:
• If you were accompanied on the trip, note only your share of expenses
• Include expenses paid by others (relative, employer, etc.) on your behalf
• Note expenses for the areas in which they were paid • Note related expenses that may have been paid before or
after the trip (e.g. tickets, food, etc.) • If you travelled with a package tour, indicate your total
costs for the tour and all related expenses in the last sec-tion of the chart.
• If you did not have any expenses for a given item, leave that section blank.
Figures in Swedish kronor (“kr”)
Fulufjället National Park
Surrounding area(outside the
national park)
Lodging ________ kr ________ kr Groceries ________ kr ________ kr Restaurants, food stands, etc. ________ kr ________ kr Shopping (other than food) ________ kr ________ kr Recreational activities ________ kr ________ kr Hired car ________ kr ________ kr Car fuel ________ kr ________ kr Coach tickets ________ kr ________ kr Train tickets ________ kr ________ kr Air tickets ________ kr ________ kr Other forms oftransportation ________ kr ________ kr Other expenses ________ kr ________ kr

179
Example 3:How much money are you going to use during your visit for various purposes?Are you estimating (please cross the appropriate alternative) 1 q your personal expenses and your contribution to the total
costs of the group (recommended) OR 2 q the total expenses of the family or the group.
q I estimate the detailed costs of my journey to have been or to be as follows:
A Travel costs to and from homeby public transport _______________ €
own/rented car, please indicate the length of the journey _________________ km
B Fuel or other purchases from service stationshere or the nearby area _______________ €
on the way or in your place of domicile _______________ €
C Food and other retail shoppinghere or the nearby area _______________ €
on the way or in your place of domicile _______________ €
D Café and restaurant purchaseshere or the nearby area_______________ €
on the way or in your place of domicile _______________________ €
E Accommodationhere or the nearby area _______________ €
on the way or in your place of domicile _______________ €
F Organised activities in the area (for instance guided tours etc.)_______________ €
G Other expenses (e.g. fishing, hunting or snowmobiling permits, equipment rental, souvenirs etc.)here or the nearby area _______________ €
on the way or in your place of domicile _______________ €

180
2. Visitor satisfaction / recreational experience
Visitor satisfaction consists of visitors’• opinions about services• opinions about environmental quality• realization of expectations• factors detracting from the visit
2.1. Purpose of the visit / motives (2C)
What to measure: Motives Unit of measurement: 5-point Likert-scaleAdvices: ---
Example 1:Below, 20 different reasons for visiting the nature/the countryside are mentioned. How important was each of the mentioned reasons for your decision to go here today?(tick one box for each of the 20 motives)
not very important important at all
5 4 3 2 1 1. So the family could do something together m m m m m 2. To be close to nature m m m m m 3. For a change from everyday life m m m m m 4. It would be a chance to meet new people m m m m m 5. To help release my clutched-up feelings m m m m m 6. To show myself that I could do it m m m m m 7. To be with others who enjoy the same things I do m m m m m 8. To improve my physical health m m m m m 9. To get away from crowded situations for a while m m m m m 10. So the family could spend some time together m m m m m 11. To enjoy the smells and sounds of nature m m m m m 12. So I could be with my friends m m m m m 13. To experience the mystery of nature m m m m m 14. To talk to new and varied people m m m m m 15. To learn more about nature m m m m m 16. To get away from the clatter and racket for a while m m m m m 17. To enjoy the scenery m m m m m 18. To show others that I could do it m m m m m 19. For the exercise m m m m m 20. To develop my skills and ability m m m m m

181
Example 2:What was or is important to you during this visit to the Pyhä-Luosto National Park? (please respond to each alternative)(5 = very important, 4 = fairly important, 3 =neither, 2 = of little importance, 1 = not important at all)
not very important important at all
5 4 3 2 1nature experiences m m m m mscenery m m m m mbeing on my own m m m m mmental well-being m m m m mgetting away from noise and pollution m m m m mrelaxation m m m m mmeeting new people m m m m mbeing together with own group m m m m mpleasant old memories m m m m mgetting to know the area m m m m mlearning about nature m m m m mimproving my own skills m m m m mkeeping fit m m m m mexperiencing excitement m m m m mlearning about the cultural heritage of the area m m m m m

182
Example 3:How important were the following factors for your decision to visit Fulufjället?(Circle the appropriate alternative for each item)
not very important important at all
To experience beautiful nature 5 4 3 2 1The area is near my place of residence 5 4 3 2 1The area is easily accessible 5 4 3 2 1I have friends who live near Fulufjället 5 4 3 2 1One meets many interesting people 5 4 3 2 1The area is unique 5 4 3 2 1The weather is pleasant 5 4 3 2 1The area is not full of litter 5 4 3 2 1The area is “family friendly” 5 4 3 2 1The park is not crowded 5 4 3 2 1To enjoy peace and quiet 5 4 3 2 1There are good restaurants nearby 5 4 3 2 1For the lakes and watercourses 5 4 3 2 1There are fishing opportunities 5 4 3 2 1There are good lodging facilities 5 4 3 2 1There are marked trails 5 4 3 2 1There are mountain cabins 5 4 3 2 1It is a national park 5 4 3 2 1To experience nature that is undisturbed by humans 5 4 3 2 1To experience wilderness 5 4 3 2 1
2.2. Importance of specific area characteristics (2O)
What to measure: The importance of specific area characteristicsUnit of measurement: Predefined response scale for specific area characteristics Advices: ---

183
Example 1: This card shows what is characteristic for the forest area. How important are these things to you?
Important Matter of Don’t Don´t difference like it know
The deer 3 2 1 0The old trees 3 2 1 0The open plains 3 2 1 0The restaurants 3 2 1 0The amusement park 3 2 1 0The golf course 3 2 1 0The riding 3 2 1 0The many other visitors 3 2 1 0The situation at the coast 3 2 1 0The situation near the city 3 2 1 0
2.3. Recreational experience (2O)
What to measure: The recreational experience obtained from the visitUnit of measurement: Predefined response scale for potential rec-reational experiencesAdvices: ---
Example 1:Did your visit to Fulufjället yield any of the experiences listed below? Circle the appropriate alternative for each item.
No, not No, not Yes, Yes, at all much some- very what much
Peace and quiet 1 2 3 4Clean, unspoiled nature 1 2 3 4Seclusion from strangers 1 2 3 4Magnificent scenery 1 2 3 4Wilderness 1 2 3 4Challenges 1 2 3 4Risk-taking 1 2 3 4Relaxation 1 2 3 4
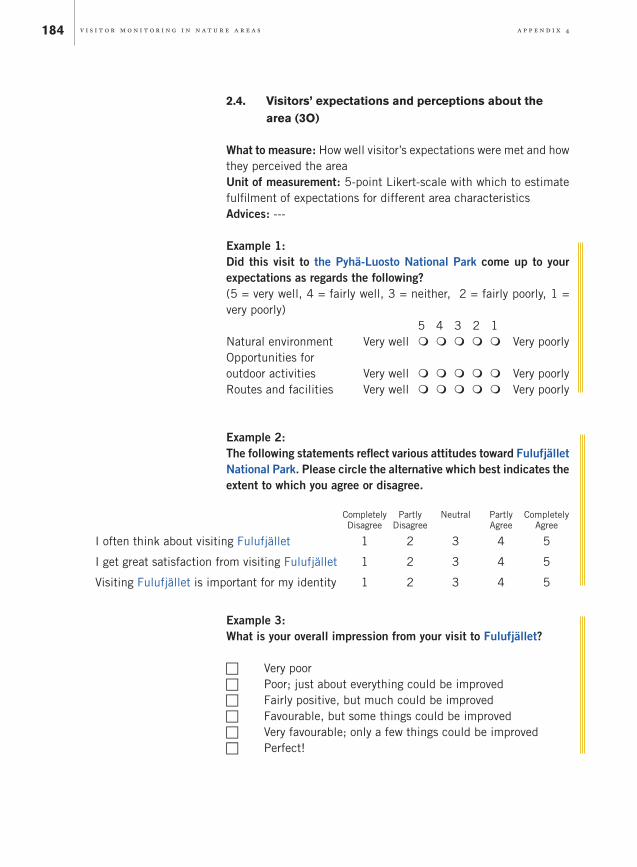
184
2.4. Visitors’ expectations and perceptions about the area (3O)
What to measure: How well visitor’s expectations were met and how they perceived the areaUnit of measurement: 5-point Likert-scale with which to estimate fulfilment of expectations for different area characteristicsAdvices: ---
Example 1: Did this visit to the Pyhä-Luosto National Park come up to your expectations as regards the following?(5 = very well, 4 = fairly well, 3 = neither, 2 = fairly poorly, 1 = very poorly) 5 4 3 2 1Natural environment Very well m m m m m Very poorlyOpportunities for outdoor activities Very well m m m m m Very poorlyRoutes and facilities Very well m m m m m Very poorly
Example 2: The following statements reflect various attitudes toward Fulufjället National Park. Please circle the alternative which best indicates the extent to which you agree or disagree.
CompletelyDisagree
PartlyDisagree
Neutral PartlyAgree
CompletelyAgree
I often think about visiting Fulufjället 1 2 3 4 5
I get great satisfaction from visiting Fulufjället 1 2 3 4 5
Visiting Fulufjället is important for my identity 1 2 3 4 5
Example 3: What is your overall impression from your visit to Fulufjället?
c Very poor c Poor; just about everything could be improvedc Fairly positive, but much could be improvedc Favourable, but some things could be improvedc Very favourable; only a few things could be improvedc Perfect!
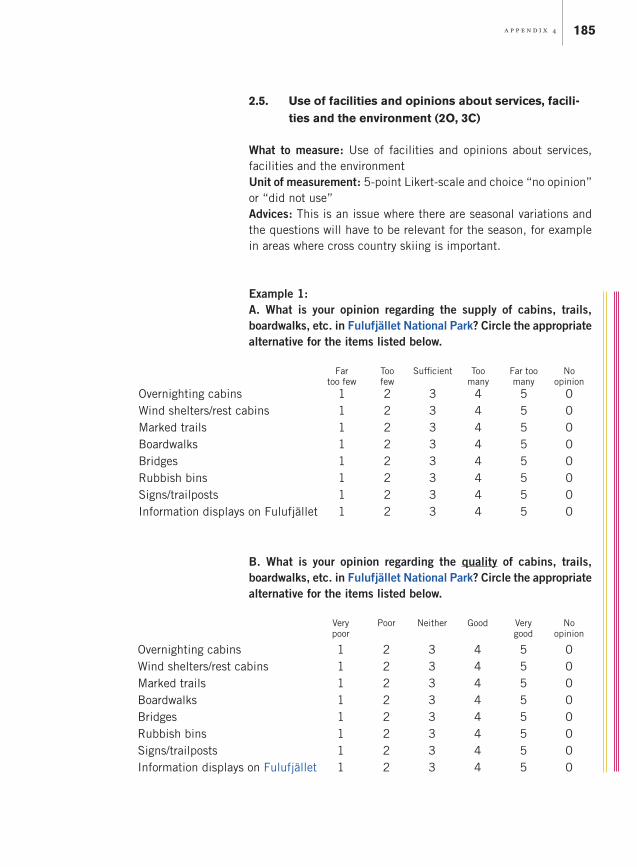
185
2.5. Use of facilities and opinions about services, facili-ties and the environment (2O, 3C)
What to measure: Use of facilities and opinions about services, facilities and the environmentUnit of measurement: 5-point Likert-scale and choice “no opinion” or “did not use” Advices: This is an issue where there are seasonal variations and the questions will have to be relevant for the season, for example in areas where cross country skiing is important.
Example 1: A. What is your opinion regarding the supply of cabins, trails, boardwalks, etc. in Fulufjället National Park? Circle the appropriate alternative for the items listed below.
Fartoo few
Too few
Sufficient Too many
Far toomany
No opinion
Overnighting cabins 1 2 3 4 5 0Wind shelters/rest cabins 1 2 3 4 5 0Marked trails 1 2 3 4 5 0Boardwalks 1 2 3 4 5 0Bridges 1 2 3 4 5 0Rubbish bins 1 2 3 4 5 0Signs/trailposts 1 2 3 4 5 0Information displays on Fulufjället 1 2 3 4 5 0
B. What is your opinion regarding the quality of cabins, trails, boardwalks, etc. in Fulufjället National Park? Circle the appropriate alternative for the items listed below.
Very poor
Poor Neither Good Very good
No opinion
Overnighting cabins 1 2 3 4 5 0Wind shelters/rest cabins 1 2 3 4 5 0Marked trails 1 2 3 4 5 0Boardwalks 1 2 3 4 5 0Bridges 1 2 3 4 5 0Rubbish bins 1 2 3 4 5 0Signs/trailposts 1 2 3 4 5 0Information displays on Fulufjället 1 2 3 4 5 0

186
Example 2: Advice: Visitors’ satisfaction with the quality of the areas facili-ties and services is asked in 10a. Satisfaction with the amount of services and facilities does not come from there on a scale from 1 to 5, hence question 10b can be useful as well.
What did you think about the quality and the quantity of the services, facilities and environment dur-ing your current visit to the Pyhä-Luosto National Park? Please answer each question and estimate the quality of the services or facilities that you used during your visit. If you did not use the service or facility this time, just cross the alternative ”did not use”. Please always evaluate the quantity of services and facilities.Quality assessment scale 5 = very good, 4 = fairly good, 3 = neither, 2 = fairly poor, 1 = very poor Quantity assessment scale 3 = too many, 2 = suitable, 1 = too few, or no opinion
Quality of the environment and of the service and facility I used
The current quantity of services and facilities
very very good 5 4 3 2 1 poor
did not use
too too many 3 2 1 few
no opinion
parking places m m m m m m m m m m road network m m m m m m m m m m
signposts on the routes m m m m m m m m m m
trail and/or skiing track network m m m m m m m m m m
signposts at the trails and/or skiing tracks m m m m m m m m m m
campfire sites and lean-tos m m m m m m m m m m
firewood in cabins and at maintained campfire places m m m m m m m m m m
public latrines m m m m m m m m m m
realisation and guidance of the waste disposal m m m m m m m m m m
paying attention to special needs of the disabled (accessibility of routes, safety, signposts/information boards etc.) m m m m m m m m m m
services provided by enterprises (for ex-ample cafes and organised activities) m m m m m m m m m m
safety of the routes and structures m m m m m m
general safety m m m m m m
general cleanliness m m m m m m
variability of landscapes m m m m m m
other (what?) __________________ m m m m m m m m m m
10b. How satisfied are you with the quantity of services and facilities in the Pyhä-Luosto National Park as a whole? (5 = very satisfied, 4 = rather satisfied, 3 = neither one nor the other 2= rather unsatisfied, 1= very unsatisfied)
5 4 3 2 1 very satisfied m m m m m very unsatisfied

187
Example 3:
Would one of the following services be necessary in the Pyhä-Luosto National Park?
very necessary 5 4 3 2 1 not at all necessary
more extensive way-finding and information services than currently exist m m m m m
open wilderness hut (for staying overnight) m m m m m landing places for canoeing m m m m m
2.6. Disturbing factors (2O, 3C)
What to measure: Factors disturbing the recreational visitUnit of measurement: A scale with which to estimate different potentially disturbing factorsAdvices: ---
Example 1: Did any of the following disturb you this time during your visit in the Pyhä-Luosto National Park? (please respond to each alternative) (5 = not at all, 4 = fairly little, 3 = neither, 2 = fairly much, 1 = very much)
not at very all much
5 4 3 2 1
erosion of the ground m m m m mlittering m m m m mtreatment of natural environment m m m m mtoo many visitors m m m m mbehaviour of other visitors m m m m mother (what?) ____________________ m m m m m
Example 2: Did you experience any crowding in connection with your visit to the Njupeskär waterfall, or while walking to and from it?(Mark a cross at the appropriate point on the scale.)
•-----------•-----------•-----------•-----------•-----------•-----------•-----------•-----------• 1 2 3 4 5 6 7 8 9 No Some Fairly Extremely crowding crowding crowded crowded at all

188
Example 3: Advice: This is a set of four questions that go together.
1. How many other visitors did you see on your visit to the forest/nature area today?(Note approximate number)
_________ no. of other visitors
2. What do you think of the number of visitors today? (tick one box)
•-----------•-----------•-----------•-----------•-----------•-----------•-----------•-----------• 1 2 3 4 5 6 7 8 9 Not crowded Slightly Moderately Extremely at all crowded crowded crowded
3. Did other visitors annoy you today?
c Yes ‡ Please note in which way and by what kind of visi-
tors you were annoyed: ______________________________
___________________________________________________
c No
4. How many other visitors could you tolerate to meet during your visit here today - and still not feel that the area is crowded? (tick one box)
The greatest number of visitors that I can accept to meet here today without feeling that the area is crowded is approx.: ________
c The number of other visitors does influence my visit but I cannot state an exact number
c The number of other visitors does not influence my visit

189
2.7. Free-form thoughts (3C)
What to measure: Open questionUnit of measurement: QualitativeAdvices: Provide enough space for the responses. Too short a line may be interpreted by some respondents that the open-ended an-swers are not really desired.
Example 1:If you wish to tell us something else, please use the space below.
___________________________________________________________
___________________________________________________________
___________________________________________________________
___________________________________________________________
___________________________________________________________
_________________________________________________________

190
3. Visitor profile
3.1. Socio-demographics
3.1.1. Age (1)
What to measure: AgeUnit of measurement: YearsAdvices: No age classes should be used as answer alternatives, because it reduces the possibility for calculations as well as com-parability across areas.
Example 1:In what year were you born? __________
Example 2:Year of birth? [ __ __ __ __ ]
Example 3:How old are you? ___________ years
3.1.2. Gender (1)
What to measure: GenderUnit of measurement: Male/FemaleAdvices: ---
Recommendation: Gender? m male m female
3.1.3. Country of residence (1) and place of residence (2C)
What to measure: Place of residenceUnit of measurement: The country where the visitor lives perma-nentlyAdvices: ---
Recommendation (level 1):Country of permanent residence?’ ___________________________

191
Example 1 (level 2C):Advices: • For foreign language questionnaires this is not relevant. • Postal code helps in creating maps
The postal code and municipality of your place of residence?
[ __ __ __ __ __ ] _______________________
3.1.4. Education (1)
What to measure: Highest level of educationUnit of measurement: Predefined classesAdvices: The applicable response alternatives may require some adjustment from country to country.Examples on how to measure:
Example 1:Highest level of education
c Primary school c Secondary school c University, undergraduate degree c University, graduate degree c Other (specify) : ___________________________
Example 2:Education? (please indicate your highest level of education) m vocational training m college-level degree m university bachelor’s degree m university master’s degree or higher m no vocational/professional qualification
3.1.5. Income (2O)
What to measure: IncomeUnit of measurement: Net income, predefined classesAdvices: It is advisable to use predefined classes because this ques-tion is difficult to answer and many respondents prefer to skip it.

192
Example 1:What was the approximate total after-tax income: of your household for year 2002? c Up to 100,000 kr c 100,000 – 200 000 kr c 200,000 – 300 000 kr c 300,000 – 400 000 kr c 400,000 – 500 000 kr c Over 500,000 kr
3.1.6. Size of household (2O)
What to measure: Size of householdUnit of measurement: Number of people (in various age classes)Advices: ---
Example 1:How many of the following categories live in your household (in-cluding yourself)?
_____ children aged 0 – 12
_____ young people aged 13 – 18
_____ adults (18+)
3.1.7. Childhood (2O)
What to measure: Size of the childhood population centreUnit of measurement: Size of the population centre predefined classesAdvices: ---
Example 1:Where did you spent the majority of your childhood (from 0 to 14 years)? (tick one box)
c In the country / In a village c In a small town (less than 10,000 inhabitants) c In a big town (more than 10,000 inhabitants) c In the metropolitan area

193
3.1.8. Membership of associations (2O)
What to measure: Membership in associations with activities in natureUnit of measurement: Predefined classesAdvices: ---
Example 1:Which associations are you a member of? Yes No
Anglers association c c
Hunting club c c
Danish Society for Conservation of Nature c c
Hiking association c c
Other associations with activities in the nature c c
Which? _________________________________________________
3.2. Visitors´ previous outdoor recreational experience / How active the visitor is in outdoor recreation in general (2C)
What to measure: Visitor’s previous outdoor recreational experience and how active the visitor is in outdoor recreation in general.Unit of measurement: Yearly amount and types of visits to different natural areas Advices: ---
Example 1:How many times have you visited a national park, recreational area or other nature destination during the last 12 months? 1 One day trips _________ times 2 Trips where at least one night has been spent in the
great outdoors (for example in a tent or wilderness cabin) _________ times

194
Example 2:Advice: Walking can be replaced by canoeing, bicycling etc. de-pending on the area.
What kinds of hiking trips have you made during the last 5 years? (please indicate all you have made)
1 q Independent hiking trips outside sign posted routes 2 q Long (over 10 km) trips on sign posted routes 3 q Short (under 10 km) independent trips on sign posted
routes and in familiar terrain 4 q Participation on a guided tour 5 q other, (what?) _________________________________
Example 3:How many times have you visited the forest/nature during the last year? (all your trips to all forest/nature areas – in the countryside – should be included; also short drives or e.g. brief walks are re-garded as a visit to the forest/nature, if they have been undertaken entirely or partly with the aim of visiting the forest/nature)
Example 4:Advice: Walking can be replaced by canoeing, bicycling etc. de-pending on the area.
The longest walking trip completed during the last year? 0, 1–2 km, 3–5, 6–10, 11–20, >20 km.
3.3. Visitors´ knowledge (3O)
What to measure: Visitor’s knowledge about the areaUnit of measurement: Predefined classesAdvices: ---
Example 1: Understanding the landscape/type of nature Would you consider this area being mainly a….. q forest q moor q heath land q beach q lake q mountain q other, please specify ______________________

195
Example 2: Do you know what is permitted in the Pyhä-Luosto National Park? (please cross below the things you consider permitted)
1 q off-trail hiking 2 q hiking only on signposted trails 3 q mountain biking off trail 4 q picking berries or mushrooms 5 q picking plants or rocks 6 q fishing 7 q hunting 8 q driving a motor vehicle 9 q making a campfire and wild camping 10 q using brushwood for firewood
Example 3:Below, various possibilities of activities in the nature/the contryside is mentioned. What do you think – as principal rule – is allowed for the public today? (tick one box at each possibility)
Allowed not don’t allowed knowTo walk on private tracks in the countryside c c c
To walk away from roads and paths in the state forests c c c
To cycle on private tracks in the countryside c c c
To cycle on forest roads in the private forests c c c
To cycle away from roads and paths in the state forests c c c
To use roads in the private forests at night c c c
To pick flowers and collect berries and mushrooms in the state forests for personal use c c c
Example 4:Who do you think owns/administrates this forest/nature area? (tick one box)
c Private c The State c County/Municipality c Don’t know

196
3.4. Wilderness purism (2O)
Now some general questions about the Swedish mountains – your opinion about the best way to preserve and manage them, and your feelings and preferences for the mountain environment.
Please indicate your attitude toward the following factors relating to the preservation, management and enjoyment of the mountains. (Circle the appropriate alternative for each item.)
Very Negative Neutral Positive Very negative positive
Prepared campsites with WCs,rubbish bins, fireplaces, etc. -2 -1 0 1 2
Mountain lodges -2 -1 0 1 2
Marked trails -2 -1 0 1 2
Availability of attractive areasfor automotive day trips -2 -1 0 1 2
Opportunity to travel several days without seeing houses, roads, etc. -2 -1 0 1 2
Encountering only a few other visitors(apart from travelling companions) -2 -1 0 1 2
Presence of rare plants and animals -2 -1 0 1 2
Core of wilderness over 5 kilometres from nearest house, road, logging area, dam, utility pole, etc. -2 -1 0 1 2
Areas unspoiled by humans -2 -1 0 1 2
3.5. Examples of other questions e.g. on area specific management issues (3O)
Example 1:Number of dogs? __________
OR: based on observation:Number of dogs ____ on a leash ____ unleashed
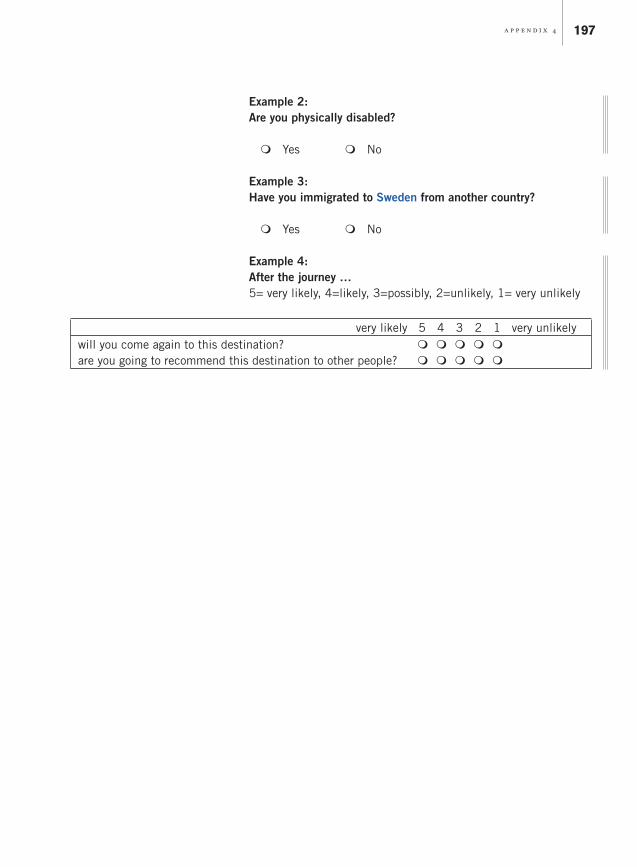
197
Example 2:Are you physically disabled?
m Yes m No
Example 3:Have you immigrated to Sweden from another country?
m Yes m No
Example 4:After the journey … 5= very likely, 4=likely, 3=possibly, 2=unlikely, 1= very unlikely
very likely 5 4 3 2 1 very unlikelywill you come again to this destination? m m m m mare you going to recommend this destination to other people? m m m m m

198
Example of a questionnaire
The person collecting the form will fill in this field:
number place visitor interviewer post initials date time of day
How to fill in this questionnaire: The information collected by this Visitor Survey will be used in management and planning of the xxx National Park. We hope that you answer to all the questions. Please note the following instructions: 1. Read the questions with care. 2. Answer the questions personally by ticking the appropriate circle (m). Where it is possible
to choose more than one alternative, place your ticks in response squares (q). In some of the questions, you can write your answer in the space reserved for it.
3. The questions are about your current visit to the xxx National Park (please see the map). 4. Please return the filled-in form to the person you got the form from, or to the place
mentioned in the instructions. 5. For more information, please contact xxx tel. 0205 64 xxxx ([email protected]) or xxx
tel. 0205 64 xxxx ([email protected])
THANK YOU IN ADVANCE!
1. When did you arrive at the xxx National Park (please see the map)?
date _________ and time of day ________
2. How long did you stay or are you going to stay during this visit
a. in the xxx National Park? (answer in days or hours)
About days or hours
b. altogether in the xxx National Park or in its vicinity, for example in xxx tourist centre (see map)?
About days or hours
xxx National ParkVisitor Survey 20xx – 20xx
3. If you stayed overnight or will stay overnight …(if not applicable, please move on to question 4)
a. in the xxx National Park, how many nights did you spend or will you spend in
1 open wilder-ness hut nights
3 rental cabins nights
10 your own accommodation (lapp pole tent, tent etc) nights
2 reservable huts nights
99 elsewhere, (where)? nights
b. in the vicinity of xxx National Park, for example in tourist centre (see map), how many nights did you spend or will you spend in
5 a hotel nights 8 your own cottage nights
6 a rental cottage nights
9 a campervan or caravan nights
7 holiday club accommoda-tion nights
99 elsewhere, (where)?
nights
5. Example of a questionnaire

199
4. Which part of the xxx National Park did you visit / will you visit this time? (Select more than one alternative if applicable)
1 q xxx Nature Centre
2 q Isokuru
3 q Karhunjuomalampi
4 q xxx naturetrail
5 q Noitatunturi
6 q Huttuloma
7 q Luoston kohteet
99 q elsewhere, please specify?__________________
5a. Which means of transport did you use to travel from your home to the xxx National Park? (please write down all the means of transport you used)
1 q car
2 q car and trailer or mobile home
3 q public transport (bus) 5 q train
4 q charter coach (tour group) 6 q airplane
99 q other, please specify?____________________
5b. Which of the above means of transport did you use last?Write the number ‡ _________
6. During this visit to the xxx National Park, what is your group like?1 I’m alone q ‡ move on to question 8.2 The size of the group _______ persons
(including yourself) of which3 under 15 years of age? _______ persons4 Please give the years of birth
under 15 years (If all are almost of the same age, please give the most common year of birth)
_______ _____________ _____________ ______
5 Physically disabled? _______ persons
7. During this visit to the xxx National Park your group mainly consists of… (please choose the most appropriate alternative)
1 m members of own family2 m other relatives3 m friends4 m co-workers5 m school class6 m kindergarten children7 m student group8 m senior citizens9 m clients of an enterprise offering organised
programmes of activities10 m club, association, etc.99 m others (what?)__________________________
8. What was or is important to you during this visit to the xxx National Park? (please respond to each alternative)(5 = very important, 4 = fairly important, 3 =neither, 2 = of little importance, 1 = not important at all)
very not importantimportant 5 4 3 2 1 at all
1 nature experiences m m m m m2 scenery m m m m m 3 being on my own m m m m m 4 mental well-being m m m m m 5 getting away from noise and
pollution m m m m m 6 relaxation m m m m m 7 meeting new people m m m m m 8 being together with own group m m m m m 9 pleasant old memories m m m m m
10 getting to know the area m m m m m 11 learning about nature m m m m m 12 improving my own skills m m m m m 13 keeping fit m m m m m 14 experiencing excitement m m m m m
9a. What did you do or intend to do at the xxx National Park during this visit? (please select all that apply)1 q walking 11 q picking mushrooms 21 q cross-country skiing on tracks2 q nordic walking 12 q studying plants 24 q downhill skiing 3 q jogging 13 q education-related visit 27 q snowshoeing4 q hiking 14 q visiting nature centre 32 q dogsledding5 q observing nature 15 q nature photographing 33 q reindeer safaris6 q picknicking 16 q scouting 34 q hiking (staying overnight in nature)7 q bicycling 17 q school camp 35 q horse trekking8 q fishing 18 q walking with a dog 36 q hunting 9 q bird watching 19 q orienteering 64 q canoeing
10 q picking wild berries 20 q hiking (overnight camping in the great outdoors)
999 q other, please specify?____________
9b. Which of the alternatives that you selected was or is the most important to you during this visit? Number ‡ [ ____ ]

200
10a. What did you think about the quality and the quantity of the services, facilities and environment during your current visit to the xxx National Park? Please answer each question and estimate the quality of the services or facilities that you used during your visit. If you did not use the service or facility this time, just cross the alternative ”did not use”. Please always evaluate the quantity of services and facilities.Quality assessment scale 5 = very good , 4 = fairly good, 3 = neither, 2 = fairly poor, 1 = very poor Quantity assessment scale 3 = too many, 2 = suitable, 1 = too few, or no opinion
Quality of the environment and of the service and facility I used
The current quantity of services and facilities
very very good 5 4 3 2 1 poor
did not use
too too many 3 2 1 few
no opinion
1 parking places m m m m m m m m m m 2 road network m m m m m m m m m m
3 signposts on the routes m m m m m m m m m m
4 trail and/or skiing track network m m m m m m m m m m
5 signposts at the trails and/or skiing tracks m m m m m m m m m m
6 campfire sites and lean-tos m m m m m m m m m m
7 firewood in cabins and at maintained campfire places m m m m m m m m m m
8 public latrines m m m m m m m m m m
9 realization and guidance of the waste disposal m m m m m m m m m m
10 paying attention to special needs of the disabled (accessibility of routes, safety, signposts/infor-mation boards etc.) m m m m m m m m m m
lines 11-15 optional, area-specific questions m m m m m m m m m m
m m m m m m m m m m
m m m m m m m m m m
m m m m m m m m m m
m m m m m m m m m m
50 services provided by enterprises (for example cafes and organised activities) m m m m m m m m m m
51 safety of the routes and structures m m m m m m
52 general safety m m m m m m
53 general cleanliness m m m m m m
54 variability of landscapes m m m m m m
99 other (what?) ________________________ m m m m m m m m m m
10b. How satisfied are you with the quantity of services and facilities in the xxx National Park as a whole? (5 = very satisfied, 4 = rather satisfied, 3 = neither one nor the other 2= rather unsatisfied, 1= very unsatisfied)
5 4 3 2 1 very satisfied m m m m m very unsatisfied
11. Did this visit to the xxx National Park come up to your expectations as regards the following?(5 = very well, 4 = fairly well, 3 = neither, 2 = fairly poorly, 1 = very poorly) very very well 5 4 3 2 1 poorly
1 natural environment m m m m m
2 opportunities for outdoor activities m m m m m
3 routes and facilities m m m m m
12. On this trip, is the xxx National Park … 1 m your trip´s only or the most important destination?2 m one among other intended destinations?
Other destinations are:
____________________________________
3 m a non-planned destination along your route? Main destination(s) is/are:
____________________________________
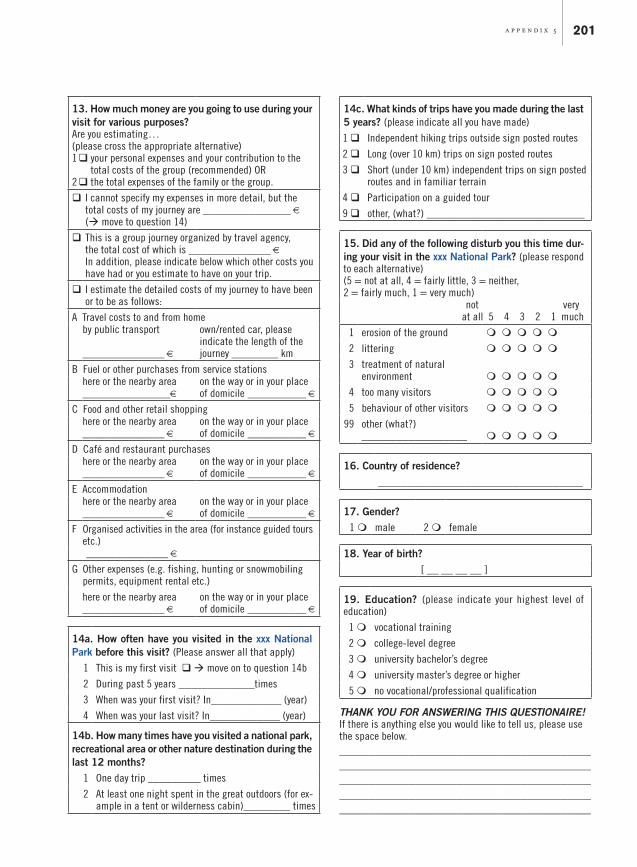
201
13. How much money are you going to use during your visit for various purposes?Are you estimating… (please cross the appropriate alternative)1 q your personal expenses and your contribution to the
total costs of the group (recommended) OR 2 q the total expenses of the family or the group.
q I cannot specify my expenses in more detail, but the total costs of my journey are _______________ € (‡ move to question 14)
q This is a group journey organized by travel agency,the total cost of which is ______________ €In addition, please indicate below which other costs you have had or you estimate to have on your trip.
q I estimate the detailed costs of my journey to have been or to be as follows:
A Travel costs to and from homeby public transport
______________ €
own/rented car, please indicate the length of the journey ________ km
B Fuel or other purchases from service stationshere or the nearby area_______________€
on the way or in your place of domicile __________ €
C Food and other retail shoppinghere or the nearby area______________ €
on the way or in your place of domicile __________ €
D Café and restaurant purchaseshere or the nearby area______________ €
on the way or in your place of domicile __________ €
E Accommodationhere or the nearby area______________ €
on the way or in your place of domicile __________ €
F Organised activities in the area (for instance guided tours etc.)______________ €
G Other expenses (e.g. fishing, hunting or snowmobiling permits, equipment rental etc.)
here or the nearby area______________ €
on the way or in your place of domicile __________ €
14a. How often have you visited in the xxx National Park before this visit? (Please answer all that apply)
1 This is my first visit q ‡ move on to question 14b
2 During past 5 years _____________times
3 When was your first visit? In____________ (year)
4 When was your last visit? In____________ (year)
14b. How many times have you visited a national park, recreational area or other nature destination during the last 12 months?
1 One day trip _________ times
2 At least one night spent in the great outdoors (for ex-ample in a tent or wilderness cabin)________ times
14c. What kinds of trips have you made during the last 5 years? (please indicate all you have made)
1 q Independent hiking trips outside sign posted routes
2 q Long (over 10 km) trips on sign posted routes
3 q Short (under 10 km) independent trips on sign posted routes and in familiar terrain
4 q Participation on a guided tour
9 q other, (what?) ___________________________
15. Did any of the following disturb you this time dur-ing your visit in the xxx National Park? (please respond to each alternative) (5 = not at all, 4 = fairly little, 3 = neither, 2 = fairly much, 1 = very much) not very at all 5 4 3 2 1 much
1 erosion of the ground m m m m m
2 littering m m m m m
3 treatment of natural environment m m m m m
4 too many visitors m m m m m
5 behaviour of other visitors m m m m m
99 other (what?)__________________ m m m m m
16. Country of residence?___________________________________
17. Gender?1 m male 2 m female
18. Year of birth?[ __ __ __ __ ]
19. Education? (please indicate your highest level of education)
1 m vocational training
2 m college-level degree
3 m university bachelor’s degree
4 m university master’s degree or higher
5 m no vocational/professional qualification
THANK YOU FOR ANSWERING THIS QUESTIONAIRE!If there is anything else you would like to tell us, please use the space below._______________________________________________________________________________________________________________________________________________________________________________________________________________________

6. Estimates of resources needed for
202
Estimates of resources needed for implementing a survey
Initial planning phases
Tasks: Determination of essential visitor informationChoosing the survey methodMapping out the necessary resources
Worker: Person in charge of the visitor surveyFor assistance he or she may use other persons responsible for the area’s management and use.
Time needed: 1–3 days
Explanation: The time consumed by planning depends on how good a preconception exists of how the visitor survey will be carried out. If visitor surveys have been performed previously at the area, this phase will be quick.
Planning the data collection
Tasks: Choosing the sampling method (onsite guided surveys) or method of obtaining contact information (postal and internet surveys)Determining the size of the samplePreparing a schedule for the surveyTraining the personnel
Worker: Person in charge of the visitor surveyFor assistance he or she may use other persons responsible for the area’s management and use.
Time needed: 3–5 days
Explanation: Plans related to sampling and the sample’s size are largely influenced by how well the number and structure of visitors are clear beforehand. Drafting the survey schedule and training the personnel will in any event consume a few days, since the entire visi-tor survey process should be made very clear to all those participating in it. From the standpoint of motivation, it is best if all the participants know why the visitor information is being collected. In addition, practical arrangements must be agreed upon, so that everyone knows how to act in various situations. If the data is to be collected onsite, the data collection points need to be checked in the field, too, with those participating in the collection process. As necessary, the locations should be prepared, for example by constructing shelters to keep out the rain. If the contact information is to be obtained in one way or another out in the field, the arrangements for that need to be made, aiming at minimising sources of error.

203
Questionnaire
Tasks: Planning TestingProduction and copying
Worker: Person in charge of the visitor survey Many people may be involved in the testing phase.
Time needed: 3–5 days
Explanation: If the model questions (Appendix 4) and the example of a questionnaire (Appendix 5) are used as an aid, designing the questionnaire form will be easy and fast: it may be possible to clarify the design of the form within a few days, since the questions in the appendices have been thoroughly prepared and tested. Regardless of everything, the form should be read by at least a few other people before it is finalised and copied. A few days have to be reserved for copying, especially if it is outsourced.
N.B.!If preparation of the form starts from point zero, without benefit of aids or any advance knowledge of the matter, getting the form ready can easily take 2–3 weeks.
Collecting the visitor data
Tasks: Collecting visitor data
Worker: 1. Onsite guided surveys:1–2 data collectorsThe area’s personnel (guides and maintenance workers, for example) can participate in gathering the data, in addition to their own duties. The data collectors may also be seasonal workers or students.2. Postal surveys:1–2 data collectors3. Internet surveys1 data collector to observe the response rate and to coordinate the sending of follow-up reminders.
Time needed: 1. Onsite guided surveys: About 40 data collection days (for gathering a minimum of 300–500 observations – de-pending on the visitation of the area)The data collection days should be distributed so as to cover the entire data collection period (3 or 12 months, for example) and to represent weekdays, weekends, etc.2. Postal surveys:Approximately 10 days for 1000 mailings with two reminders.
Explanation: 1. Onsite guided surveys: The number of visitors at the data collection point has a decisive impact on how many observations are obtained in a day, so that it is impossible to give a very clear estimate as to the number of data collection days. Often about 2–5 observations per hour is a fairly normal number. In this case, for instance, some 8–20 returned questionnaires can be obtained in the course of 4–5 hours of gathering – de-pending on whether the visitors fill in the forms independently or are interviewed. If the size of the sample is increased, the number of collection days must also be increased. On collection days, the data collectors should be released from other tasks. It is also useful if the person in charge of the survey takes part in the data collection, at least at the beginning, to “get a feel for it”.2. Postal surveys: The work includes collecting addresses, preparing envelopes, mail-outs, reminders and survey diary.

204
Data entry
Tasks: Entering the visitor data from the forms into a computer.
Worker: 1 data entererThe data enterer can perform the entry work in addition to his or her own job, or tempo-rary personnel can be specially engaged for the task.
Time needed: 5 days (to enter about 300 forms – depending on the length of the form)
Explanation: Recording the information on a ready-to-go entry form takes about 5 minutes per form, so that in an hour one can in principle record responses from 12 forms. Entering 300 forms thus takes about 25 hours. In practice, the task takes one person at least one work week. The data entry can also be performed gradually, as the collection of material progresses. The individual’s level of experience has a major impact on the speed of the entry work. More important than speed, however, is the proper entry of the data. In spite of every-thing, typographical errors always sneak in. The worker should be able to correct them as accurately as possible.
Processing and analysing the data
Tasks: Processing the visitor data and computing and analysing the results
Worker: Person in charge of the visitor survey He or she may use other experts for assistance.
Time needed: 3–5 days
Explanation: Once they have been entered, the data must always be checked, and corrections made as needed. The computer software available and experience of the analyser will have a marked impact on the time required for processing and analysing the material.
Reporting the results
Tasks: Editing the visitor information and presenting it in the form of a readable (understandable) report.
Worker: Person in charge of the visitor survey
Time needed: 10 days (at least).
Explanation: Transferring the results to a report form and writing the report generally take at least a few weeks. The time requirement depends on experience and on how detailed the report is.
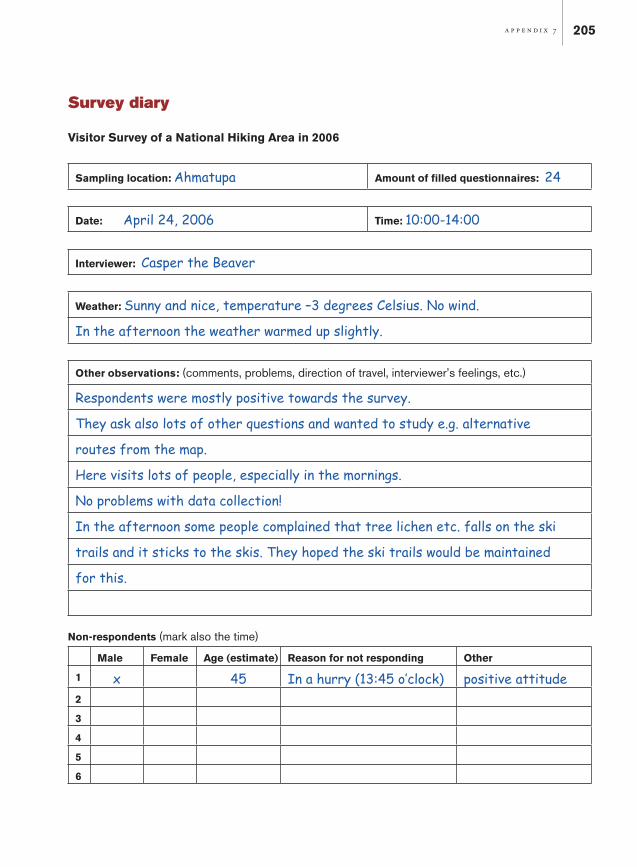
7. Survey diary
205
Survey diary
Visitor Survey of a National Hiking Area in 2006
Sampling location: Ahmatupa Amount of filled questionnaires: 24
Date: April 24, 2006 Time: 10:00-14:00
Interviewer: Casper the Beaver
Weather: Sunny and nice, temperature –3 degrees Celsius. No wind.
In the afternoon the weather warmed up slightly.
Other observations: (comments, problems, direction of travel, interviewer’s feelings, etc.)
Respondents were mostly positive towards the survey.
They ask also lots of other questions and wanted to study e.g. alternative
routes from the map.
Here visits lots of people, especially in the mornings.
No problems with data collection!
In the afternoon some people complained that tree lichen etc. falls on the ski
trails and it sticks to the skis. They hoped the ski trails would be maintained
for this.
Non-respondents (mark also the time)
Male Female Age (estimate) Reason for not responding Other
1 x 45 In a hurry (13:45 o’clock) positive attitude2
3
4
5
6
The importance of nature tourism and outdoor rec-reation is increasing in the Nordic and Baltic countries. Information on visitors to nature areas is needed for managing outdoor recreation to ensure quality recreation
experiences, tourism development, the promotion of public health and well-being, and the efficient protection of nature and cultural heritage in a sustainable way. The purpose of this manual is to provide managers with methods, tools and ideas for learning more about outdoor rec-reationists and their use of nature areas. The main focus is on practical matters: how to carry out visitor counting and visitor surveys, how to report the results and how to make use of the information obtained. The manual includes guidelines, recom-mendations and examples on visitor monitoring methodologies applicable to nature areas in the Nordic and Baltic countries. The manual has been produced by a group of specialists on visitor monitoring methodologies in nature areas, and it repre-sents an effort to put harmonised methods into practice in the Nordic and Baltic countries. It is a first step towards obtaining uniform visitor monitoring information, creating a common basis for statistics and databases in this part of the world.
ISBN 91-620-1258-4
,!7IJ1G2-abcfii!