Vision Research 41
15
Vision Research 41 (2001) 1023 – 1037 Dynamics of contour integration Robert F. Hess *, William H.A. Beaudot, Kathy T. Mullen Department of Ophthalmology, McGill Vision Research, McGill Uni6ersity, 687 Pine A6enue West (H4 -14), Montre ´al, Que ´bec, Canada H3A 1A1 Received 3 May 2000; received in revised form 6 October 2000 Abstract To determine the dynamics of contour integration the temporal properties of the individual contour elements were varied as well as those of the contour they form. A temporal version of a contour integration paradigm (Field, D. J., Hayes, A., & Hess, R. F. (1993) Vision Research, 33, 173–193) was used to assess these two temporal dynamics as a function of the contrast of individual elements and the curvature of the contour. The results show that the dynamics of contour integration are good when the contrast of the individual elements is modulated in time (10–30 Hz), but are poor when contour linking per se is temporally modulated (1–12 Hz). The dynamics of contour linking is not dependent on the absolute contrast of the linking elements, so long as they are visible, but does vary with the curvature of the contour. For straight contours, temporal resolution is around 6–12 Hz but falls to around 1–2 Hz for curved contours. © 2001 Elsevier Science Ltd. All rights reserved. Keywords: Contour integration; Temporal sensitivity; Dynamics; Curvature; Contrast www.elsevier.com/locate/visres 1. Introduction There is a growing awareness of the importance of network interactions within the visual cortex as op- posed to the purely local properties of the classical receptive field. This is especially true for the integration of visual contours for which the concept of an ‘associa- tion field’ has been developed in an attempt to define the functional nature of the underlying lateral interac- tions (Field, Hayes, & Hess, 1993). According to this psychophysical approach, extended contours composed of elements that are co-oriented and co-aligned are most detectable, following the Gestalt rule of good continuation (for review see Kovacs, 1996; Hess & Field, 1999). Anatomical and physiological support for the psychophysically defined association field comes from a number of studies (e.g. Rockland & Lund, 1982; Gilbert & Wiesel, 1983; Malach, Amir, Harel, & Grin- vald, 1993; Bosking, Zhang, Schofield, & Fitzpatrick, 1997) that delineate how cells within ocular dominance columns are interconnected across disparate regions of cortex through long-range connections. There is now neurophysiological evidence that these network interac- tions are context-dependent (e.g. Lamme, Super, & Spekreijse, 1998), which in turn suggests that the saliency of a stimulus can be modulated according to its global properties (Fregnac, Bringuier, Chavane, Glaeser, & Lorenceau, 1996; Gilbert, Das, Ito, Kapa- dia, & Westheimer, 1996; Toth, Rao, Kim, Somers, & Sur, 1996; Gilbert, 1997; Kapadia, Westheimer, & Gilbert, 1999; Lorenceau & Zago, 1999; Pettet, 1999; Polat, 1999). Recent experiments on figure-ground seg- regation, an area closely related to contour integration, suggest that intra- as well as extra-cortical feedback circuits are involved in these network interactions (Burkhalter, 1993; Gilbert, 1996, 1998; Hupe ´, James, Payne, Lomber, Girard, & Bullier, 1998; Lamme et al., 1998). A great deal is known about the spatial properties of this network interaction from psychophysical studies (for review see: Kovacs, 1996; Hess & Field, 1999), however, very little is known about the temporal prop- erties or dynamics involved in the orientation linking of extended contours. The little we know relates to the importance of temporal synchrony between path and background elements (Usher & Donnelly, 1998; Beau- This work was initially reported to the 2000 Meeting of the Association for Research in Vision and Ophthalmology, Fort Laud- erdale, FL, USA (IOVS 41/4, S441). * Corresponding author. Tel.: +1-514-8421231, ext. 4815; fax: +1-514-8431691. E-mail address: [email protected] (R.F. Hess). 0042-6989/01/$ - see front matter © 2001 Elsevier Science Ltd. All rights reserved. PII: S0042-6989(01)00020-7
Transcript of Vision Research 41

Vision Research 41 (2001) 1023–1037
Dynamics of contour integration�
Robert F. Hess *, William H.A. Beaudot, Kathy T. MullenDepartment of Ophthalmology, McGill Vision Research, McGill Uni6ersity, 687 Pine A6enue West (H4-14), Montreal, Quebec, Canada H3A 1A1
Received 3 May 2000; received in revised form 6 October 2000
Abstract
To determine the dynamics of contour integration the temporal properties of the individual contour elements were varied aswell as those of the contour they form. A temporal version of a contour integration paradigm (Field, D. J., Hayes, A., & Hess,R. F. (1993) Vision Research, 33, 173–193) was used to assess these two temporal dynamics as a function of the contrast ofindividual elements and the curvature of the contour. The results show that the dynamics of contour integration are good whenthe contrast of the individual elements is modulated in time (10–30 Hz), but are poor when contour linking per se is temporallymodulated (1–12 Hz). The dynamics of contour linking is not dependent on the absolute contrast of the linking elements, so longas they are visible, but does vary with the curvature of the contour. For straight contours, temporal resolution is around 6–12Hz but falls to around 1–2 Hz for curved contours. © 2001 Elsevier Science Ltd. All rights reserved.
Keywords: Contour integration; Temporal sensitivity; Dynamics; Curvature; Contrast
www.elsevier.com/locate/visres
1. Introduction
There is a growing awareness of the importance ofnetwork interactions within the visual cortex as op-posed to the purely local properties of the classicalreceptive field. This is especially true for the integrationof visual contours for which the concept of an ‘associa-tion field’ has been developed in an attempt to definethe functional nature of the underlying lateral interac-tions (Field, Hayes, & Hess, 1993). According to thispsychophysical approach, extended contours composedof elements that are co-oriented and co-aligned aremost detectable, following the Gestalt rule of goodcontinuation (for review see Kovacs, 1996; Hess &Field, 1999). Anatomical and physiological support forthe psychophysically defined association field comesfrom a number of studies (e.g. Rockland & Lund, 1982;Gilbert & Wiesel, 1983; Malach, Amir, Harel, & Grin-vald, 1993; Bosking, Zhang, Schofield, & Fitzpatrick,1997) that delineate how cells within ocular dominance
columns are interconnected across disparate regions ofcortex through long-range connections. There is nowneurophysiological evidence that these network interac-tions are context-dependent (e.g. Lamme, Super, &Spekreijse, 1998), which in turn suggests that thesaliency of a stimulus can be modulated according to itsglobal properties (Fregnac, Bringuier, Chavane,Glaeser, & Lorenceau, 1996; Gilbert, Das, Ito, Kapa-dia, & Westheimer, 1996; Toth, Rao, Kim, Somers, &Sur, 1996; Gilbert, 1997; Kapadia, Westheimer, &Gilbert, 1999; Lorenceau & Zago, 1999; Pettet, 1999;Polat, 1999). Recent experiments on figure-ground seg-regation, an area closely related to contour integration,suggest that intra- as well as extra-cortical feedbackcircuits are involved in these network interactions(Burkhalter, 1993; Gilbert, 1996, 1998; Hupe, James,Payne, Lomber, Girard, & Bullier, 1998; Lamme et al.,1998).
A great deal is known about the spatial properties ofthis network interaction from psychophysical studies(for review see: Kovacs, 1996; Hess & Field, 1999),however, very little is known about the temporal prop-erties or dynamics involved in the orientation linking ofextended contours. The little we know relates to theimportance of temporal synchrony between path andbackground elements (Usher & Donnelly, 1998; Beau-
� This work was initially reported to the 2000 Meeting of theAssociation for Research in Vision and Ophthalmology, Fort Laud-erdale, FL, USA (IOVS 41/4, S441).
* Corresponding author. Tel.: +1-514-8421231, ext. 4815; fax:+1-514-8431691.
E-mail address: [email protected] (R.F. Hess).
0042-6989/01/$ - see front matter © 2001 Elsevier Science Ltd. All rights reserved.PII: S0042-6989(01)00020-7
R.F. Hess et al. / Vision Research 41 (2001) 1023–10371024
dot, forthcoming), the effect of the relative separationof path and background elements on processing time(Braun, 1999) and how reaction times depend on con-tour contrast, curvature and chromaticity (Beaudot &Mullen, forthcoming). Though these are important is-sues we still do not know for example whether theassociation field is dynamic or fixed or whether itsdynamics depends on the curvature, luminance con-trast or contrast polarity of the contour.
Furthermore, a knowledge of the dynamics of con-tour integration may bear upon whether a temporalcode is used to link the outputs of the neurons atearly stages of cortical processing. Consider two ex-treme examples of a temporal code for contour link-ing: temporal synchronization and temporalsequencing. According to the first hypothesis, forwhich there is evidence both for (Fahle, 1993; Blake& Yang, 1997; Alais, Blake, & Lee, 1998; Usher &Donnelly, 1998; Lee & Blake, 1999) and against(Golledge, Hilgetag, & Tovee, 1996; Kiper, Gegen-furtner, & Movshon, 1996; Hardcastle, 1997; Lamme& Spekreijse, 1998; Ziebell & Nothdurft, 1999), tem-poral oscillatory synchronization in the firing patternof individual cortical cells could be the substrate forperceptual binding (e.g. Singer & Gray, 1995), andconsequently for contour integration (Roelfsema &Singer, 1998; Yen & Finkel, 1998). Since the temporalresolution of this synchronization is high, in theGamma band (i.e. around 40 Hz), if only a few cy-cles are needed for this posited linking code, onewould expect that the temporal resolution of contourintegration as a whole to be high.
According to the temporal sequencing hypothesis,figure-ground discrimination requires feedback fromhigher visual areas (Burkhalter, 1993; Zipser, Lamme,& Schiller, 1996; Hupe et al., 1998; Lamme et al.,1998) as well as long-range lateral connections withinthe one cortical region (Gilbert & Wiesel, 1989;Atkinson & Braddick, 1992; Burkhalter, 1993; Gilbertet al., 1996; Lamme et al., 1998). As a possible conse-quence, different parts of the cellular spike train mayreflect different aspects of visual processing, with theearly part of the spike-train carrying the code forcontrast and the latter part, the code for contour/figure-ground (Lamme, 1995; Zipser et al., 1996).Such a mechanism would predict that the detection ofa contour per se, and more generally a ‘context-defined feature’, would have slower dynamics com-pared with the mainly feedforward effects, forexample, in the signaling of contrast (Richmond,Gawne, & Jin, 1997; Hess, Dakin, & Field, 1998;Lamme et al., 1998).
These issues point to the potential importance ofthe dynamics of contour integration about which weknow so little. To redress this, we have assessed thedynamics of contour integration by not only tempo-
rally varying the contrast of the elements constitutingthe contour as in previous, related, texture-segregationstudies, but also by temporally varying the linkingitself. The results show that the linking process isslow compared with the temporal properties for thedetection of the constituent elements, and that thedynamics of linking varies with contour curvature butnot with the contour contrast.
2. Methods
2.1. Stimuli
The stimuli were square patches (14×14°) ofpseudo-randomly distributed Gabor elements (Fig.1A, left panel). The subject’s task was to detect a‘path’ which consisted of a set of ten oriented Gaborelements aligned along a common contour, embeddedin the background of similar but randomly orientedGabor elements. Inspection of Fig. 1A reveals thatthe path in the example winds horizontally across thefigure. Gabor elements were used to limit the spatialbandwidth of the stimuli (Field et al., 1993; McIl-hagga & Mullen, 1996). The elements were odd sym-metric and defined by the equation:
g(x, y, u)
=c sin(2pf(x sin u+y cos u)) exp−�x2+y2
2s2
�(1)
where u is the element orientation in degrees, (x, y) isthe distance in degrees from the element center, and cis the contrast. The sinusoidal frequency ( f ) is 1.5cpd, and the space constant (s) is 0.17°.
A temporal 2AFC task was used to measure thesubject’s ability to detect the path, in which thechoice was between the path stimulus and a no-pathstimulus consisting only of randomly placed Gaborelements. The no-path stimulus was constructed withthe following algorithm; the stimulus area was dividedinto a 14×14 grid of equally sized cells (each 1°square) and a Gabor element of random orientationwas placed in each cell with the restriction that eachcell contained the center of only one Gabor element.This pseudo-random placement prevents clumping ofthe elements. Overlap of the elements was also pre-vented by restricting the placement of their centerswithin the cell. It was sometimes impossible to placea Gabor element in its cell because it would be tooclose to elements previously placed. This produced anempty cell, and no more than eight empty cells werepermitted in a display and the average number was 4.The average distance between neighboring Gabor ele-ments was 1.3°.
The path stimulus can be considered as two parts,the ten path elements themselves and the background

R.F. Hess et al. / Vision Research 41 (2001) 1023–1037 1025
Fig. 1.

R.F. Hess et al. / Vision Research 41 (2001) 1023–10371026
Fig
.1.
(Con
tinu
ed)

R.F. Hess et al. / Vision Research 41 (2001) 1023–1037 1027
Fig. 2. Effect of contrast and curvature on path detection as a function of stimulus duration in the non-masked condition. Each data pointrepresents performance averaged across the three subjects. Each subject performs one or two sessions of 50 trials per data point. Error bars denoteS.D.
elements. A subset of path elements is shown in Fig.1A, right panel, and its construction is illustrated inthe inset. The path has a ‘backbone’ of ten invisibleline segments, and each line segment is randomly se-lected to be between 1.2 and 1.4° long. The shape ofthe backbone is controlled by the parameter a
(termed path curvature) which determines the angledifference between adjacent backbone elements.Higher values of a produce more curvature in the
path, and lower values produce straighter paths. Pri-marily to avoid the occurrence of straight paths whena is 0°, an orientation jitter (Da) uniformly dis-tributed between 910° was added to the path curva-ture. Gabor elements were placed in the middle ofeach backbone segment with the same orientation. b
gives the orientation of the Gabor element with re-spect to the backbone element. b is zero in experi-ments presented in this paper. Finally, to avoid
Fig. 1. (A) Left panel : An example of the stimulus. The ‘path’ is difficult to detect when embedded in a background of similar but randomlyoriented elements. Experienced subjects perform at around 65–75% correct under a steady presentation of 500 ms. Right panel. The path is shownseparated from the background elements. It is a chain of ten Gabor elements which vary systematically in their orientation, as described in theinset. Inset: The path is made up of ten backbone line segments. The orientation difference between each successive line segment is given by theangle a which in this case is 930°. a determines the path curvature. Da is a small orientation jitter added to a and is uniformly distributedbetween 910°. b gives the orientation of the Gabor element with respect to the backbone element. b is zero in experiments presented in thispaper. (B) Sequence of stimuli presented in a trial of the masked condition in the first group of experiments, and repeated cyclically in the secondgroup of experiments. Forward mask and backward mask are identical, and built from the orientation randomization of each Gabor elementcomposing the test stimulus. Extremities of the 20° path are denoted by white arrows in the test stimulus. (C) Example of stimuli sequencepresented in a path interval of the orientation modulation experiment. A stimulus cycle is composed of a test stimulus and its associatedorientation mask presented for the same duration (in this particular example we used the stimuli shown in B). This stimulus cycle is repeated overone second, and the contrast of the whole stimulus is modulated by a centred Gaussian window. (D) Examples of stimuli presented in a pathinterval of the contrast modulation experiment. In both in-phase and anti-phase conditions, a stimulus cycle is composed of a test stimulus andits contrast-reversed counterpart. The whole stimulus is built identically to the one of the orientation modulation experiment: cyclic presentationover 1 sec with a Gaussian contrast modulation. Arrows indicate extremities of the 20° paths.

R.F. Hess et al. / Vision Research 41 (2001) 1023–10371028
random closure of the paths with a high curvature,which can affect detection (Elder & Zucker, 1993; Ko-vacs & Julesz, 1993), paths which looped back onthemselves were discarded and new ones generated. Theentire path was pasted into the display at a randomlocation, making sure that the centers of the Gaborelements occupied different cells, and that at least onepath element passed through the central region of thestimulus (defined as a circular region 3° in diameter).The remaining empty cells were filled with randomlyoriented Gabor elements, as in the no-path stimulus.
Various control measurements ensured that no spuri-ous cues could be used for path detection. In particularit was ascertained that the presence of the path does notaffect the local densities of the elements since theaveraged distance between path elements and betweenbackground elements is the same and the number ofempty neighboring cells are the same for both path andbackground elements. Furthermore, the number ofempty cells is the same for both path and no-pathstimuli indicating no global density changes. If neitherdensity nor proximity are cues, path visibility should be
due only to the alignment of the elements of the pathsince nothing else distinguishes path element frombackground element. This was confirmed in a controlexperiment in which the orientation of the path ele-ments was randomized. The path could not be detectedunder extended viewing regardless of the curvature. Thecontinuity in the local orientation across space is then acrucial feature for path detection.
2.2. Apparatus and calibrations
Stimuli were displayed on a Sony Trinitron monitordriven by a VSG 2/4 graphics board (Cambridge Re-search Systems) with 15 bits contrast resolution, housedin a Pentium PC computer. The frame rate of thedisplay was 76 Hz. The monitor was gamma correctedin software with lookup tables using luminance mea-surements obtained from a United Detector Technol-ogy Optometer (UDT S370) fitted with a 265photometric sensor. The monitor was viewed in a dimlylit room. The mean luminance of the display was 14.2cd/m2. The stimuli were viewed at 60cm, and subtendeda constant area of 14×14°.
Fig. 3. Effect of curvature and contrast on path detection as a function of stimulus duration in the orientation-masked condition. Data shownfor one subject (WB), the other two subjects show similar results. Each subject performs one or two sessions of 50 trials per data point. Filledand open symbols represent performance measurement (% correct). Solid lines denote fits to Eq. (2) to each data set.
R.F. Hess et al. / Vision Research 41 (2001) 1023–1037 1029
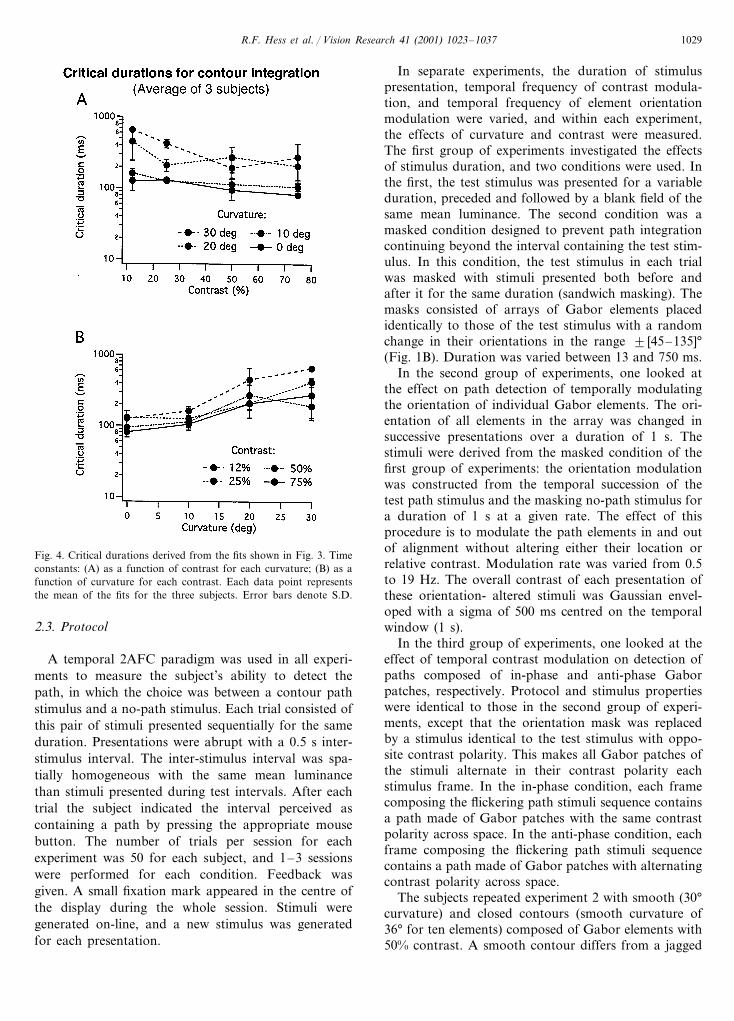
Fig. 4. Critical durations derived from the fits shown in Fig. 3. Timeconstants: (A) as a function of contrast for each curvature; (B) as afunction of curvature for each contrast. Each data point representsthe mean of the fits for the three subjects. Error bars denote S.D.
In separate experiments, the duration of stimuluspresentation, temporal frequency of contrast modula-tion, and temporal frequency of element orientationmodulation were varied, and within each experiment,the effects of curvature and contrast were measured.The first group of experiments investigated the effectsof stimulus duration, and two conditions were used. Inthe first, the test stimulus was presented for a variableduration, preceded and followed by a blank field of thesame mean luminance. The second condition was amasked condition designed to prevent path integrationcontinuing beyond the interval containing the test stim-ulus. In this condition, the test stimulus in each trialwas masked with stimuli presented both before andafter it for the same duration (sandwich masking). Themasks consisted of arrays of Gabor elements placedidentically to those of the test stimulus with a randomchange in their orientations in the range 9 [45–135]°(Fig. 1B). Duration was varied between 13 and 750 ms.
In the second group of experiments, one looked atthe effect on path detection of temporally modulatingthe orientation of individual Gabor elements. The ori-entation of all elements in the array was changed insuccessive presentations over a duration of 1 s. Thestimuli were derived from the masked condition of thefirst group of experiments: the orientation modulationwas constructed from the temporal succession of thetest path stimulus and the masking no-path stimulus fora duration of 1 s at a given rate. The effect of thisprocedure is to modulate the path elements in and outof alignment without altering either their location orrelative contrast. Modulation rate was varied from 0.5to 19 Hz. The overall contrast of each presentation ofthese orientation- altered stimuli was Gaussian envel-oped with a sigma of 500 ms centred on the temporalwindow (1 s).
In the third group of experiments, one looked at theeffect of temporal contrast modulation on detection ofpaths composed of in-phase and anti-phase Gaborpatches, respectively. Protocol and stimulus propertieswere identical to those in the second group of experi-ments, except that the orientation mask was replacedby a stimulus identical to the test stimulus with oppo-site contrast polarity. This makes all Gabor patches ofthe stimuli alternate in their contrast polarity eachstimulus frame. In the in-phase condition, each framecomposing the flickering path stimuli sequence containsa path made of Gabor patches with the same contrastpolarity across space. In the anti-phase condition, eachframe composing the flickering path stimuli sequencecontains a path made of Gabor patches with alternatingcontrast polarity across space.
The subjects repeated experiment 2 with smooth (30°curvature) and closed contours (smooth curvature of36° for ten elements) composed of Gabor elements with50% contrast. A smooth contour differs from a jagged
2.3. Protocol
A temporal 2AFC paradigm was used in all experi-ments to measure the subject’s ability to detect thepath, in which the choice was between a contour pathstimulus and a no-path stimulus. Each trial consisted ofthis pair of stimuli presented sequentially for the sameduration. Presentations were abrupt with a 0.5 s inter-stimulus interval. The inter-stimulus interval was spa-tially homogeneous with the same mean luminancethan stimuli presented during test intervals. After eachtrial the subject indicated the interval perceived ascontaining a path by pressing the appropriate mousebutton. The number of trials per session for eachexperiment was 50 for each subject, and 1–3 sessionswere performed for each condition. Feedback wasgiven. A small fixation mark appeared in the centre ofthe display during the whole session. Stimuli weregenerated on-line, and a new stimulus was generatedfor each presentation.

R.F. Hess et al. / Vision Research 41 (2001) 1023–10371030
one in that the angle between individual elements alongthe contour is of the same sign.
2.4. Obser6ers
The observers were the three authors (WB, RFH &KTM). All have normal, or refracted to normal vision.All experiments were done under binocular conditions.
3. Results
3.1. The roles of contrast and cur6ature on criticalduration
In the first experiment the dynamics of contour inte-gration were investigated by varying the time the stimu-lus was presented. This was done with and without apost stimulus mask to ensure that visual processing waslimited to the interval during which the stimulus waspresented. Thus the combined effects of the duration ofstimulus presentation, contrast, and path curvature inlimiting contour integration in the masked and un-masked conditions were measured. Path detection wasmeasured over a range of durations (13–250 ms with-out mask, 13–750 ms with mask), contrasts (supra-threshold range, 12–75%), and path curvatures(0–30°). Results are shown in Figs. 2 and 3 by datapoints, solid curves in Fig. 3 denote fits as describedbelow. Each curve represents performance on pathdetection as a function of duration for different con-trasts and curvatures.
Data for the non-masked condition (Fig. 2) is aver-aged across the three subjects. It shows that, apart froman initial steep rise at the shortest duration (13 ms),performance is almost constant with duration (exceptfor the lowest contrast 12% which is more dependenton duration). However the overall level of this asymp-totic performance decreases progressively with the cur-vature of the contour. Friedman’s two-way ANOVAsof asymptotic performance levels (data accumulatedacross duration because duration has no influence onperformance, except for the lowest contrast) for bothcontrast and curvature conditions confirm that there isno significant difference in performance between thethree suprathreshold contrast conditions (25, 50 &75%),and that the loss of asymptotic performance with cur-vature is significant (X2
F=82.456, df=3, PB0.0001,N=45), following previous studies (Field et al., 1993;Mullen, Beaudot, & McIlhagga, 2000). This first exper-iment demonstrates that contour integration can beeffectively performed even for the shortest duration (13ms) and that these fast dynamics do not appear todepend on the curvature of the contour.
Results for the masked condition are shown in Fig. 3;representative data for only one of the three subjectstested is shown. There is a shallower initial dependenceon stimulus duration than in the unmasked condition.These curves also show that the asymptotic level andthe steepness of the initial dependence on durationdecrease with curvature. To derive a critical duration(i.e. a time constant), we fitted the data of Fig. 3(performance as a function of duration at each pathcurvature and each contrast) with Weibull functionscorrected to take the differing asymptotic performancelevels into account:
Fig. 5. Effect of curvature and contrast on path detection as a function of stimulus temporal frequency in the temporal orientation modulationexperiment. Data shown for one subject (WB), other subjects show similar results. Each subject performs one to three sessions of 50 trials per datapoint. Filled and open symbols represent performance measurement (% correct). Solid lines denote fits to Eq. (3) for each data set.
R.F. Hess et al. / Vision Research 41 (2001) 1023–1037 1031
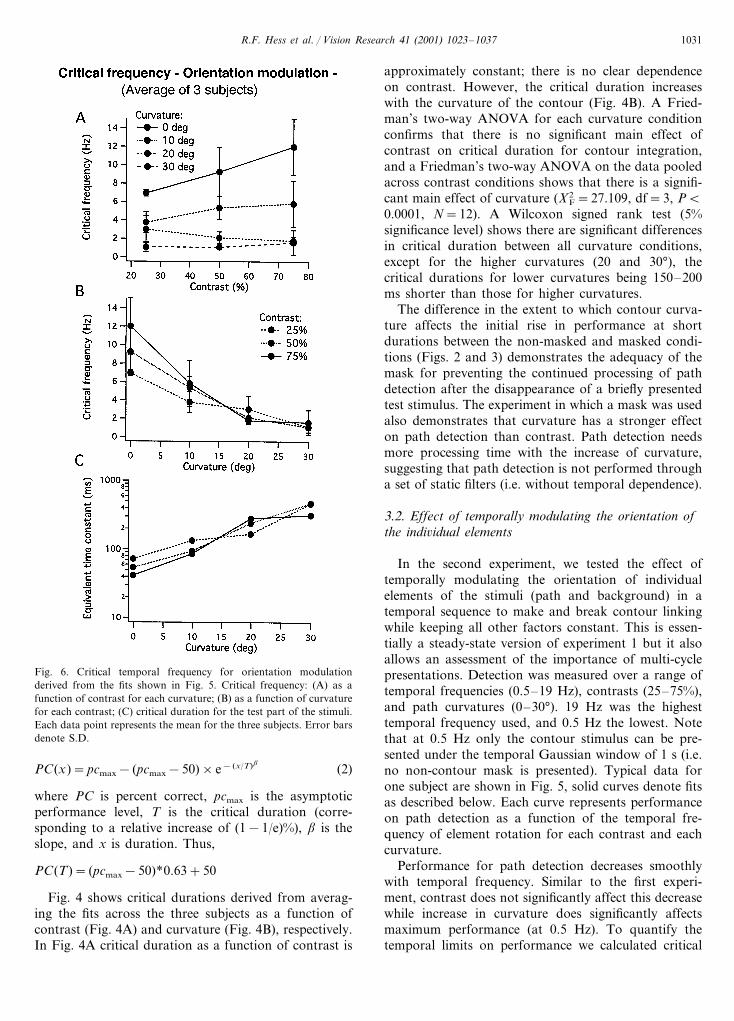
Fig. 6. Critical temporal frequency for orientation modulationderived from the fits shown in Fig. 5. Critical frequency: (A) as afunction of contrast for each curvature; (B) as a function of curvaturefor each contrast; (C) critical duration for the test part of the stimuli.Each data point represents the mean for the three subjects. Error barsdenote S.D.
approximately constant; there is no clear dependenceon contrast. However, the critical duration increaseswith the curvature of the contour (Fig. 4B). A Fried-man’s two-way ANOVA for each curvature conditionconfirms that there is no significant main effect ofcontrast on critical duration for contour integration,and a Friedman’s two-way ANOVA on the data pooledacross contrast conditions shows that there is a signifi-cant main effect of curvature (X2
F=27.109, df=3, PB0.0001, N=12). A Wilcoxon signed rank test (5%significance level) shows there are significant differencesin critical duration between all curvature conditions,except for the higher curvatures (20 and 30°), thecritical durations for lower curvatures being 150–200ms shorter than those for higher curvatures.
The difference in the extent to which contour curva-ture affects the initial rise in performance at shortdurations between the non-masked and masked condi-tions (Figs. 2 and 3) demonstrates the adequacy of themask for preventing the continued processing of pathdetection after the disappearance of a briefly presentedtest stimulus. The experiment in which a mask was usedalso demonstrates that curvature has a stronger effecton path detection than contrast. Path detection needsmore processing time with the increase of curvature,suggesting that path detection is not performed througha set of static filters (i.e. without temporal dependence).
3.2. Effect of temporally modulating the orientation ofthe indi6idual elements
In the second experiment, we tested the effect oftemporally modulating the orientation of individualelements of the stimuli (path and background) in atemporal sequence to make and break contour linkingwhile keeping all other factors constant. This is essen-tially a steady-state version of experiment 1 but it alsoallows an assessment of the importance of multi-cyclepresentations. Detection was measured over a range oftemporal frequencies (0.5–19 Hz), contrasts (25–75%),and path curvatures (0–30°). 19 Hz was the highesttemporal frequency used, and 0.5 Hz the lowest. Notethat at 0.5 Hz only the contour stimulus can be pre-sented under the temporal Gaussian window of 1 s (i.e.no non-contour mask is presented). Typical data forone subject are shown in Fig. 5, solid curves denote fitsas described below. Each curve represents performanceon path detection as a function of the temporal fre-quency of element rotation for each contrast and eachcurvature.
Performance for path detection decreases smoothlywith temporal frequency. Similar to the first experi-ment, contrast does not significantly affect this decreasewhile increase in curvature does significantly affectsmaximum performance (at 0.5 Hz). To quantify thetemporal limits on performance we calculated critical
PC(x)=pcmax− (pcmax−50)×e− (x/T)b
(2)
where PC is percent correct, pcmax is the asymptoticperformance level, T is the critical duration (corre-sponding to a relative increase of (1−1/e)%), b is theslope, and x is duration. Thus,
PC(T)= (pcmax−50)*0.63+50
Fig. 4 shows critical durations derived from averag-ing the fits across the three subjects as a function ofcontrast (Fig. 4A) and curvature (Fig. 4B), respectively.In Fig. 4A critical duration as a function of contrast is

R.F. Hess et al. / Vision Research 41 (2001) 1023–10371032
temporal frequencies for path detection by fitting thedata of Fig. 5 (performance as a function of temporalfrequency at each path curvature and each contrast)with a Weibull function corrected to take the differingasymptotic levels into account:
PC(x)=50+ (pcmax−50)×e− (x/F)b
(3)
where PC is percent correct, pcmax is the asymptoticperformance level, F is the critical frequency, b is theslope, and x is temporal frequency. The critical fre-quency (F) of this function is 1/e% of the asymptoticlevel relative to guess level, and it was corrected back to(1−1/e)% for comparison with experiment 1 with theformula: A=F. [− ln(1−e−1)]1/b.
Fig. 6A shows these critical frequencies derived fromaveraging the fits to the data of our three subjects as afunction of contrast. Contrast has little effect on thecritical frequency for orientation modulation in time.Fig. 6B shows critical frequencies as a function ofcurvature again averaged across the three subjects’data. The critical frequency for orientation modulationclearly declines with curvature. A Friedman’s two-wayANOVA for each curvature condition confirms thatthere is no significant main effect of contrast on critical
frequency of orientation modulation, and a Friedman’stwo-way ANOVA on the data pooled across contrastconditions confirms that there is a significant maineffect of curvature (X2
F=23.8, df=3, PB0.0001, N=9). A Wilcoxon signed rank test (5% significance level)shows there are significant differences between all cur-vature conditions, except between the two highest (20and 30°): critical frequency decreases steeply with cur-vature (from 9.593.5 Hz for straight paths) to reachan asymptotic level (1.290.9 Hz) around 30° of curva-ture. This result suggests that, similar to the criticalduration found for the masked condition in experiment1, critical temporal frequency for path detection is notfixed but depends on curvature. From these criticaltemporal frequencies one can also derive equivalenttime constants for the contour stimulus using therelation:
T=1/(2*F)
Fig. 6C shows the critical duration (derived from thecritical frequency averaged across subjects) for the con-tour stimulus as a function of curvature and at differentcontrasts: test critical duration increases smoothly withcurvature. Interestingly, the critical duration in the
Fig. 7. Effect of curvature and contrast on path detection as a function of stimulus temporal frequency in the temporal contrast modulationexperiment (in-phase condition). Data shown for one subject (WB), other subjects show similar results. Each subject performs one to three sessionsof 50 trials per data point. Filled and open symbols represent performance measurement (% correct). Solid lines denote fits to Eq. (3) for eachdata set.

R.F. Hess et al. / Vision Research 41 (2001) 1023–1037 1033
Fig. 8. Critical temporal frequencies for contrast modulation derivedfrom the fits shown in Fig. 7. Critical frequencies: (A) as a functionof curvature for each contrast; (B) as a function of contrast for eachcurvature. Each data point represents the mean for the three subjects.Error bars denote S.D.
elements comprising the path and background). Con-trast polarity alternated and the orientation of individ-ual elements remained constant. In order to delineatehow contrast is temporally and spatially integrated bythe linking process, performance was tested under twodifferent conditions: in one condition paths were com-posed of in-phase Gabor patches, and in another eachalternate path element was 180° out of phase bothspatially and temporally. In an identical manner toexperiment 2, path detection was measured over arange of temporal frequency (0.5–38 Hz), achromaticcone contrasts (25–75%), and path curvatures (0–30°).At 0.5 Hz only one stimulus frame is presented underthe temporal Gaussian window of 1 s (i.e. no contrastreversal). Representative results in the in-phase condi-tion for one of the three subjects tested are shown inFig. 7 by data points, solid curves denote fits as de-scribed below. Each curve represents performance ofpath detection as a function of temporal frequency foreach contrast and each curvature.
Below 10 Hz, performance reaches an asymptoticlevel whose magnitude depends on curvature but isrelatively independent of contrast. Regardless of eitherthe contrast or curvature, psychometric performancedecreases with temporal frequency above 10 Hz. Thismay be attributed either to the decrease of perceivedcontrast with the increase of temporal frequency or tothe temporal limitation of the linking process itself, orto both. These effects were quantified by fitting the dataof Fig. 7 with Eq. (3), previously used in experiment 2.Fig. 8A and B show critical frequencies (averaged fitsfor the three subjects) as a function of curvature andcontrast, respectively. A Friedman’s two-way ANOVAfor each contrast condition shows that there is nosignificant main effect of curvature on critical frequencyfor contrast modulation, and a Friedman’s two-wayANOVA on the data pooled across curvature condi-tions shows that there is a clear main effect of contrast(X2
F=18.943, df=3, P=0.0003, N=12). A Wilcoxonsigned rank test (5% significance level) shows there aresignificant differences between all contrast conditions,except for the higher contrasts (50 and 75%): criticalfrequency increases significantly with contrast from12.491.9 Hz at 12% to 25.592.5 Hz at 75%.
Contrary to experiment 2 in which critical frequen-cies for orientation modulation strongly depend oncurvature not contrast, here the critical frequencies arecontrast not curvature-dependent when contrast-rever-sal of individual elements is used. Critical frequency isnoticeably better (i.e. has a better time resolution) whenthe contrast rather than the orientation of individualelements is modulated.
Figs. 9 and 10 show the result in the anti-phasecondition for one subject WB and for two contrasts(50–75%). Critical frequency is relatively invariant withcurvature for both 75% and 50%, similar to the in-
steady-state, flickering condition are very similar tothose measured in experiment 1 (Fig. 4B, masked con-dition) and shown in Fig. 4B (50–400 ms depending oncurvature).
3.3. Effect of temporally modulating the contrast of theindi6idual elements
To gauge the extent to which the visibility of individ-ual Gabor elements limited performance in the preced-ing experiments, contour integration was measured fortemporally modulated (same spatial phase) Gabor ele-ments. In this experiment, we looked at the effect oftemporally modulating the contrast of the individualelements of our stimulus (i.e. contrast-reversal of all the

R.F. Hess et al. / Vision Research 41 (2001) 1023–10371034
Fig. 9. Effect of curvature and contrast on path detection as a function of stimulus temporal frequency in the temporal contrast modulationexperiment (anti-phase condition). The number of trials was 50–150 per data point (subject WB only). Filled and open symbols representperformance measurement (% correct). Solid lines denote fits to Eq. (3) for each data set.
phase condition (Fig. 8A). Change in contrast polarityalong the contour decreases asymptotic performance(compare Figs. 7 and 9), but does not affect signifi-cantly the critical frequency for contrast modulation(20–25 Hz). The effect of the change in contrast polar-ity along the path is consistent with that of previousstudies (McIlhagga & Mullen, 1996; Mullen et al., 2000;Field, Hayes, & Hess, 2000). Thus, change in contrastpolarity disrupts contour extraction but not its con-trast-dependent dynamics. This implies that the associa-tion field is more sensitive to the spatial phase than tothe temporal phase of contrast since spatial phase alter-nation disrupts the orientation linking more than doestemporal phase alternation. Consequently, the contrast-dependent dynamics reported in these experiments donot reflect the dynamics of contour integration as awhole but rather the dynamics associated with theprocessing of the individual elements comprising thecontour.
4. Discussion
The main finding is that there are dynamics to con-tour integration: contour integration is slower for morecurved contours (Exps 1 & 2). This is consistent with acurrent study showing a dependence of reaction timesfor contour processing on curvature (Beaudot & Mul-len, forthcoming & personal communication). The criti-cal frequency which is a measure of temporal acuitywas around 10 Hz for straight contours but onlyaround 1–2 Hz for curved contours (30° path angle),with a continuous change between these two extremes
(Exp 2). The contours that were used in the main studywere jagged ones but it has also been verified thatsmooth contours exhibited similar temporal dependen-cies (see Table 1). In agreement with Elder and Zucker(1993), who measured reaction times for detection oflocalized elements in a visual search paradigm, it wasfound that closed contours (smooth curvature of 36°for ten elements) are detected faster than open contourswith the same curvature by about a factor of 2 (Table1). It is interesting that this speed advantage for closedcontours was not reflected in a higher asymptotic per-formance (see Table 1) despite the fact that closed
Fig. 10. Critical temporal frequencies derived from the fits shown inFig. 9 as a function of curvature for each contrast (subject WB only).

R.F. Hess et al. / Vision Research 41 (2001) 1023–1037 1035
Table 1Summary measures from three subjects for jagged, smooth and closedcontoursa
Path Critical AsymptoticSubjectsfrequency level
0.720703Jagged (30°) 69.848RFH0.966041 81.839WB3.50782KTM 83.805
Mean9S.D. 1.73291.261 78.49796.1681.16089RFH 74Smooth (30°)3.19773 76.055WB0.890552KTM 84
Mean9S.D. 1.7591.03 78.01894.3121.32289RFH 81Closed (36°)
WB 5.93353 82.4494.73703 79KTM3.99891.953 80.81691.414Mean9S.D.
a The dynamics for closed contours is a factor of two better thanfor open ones, though their asymptotic levels are similar.
ken down by a mask disrupting the visual linking(orientation continuity). This suggests a mechanismthat is not highly reliant on iterative processing toachieve optimum performance. For example, this find-ing rules out the possibility that orientation linking isfollowed by a slow integration stage through which aniterative process could enhance performance when mul-tiple stimulus cycles are presented.
Two lines of evidence suggest there are two differentunderlying processes limiting performance on this con-tour detection paradigm, one involving the dynamicsassociated with the processing of the array elements perse, as assessed by modulating their contrast and an-other involving the dynamics associated with the detec-tion of the contour that they comprise, as assessed bymodulating element orientation. Firstly, the temporalresolution of element processing is high (20–30 Hz athigh contrasts) and does not depend on contour curva-ture (Exp 3), whereas the temporal resolution of con-tour processing is very low (2–12 Hz) and is stronglycurvature dependent (Exps 1 & 2). Secondly, the findingthat the critical frequency for detecting individual ele-ments is contrast dependent while the critical frequencyfor detecting the contour is not, suggests separate pro-cesses. The superior temporal resolution of elementdetection may represent the initial feedforward input tothe network that carries the code for contrast (Gawne,Kjaer, & Richmond, 1996; Richmond et al., 1997;Lamme et al., 1998; Hess et al., 1998), the slowertemporal resolution of contour detection, the outcomeof intra- and extra-cortical feedback processes whichcarry the code for contour detection independent of theabsolute level or relative polarity of the contrast of itsconstituents (Lamme, 1995; Zipser et al., 1996; Rich-mond et al., 1997; Hess et al., 1998; Lamme et al.,1998).
The results do not rule out the possibility that featurebinding is accomplished by synchronous oscillations(i.e. the hypothesis of Singer and colleagues). Investiga-tion of the temporal properties of neural oscillatorysynchronization in cat striate cortex (Gray, Engel,Konig, & Singer, 1992) showed that duration of syn-chrony is variable (100–900 ms) and that phase differ-ences and frequencies of synchronized events are alsovariable (93 ms, 40–60 Hz), suggesting a high degreeof dynamic variability and a rapid onset and offset ofsynchrony among interacting populations of neurons.However, if the synchronicity of cortical oscillationsdetermines feature binding in contour integration, thisprocess must require many temporal cycles to work (i.e.relatively slow dynamics) and for reasons yet unknownthis requirement must increase for more curvedcontours.
Current models of contour integration (Heitger,Rosenthaler, von der Heydt, Peterhans, & Kubler,1992; Williams & Jacobs, 1997; Li, 1998; Yen & Finkel,
contours are generally more detectable than open ones(Kovacs & Julesz, 1993; Pettet, McKee, & Grzywacz,1998; Braun, 1999).
The finding that curved contours take longer todetect than straight ones suggests two things. First, it isunlikely that contours of different curvature are eachdetected by dedicated detectors but rather in a flexibleand distributed population code. Second, the findingsuggests that path detection could result from a dy-namic process, intrinsically tuned to straight paths (cur-vature of 0°) and evolving temporally to a curvaturetuning matching the spatial properties of the path. Sucha process may depend on intra- and extra-corticalfeedback known to be important in contextual modula-tion and figure-ground segregation (Gilbert & Wiesel,1990; Burkhalter, 1993; Kapadia, Ito, Gilbert, & West-heimer, 1995; Sillito, Grieve, Jones, Cudeiro, & Davis,1995; Fregnac, Bringuier, & Chavane, 1996; Fregnac etal., 1996; Gilbert, 1996; Gilbert et al., 1996; Sillito &Jones, 1996; Toth et al., 1996; Adini, Sagi, & Tsodyks,1997; Levitt & Lund, 1997; Gilbert, 1998; Hupe et al.,1998; Lamme, Zipser & Spekreijse, 1998; Lamme et al.,1998; Das & Gilbert, 1999; Hess & Field, 1999; Kapa-dia et al., 1999; Polat, 1999).
The similarity in time constants between one-shotand multi-shot presentations (comparison of results forExps 1 & 2) of the same stimulus in which the orienta-tion of individual elements is cyclically varied suggeststhat repeated presentations (with a 500 ms Gaussianmodulation in a 1 s window) bring no improvementover a simple one-shot presentation. The mechanisminvolved in linking orientations across space must notbenefit from a repeated presentation of the same stimu-lus. Therefore, linking has to be a short-term process,with an integration time dependent on curvature, trig-gered by the stimulus presentation, and efficiently bro-
R.F. Hess et al. / Vision Research 41 (2001) 1023–10371036
1998; Grossberg, 1999; Li, 1999) have yet to incorpo-rate explicitly any dynamics.
Acknowledgements
This study was funded by grants from the MedicalResearch Council of Canada to K.T. Mullen (MT-10819) and R.F. Hess (MT-10818), and partially sup-ported by a fellowship from the Fyssen Foundation toW.H.A. Beaudot. We also acknowledge partial supportfrom the ‘Reseau FRSQ de Recherche en Sante de laVision’.
References
Adini, Y., Sagi, D., & Tsodyks, M. (1997). Excitatory-inhibitorynetwork in the visual cortex: psychophysical evidence. Proceedingsof the National Academy of Sciences of the United States ofAmerica, 94, 10426–10431.
Alais, D., Blake, R., & Lee, S. H. (1998). Visual features that varytogether over time group together over space. Natural Neuro-science, 1, 160–164.
Atkinson, J., & Braddick, O. (1992). Visual segmentation of orientedtextures by infants. Beha6ioural Brain Research, 49, 123–131.
Beaudot, W. H. A. (forthcoming). Role of onset asynchrony incontour integration.
Beaudot, W. H. A., & Mullen, K. T. M. (forthcoming). Processingtime of contour integration: The role of color, contrast andcurvature.
Blake, R., & Yang, Y. (1997). Spatial and temporal coherence inperceptual binding. Proceedings of the National Academy of Sci-ences of the United States of America, 94, 7115–7119.
Bosking, W. H., Zhang, Y., Schofield, B., & Fitzpatrick, D. (1997).Orientation selectivity and the arrangement of horizontal connec-tions in tree shrew striate cortex. Journal of Neuroscience, 17,2112–2127.
Braun, J. (1999). On the detection of salient contours. Spatial Vision,12, 211–225.
Burkhalter, A. (1993). Development of forward and feedback connec-tions between areas V1 and V2 of human visual cortex. CerebralCortex, 3, 476–487.
Das, A., & Gilbert, C. D. (1999). Topography of contextual modula-tions mediated by short-range interactions in primary visual cor-tex. Nature, 399, 655–661.
Elder, J., & Zucker, S. (1993). The effect of contour closure on therapid discrimination of two-dimensional shapes. Vision Research,33, 981–991.
Fahle, M. (1993). Figure-ground discrimination from temporal infor-mation. Proceedings of the Royal Society of London. Series B:Biological Sciences, 254, 199–203.
Field, D. J., Hayes, A., & Hess, R. F. (1993). Contour integration bythe human visual system: evidence for a local ‘association field’.Vision Research, 33, 173–193.
Field, D. J., Hayes, A., & Hess, R. F. (2000). The roles of polarityand symmetry in the perceptual grouping of contour fragments.Spatial Vision, 13, 51–66.
Fregnac, Y., Bringuier, V., & Chavane, F. (1996). Synaptic integra-tion fields and associative plasticity of visual cortical cells in vivo.Journal of Physiology Paris, 90, 367–372.
Fregnac, Y., Bringuier, V., Chavane, F., Glaeser, L., & Lorenceau, J.(1996). An intracellular study of space and time representation in
primary visual cortical receptive fields. Journal of PhysiologyParis, 90, 189–197.
Gawne, T. J., Kjaer, T. W., & Richmond, B. J. (1996). Latency:another potential code for feature binding in striate cortex. Jour-nal of Neurophysiology, 76, 1356–1360.
Gilbert, C. D. (1996). Plasticity in visual perception and physiology.Current Opinion in Neurobiology, 6, 269–274.
Gilbert, C. D. (1997). Cortical dynamics. Acta Paediatrica. Supple-ment, 422, 34–37.
Gilbert, C. D. (1998). Adult cortical dynamics. Physiological Re6iews,78, 467–485.
Gilbert, C. D., Das, A., Ito, M., Kapadia, M., & Westheimer, G.(1996). Spatial integration and cortical dynamics. Proceedings ofthe National Academy of Sciences of the United States of America,93, 615–622.
Gilbert, C. D., & Wiesel, T. N. (1983). Clustered intrinsic connectionsin cat visual cortex. Journal of Neuroscience, 3, 1116–1133.
Gilbert, C. D., & Wiesel, T. N. (1989). Columnar specificity ofintrinsic horizontal and corticocortical connections in cat visualcortex. Journal of Neuroscience, 9, 2432–2442.
Gilbert, C. D., & Wiesel, T. N. (1990). The influence of contextualstimuli on the orientation selectivity of cells in primary visualcortex of the cat. Vision Research, 30, 1689–1701.
Golledge, H. D. R., Hilgetag, C. C., & Tovee, M. J. (1996). Asolution to the binding problem? Information processing. CurrentBiology, 6, 1092–1095.
Gray, C. M., Engel, A. K., Konig, P., & Singer, W. (1992). Synchro-nization of oscillatory neuronal responses in cat striate cortex:temporal properties. Visual Neuroscience, 8, 337–347.
Grossberg, S. (1999). How does the cerebral cortex work? Learning,attention, and grouping by the laminar circuits of visual cortex.Spatial Vision, 12, 163–185.
Hardcastle, V. G. (1997). Consciousness and the neurobiology ofperceptual binding. Seminars in Neurology, 17, 163–170.
Heitger, F., Rosenthaler, L., von der Heydt, R., Peterhans, E., &Kubler, O. (1992). Simulation of neural contour mechanisms:from simple to end-stopped cells. Vision Research, 32, 963–981.
Hess, R., & Field, D. (1999). Integration of contours: new insights.Trends in Cogniti6e Science, 3, 480–486.
Hess, R. F., Dakin, S. C., & Field, D. J. (1998). The role of ‘contrastenhancement’ in the detection and appearance of visual contours.Vision Research, 38, 783–787.
Hupe, J. M., James, A. C., Payne, B. R., Lomber, S. G., Girard, P.,& Bullier, J. (1998). Cortical feedback improves discriminationbetween figure and background by V1, V2 and V3 neurons.Nature, 394, 784–787.
Kapadia, M. K., Ito, M., Gilbert, C. D., & Westheimer, G. (1995).Improvement in visual sensitivity by changes in local context:parallel studies in human observers and in V1 of alert monkeys.Neuron, 15, 843–856.
Kapadia, M. K., Westheimer, G., & Gilbert, C. D. (1999). Dynamicsof spatial summation in primary visual cortex of alert monkeys.Proceedings of the National Academy of Sciences of the UnitedStates of America, 96, 12073–12078.
Kiper, D. C., Gegenfurtner, K. R., & Movshon, J. A. (1996). Corticaloscillatory responses do not affect visual segmentation. VisionResearch, 36, 539–544.
Kovacs, I. (1996). Gestalten of today: early processing of visualcontours and surfaces. Beha6ioural Brain Research, 82, 1–11.
Kovacs, I., & Julesz, B. (1993). A closed curve is much more than anincomplete one: effect of closure in figure-ground segmentation.Proceedings of the National Academy of Sciences of the UnitedStates of America, 90, 7495–7497.
Lamme, V. A. (1995). The neurophysiology of figure-ground segrega-tion in primary visual cortex. Journal of Neuroscience, 15, 1605–1615.

R.F. Hess et al. / Vision Research 41 (2001) 1023–1037 1037
Lamme, V. A., & Spekreijse, H. (1998). Neuronal synchrony does notrepresent texture segregation. Nature, 396, 362–366.
Lamme, V. A., Super, H., & Spekreijse, H. (1998). Feedforward,horizontal, and feedback processing in the visual cortex. CurrentOpinion in Neurobiology, 8, 529–535.
Lamme, V. A., Zipser, K., & Spekreijse, H. (1998). Figure-groundactivity in primary visual cortex is suppressed by anesthesia.Proceedings of the National Academy of Sciences of the UnitedStates of America, 95, 3263–3268.
Lee, S. H., & Blake, R. (1999). Visual form created solely fromtemporal structure [see comments]. Science, 284, 1165–1168.
Levitt, J. B., & Lund, J. S. (1997). Contrast dependence of contextualeffects in primate visual cortex. Nature, 387, 73–76.
Li, Z. (1998). A neural model of contour integration in the primaryvisual cortex. Neural Computation, 10, 903–940.
Li, Z. (1999). Visual segmentation by contextual influences via intra-cortical interactions in the primary visual cortex. Network-Com-putation in Neural Systems, 10, 187–212.
Lorenceau, J., & Zago, L. (1999). Cooperative and competitivespatial interactions in motion integration. Visual Neuroscience, 16,755–770.
Malach, R., Amir, Y., Harel, M., & Grinvald, A. (1993). Relation-ship between intrinsic connections and functional architecturerevealed by optical imaging and in vivo targeted biocytin injec-tions in primate striate cortex. Proceedings of the NationalAcademy of Sciences of the United States of America, 90, 10469–10473.
McIlhagga, W. H., & Mullen, K. T. (1996). Contour integration withcolour and luminance contrast. Vision Research, 36, 1265–1279.
Mullen, K. T. M., Beaudot, W. H. A., & McIlhagga, W. H. (2000).Contour integration in color vision: a common process for theblue-yellow, red-green and luminance mechanisms? Vision Re-search, 40, 639–655.
Pettet, M. W. (1999). Shape and contour detection. Vision Research,39, 551–557.
Pettet, M. W., McKee, S. P., & Grzywacz, N. M. (1998). Constraintson long range interactions mediating contour detection. VisionResearch, 38, 865–879.
Polat, U. (1999). Functional architecture of long-range perceptualinteractions. Spatial Vision, 12, 143–162.
Richmond, B. J., Gawne, T. J., & Jin, G. X. (1997). Neuronal codes:reading them and learning how their structure influences networkorganization. Biosystems, 40, 149–157.
Rockland, K. S., & Lund, J. S. (1982). Widespread periodic intrinsicconnections in the tree shrew visual cortex. Science, 215, 1532–1534.
Roelfsema, P. R., & Singer, W. (1998). Detecting connectedness.Cerebral Cortex, 8, 385–396.
Sillito, A. M., Grieve, K. L., Jones, H. E., Cudeiro, J., & Davis, J.(1995). Visual cortical mechanisms detecting focal orientationdiscontinuities. Nature, 378, 492–496.
Sillito, A. M., & Jones, H. E. (1996). Context-dependent interactionsand visual processing in V1. Journal of Physiology Paris, 90,205–209.
Singer, W., & Gray, C. M. (1995). Visual feature integration and thetemporal correlation hypothesis. Annual Re6iew of Neuroscience,18, 555–586.
Toth, L. J., Rao, S. C., Kim, D. S., Somers, D., & Sur, M. (1996).Subthreshold facilitation and suppression in primary visual cortexrevealed by intrinsic signal imaging. Proceedings of the NationalAcademy of Sciences of the United States of America, 93, 9869–9874.
Usher, M., & Donnelly, N. (1998). Visual synchrony affects bindingand segmentation in perception. Nature, 394, 179–182.
Williams, L. R., & Jacobs, D. W. (1997). Stochastic completion fields;a neural model of illusory contour shape and salience. NeuralComputation, 9, 837–858.
Yen, S. C., & Finkel, L. H. (1998). Extraction of perceptually salientcontours by striate cortical networks. Vision Research, 38, 719–741.
Ziebell, O., & Nothdurft, H. C. (1999). Cueing and pop-out. VisionResearch, 39, 2113–2125.
Zipser, K., Lamme, V. A., & Schiller, P. H. (1996). Contextualmodulation in primary visual cortex. Journal of Neuroscience, 16,7376–7389.
.