Visi – A VTK- and QT-Based Open-Source Project for Data ...VTK is an open-source, cross-platform...
8
> REPLACE THIS LINE WITH YOUR PAPER IDENTIFICATION NUMBER (DOUBLE-CLICK HERE TO EDIT) < 1 Abstract— In this paper, we present an open-source project, Visi for high-dimensional engineering and scientific data visualization. Visi is with state-of-the-art interactive user interfaces and graphics kernels based upon Qt (a cross-platform GUI toolkit) and VTK (an object-oriented visualization library). For an initialization of Visi, a preliminary window will be functioned by invoking Qt, and the kernel of VTK is simultaneously embedded into the window, where the graphics resources are then allocated. Representation of visualization is through an interactive interface so that the data could be rendered according to user’s preference. Benefited from C++ programming techniques, in particular for design pattern, the developed framework possesses high flexibility and extensibility for advanced functions (e.g., object combination, etc) and further applications. Application of Visi to data visualization in various fields, such as protein structure in bioinformatics, 3D semiconductor transistor, and interconnect of very-large scale integration (VLSI) layout are also illustrated to show the performance of Visi. The developed open-source project is available in the public domain [1]. Index Terms—data visualization, computational science and engineering, Qt, VTK, design pattern, C++, open source. I. INTRODUCTION HEN visualizing a set of scientific or engineering results, people may interest in a simple but vivid way [2-4] to gain insight into the data in order to get the best possible impression of their content. Several data visualization environments have been developed over the past years [5-8], which claim to meet the requirements of the users in the fields of computer and computational science [9-11]. In high-dimensional data visualization, issues including code manipulation, optimization, adoption, and system-dependent graphical user interface still attract many attentions. Initiated by Steven Johnson, Vis5D [12] is a well-known project for numerical weather models. Tools, MayaVi [13] and ParaView [14] are existing open packages for high-dimensional data visualization. They are written in script languages such as Python [15] and TCL/TK [16], respectively, where the graphics This work was supported in part by Taiwan National Science Council (NSC) under Contract NSC-95-2221-E-009-336 and Contract NSC-95-2752- E-009-003-PAE, and by the MoE ATU Program under a 2006 grant. Y. Li is with the Department of Communication Engineering, National Chiao Tung University, Hsinchu 300, Taiwan. He is also with the Modelling and Simulation Research Center and the Institute of Management of Technology, National Chiao Tung University, Hsinchu 300, Taiwan. (e-mail: [email protected]). C.-K. Chen is with the Department of Communication Engineering, National Chiao Tung University, Hsinchu 300, Taiwan. kernel, Visualization Toolkit (VTK) [17-21] is adopted in these applications. These public domain available projects have their advantages and features. Nevertheless, we believe that there is still a room to accommodate a new and good application by integrating the Qt [22] and VTK libraries for high-dimensional data visualization. In this work, we develop a new open-source project, Visi for high-dimensional engineering and scientific data visualization [23]. The main framework is based upon Qt (ver. 3.2.3) and it integrates VTK (ver. 4.4) as the rendering kernel. Visi is with state-of-the-art interactive user interface and graphics kernels. VTK is an open-source, cross-platform C++ library for 3D data visualization which has accumulated a large user base in the scientific computation research community. Moreover, Qt is a multi platform framework for building graphical user interface which supports OpenGL and has good performance by interacting with VTK QVTKWidget. Within an initialization procedure of Visi, a preliminary window will be functioned by invoking Qt, and the kernel of VTK is simultaneously embedded into the window, where the graphics resources are allocated. Visi working environment is now configured. Representation of visualization is established through an interactive interface so that the data could be rendered according to user’s preference. This project is mainly developed by using C++, which significantly benefits the flexibility and extensibility of the programming. Application of Visi to high-dimensional data visualization in various fields, such as protein structure in bioinformatics [24,25], 3D semiconductor transistor [26,27], 3D carbon nanotube device [28], and interconnect of very-large scale integration (VLSI) layout [29] is also illustrated to show the performance of Visi. The developed open-source project is now available in the public domain [1]. This paper is organized as follows. In Sec. II, the implementation technique is introduced. Functions of the presented work will be described in Sec. III. In Sec. IV, illustration examples arising from various fields are reported. Finally, we draw conclusions and suggest future work. II. IMPLEMENTATION TECHNIQUES Based on Qt and VTK libraries, the developed framework brings Visi high extensibilities and flexibilities, by warping the original classes. High extensibilities imply that new functionalities could be conveniently constructed and plugged into the existed code in the programming level. Flexibilities, on Visi – A VTK- and QT-Based Open-Source Project for Data Visualization Yiming Li, Member, IEEE and Cheng-Kai Chen W
Transcript of Visi – A VTK- and QT-Based Open-Source Project for Data ...VTK is an open-source, cross-platform...

> REPLACE THIS LINE WITH YOUR PAPER IDENTIFICATION NUMBER (DOUBLE-CLICK HERE TO EDIT) <
1
Abstract— In this paper, we present an open-source project,
Visi for high-dimensional engineering and scientific data visualization. Visi is with state-of-the-art interactive user interfaces and graphics kernels based upon Qt (a cross-platform GUI toolkit) and VTK (an object-oriented visualization library). For an initialization of Visi, a preliminary window will be functioned by invoking Qt, and the kernel of VTK is simultaneously embedded into the window, where the graphics resources are then allocated. Representation of visualization is through an interactive interface so that the data could be rendered according to user’s preference. Benefited from C++ programming techniques, in particular for design pattern, the developed framework possesses high flexibility and extensibility for advanced functions (e.g., object combination, etc) and further applications. Application of Visi to data visualization in various fields, such as protein structure in bioinformatics, 3D semiconductor transistor, and interconnect of very-large scale integration (VLSI) layout are also illustrated to show the performance of Visi. The developed open-source project is available in the public domain [1].
Index Terms—data visualization, computational science and engineering, Qt, VTK, design pattern, C++, open source.
I. INTRODUCTION HEN visualizing a set of scientific or engineering
results, people may interest in a simple but vivid way [2-4] to gain insight into the data in order to get the best possible impression of their content. Several data visualization environments have been developed over the past years [5-8], which claim to meet the requirements of the users in the fields of computer and computational science [9-11]. In high-dimensional data visualization, issues including code manipulation, optimization, adoption, and system-dependent graphical user interface still attract many attentions. Initiated by Steven Johnson, Vis5D [12] is a well-known project for numerical weather models. Tools, MayaVi [13] and ParaView [14] are existing open packages for high-dimensional data visualization. They are written in script languages such as Python [15] and TCL/TK [16], respectively, where the graphics
This work was supported in part by Taiwan National Science Council (NSC) under Contract NSC-95-2221-E-009-336 and Contract NSC-95-2752- E-009-003-PAE, and by the MoE ATU Program under a 2006 grant.
Y. Li is with the Department of Communication Engineering, National Chiao Tung University, Hsinchu 300, Taiwan. He is also with the Modelling and Simulation Research Center and the Institute of Management of Technology, National Chiao Tung University, Hsinchu 300, Taiwan. (e-mail: [email protected]).
C.-K. Chen is with the Department of Communication Engineering, National Chiao Tung University, Hsinchu 300, Taiwan.
kernel, Visualization Toolkit (VTK) [17-21] is adopted in these applications. These public domain available projects have their advantages and features. Nevertheless, we believe that there is still a room to accommodate a new and good application by integrating the Qt [22] and VTK libraries for high-dimensional data visualization.
In this work, we develop a new open-source project, Visi for high-dimensional engineering and scientific data visualization [23]. The main framework is based upon Qt (ver. 3.2.3) and it integrates VTK (ver. 4.4) as the rendering kernel. Visi is with state-of-the-art interactive user interface and graphics kernels. VTK is an open-source, cross-platform C++ library for 3D data visualization which has accumulated a large user base in the scientific computation research community. Moreover, Qt is a multi platform framework for building graphical user interface which supports OpenGL and has good performance by interacting with VTK QVTKWidget. Within an initialization procedure of Visi, a preliminary window will be functioned by invoking Qt, and the kernel of VTK is simultaneously embedded into the window, where the graphics resources are allocated. Visi working environment is now configured. Representation of visualization is established through an interactive interface so that the data could be rendered according to user’s preference. This project is mainly developed by using C++, which significantly benefits the flexibility and extensibility of the programming. Application of Visi to high-dimensional data visualization in various fields, such as protein structure in bioinformatics [24,25], 3D semiconductor transistor [26,27], 3D carbon nanotube device [28], and interconnect of very-large scale integration (VLSI) layout [29] is also illustrated to show the performance of Visi. The developed open-source project is now available in the public domain [1].
This paper is organized as follows. In Sec. II, the implementation technique is introduced. Functions of the presented work will be described in Sec. III. In Sec. IV, illustration examples arising from various fields are reported. Finally, we draw conclusions and suggest future work.
II. IMPLEMENTATION TECHNIQUES Based on Qt and VTK libraries, the developed framework
brings Visi high extensibilities and flexibilities, by warping the original classes. High extensibilities imply that new functionalities could be conveniently constructed and plugged into the existed code in the programming level. Flexibilities, on
Visi – A VTK- and QT-Based Open-Source Project for Data Visualization
Yiming Li, Member, IEEE and Cheng-Kai Chen
W

> REPLACE THIS LINE WITH YOUR PAPER IDENTIFICATION NUMBER (DOUBLE-CLICK HERE TO EDIT) <
2
the other hand, aim to provide better users’ experience in interacting with Visi. In this section, the design details of the framework including architecture, and visualization and data managements will be discussed.
A. Architecture An illustration of the architecture of developed classes in Visi
is shown in Fig. 1. According to the functionality of the program, it can be separated into three categories: the maintenance-, GUI-, and visualization-related classes.
Fig. 1. An architecture of the developed classes in Visi.
CClipDatasetActor
CContourActor
CCutActor
CDelauney2DActor
CGlyphActor
CLoopSubdivisionActor
CThresholdActor
CTubeActor
CWarpScalarActor
Derived from CBaseActor
Derived from BaseOptionFrame
ClipOptionFrame
ContourOptionFrame
CutOptionFrame
Delauney2DOptionFrame
GlyphOptionFrame
LoopSubdivisionOptionFrame
ThresholdOptionFrame
TubeOptionFrame
WarpScalarOptionFrame
Filter
Cut
Clip
Contour
SurfaceConstruction
Threshold
Refinement
Warp - Scalar
Glyph
Tube Fig. 2. Filter functionalities of Visi and the corresponding implementation classes.
MainFrame class, shown in Fig. 1, is right the maintenance
class in Visi which connects the human interface and the kernel of VTK. It includes two objects derived from ControlPanel and QVTKFrame classes. Visualization-related category includes QVTKFrame, PickCallback, CDataSource, and CBaseActor classes. CDataSource is a general data reader to decode various data format for further processes. CBaseActor is the base class provides a necessary interface for the basic visualized object. In Visi, all visualized objects can be regarded as actors which are derived from CBaseActor, shown in Fig. 2.
QVTKFrame manages all the graphics resources, such as the original VTK resource and developed visualized objects. It derived from QVTKWidget which provides an efficient way to embed into MainFrame. PickCallBack is a callback function object derived from vtkCommand. It provides a callback routine which is invoked by VTK kernel to get the information
according to the location of mouse. GUI-related group includes ControlPanel, FilePrtyPage,
BaseOptionFrame, DisplayPage, ColorPage, and InformationPage classes. ControlPanel is a docking panel to display the property for each actor. FilePrtyPage, DisplayPage, ColorPage, and InformationPage are the property frames. It is noted that classes in GUI-related category are all derived from Qt, shown in Fig.1, such as QDockWindow, QWidget, QScrollView, and QFrame, respectively. FilePrtyPage is a sub-page to display the basic information of the actor. It includes the file and option frames. The file frame shows the file information, such as filename, path, and object id, etc. The option frame is a setting page which inherited from BaseOptionFrame for each filter. Figure 2 shows all derived classes of each filter. DisplayPage and ColorPage are used to adjust the appearance of the actor. InformationPage lists the geometric property of the actor (e.g., the object boundaries limits). We note that BaseOptionFrame and CBaseActor are base classes for filter construction.
Warp functions
Input source data
Add Visi filters;Set object property
Interact with visualized object
CDataSource
CBaseActor
QVTKFrame::QVTKWidget
Data decode
VTK engine
Generate CBaseActor
in proper type
procedure flow
invoke object
generate
invoke function
data reference
Procedure flow (MainFrame and
ControlPanel)
QVTKFrameworking flow
Visi engine
Fig. 3. The procedure flow for manipulating Visi to visualize a source data, and the corresponding working flow in QVTKFrame.
Three steps are performed when visualizing the source data in Visi, shown in Fig. 3. For various kinds of the input data, CDataSource class firstly decodes the source. It then transforms the decoded data and generates a corresponding type of CBaseActor object. In the next step, users add proper Visi filter to CBaseActor object, and set the object properties in ControlPanel. QVTKFrame collects all objects above and invokes Visi engine, and then it will call VTK engine to display the objects. Visi engine warps the original VTK classes including VTKRender, VTKActor, and VTKPointPicker, etc. In order to improve the flexibilities to fit our requirement in Visi, the redesign visualization procedure and developed visualized classes will be discussed later.
B. Visualization Procedure Based on VTK pipeline and developed data classes, Visi’s
visualization procedure exhibits much more extensibilities and flexibilities from the original VTK both in software
> REPLACE THIS LINE WITH YOUR PAPER IDENTIFICATION NUMBER (DOUBLE-CLICK HERE TO EDIT) <
3
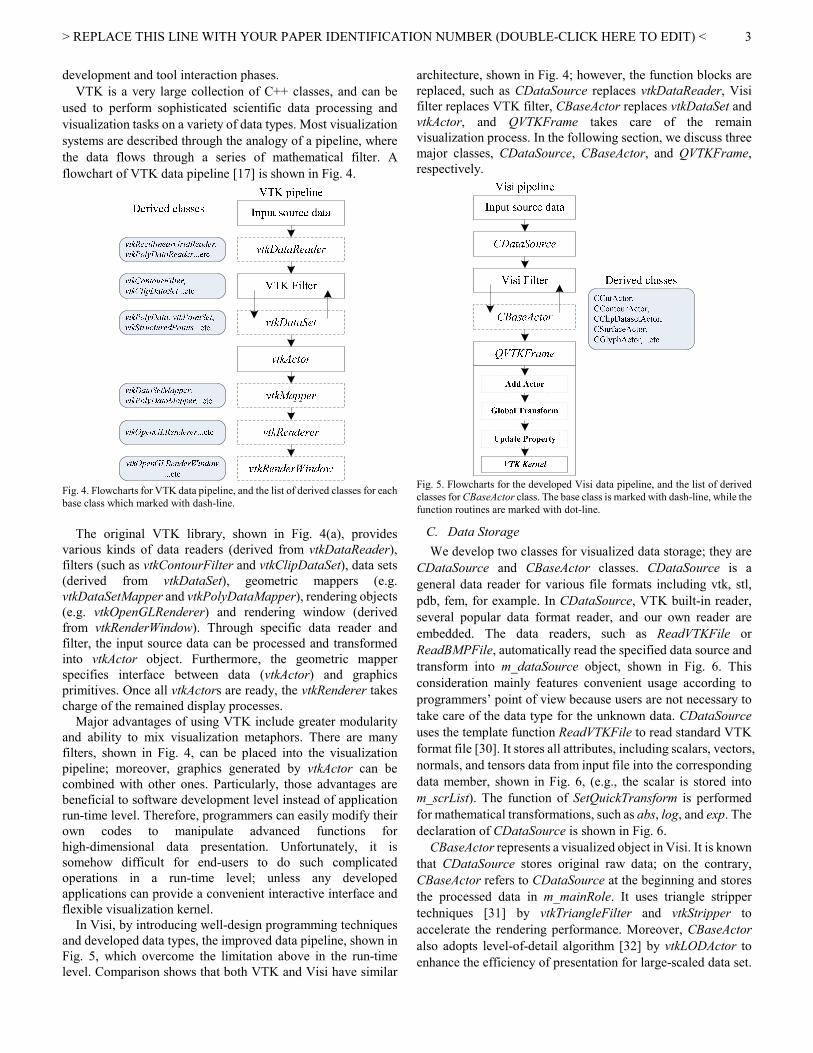
development and tool interaction phases. VTK is a very large collection of C++ classes, and can be
used to perform sophisticated scientific data processing and visualization tasks on a variety of data types. Most visualization systems are described through the analogy of a pipeline, where the data flows through a series of mathematical filter. A flowchart of VTK data pipeline [17] is shown in Fig. 4.
Fig. 4. Flowcharts for VTK data pipeline, and the list of derived classes for each base class which marked with dash-line.
The original VTK library, shown in Fig. 4(a), provides
various kinds of data readers (derived from vtkDataReader), filters (such as vtkContourFilter and vtkClipDataSet), data sets (derived from vtkDataSet), geometric mappers (e.g. vtkDataSetMapper and vtkPolyDataMapper), rendering objects (e.g. vtkOpenGLRenderer) and rendering window (derived from vtkRenderWindow). Through specific data reader and filter, the input source data can be processed and transformed into vtkActor object. Furthermore, the geometric mapper specifies interface between data (vtkActor) and graphics primitives. Once all vtkActors are ready, the vtkRenderer takes charge of the remained display processes. Major advantages of using VTK include greater modularity and ability to mix visualization metaphors. There are many filters, shown in Fig. 4, can be placed into the visualization pipeline; moreover, graphics generated by vtkActor can be combined with other ones. Particularly, those advantages are beneficial to software development level instead of application run-time level. Therefore, programmers can easily modify their own codes to manipulate advanced functions for high-dimensional data presentation. Unfortunately, it is somehow difficult for end-users to do such complicated operations in a run-time level; unless any developed applications can provide a convenient interactive interface and flexible visualization kernel. In Visi, by introducing well-design programming techniques and developed data types, the improved data pipeline, shown in Fig. 5, which overcome the limitation above in the run-time level. Comparison shows that both VTK and Visi have similar
architecture, shown in Fig. 4; however, the function blocks are replaced, such as CDataSource replaces vtkDataReader, Visi filter replaces VTK filter, CBaseActor replaces vtkDataSet and vtkActor, and QVTKFrame takes care of the remain visualization process. In the following section, we discuss three major classes, CDataSource, CBaseActor, and QVTKFrame, respectively.
Fig. 5. Flowcharts for the developed Visi data pipeline, and the list of derived classes for CBaseActor class. The base class is marked with dash-line, while the function routines are marked with dot-line.
C. Data Storage We develop two classes for visualized data storage; they are
CDataSource and CBaseActor classes. CDataSource is a general data reader for various file formats including vtk, stl, pdb, fem, for example. In CDataSource, VTK built-in reader, several popular data format reader, and our own reader are embedded. The data readers, such as ReadVTKFile or ReadBMPFile, automatically read the specified data source and transform into m_dataSource object, shown in Fig. 6. This consideration mainly features convenient usage according to programmers’ point of view because users are not necessary to take care of the data type for the unknown data. CDataSource uses the template function ReadVTKFile to read standard VTK format file [30]. It stores all attributes, including scalars, vectors, normals, and tensors data from input file into the corresponding data member, shown in Fig. 6, (e.g., the scalar is stored into m_scrList). The function of SetQuickTransform is performed for mathematical transformations, such as abs, log, and exp. The declaration of CDataSource is shown in Fig. 6.
CBaseActor represents a visualized object in Visi. It is known that CDataSource stores original raw data; on the contrary, CBaseActor refers to CDataSource at the beginning and stores the processed data in m_mainRole. It uses triangle stripper techniques [31] by vtkTriangleFilter and vtkStripper to accelerate the rendering performance. Moreover, CBaseActor also adopts level-of-detail algorithm [32] by vtkLODActor to enhance the efficiency of presentation for large-scaled data set.
> REPLACE THIS LINE WITH YOUR PAPER IDENTIFICATION NUMBER (DOUBLE-CLICK HERE TO EDIT) <
4
MakeShowActor function processes the data set – m_mainRole as an actor. PushShowActorToPipeline pushes the actor to visualization pipeline. The members of CBaseActor are partially shown in Fig. 7.
class CDataSource { void *m_genericReader; vtkDataSet *m_dataSource; vector<vtkAttMode> m_scrList, m_vecList…; void SetQuickTransform(int trans); // Various data readers template<class DataSet,class DataReader> bool ReadVTKFile(string fn); bool ReadBMPFile(string fn); … } Fig. 6. Class declaration of CDataSource.
class CBaseActor : public QObject { vtkDataSet *m_mainRole; vtkTriangleFilter *m_tri; vtkStripper *m_strip; vtkLODActor *m_lodActor; … void MakeShowActor(); void PushShowActorToPipeline(); … } Fig. 7. Class declaration of CBaseActor.
D. Visi Engine QVTKFrame can be regarded as the visualization kernel,
which handles all visualization operations in Visi. It inherits the functionality of QVTKWidget bridging the communication between GUI and visualized objects. Figure 8 shows the member declarations in QVTKFrame. The variable m_actors stores all CBaseActor objects and m_data is for CDataSource objects similarly. UpdateFramePrty updates all objects in the display area. When users apply the specific filter on the actor, AddFilter function will process the corresponding procedures with respect to the actor and filter. UpdateGlobalTransform performs the global space transformation shown below.
class QVTKFrame : public QVTKWidget { map<int,CBaseActor*> m_actors; map<int,CDataSource*> m_data; … void UpdateFramePrty(); int AddFilter(int type); void UpdateGlobalTransform(); … } Fig. 8. The member declarations in QVTKFrame.
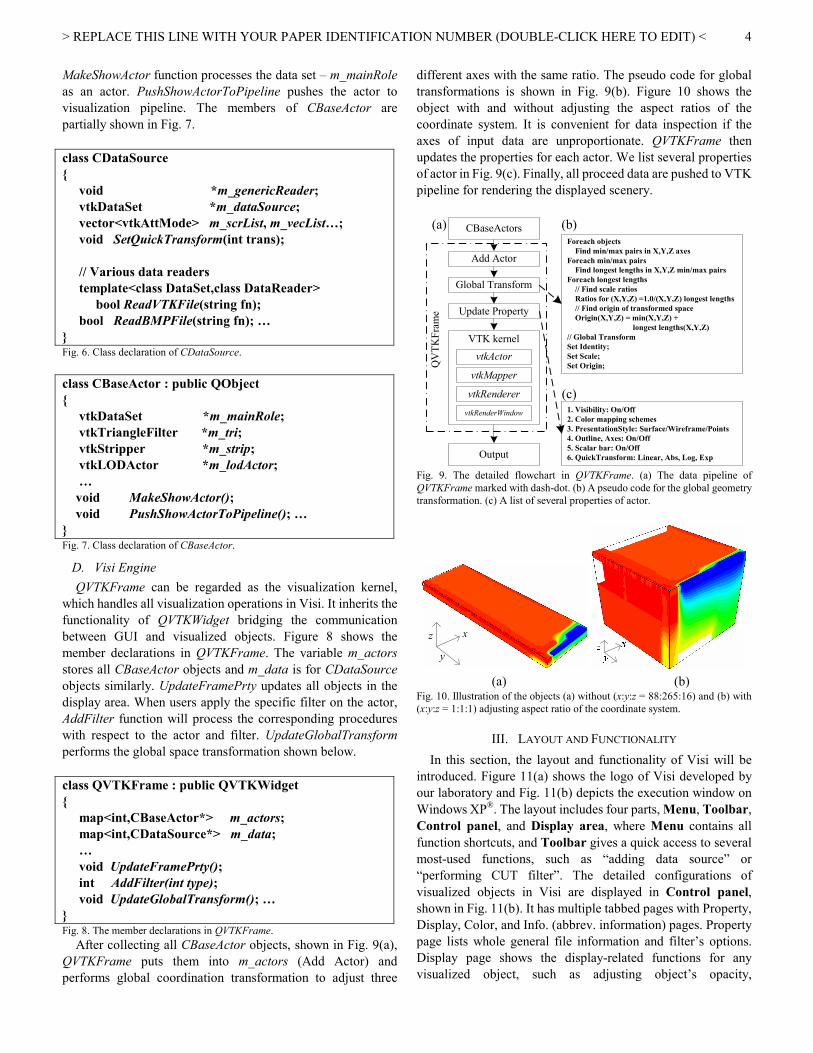
After collecting all CBaseActor objects, shown in Fig. 9(a), QVTKFrame puts them into m_actors (Add Actor) and performs global coordination transformation to adjust three
different axes with the same ratio. The pseudo code for global transformations is shown in Fig. 9(b). Figure 10 shows the object with and without adjusting the aspect ratios of the coordinate system. It is convenient for data inspection if the axes of input data are unproportionate. QVTKFrame then updates the properties for each actor. We list several properties of actor in Fig. 9(c). Finally, all proceed data are pushed to VTK pipeline for rendering the displayed scenery.
CBaseActors
Global Transform
Update Property
Add Actor
VTK kernel
1. Visibility: On/Off2. Color mapping schemes 3. PresentationStyle: Surface/Wireframe/Points4. Outline, Axes: On/Off5. Scalar bar: On/Off6. QuickTransform: Linear, Abs, Log, ExpOutput
Foreach objects Find min/max pairs in X,Y,Z axesForeach min/max pairs Find longest lengths in X,Y,Z min/max pairsForeach longest lengths // Find scale ratios Ratios for (X,Y,Z) =1.0/(X,Y,Z) longest lengths // Find origin of transformed space Origin(X,Y,Z) = min(X,Y,Z) + longest lengths(X,Y,Z) // Global TransformSet Identity;Set Scale;Set Origin;
(a) (b)
(c)
QV
TKFr
ame
vtkRenderer
vtkRenderWindow
vtkMapper
vtkActor
Fig. 9. The detailed flowchart in QVTKFrame. (a) The data pipeline of QVTKFrame marked with dash-dot. (b) A pseudo code for the global geometry transformation. (c) A list of several properties of actor.
z x
y
(a) (b) Fig. 10. Illustration of the objects (a) without (x:y:z = 88:265:16) and (b) with (x:y:z = 1:1:1) adjusting aspect ratio of the coordinate system.
III. LAYOUT AND FUNCTIONALITY In this section, the layout and functionality of Visi will be
introduced. Figure 11(a) shows the logo of Visi developed by our laboratory and Fig. 11(b) depicts the execution window on Windows XP®. The layout includes four parts, Menu, Toolbar, Control panel, and Display area, where Menu contains all function shortcuts, and Toolbar gives a quick access to several most-used functions, such as “adding data source” or “performing CUT filter”. The detailed configurations of visualized objects in Visi are displayed in Control panel, shown in Fig. 11(b). It has multiple tabbed pages with Property, Display, Color, and Info. (abbrev. information) pages. Property page lists whole general file information and filter’s options. Display page shows the display-related functions for any visualized object, such as adjusting object’s opacity,
> REPLACE THIS LINE WITH YOUR PAPER IDENTIFICATION NUMBER (DOUBLE-CLICK HERE TO EDIT) <
5
adding/removing the outline box around the object, etc. In Color page, users can select different color suite to map to the input scalar data, or turn on/off the color bar. Properties for visualized objects, such as number of cells, points, or data ranges, are shown in Info. page. Display area, shown in Fig. 11(b), is designed to output visualized objects, where the real-time rendering engine depicts the visualized object. Visi provides various functions to inspect the objects in this area, for example, users can use mouse to rotate or zoom in/out the camera. The main features and the filters are briefed below.
(a) (b)
Fig. 11. (a) Visi’s logo and (b) its layout, where four tabbed pages, Property, Display, Color, and Info. are designed in Control panel.
A. Major Functions The major functions implemented in Visi are summarized: A.1. Real-time high-dimensional data visualization; A.2. Twelve filters for exploring the complex data; A.3. Saving the displayed scenery to file or clipboard; A.4. Sixteen fixed predefined camera angles (for display with
arbitrary angles can be done by mouse); A.5. Animation functions for dynamic data demonstration;
and A.6. Various data formats including text raw data.
In the item six above, the supported function recognizes several widely used file formats, including standard VTK format (.vtk), protein data bank format (.pdb), stereolithography format (.stl), bitmap (.bmp), smart analysis programs (SAP) [33] format, and text raw data file.
B. Filters Visi has built-in twelve filters which can be applied to all
objects. The functionality of each filter and implemented classes in VTK are summarized and listed below. Detailed instructions of Visi could be referred to the user’s manual which is available on line [1].
B.1. Cut: This filter cuts data by a given plane, which is implemented by vtkCutter class.
B.2. Clip: It clips input data by a corresponding plane implemented by vtkClipDataSet class.
B.3. Contour: It adapts from vtkContourFilter class and generates isosurface or isolines from three-dimensional (3D) and 2D input data.
B.4. Glyph: We use vtkGlyph3D to implement this function. It copies the glyph to every input point according to their orientations and scalars.
B.5. Probe: It samples data values with respect to specified locations. vtkProberFilter extracts the value from input data.
B.6. Grid Merge: This filter merges duplicated points for a set of given data by vtkCleanPolyData class.
B.7. Refinement: It uses vtkLoopSubdivisionFilter to generate a subdivision surface from a given source.
B.8. Surface Construction: For a set of points, this filter constructs the surface using Delauney triangulation which is already built-in vtkDelaunay2D class.
B.9. Warp – Scalar: It uses vtkWarpScalar to create an x-y-z plot (the so-called carpet plot) from an x-y-value data. It transforms the geometry with scalar and modifies point coordinates by moving points along a specific normal.
B.10. Threshold: This filter extracts cells where scalar in cell satisfies threshold criterion. vtkThreshold can be used to discard the value outside the given ranges.
B.11. Ribbon: Using vtkRibbonFilter to create oriented ribbons from lines which are defined in polygonal data.
B.12. Tube: It generates tubes around lines by using vtkTubeFilter.
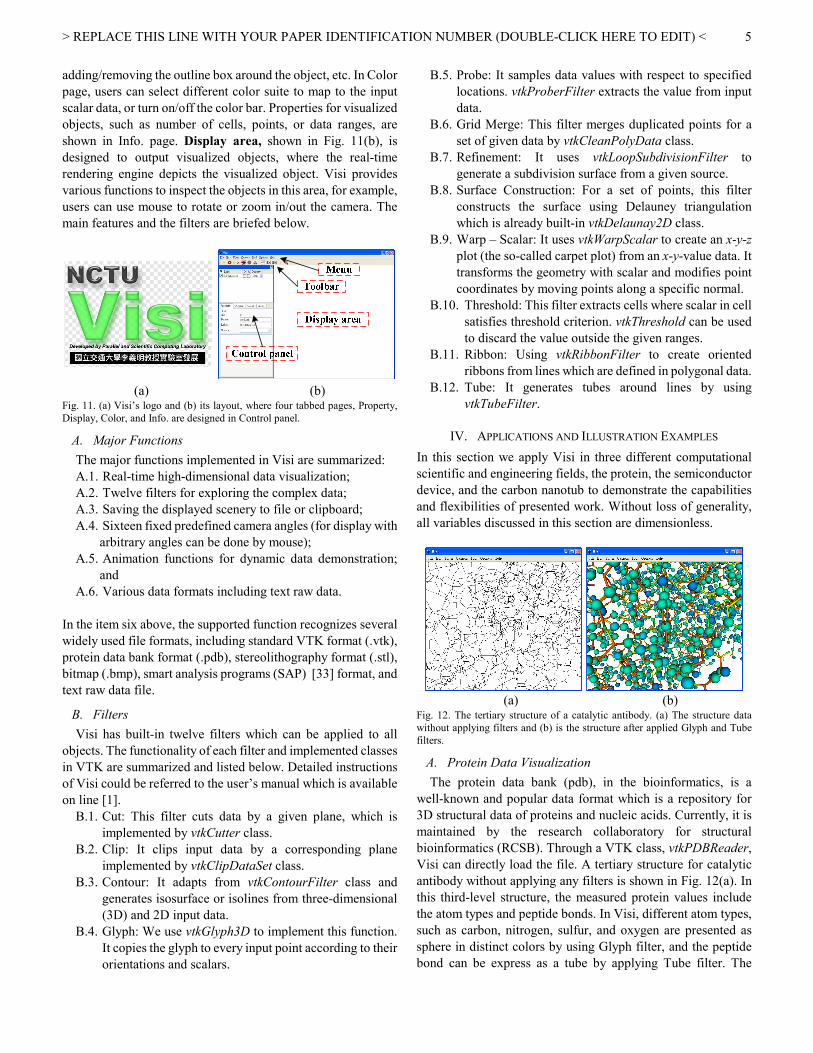
IV. APPLICATIONS AND ILLUSTRATION EXAMPLES In this section we apply Visi in three different computational scientific and engineering fields, the protein, the semiconductor device, and the carbon nanotub to demonstrate the capabilities and flexibilities of presented work. Without loss of generality, all variables discussed in this section are dimensionless.
(a) (b)
Fig. 12. The tertiary structure of a catalytic antibody. (a) The structure data without applying filters and (b) is the structure after applied Glyph and Tube filters.
A. Protein Data Visualization The protein data bank (pdb), in the bioinformatics, is a
well-known and popular data format which is a repository for 3D structural data of proteins and nucleic acids. Currently, it is maintained by the research collaboratory for structural bioinformatics (RCSB). Through a VTK class, vtkPDBReader, Visi can directly load the file. A tertiary structure for catalytic antibody without applying any filters is shown in Fig. 12(a). In this third-level structure, the measured protein values include the atom types and peptide bonds. In Visi, different atom types, such as carbon, nitrogen, sulfur, and oxygen are presented as sphere in distinct colors by using Glyph filter, and the peptide bond can be express as a tube by applying Tube filter. The

> REPLACE THIS LINE WITH YOUR PAPER IDENTIFICATION NUMBER (DOUBLE-CLICK HERE TO EDIT) <
6
synthesis visualization image after applying Glyph and Tube filters is shown in Fig. 12(b). It is obvious that the latter image is much clear to express a protein sequence.
(a) (b)
Fig. 13. (a) The potential profile for a 2D MOSFET device, and (b) the zoom-in plot in the channel region of MOSFET device with contour lines and scalar bar.
(a) (b)
Fig. 14. The carpet plot for 2D potential profile by applying Warp-Scalar filter with different color mapping schemes.
B. Semiconductor Visualization In this section we demonstrate visualizations of 2D and 3D
metal-oxide-semiconductor field effect transistor (MOSFET) simulation results, respectively. An electrostatic potential of a 2D n-type MOSFET device from technology computer-aided design (TCAD) simulation is shown in Fig. 13(a). In semiconductor device simulation, from the source side (green color) to the drain side (red color) horizontally, the potential’s distributions and variations near the region of surface (i.e., 0.5 ≤ y) determine device characteristics. A zoom-in plot focusing on the upper half plane of the explored MOSFET with contours and scalar bar is shown in Fig. 13(b). With the help of Contour filter, the equal-potential lines of the computed solution profile are inspected easily. For the same 2D simulation data, the Warp-Scalar filter transforms 2D (x-y) with values to 3D (x-y-z) carpet plots, moreover, applied different color mapping scheme can express the original data vividly. Comparison of transformed carpet plots on potential profiles by applying Warp-Scalar filter with different color mapping schemes is shown in Fig. 14. For a 3D MOSFET simulation, it is difficult to exhibit the data in different angles, such as surface of simulation domain or inner cutting plane plot. The surface potential of a 3D MOSFET device with random-dopant-induced characteristic fluctuation is shown in Fig. 15(a). In this data set, discrete dopant particles are randomly distributed inside the device.
Similarly, Glyph filter can be used to represent the random particles as a sphere, shown in Fig. 15(b). Visi combines two objects, surface plot for potential profile with 60% transparent and random particles, into a single visualized object. Benefits from this feature, multiple objects can be integrated to represent a complex data.
(a) (b)
Fig. 15. (a) The surface potential plot of a 3D MOSFET device. (b) The transparent plot for potential profile and discrete implant doping atoms.
(a) (b)
Fig. 16. (a) X-Y and (b) X-Z cut planes of 3D MOSFET potential profile.
(a) (b)
Fig. 17. The carpet plots for (a) X-Y and (b) X-Z cut planes.
Furthermore, Cut filter extracts the simulated 3D potential profile from different cutting planes. For a fixed Z-position, X-Y cut plane and the corresponding contour are shown in Fig. 16(a). X-Z cut plane near the surface (i.e., Y≈2.0) is shown in Fig. 16(b). In those two figures, the contours indicate the regions have acute variations which are caused by random dopant particles. The 3D carpet surface plots generated by Warp-Scalar filter from the extracted X-Y and X-Z plane are shown in Fig. 17.
C. Circuit Layout and Carbon Nanotube Visualization The visualization for SAP’s simulation results will be
demonstrated in this section. Data are obtained from passive components’ simulation of certain designed circuit and carbon
> REPLACE THIS LINE WITH YOUR PAPER IDENTIFICATION NUMBER (DOUBLE-CLICK HERE TO EDIT) <
7
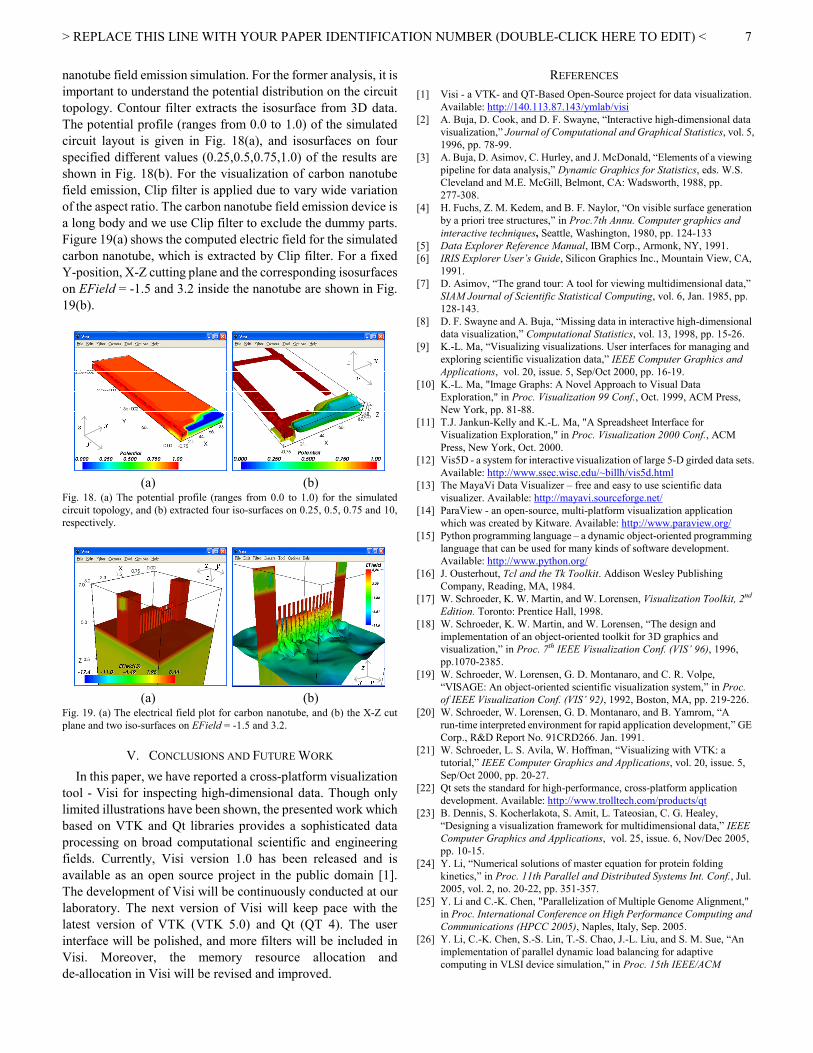
nanotube field emission simulation. For the former analysis, it is important to understand the potential distribution on the circuit topology. Contour filter extracts the isosurface from 3D data. The potential profile (ranges from 0.0 to 1.0) of the simulated circuit layout is given in Fig. 18(a), and isosurfaces on four specified different values (0.25,0.5,0.75,1.0) of the results are shown in Fig. 18(b). For the visualization of carbon nanotube field emission, Clip filter is applied due to vary wide variation of the aspect ratio. The carbon nanotube field emission device is a long body and we use Clip filter to exclude the dummy parts. Figure 19(a) shows the computed electric field for the simulated carbon nanotube, which is extracted by Clip filter. For a fixed Y-position, X-Z cutting plane and the corresponding isosurfaces on EField = -1.5 and 3.2 inside the nanotube are shown in Fig. 19(b).
(a) (b)
Fig. 18. (a) The potential profile (ranges from 0.0 to 1.0) for the simulated circuit topology, and (b) extracted four iso-surfaces on 0.25, 0.5, 0.75 and 10, respectively.
(a) (b)
Fig. 19. (a) The electrical field plot for carbon nanotube, and (b) the X-Z cut plane and two iso-surfaces on EField = -1.5 and 3.2.
V. CONCLUSIONS AND FUTURE WORK In this paper, we have reported a cross-platform visualization
tool - Visi for inspecting high-dimensional data. Though only limited illustrations have been shown, the presented work which based on VTK and Qt libraries provides a sophisticated data processing on broad computational scientific and engineering fields. Currently, Visi version 1.0 has been released and is available as an open source project in the public domain [1]. The development of Visi will be continuously conducted at our laboratory. The next version of Visi will keep pace with the latest version of VTK (VTK 5.0) and Qt (QT 4). The user interface will be polished, and more filters will be included in Visi. Moreover, the memory resource allocation and de-allocation in Visi will be revised and improved.
REFERENCES [1] Visi - a VTK- and QT-Based Open-Source project for data visualization.
Available: http://140.113.87.143/ymlab/visi [2] A. Buja, D. Cook, and D. F. Swayne, “Interactive high-dimensional data
visualization,” Journal of Computational and Graphical Statistics, vol. 5, 1996, pp. 78-99.
[3] A. Buja, D. Asimov, C. Hurley, and J. McDonald, “Elements of a viewing pipeline for data analysis,” Dynamic Graphics for Statistics, eds. W.S. Cleveland and M.E. McGill, Belmont, CA: Wadsworth, 1988, pp. 277-308.
[4] H. Fuchs, Z. M. Kedem, and B. F. Naylor, “On visible surface generation by a priori tree structures,” in Proc.7th Annu. Computer graphics and interactive techniques, Seattle, Washington, 1980, pp. 124-133
[5] Data Explorer Reference Manual, IBM Corp., Armonk, NY, 1991. [6] IRIS Explorer User’s Guide, Silicon Graphics Inc., Mountain View, CA,
1991. [7] D. Asimov, “The grand tour: A tool for viewing multidimensional data,”
SIAM Journal of Scientific Statistical Computing, vol. 6, Jan. 1985, pp. 128-143.
[8] D. F. Swayne and A. Buja, “Missing data in interactive high-dimensional data visualization,” Computational Statistics, vol. 13, 1998, pp. 15-26.
[9] K.-L. Ma, “Visualizing visualizations. User interfaces for managing and exploring scientific visualization data,” IEEE Computer Graphics and Applications, vol. 20, issue. 5, Sep/Oct 2000, pp. 16-19.
[10] K.-L. Ma, "Image Graphs: A Novel Approach to Visual Data Exploration," in Proc. Visualization 99 Conf., Oct. 1999, ACM Press, New York, pp. 81-88.
[11] T.J. Jankun-Kelly and K.-L. Ma, "A Spreadsheet Interface for Visualization Exploration," in Proc. Visualization 2000 Conf., ACM Press, New York, Oct. 2000.
[12] Vis5D - a system for interactive visualization of large 5-D girded data sets. Available: http://www.ssec.wisc.edu/~billh/vis5d.html
[13] The MayaVi Data Visualizer – free and easy to use scientific data visualizer. Available: http://mayavi.sourceforge.net/
[14] ParaView - an open-source, multi-platform visualization application which was created by Kitware. Available: http://www.paraview.org/
[15] Python programming language – a dynamic object-oriented programming language that can be used for many kinds of software development. Available: http://www.python.org/
[16] J. Ousterhout, Tcl and the Tk Toolkit. Addison Wesley Publishing Company, Reading, MA, 1984.
[17] W. Schroeder, K. W. Martin, and W. Lorensen, Visualization Toolkit, 2nd Edition. Toronto: Prentice Hall, 1998.
[18] W. Schroeder, K. W. Martin, and W. Lorensen, “The design and implementation of an object-oriented toolkit for 3D graphics and visualization,” in Proc. 7th IEEE Visualization Conf. (VIS’ 96), 1996, pp.1070-2385.
[19] W. Schroeder, W. Lorensen, G. D. Montanaro, and C. R. Volpe, “VISAGE: An object-oriented scientific visualization system,” in Proc. of IEEE Visualization Conf. (VIS’ 92), 1992, Boston, MA, pp. 219-226.
[20] W. Schroeder, W. Lorensen, G. D. Montanaro, and B. Yamrom, “A run-time interpreted environment for rapid application development,” GE Corp., R&D Report No. 91CRD266. Jan. 1991.
[21] W. Schroeder, L. S. Avila, W. Hoffman, “Visualizing with VTK: a tutorial,” IEEE Computer Graphics and Applications, vol. 20, issue. 5, Sep/Oct 2000, pp. 20-27.
[22] Qt sets the standard for high-performance, cross-platform application development. Available: http://www.trolltech.com/products/qt
[23] B. Dennis, S. Kocherlakota, S. Amit, L. Tateosian, C. G. Healey, “Designing a visualization framework for multidimensional data,” IEEE Computer Graphics and Applications, vol. 25, issue. 6, Nov/Dec 2005, pp. 10-15.
[24] Y. Li, “Numerical solutions of master equation for protein folding kinetics,” in Proc. 11th Parallel and Distributed Systems Int. Conf., Jul. 2005, vol. 2, no. 20-22, pp. 351-357.
[25] Y. Li and C.-K. Chen, "Parallelization of Multiple Genome Alignment," in Proc. International Conference on High Performance Computing and Communications (HPCC 2005), Naples, Italy, Sep. 2005.
[26] Y. Li, C.-K. Chen, S.-S. Lin, T.-S. Chao, J.-L. Liu, and S. M. Sue, “An implementation of parallel dynamic load balancing for adaptive computing in VLSI device simulation,” in Proc. 15th IEEE/ACM
> REPLACE THIS LINE WITH YOUR PAPER IDENTIFICATION NUMBER (DOUBLE-CLICK HERE TO EDIT) <
8
International Parallel and Distributed Processing Symposium (IEEE/ACM IPDPS 2001), San Francisco, Apr. 2001, pp. 17.3.1-17.3.6.
[27] Y. Li and S.-M. Yu, “Comparison of random dopant-induced threshold voltage fluctuations in nanoscale single-, double-, and surrounding-gate field effect transistors,” Japanese Journal of Applied Physics, vol. 45, no. 9A, 2006, pp. 6860-6865.
[28] Y. Li, H.-M. Chou, J.-W. Lee, and B.-S. Lee, ”A three-dimensional simulation of electrostatic characteristics for carbon nanotube array field effect transistors,” Microelectronic Engineering, vol. 81, no. 2-4, Aug. 2005, pp. 434-440.
[29] H.-M. Chou and Y. Li, “Three-dimensional simulation of nanoscale copper interconnects,” in Proc. 5th IEEE Conf. on Nanotechnology (IEEE NANO 2005), Nagoya, Japan, July 2005, pp. 721-724.
[30] Document for VTK file format. Available: http://public.kitware.com/VTK/pdf/file-formats.pdf
[31] M. Magnor and B. Girod, “Fully embedded coding of triangle meshes,” in Proc. Vision, Modeling, and Visualization (VMV’99), Erlangen, Germany, Nov. 1999, pp. 253-259.
[32] D. Luebke, M. Reddy, J. D. Cohen, A. Varshney, B. Watson, and R. Huebner, Level of Detail for 3D Graphics. Morgan Kaufmann, 2002.
[33] SAP - Smart Analysis Programs, A two- and three-dimensional interconnect simulator. Available: http://www.iue.tuwien.ac.at/76.0.html?&user_iuesoftware_pi3[showUid]=4&type=0&cHash=69311b28d7
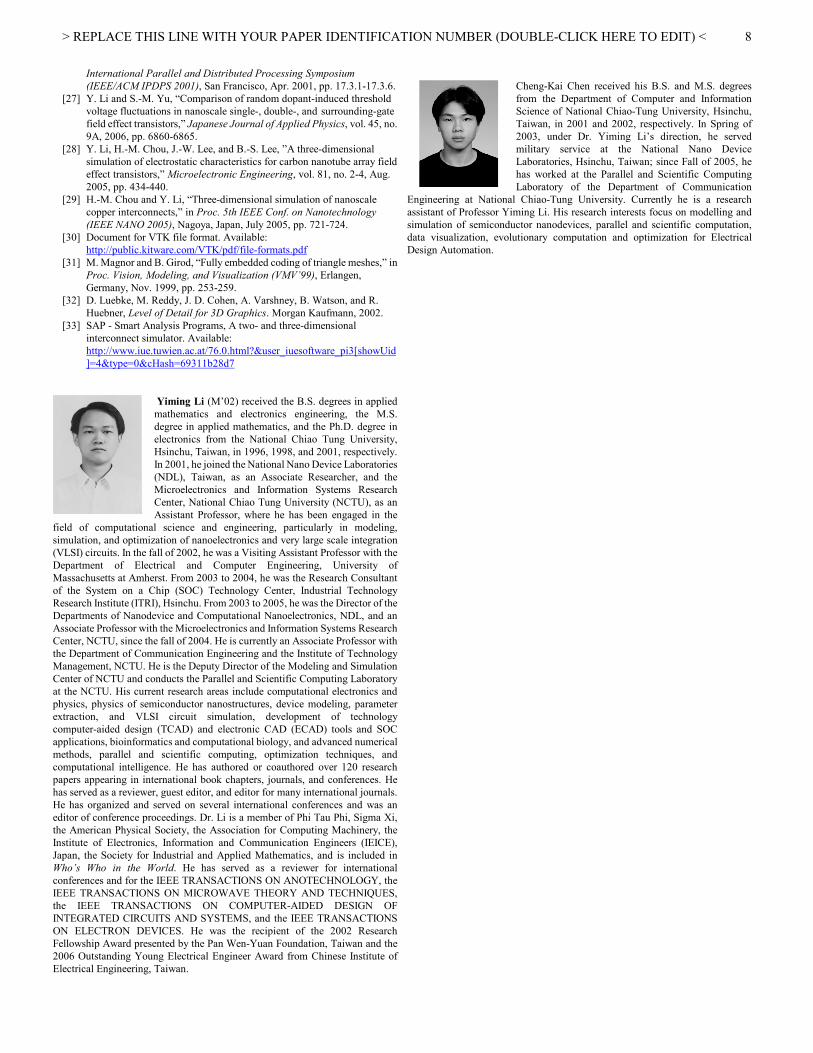
Yiming Li (M’02) received the B.S. degrees in applied mathematics and electronics engineering, the M.S. degree in applied mathematics, and the Ph.D. degree in electronics from the National Chiao Tung University, Hsinchu, Taiwan, in 1996, 1998, and 2001, respectively. In 2001, he joined the National Nano Device Laboratories (NDL), Taiwan, as an Associate Researcher, and the Microelectronics and Information Systems Research Center, National Chiao Tung University (NCTU), as an Assistant Professor, where he has been engaged in the
field of computational science and engineering, particularly in modeling, simulation, and optimization of nanoelectronics and very large scale integration (VLSI) circuits. In the fall of 2002, he was a Visiting Assistant Professor with the Department of Electrical and Computer Engineering, University of Massachusetts at Amherst. From 2003 to 2004, he was the Research Consultant of the System on a Chip (SOC) Technology Center, Industrial Technology Research Institute (ITRI), Hsinchu. From 2003 to 2005, he was the Director of the Departments of Nanodevice and Computational Nanoelectronics, NDL, and an Associate Professor with the Microelectronics and Information Systems Research Center, NCTU, since the fall of 2004. He is currently an Associate Professor with the Department of Communication Engineering and the Institute of Technology Management, NCTU. He is the Deputy Director of the Modeling and Simulation Center of NCTU and conducts the Parallel and Scientific Computing Laboratory at the NCTU. His current research areas include computational electronics and physics, physics of semiconductor nanostructures, device modeling, parameter extraction, and VLSI circuit simulation, development of technology computer-aided design (TCAD) and electronic CAD (ECAD) tools and SOC applications, bioinformatics and computational biology, and advanced numerical methods, parallel and scientific computing, optimization techniques, and computational intelligence. He has authored or coauthored over 120 research papers appearing in international book chapters, journals, and conferences. He has served as a reviewer, guest editor, and editor for many international journals. He has organized and served on several international conferences and was an editor of conference proceedings. Dr. Li is a member of Phi Tau Phi, Sigma Xi, the American Physical Society, the Association for Computing Machinery, the Institute of Electronics, Information and Communication Engineers (IEICE), Japan, the Society for Industrial and Applied Mathematics, and is included in Who’s Who in the World. He has served as a reviewer for international conferences and for the IEEE TRANSACTIONS ON ANOTECHNOLOGY, the IEEE TRANSACTIONS ON MICROWAVE THEORY AND TECHNIQUES, the IEEE TRANSACTIONS ON COMPUTER-AIDED DESIGN OF INTEGRATED CIRCUITS AND SYSTEMS, and the IEEE TRANSACTIONS ON ELECTRON DEVICES. He was the recipient of the 2002 Research Fellowship Award presented by the Pan Wen-Yuan Foundation, Taiwan and the 2006 Outstanding Young Electrical Engineer Award from Chinese Institute of Electrical Engineering, Taiwan.
Cheng-Kai Chen received his B.S. and M.S. degrees from the Department of Computer and Information Science of National Chiao-Tung University, Hsinchu, Taiwan, in 2001 and 2002, respectively. In Spring of 2003, under Dr. Yiming Li’s direction, he served military service at the National Nano Device Laboratories, Hsinchu, Taiwan; since Fall of 2005, he has worked at the Parallel and Scientific Computing Laboratory of the Department of Communication
Engineering at National Chiao-Tung University. Currently he is a research assistant of Professor Yiming Li. His research interests focus on modelling and simulation of semiconductor nanodevices, parallel and scientific computation, data visualization, evolutionary computation and optimization for Electrical Design Automation.