Viscosity Modifiers: A Fundamental Study Lelia Cosimbescu Presentations/Lubrication...
22
Viscosity Modifiers: A Fundamental Study Lelia Cosimbescu B. Tarasevich; P. Bhattacharya; J. Robinson S. Krueger; U. S. Ramasamy; A. Martini; Applied Synthetic Chemistry Group Energy Processes and Materials 1 May 16, 2016 PNNL-SA-117540
Transcript of Viscosity Modifiers: A Fundamental Study Lelia Cosimbescu Presentations/Lubrication...
Viscosity Modifiers: A Fundamental Study
Lelia Cosimbescu
B. Tarasevich; P. Bhattacharya; J. Robinson
S. Krueger; U. S. Ramasamy; A. Martini;
Applied Synthetic Chemistry Group
Energy Processes and Materials
1
May 16, 2016 PNNL-SA-117540
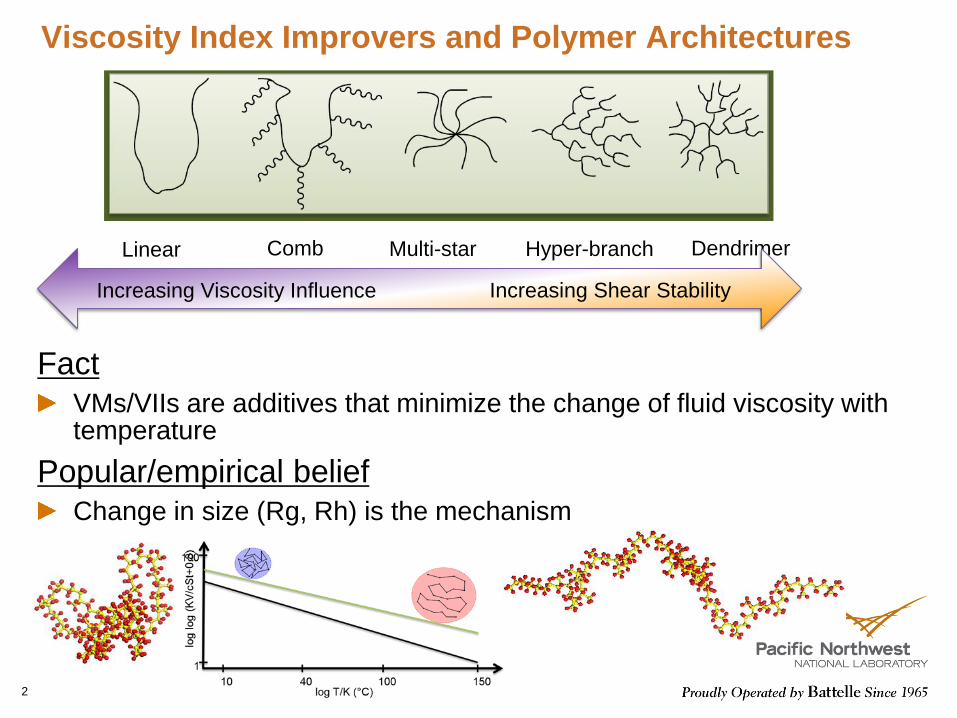
Viscosity Index Improvers and Polymer Architectures
2
Linear Comb Multi-star Hyper-branch Dendrimer
Increasing Viscosity Influence Increasing Shear Stability
Fact
VMs/VIIs are additives that minimize the change of fluid viscosity with temperature
Popular/empirical belief
Change in size (Rg, Rh) is the mechanism

Probing the Mechanism
Methods used to probe the expansion mechanisms
Direct methods
Small angle neutron scattering (SANS)
Dynamic light scattering (DLS)
Triple detection size exclusion chromatography (SEC)
Indirect Methods
Flory-Fox Equation (change in coil size is directly proportional to change in the
intrinsic viscosity)
Molecular dynamic simulations (MDS)
Simulation structures are created by placing one model VI polymer in an alkane
solvent
Requirement: measurements/simulation must be run at 40 and 100 oC
Viscosity Index is a measure of the change of fluid viscosity with temperature (based on KV40 and KV100)
Can we predict VIs with any of the methods?
3

Prior Studies
4
Conclusions
PAMA aka PMA polymers suggest a coil expansion mechanism
OCP is actually shrinking upon heating
M.J. Covitch, K.J. Trickett, Advances in Chemical Engineering and Science, (5),
134-151 (2015)
Polymer
Radius of Gyration / nm
Dodecane 400C
Dodecane 1000C
Xylene 400C
Xylene 1000C
OCP1 12.4 11.1 11.9 12.4
PMA1 12.8 13.6 12.9 13.4
PMA2 15.5 17.3 17.5 18.1
Rg data from SANS Experiments

5
DLS studies (PNNL)
Polymers were dissolved in hexadecane at 0.5% and then
centrifuged to remove large aggregates (6000 nm diameter) to
improve the autocorrelation function (ACF)
The average diameters were determined with temperature
corrected solvent viscosities
Temperature sweep from RT to ~90 oC (software limitation)
A measurement was taken every 5-10 oC
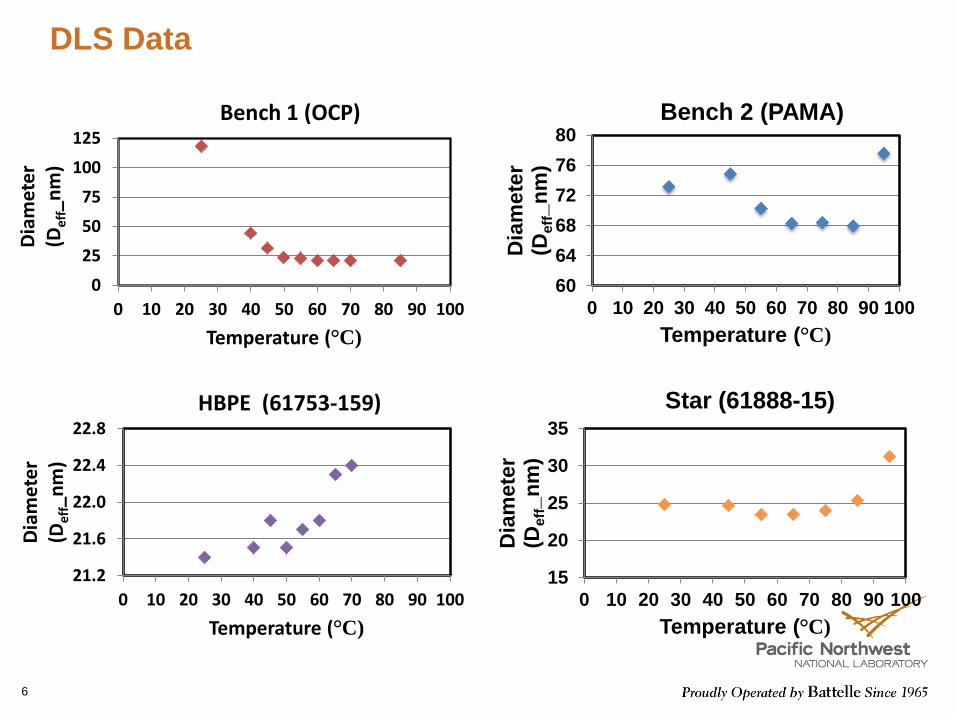
DLS Data
6
0
25
50
75
100
125
0 10 20 30 40 50 60 70 80 90 100
Dia
met
er
(D
eff_
nm
)
Temperature (°C)
Bench 1 (OCP)
60
64
68
72
76
80
0 10 20 30 40 50 60 70 80 90 100
Dia
mete
r (D
eff_n
m)
Temperature (°C)
Bench 2 (PAMA)
21.2
21.6
22.0
22.4
22.8
0 10 20 30 40 50 60 70 80 90 100
Dia
met
er
(Def
f_n
m)
Temperature (°C)
HBPE (61753-159)
15
20
25
30
35
0 10 20 30 40 50 60 70 80 90 100
Dia
mete
r (D
eff_n
m)
Temperature (°C)
Star (61888-15)

DLS Results
Positive/Negative percent indicates size increases/decreases at higher
temperatures
Bench 1 (OCP) shows large decrease in size throughout the temperature
range tested
Bench 2 (PAMA) shows a moderate decrease in size throughout the
temperature range tested, with a slight increase at the highest T
HBPE shows negligible change with a slight increase in size from low to high T
Star polymer shows a high increase in size from low T to high T
7
VI=188
VI=238
VI=185
VI=204

Molecular Dynamic Simulations (UC Merced)
8 OCP in dodecane
Individual polymers are placed in dodecane (solvent mimic for oil)
Characterization simulation at 40 and 100 oC
Radius of gyration (Rg) information is collected for 100ns of simulation time
Frequency histograms are plotted with the collected Rg data
%change is estimated using the following equation:

Rg Distribution for Various Structures
Significant size
increase with
temperature
9
PAMA Mean Stdev
40 ºC 17.1 0.7
100 ºC 22.5 3.0
OCP Mean Stdev
40 ºC 16.5 3.6
100 ºC 16.1 3.7
Marginal size decrease
Agrees with DLS
No agreement with DLS

Rg Distribution for Various Structures
10
HBPE Mean Stdev
40 ºC 17.2 2.6
100 ºC 17.3 2.7
Star Mean Stdev
40 ºC 21.5 1.3
100 ºC 21.0 1.6
No change in size
with increasing
temperature
Slight decrease
in size with
increasing
temperature
Agrees with DLS
No agreement with DLS

MD Simulations Summary
PAMA shows a significant increase in Rg with temperature
OCP and Star show a marginal decrease in Rg
HBPE remains the same
11
Mean PAMA OCP HBPE Star
40 ̊C 17.1 16.5 17.2 21.5
100 ̊C 22.5 16.1 17.3 21.0
% Change 31.5 -2.2 0.18 -2.4

SANS Measurements (NIST)
12
NG-7 -- 30-m SANS instrument
Temperature sweep: 25, 40, 70 and 100 oC
Samples ran in deuterated hexadecane-d34 (good base oil mimic)
Analogs: Bench 1 (OCP), Bench 2 (PAMA), 61888 (Star), 61753 (HBPE-
hyperbranched)
Constant concentration of 0.5% (w/w) for all
SANS profile plots generated: scattering vector Q, versus scattering intensity I(Q)
Fit the data to established models (Porod exponent, n)

SANS Raw Data for HBPE
13

Example of fitting curves for HBPE at 25 oC
14

SANS - Radius of Gyration Values
Polymer excluded volume fitting function
Good fit for Bench 1 (OCP) and Bench 2 (PAMA)
Porod exponent = 3, would mean collapsed polymer coil
15
Sample Rg Porod
bench1_25c.abs 143 1.75 bench1_100c.abs 135 1.71
HBPE_25c.abs 124 1.98 HBPE_100c.abs 126 1.93
Star_25c.abs 95 2.0 Star_100c.abs 105 1.9
bench2_25c.abs 290 1.85 bench2_100c.abs 258 1.72
OCP
HBPE
Star
PAMA

SANS and DLS comparison
Bench 1 (OCP), star and hyperbranched show same trend
OCP first point may be an outlier
Bench 2 - PAMA shows opposite trends
Anomalous behavior in the range studied 16

Summary- Temperature Effects on Polymer Size
Not all methods agree
Experimental methods (DLS and SANS) agree with exception of PAMA
17
Method PAMA OCP HBPE Star
SANS (Rg)
DLS (Rh)
MD (Rg) Marginal Marginal
VI=188 VI=238 VI=185 VI=204

Conclusions
Can we predict polymer behavior (VI) with SANS, DLS, MD?
The short answer is NO, at least not fully
Due to more complex interactions and effects
Inter and intra-molecular interactions not accounted for
Shear resistance
Polarity
Molecular weight (huge influence on viscosity)
Topology and architecture
18

Conclusions Cont’d
If multiple methods point in the same direction, size changes with temperature of
can be predicted
However, VI cannot be predicted
OCP data agrees with literature
PAMA data is in disagreement
19

Acknowledgements
Funding DOE: Kevin Stork
The PNNL Team
Dr. Joshua Robinson (synthesis)
Dr. Barbara Tarasevich (DLS)
Dr. Priyanka Bhattacharya (DLS)
NIST
Dr. Susan Krueger
UC Merced
Dr. Ashlie Martini
Uma Shantini Ramasamy
Evonik
David Gray, JoRuetta Ellington
Afton Chemical
Dr. Jeff Guevremont
20

Extra data
Fit correlations for analogs with Porod exponent ~2
21
Sample Corr Leng Porod Bgnd
61753_25c.abs 93 1.96 .08
61753_100c.abs 93 1.94 0.09
61888_25c.abs 56 2.0 .08
61888_100c.abs 68 2.0 .09

SANS Data
22
Sample Scale Fact Rg Porod Bgnd
bench1_25c.abs 3.1 143 1.75 .09
bench1_100c.abs 2.7 135 1.71 .1
bench1_25c.sub 2.9 141 1.83 -.001
bench1_100c.sub 2.5 130 1.85 -.001
61753_25c.abs 5.4 124 1.98 .08
61753_100c.abs 4.9 126 1.93 .09
61753_25c.sub 5.3 126 2.0 -.004
61753_100c.sub 4.8 127 1.98 -.004
61888_25c.abs 5.0 95 2.0 .08
61888_100c.abs 4.5 105 1.9 .09
61888_25c.sub 4.7 92 2.1 -.004
61888_100c.sub 4.2 103 2.0 -.004
bench2_25c.abs 47 290 1.85 .09
bench2_100c.abs 22 258 1.72 .1
bench2_25c.sub 45 278 1.9 -.004
bench2_100c.sub 20 243 1.8 -.004