Visa Inc. 2017 Investor Day Visa: The Investment Proposition · Visa Inc. 2017 Investor Day Visa:...
40
Visa Inc. 2017 Investor Day Visa: The Investment Proposition Vasant Prabhu Chief Financial Officer
Transcript of Visa Inc. 2017 Investor Day Visa: The Investment Proposition · Visa Inc. 2017 Investor Day Visa:...
Visa Inc. 2017 Investor Day
Visa: The Investment Proposition
Vasant Prabhu
Chief Financial Officer
Visa: The Investment Proposition
• The Global Growth Opportunity
• Visa’s Core Assets
• Capturing the Growth Opportunity
• Managing the Challenges
• Visa’s Track Record
• The Growth Model
• Capital Allocation Priorities
The Global Growth Opportunity
• $17 Trillion cash and check conversion opportunity
• Growth is approaching an inflectionpoint, one of four over Visa’s 60 year history
• Connected devices could drive a massive expansion in use cases and acceptance points
• Significant opportunity to accelerate payments volume and transaction growth
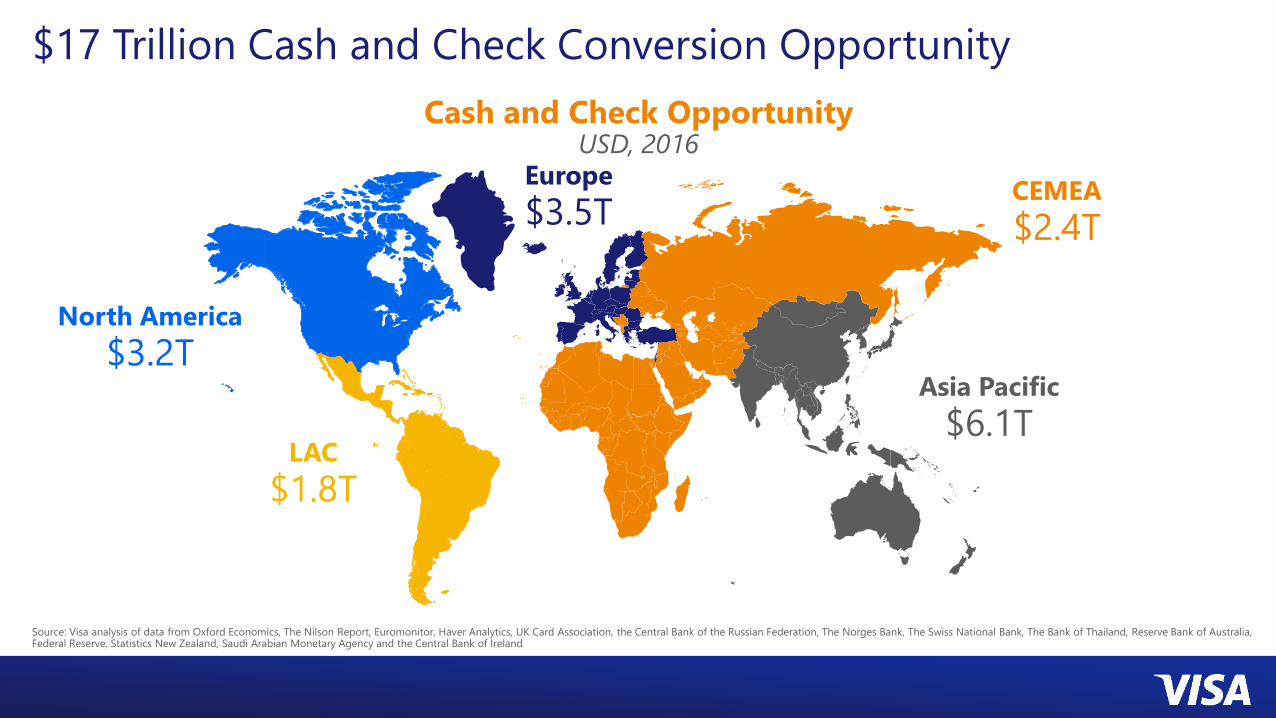
North America
$3.2TAsia Pacific
$6.1T
Europe
$3.5T
LAC
$1.8T
Cash and Check OpportunityUSD, 2016
CEMEA
$2.4T
$17 Trillion Cash and Check Conversion Opportunity
Source: Visa analysis of data from Oxford Economics, The Nilson Report, Euromonitor, Haver Analytics, UK Card Association, the Central Bank of the Russian Federation, The Norges Bank, The Swiss National Bank, The Bank of Thailand, Reserve Bank of Australia, Federal Reserve, Statistics New Zealand, Saudi Arabian Monetary Agency and the Central Bank of Ireland
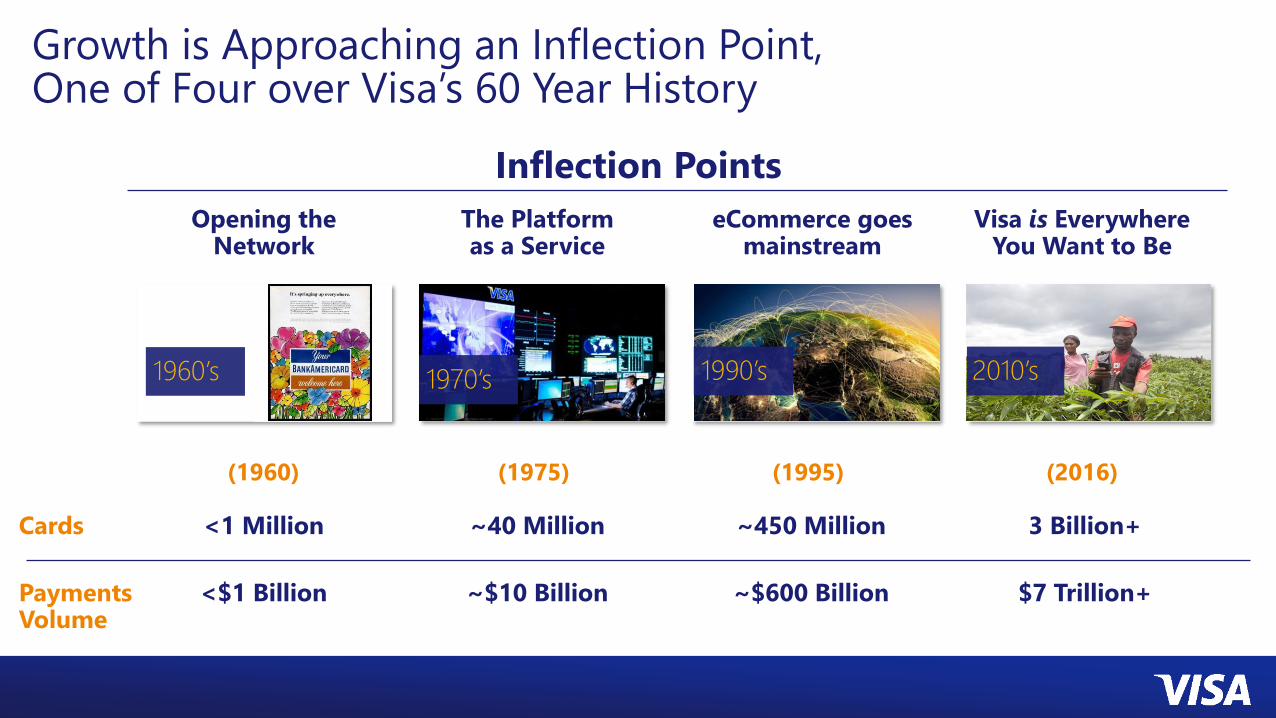
Growth is Approaching an Inflection Point, One of Four over Visa’s 60 Year History
Cards
Payments Volume
| Opportunity Through New Inflection Points | June 7, 20173
1970’s
~40 Million
~$10 Billion
(1975)
The Platform as a Service
| Opportunity Through New Inflection Points | June 7, 20174
1990’s
~450 Million
~$600 Billion
(1995)
eCommerce goes mainstream
2010’s
3 Billion+
$7 Trillion+
(2016)
Visa is Everywhere You Want to Be
Inflection Points
1960’s
<1 Million
<$1 Billion
(1960)
Opening the Network
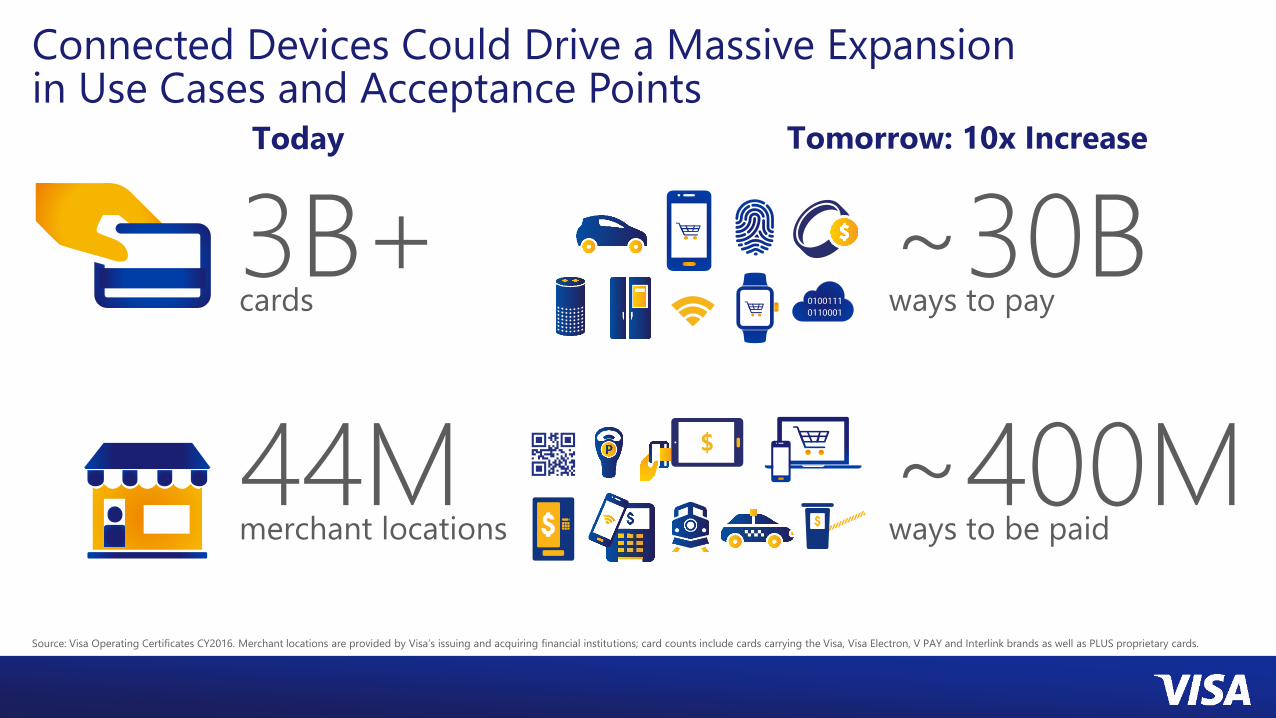
Connected Devices Could Drive a Massive Expansion in Use Cases and Acceptance Points
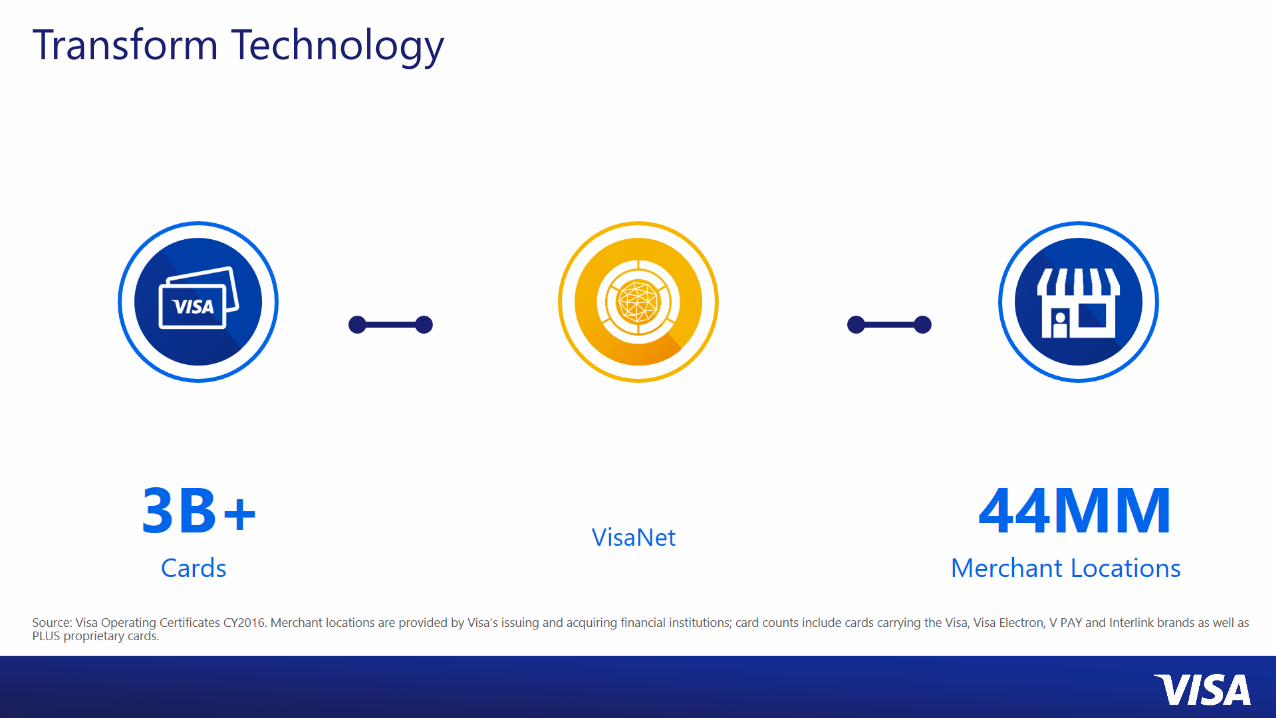
Source: Visa Operating Certificates CY2016. Merchant locations are provided by Visa’s issuing and acquiring financial institutions; card counts include cards carrying the Visa, Visa Electron, V PAY and Interlink brands as well as PLUS proprietary cards.
Today
3B+cards
44Mmerchant locations
Tomorrow: 10x Increase
~30Bways to pay
~400Mways to be paid
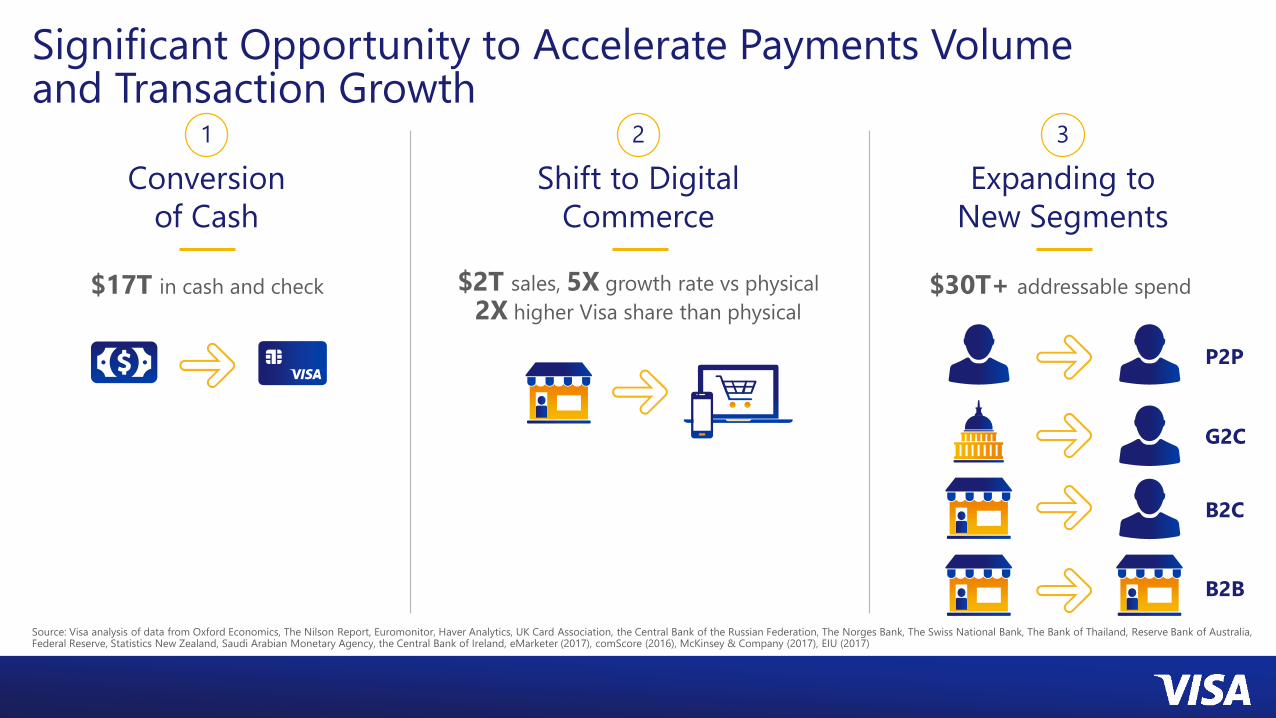
1
Conversion
of Cash
$17T in cash and check
2
Shift to Digital
Commerce
$2T sales, 5X growth rate vs physical
2X higher Visa share than physical
3
Expanding to
New Segments
$30T+ addressable spend
B2B
P2P
G2C
B2C
Significant Opportunity to Accelerate Payments Volume and Transaction Growth
Source: Visa analysis of data from Oxford Economics, The Nilson Report, Euromonitor, Haver Analytics, UK Card Association, the Central Bank of the Russian Federation, The Norges Bank, The Swiss National Bank, The Bank of Thailand, Reserve Bank of Australia, Federal Reserve, Statistics New Zealand, Saudi Arabian Monetary Agency, the Central Bank of Ireland, eMarketer (2017), comScore (2016), McKinsey & Company (2017), EIU (2017)
Visa’s Core Assets
The resources of the four-party network reinforced by new strategic partners
The scale, reliability and security of VisaNet
The power of the Visa Brand
Financial resources of Global Visa
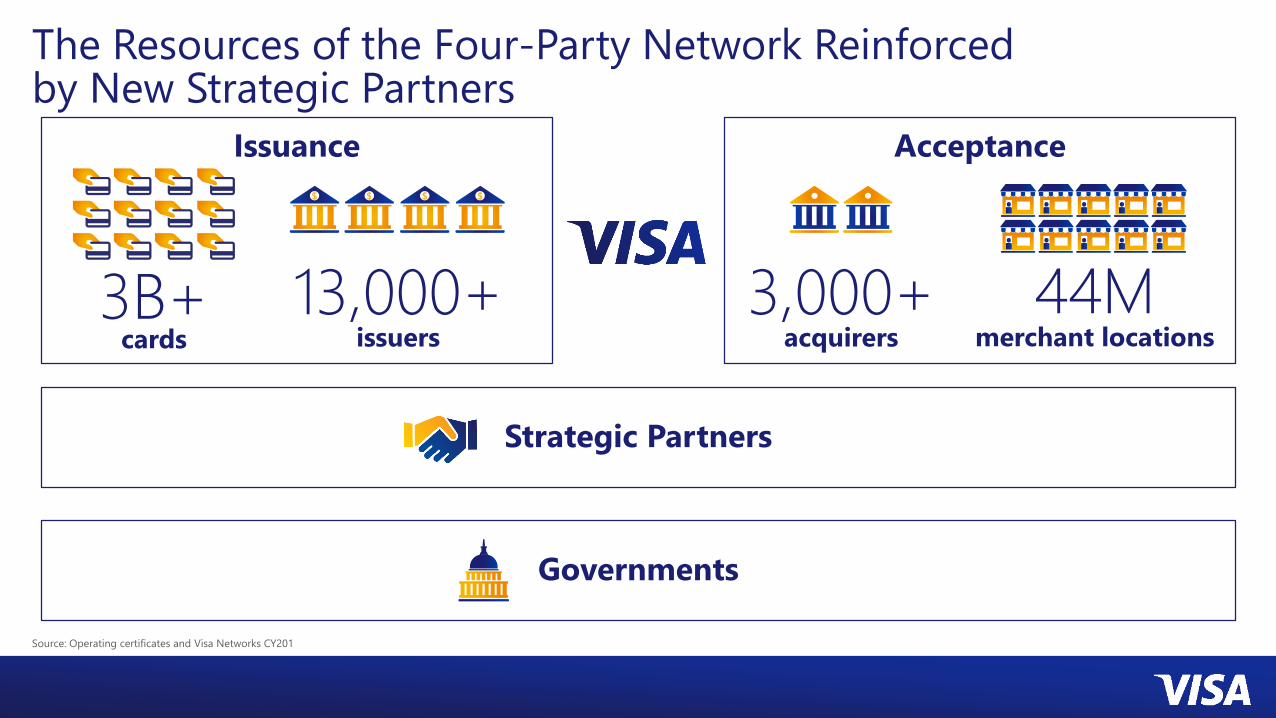
The Resources of the Four-Party Network Reinforced by New Strategic Partners
Source: Operating certificates and Visa Networks CY201
Issuance Acceptance
Strategic Partners
Governments
3B+cards
13,000+ issuers
3,000+acquirers
44Mmerchant locations
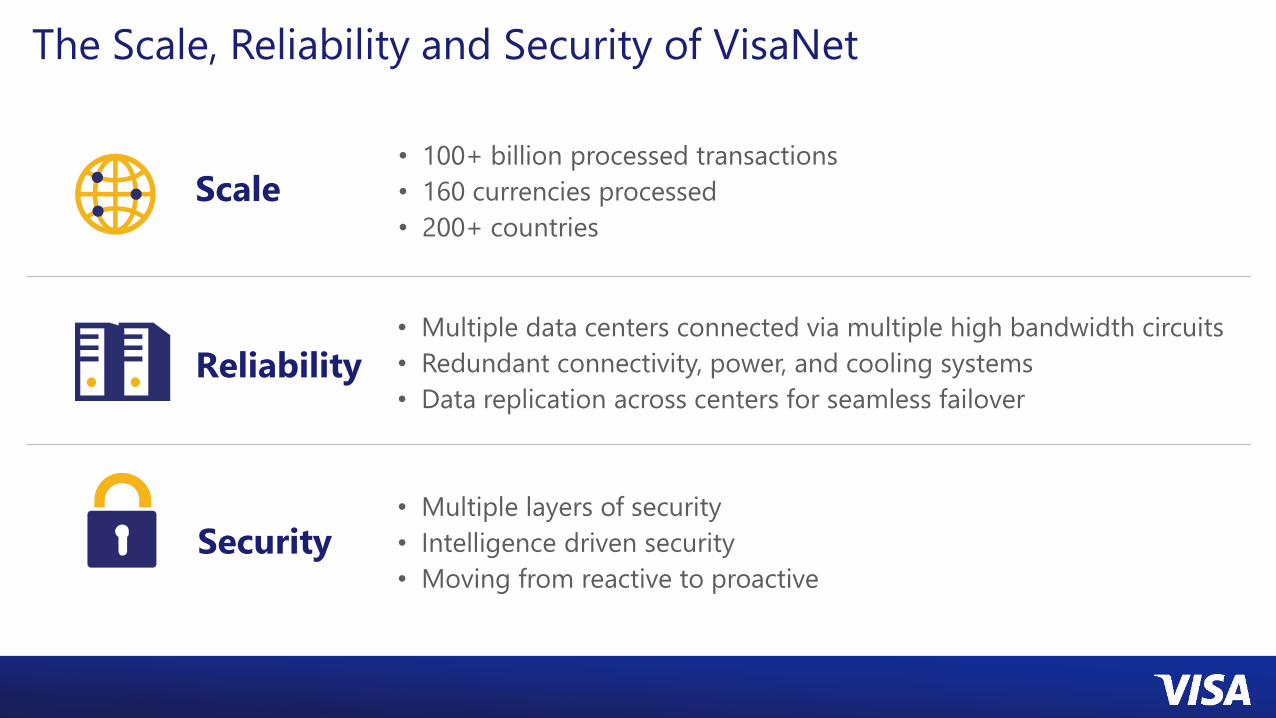
Scale
Reliability
Security
• 100+ billion processed transactions
• 160 currencies processed
• 200+ countries
• Multiple data centers connected via multiple high bandwidth circuits
• Redundant connectivity, power, and cooling systems
• Data replication across centers for seamless failover
• Multiple layers of security
• Intelligence driven security
• Moving from reactive to proactive
The Scale, Reliability and Security of VisaNet
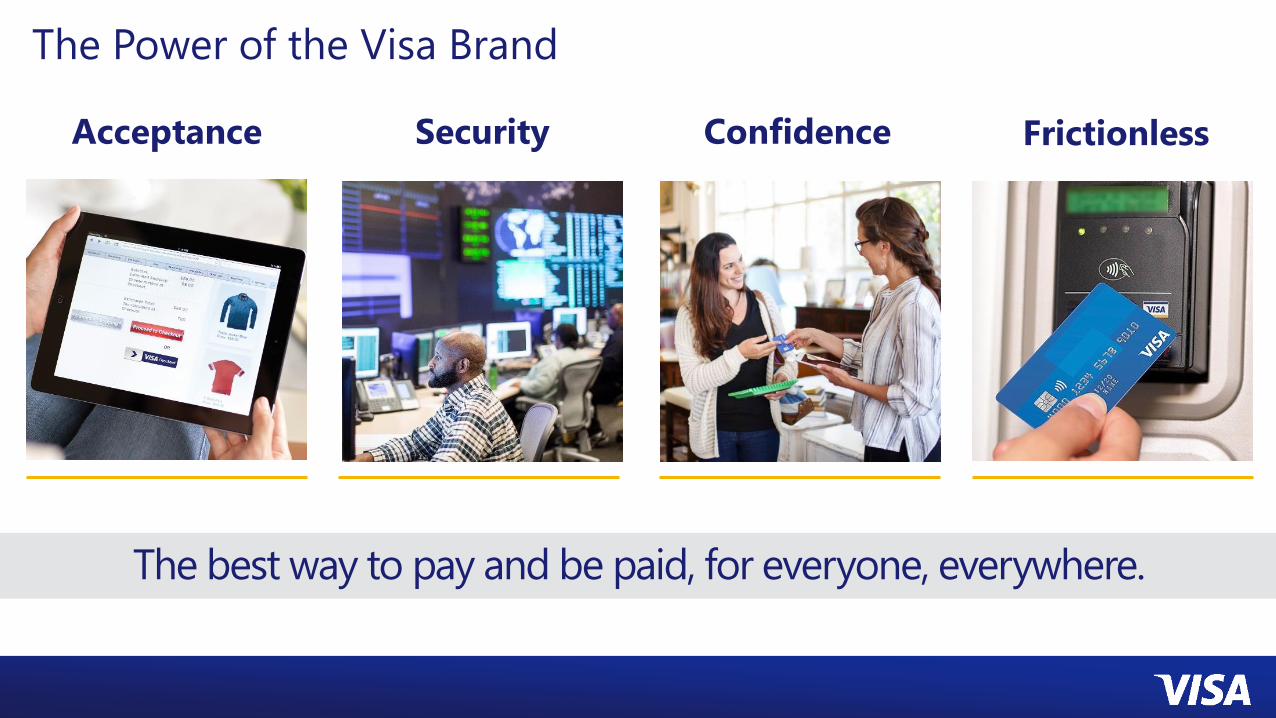
The Power of the Visa Brand
ConfidenceSecurityAcceptance Frictionless
The best way to pay and be paid, for everyone, everywhere.
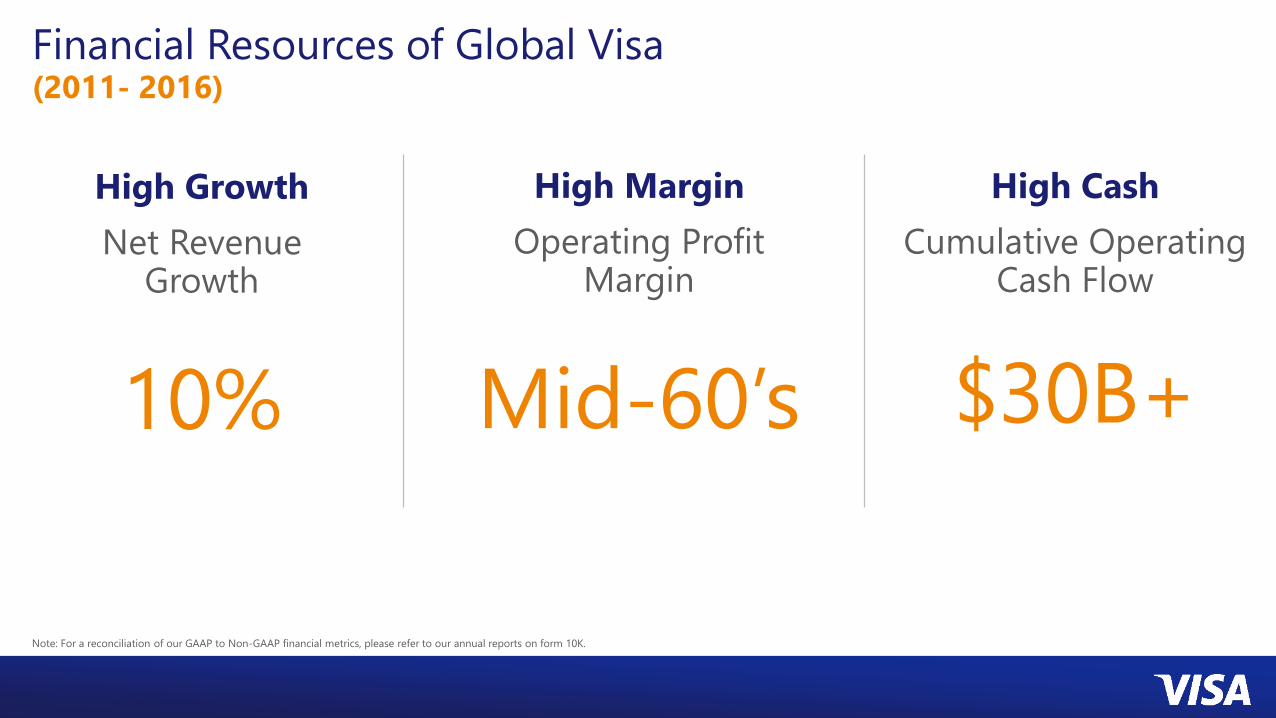
Financial Resources of Global Visa(2011- 2016)
Note: For a reconciliation of our GAAP to Non-GAAP financial metrics, please refer to our annual reports on form 10K.
High Growth
Net RevenueGrowth
10%
High Margin
Operating ProfitMargin
Mid-60’s
High Cash
Cumulative Operating Cash Flow
$30B+
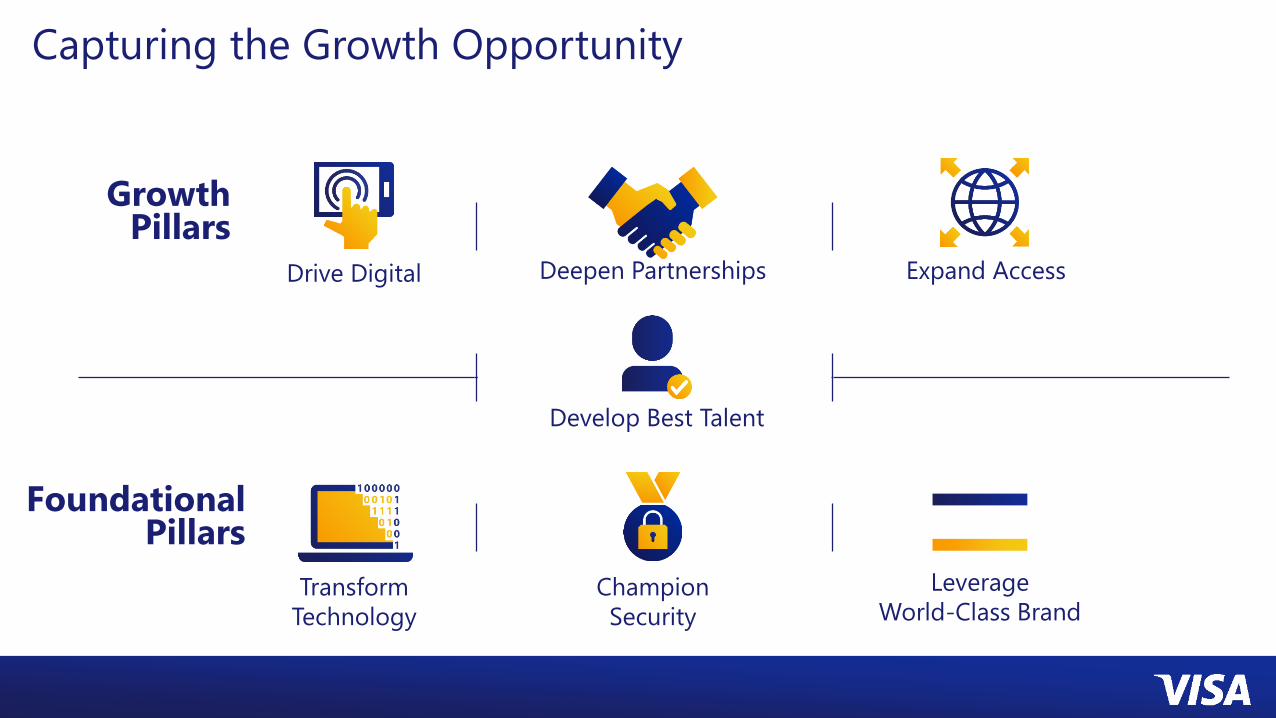
Capturing the Growth Opportunity
Develop Best Talent
Transform
Technology
Champion
Security
Foundational Pillars
Leverage
World-Class Brand
Drive Digital Deepen Partnerships Expand Access
Growth Pillars
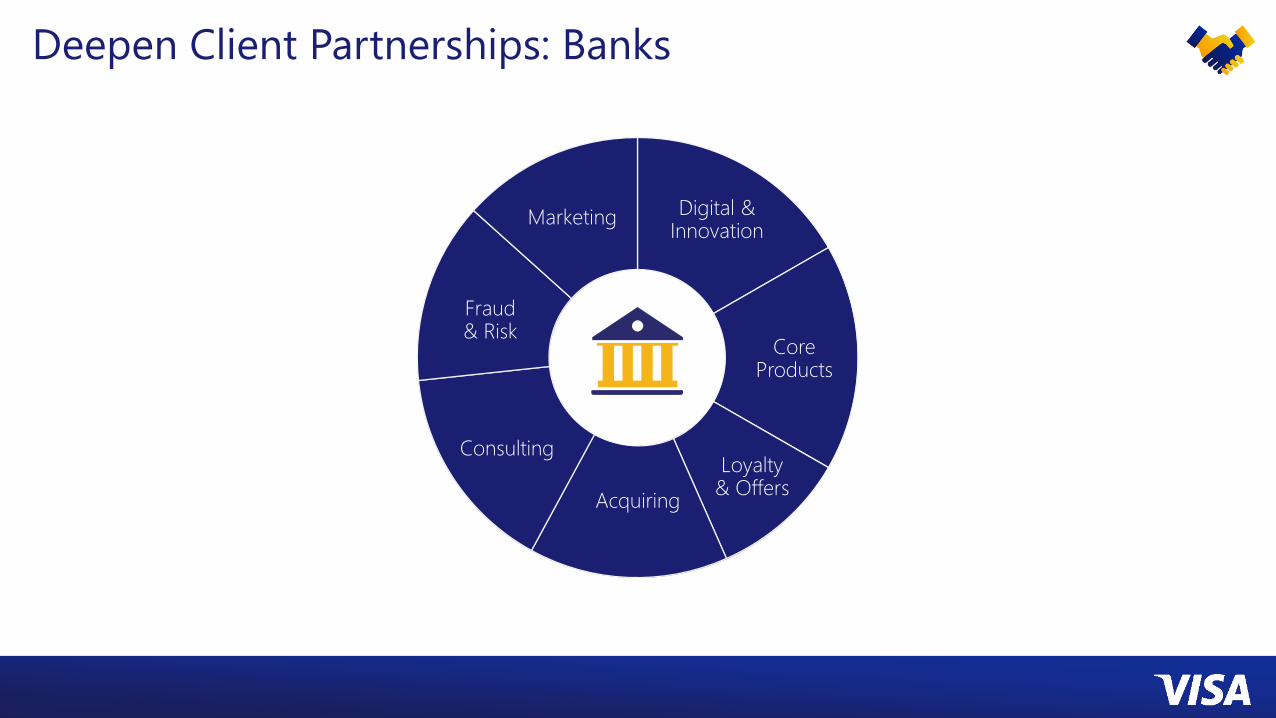
Deepen Client Partnerships: Banks
Loyalty & Offers
Acquiring
Consulting
Fraud & Risk
Marketing Digital & Innovation
Core Products
STIP
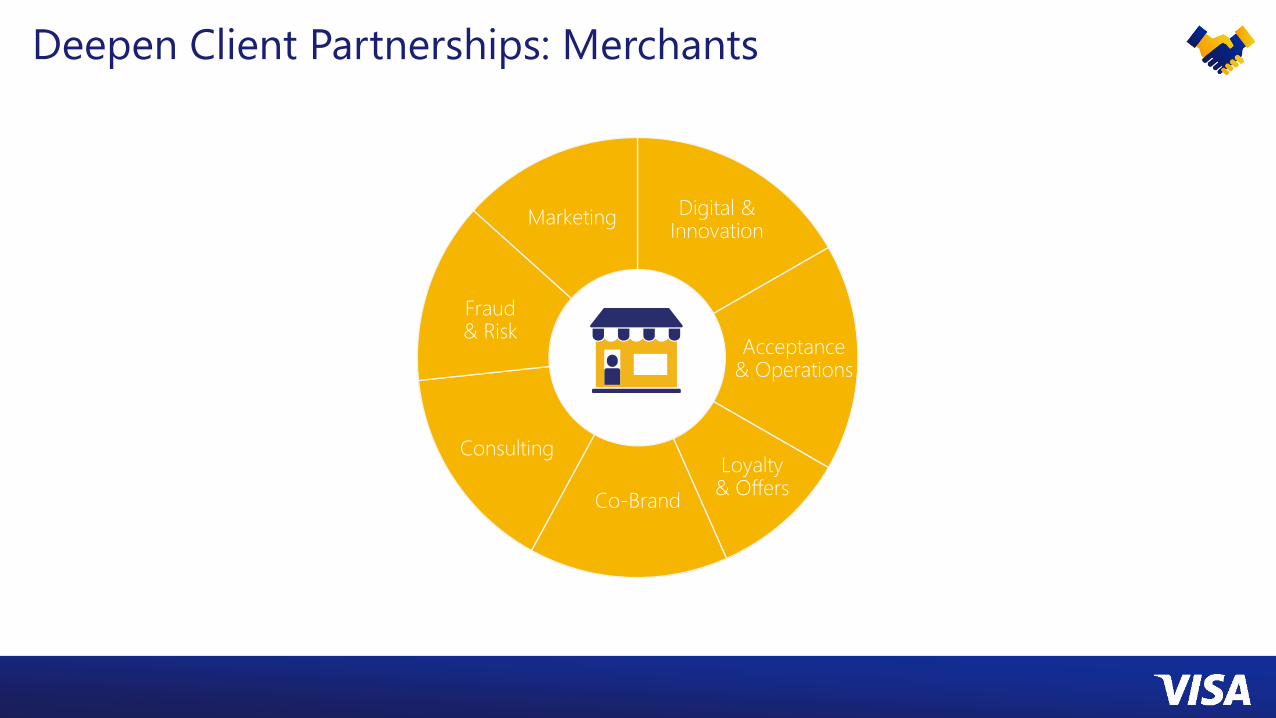
Deepen Client Partnerships: Merchants
Loyalty & Offers
Co-Brand
Consulting
Fraud & Risk
Marketing Digital & Innovation
Acceptance& Operations
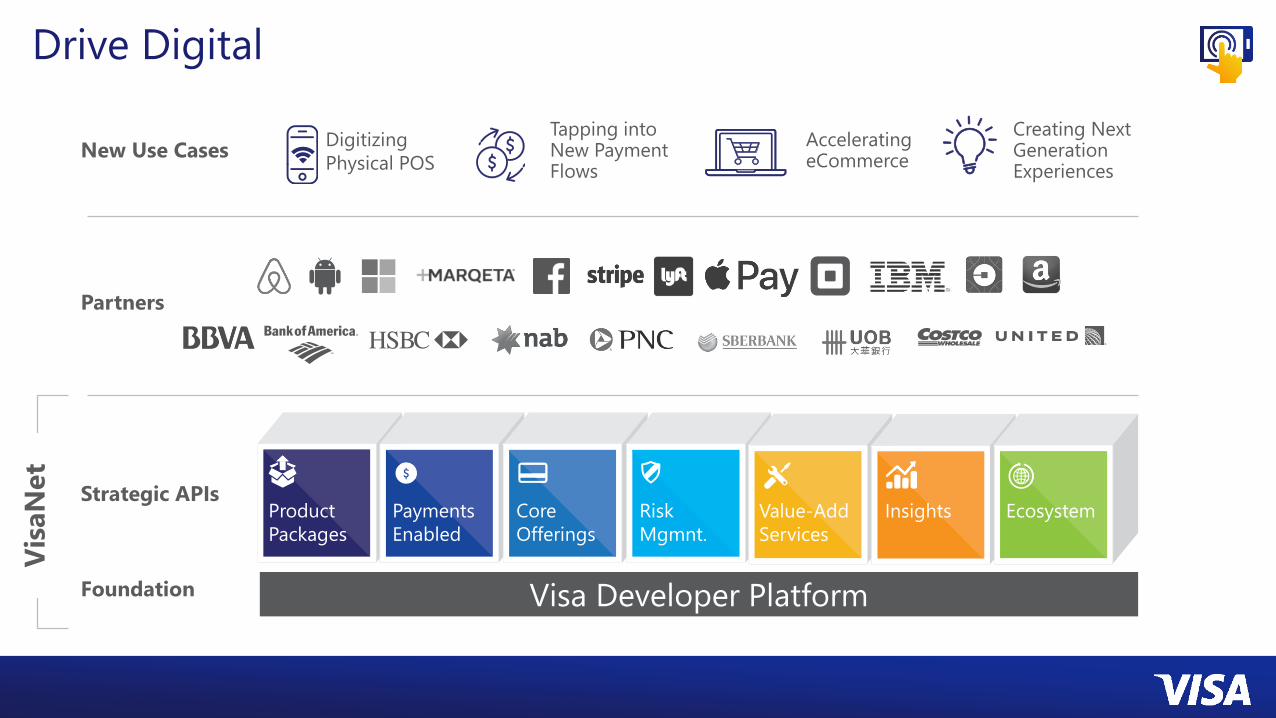
New Use Cases
Visa Developer PlatformFoundation
Vis
aN
et
Strategic APIs
Partners
Product
Packages
Payments
Enabled
Core
Offerings
Risk
Mgmnt.
Value-Add
Services
Insights Ecosystem
Drive Digital
Digitizing
Physical POS
Accelerating eCommerce
Tapping into New Payment Flows
Creating Next Generation Experiences
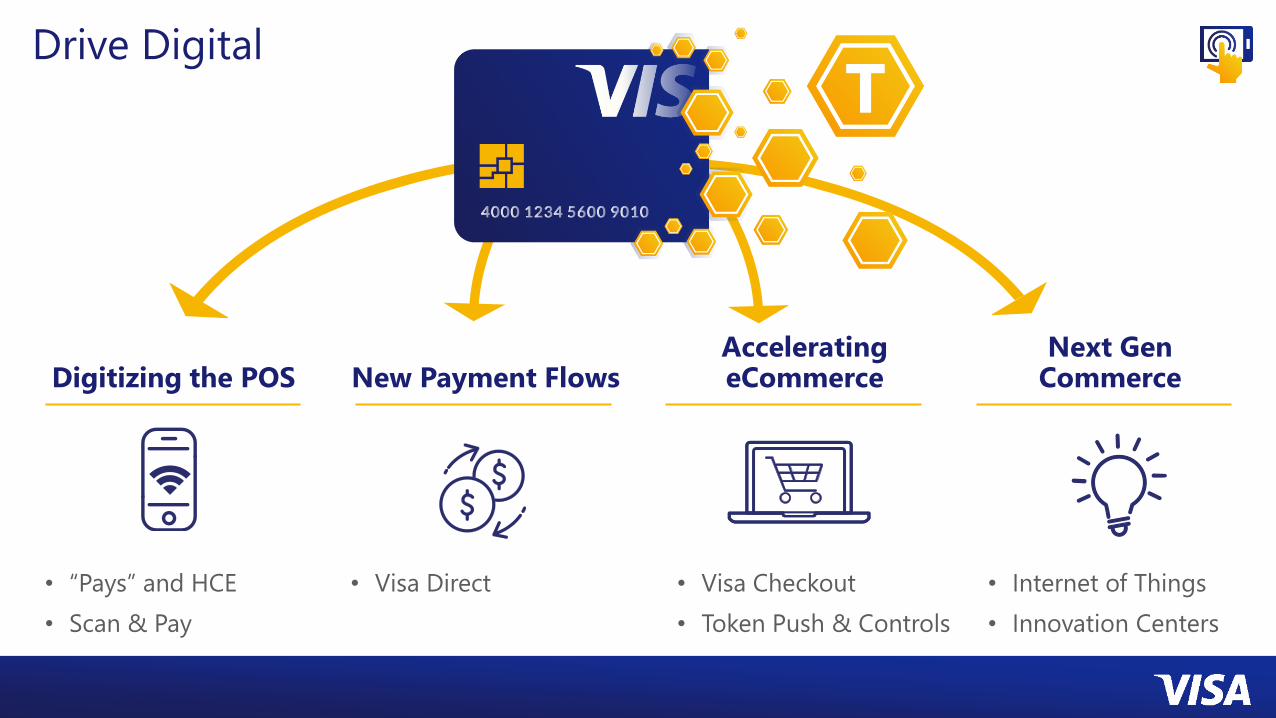
Drive Digital
Digitizing the POSAccelerating eCommerce
Next Gen CommerceNew Payment Flows
• Visa Checkout
• Token Push & Controls
• Internet of Things
• Innovation Centers
• Visa Direct• “Pays” and HCE
• Scan & Pay
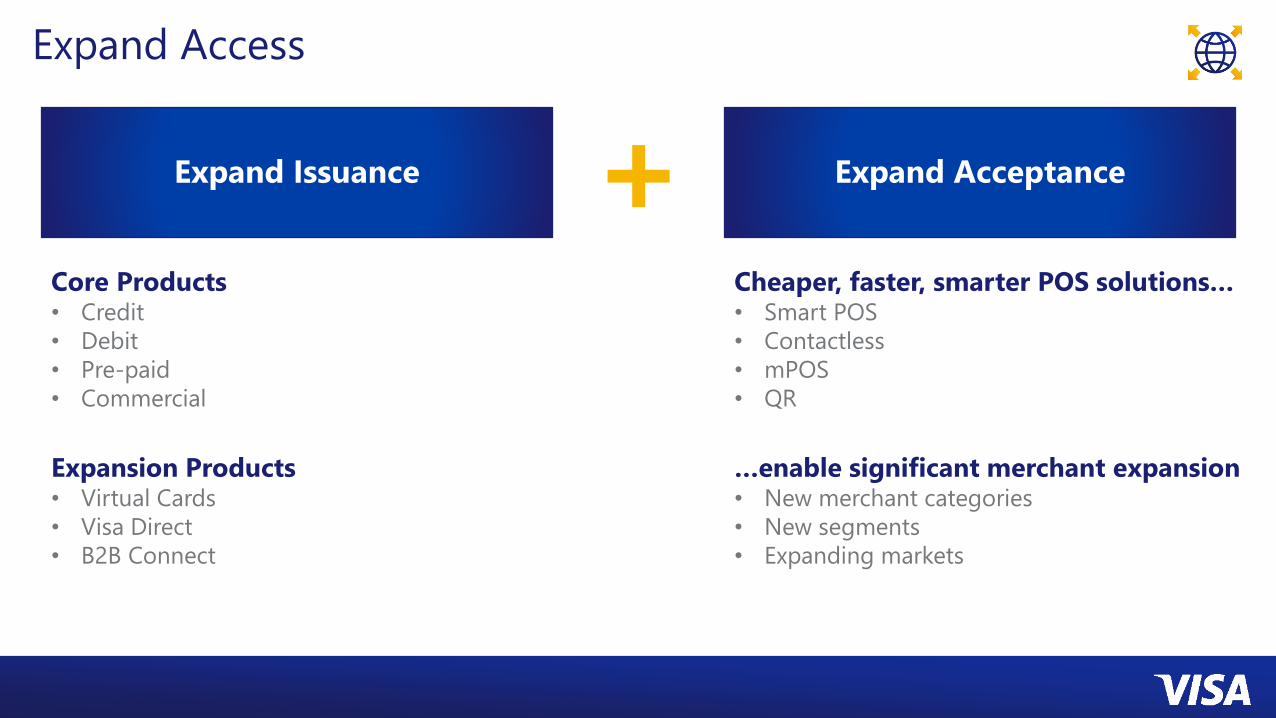
Expand Access
Expand Acceptance+Expand Issuance
Core Products• Credit
• Debit
• Pre-paid
• Commercial
Expansion Products• Virtual Cards
• Visa Direct
• B2B Connect
Cheaper, faster, smarter POS solutions…• Smart POS
• Contactless
• mPOS
• QR
…enable significant merchant expansion• New merchant categories
• New segments
• Expanding markets
Transform Technology
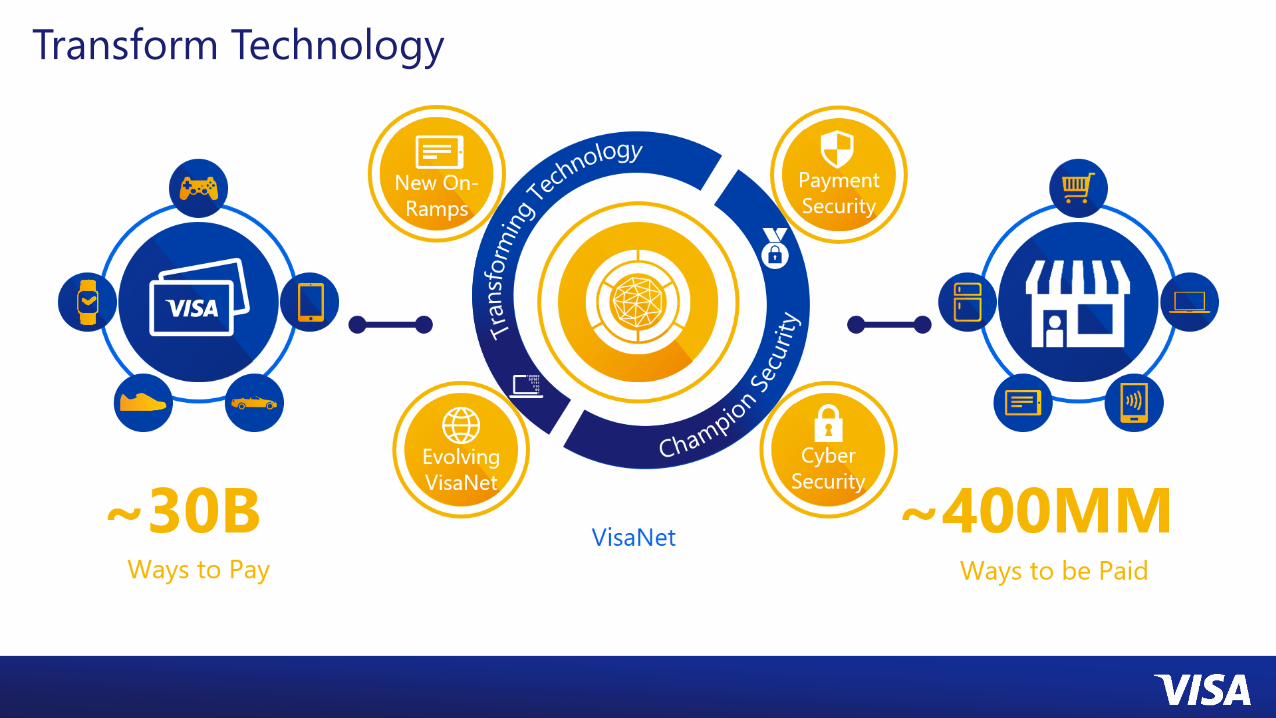
Transform Technology
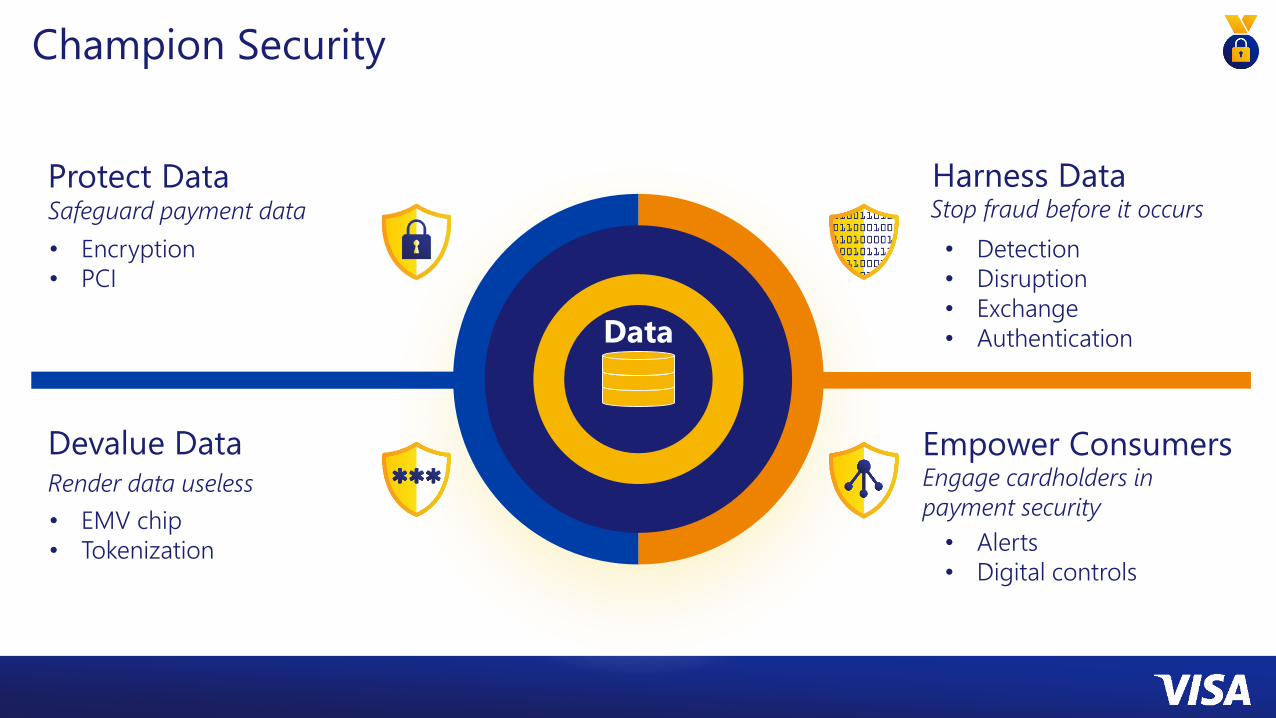
Champion Security
Empower ConsumersEngage cardholders in
payment security
Devalue DataRender data useless
Protect DataSafeguard payment data
Harness DataStop fraud before it occurs
• Encryption
• PCI
• Detection
• Disruption
• Exchange
• Authentication
• EMV chip
• Tokenization • Alerts
• Digital controls
Data
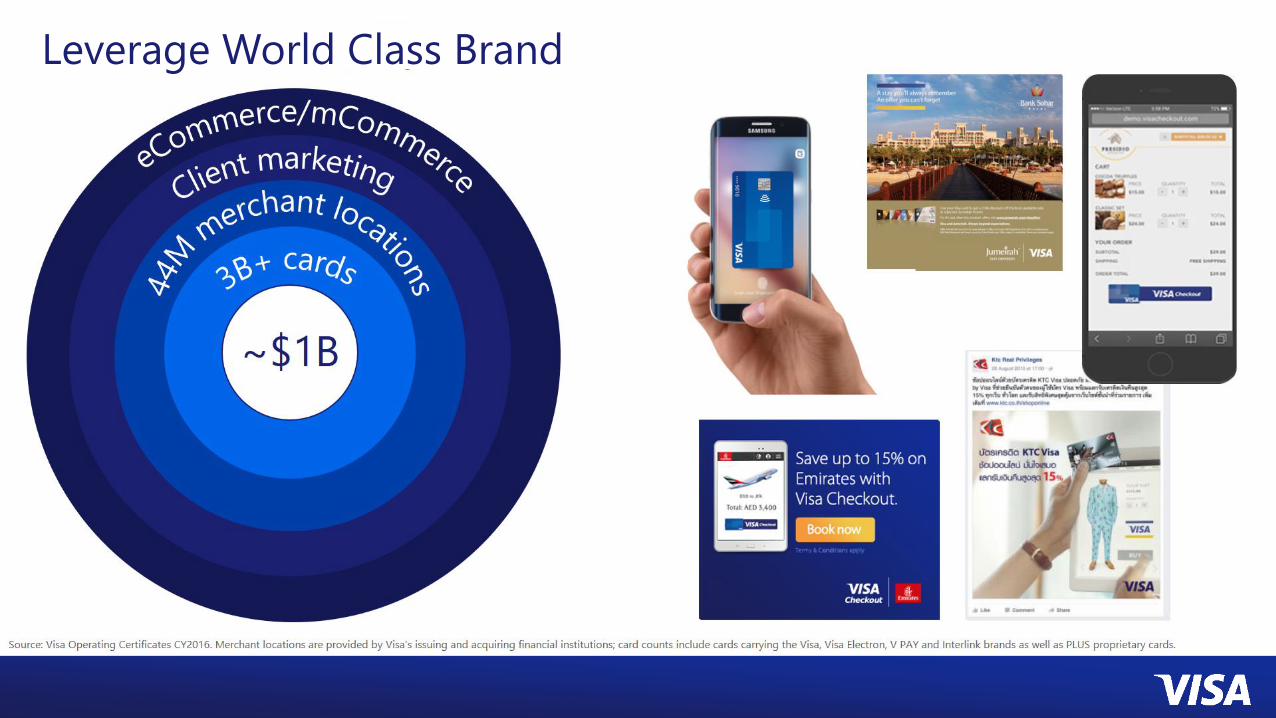
Leverage World Class Brand
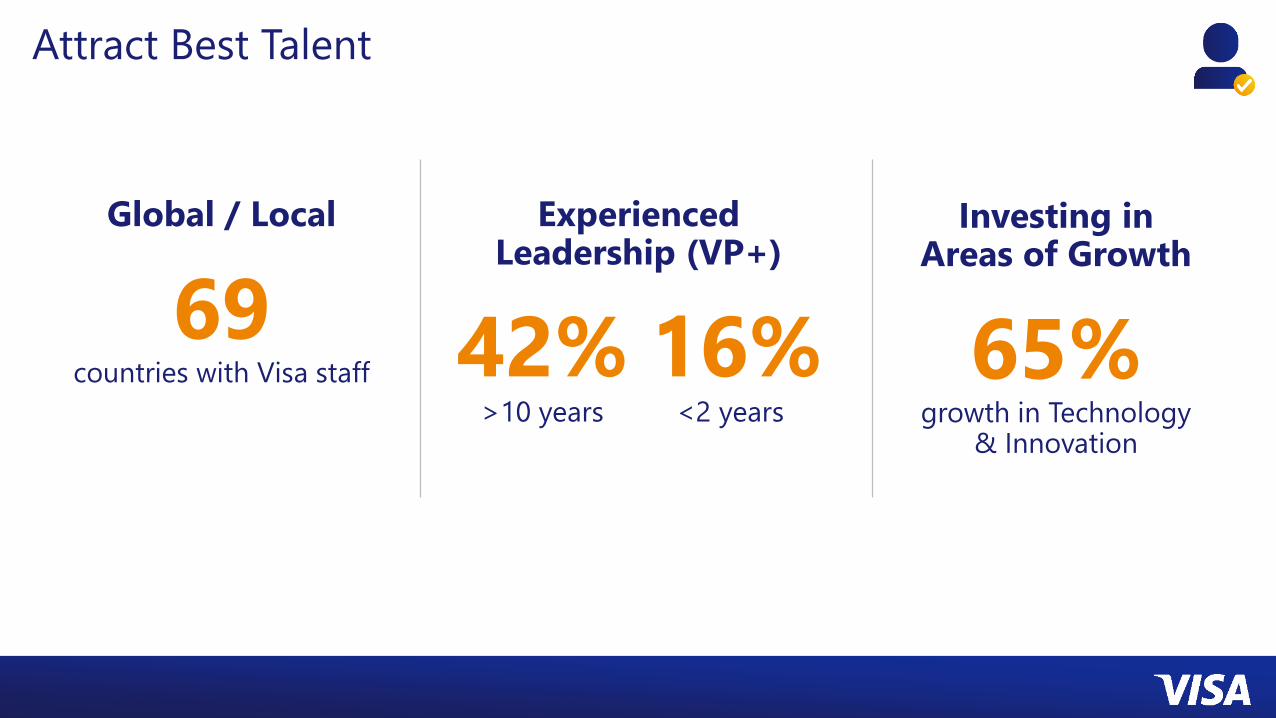
Attract Best Talent
Global / Local
69countries with Visa staff
Investing in Areas of Growth
65%growth in Technology
& Innovation
Experienced Leadership (VP+)
42% 16%>10 years <2 years
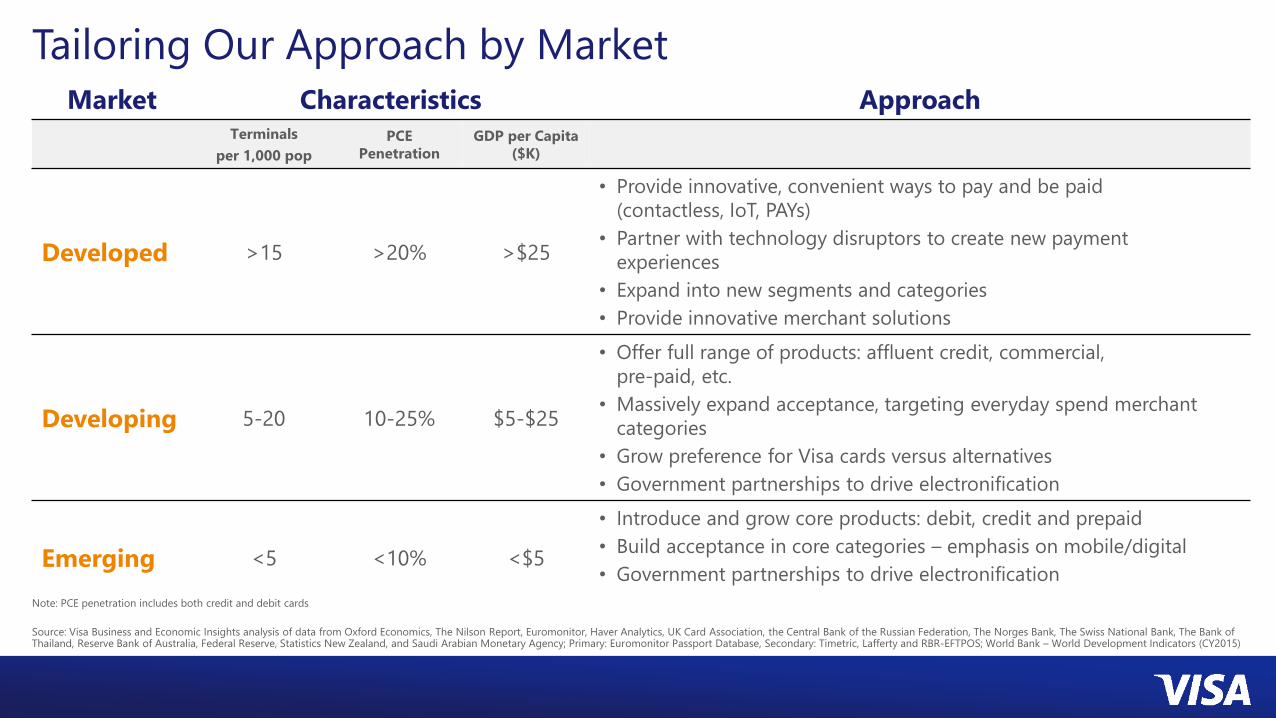
Tailoring Our Approach by Market
Note: PCE penetration includes both credit and debit cards
Source: Visa Business and Economic Insights analysis of data from Oxford Economics, The Nilson Report, Euromonitor, Haver Analytics, UK Card Association, the Central Bank of the Russian Federation, The Norges Bank, The Swiss National Bank, The Bank of Thailand, Reserve Bank of Australia, Federal Reserve, Statistics New Zealand, and Saudi Arabian Monetary Agency; Primary: Euromonitor Passport Database, Secondary: Timetric, Lafferty and RBR-EFTPOS; World Bank – World Development Indicators (CY2015)
Market Characteristics ApproachTerminals
per 1,000 pop
PCE
Penetration
GDP per Capita
($K)
Developed >15 >20% >$25
• Provide innovative, convenient ways to pay and be paid
(contactless, IoT, PAYs)
• Partner with technology disruptors to create new payment
experiences
• Expand into new segments and categories
• Provide innovative merchant solutions
Developing 5-20 10-25% $5-$25
• Offer full range of products: affluent credit, commercial,
pre-paid, etc.
• Massively expand acceptance, targeting everyday spend merchant
categories
• Grow preference for Visa cards versus alternatives
• Government partnerships to drive electronification
Emerging <5 <10% <$5
• Introduce and grow core products: debit, credit and prepaid
• Build acceptance in core categories – emphasis on mobile/digital
• Government partnerships to drive electronification
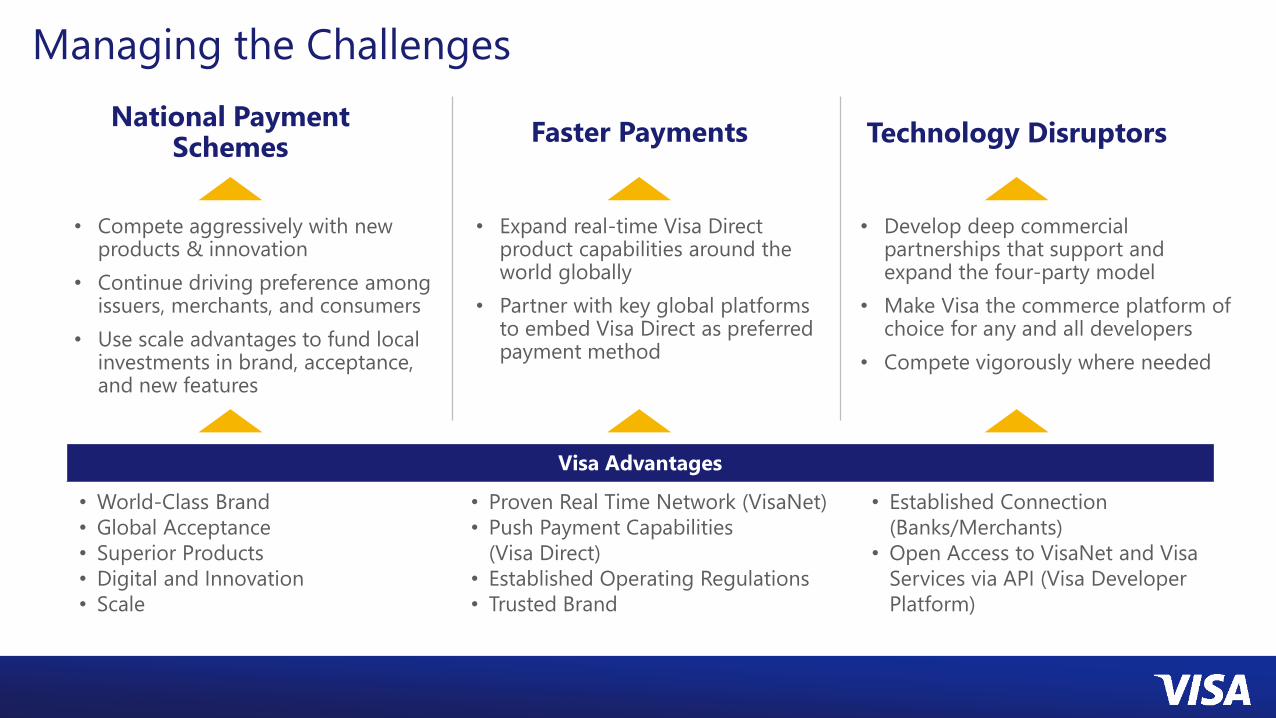
Managing the Challenges
National Payment Schemes
Faster Payments Technology Disruptors
Visa Advantages
• World-Class Brand
• Global Acceptance
• Superior Products
• Digital and Innovation
• Scale
• Proven Real Time Network (VisaNet)
• Push Payment Capabilities
(Visa Direct)
• Established Operating Regulations
• Trusted Brand
• Established Connection
(Banks/Merchants)
• Open Access to VisaNet and Visa
Services via API (Visa Developer
Platform)
• Compete aggressively with new products & innovation
• Continue driving preference among issuers, merchants, and consumers
• Use scale advantages to fund local investments in brand, acceptance, and new features
• Expand real-time Visa Direct product capabilities around the world globally
• Partner with key global platforms to embed Visa Direct as preferred payment method
• Develop deep commercial partnerships that support and expand the four-party model
• Make Visa the commerce platform of choice for any and all developers
• Compete vigorously where needed
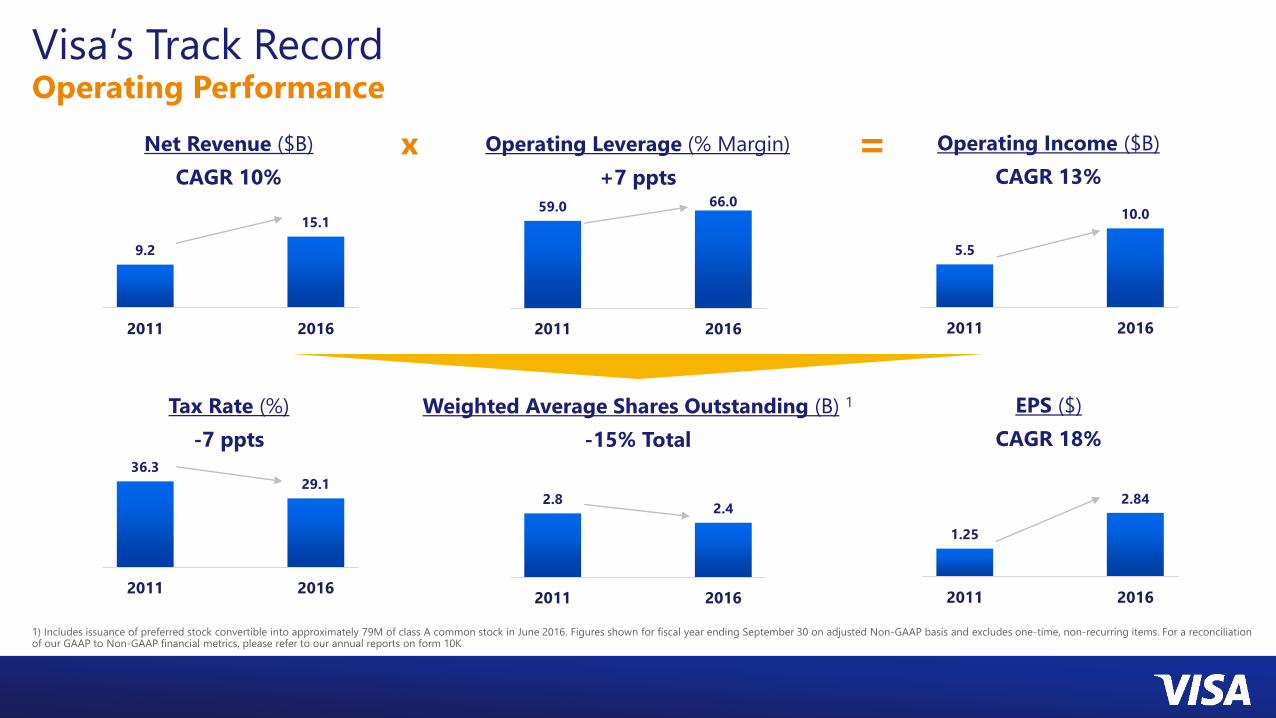
Net Revenue ($B)
CAGR 10%
Operating Leverage (% Margin)
+7 ppts
Operating Income ($B)
CAGR 13%
Visa’s Track RecordOperating Performance
1) Includes issuance of preferred stock convertible into approximately 79M of class A common stock in June 2016. Figures shown for fiscal year ending September 30 on adjusted Non-GAAP basis and excludes one-time, non-recurring items. For a reconciliation of our GAAP to Non-GAAP financial metrics, please refer to our annual reports on form 10K
9.2
15.1
2011 2016
=x
Tax Rate (%)
-7 ppts
36.3
29.1
2011 2016
59.0 66.0
2011 2016
Weighted Average Shares Outstanding (B) 1
-15% Total
2.82.4
2011 2016
5.5
10.0
2011 2016
EPS ($)
CAGR 18%
1.25
2.84
2011 2016
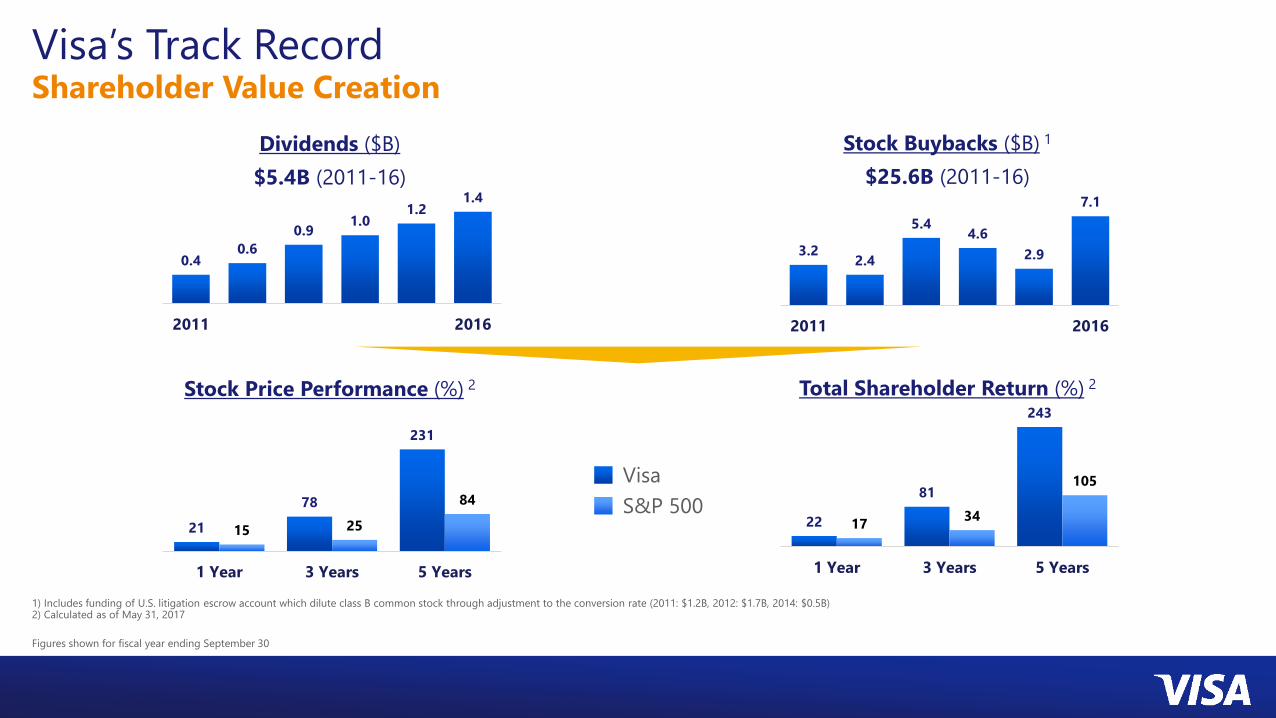
Dividends ($B)
$5.4B (2011-16)
Stock Buybacks ($B) 1
$25.6B (2011-16)
Visa’s Track RecordShareholder Value Creation
1) Includes funding of U.S. litigation escrow account which dilute class B common stock through adjustment to the conversion rate (2011: $1.2B, 2012: $1.7B, 2014: $0.5B)2) Calculated as of May 31, 2017
Figures shown for fiscal year ending September 30
0.40.6
0.91.0
1.21.4
2011 2016
Stock Price Performance (%) 2
3.22.4
5.44.6
2.9
7.1
2011 2016
Total Shareholder Return (%) 2
21
78
231
15 25
84
1 Year 3 Years 5 Years
Visa
S&P 50022
81
243
1734
105
1 Year 3 Years 5 Years
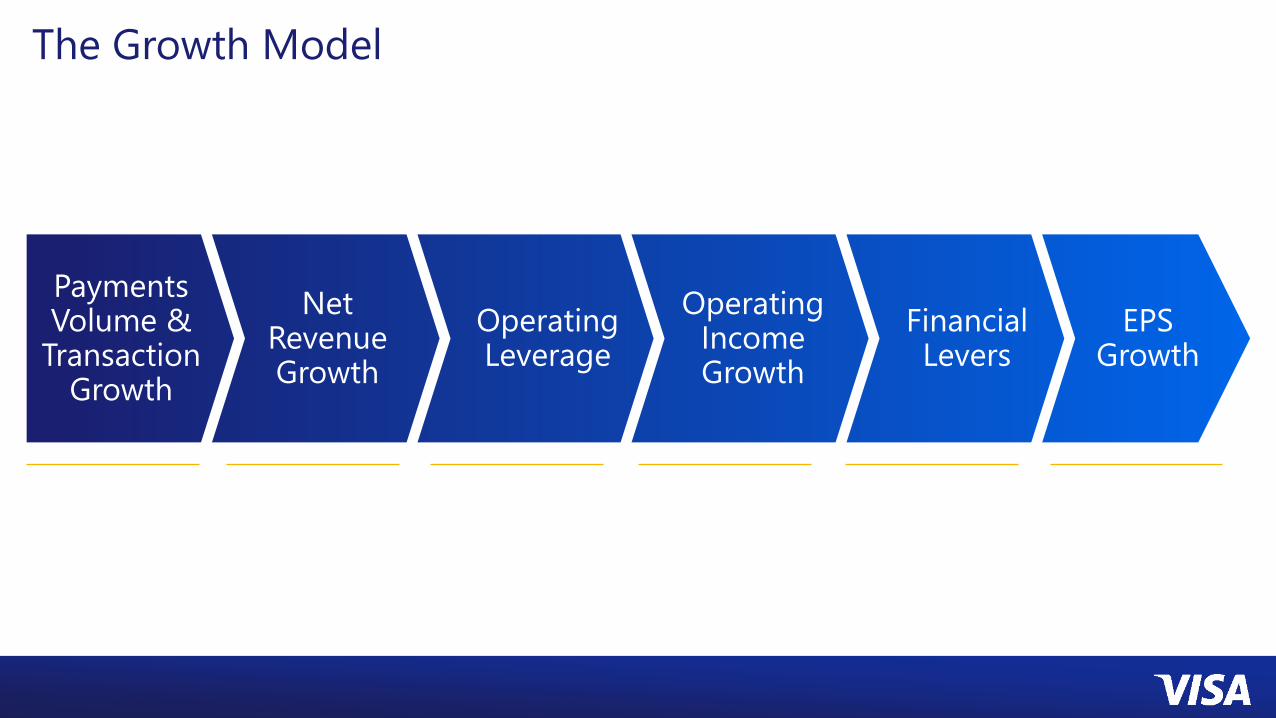
The Growth Model
Net Revenue Growth
Operating Leverage
Operating Income Growth
Financial Levers
EPS Growth
Payments Volume &
Transaction Growth
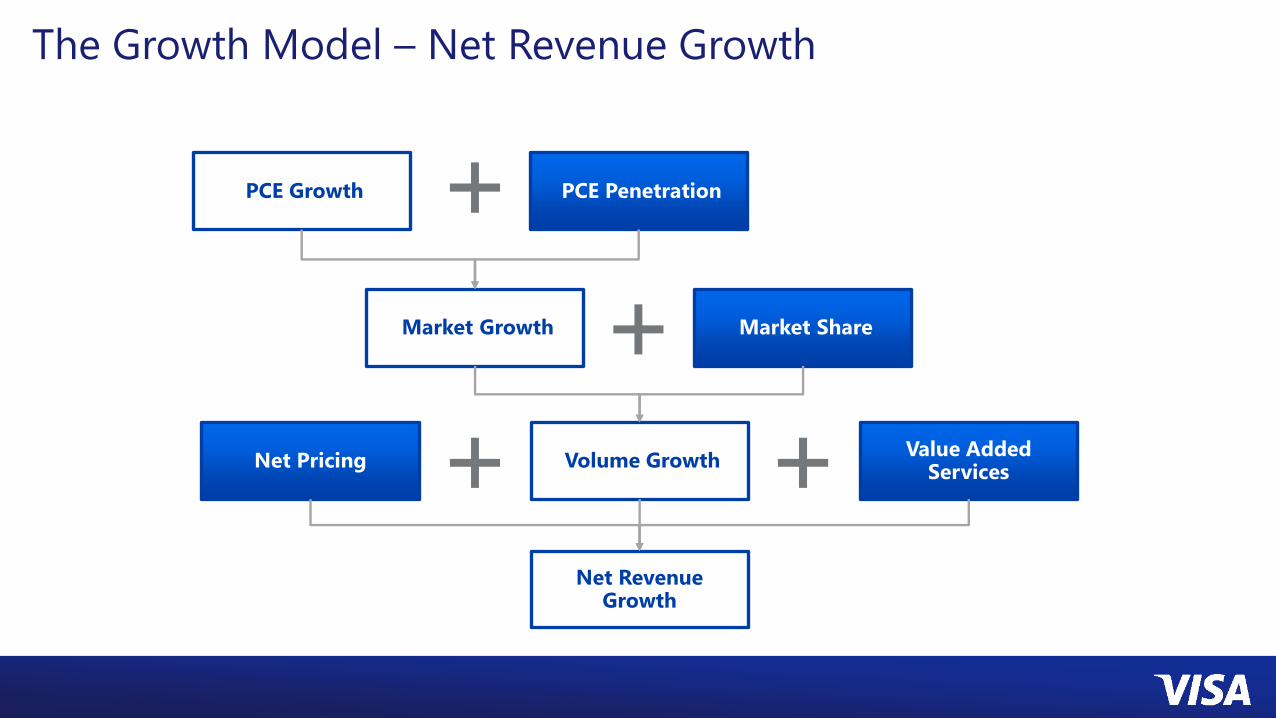
The Growth Model – Net Revenue Growth
PCE Growth PCE Penetration
Market Growth
Volume Growth
Market Share
Net Revenue Growth
Value AddedServices
Net Pricing
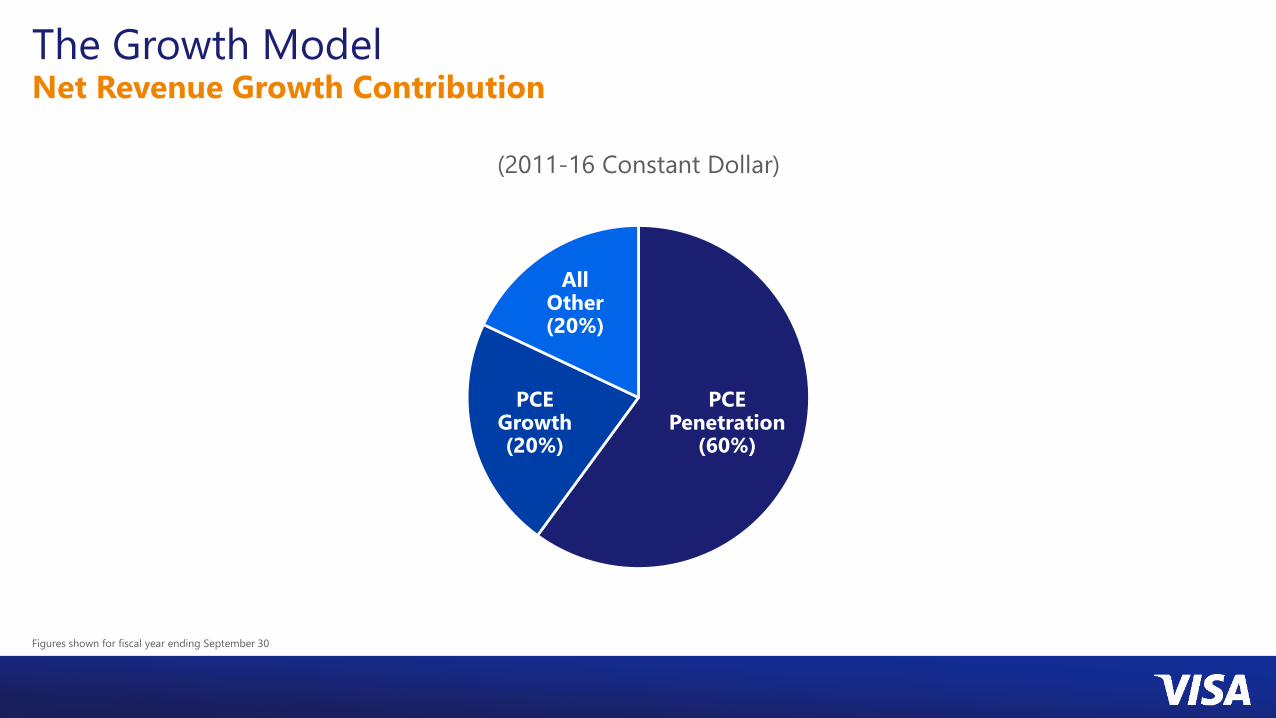
The Growth ModelNet Revenue Growth Contribution
Figures shown for fiscal year ending September 30
(2011-16 Constant Dollar)
PCE Growth(20%)
PCE Penetration
(60%)
All Other(20%)
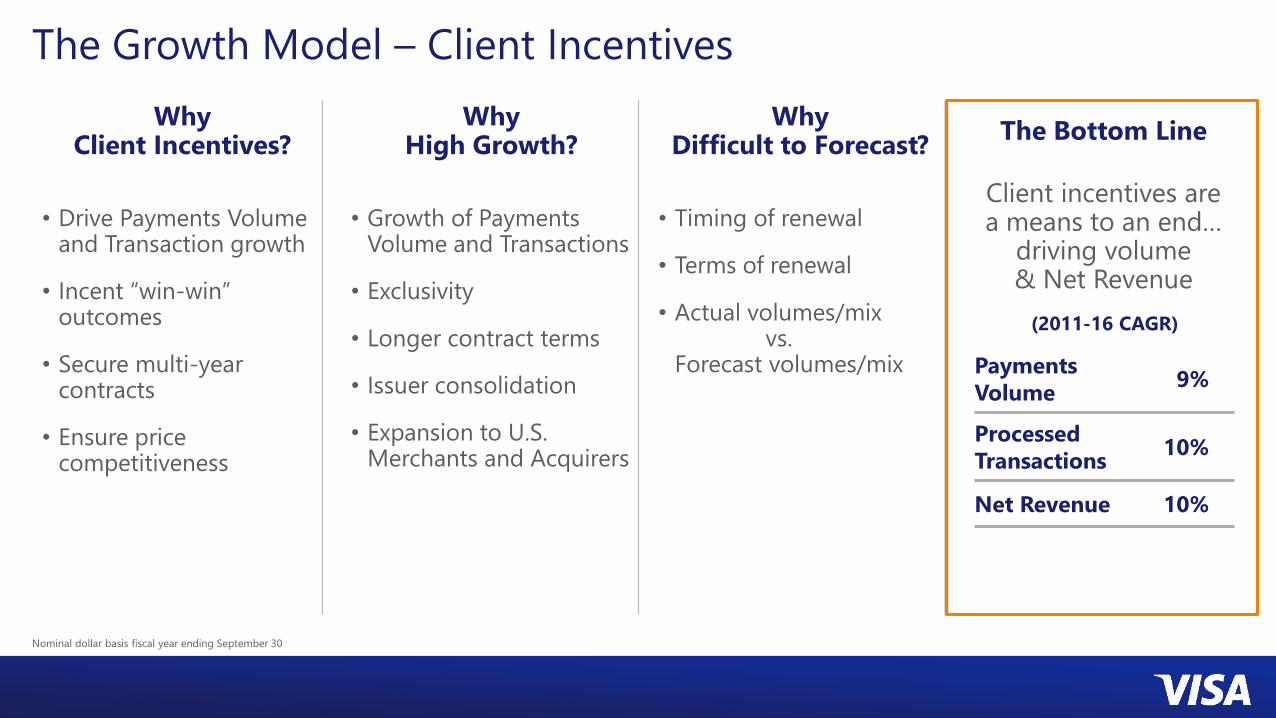
The Growth Model – Client Incentives
Nominal dollar basis fiscal year ending September 30
• Drive Payments Volume and Transaction growth
• Incent “win-win” outcomes
• Secure multi-year contracts
• Ensure price competitiveness
Why Client Incentives?
Why High Growth?
Why Difficult to Forecast?
• Growth of Payments Volume and Transactions
• Exclusivity
• Longer contract terms
• Issuer consolidation
• Expansion to U.S. Merchants and Acquirers
• Timing of renewal
• Terms of renewal
• Actual volumes/mixvs.
Forecast volumes/mix
Client incentives are a means to an end…
driving volume & Net Revenue
The Bottom Line
Payments
Volume9%
Processed
Transactions10%
Net Revenue 10%
(2011-16 CAGR)
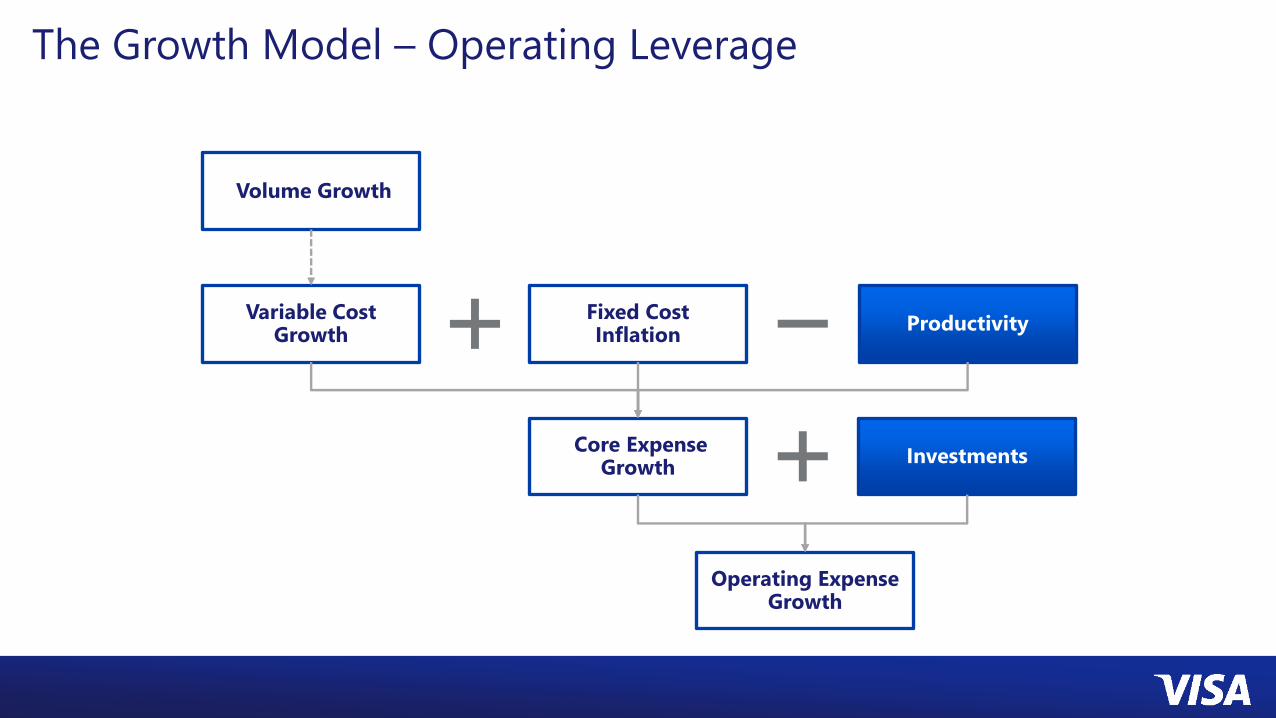
The Growth Model – Operating Leverage
Volume Growth
Fixed Cost Inflation
Core Expense Growth
Productivity
Operating Expense Growth
Investments
Variable CostGrowth
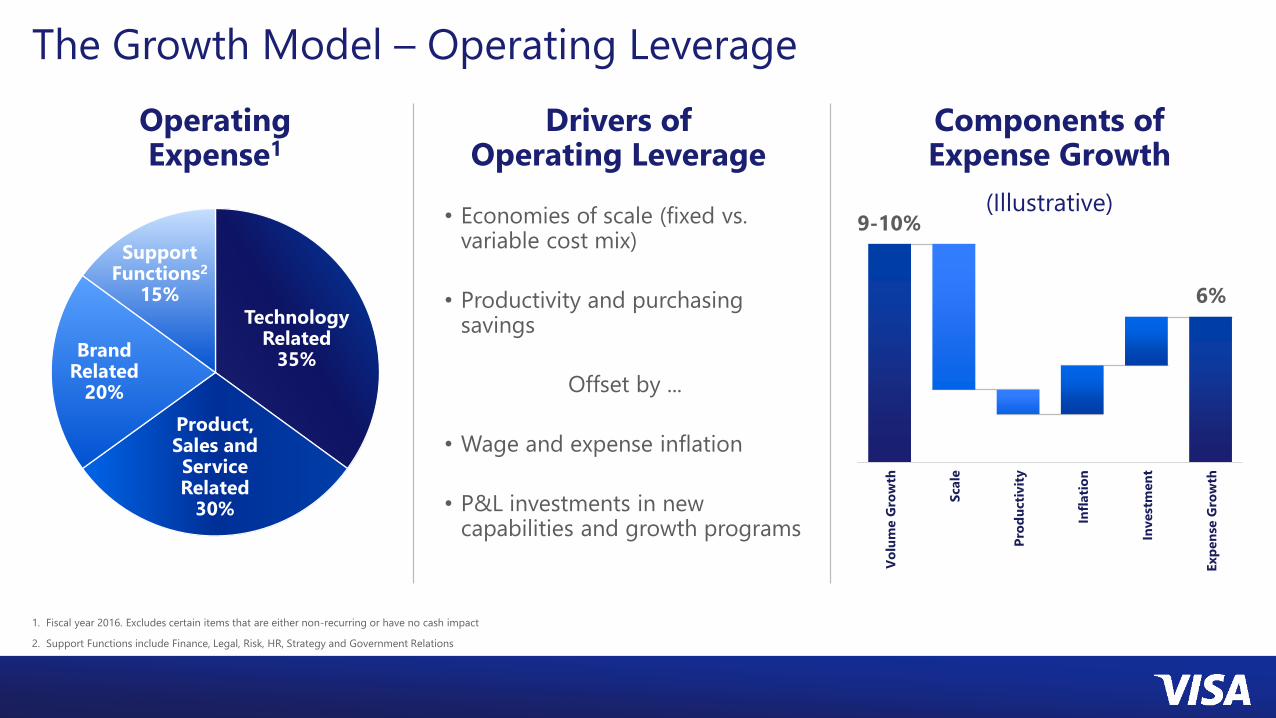
The Growth Model – Operating Leverage
1. Fiscal year 2016. Excludes certain items that are either non-recurring or have no cash impact
2. Support Functions include Finance, Legal, Risk, HR, Strategy and Government Relations
Components of Expense Growth
(Illustrative)
Technology Related
35%
Product, Sales and Service Related
30%
Brand Related
20%
Drivers of Operating Leverage
• Economies of scale (fixed vs. variable cost mix)
• Productivity and purchasing savings
Offset by ...
• Wage and expense inflation
• P&L investments in new capabilities and growth programs
Operating Expense1
Support Functions2
15%
Vo
lum
e G
row
th
Scale
Pro
du
cti
vit
y
Infl
ati
on
Invest
men
t
Exp
en
se G
row
th
9-10%
6%
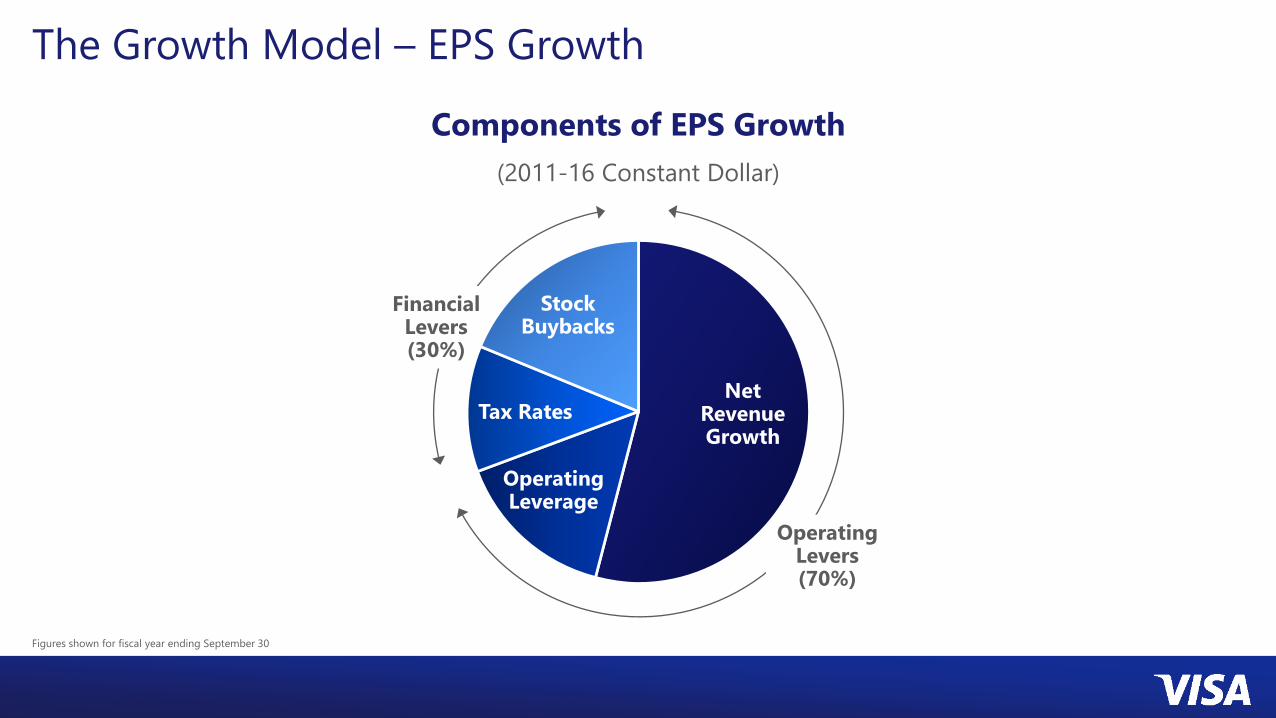
Operating Levers(70%)
Financial Levers(30%)
The Growth Model – EPS Growth
Figures shown for fiscal year ending September 30
Components of EPS Growth
(2011-16 Constant Dollar)
Stock Buybacks
Net Revenue Growth
Tax Rates
Operating Leverage
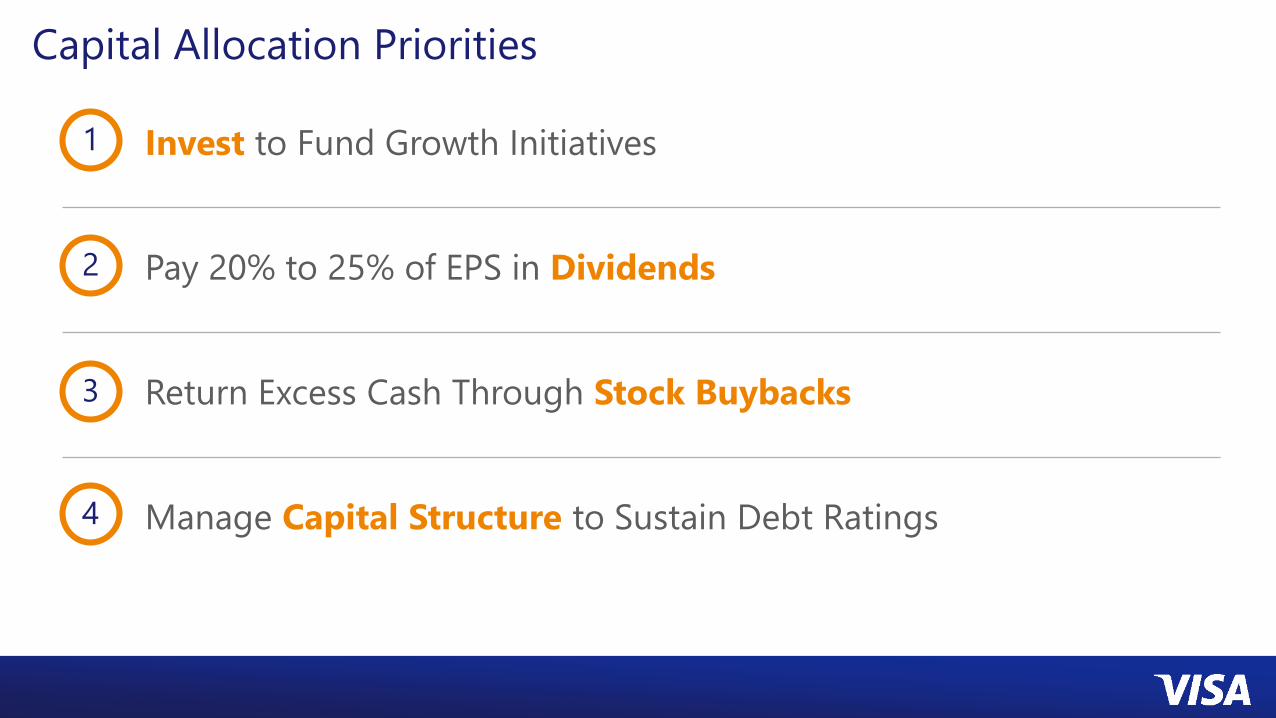
Capital Allocation Priorities
Invest to Fund Growth Initiatives
Pay 20% to 25% of EPS in Dividends
Return Excess Cash Through Stock Buybacks
Manage Capital Structure to Sustain Debt Ratings
1
2
3
4
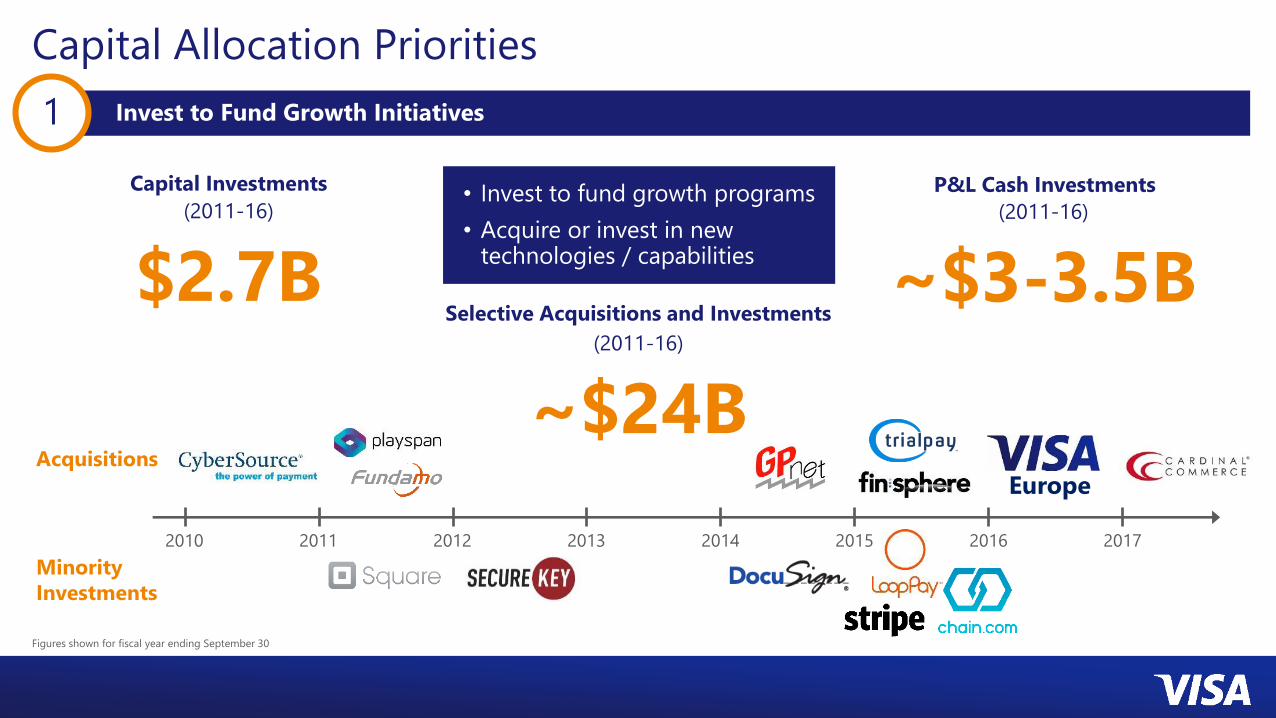
P&L Cash InvestmentsCapital Investments
Capital Allocation Priorities
Figures shown for fiscal year ending September 30
Selective Acquisitions and Investments
Acquisitions
Minority
Investments
2010 2011 2012 2013 2014 2015 2016 2017
Europe
(2011-16)
~$3-3.5B
(2011-16)
$2.7B(2011-16)
~$24B
• Invest to fund growth programs
• Acquire or invest in new technologies / capabilities
Invest to Fund Growth Initiatives1
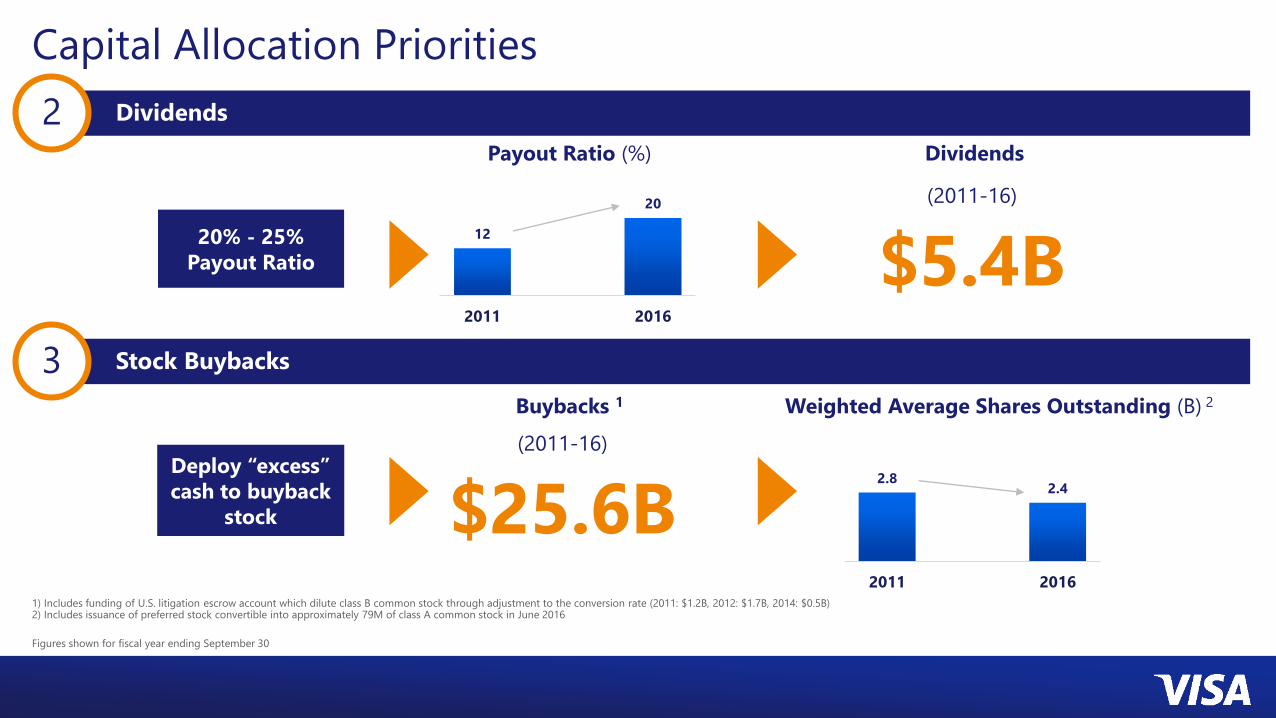
Payout Ratio (%)
Buybacks 1
Capital Allocation Priorities
1) Includes funding of U.S. litigation escrow account which dilute class B common stock through adjustment to the conversion rate (2011: $1.2B, 2012: $1.7B, 2014: $0.5B)2) Includes issuance of preferred stock convertible into approximately 79M of class A common stock in June 2016
Figures shown for fiscal year ending September 30
Dividends
Weighted Average Shares Outstanding (B) 2
12
20
2011 2016
2.82.4
2011 2016
20% - 25%
Payout Ratio
Deploy “excess”
cash to buyback
stock
(2011-16)
$5.4B
(2011-16)
$25.6B
Dividends2
Stock Buybacks3
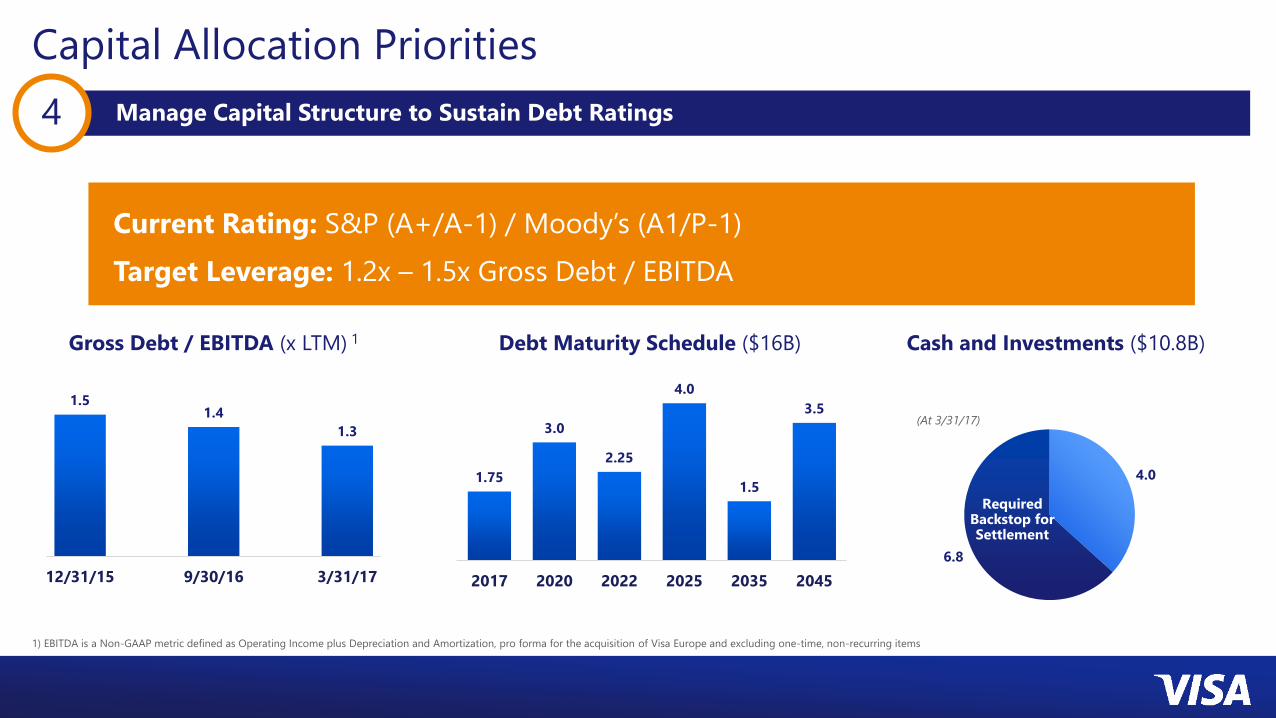
1.51.4
1.3
12/31/15 9/30/16 3/31/17
4.0
6.8
Gross Debt / EBITDA (x LTM) 1 Debt Maturity Schedule ($16B)
Capital Allocation Priorities
1) EBITDA is a Non-GAAP metric defined as Operating Income plus Depreciation and Amortization, pro forma for the acquisition of Visa Europe and excluding one-time, non-recurring items
1.75
3.0
2.25
4.0
1.5
3.5
2017 2020 2022 2025 2035 2045
Current Rating: S&P (A+/A-1) / Moody’s (A1/P-1)
Target Leverage: 1.2x – 1.5x Gross Debt / EBITDA
Cash and Investments ($10.8B)
Required Backstop for Settlement
(At 3/31/17)
Manage Capital Structure to Sustain Debt Ratings4
Summary
• Sizeable global growth opportunity
• Visa has powerful assets to capture this opportunity
• Well defined strategy and tactics tailored by market
• Track record of revenue and EPS growth
• Disciplined capital allocation
• Well positioned to sustain superiorshareholder value creation
This presentation contains forward-looking statements within the meaning of the U.S. Private Securities Litigation Reform Act of 1995
that relate to, among other things, our future operations, prospects, developments, strategies, business growth and financial outlook.
Forward-looking statements generally are identified by words such as "believes," "estimates," "expects," "intends," "may," "projects,"
“could," "should," "will," "continue" and other similar expressions. All statements other than statements of historical fact could be
forward-looking statements, which speak only as of the date they are made, are not guarantees of future performance and are subject to
certain risks, uncertainties and other factors, many of which are beyond our control and are difficult to predict. We describe risks and
uncertainties that could cause actual results to differ materially from those expressed in, or implied by, any of these forward-looking
statements in our filings with the U.S. Securities and Exchange Commission, including our Annual Report on Form 10-K for the year
ended September 30, 2016 and our subsequent reports on Forms 10-Q and 8-K. Except as required by law, we do not intend to update
or revise any forward-looking statements as a result of new information, future events or otherwise.
***
Note: All brand names and logos are the property of their respective owners, are used for identification purposes only, and do not imply
product endorsement or affiliation with Visa. With the exception of slide titled “Acceptance Penetration Drives PCE Penetration,” PCE is
defined as Purchase PCE (does not include non-financial transactions).
Forward-Looking Statements