Virtualization : IBM Insights in Sizing Servers for...
62
Virtualization : IBM Insights in Sizing Servers for Virtualization Bob Zuber WW Program Manager for Virtualization
Transcript of Virtualization : IBM Insights in Sizing Servers for...

Virtualization : IBM Insights in Sizing Servers for Virtualization
Bob Zuber
WW Program Manager for Virtualization

Learning Objectives
Title: Virtualization - IBM Insights in Sizing Servers for Virtualization
Abstract: Come hear how IBM can help you build a better virtualized infrastructure. Learn how to use the new IBM Virtualization Sizing Guide, to help you understand the method and tools that IBM has used to assist their customers in many consolidation engagements. In addition, learn how IBM System x and Bladecenter servers can be deployed to provide the most efficient and reliable hardware platform for your VMwarevirtualization needs. Also see how IBM Director and Virtualization Manager provide a complete systems management solution, via a single pane of glass interface, for your virtual and physical servers

SizingThe elements of sizingIBM’s insights into sizing
IBM PortfolioPortfolio PositioningCompetitive Advantage
Systems Management – IBM DirectorWhat is itHow it helps virtualization
Summary
Agenda
Long-term Focus On Virtualization Across Our Systems
iSeries ™System z9™zSeries®
System p5 ™pSeries®
System x™ BladeCenter™IBM System Storage ™
OpenPower®
While virtualization sounds complex, it’s really a simple idea. IBM Systems can provide virtualization capabilities that are unique in the marketplace.
IBM mainframe virtualization – 40 year history of world-class innovationIBM X-Architecture designed for virtualization, shared cross platformCoolBlue™ - Power and Cooling designs that lead the industryVirtualization Management software that simplifies your environmentVirtualization features do not require “rip and replace” upgradesVMware’s number one OEM vendor(1)
Note (1) : Based on bundled license revenue

Why is Sizing Important
There are so many sizing considerations, either the source or targetConsider just the Source server
Average and Peak CPU utilizationAverage and Peak memory utilizationPage Size and page extentsDisk I/O throughputNetwork I/O throughput
And now the Target serverCPU UtilizationMemory UtilizationPage size page extentsDisk I/O throughput

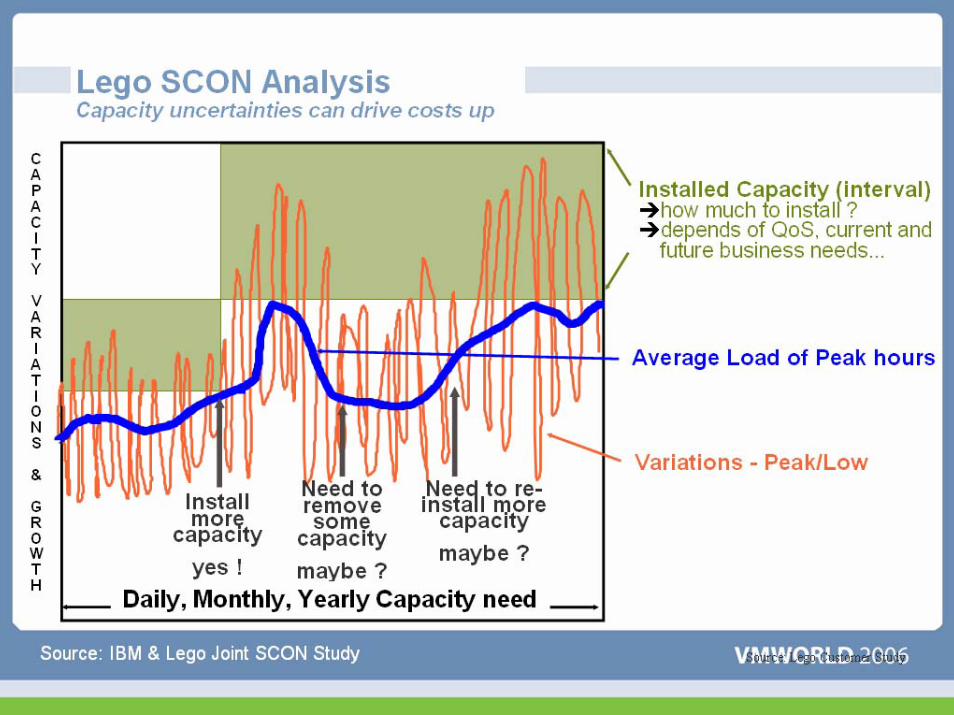

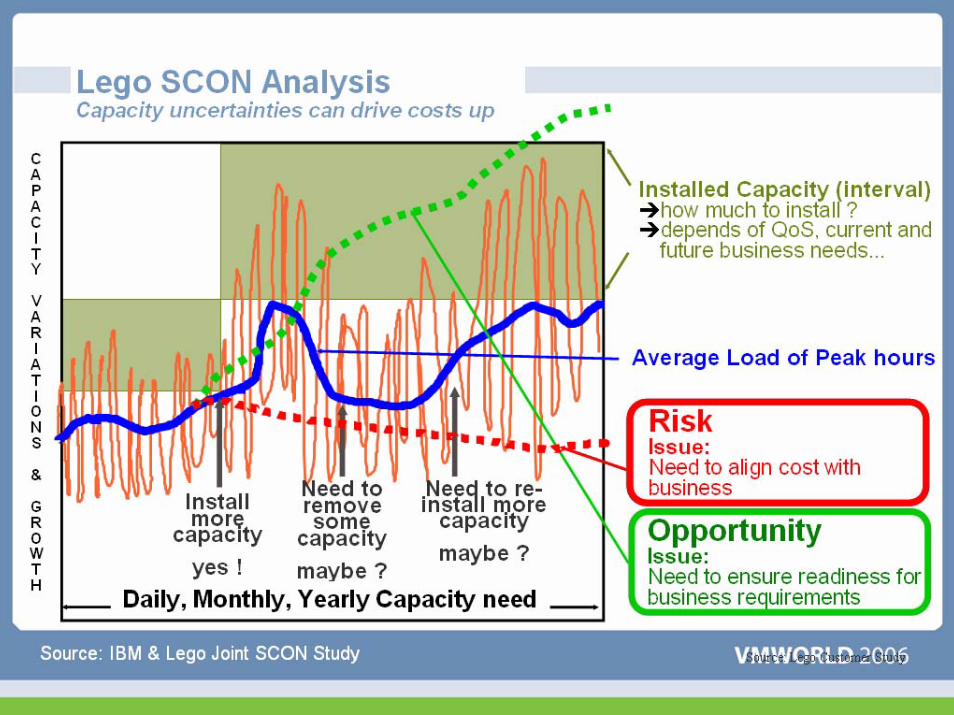
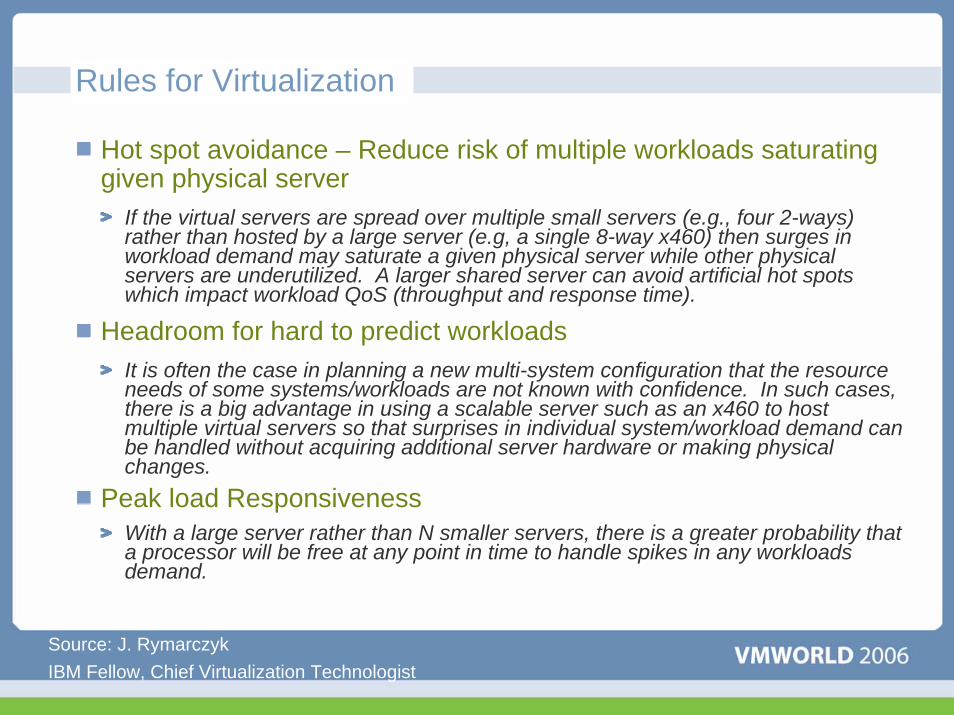
Rules for Virtualization
Hot spot avoidance – Reduce risk of multiple workloads saturating given physical server
If the virtual servers are spread over multiple small servers (e.g., four 2-ways) rather than hosted by a large server (e.g, a single 8-way x460) then surges in workload demand may saturate a given physical server while other physical servers are underutilized. A larger shared server can avoid artificial hot spots which impact workload QoS (throughput and response time).
Headroom for hard to predict workloadsIt is often the case in planning a new multi-system configuration that the resource needs of some systems/workloads are not known with confidence. In such cases, there is a big advantage in using a scalable server such as an x460 to host multiple virtual servers so that surprises in individual system/workload demand can be handled without acquiring additional server hardware or making physical changes.
Peak load ResponsivenessWith a large server rather than N smaller servers, there is a greater probability that a processor will be free at any point in time to handle spikes in any workloads demand.
Source: J. RymarczykIBM Fellow, Chief Virtualization Technologist

Gather The Data
VMware® Capacity PlannerIBM CDATBoth gather inventory and performance information for servers and clients.Data is needed to provide the best sizing for your customers workloads.Using Virtualization for Server Consolidation is only as good as the initial sizing information.

Real-World Workload EnvironmentsNon-Steady State(Unpredictable)
Steady State(Predictable)
Non-Steady vs Steady State workloads1.Peak utilization should be examined for all Non-Steady workloads. Email server peak periods may be
entirely different from the CRM server, causing peaks and valleys to either negate each other, or doubling the amount of resources needed.
2.Average utilization can be examined for Steady state workloads, once they have achieved steady state. Measurements can be performed prior to Steady State, but this would not reflect the workloads true resource needs.
Source : Intel Technology Journal, Vol 10 Issue 3, published August 10, 2006 - “Redefining Server Performance Characterization for Virtualization Benchmarking”

What is VMware® Capacity Planner?
Agent-less discovery, inventory, and performance collectionData Sources: WMI, Registry & Perfmon API calls on Windows and Remote SSH Sessions using UNIX and Linux utilitiesHourly performancemetrics for days/weeksCDAT compatibleWeb-based reportingIndustry benchmarking /comparisonConsolidation and virtualization scenario modelingIncorporated into BCE and Virtualization Assessment reports
Select IBM Server Model
Create Server Groups
Model for VMware

What is CDAT? – Consolidation, Discovery & Analysis
Discovers servers on the networkEstablishes communication with the servers on the network:
SNMP for all servers except xSeriesStandard API calls for xSeries
Takes a snap shot of the data that is collected and stored on the server by the OS and the performance countersExports the data into Excel spread sheet which can be exported to any spread sheet of your choice
Server grouped into categories by CDAT for data collection purposes
The contents of the SQL server group – selected a group, server, server information

Customer Consolidation Study
Methodology for the Virtualization Sizing GuideUsed customer survey data to define key workload classifications targeted for server consolidationAnalyzed recent CDAT(1) studies for 30 customers• Organized their legacy servers by application type into the key workload
classifications• Entered more than 3,200 servers in the customer study database• Defined typical average and peak utilization statistics for each key workload
classificationInput typical workloads from each workload classification into IBM’s VISIAN(2) tool• VISIAN consolidated the workloads into virtual machines onto a target server
according to the Headroom Rules.• VISIAN defined the limiting factor for adding additional workloads (CPU,
Memory, Virtual CPU)
Notes :1. IBM’s CDAT is a stand-alone discovery tool that automatically gathers a significant amount of server inventory, configuration and performance data, generating
an enterprise-wide view of server population and usage. IBM has performed over 2,000 customer server consolidation studies involving over 200,000 servers.2. IBM’s VISIAN is a tool that facilitates the calculation of the optimal number of machines that can be consolidated onto an IBM System x server running VMware
ESX Server 2.5. VISIAN is an internal-use-only tool, and an patent is pending.

Virtualization Sizing Insights
Software Performance VariationCustomer consolidation studies highlight a greater variation between average CPU utilization and peak CPU utilization on legacy 2-P source workloads than on 4-P and 8-P source workloads.Variations in the CPU utilization will determine the number of virtual machines possible on a server configuration.
Server HeadroomSize for excess capacity to ensure that workloads have headroom for peak periods of operation when they require greater server resources than their average or steady state period of operation.To calculate the correct amount of headroom, consider the variation between average and peak server resource requirements for each consolidated workload. The Headroom Rules account for this variation.
Peak Utilization versus Average UtilizationTo correctly size the number of virtual machines per platform, consider the average and peak utilization of the processor, memory, and disk.The chart on the next page shows the recommended number of VMs based on both the peak and average utilizations. The first lettered indicator aligns with the number of recommended VMs based on the peak utilization values. The second lettered indicator aligns with the number of recommended VMs based on the average utilization values.The letter represents the constraining factor which is the resource on the server that limits the recommended number of VMs for that server configuration.
Memory versus CPU constraintsPhysical CPU utilization is not always the primary constraint for consolidated workloads.Workloads that are consolidated based on peak utilizations tend to be CPU-constrained and those based on average utilizations tend to be memory-constrained or vCPU-constrained.
VMware Scheduler ContentionThe amount of work that can be scheduled has a non-linear relationship to the number of CPUs and the number of vCPUS defined for a given virtual machine. VMs with more than 1 vCPU have lower scheduler latency on SMP servers with more CPU cores compared to servers with less CPU cores.
Server Headroom
Peak and Average Utilization
Scheduler Contention
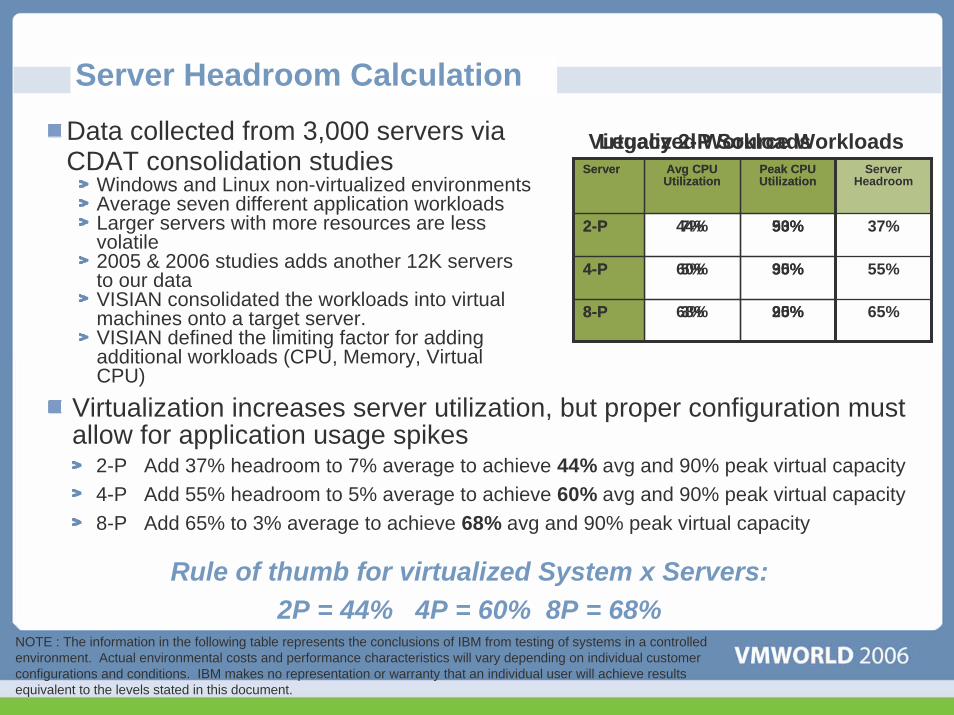
Server Headroom CalculationData collected from 3,000 servers via CDAT consolidation studies
Windows and Linux non-virtualized environmentsAverage seven different application workloadsLarger servers with more resources are less volatile2005 & 2006 studies adds another 12K servers to our dataVISIAN consolidated the workloads into virtual machines onto a target server.VISIAN defined the limiting factor for adding additional workloads (CPU, Memory, Virtual CPU)
Server Avg CPU Utilization
Peak CPU Utilization
Server Headroom
2-P 7% 53%
35%
25%
4-P 5%
37%
55%
8-P 3% 65%
Rule of thumb for virtualized System x Servers: 2P = 44% 4P = 60% 8P = 68%
Virtualization increases server utilization, but proper configuration must allow for application usage spikes
2-P Add 37% headroom to 7% average to achieve 44% avg and 90% peak virtual capacity4-P Add 55% headroom to 5% average to achieve 60% avg and 90% peak virtual capacity8-P Add 65% to 3% average to achieve 68% avg and 90% peak virtual capacity
Server Avg CPU Utilization
Peak CPU Utilization
2-P 44% 90%
90%
90%
4-P 60%
8-P 68%
Legacy 2-P Source WorkloadsVirtualized Workloads
NOTE : The information in the following table represents the conclusions of IBM from testing of systems in a controlled environment. Actual environmental costs and performance characteristics will vary depending on individual customer configurations and conditions. IBM makes no representation or warranty that an individual user will achieve results equivalent to the levels stated in this document.

Virtualization Sizing Insights
Server Headroom
Peak and Average Utilization
Scheduler Contention

x86 Server Utilization ObservationsConsolidation Parameters for Source Workloads
Legacy 2-P Workloads
Typical Processor
Avg CPU Utilization
Peak CPU Utilization
Avg Memory
Used
Peak Memory
UsedInfrastructure Xeon 2.0GHz 8% 48% 568 768 Web Xeon 1.8GHz 5% 47% 592 768 Application Xeon 1.8GHz 8% 52% 611 768 Database Xeon 1.8GHz 9% 60% 1,199 1,536 Terminal Server PIII 1.4GHz 9% 70% 603 1,024 Email Xeon 2.0GHz 6% 50% 994 1,280
Legacy 4-P Workloads
Typical Processor
Avg CPU Utilization
Peak CPU Utilization
Avg Memory
Used
Peak Memory
UsedInfrastructure Xeon MP 2.5GHz 6% 35% 841 1,024 Web Xeon MP 2.5GHz 4% 24% 737 1,024 Application Xeon MP 2.7GHz 4% 34% 935 1,280 Database Xeon MP 2.5GHz 5% 37% 1,553 1,792 Terminal Server Xeon MP 2.7GHz 6% 45% 882 1,536 Email Xeon MP 2.8GHz 4% 34% 1,295 1,536
Table C - Consolidation Parameters for Source Workloads
The CDAT information was broken into two types of workloads, 2-P and 4-P.
The sizing was based on both the average and peak for CPU, memory, disk, and network I/O.
The disk and network I/O was not included in the print document, it was not a constraint that was seen in the sizing table.
This information was used to size the target servers.
Each cell of the sizing guide is represented by these 6 workloads, and added in a round robin fashion to achieve the needed workloads.
NOTE : The information in the following table represents the conclusions of IBM from testing of systems in a controlled environment. Actual environmental costs and performance characteristics will vary depending on individual customer configurations and conditions. IBM makes no representation or warranty that an individual user will achieve results equivalent to the levels stated in this document.
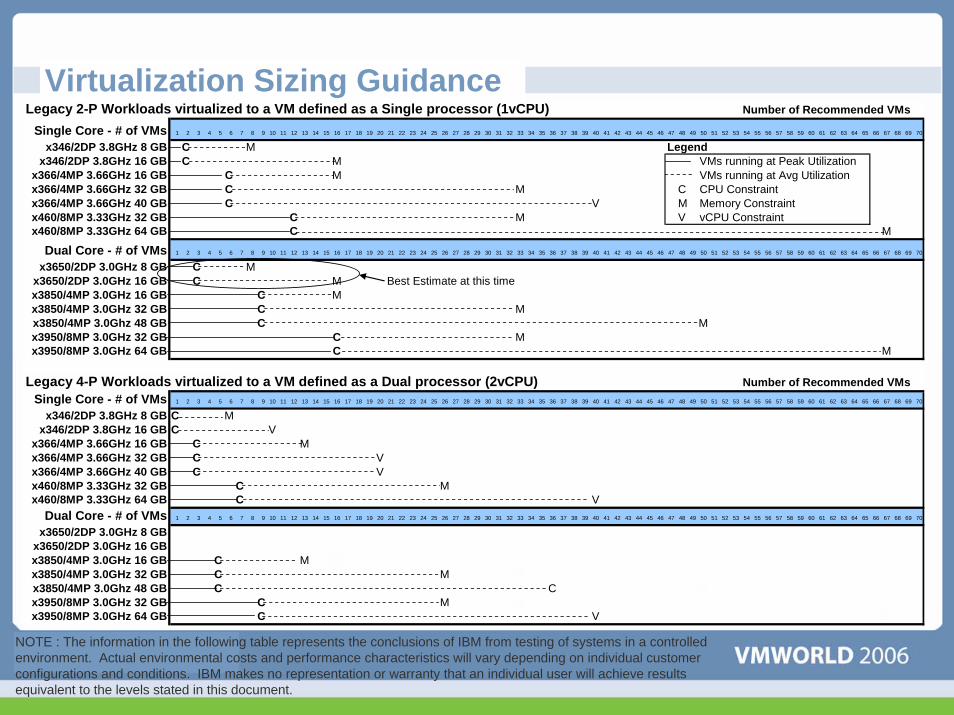
Virtualization Sizing GuidanceLegacy 2-P Workloads virtualized to a VM defined as a Single processor (1vCPU) Number of Recommended VMs
Single Core - # of VMs 1 2 3 4 5 6 7 8 9 10 11 12 13 14 15 16 17 18 19 20 21 22 23 24 25 26 27 28 29 30 31 32 33 34 35 36 37 38 39 40 41 42 43 44 45 46 47 48 49 50 51 52 53 54 55 56 57 58 59 60 61 62 63 64 65 66 67 68 69 70
x346/2DP 3.8GHz 8 GB C M Legendx346/2DP 3.8GHz 16 GB C M VMs running at Peak Utilization
x366/4MP 3.66GHz 16 GB C M VMs running at Avg Utilizationx366/4MP 3.66GHz 32 GB C M C CPU Constraintx366/4MP 3.66GHz 40 GB C V M Memory Constraintx460/8MP 3.33GHz 32 GB C M V vCPU Constraintx460/8MP 3.33GHz 64 GB C M
Dual Core - # of VMs 1 2 3 4 5 6 7 8 9 10 11 12 13 14 15 16 17 18 19 20 21 22 23 24 25 26 27 28 29 30 31 32 33 34 35 36 37 38 39 40 41 42 43 44 45 46 47 48 49 50 51 52 53 54 55 56 57 58 59 60 61 62 63 64 65 66 67 68 69 70
x3650/2DP 3.0GHz 8 GB C Mx3650/2DP 3.0GHz 16 GB C M Best Estimate at this timex3850/4MP 3.0GHz 16 GB C Mx3850/4MP 3.0GHz 32 GB C Mx3850/4MP 3.0Ghz 48 GB C Mx3950/8MP 3.0GHz 32 GB C Mx3950/8MP 3.0GHz 64 GB C M
Legacy 4-P Workloads virtualized to a VM defined as a Dual processor (2vCPU) Number of Recommended VMsSingle Core - # of VMs 1 2 3 4 5 6 7 8 9 10 11 12 13 14 15 16 17 18 19 20 21 22 23 24 25 26 27 28 29 30 31 32 33 34 35 36 37 38 39 40 41 42 43 44 45 46 47 48 49 50 51 52 53 54 55 56 57 58 59 60 61 62 63 64 65 66 67 68 69 70
x346/2DP 3.8GHz 8 GB C Mx346/2DP 3.8GHz 16 GB C V
x366/4MP 3.66GHz 16 GB C Mx366/4MP 3.66GHz 32 GB C Vx366/4MP 3.66GHz 40 GB C Vx460/8MP 3.33GHz 32 GB C Mx460/8MP 3.33GHz 64 GB C V
Dual Core - # of VMs 1 2 3 4 5 6 7 8 9 10 11 12 13 14 15 16 17 18 19 20 21 22 23 24 25 26 27 28 29 30 31 32 33 34 35 36 37 38 39 40 41 42 43 44 45 46 47 48 49 50 51 52 53 54 55 56 57 58 59 60 61 62 63 64 65 66 67 68 69 70
x3650/2DP 3.0GHz 8 GBx3650/2DP 3.0GHz 16 GBx3850/4MP 3.0GHz 16 GB C Mx3850/4MP 3.0GHz 32 GB C Mx3850/4MP 3.0Ghz 48 GB C Cx3950/8MP 3.0GHz 32 GB C Mx3950/8MP 3.0GHz 64 GB C V
Table A - Virtualization Sizing GuidanceNOTE : The information in the following table represents the conclusions of IBM from testing of systems in a controlled environment. Actual environmental costs and performance characteristics will vary depending on individual customer configurations and conditions. IBM makes no representation or warranty that an individual user will achieve results equivalent to the levels stated in this document.
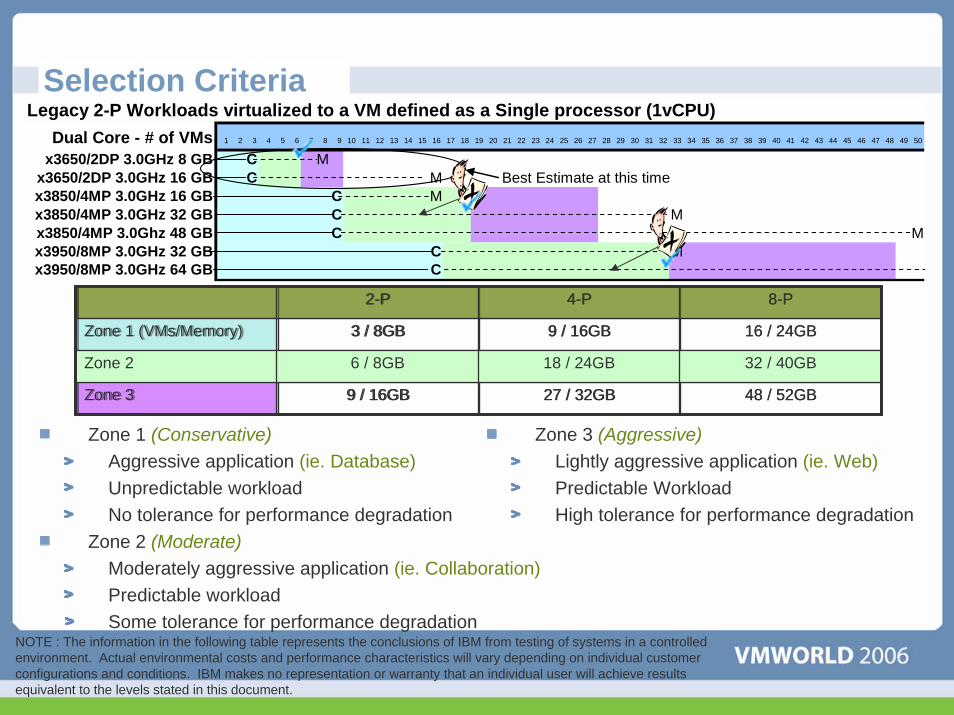
Selection Criteria
Zone 1 (Conservative)Aggressive application (ie. Database)Unpredictable workloadNo tolerance for performance degradation
Zone 2 (Moderate)Moderately aggressive application (ie. Collaboration)Predictable workloadSome tolerance for performance degradation
2-P 4-P 8-P
Zone 1 (VMs/Memory) 3 / 8GB 9 / 16GB 16 / 24GB
Zone 2 6 / 8GB 18 / 24GB 32 / 40GB
Zone 3 9 / 16GB 27 / 32GB 48 / 52GB
Zone 3 (Aggressive)Lightly aggressive application (ie. Web)Predictable WorkloadHigh tolerance for performance degradation
Legacy 2-P Workloads virtualized to a VM defined as a Single processor (1vCPU)Dual Core - # of VMs 1 2 3 4 5 6 7 8 9 10 11 12 13 14 15 16 17 18 19 20 21 22 23 24 25 26 27 28 29 30 31 32 33 34 35 36 37 38 39 40 41 42 43 44 45 46 47 48 49 50
x3650/2DP 3.0GHz 8 GB C Mx3650/2DP 3.0GHz 16 GB C M Best Estimate at this timex3850/4MP 3.0GHz 16 GB C Mx3850/4MP 3.0GHz 32 GB C Mx3850/4MP 3.0Ghz 48 GB C Mx3950/8MP 3.0GHz 32 GB C Mx3950/8MP 3.0GHz 64 GB C
2-P 4-P 8-P
Zone 1 (VMs/Memory) 3 / 8GB 9 / 16GB 16 / 24GB
Zone 2 6 / 8GB 18 / 24GB 32 / 40GB
Zone 3 9 / 16GB 27 / 32GB 48 / 52GB
NOTE : The information in the following table represents the conclusions of IBM from testing of systems in a controlled environment. Actual environmental costs and performance characteristics will vary depending on individual customer configurations and conditions. IBM makes no representation or warranty that an individual user will achieve results equivalent to the levels stated in this document.

Virtualization Sizing Insights
Server Headroom
Peak and Average Utilization
Scheduler Contention

Guidance from VMware®
The Benefits of CPU Dense ESX Server Hosts:“The chance that the scheduler can find room for a particular workload without much reshuffling of virtual machines will always be better when the scheduler has more CPUs across which it can search for idle time. For this reason, it will generally be better to purchase two four-way ESX Server licenses than to purchase four two-way machines. Similarly, two eight-way servers will provide more scheduling flexibility than four four-way servers.”
Tips and Techniques for Implementing Infrastructure Services on ESX Server

VMware® Scheduler
Single Core 2-PCPU 1 CPU 2
1 vcpu, 100%
2 vcpu, 200%
2 vcpu, 150%
4 vcpu, 400%
1 vcpu, 50%
1 vcpu, 100%
First Clock Cycle
Second Clock Cycle
Third Clock Cycle
Fourth Clock Cycle
Late
ncy

VMware® SchedulerDual Core 2-P
&Single Core 4-P
CPU 1 CPU 2 CPU 3 CPU 4
1 vcpu, 100%
2 vcpu, 200%
2 vcpu, 150%
4 vcpu, 400%
1 vcpu, 50%
1 vcpu, 100%
First Clock Cycle
Second Clock Cycle
Third Clock Cycle
Late
ncy

VMware® Scheduler
Dual Core 4-PCPU 2 CPU 4 CPU 5 CPU 6
1 vcpu, 100%
2 vcpu, 200%
2 vcpu, 150%
4 vcpu, 400%
1 vcpu, 50%
1 vcpu, 100%First Clock Cycle
Second Clock Cycle
CPU 1 CPU 3 CPU 7 CPU 8
Late
ncy

SizingThe elements of sizingIBM’s insights into sizing
IBM PortfolioPortfolio PositioningCompetitive Advantage
Systems Management – IBM DirectorWhat is itHow it helps virtualization
Summary
Agenda

x86 Servers Made Better With Virtualization
Integrat
ion
Reducti
on
Utiliza
tion
Infrastructure simplification Application serving Server consolidation
Platform IBM BladeCenter® IBM System xTM
Two-processor rack & towerIBM System x Four + processor
rackDescription Integrating server, networking
and storage resources Combining a few applications
on a single server for greater utilization
Consolidating large numbers of underutilized servers for
greatest TCO
Key attributes Hardware usabilityPackaging densityUnified managementPower/cooling savings
Industry-standard designPrice/performanceCompatibility
PerformanceScalabilityStrong reliability features
Infrastructure simplification Application serving Server consolidation
Platform IBM BladeCenter® IBM System xTM
Two-processor rack & towerIBM System xTM Four +
processor rack
Description Integrating server, networking and storage resources
Combining a few applications on a single server for greater
utilization
Consolidating large numbers of underutilized servers for
greatest TCO
Key attributes Hardware usabilityPackaging densityUnified managementPower/cooling savingsServer mobilityHigh availability/disaster recovery capability
Industry-standard designPrice/performanceCompatibilityMultiple apps per serverHigh utilization
PerformanceScalabilityStrong reliability featuresApplication isolationReduction of physical systemsRapid system deployment

IBM differentiates itself from the competition
BladeC
enter
®
IBM X3 chipsetUp to 32-socket scalabilityMainframe-inspired reliabilityPFA on more components than competitors
Innovative design with standard partsMore memory DIMMS per processor than competitorsMore I/O slots per processor than competitors
Compatibility across chassisComprehensive ecosystemPower managementTwo redundant high-speed fabrics
IBM CoolBlue™ innovations
Largest OEM vendor(1)
IBM Director
IBM Virtualization Manager
Note (1) : Based on bundled license revenue
Common across the portfolio
System
x
four + proce
ssor r
ack
System
x
two-proce
ssor r
ack
& tower
First VMware® system vendorFirst joint development partnerFirst to leverage VMware® SDK First to offer comprehensive support
Microsoft Windows, Linux and IBM software in a VMware virtual machine
First blade offering to include VMware®
First to integrate VMware® into a Virtual Client SolutionFirst system vendor to announce VMware®
Infrastructure 3
IBM and VMware®: A Relationship Of Firsts!

BladeCenter ® Competitive Advantage
IBM CoolBlue™ innovations
Largest OEM vendor(1)
IBM Director
IBM Virtualization Manager
Note (1) : Based on bundled license revenue
Common across the portfolio
Up to 30% better power efficiencyFully redundant configurations for higher availabilityLargest ecosystem provides more flexibility and choiceInnovative ‘snap-in’ scalable blade server that scales from 2P to 4P in secondsOpen architecture allows 3rd party hw and sw vendors to provide more BladeCenter® solutionsBlade compatibility across chassis provides investment protection
BladeC
enter
®

When do I deploy IBM BladeCenter® Systems?
When you want to:Consolidate infrastructure and centralize managementReduce the complexity of ‘scale out’Reduce power consumptionMake more efficient use of datacenter space
Reduce floor space consumedReduce weight
Achieve maximum processor density
It’s that Simple ….. With IBM

I/O Virtualization SolutionBuilding Blocks
Cisco SFS 3012• InfiniBand Switching• InfiniBand to Ethernet• InfiniBand to Fibre Channel
Cisco InfiniBand Switch Module forIBM BladeCenter
Embedded system and fabric management
Host channel adapter (HCA)With upper layer protocols
• MPI• IPoIB • SDP• SRP
Linux, Windows, and Solarisdriver support
Network-embedded InfiniBand Subnet Manager
Cisco® VFrame Server Virtualization Software
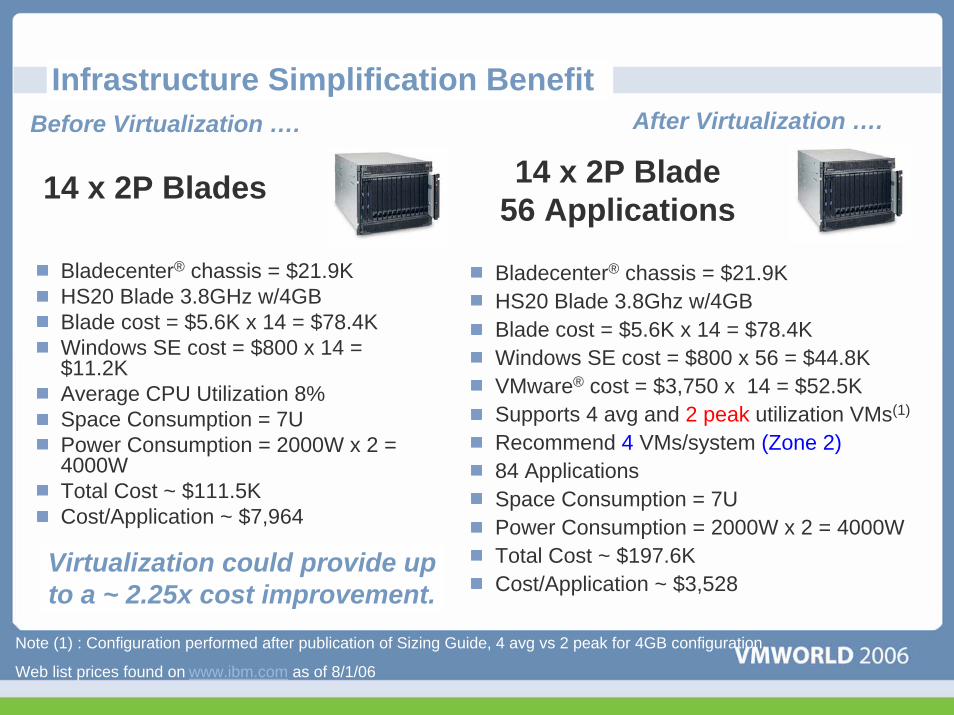
Infrastructure Simplification Benefit
Bladecenter® chassis = $21.9KHS20 Blade 3.8GHz w/4GBBlade cost = $5.6K x 14 = $78.4KWindows SE cost = $800 x 14 = $11.2KAverage CPU Utilization 8%Space Consumption = 7UPower Consumption = 2000W x 2 = 4000WTotal Cost ~ $111.5KCost/Application ~ $7,964
14 x 2P Blades
Virtualization could provide up to a ~ 2.25x cost improvement.
Bladecenter® chassis = $21.9KHS20 Blade 3.8Ghz w/4GBBlade cost = $5.6K x 14 = $78.4KWindows SE cost = $800 x 56 = $44.8KVMware® cost = $3,750 x 14 = $52.5KSupports 4 avg and 2 peak utilization VMs(1)
Recommend 4 VMs/system (Zone 2)84 ApplicationsSpace Consumption = 7UPower Consumption = 2000W x 2 = 4000WTotal Cost ~ $197.6KCost/Application ~ $3,528
14 x 2P Blade56 Applications
Note (1) : Configuration performed after publication of Sizing Guide, 4 avg vs 2 peak for 4GB configuration.
Web list prices found on www.ibm.com as of 8/1/06
Before Virtualization …. After Virtualization ….

BladeCenter® Competitive AdvantageHP BL465c LS21 LS41 scalable
bladeDual core AMD OpteronProcessors
2 2 4
DIMMs/Max RAM 8 DIMMs16GB
8 DIMMs32GB
16 DIMMs64MB
HDDs 2 1(4)* 2(5)*
I/O expansion slots 2 2 3
High speed (10Gb) support In future now now
Note : Specifications for the server hardware can be found on the following web sites : www.ibm.com, www.dell.com, and www.hp.com
* With optional SIO expansion blade

IBM differentiates itself from the competition
Innovative design with standard partsMore memory DIMMS per processor than competitorsMore I/O slots per processor than competitors
IBM CoolBlue™ innovations
Largest OEM vendor(1)
IBM Director
IBM Virtualization Manager
Note (1) : Based on bundled license revenue
Common across the portfolio
System
x
two-proce
ssor r
ack
& tower

When do I deploy IBM Two Socket Systems?
When you want to:Optimize highly demanding business applicationsRun applications that require high-speed memory subsystemsNeed broad and low-latency I/O choices for Ethernet and fibrechannelActively manage energy consumptionConsolidate legacy 2 Socket servers using virtualization
• When consolidating several traditional 2 way workloads• When consolidating less than 18 traditional 2 way workloads
It’s that Simple ….. With IBM

Application Serving Benefit
x3650 3.0GHz DC w/4GBServer cost = $4.9K x 6 = $29.4KWindows SE cost = $800 x 6 = $4.8KAverage CPU Utilization 8%Space Consumption = 12UPower Consumption = 242Wx6 = 1452WTotal Cost ~ $34.2KCost/Application ~ $5,700
6 x 2P Server
Virtualization could provide up to a ~ 1.5x cost improvement.
x3650 3.0GHz DC w/8GBServer cost = $9.5KWindows SE cost = $800 x 6 = $4.8KVMware® cost = $3,750 x 2 = $7.5KSupports 8 avg and 3 peak utilization VMsRecommend 6 VMs/system (Zone 2)Space Consumption = 2UPower Consumption = 242WTotal Cost ~ $21.8KCost/Application ~ $3,633
2P Server
Before Virtualization …. After Virtualization ….
Web list prices found on www.ibm.com as of 8/1/06

How about 12 legacy 2 way workloads
x3850 3.0GHz DC w/24GBServer cost = $24.4K = $24.4kWindows DC cost = $2K x 4 = $8K*VMware® cost = $3,750 x 4 = $15KSupports 24 avg and 9 peak utilization VMsRecommend 18 VMs/system (Zone 2)Space Consumption = 3UPower Consumption = 799WTotal Cost ~ $47.4KCost/VM ~ $3,950
12 Servers
4P Server
Cost per VM could be up to 22% less on the 2P Platform
2P ServersServing from….
x3650 3.0GHz DC w/8GBServer cost = $9.5K x 2 = $19KWindows DC cost = $2K x 2 x 2 = $8K*VMware® cost = $3,750 x 2 x 2 = $15KSupports 8 avg and 3 peak utilization VMsRecommend 6 VMs/System (Zone 2)Space Consumption = 18UPower Consumption = 246Wx2 = 492WTotal Cost ~ $42KCost/VM ~ $3,500
Note : MS Windows Datacenter licensing – Estimated $2,000 processor, unlimited virtualization client. GA 9/28/06.
Web list prices found on www.ibm.com as of 8/1/06
Before Virtualization …. After Virtualization ….
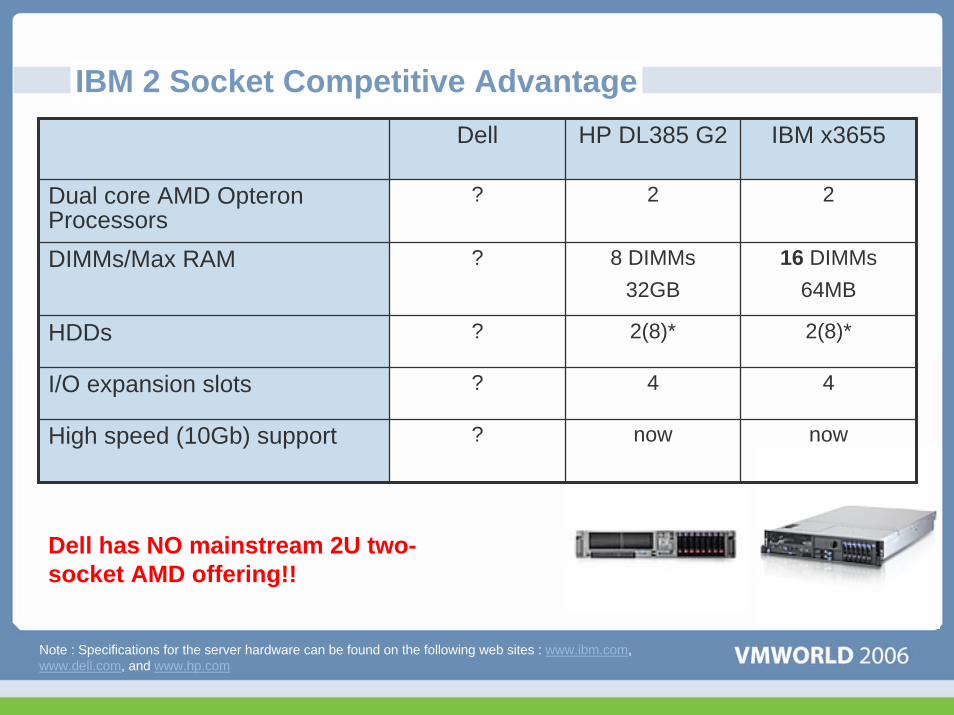
IBM 2 Socket Competitive AdvantageDell HP DL385 G2 IBM x3655
Dual core AMD OpteronProcessors
? 2 2
DIMMs/Max RAM ? 8 DIMMs32GB
16 DIMMs64MB
HDDs ? 2(8)* 2(8)*
I/O expansion slots ? 4 4
High speed (10Gb) support ? now now
Dell has NO mainstream 2U two-socket AMD offering!!
Note : Specifications for the server hardware can be found on the following web sites : www.ibm.com, www.dell.com, and www.hp.com

IBM differentiates itself from the competition
IBM X3 chipsetUp to 32-socket scalabilityMainframe-inspired reliabilityPFA on more components than competitors
Note (1) : Based on bundled license revenue
IBM CoolBlue™ innovations
Largest OEM vendor(1)
IBM Director
IBM Virtualization Manager
Common across the portfolio
System
x
four + proce
ssor r
ack

When do I deploy IBM Scaleable Systems?
When you want to:Run Applications that Multi-Thread• SAP, SAS, DB2, Oracle, SQL, CognosRun Applications that have large local storage requirements• Database, Large Collaboration and or MessagingConsolidate legacy servers using virtualization• When consolidating more than 18 traditional 2 way workloads• When consolidating more than 10 traditional 4 way workloads• When partitions needs 2 or more virtual CPU’s
It’s that Simple ….. With IBM

Datacenter Consolidation Benefit
x3650 3.0GHz DC w/4GBServer cost = $4.9K x 18 = $88.2KWindows SE cost = $800 x 18 = $14.4KAverage Utilization 5%Peak Utilization 47%Space Consumption = 36U = 1 RackPower Consumption = 242W x 18 = 4356WTotal Cost ~ $102.6KCost/Application ~ $5,700
x3850 3.0GHz DC w/24GBServer cost = $24.4KWindows DC cost = $2K x 4 = $8K*VMware® cost = $3,750 x 4 = $15KSupports 24 avg and 9 peak utilization VMsRecommend 18 VMs/system (Zone 2)Space Consumption = 3UPower Consumption = 835WTotal Cost ~ $47.4KCost/Application ~ $2,633
18 Servers4P Server
Virtualization could provide up to a 2.2x cost improvement
Before Virtualization …. After Virtualization ….
Note : MS Windows Datacenter licensing – Estimated $2,000 processor, unlimited virtualization client. GA 9/28/06.
Web list prices found on www.ibm.com as of 8/1/06

How about 36 legacy 2 way workloads
x3850 3.0GHz DC w/24GBServer cost = $24.4K x 2 = $48.8kWindows DC cost = $2K x 4 x 2 = $16K*VMware® cost = $3,750 x 4 x 2 = $30KSupports 24 avg and 9 peak utilization VMsRecommend 18 VMs/system (Zone 2)Space Consumption = 6UPower Consumption = 799Wx2 = 1598WTotal Cost ~ $94.8KCost/VM ~ $2,633
36 Servers
4P Server
Cost per VM could be up to 25% less on the 4P PlatformPlus Lower Software & Management Costs
2P Servers
Consolidated to ….
x3650 3.0GHz DC w/8GBServer cost = $9.5K x 6 = $57KWindows DC cost = $2K x 2 x 6 = $24K*VMware® cost = $3,750 x 2 x 6 = $45KSupports 8 avg and 3 peak utilization VMsRecommend 6 VMs/System (Zone 2)Space Consumption = 18UPower Consumption = 246Wx6 = 1476WTotal Cost ~ $126KCost/VM ~ $3,500
Before Virtualization …. After Virtualization ….
Note : MS Windows Datacenter licensing – Estimated $2,000 processor, unlimited virtualization client. GA 9/28/06.
Web list prices found on www.ibm.com as of 8/1/06

X Architecture Competitive AdvantageDell 6950 HP DL585 IBM x3755
Dual core AMD OpteronProcessors
4 4 4
DIMMs/Max RAM 16 DIMMs64GB
32 DIMMs64GB
32 DIMMs128MB
HDDs 4 X 3.5” SAS 8 x 2.5” SAS 5 x 3.5” SAS
I/O expansion slots PCI-X 0PC-E 2(x8), 5(x4)
PCI-X 2(100mhz)PCI-E 3(x8), 4(x4)
PCI-X 2(66mhz)PC-E 1(x16), 3(x8)
HTX Support No No Yes – 1 slot
Note : Specifications for the server hardware can be found on the following web sites : www.ibm.com, www.dell.com, and www.hp.com

Application Serving versus Server Consolidation
Workgroup ConsolidationDrive server utilizationMultiple applications per server
Power ReductionManagement Features
Datacenter ConsolidationSmallest number of serversApplication Isolation
Power ReductionManagement features
2P Server 4P Server
Platform selection driven by size, and number of virtual machines

SizingThe elements of sizingIBM’s insights into sizing
IBM PortfolioPortfolio PositioningCompetitive Advantage
Systems ManagementIBM Virtualization ManagerIBM Director
Summary
Agenda

Optimize
Virtualization ManagerCapacity
Manager $System Availability
PowerExecutive
Inventory
Resource Monitor
Event Action Plans
Hardware Status
Monitor & Alert
SW Distribution
Update Assistant
Scheduler
Maintain
Remote Control
DynamicSystem Analysis
Analyze &Troubleshoot
Remote DeploymentManager $
$Deploy
IBM Director From Deployment Through Maintenance …

IBM Virtualization Manager
Industry standards-based virtualization mgmt interfaces (DMTF)
PHyP
Simplified management of virtualized systems via standard interfaces regardless of platform or virtualization technology
Remove barriers to virtualizationRemove pain points of virtualization
Simplified management of virtualized systems via standard interfaces regardless of platform or virtualization technology
Remove barriers to virtualizationRemove pain points of virtualization

IBM Virtualization ManagerKey Design Points
Discover and visualize resources and relationshipsOut-of-the-box discovery, easily find resources and relationships, analyze environment, etc.
Show health and tasks from all resources and relationshipsDefine and monitor health, drill down on problems quickly to find root causeProvide common tasks that work across all resourcesProvide detailed tasks to perform platform-specific tasks in common ways
Grow existing workload by expanding or migrating Increase virtual server’s memory, storage, processing, networking capabilitiesGrowing virtual server workload can be moved to more powerful physical server
Use virtualization to help with repair and upgrade of serversAdd new resources and work into virtual environment
Easily allocate, configure, and manage virtual serversMake changes transparently without “change windows”

IBM Virtualization Manager and VMware VirtualCenterVMware® VirtualCenter provides management of homogeneous VMware environments
Dynamic (live) migration via VMotion™Supports cloning and P2V Single point of management for multiple virtual hostsFocuses on virtualization management, not physical systems
IBM Virtualization Manager complements VMware® VirtualCenter, providing one management interface for both the virtual and physical resourcesIBM Virtualization Manager provides common interface for hardware and virtual machine management
VMware®, with or without VirtualCenterMicrosoft Virtual ServerXen hypervisor support in SLES 10pHype endpoints managed by HMC (System p)
Availability and failover with Event Action PlansActual or predicted system failureStatic migration of all supported hypervisor productsDynamic migration via VMotion™ for VMware® environments
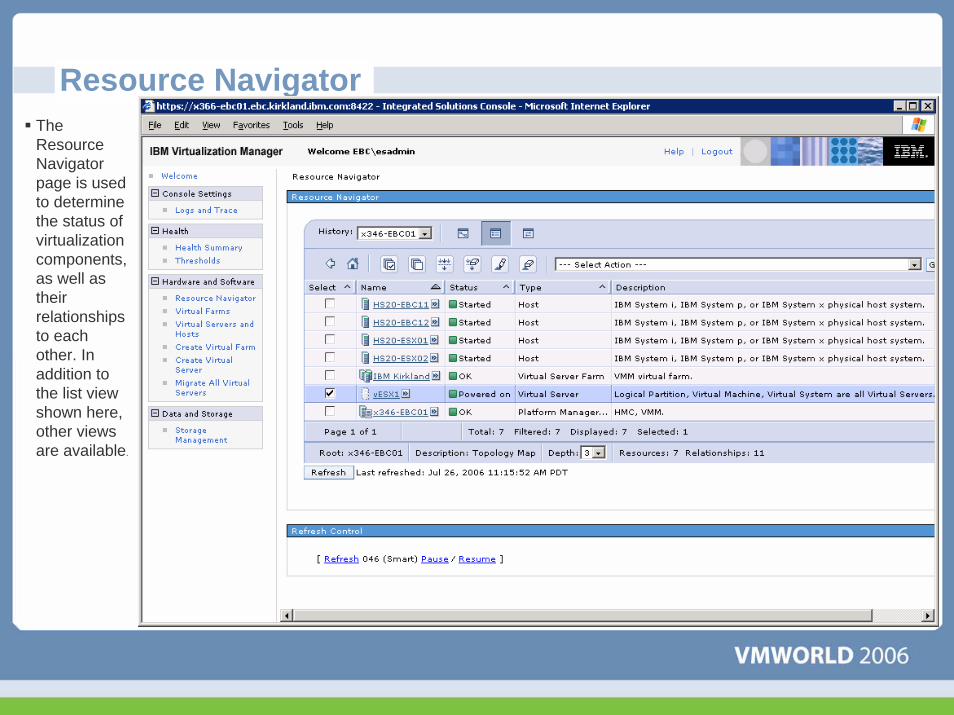
Resource NavigatorThe Resource Navigator page is used to determine the status of virtualization components, as well as their relationships to each other. In addition to the list view shown here, other views are available.
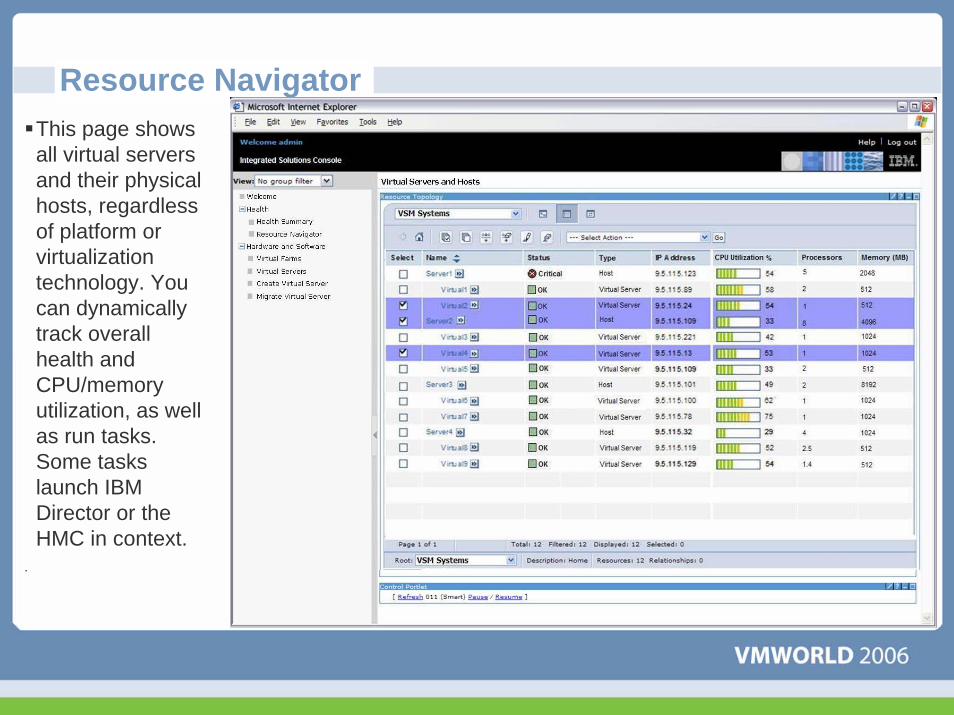
Resource NavigatorThis page shows all virtual servers and their physical hosts, regardless of platform or virtualization technology. You can dynamically track overall health and CPU/memory utilization, as well as run tasks. Some tasks launch IBM Director or the HMC in context.
.

Resource NavigatorThe topology view, a network diagram is displayed. Relationships between components are indicated by colored arrows between systems.
.

IBM Director Event FiltersThe VSM tree adds new Event Filters for managing virtual environments. Many events unique to these environments can now be detected and acted upon by Event Action Plans.

SizingThe elements of sizingIBM’s insights into sizing
IBM PortfolioPortfolio PositioningCompetitive Advantage
Systems ManagementIBM Virtualization ManagerIBM Director
Summary
Agenda

IBM has more x86 virtualization experience
IBM has more experience in virtualization providing a competitive advantage
Intelligent virtualization with IBM X-Architecture® technologyMore Industry Experience for Proper SizingOutstanding IBM CoolBlue™ Power and Cooling designsLeadership Management softwareVMware’s Largest OEM Vendor(1)
Note (1) : Based on bundled license revenue
It’s that Simple With IBM
IBM, BladeCenter, ClusterProven, DB2, ServerProven, System x, Virtualization Engine, WebSphere, XpandOnDemand, X-Architecture, Memory ProteXion and xSeries are trademarks of the International Business Machines Corporation in the United States and/or other countries. For a complete list of IBM Trademarks, see www.ibm.com/legal/copytrade.shtml.
Intel and Xeon are registered trademarks of Intel Corporation.Linux is a trademark of Linus Torvalds in the United States, and/or other countries. Microsoft and Windows are trademarks or registered trademarks of Microsoft Corporation.VMware and ESX Server are trademarks of VMware, Inc. All other products may be trademarks or registered trademarks of their respective companies.
The workloads and the associated hardware utilization data and the consolidation data described are representative of the server population that was analyzed in the IBM server consolidation study. The workloads and data are not intended to represent a specific customer environment. To arrange a customized IBM server consolidation study, contact your IBM Sales representative.
Performance is in Internal Throughput Rate (ITR) ratio based on measurements and projections using standard IBM benchmarks in a controlled environment. The actual throughput that any user will experience will vary depending upon considerations such as the amount of multiprogramming in the user's job stream, the I/O configuration, the storage configuration, and the workload processed. Therefore, no assurance can be given that an individual user will achieve throughput improvements equivalent to the performance ratios stated here.
IBM hardware products are manufactured from new parts, or new and serviceable used parts. Regardless, our warranty terms apply. For a copy of applicable product warranties, write to: Warranty Information, P.O. Box 12195, RTP, NC 27709, Attn: Dept. JDJA/B203. IBM makes no representation or warranty regarding third-party products or services including those designated as ServerProven® or ClusterProven®.
All customer examples cited or described in this presentation are presented as illustrations of the manner in which some customers have used IBM products and the results they may have achieved. Actual environmental costs and performance characteristics will vary depending on individual customer configurations and conditions.
This publication was produced in the United States. IBM may not offer the products, services or features discussed in this document in other countries, and the information may be subject to change without notice. Consult your local IBM business contact for information on the product or services available in your area.
All statements regarding IBM's future direction and intent are subject to change or withdrawal without notice, and represent goals and objectives only. Information about non-IBM products is obtained from the manufacturers of those products or their published announcements. IBM has not tested those products and cannot confirm the performance, compatibility, or any other claims related to non-IBM products. Questions on the capabilities of non-IBM products should be addressed to the suppliers of those products.
Prices subject to change without notice. Starting price may not include a hard drive, operating system or other features. Contact your IBM representative or Business Partner for the most current pricing in your geography. MB, GB, and TB = 1,000,000, 1,000,000,000 and 1,000,000,000,000 bytes, respectively, when referring to storage capacity. Accessible capacity is less; up to 3GB is used in service partition. Actual storage capacity will vary based upon many factors and may be less than stated. Some numbers given for storage capacities give capacity in native mode followed by capacity using data compression technology. Maximum internal hard disk and memory capacities may require the replacement of any standard hard drives and/or memory and the population of all hard disk bays and memory slots with the largest currently supported drives available.
The information could include technical inaccuracies or typographical errors. Changes are periodically made to the information herein; these changes will be incorporated in new editions of the publication. IBM may make improvements and/or changes in the product(s) and/or the program(s) described in this publication at any time without notice. Any references in this information to non-IBM Web sites are provided for convenience only and do not in any manner serve as an endorsement of those Web sites. The materials at those Web sites are not part of the materials for this IBM product and use of those Web sites is at your own risk.The following are trademarks or registered trademarks of other companies
NOTES:
(c) 2005 International Business Machines Corporation. All rights reserved.
Performance is in Internal Throughput Rate (ITR) ratio based on measurements and projections using standard IBM benchmarks in a controlled environment. The actual throughput that any user will experience will vary depending upon considerations such as the amount of multiprogramming in the user's job stream, the I/O configuration, the storage configuration, and the workload processed. Therefore, no assurance can be given that an individual user will achieve throughput improvements equivalent to the performance ratios stated here.
IBM hardware products are manufactured from new parts, or new and serviceable used parts. Regardless, our warranty terms apply. For a copy of applicable product warranties, write to: Warranty Information, P.O. Box 12195, RTP, NC 27709, Attn: Dept. JDJA/B203. IBM makes no representation or warranty regarding third-party products or services including those designated as ServerProven or ClusterProven.
All customer examples cited or described in this presentation are presented as illustrations of the manner in which some customers have used IBM products and the results they may have achieved. Actual environmental costs and performance characteristics will vary depending on individual customer configurations and conditions.
This publication was produced in the United States. IBM may not offer the products, services or features discussed in this document in other countries, and the information may be subject to change without notice. Consult your local IBM business contact for information on the product or services available in your area.
All statements regarding IBM's future direction and intent are subject to change or withdrawal without notice, and represent goals and objectives only.
Information about non-IBM products is obtained from the manufacturers of those products or their published announcements. IBM has not tested those products and cannot confirm the performance, compatibility, or any other claims related to non-IBM products. Questions on the capabilities of non-IBM products should be addressed to the suppliers of those products.
Prices subject to change without notice. Starting price may not include a hard drive, operating system or other features. Contact your IBM representative or Business Partner for the most current pricing in your geography.
MB, GB, and TB = 1,000,000, 1,000,000,000 and 1,000,000,000,000 bytes, respectively, when referring to storage capacity. Accessible capacity is less; up to 3GB is used in service partition. Actual storage capacity will vary based upon many factors and may be less than stated. Some numbers given for storage capacities give capacity in native mode followed by capacity using data compression technology. Maximum internal hard disk and memory capacities may require the replacement of any standard hard drives and/or memory and the population of all hard disk bays and memory slots with the largest currently supported drives available.
The information could include technical inaccuracies or typographical errors. Changes are periodically made to the information herein; these changes will be incorporated in new editions of the publication. IBM may make improvements and/or changes in the product(s) and/or the program(s) described in this publication at any time without notice.
Any references in this information to non-IBM Web sites are provided for convenience only and do not in any manner serve as an endorsement of those Web sites. The materials at those Web sites are not part of the materials for this IBM product and use of those Web sites is at your own risk.
Trademarks & Legal References

Appendix – Backup

Presentation Download
Please remember to complete yoursession evaluation form
and return it to the room monitorsas you exit the session
The presentation for this session can be downloaded at http://www.vmware.com/vmtn/vmworld/sessions/
Enter the following to download (case-sensitive):
Username: cbv_repPassword: cbvfor9v9r