Virtual Sugarcane Biorefinery Report | 2011
124
Technological Assessment Program (PAT) The Virtual Sugarcane Biorefinery (VSB) 2011 Report Antonio Bonomi Adriano Pinto Mariano Charles Dayan Farias de Jesus Henrique Coutinho Junqueira Franco Marcelo Pereira Cunha Marina Oliveira de Souza Dias Mateus Ferreira Chagas Otávio Cavalett Paulo Eduardo Mantelatto Rubens Maciel Filho Tassia Lopes Junqueira Terezinha de Fátima Cardoso
description
Report concerns the main activities carried out for the construction of the VSB in 2011, as well as the most important results obtained so far.
Transcript of Virtual Sugarcane Biorefinery Report | 2011

Technological Assessment Program (PAT)
The Virtual Sugarcane Biorefinery (VSB)
2011 Report
Antonio Bonomi
Adriano Pinto Mariano
Charles Dayan Farias de Jesus
Henrique Coutinho Junqueira Franco
Marcelo Pereira Cunha
Marina Oliveira de Souza Dias
Mateus Ferreira Chagas
Otávio Cavalett
Paulo Eduardo Mantelatto
Rubens Maciel Filho
Tassia Lopes Junqueira
Terezinha de Fátima Cardoso
Campinas, 2012
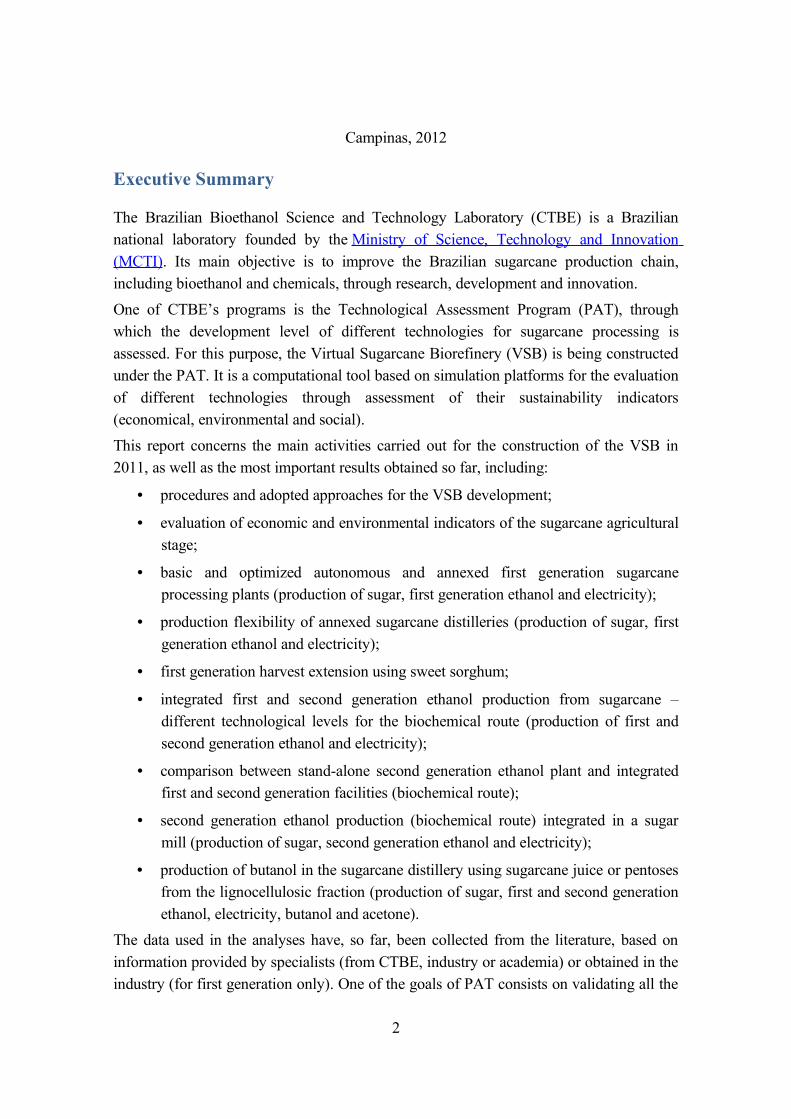
Executive Summary
The Brazilian Bioethanol Science and Technology Laboratory (CTBE) is a Brazilian national laboratory founded by the Ministry of Science, Technology and Innovation (MCTI). Its main objective is to improve the Brazilian sugarcane production chain, including bioethanol and chemicals, through research, development and innovation.
One of CTBE’s programs is the Technological Assessment Program (PAT), through which the development level of different technologies for sugarcane processing is assessed. For this purpose, the Virtual Sugarcane Biorefinery (VSB) is being constructed under the PAT. It is a computational tool based on simulation platforms for the evaluation of different technologies through assessment of their sustainability indicators (economical, environmental and social).
This report concerns the main activities carried out for the construction of the VSB in 2011, as well as the most important results obtained so far, including:
• procedures and adopted approaches for the VSB development;
• evaluation of economic and environmental indicators of the sugarcane agricultural stage;
• basic and optimized autonomous and annexed first generation sugarcane processing plants (production of sugar, first generation ethanol and electricity);
• production flexibility of annexed sugarcane distilleries (production of sugar, first generation ethanol and electricity);
• first generation harvest extension using sweet sorghum;
• integrated first and second generation ethanol production from sugarcane – different technological levels for the biochemical route (production of first and second generation ethanol and electricity);
• comparison between stand-alone second generation ethanol plant and integrated first and second generation facilities (biochemical route);
• second generation ethanol production (biochemical route) integrated in a sugar mill (production of sugar, second generation ethanol and electricity);
• production of butanol in the sugarcane distillery using sugarcane juice or pentoses from the lignocellulosic fraction (production of sugar, first and second generation ethanol, electricity, butanol and acetone).
The data used in the analyses have, so far, been collected from the literature, based on information provided by specialists (from CTBE, industry or academia) or obtained in the industry (for first generation only). One of the goals of PAT consists on validating all the
2
results generated in the simulations through the use of data obtained in the industry and on the CTBE’s pilot plant, which will provide data for second generation ethanol production using various technologies. It is expected that some of the data generated in the pilot plant will be available for evaluation in the VSB during 2012.
Summary
Executive Summary ............................................................................................................... 2
Summary ................................................................................................................................ 3
List of Figures ........................................................................................................................ 4
List of Tables .......................................................................................................................... 7
Abbreviations ....................................................................................................................... 10
Glossary ................................................................................................................................ 11
1. Introduction ...................................................................................................................... 13
2. The Virtual Sugarcane Biorefinery (VSB) ...................................................................... 16
3. Construction of the Virtual Sugarcane Biorefinery ......................................................... 23
4. Results .............................................................................................................................. 48
5. Final remarks .................................................................................................................. 111
6. References ...................................................................................................................... 117
3
List of Figures
Figure 1. Representation of CTBE’s Programs interaction................................................13
Figure 2. General concept of the VSB.................................................................................17
Figure 3. Basic principles of a biorefinery (Kamm and Kamm, 2004)..............................18
Figure 4. Aggregated flowchart of main operations used in the sugarcane production
system...................................................................................................................................24
Figure 5. Illustration of the Controlled Traffic Structure....................................................28
Figure 6. Canasoft Model scheme.......................................................................................29
Figure 7. Sugarcane plant parts (Hassuani et al., 2005)......................................................31
Figure 8. Block flow diagram of the production of sugar, ethanol and electricity from
sugarcane..............................................................................................................................36
Figure 9. Block-flow diagram of the integrated 1st and 2nd generation ethanol production
process from sugarcane........................................................................................................37
Figure 10. Example of an Aspen Plus flowsheet for the integrated first and second
generation ethanol production process from sugarcane......................................................38
Figure 11. Unit operations that represent distillation step..................................................39
Figure 12. Unit operations envolved in the second generation process..............................39
Figure 13. Scheme of the interactions between each main block of the simulation of the
integrated first and second generation production process.................................................40
Figure 14. Relative environmental impacts of different scenarios of sugarcane production.
..............................................................................................................................................50
Figure 15. Simplified scheme of the distillation columns...................................................59
Figure 16. Main results for basic and optimized autonomous and annexed plants............69
Figure 17. Investment and IRR of the basic and optimized autonomous and annexed
plants....................................................................................................................................70
Figure 18. Comparative environmental impact scores for ethanol production in base and
optimized scenarios of annexed plants and autonomous distilleries...................................71
4
Figure 19. Comparative environmental impacts breakdown for ethanol production in the
E50-B...................................................................................................................................72
Figure 20. Comparative environmental impact scores for ethanol production in base and
optimized scenarios of annexed plants and autonomous distilleries considering only the
industrial processing stage...................................................................................................72
Figure 21. Comparison of the IRR of optimized distilleries considering average prices for
the past 10 years and 2010 prices........................................................................................74
Figure 22. Impact of changes in prices and costs on the IRR for basic and optimized
autonomous and annexed plants..........................................................................................75
Figure 23. Ethanol and sugar production in the annexed plants with different fractions of
sugarcane juice diverted to sugar production......................................................................77
Figure 24. Investment and IRR for different configurations of the annexed plants..........77
Figure 25. Impact of changes on ethanol and sugar prices on the IRR of the Flex 70:70
and E50.................................................................................................................................78
Figure 26. Comparative environmental impact scores for ethanol production in E50 and
Flex 70:70 considering only the industrial processing stage..............................................79
Figure 27. Ethanol and electricity production in the optimized autonomous first
generation (1G) and scenarios for sweet sorghum..............................................................87
Figure 28. Impact of ±15% changes on sweet sorghum prices in the IRR of the scenarios
evaluated with harvest extension.........................................................................................88
Figure 29. Simplified scheme illustrating lignocellulosic material use, energy and ethanol
production in scenarios 1 through 4.....................................................................................95
Figure 30. Anhydrous ethanol and electricity production in the scenarios evaluated for the
integration of second generation ethanol production in an optimized autonomous
distillery................................................................................................................................96
Figure 31. Investment and IRR in the scenarios evaluated for the integration of second
generation ethanol production in an optimized autonomous distillery...............................96
Figure 32. Ethanol production costs in the scenarios evaluated.........................................97
Figure 33. Comparative environmental impact indicators of the different scenarios.........97
5
Figure 34. Sensitivity analyses for Global Warming Potential (GWP) (a), Eutrophication
Potential (EP) (b) and Human Toxicity Potential (HTP) (c) for scenario 4 (integrated first
and second generation ethanol production from sugarcane, using advanced hydrolysis
technologies and pentoses fermentation).............................................................................99
Figure 35. Ethanol and electricity production in the scenarios evaluated to compare stand-
alone 2nd generation (2G), the equivalent stand-alone plant including the first generation
producing lignocellulosic material (1G + 2G) and the integrated 1st and 2nd generation
(1G2G) plant......................................................................................................................100
Figure 36. Simplified scheme illustrating lignocellulosic material use, energy and ethanol
production in the stand-alone second generation plant.....................................................101
Figure 37. IRR and investment for each scenario in the evaluation of stand-alone second
generation plants................................................................................................................101
Figure 38. Ethanol, sugar and electricity production in the sugar mill coupled, or not, with
second generation ethanol production...............................................................................102
Figure 39. IRR and investment for the sugar mill and the sugar mill coupled with second
generation ethanol production...........................................................................................103
Figure 40. IRR for the annexed distillery (50/50: 50% of the juice for sugar production;
75/25: 25% of the juice for sugar production; RS: regular strain for butanol production;
MS: mutant strain; C: chemical market; B: biofuel market).............................................107
Figure 41. IRR for the integrated first and second generation ethanol production (ES: 1st
and 2nd generation ethanol production in the annexed distillery processing 50% of the
sugar juice for sugar production; RS: regular strain for butanol production; MS: mutant
strain; C: chemical market; B: biofuel market).................................................................108
Figure 42. Sensitivity analysis: impact of changes of +10% of the main variables on the
IRR of the first generation mill (left) and for the first generation mill with butanol
production (right)...............................................................................................................109
Figure 43. Sensitivity analysis: impact of changes of +10% of the main variables on the
IRR of the integrated first and second generation plant (left) and for the integrated process
with butanol production (right)..........................................................................................110
6
List of Tables
Table 1. Sugarcane fiber and sucrose content adopted by several authors.........................32
Table 2. Sugarcane bagasse composition (dry basis) – normalized average values obtained
for 50 samples (Rocha et al., 2010).....................................................................................32
Table 3. Sugarcane average chemical composition (Camargo, 1990)................................33
Table 4. Sugarcane composition (Mantelatto, 2005)..........................................................34
Table 5. Composition of the sugarcane adopted in the Virtual Sugarcane Biorefinery.....34
Table 6. Sugarcane production costs for the different sugarcane production scenarios
(values in US$/ha)................................................................................................................50
Table 7. Main parameters adopted in the simulation of the sugarcane cleaning................52
Table 8. Main parameters adopted in the simulation of the sugarcane extraction.............53
Table 9. Main parameters adopted in the simulation of the juice treatment operations.....55
Table 10. Parameters of the sugar crystallization process..................................................56
Table 11. Parameters of the sugar drying............................................................................57
Table 12. Main parameters adopted in the simulation of the fermentation process...........58
Table 13. Main parameters adopted in the simulation of the distillation columns.............59
Table 14. Main parameters of the dehydration processes evaluated in the VSB................60
Table 15. Main parameters of the cogeneration system......................................................61
Table 16. Distribution of investment of an autonomous distillery (Dedini, 2009).............62
Table 17. Fraction of investment of a mill/distillery (Sousa and Macedo, 2010). ............63
Table 18. Investment in equipment for annexed and autonomous distilleries (Sousa and
Macedo, 2010)......................................................................................................................64
Table 19. Assumptions made for investment calculations in the VSB...............................64
Table 20. Main features of the scenarios.............................................................................65
Table 21. Investment for basic scenarios, based on Sousa and Macedo (2010).................66
Table 22. The steam production for each scenario..............................................................66
7
Table 23.Investment estimate for each scenario.................................................................68
Table 24. Main characteristics of the basic and optimized plants......................................68
Table 25. Scenarios evaluated in the comparison of basic and optimized plants...............69
Table 26. Prices adopted in the analysis for 2010 (CEPEA, 2011)....................................74
Table 27. Sugarcane processed in August and accumulated in season – Data from Mill
A’s bulletin...........................................................................................................................79
Table 28. Sugar and ethanol produced in August and accumulated in season – Data from
Mill A’s bulletin...................................................................................................................80
Table 29. Example of input data based on information from the database and processes of
the sugar mill for the sugar plant section.............................................................................80
Table 30. Sample data entered based only on information from bulletins and process -
Configuration processes of distillation section...................................................................81
Table 31. Comparison between the results of brix, pol and moisture, obtained for the stage
of preparation and extraction of sugarcane, with the bulletin data.....................................81
Table 32. Comparison between the results of RS, TRS and fiber, obtained for the
preparation and extraction of sugarcane, and data provided in the bulletin.......................82
Table 33. Comparison between the results of TRS and moisture, obtained for the stage of
juice treatment, and data provided in the bulletin...............................................................82
Table 34. Comparison between the results of brix and pol, obtained for the stage of juice
treatment, with the bulletin data..........................................................................................82
Table 35. Comparison between the results of brix, pol and TRS, obtained for the stage of
juice evaporation, with the bulletin data..............................................................................82
Table 36. Comparison between the obtained results and bulletin data for must. ..............83
Table 37. Comparison between the obtained results and bulletin data for CHP................83
Table 38. Comparison of the results obtained for the production of alcohol from the
simulation on Aspen Plus with data from the bulletin........................................................83
Table 39. Comparison of the results obtained for the sugar production with data from the
bulletin..................................................................................................................................83
8

Table 40. Comparison of the results obtained for the intermediate streams in sugar
production with data from the bulletin................................................................................84
Table 41. Comparison of yields calculated from the results of the simulation on Aspen
Plus with data from the bulletin...........................................................................................84
Table 42. Sweet sorghum main characteristics and process yield (Rossell, 2011)............86
Table 43. Sweet sorghum prices, IRR and ethanol production costs for the harvest
extension scenarios with sweet sorghum.............................................................................88
Table 44. Parameters adopted in the simulation of the 2nd generation process.................92
Table 45. Estimate of equipment investment and processing capacity of 2G plants
(CGEE, 2009).......................................................................................................................93
Table 46. Scenarios evaluated in the integrated first and second generation ethanol
production from sugarcane..................................................................................................94
Table 47. Scenarios evaluated in the integrated first and second generation ethanol
production from sugarcane................................................................................................100
Table 48. Description of the scenarios evaluated for butanol production in the VSB.....104
Table 49. Outputs of a sugarcane biorefinery with butanol production...........................105
Table 50. Butanol and acetone prices adopted in the economic analysis.........................106
9
Abbreviations
ADP: Abiotic depletion
AP: Acidification
1G: First generation ethanol production
2G: Second generation ethanol production
ATR: Total Recoverable Sugars
CHP: Combined Heat and Power (cogeneration system)
CTBE: Brazilian Bioethanol Science and Technology Laboratory
CTS: Controlled Traffic Structure
EP: Eutrophication
FWAET: Fresh water aquatic ecotoxicity
GHG: Greenhouse Gases
GWP: Global warming
°GL: Degree Gay Lussac (% alcohol by volume at 15°C)
HTP: Human toxicity
iLUC: indirect land use change
°INPM: Ethanol content (percent by weight)
IRR: Internal Rate of Return
LCA: Life Cycle Assessment
LCI: Life Cycle Inventory
LCIA: Life Cycle Impact Assessment
LHV: Low heating value
LM: Lignocellulosic material
LUC: land use change
MAET: Marine aquatic ecotoxicity
MEE: Multiple Effect Evaporators
ODP: Ozone layer depletion
PAT: Technological Assessment Program of CTBE
POP: Photochemical oxidation
RS: Reducing sugars
TC: Tons of sugarcane (1000 kg)
TET: Terrestrial ecotoxicity
TRS: Total reducing sugars
VSB: Virtual Sugarcane Biorefinery
10

Glossary
Anhydrous ethanol: stream produced after dehydration of hydrated ethanol, containing at
least 99.3 wt% ethanol (in accord to Brazilian regulation), used as fuel in a mixture with
gasoline;
Bagasse: fibrous residue produced after extraction of juice from sugarcane. Currently
used for energy (steam and electricity) production in cogeneration systems, may be used
as feedstock for second generation ethanol production;
Construction of terrace: operation performed to avoid water flow over soil surface;
Dry leaves: old leaves of the sugarcane plant;
EMBRAPA: Empresa Brasileira de Pesquisa Agropecuária (Brazilian Agricultural
Research Corporation);
Filter cake: solid residue obtained during juice treatment that contains most of the
impurities of the sugarcane juice. Used as fertilizer in the sugarcane field;
Dedini: a company with a long history on supplying equipment and solutions for the
sugar/ethanol/energy market;
Furrow: row of planting;
Growth promoters: a combination of different compounds which can promote sugarcane
growth;
Harrowing: operation to revolve the soil;
Herbicide: agrochemical used for weeds control;
Hormones: root growth promoters;
Humic Acid: complex mixture of organic acids produced by the decomposition of organic
matter which improves root growth;
Hydrated ethanol: hydroalcoholic solution containing between 92.8 and 93.6 wt% ethanol
(in accord to Brazilian regulation), used as a fuel in neat ethanol or flex-fuel engines;
Infield transport: operation of sugarcane removal from the field until transport;
Insecticide: agrochemical used to control plagues;
Leveling: operation to flatten the soil before the planting;
Loading: operation to put sugarcane into in field transport;
Massecuites: intermediate stream in the sugar production process containing sugar
crystals and mother liquor;
11
Molasses: syrup containing remainder sugars and non sugars obtained after sucrose
crystallization. The last and more impure is so called “final molasses”;
Micronutrients: plant nutrients required in low amounts;
Nematicide: agrochemical used to eliminate soil nematodes, a specific class of plant
parasites;
No-tillage: practice without soil revolving during pre-planting sugarcane;
Phlegm: ethanol-rich streams (40 – 50 °GL) obtained during ethanol distillation, are fed
to the rectification column where hydrated ethanol is produced;
Phlegmasse: residue obtained in the rectification column, containing mostly water.
Pre-planting: all operations performed before sugarcane planting;
Plant cane: designation of the first sugarcane crop;
Plowing: operation in which the soil is substantially revolved;
Ratoon: designation of the sugarcane crops after the first harvest;
Rotation culture: practice used to break the monoculture in sugarcane fields;
Soluble solids: solids that are dissolved in a solution or stream;
Subsoiling: operation performed to decrease the soil compaction;
Sugarcane setts: sections of the stalks;
Surplus bagasse: remaining bagasse after all needs of steam and electricity of the
industrial plant have been fulfilled;
Technological pre-analysis: collection of samples to assess the level of Brix, Pol, and
other quality parameters of stalks;
Tops: green leaves of the plant;
Total solids: soluble and insoluble solids in a solution or stream;
Trash: sugarcane tops and leaves that may be used as fuel in cogeneration systems,
producing electricity. Usually it is burnt when manual harvest is used;
Vinasse: residue obtained during ethanol distillation, containing high contents of organic
compounds, suspended solids, potassium and other nutrients. Usually used for
fertirrigation in the sugarcane field;
Wine: hydroalcoholic solution obtained after fermentation of sugars.
12
1. Introduction
The Brazilian Bioethanol Science and Technology Laboratory (Laboratório Nacional de
Ciência e Tecnologia do Bioetanol – CTBE) integrating the Brazilian Center of Research
in Energy and Materials (Centro Nacional de Pesquisa em Energia e Materiais – CNPEM)
was inaugurated by the Ministry of Science, Technology and Innovation (Ministério de
Ciência, Tecnologia e Inovação – MCTI) of the Brazilian Government in 2010 to
contribute to the Brazilian leadership in the sectors of renewable energy sources and
chemical industry raw material production, mainly by improving the sugarcane bioethanol
production chain through research, development and innovation, along with the
productive sector and the Brazilian scientific-technology community.
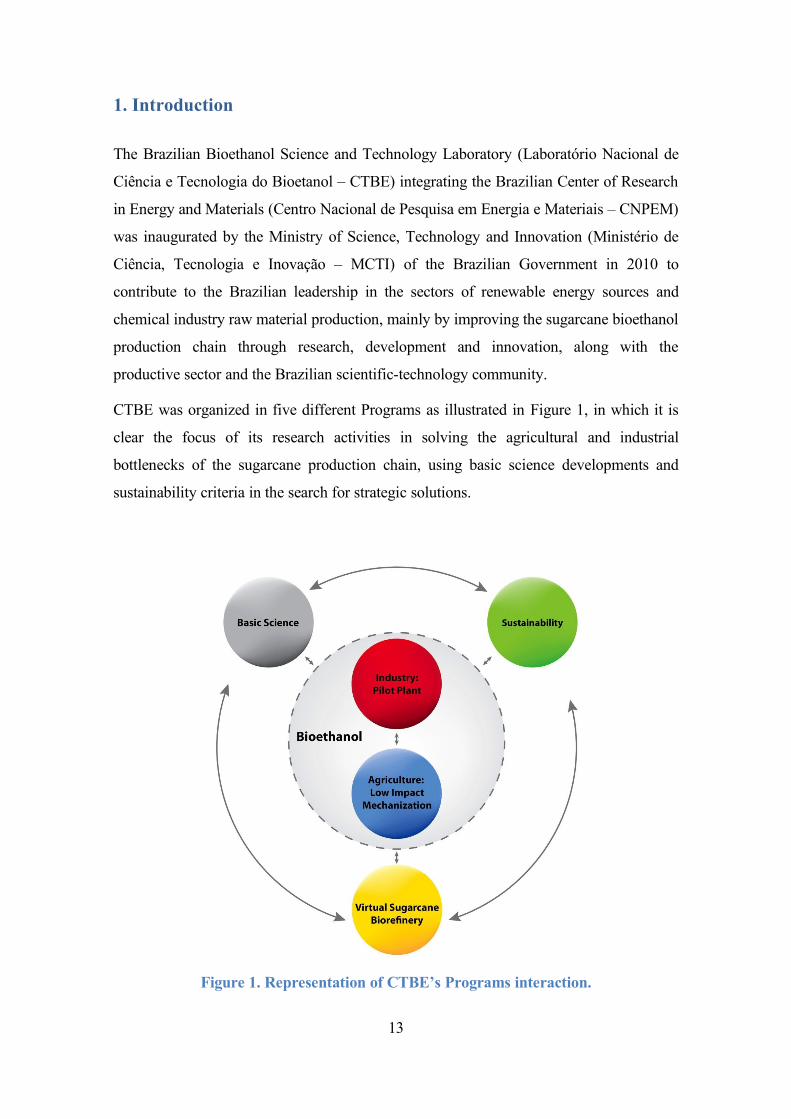
CTBE was organized in five different Programs as illustrated in Figure 1, in which it is
clear the focus of its research activities in solving the agricultural and industrial
bottlenecks of the sugarcane production chain, using basic science developments and
sustainability criteria in the search for strategic solutions.
Figure 1. Representation of CTBE’s Programs interaction.
13
The Technological Assessment Program (Programa de Avaliação Tecnológica – PAT),
has emerged from the need of setting a methodology to measure CTBE’s success. With
this purpose, the construction of a simulation tool was designed – the Virtual Sugarcane
Biorefinery (VSB). A plan containing the idea, objectives, scope and methodology for the
VSB construction was submitted, evaluated and approved by the bioethanol and
sugarcane community in the workshop “Virtual Sugarcane Biorefinery: Assessing success
of new technologies”.
The VSB is a simulation platform which will allow the evaluation of the integration of
new technologies (cellulosic ethanol and other products from the green chemistry in the
biorefinery concept, new agricultural strategies for sugarcane production, as well as
different strategies for ethanol use as a biofuel) with the technologies practiced today in
the whole production chain. The results obtained with the VSB will be validated against
existing plants, in order to guarantee the accuracy of the sustainability impacts calculated
with this simulation tool.
The VSB will also be used to assess the level of success reached by CTBE’s Pilot Plant
for Process Development (Planta Piloto de Desenvolvimento de Processos – PPDP) in the
development of new industrial technologies, as well as the CTBE’s Agriculture Program
innovations, using methodologies identified and developed together with the
Sustainability Program. It is an important tool for the continuous evaluation and
improvement of CTBE’s research activities, as well as to evaluate the potential of several
possible alternatives and technologies covering all aspects of the program.
Focused on the concept that “the increase of ethanol productivity per hectare (liters of
ethanol produced per hectare of used land and per year) is the combination of advances in
the two sectors of the production chain – agricultural and industrial”, two objective macro
goals related to each sector were created in order to keep CTBE’s focus linked to
developments in both areas, with substantial impacts on the sustainability of the Brazilian
sugarcane production chain:
Macrogoal 1: Research and development of an innovative agricultural model for full use
of sugarcane using no-till and precision agriculture, according to criteria of technical
viability and sustainability (economic, environmental and social) of the production chain
with a focus on productivity, quality and specificity of the raw material.
14
Macrogoal 2: Research and development of processes to obtain “second generation” (2G)
ethanol, electricity and co-products derived from the green chemistry, in the biorefineries
concept, with full use of sugarcane, exploring the strategy of integration with the “first
generation” (1G) ethanol production and according to criteria of technical viability and
sustainability (economic, environmental and social) of the production chain.
The success of these macrogoals will be measured using the VSB developed by the PAT
team, which will be constructed and validated over the next years. Thereby, these
macrogoals are focused on the development of a technology able to introduce a
productive increase in the sustainability of the whole sugarcane industry, mainly for
ethanol production.
In order to help CTBE to achieve these two macro goals, PAT defined its own two major
macrogoals:
• Construction of a tool to calculate the sustainability indicators of different
agricultural and industrial technology routes within a biorefinery focused in
current CTBE’s developments – the VSB.
• Periodical evaluation and comparison of stages of ethanol technology
development (1G, 2G and integrated 1G and 2G) as well as other routes within a
biorefinery, considering the average levels and good practices (performed
commercially) and the ones currently under development at CTBE and by third
parties (Megaexperiment).
The PAT macrogoals will be reached through the development of a set of well planned
projects, which will evaluate the impacts of the technologies to be implemented through
the construction and simulation of the corresponding scenarios and present the results of
periodical evaluations, by means of an annual report.
15
2. The Virtual Sugarcane Biorefinery (VSB)
The mathematical modeling and simulation of the different processes and operations
included in the sugarcane production chain (agricultural, industrial and usage sectors) will
allow the estimation and optimization of the economic, social and environmental impacts
associated with the new technologies under development. These results will allow
assessing the stage of development of the new technologies, as well as the interest in
accelerating the implementation process, orienting the laboratories participating in the
development about possible optimum operating conditions, looking for their experimental
confirmation.
The development of models and the use of computational tools and specific commercial
software will make it possible to assess the impacts of the new technologies on the
Brazilian bioethanol production chain in the three areas of the sustainability concept:
Economic: required investment, profitability (internal rate of return – IRR and other
parameters), products production costs, revenues and taxes, among other parameters, and
their implications in the production chain will be evaluated using economic engineering
tools; at the same time, the sensitivity analysis of the most important parameters included
in the technologies under development, on the related costs and investments will be
performed, as well as a risk analysis related with the implementation of the new
technologies.
Environmental: energy balance (relation among the renewable energy produced and the
fossil energy consumed), greenhouse gas emissions balances, water consumption and
other environmental impacts included in the Life Cycle Assessment (LCA) such as
acidification, photo-oxidant formation, nitrification, eutrophication and human toxicity, as
well as new concepts and models introduced in the environmental analysis of biofuels,
such as land use changes (LUC and iLUC) and impacts on the biodiversity.
Social: local impacts derived from the automation, plant scale, agricultural sector
mechanization, among others, on the number and quality of created jobs (income and
scholar degree), as well as land use, social relations with the community and labor
qualification; these impacts will be estimated using the input-output and general
equilibrium methodologies; these economic models allow for the quantification of the
16

changes in the activity level of each sector of the economy as a function of modifications
on demand for products of one or more sector.
Figure 2 illustrates the general concept of the VSB.
Figure 2. General concept of the VSB.
2.1 Objectives
The VSB project aims the development of an analysis tool for sugarcane biorefineries,
including the agricultural, industrial and usage sectors, which will make possible to:
• optimize the concepts and processes included in a biorefinery;
• assess different biorefinery alternatives referring to their sustainability (economic,
environmental and social impacts);
• assess the stage of development of the new technologies included in the analysis.
2.2 Scope
The scope of the VSB is the construction/adaptation of a simulation platform aiming to
assist the modeling, optimization and socio-economic and environmental assessment of
integrated processes, major characteristic of a biorefinery, together with all the stages of
17
the sugarcane production chain. This will be a tool able to identify the processes and
parameters showing major economic, social and environmental impacts, in order to help
in the prioritization of the scientific and technological researches.
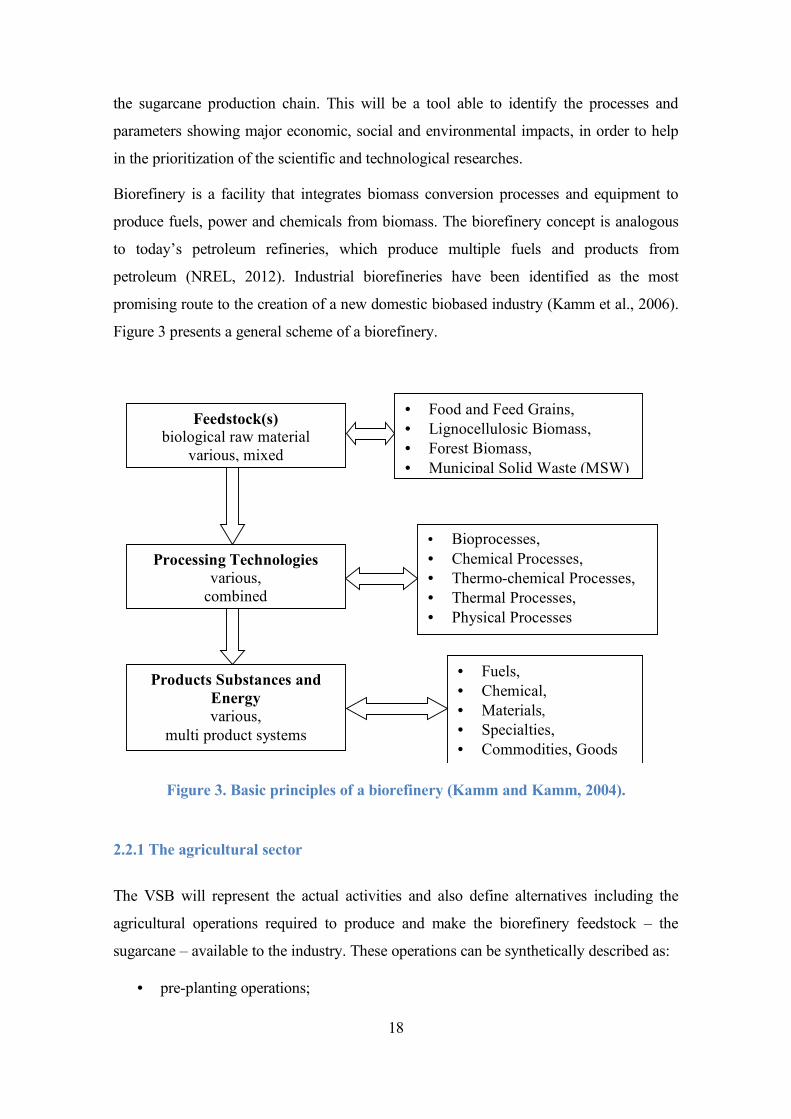
Biorefinery is a facility that integrates biomass conversion processes and equipment to
produce fuels, power and chemicals from biomass. The biorefinery concept is analogous
to today’s petroleum refineries, which produce multiple fuels and products from
petroleum (NREL, 2012). Industrial biorefineries have been identified as the most
promising route to the creation of a new domestic biobased industry (Kamm et al., 2006).
Figure 3 presents a general scheme of a biorefinery.
Products Substances and Energy various,
multi product systems
• Fuels, • Chemical, • Materials, • Specialties, • Commodities, Goods
Processing Technologies various,
combined
• Bioprocesses, • Chemical Processes, • Thermo-chemical Processes, • Thermal Processes, • Physical Processes
• Food and Feed Grains, • Lignocellulosic Biomass, • Forest Biomass, • Municipal Solid Waste (MSW)
Feedstock(s) biological raw material
various, mixed
Figure 3. Basic principles of a biorefinery (Kamm and Kamm, 2004).
2.2.1 The agricultural sector
The VSB will represent the actual activities and also define alternatives including the
agricultural operations required to produce and make the biorefinery feedstock – the
sugarcane – available to the industry. These operations can be synthetically described as:
• pre-planting operations;
18

• soil preparation;
• manual or mechanical planting;
• cultivation – sugarcane plant and ratoon;
• manual or mechanical harvesting;
• sugarcane transport.
In order to evaluate the technical, socio-economic and environmental impacts of different
technological scenarios, an agricultural spreadsheet (that includes a detailed description of
the above mentioned operations), named “Canasoft”, is being constructed, validated and
integrated to the simulation tools used to represent the other sectors of the sugarcane
production chain.
2.2.2 The industrial sector
In order to make the inclusion and the sustainability assessment of several biorefinery
alternatives viable, it will be necessary to define and technically evaluate different
proposals and routes to transform biomass into products. The VSB will focus on
sugarcane as the biomass to be used and the first and second generation bioethanol as the
major product, although it will include the analysis of other products such as sugar,
electricity, other liquid fuels (obtained using the thermal and biochemical route to convert
the lignocellulosic material), materials (such as the polyhydroxyalkanoates obtained
through sugars fermentation), primers for the chemical industry (obtained from ethanol,
sugar or fractions of the lignocellulosic material), among others.
Therefore, some basic routes must be designed and technically assessed, being a basis for
the construction of the VSB:
Route 1: biorefinery producing first generation ethanol, sugar and electricity;
Route 2: biorefinery based on the utilization of the whole sugarcane, focused on the
production of the second generation bioethanol (through hydrolysis);
Route 3: biorefinery based on the utilization of the whole sugarcane, focused on the
production of liquid fuels from the gasification of excess biomass (synthesis gas –
thermochemical route);
Route 4: biorefinery focused on the alcoholchemistry route;
19
Route 5: biorefinery focused on the sugarchemistry route;
Route 6: biorefinery focused on the lignin chemistry route;
Route n: other routes.
A simulation platform is used to simulate the different basic routes proposed in the
construction of the VSB. Several commercial packages oriented to process simulation are
available in the market (Aspen Plus, SuperPro Designer and EMSO are just examples).
They were developed for a large spectrum of industries: oil, petrochemicals,
pharmaceuticals, biotechnologies, fine chemistry, mineral processing, microelectronic and
effluents treatment, among others. For several reasons, which will be detailed in the topic
related to the development of the simulations of the industrial production process in the
VSB, Aspen Plus was selected as the simulation platform.
2.2.3 The usage sector
In order to complete the sugarcane production chain, the last sector to be simulated is the
one that includes the operations of commercialization and use of the different products
produced in the biorefinery. Taking, for example, ethanol as the product to be assessed,
the major operations to be considered for simulation are:
• transport of ethanol to/among the commercialization agents;
• mixture with gasoline (gasohol alternative);
• use of ethanol in the vehicles;
• deposition of the product (not in the case of ethanol).
A spreadsheet will be constructed detailing the operations involved for the use of the
different products in the biorefinery, allowing for the complete assessment of the
sugarcane production chain.
2.2.4 Stages of development
Three development versions of the VSB are defined in order to characterize the quality
and accuracy of the simulation performed during the use of the VSB for assessment
purposes. The descriptions of these versions are illustrated for the industrial sector, but
20

they can be applied with minor adjustments to the other sectors of the production chain, to
know:
1) Preliminary Version: all the simulation is performed based on preliminary flow
diagrams and, in general, using data available in the literature.
2) Consolidated Version: all the simulation is performed based on a conceptual
design performed for the assessed technology or using operation description
discussed in detail with specialists, when the other sectors of the chain are
considered.
3) Validated Version: the parameters used in the simulation as well as the results
obtained are compared with data measured or obtained in commercial operations.
Generally 3 levels of validation are considered: validated against one technology
(1); validated against different technologies (2); validated against different
technologies and regional conditions (3).
2.3 Modeling and Simulation Net
The VSB will be constructed based on the scheme presented in Figure 2. The amplitude
of the scope of the present Program requires the collaboration of Research Institutions and
Companies interested in the development and use of the VSB that, in the future, will
constitute a supporting network.
The development of the Program is coordinated by CTBE that centralizes the
construction, operation and publication of the results obtained with the several versions of
the VSB, as soon as they are developed and validated, including the ones developed
together with Institutions and Companies that are already participating in its construction.
The Modeling and Simulation Network to support the VSB construction is organized into
six sub-nets that operate in an integrated form.
Sub-Net 1: Development and utilization of simulation platforms of integrated systems
– application to biorefinery concepts.
Sub-Net 2: Development of optimization techniques for unit operations and integrated
processes.
21
Sub-Net 3: Development of mathematical models of the unit operations present in the
biorefinery configurations.
Sub-Net 4: Development of the methodologies and databases to be used in
sustainability impacts calculations.
Sub-Net 5: Development of mathematical models for the agricultural and logistic
operations related to sugarcane production.
Sub-Net 6: Development of the VSB version to simulate the thermochemical route,
including the database for its construction.
22
3. Construction of the Virtual Sugarcane Biorefinery
3.1 Sugarcane agricultural phase
3.1.1 General description of the sugarcane production system
Sugarcane agricultural practices may vary according to regional characteristics, soil,
water availability, slope of the field, among other factors. Furthermore, there are also
many variations depending on the agricultural management adopted, mainly on pre-
planting, planting and harvesting operations. In this report the main agricultural
operations used in South-Central region of Brazil are described. This area is responsible
for about 90% of Brazilian sugarcane production (UNICA, 2011).
The main operations impacting on sugarcane production costs are planting and
harvesting. In this context, CTBE has been leading innovative research projects on both
planting and harvesting challenges for the sugarcane sector.
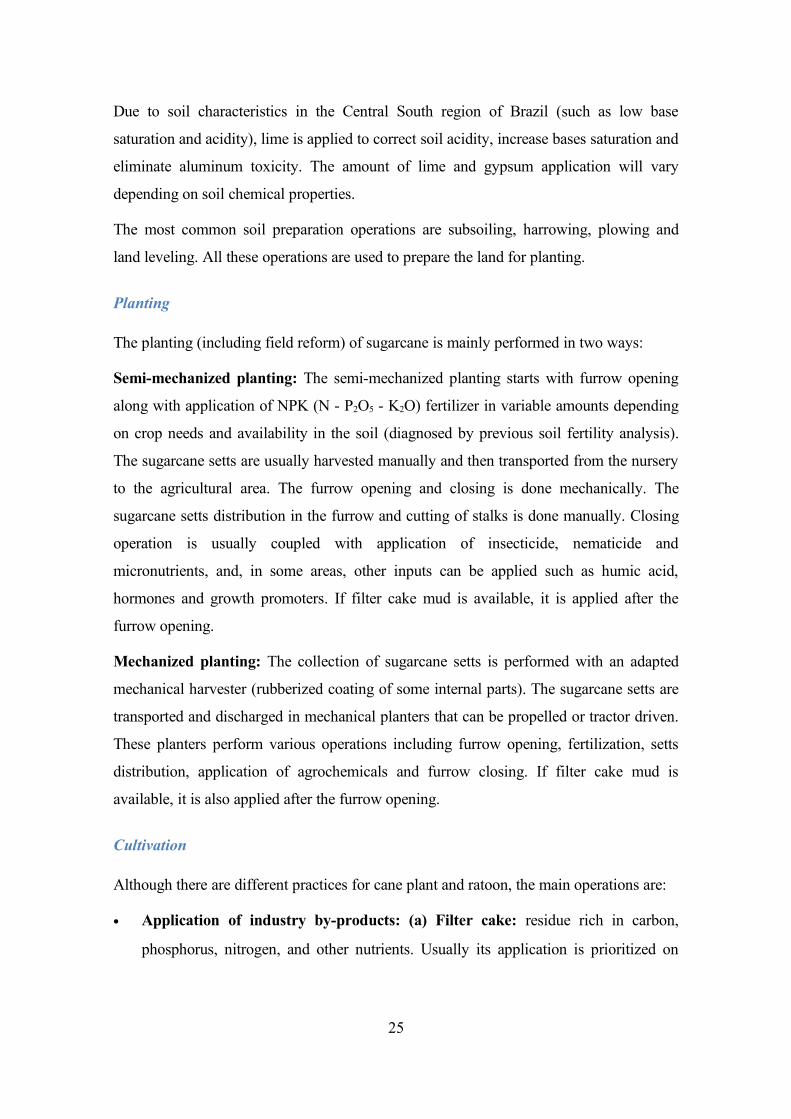
This section describes the main operations (depicted in Figure 4) in the sugarcane
agricultural production system, from the soil preparation until the sugarcane delivery into
the industrial facility. This figure is aggregated and only the main operations are shown.
Pre-planting operations
During the decision-making process in the sugarcane mills management, the plots to be
replaced are selected based on their productivity, age, and/or level of infestation from
pests and diseases. Also depending on location (logistics) and plant production strategies,
there will be incorporation of new crop areas. Therefore, a set of mechanized operations
to adapt the land are translated into the production cost difference between current and
expansion production areas.
Among operations for land use preparation are the soil conservation, construction of
terraces and roads, according to previous occupation (pasture, permanent crops, among
others). In reform areas the previous ratoon elimination can be done using physical
(harrowing) or chemical (herbicides) techniques, depending on the management practices
to be adopted.
23

Figure 4. Aggregated flowchart of main operations used in the sugarcane production
system.
24
Due to soil characteristics in the Central South region of Brazil (such as low base
saturation and acidity), lime is applied to correct soil acidity, increase bases saturation and
eliminate aluminum toxicity. The amount of lime and gypsum application will vary
depending on soil chemical properties.
The most common soil preparation operations are subsoiling, harrowing, plowing and
land leveling. All these operations are used to prepare the land for planting.
Planting
The planting (including field reform) of sugarcane is mainly performed in two ways:
Semi-mechanized planting: The semi-mechanized planting starts with furrow opening
along with application of NPK (N - P2O5 - K2O) fertilizer in variable amounts depending
on crop needs and availability in the soil (diagnosed by previous soil fertility analysis).
The sugarcane setts are usually harvested manually and then transported from the nursery
to the agricultural area. The furrow opening and closing is done mechanically. The
sugarcane setts distribution in the furrow and cutting of stalks is done manually. Closing
operation is usually coupled with application of insecticide, nematicide and
micronutrients, and, in some areas, other inputs can be applied such as humic acid,
hormones and growth promoters. If filter cake mud is available, it is applied after the
furrow opening.
Mechanized planting: The collection of sugarcane setts is performed with an adapted
mechanical harvester (rubberized coating of some internal parts). The sugarcane setts are
transported and discharged in mechanical planters that can be propelled or tractor driven.
These planters perform various operations including furrow opening, fertilization, setts
distribution, application of agrochemicals and furrow closing. If filter cake mud is
available, it is also applied after the furrow opening.
Cultivation
Although there are different practices for cane plant and ratoon, the main operations are:
• Application of industry by-products: (a) Filter cake: residue rich in carbon,
phosphorus, nitrogen, and other nutrients. Usually its application is prioritized on
25
planting (reform of sugarcane). (b) Vinasse: residue rich in organic matter,
potassium and other nutrients. It is usually applied on ratoons.
• Application of agrochemicals: herbicides are applied on the soil between the rows
to control weeds. In some cases, the use of insecticides may also be necessary. There
is a high range of agrochemicals registered for sugarcane culture.
• Fertilization: plant cane fertilization is usually performed during the planting
operation. In the ratoon it is performed through triple operation (subsoiling,
harrowing, fertilizing), or applied over the straw. There are multiple combinations of
NPK that can be used.
The main manual operations at this stage are: agricultural pests monitoring performed by
biological pest control, technological pre-analysis of sugarcane, weeds manual control.
The main inputs at this stage are: herbicide, maturator, conventional/biological chemicals,
and fertilizers (urea and NPK formulates).
Harvesting, loading and transport
The sugarcane harvesting is performed mainly in two ways:
• Manual: Manual harvesting is usually preceded by the operation of burning the
sugarcane field, which requires preparation with firebreaks and monitoring to prevent
the fire from spreading into other areas. The practice of burning before harvesting
increases the efficiency of manual cutting and reduces the risk of attacks by
venomous animals, such as snakes and spiders. The manual green cane (without pre
harvesting burning) harvesting is unusual, being used mostly in sugarcane setts. The
harvesting operation is a very intensive operation in manpower use. After cutting,
cane stalks are placed in trucks through self-propelled machine with mechanical claw
(loader).
• Mechanized: Mechanical harvesting presents a higher efficiency than manual
harvesting and it is currently used in areas with slopes up to 12%. It is an intensive
operation in machinery and fuel use in comparison to manual harvesting, but it does
not require pre harvesting burning. The loading of sugarcane harvested mechanically
is usually performed using in field transport.
26
Sugarcane transportation from the field to the industrial plant is mainly done in three
ways:
• “Romeu e Julieta”: a truck plus trailer with a loading capacity of 28 tons. It is
normally used in areas where manual harvesting is applied.
• “Treminhão”: basically a “Romeu e Julieta” set where another trailer (Julieta) is
annexed. It has an approximate loading capacity of 45 tons. It is, along with the
“Rodotrem”, normally used in areas where mechanical harvesting is applied.
• “Rodotrem”: a lorry with combination of two semi-trailers connected by a two-axle
dolly. The loading capacity in this case is of 58 tons.
Technological innovations in the sugarcane agricultural production system
No-tillage practice has been considered an alternative technique for sugarcane planting
with potential for many agronomic, economic and environmental benefits. It can promote
reduced soil tillage and lower production costs due to less agricultural operations and,
consequently, less use of machinery and fuel.
Similarly, precision agriculture is also an innovative practice in the sugarcane production
system. It has a great potential for agronomic, economic and environmental benefits for
planting and cultivation due to application of main inputs at variable rate based in the
agronomic/potential need of the plant. The development of sensors and specialized
machinery for this purpose is still a challenge to overcome.
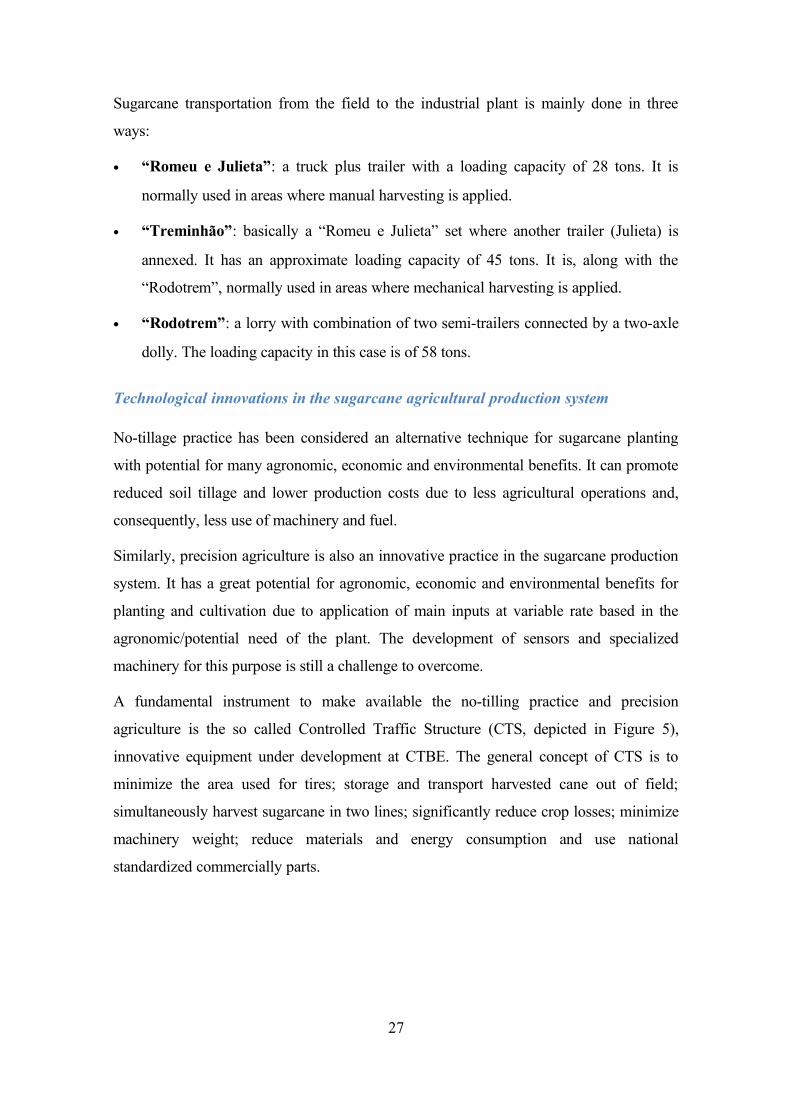
A fundamental instrument to make available the no-tilling practice and precision
agriculture is the so called Controlled Traffic Structure (CTS, depicted in Figure 5),
innovative equipment under development at CTBE. The general concept of CTS is to
minimize the area used for tires; storage and transport harvested cane out of field;
simultaneously harvest sugarcane in two lines; significantly reduce crop losses; minimize
machinery weight; reduce materials and energy consumption and use national
standardized commercially parts.
27

Figure 5. Illustration of the Controlled Traffic Structure.
Another important innovation that has been discussed in the sugarcane sector is the use of
trash (sugarcane leaves and tops) resulting from mechanical harvesting (without pre
harvesting burning) for energy purposes. The amount of trash that can be removed from
the field and used at the sugarcane mill, without compromising its agronomic function
(maintenance of moisture, maintaining the physical aspects of soil, nutrient recycling,
among others) as well as its best collection procedure (including its technology,
machinery and logistics) need further research. These important issues are also included
in the strategic objectives of CTBE.
3.1.2 Canasoft Model
Computer simulation platforms are recognized to be powerful tools to simulate, predict
and calculate mass and energy balances in industrial processes. However, there is no
similar instrument, readily available, for evaluation of agricultural production systems due
to its complexity, specificity, variability, interaction with environment and other inherent
characteristics of agricultural systems.
To overcome this lack, which in fact represents a challenge, a computational model, so
called Canasoft Model, has been developed at CTBE for simulation and measurement of
important agricultural parameters for technical and sustainability assessment of
28
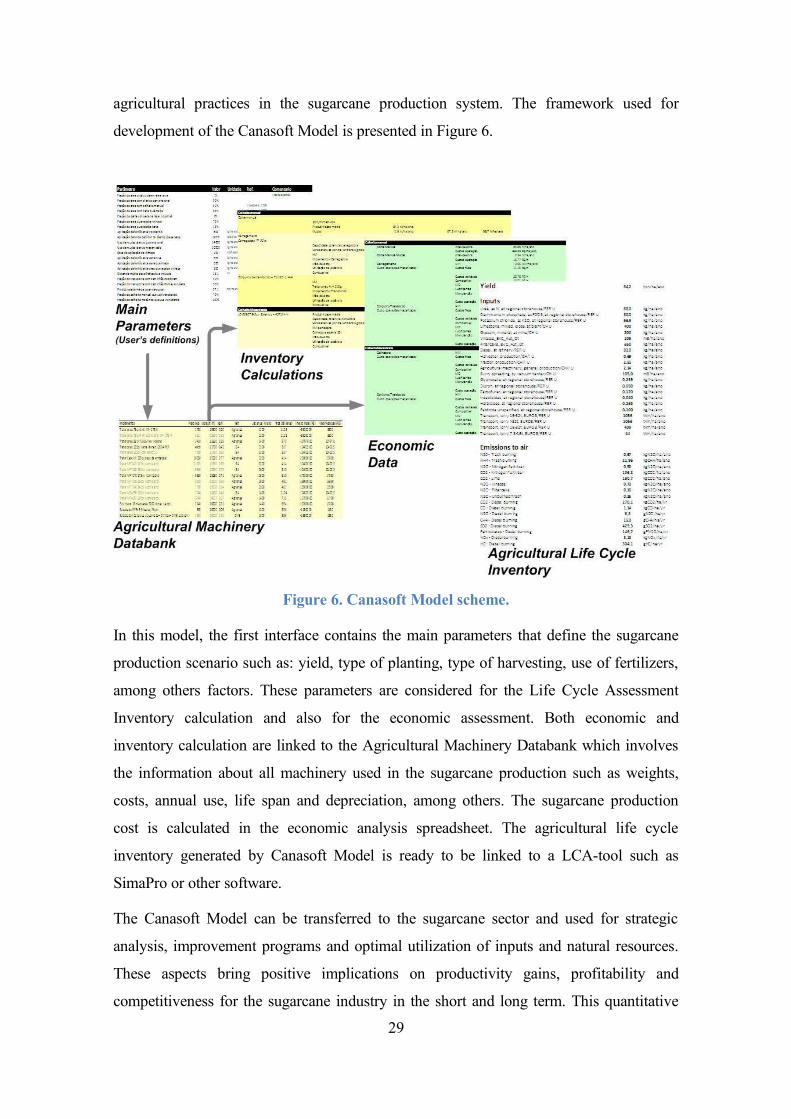
agricultural practices in the sugarcane production system. The framework used for
development of the Canasoft Model is presented in Figure 6.
Figure 6. Canasoft Model scheme.
In this model, the first interface contains the main parameters that define the sugarcane
production scenario such as: yield, type of planting, type of harvesting, use of fertilizers,
among others factors. These parameters are considered for the Life Cycle Assessment
Inventory calculation and also for the economic assessment. Both economic and
inventory calculation are linked to the Agricultural Machinery Databank which involves
the information about all machinery used in the sugarcane production such as weights,
costs, annual use, life span and depreciation, among others. The sugarcane production
cost is calculated in the economic analysis spreadsheet. The agricultural life cycle
inventory generated by Canasoft Model is ready to be linked to a LCA-tool such as
SimaPro or other software.
The Canasoft Model can be transferred to the sugarcane sector and used for strategic
analysis, improvement programs and optimal utilization of inputs and natural resources.
These aspects bring positive implications on productivity gains, profitability and
competitiveness for the sugarcane industry in the short and long term. This quantitative
29
assessment of sustainability indicators for alternative sugarcane biorefineries can also
support new initiatives to add value and remuneration of this activity due to
environmental benefits (positive externalities) that may be produced or public policy for
valuation of carbon credits through a Clean Development Mechanism.
3.1.3 Agricultural databank and validation process
The Agricultural Databank is the database that contains all the information about the
sugarcane agricultural production process. This information includes the inputs and
outputs of different sugarcane production processes under several management conditions
in different regions of Brazil.
In the first step most of the information was collected from literature and provided by
specialists. In a second stage this information will be complemented and validated with
data from several sugarcane mills in Brazil operating under several management practices
in different regions.
It is important to mention that this validation process has already started for the industrial
data and it is expected that in the next year it will be possible to have a portfolio of
sugarcane mills to validate the Agricultural Databank. Furthermore, it will be possible to
count with EMBRAPA’s collaboration for the validation of sugarcane production data.
This collaboration will provide some biophysical, economic and environmental models to
the sugarcane agricultural production stage and will assist the validation of the data used
in the Canasoft Model.
The information about different practices will be organized in different groups
characterizing different technological, geographical and historical scenarios. These data
will be collected considering uncertainty, representativeness and consistency.
The main information of the sugarcane agricultural stage to be collected in the
Agricultural Databank and/or validated is listed below:
• Sugarcane yield;
• Sugarcane quality (sugar and fiber content);
• Number of cuts (crop season);
• Type and main inputs and outputs for the rotation culture (e.g. soybean, peanuts);
30

• Type and main inputs for sugarcane culture: fertilizers, limestone, agrichemicals,
others;
• Type and main outputs for sugarcane culture: sugarcane stalks, trash;
• Amount and use of industrial residues (vinasse, ashes and filter cake mud) that are
recycled in the sugarcane field;
• Agricultural machinery and fuel consumption used for each agricultural operation;
• Fraction of sugarcane with pre-harvesting burning;
• Type and average distance for sugarcane transport from field to industry;
• Previous land use that is now occupied with sugarcane.
3.2 Sugarcane quality
The sugarcane plant is comprised by stalks, which contain most of the sugars, tops and
leaves, included in the so-called trash, as represented in Figure 7.
Figure 7. Sugarcane plant parts (Hassuani et al., 2005).
31
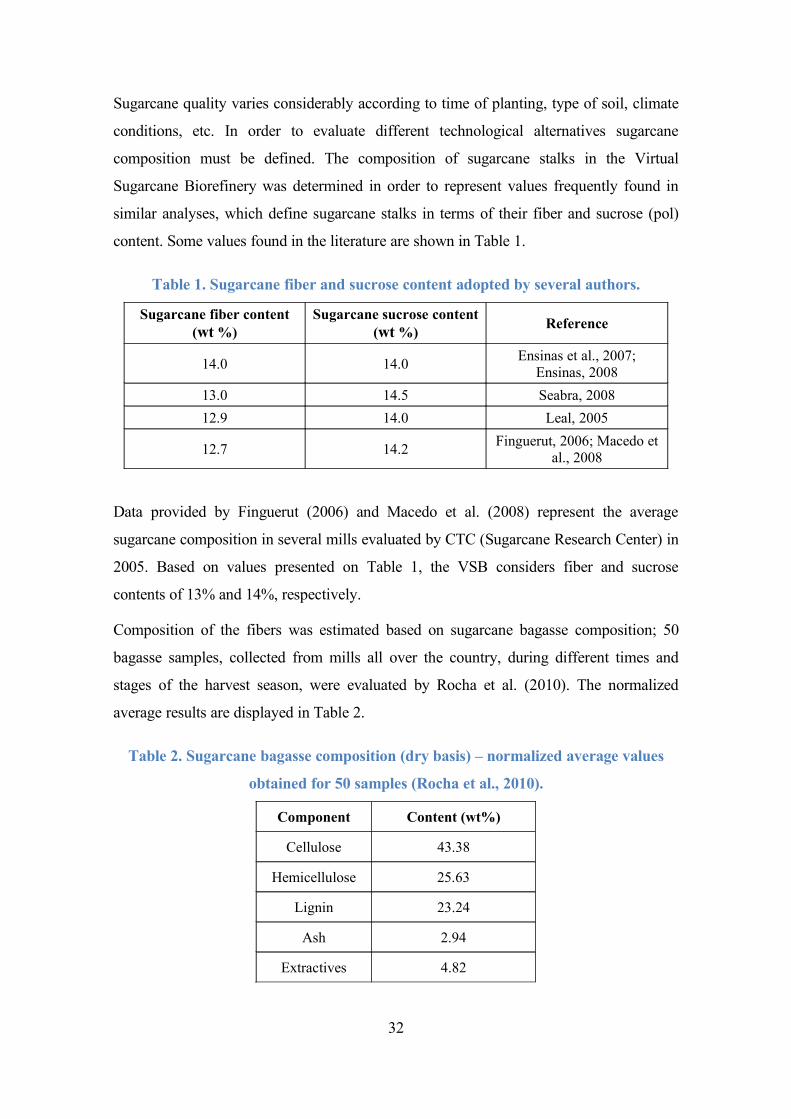
Sugarcane quality varies considerably according to time of planting, type of soil, climate
conditions, etc. In order to evaluate different technological alternatives sugarcane
composition must be defined. The composition of sugarcane stalks in the Virtual
Sugarcane Biorefinery was determined in order to represent values frequently found in
similar analyses, which define sugarcane stalks in terms of their fiber and sucrose (pol)
content. Some values found in the literature are shown in Table 1.
Table 1. Sugarcane fiber and sucrose content adopted by several authors.
Sugarcane fiber content (wt %)
Sugarcane sucrose content (wt %)
Reference
14.0 14.0Ensinas et al., 2007;
Ensinas, 2008
13.0 14.5 Seabra, 2008
12.9 14.0 Leal, 2005
12.7 14.2Finguerut, 2006; Macedo et
al., 2008
Data provided by Finguerut (2006) and Macedo et al. (2008) represent the average
sugarcane composition in several mills evaluated by CTC (Sugarcane Research Center) in
2005. Based on values presented on Table 1, the VSB considers fiber and sucrose
contents of 13% and 14%, respectively.
Composition of the fibers was estimated based on sugarcane bagasse composition; 50
bagasse samples, collected from mills all over the country, during different times and
stages of the harvest season, were evaluated by Rocha et al. (2010). The normalized
average results are displayed in Table 2.
Table 2. Sugarcane bagasse composition (dry basis) – normalized average values
obtained for 50 samples (Rocha et al., 2010).
Component Content (wt%)
Cellulose 43.38
Hemicellulose 25.63
Lignin 23.24
Ash 2.94
Extractives 4.82
32
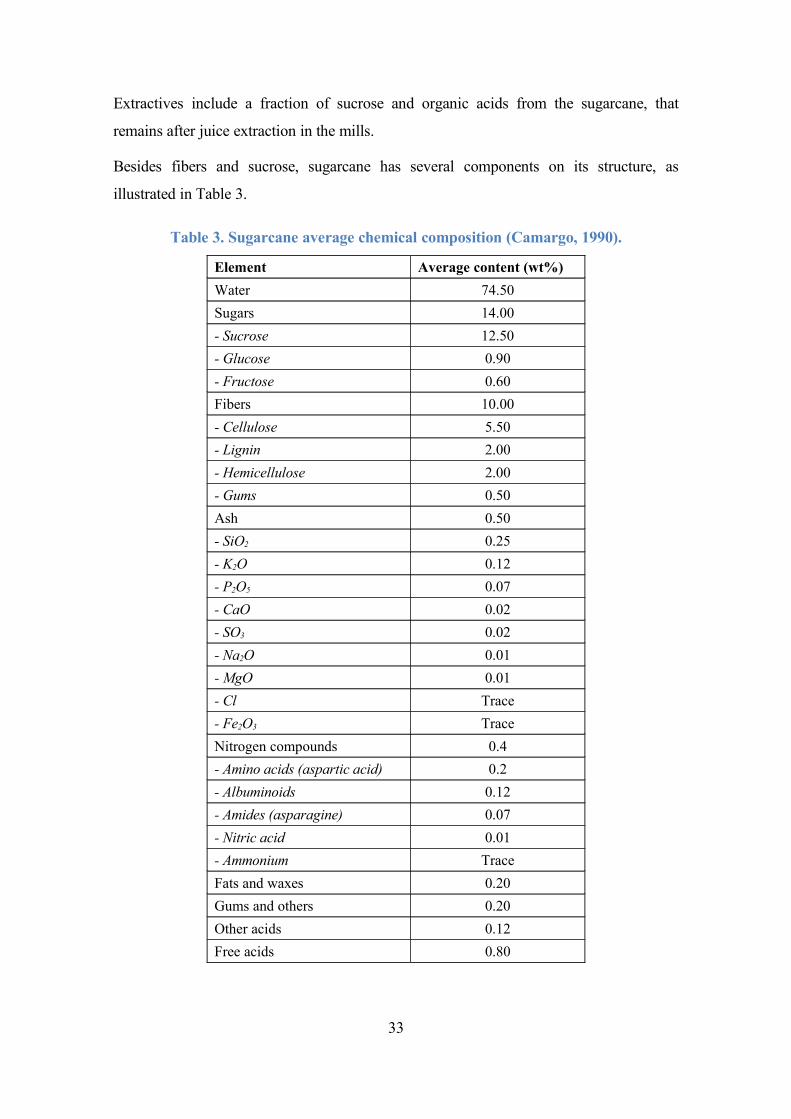
Extractives include a fraction of sucrose and organic acids from the sugarcane, that
remains after juice extraction in the mills.
Besides fibers and sucrose, sugarcane has several components on its structure, as
illustrated in Table 3.
Table 3. Sugarcane average chemical composition (Camargo, 1990).
Element Average content (wt%)
Water 74.50
Sugars 14.00
- Sucrose 12.50
- Glucose 0.90
- Fructose 0.60
Fibers 10.00
- Cellulose 5.50
- Lignin 2.00
- Hemicellulose 2.00
- Gums 0.50
Ash 0.50
- SiO2 0.25
- K2O 0.12
- P2O5 0.07
- CaO 0.02
- SO3 0.02
- Na2O 0.01
- MgO 0.01
- Cl Trace
- Fe2O3 Trace
Nitrogen compounds 0.4
- Amino acids (aspartic acid) 0.2
- Albuminoids 0.12
- Amides (asparagine) 0.07
- Nitric acid 0.01
- Ammonium Trace
Fats and waxes 0.20
Gums and others 0.20
Other acids 0.12
Free acids 0.80
33

Most authors describe sugarcane composition in terms of soluble and total solids content,
as exemplified in Table 4.
Table 4. Sugarcane composition (Mantelatto, 2005).
Component Content (wt%)
Water 73 – 76
Total solids 24 – 27
Soluble solids 10 – 16
Fibers (dry basis) 11 – 16
Sugarcane composition in the Virtual Sugarcane Biorefinery was estimated based on data
provided in the previous tables. The composition included in the simulation is shown in
Table 5. The dirt (soil and solid residues that comes from the field) is taken into account
in the sugarcane received in the mill.
Table 5. Composition of the sugarcane adopted in the Virtual Sugarcane
Biorefinery.
ComponentContent (wt%) in the
sugarcane stalksContent (wt%) in the
sugarcane received in the mill
Organic acids 0.56 0.56
Glucose 0.60 0.60
Minerals 0.20 0.20
Salts 1.31 1.30
Phosphate 0.03 0.03
Dirt 0 0.60
Sucrose 14.00 13.92
Water 70.29 69.87
Fibers 13.00 12.92
- Cellulose 5.99 5.95
- Hemicellulose 3.54 3.52
- Lignin 3.21 3.19
- Ash 0.27 0.27
Based on estimates provided by specialists, the VSB assumes that 2/3 of the ash obtained
in sugarcane bagasse analyses are inherent to the fiber, and the remaining 1/3 is derived
from the sugarcane stalks. Sugarcane impurities are represented by minerals, salts and
organic acids, which comprise both sugarcane stalk ash and bagasse ash.
34

In addition to the components displayed in Table 5, the sugarcane plant also produces
trash; the VSB considers that 140 kg of trash (dry basis) are produced per ton of
sugarcane stalks (Seabra et al., 2010). Sugarcane trash composition was fixed as the
composition of the bagasse, except for the extractives (which were not included) and
water content (assumed as 15%).
3.3 Industrial phase – first generation
First generation ethanol production from sugarcane takes place in autonomous distilleries
or annexed plants; in the latter a fraction of the sugarcane juice is diverted for sugar
production and the remaining fraction along with the molasses (impure solution of sugars
that remains after sucrose crystallization) are used for ethanol production. Approximately
70% of the sugarcane processing units in Brazil are annexed plants (BNDES and CGEE,
2008). In the most common scenario annexed plant operates using half of sugarcane juice
for sugar production and the other half (plus molasses) is used for bioethanol production.
The flexibility of annexed plants to produce more ethanol or more sugar, depending upon
the market demands, is part of the reason for the success of bioethanol production in the
country. However, the range of operation of an installed plant is somehow limited to the
existing design restrictions and available facilities.
The sugarcane processing facility is self sufficient on its energy consumption: all the
thermal and electric energy required for the production process is produced in combined
heat and power (CHP) systems using bagasse as a fuel. If sugarcane trash is recovered
from the field, it may also be used as a fuel to produce energy.
A scheme of the sugar, ethanol and electricity production process from sugarcane is
illustrated in Figure 8. In an autonomous distillery, the unit operations related to the sugar
production (left side of Figure 8) are not included in the sugarcane mill.
35

Sugarcane
Anhydrous Ethanol
Cleaning
Extraction of sugars
Juice treatment
Juice concentration
Fermentation
Combined Heat and Power generation
Bagasse
Steam, ElectricityJuice treatment
Juice concentration
Crystallization
Drying
Sugar (VVHP)
Distillation and Rectification
Dehydration
Molasses
Trash
Hydrous Ethanol
Figure 8. Block flow diagram of the production of sugar, ethanol and electricity
from sugarcane.
3.4 Industrial phase – second generation
Second generation ethanol production from sugarcane bagasse and trash was evaluated in
the VSB both in integrated processes with conventional first generation ethanol and in
stand-alone second generation plants. Currently, it is considered that the surplus bagasse
and trash are pretreated through steam explosion, followed or not by an alkaline
delignification step. The pretreated material is sent to enzymatic hydrolysis, where
cellulose is converted to glucose. Following to pretreatment, delignification and
hydrolysis, a solid-liquid separation is performed. After pretreatment, the pentoses liquor
is obtained, which can be either biodigested or fermented to ethanol; after delignification,
the lignin solution obtained is acidified and solid lignin is recovered in another solid-
liquid separation system; after enzymatic hydrolysis, the unreacted cellulose is obtained
and sent to cogeneration, along with the lignin recovered and biogas from pentoses
biodigestion. The glucose liquor is concentrated along with the sugarcane juice (in the
36
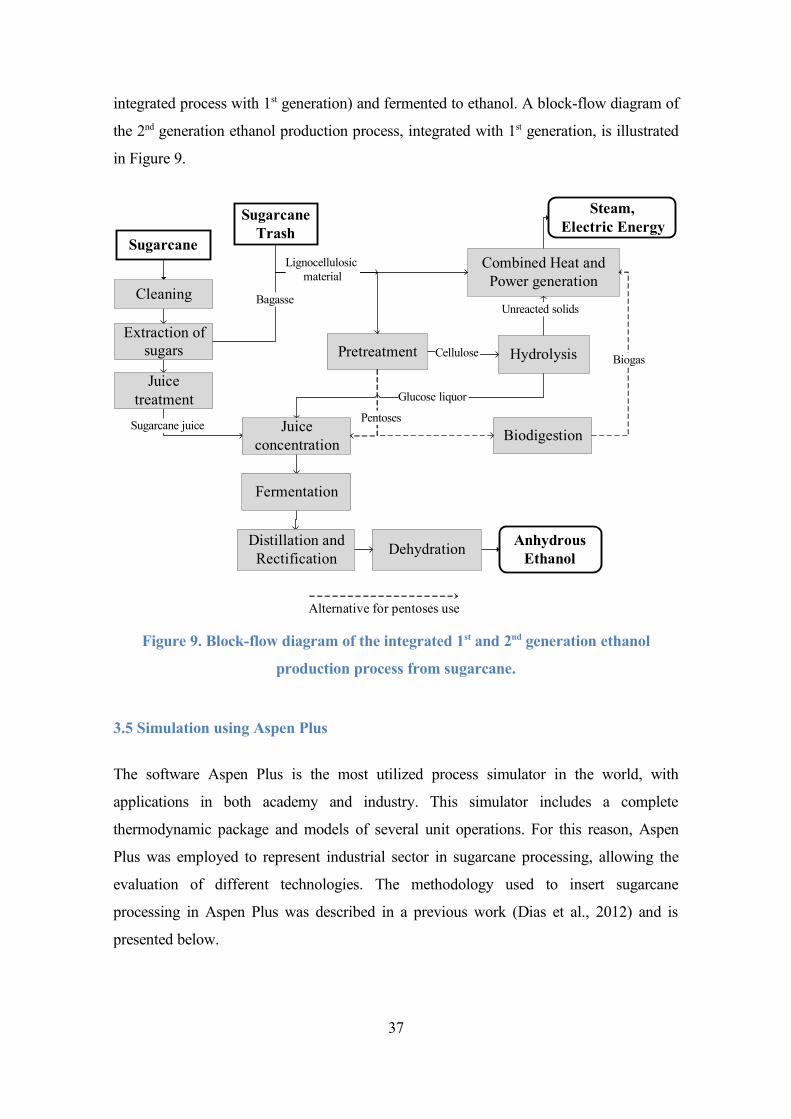
integrated process with 1st generation) and fermented to ethanol. A block-flow diagram of
the 2nd generation ethanol production process, integrated with 1st generation, is illustrated
in Figure 9.
Sugarcane juice
Anhydrous Ethanol
Cleaning
Extraction of sugars
Juice treatment
Juice concentration
Fermentation
Distillation and Rectification
Combined Heat and Power generation
Bagasse
Steam, Electric Energy
Pretreatment HydrolysisCellulose
Unreacted solids
Glucose liquor
Sugarcane Trash
Sugarcane
Dehydration
Biodigestion
Biogas
Pentoses
Lignocellulosicmaterial
Alternative for pentoses use
Figure 9. Block-flow diagram of the integrated 1st and 2nd generation ethanol
production process from sugarcane.
3.5 Simulation using Aspen Plus
The software Aspen Plus is the most utilized process simulator in the world, with
applications in both academy and industry. This simulator includes a complete
thermodynamic package and models of several unit operations. For this reason, Aspen
Plus was employed to represent industrial sector in sugarcane processing, allowing the
evaluation of different technologies. The methodology used to insert sugarcane
processing in Aspen Plus was described in a previous work (Dias et al., 2012) and is
presented below.
37
Different scenarios were defined and simulated using software Aspen Plus. Since
components of the lignocellulosic material were not available in the software databank,
their properties were obtained from the databank for biofuels components developed by
the National Renewable Energy Laboratory (NREL) (Wooley and Putsche, 1996);
however, lignin structure was modified to represent sugarcane lignin, with molecular
formula C9O2.9H8.6(OCH3) and its enthalpy of formation was determined based on
enthalpy of combustion (27000 kJ/kg) given by Stanmore (2010), resulting in 25689
kJ/kg. Fiber components (cellulose, hemicellulose and lignin) were inserted as solids;
streams containing those components are defined as MIXCISLD streams in the
simulation, which represent streams with conventional inert solids – with no influence on
phase equilibrium – and a defined molecular weight (no particle distribution).
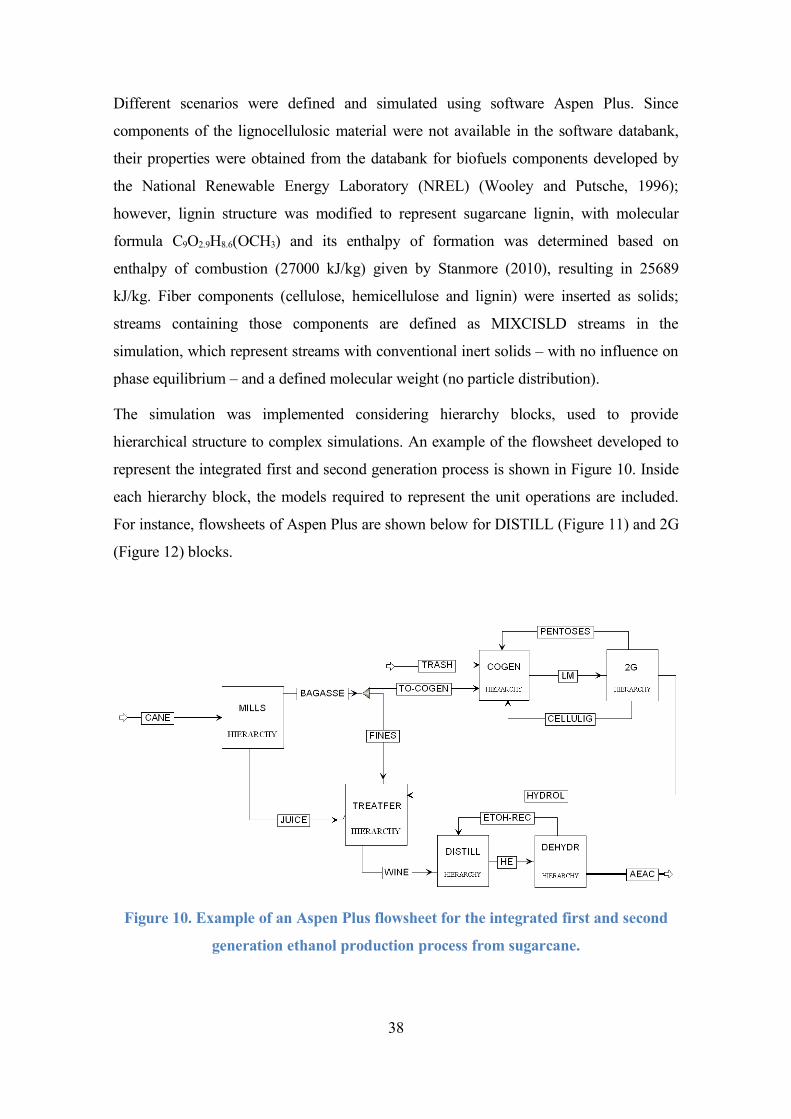
The simulation was implemented considering hierarchy blocks, used to provide
hierarchical structure to complex simulations. An example of the flowsheet developed to
represent the integrated first and second generation process is shown in Figure 10. Inside
each hierarchy block, the models required to represent the unit operations are included.
For instance, flowsheets of Aspen Plus are shown below for DISTILL (Figure 11) and 2G
(Figure 12) blocks.
Figure 10. Example of an Aspen Plus flowsheet for the integrated first and second
generation ethanol production process from sugarcane.
38

Figure 11. Unit operations that represent distillation step.
Figure 12. Unit operations envolved in the second generation process.
Several operations (mills, filters, settlers and adsorption column, among others) were
represented as component splitters, due to the lack of more adequate blocks in the
simulator database. In the separators, separation efficiency for each component of the
mixture was supplied in such a way that the equipment efficiency and other
characteristics of the materials, such as composition, agreed with those found in the
literature or in the industry.
39
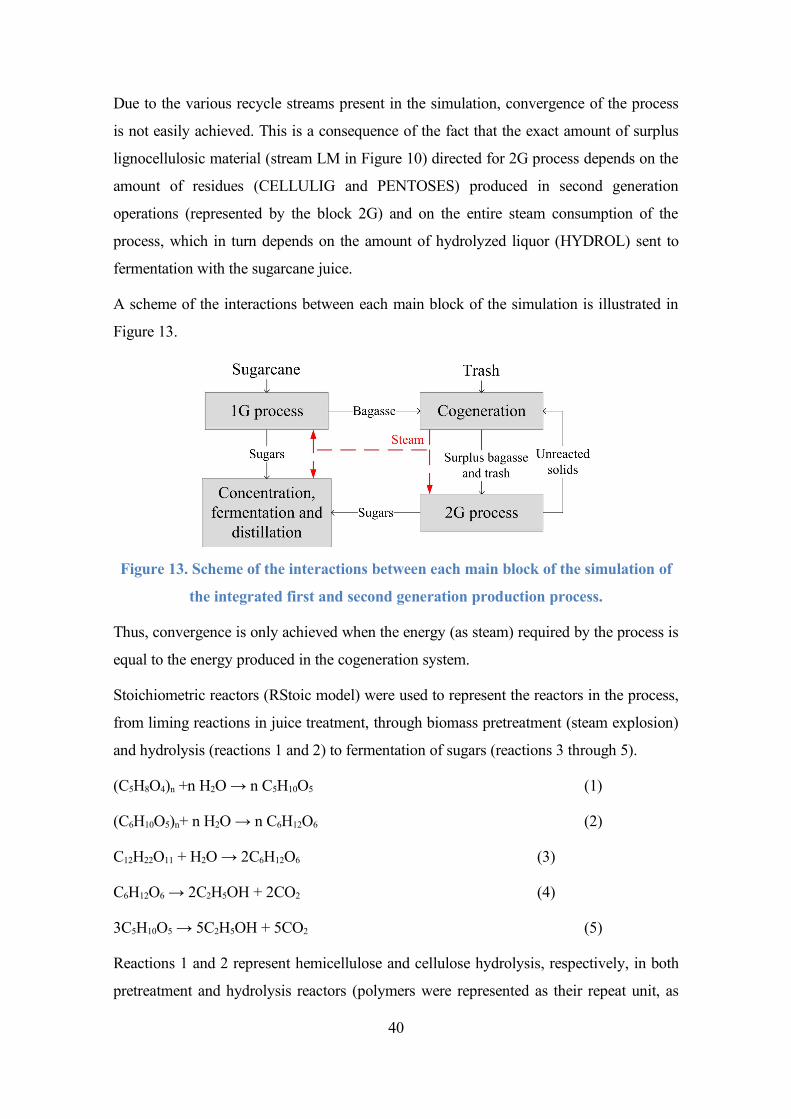
Due to the various recycle streams present in the simulation, convergence of the process
is not easily achieved. This is a consequence of the fact that the exact amount of surplus
lignocellulosic material (stream LM in Figure 10) directed for 2G process depends on the
amount of residues (CELLULIG and PENTOSES) produced in second generation
operations (represented by the block 2G) and on the entire steam consumption of the
process, which in turn depends on the amount of hydrolyzed liquor (HYDROL) sent to
fermentation with the sugarcane juice.
A scheme of the interactions between each main block of the simulation is illustrated in
Figure 13.
Figure 13. Scheme of the interactions between each main block of the simulation of
the integrated first and second generation production process.
Thus, convergence is only achieved when the energy (as steam) required by the process is
equal to the energy produced in the cogeneration system.
Stoichiometric reactors (RStoic model) were used to represent the reactors in the process,
from liming reactions in juice treatment, through biomass pretreatment (steam explosion)
and hydrolysis (reactions 1 and 2) to fermentation of sugars (reactions 3 through 5).
(C5H8O4)n +n H2O → n C5H10O5 (1)
(C6H10O5)n+ n H2O → n C6H12O6 (2)
C12H22O11 + H2O → 2C6H12O6 (3)
C6H12O6 → 2C2H5OH + 2CO2 (4)
3C5H10O5 → 5C2H5OH + 5CO2 (5)
Reactions 1 and 2 represent hemicellulose and cellulose hydrolysis, respectively, in both
pretreatment and hydrolysis reactors (polymers were represented as their repeat unit, as
40
suggested by Wooley and Putsche (1996)). Reaction 3 represents sucrose hydrolysis in
the fermentation reactors; glucose and pentoses fermentation into ethanol are represented
by reactions 4 and 5, respectively.
The burner in the cogeneration section, where combustion of the components of the
lignocellulosic material takes place, leading to the production of steam and electricity,
was represented as a reactor as well; reactions 6 through 8 represent the combustion of the
main components (cellulose, hemicellulose and lignin, respectively) in the burner.
(C6H10O5)n + 6n O2 → 5n H2O + 6n CO2 (6)
(C5H8O4)n + 5n O2 → 4n H2O + 5n CO2 (7)
(C9O2.9H8.6(OCH3))n + 10. 95n O2 → 5.8n H2O + 10n CO2 (8)
Conversion of the combustion reactions was set as 100%; inefficiencies of the boiler were
represented as the loss of a fraction of the hot gases obtained at the burner. Sugarcane
bagasse LHV was calculated as 7.5 MJ/kg (50% moisture), and for sugarcane trash (15 %
moisture), a LHV of 14.9 MJ/kg was obtained; these values are in accordance with those
reported in the literature (Alonso Pippo et al., 2011; Seabra et al., 2010).
Biodigestion reactions were inserted in a stoichiometric reactor model as well, on which
the pentoses liquor obtained after steam explosion is used as feedstock. Reactions 9 and
10 were used to represent biodigestion of the pentoses liquor (which contains both
pentoses and glucose):
C5H10O5 → 2.5CH4 + 2.5 CO2 (9)
C6H12O6 → 3CH4 + 3CO2 (10)
Most of the water in the biogas produced in the biodigestor is removed prior to biogas
burning in the burner, which was represented as the complete combustion of methane
(and the same boiler efficiency as that for solid biomass fuels).
Distillation columns were simulated as rigorous distillation columns (Aspen Plus RadFrac
model); product purification takes place on a series of distillation and rectification
columns, representing the most common configuration of the distillation sequence in
ethanol production in Brazil (Dias et al., 2011a).
41

3.5.1 Validation process of the virtual sugarcane biorefinery for production of first
generation bioethanol
The methods used in the validation process of the VSB, producing sugar, ethanol and
electricity, are presented in this section.
Methodology
In order to perform the validation of VSB simulation in the commercial software Aspen
Plus, a mill located in the state of São Paulo, referenced here as Mill A, was chosen as a
partner for supplying the process data. This mill crushes about 4,000,000 tons of
sugarcane per season for production of crystal sugar, anhydrous and hydrated ethanol and
power cogeneration.
The unit operations in the processing of sugarcane in the chosen mill are comprised
basically by reception and cleaning of the sugarcane, cane preparation and juice
extraction, in which bagasse and juice are separated. Extracted juice is split in two
streams: primary juice (obtained in the first tandem, richer in sucrose and with less
impurities) diverted to sugar production, and the secondary juice (obtained after the first
tandem of the mill) to ethanol production. Both juices undergo physicochemical treatment
and juice clarification. Clarified juice intended for sugar production is submitted to a
multiple step evaporation to produce a concentrated syrup that is directed for
crystallization in fed batch “vacuums pans” (in a so called “two-boiling system”),
centrifugation and separation of sugar crystals from molasses; intermediate ones are
recycled back to the process and the final molasses is sent to ethanol production, while
sugar crystals are dried. The mud effluent of clarifiers (from juice treatment of both sugar
and ethanol production) is sent to filtration, producing filter cake that is recycled to
sugarcane plantation, while the filtrated juice is mixed to the juice destined to ethanol
production. The bagasse obtained in the mills is burnt in the boiler to produce steam.
The clarified juice intended for ethanol production is submitted to a partial evaporation,
cooled, mixed with final molasses from the sugar plant and directed for the fermentation
step. After fermentation, the fermented wine is sent to the centrifuges where yeast is
recovered and recycled to be used in the new fermentation step. The centrifuged wine is
then sent to a set of distillation columns (A/A1/D) for ethanol stripping and after to
rectification columns (B/B1) for ethanol enrichment. At the top of column B, hydrated
42

ethanol is obtained. A fraction of hydrated ethanol is sent to dehydration on molecular
sieves where anhydrous ethanol is produced. Carbon dioxide effluent of the fermenters is
washed in absorption columns to recover the remaining ethanol.
The data and information collected on the mill, referring to the process described, were
subjected to several validation steps as described below:
• Selection of a sugar mill partner with milling capacity greater than or equal to
2,000,000 tons per year (average milling capacity for sugar mills in Brazil);
• Collection of information about the inventory of the selected sugar mill,
comprising the unit operations of sugar, ethanol and energy production;
• Compilation of information about process through daily bulletins, files, local
instrumentation in the equipment and collection of data from various sections of
the plant stored in the supervisory system;
• Treatment of the collected data and organization of information for each month of
the harvest season to feed an Excel spreadsheet;
• Design of the process flow diagram according with the sugar mill inventory;
• Development of an Excel spreadsheet to calculate the mass balance of the process
using the data previously collected in the sugar mill to define some intermediate
flows where there is no recorded process data;
• Interactive adjustment of calculations to obtain rigorous agreement between the
values of the process and those from the Excel spreadsheet;
• Introduction of the main values from the Excel spreadsheet to be introduced in the
Aspen Plus simulator;
• Adjustment of the Aspen Plus simulations to represent accurately the inventory of
the process plant;
• Calculation of the mass and energy balance using Aspen Plus.
Results of the performed validation procedure are presented in section 4.2.5.
43

3.6. Sustainability indicators
3.6.1 Economic indicators
In order to provide a comparison among different technologies, in terms of economic
viability, some of the most used impacts in Engineering Economy, such as internal rate of
return (IRR) and products production costs, were calculated considering a set of scenarios
related to first and second generation sugarcane ethanol production. During the initial
construction of the VSB (reported in this version of the VSB) these impacts were
calculated only for the industrial process.
The principles for this evaluation are based on Engineering Economy, when a cash flow is
projected for each technological scenario to be evaluated, taking into account the
investment needed for the project and all expenses and revenues for an expected project
lifetime.
The main expenses and revenues come from technical parameters from process modeling
(using Aspen Plus) and from monetary values observed in the last decade, such as
sugarcane, ethanol and sugar prices. The basis for the monetary values related to the
investments were obtained from Dedini for a standard first generation autonomous
distillery and from data based on literature; an approximation method was used to
estimate the investments for specific parts of the process when it was necessary for new
evaluated technologies. A detailed description of the methodology employed to calculate
investment of first generation plants is provided in sections 4.2.2 of this report.
An evaluation of risk was conducted in some studies using a Monte Carlo approach,
assuming a normal distribution for the main economic parameters, such as the values of
total investment and prices of sugarcane, ethanol, electricity, enzymes and trash. As a
result of the assessments done, an electronic spreadsheet was developed and implemented
to calculate the internal rate of return (IRR) and production costs. Some of the scenarios
evaluated in 2011, their results and the adopted methodologies can be found in some
recent published papers (Dias et al., 2011b, Dias et al., 2012, Cavalett et al., 2012), as
well as on Chapter 4 of this report.
A short description of Internal Rate of Return (IRR) and production costs that have been
adopted in the economic viability assessments is presented below.
44

Internal Rate of Return (IRR)
Internal Rate of Return (IRR) is the average interest rate paid per year for the project
evaluated, or, in other words, IRR is the interest rate that balances all operating profits
along the project life time with regard to the investment. This parameter is useful to be
compared with the opportunity cost of capital that an investor may consider. The
following mathematical expression (equation 1) shows how IRR is obtained (considering
a life time of 25 years):
∑=
=+
25
1
investment Total)1(
)(Profit Operating
kkIRR
k
(eq. 1)
Production cost excluding capital expenditures
In order to estimate total production cost, it is necessary to evaluate the capital cost
associated with the investment to be evaluated. This cost is related to the investor’s risk
perception, and, in this sense, depends on the nature of the project as well as the risks
associated with the country on which the project would take place. As this parameter
(capital cost) is crucial to calculate the total production cost, in 2012 a study will be done
to improve its evaluation when considering an investment in a sugarcane biorefinery in
Brazil, in particular taking into account second generation ethanol production.
For this reason, the production costs estimated with respect to the scenarios evaluated
were obtained excluding returns on total investments. There are many different
approaches to obtain these costs when an industry produce more than one product;
among then, a classical methodology is to allocate all the expenses (including capital
depreciation) proportionally with respect to each revenue of the products. Therefore, the
costs associated to the biorefinery products were estimated reducing their respective
average market prices at the same proportion until IRR reached zero.
3.6.2 Environmental indicators
In the VSB framework the environmental assessment is made by using the Life Cycle
Assessment methodology (LCA). Life Cycle Assessment is a recognized method for
determining the environmental impact of a product (or good or service) during its entire
life cycle, from extraction of raw materials through manufacturing, logistics, use and final
disposal or recycling.
45
In LCA substantially broader environmental aspects can be covered, ranging from GHG
emissions and fossil resource depletion to acidification, toxicity, water and land use
aspects, among others; hence, it is an appropriate tool for quantifying environmental
impacts of a product system. The method consists of four main steps: goal and scope
definition, inventory analysis, impact assessment and interpretation (ISO 2006a; 2006b).
Life Cycle Inventory modeling
Life cycle inventory (LCI) is the methodological step where an overview is given of the
environmental interventions (energy use, resource extraction or emission to an
environmental compartment) caused by or required for the processes within the
boundaries of the studied system.
Using the VSB framework, data used for the Life Cycle Inventory modeling are obtained
from different sources. Agricultural data are obtained from the Canasoft Model that
generates a comprehensive inventory for the agricultural sugarcane production system.
The inventories of the sugarcane industrial biorefinery alternatives are based on the mass
and energy balances calculated using computer simulation platforms (e.g. Aspen Plus).
Emission data for use of ethanol, co-products and derivates are obtained from literature,
ongoing research at CTBE and consults to specialists.
Emissions from background processes used in the sugarcane production, industrialization
and use chain can be obtained also from Swiss Center of Life Cycle Inventories
(Ecoinvent database, 2009) after a careful update to the Brazilian reality.
Life Cycle Impact Assessment – SimaPro
With the translation of the product system's environmental flows from the Life Cycle
Inventory phase (LCI) into scores that represent their impacts on environment, Life Cycle
Impact Assessment (LCIA) is essential for the interpretation of the results in relation to
the questions posed in the goal definition (Finnveden et al., 2009). The challenge of LCIA
is to evaluate the potential impact of the emitted substances by using a procedure that is
ideally simple, applicable consistently to all substances, that uses a common unit of
measure, and that gives results that are comparable between impact categories.
The software package SimaPro (PRé Consultants B.V.) and the CML 2 Baseline 2000
v2.05 method (Guineé et al., 2002) have been used as tools for the environmental impact
assessment in the VSB framework. However, it is intended in the future to use other Life
46

Cycle Impact Assessment methods to evaluate other aspects in the VSB framework such
as energy balance, water and land uses. In the CML method, the environmental impacts
are categorized into ten environmental categories: Abiotic Depletion (ADP) measured in
kg of Sbeq.; Acidification (AP) measured in kg of SO2eq.; Eutrophication (EP) measured in
kg of PO4-3
eq.; Global Warming Potential (GWP) measured in kg of CO2eq.; Ozone Layer
Depletion (ODP) measured in kg of CFC-11eq.; Human Toxicity (HTP) measured in kg of
1,4 DBeq. (dichlorobenzene); Fresh Water Aquatic Ecotoxicity FWAET) measured in kg
of 1,4 DBeq; Marine Aquatic Ecotoxicity (MAET) measured in kg of 1,4 DBeq.; Terrestrial
Ecotoxicity (TET) measured in kg of 1,4 DBeq.; and Photochemical Oxidation (POP)
measured in kg of C2H4eq.
3.6.3 Social indicators
Social indicators are one of the three pillars of sustainability. However, social issues are
quite qualitative and, therefore, more difficult to be measured and used for scenario
comparison. Some social indicators such as direct and indirect job creation, wages and
other socioeconomic aspects will be evaluated using the Input-Output Analysis in the
VSB framework. Up to this stage of the development, the social indicators were not
considered in the assessment.
47

4. Results
In this section the main results obtained so far (up to 2011) with the VSB are presented in
details.
4.1 Sugarcane agricultural phase
These results are from the first assessments of different sugarcane production scenarios
using the VSB framework. The study concerned different technologies for sugarcane
planting and harvesting that are currently used in Brazil with focus on changes in
mechanization. Economic and environmental analyses were performed using the Canasoft
Model for detailing all operations used in the three sugarcane production scenarios
evaluated. The Canasoft Model allowed characterization and quantification of all the
inputs such as fertilizers, machinery, diesel, manpower, among others; and outputs such
as products and emissions. The model calculates and organizes the information producing
complete inventories for economic and environmental assessment. The basic information
required to conduct this study was obtained through literature, internet and personal
communication, being organized in different scenarios after a careful analysis of its
representativeness. Results were then used to identify the processes with critical
environmental and economic impacts and, therefore, pointed out as focus for further
research on technological development.
4.1.1 Scenarios description
In this study it was considered that the sugarcane production takes five harvesting seasons
per cycle, with distinct potential yield for each harvest. Scenario 1 represents the
production system where the planting of sugarcane is semi-mechanized (which involves
manual operations such as harvesting of sugarcane setts, setts distribution and chopping
of stalks; and mechanical operations such as opening and closing furrow) and manual
harvesting with the previous burning of the sugarcane trash. This production system has
been abandoned in recent years, mainly due to a state mandate and a voluntary protocol to
control and phase out pre-harvesting burning in São Paulo State.
48

Nowadays several production units are adopting mechanical harvesting, with significant
changes in the production system. This situation is evaluated in Scenario 2. In this case
planting is also semi-mechanized, but the harvest is done mechanically without pre-
harvesting burning.
Scenario 3 represents the most modern sugarcane production system employed in the
industry, where both planting and harvesting are done mechanically, without pre-
harvesting burning, with effective decrease in labor use.
4.1.2 Environmental assessment
The environmental assessment is performed using the Life Cycle Assessment. Some
environmental indicators from CML Life Cycle Impact Assessment method were selected
for this evaluation (Guineé et al., 2002). Figure 14 shows the relative environmental
impacts of different scenarios of sugarcane production. Environmental impact assessment
results showed that options with higher level of mechanization (Scenarios 2 and 3)
showed better results in the global warming and photochemical oxidation indicators in
comparison to the scenario with manual planting and harvesting (Scenario 1). This is due
to elimination of the pre-harvesting burning operation of sugarcane, which significantly
reduces emissions of greenhouse gases (CO2, N2O and CH4) in Scenarios 2 and 3. In the
other environmental impact indicators (abiotic depletion, acidification, eutrophication,
ozone layer depletion and ecotoxicities) it was not possible to observe significant
differences between evaluated scenarios. However, Scenario 1 presented slightly better
results than scenarios with higher mechanization level (Scenarios 2 and 3) because lower
inputs are required for manual harvesting and planting.
Results show that gradual change presented in recent years by the sugarcane production
system has positive impacts on an environmental standpoint. However, they can and
should be maximized because there are many bottlenecks to be solved such as: reduce
tillage in mechanical operations, increase quality of sugarcane setts in mechanical
planting, reduction of soil compactation, and increase the amount of agricultural residues
that are available to be used in the industrial process for energy production, among others.
All these challenges are included in the scientific agenda of CTBE in order to maximize
the sustainability of sugarcane production and industrialization in Brazil.
49

0%
10%
20%
30%
40%
50%
60%
70%
80%
90%
100%
ADP AP EP GWP ODP TET POP
Scenario 1 Scenario 2 Scenario 3
Figure 14. Relative environmental impacts of different scenarios of sugarcane
production.
Note: ADP: Abiotic Depletion; AP: Acidification; EP: Eutrophication; GWP: Global Warming; ODP:
Ozone Layer Depletion; TET: Terrestrial Ecotoxicity; POP: Photochemical Oxidation.
4.1.3 Economic assessment
The breakdown of sugarcane production costs are presented in Table 6, in which values
for each sugarcane production stage according to the three proposed scenarios are shown,
considering the average of five harvesting seasons. These costs are distributed according
to the main stages of the production system.
The average total cost (considering weighted average of five harvests) calculated in this
work is 22.45 US$/TC in Scenario 1; 22.55 US$/TC in Scenario 2; and 22.90 US$/TC in
Scenario 3. It is possible to notice increasing production costs with increasing
mechanization level. Additionally, manual operations in Scenario 1 corresponded to
33.9% of the total production cost, whereas in Scenarios 2 and 3 these figures were only
7.5% and 3.1%, respectively. Therefore, there is no doubt that manual harvesting is the
operation that requires more manpower (also overcoming the planting) since in Scenario 2
manual operations accounted for a significant smaller fraction of the total costs than in
Scenario 1.
Table 6. Sugarcane production costs for the different sugarcane production
scenarios (values in US$/ha).
50
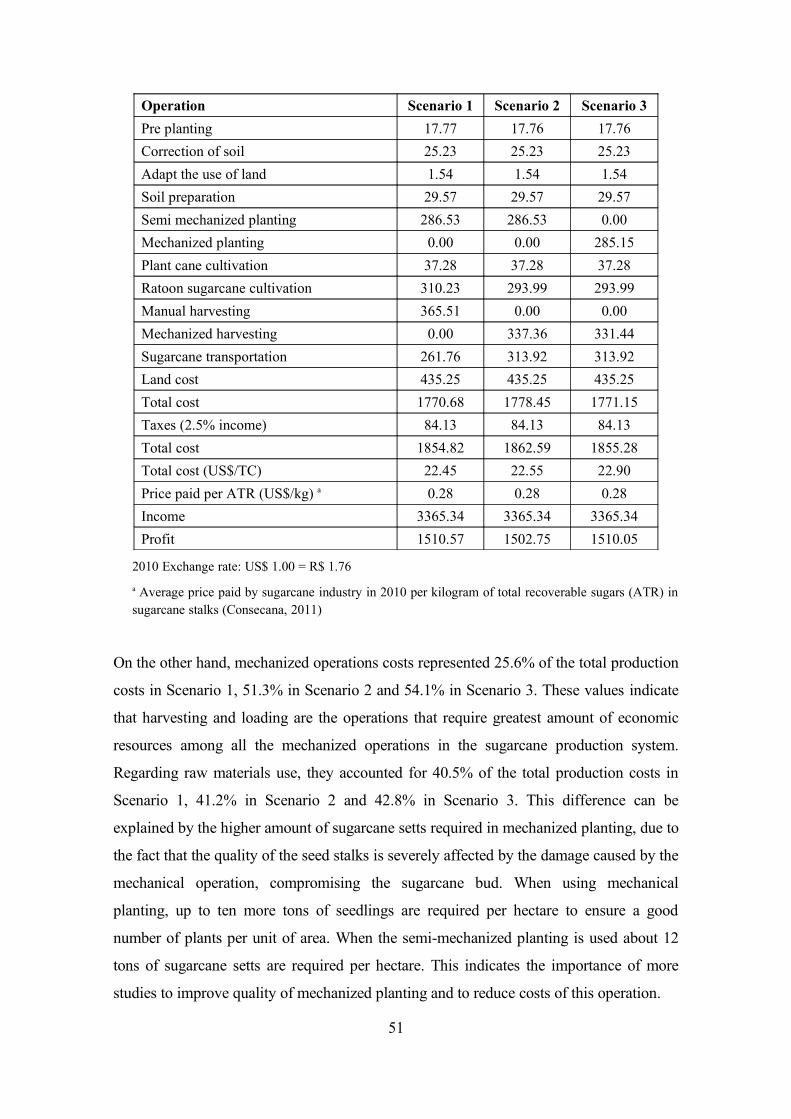
Operation Scenario 1 Scenario 2 Scenario 3
Pre planting 17.77 17.76 17.76
Correction of soil 25.23 25.23 25.23
Adapt the use of land 1.54 1.54 1.54
Soil preparation 29.57 29.57 29.57
Semi mechanized planting 286.53 286.53 0.00
Mechanized planting 0.00 0.00 285.15
Plant cane cultivation 37.28 37.28 37.28
Ratoon sugarcane cultivation 310.23 293.99 293.99
Manual harvesting 365.51 0.00 0.00
Mechanized harvesting 0.00 337.36 331.44
Sugarcane transportation 261.76 313.92 313.92
Land cost 435.25 435.25 435.25
Total cost 1770.68 1778.45 1771.15
Taxes (2.5% income) 84.13 84.13 84.13
Total cost 1854.82 1862.59 1855.28
Total cost (US$/TC) 22.45 22.55 22.90
Price paid per ATR (US$/kg) a 0.28 0.28 0.28
Income 3365.34 3365.34 3365.34
Profit 1510.57 1502.75 1510.05
2010 Exchange rate: US$ 1.00 = R$ 1.76
a Average price paid by sugarcane industry in 2010 per kilogram of total recoverable sugars (ATR) in sugarcane stalks (Consecana, 2011)
On the other hand, mechanized operations costs represented 25.6% of the total production
costs in Scenario 1, 51.3% in Scenario 2 and 54.1% in Scenario 3. These values indicate
that harvesting and loading are the operations that require greatest amount of economic
resources among all the mechanized operations in the sugarcane production system.
Regarding raw materials use, they accounted for 40.5% of the total production costs in
Scenario 1, 41.2% in Scenario 2 and 42.8% in Scenario 3. This difference can be
explained by the higher amount of sugarcane setts required in mechanized planting, due to
the fact that the quality of the seed stalks is severely affected by the damage caused by the
mechanical operation, compromising the sugarcane bud. When using mechanical
planting, up to ten more tons of seedlings are required per hectare to ensure a good
number of plants per unit of area. When the semi-mechanized planting is used about 12
tons of sugarcane setts are required per hectare. This indicates the importance of more
studies to improve quality of mechanized planting and to reduce costs of this operation.
51
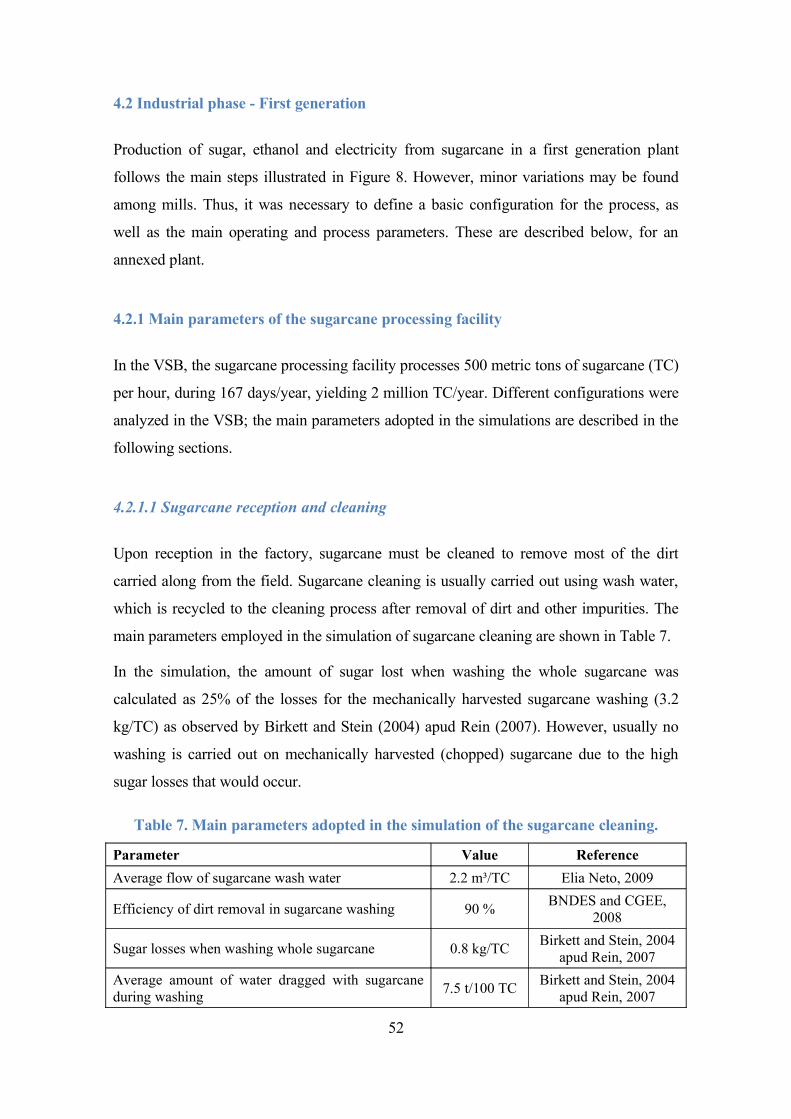
4.2 Industrial phase - First generation
Production of sugar, ethanol and electricity from sugarcane in a first generation plant
follows the main steps illustrated in Figure 8. However, minor variations may be found
among mills. Thus, it was necessary to define a basic configuration for the process, as
well as the main operating and process parameters. These are described below, for an
annexed plant.
4.2.1 Main parameters of the sugarcane processing facility
In the VSB, the sugarcane processing facility processes 500 metric tons of sugarcane (TC)
per hour, during 167 days/year, yielding 2 million TC/year. Different configurations were
analyzed in the VSB; the main parameters adopted in the simulations are described in the
following sections.
4.2.1.1 Sugarcane reception and cleaning
Upon reception in the factory, sugarcane must be cleaned to remove most of the dirt
carried along from the field. Sugarcane cleaning is usually carried out using wash water,
which is recycled to the cleaning process after removal of dirt and other impurities. The
main parameters employed in the simulation of sugarcane cleaning are shown in Table 7.
In the simulation, the amount of sugar lost when washing the whole sugarcane was
calculated as 25% of the losses for the mechanically harvested sugarcane washing (3.2
kg/TC) as observed by Birkett and Stein (2004) apud Rein (2007). However, usually no
washing is carried out on mechanically harvested (chopped) sugarcane due to the high
sugar losses that would occur.
Table 7. Main parameters adopted in the simulation of the sugarcane cleaning.
Parameter Value Reference
Average flow of sugarcane wash water 2.2 m³/TC Elia Neto, 2009
Efficiency of dirt removal in sugarcane washing 90 %BNDES and CGEE,
2008
Sugar losses when washing whole sugarcane 0.8 kg/TCBirkett and Stein, 2004
apud Rein, 2007
Average amount of water dragged with sugarcane during washing
7.5 t/100 TCBirkett and Stein, 2004
apud Rein, 2007
52
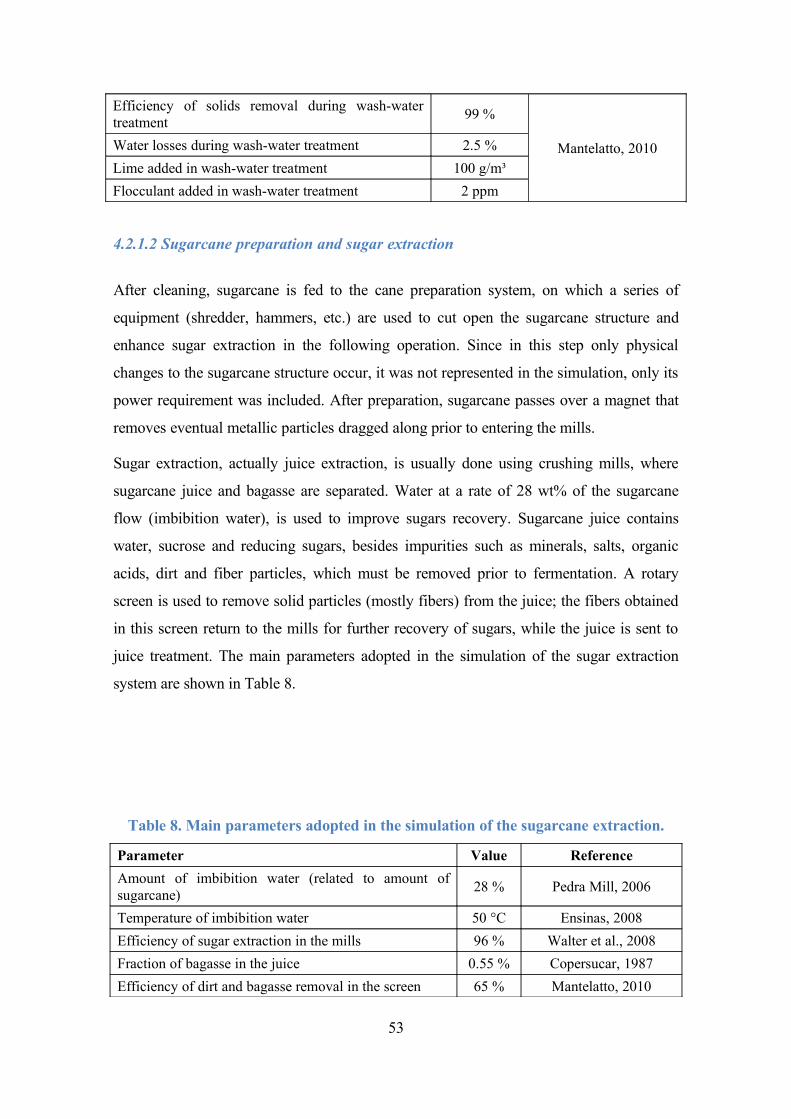
Efficiency of solids removal during wash-water treatment
99 %
Mantelatto, 2010Water losses during wash-water treatment 2.5 %
Lime added in wash-water treatment 100 g/m³
Flocculant added in wash-water treatment 2 ppm
4.2.1.2 Sugarcane preparation and sugar extraction
After cleaning, sugarcane is fed to the cane preparation system, on which a series of
equipment (shredder, hammers, etc.) are used to cut open the sugarcane structure and
enhance sugar extraction in the following operation. Since in this step only physical
changes to the sugarcane structure occur, it was not represented in the simulation, only its
power requirement was included. After preparation, sugarcane passes over a magnet that
removes eventual metallic particles dragged along prior to entering the mills.
Sugar extraction, actually juice extraction, is usually done using crushing mills, where
sugarcane juice and bagasse are separated. Water at a rate of 28 wt% of the sugarcane
flow (imbibition water), is used to improve sugars recovery. Sugarcane juice contains
water, sucrose and reducing sugars, besides impurities such as minerals, salts, organic
acids, dirt and fiber particles, which must be removed prior to fermentation. A rotary
screen is used to remove solid particles (mostly fibers) from the juice; the fibers obtained
in this screen return to the mills for further recovery of sugars, while the juice is sent to
juice treatment. The main parameters adopted in the simulation of the sugar extraction
system are shown in Table 8.
Table 8. Main parameters adopted in the simulation of the sugarcane extraction.
Parameter Value Reference
Amount of imbibition water (related to amount of sugarcane)
28 % Pedra Mill, 2006
Temperature of imbibition water 50 °C Ensinas, 2008
Efficiency of sugar extraction in the mills 96 % Walter et al., 2008
Fraction of bagasse in the juice 0.55 % Copersucar, 1987
Efficiency of dirt and bagasse removal in the screen 65 % Mantelatto, 2010
53
4.2.1.3 Juice treatment
Following extraction, juice receives a chemical treatment to remove other impurities. This
process consists of juice heating from 30 to 70 ºC, addition of phosphoric acid and lime
and a second heating operation, up to 105 ºC. Hot juice is flashed to remove dissolved air
and after addition of a flocculant polymer, impurities are removed in a settler, where mud
and clarified juice are obtained. A filter is used to recover some of the sugars carried
along with the mud, and the separated solids are recycled to the process prior to the
second heating operation; bagasse fines (bagacillo) and wash water are used in the filter to
improve recovery of sugars. The clarified juice is fed to the screens to remove solid
particles that were not removed in the clarifier.
Clarified juice contains around 15 wt% solids; clarified juice destined for sugar
production is concentrated on a 5-stage multiple effect evaporator (MEE) up to 65 wt%
solids. In the annexed distillery, a fraction of the syrup, as well as final molasses, are used
to concentrate the clarified juice destined for ethanol production up to around 22 wt%
solids, which is cooled and fed into the fermenters.
The main parameters adopted in the simulation of the juice treatment operations are
shown in Table 9.
54

Table 9. Main parameters adopted in the simulation of the juice treatment
operations.
Parameter Value Reference
Temperature – first juice heating 70 °C Mantelatto, 2009
Phosphate content of the juice after phosphoric acid addition
250 ppm
Mantelatto, 2010Phosphoric acid concentration 85%
Amount of lime added in liming 1.0 kg CaO/TC
Density of Ca(OH)2 added in liming 6 °Bé Copersucar, 1987
Temperature – second juice heating 105 °C Copersucar, 1989
Amount of flocculant polymer 2.5 g/TC Pedra Mill, 2006
Polymer solution concentration 0.1/0.05 % Mantelatto, 2010
Loss of reducing sugars by decomposition in the mud
1.0 % Hugot, 1986
Efficiency of settling of insoluble solids 99.7%
Mantelatto, 2010
Solids concentration in the mud 8-12%
Clarified juice temperature 98 °C
Amount of filter cake produced 35-40 kg/TC
Temperature – filter wash water 90 °C
Rotary filter solids retention 65%
Filter cake pol content 1.5 %
Filter cake moisture content 65 %
Amount of wash water related to filter cake 150 %Mantelatto, 2009
Bagasse fines added in the filter 0.6 t/100 TC
Efficiency of removal of insoluble solids in the clarified juice screen
65%
Mantelatto, 2010Concentration of insoluble solids in the impurities retained in the screens
30%
Number of effects in the multiple effect evaporation
5
Syrup soluble solids content 65 %
4.2.1.4 Sugar production
The sucrose present in the syrup as sugar crystals is separated from the solution in
equipments called vacuum pans and crystallizers, usually operated under vacuum and in
fed batch mode. The syrup is fed into the vacuum pans, where water is removed in a
similar way as in the evaporators. The mixture of sugar crystals and molasses (liquid part)
inside the equipment is called massecuite. When the amount of material reaches the limit
55
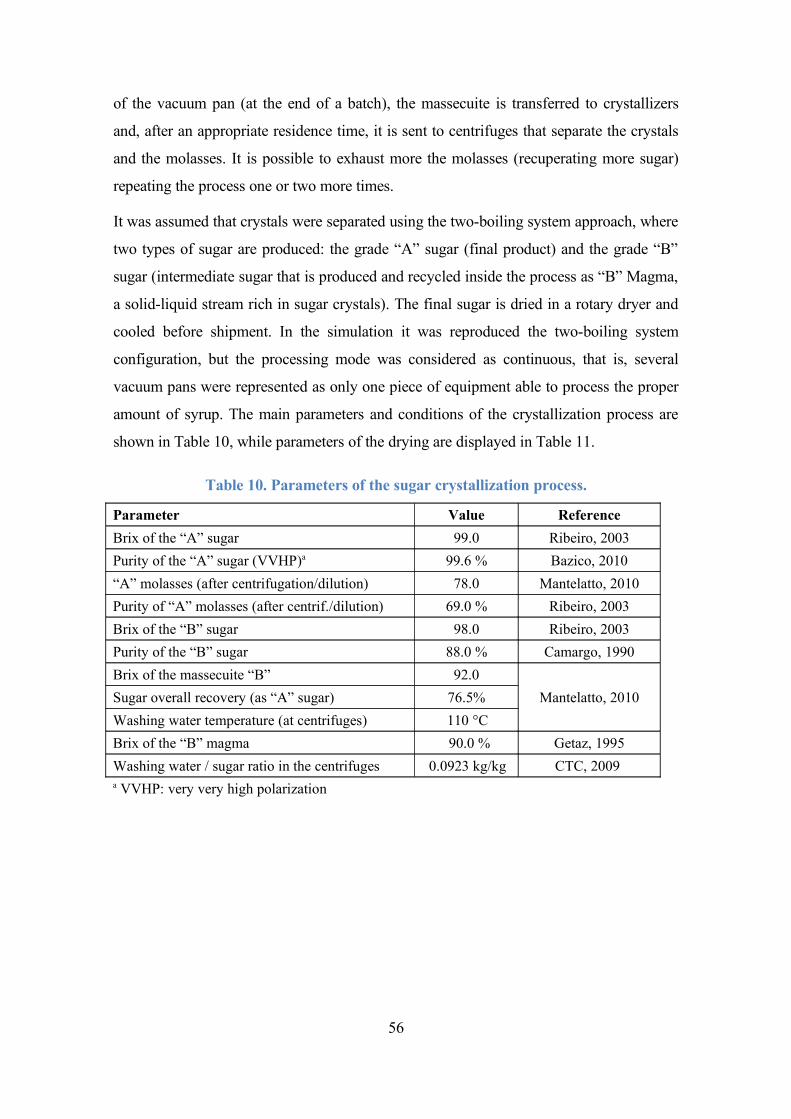
of the vacuum pan (at the end of a batch), the massecuite is transferred to crystallizers
and, after an appropriate residence time, it is sent to centrifuges that separate the crystals
and the molasses. It is possible to exhaust more the molasses (recuperating more sugar)
repeating the process one or two more times.
It was assumed that crystals were separated using the two-boiling system approach, where
two types of sugar are produced: the grade “A” sugar (final product) and the grade “B”
sugar (intermediate sugar that is produced and recycled inside the process as “B” Magma,
a solid-liquid stream rich in sugar crystals). The final sugar is dried in a rotary dryer and
cooled before shipment. In the simulation it was reproduced the two-boiling system
configuration, but the processing mode was considered as continuous, that is, several
vacuum pans were represented as only one piece of equipment able to process the proper
amount of syrup. The main parameters and conditions of the crystallization process are
shown in Table 10, while parameters of the drying are displayed in Table 11.
Table 10. Parameters of the sugar crystallization process.
Parameter Value Reference
Brix of the “A” sugar 99.0 Ribeiro, 2003
Purity of the “A” sugar (VVHP)a 99.6 % Bazico, 2010
“A” molasses (after centrifugation/dilution) 78.0 Mantelatto, 2010
Purity of “A” molasses (after centrif./dilution) 69.0 % Ribeiro, 2003
Brix of the “B” sugar 98.0 Ribeiro, 2003
Purity of the “B” sugar 88.0 % Camargo, 1990
Brix of the massecuite “B” 92.0
Mantelatto, 2010Sugar overall recovery (as “A” sugar) 76.5%
Washing water temperature (at centrifuges) 110 °C
Brix of the “B” magma 90.0 % Getaz, 1995
Washing water / sugar ratio in the centrifuges 0.0923 kg/kg CTC, 2009 a VVHP: very very high polarization
56

Table 11. Parameters of the sugar drying.
Parameter Value Reference
Hot air temperature 100 °C Camargo, 1990
Humidity of the inlet air 1.9 % (dry basis) Camargo, 1990
Moisture content of the dry sugar 0.1 % (VVHP) Bazico, 2010
Humidity of the outlet air 3.6 % (dry basis) Camargo, 1990
Cooling air temperature 30 °C
Mantelatto, 2010
Temperature of the outlet sugar 35 °C
Sugar dust in the outlet air 0.8 %
Sugar recovered from the outlet air (via scrubber)
99.5 %
Brix of the scrubber outlet stream 3.0
4.2.1.5 Fermentation
A fed-batch fermentation process with cell recycle was assumed. In this process yeast
cells in a solution are fed to the fermenters, followed by the juice. During fermentation,
gases released in the fermenters are collected and sent to an absorption column where the
entrained ethanol is recovered using water. After fermentation reactions cease, the wine is
sent to the centrifuges, where cells are separated from the ethanol solution. Cells obtained
in the centrifuges are treated in a separate reactor by addition of sulphuric acid and water,
to decrease bacterial contamination. After this treatment, the cells are recycled to be used
in another batch. Wine is mixed with the alcoholic solution obtained in the absorption
process and sent to purification. The main parameters adopted in the simulation of the
fermentation process are shown in Table 12.
57

Table 12. Main parameters adopted in the simulation of the fermentation process.
Parameter Value Reference
Fraction of the reactor fed with yeast solution 25 %
Pedra Mill, 2006Concentration of cells in the yeast solution (wet basis) 30 %
Fermentation temperature 33 °C
Conversion of sugars to ethanol a
89.5 %
Mantelatto, 2010
Formation of by-products related to ethanol – glycerol 6.33 %
Formation of by-products related to ethanol – acids 3.56 %
Formation of by-products related to ethanol – yeast 5.85 %
Residual sugars related to ethanol produced 0.25 %
Ethanol content of the alcoholic solution obtained after ethanol recovery in the absorption column
3 %
Efficiency of solids retention in the centrifuges 99 %
Ethanol content in the wine fed to the distillation columns 8.5 °GL
Ethanol content of the yeast concentrated solution obtained in the centrifuges
6.5 %
Concentration of cells in the yeast concentrated solution (wet basis)
70 % Pedra Mill, 2006
Sulphuric acid addition in yeast treatment (on 100% basis) 5 kg/m³ ethanol
Rossell, 2011
a In the autonomous distillery, fermentation yields (conversion of sugar to ethanol) is higher and equal to 90%.
4.2.1.6 Distillation
Wine is sent to a series of distillation and rectification columns, producing hydrated
ethanol (HE). Distillation columns are comprised by two set of columns A, A1 and D, and
rectification columns by columns B1 and B, each located one above the other. Wine is
pre-heated in the condenser of column B (heat exchanger E) and by exchanging heat with
the bottom of column A (heat exchanger K) before being fed into the top of column A1.
Ethanol-rich streams (phlegm) are obtained on top of column A and on bottom of column
D, then fed to column B-B1. Vinasse is produced in the bottom of column A, while 2nd
58
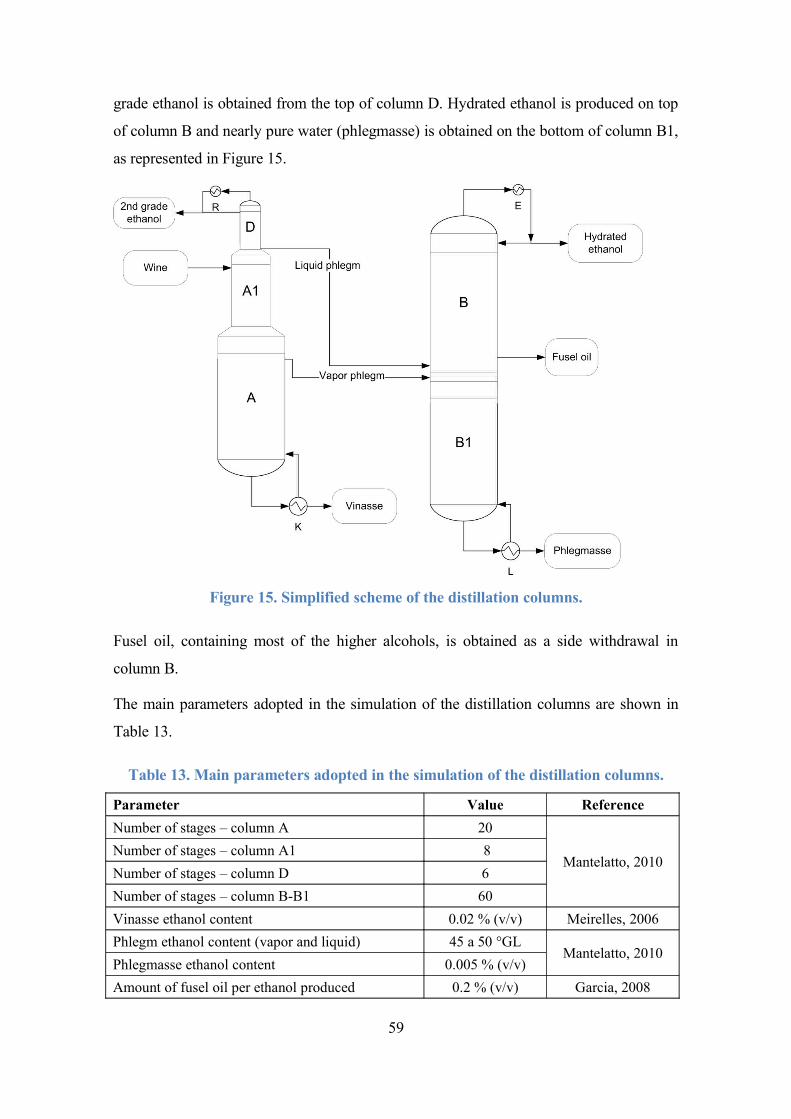
grade ethanol is obtained from the top of column D. Hydrated ethanol is produced on top
of column B and nearly pure water (phlegmasse) is obtained on the bottom of column B1,
as represented in Figure 15.
Figure 15. Simplified scheme of the distillation columns.
Fusel oil, containing most of the higher alcohols, is obtained as a side withdrawal in
column B.
The main parameters adopted in the simulation of the distillation columns are shown in
Table 13.
Table 13. Main parameters adopted in the simulation of the distillation columns.
Parameter Value Reference
Number of stages – column A 20
Mantelatto, 2010Number of stages – column A1 8
Number of stages – column D 6
Number of stages – column B-B1 60
Vinasse ethanol content 0.02 % (v/v) Meirelles, 2006
Phlegm ethanol content (vapor and liquid) 45 a 50 °GLMantelatto, 2010
Phlegmasse ethanol content 0.005 % (v/v)
Amount of fusel oil per ethanol produced 0.2 % (v/v) Garcia, 2008
59
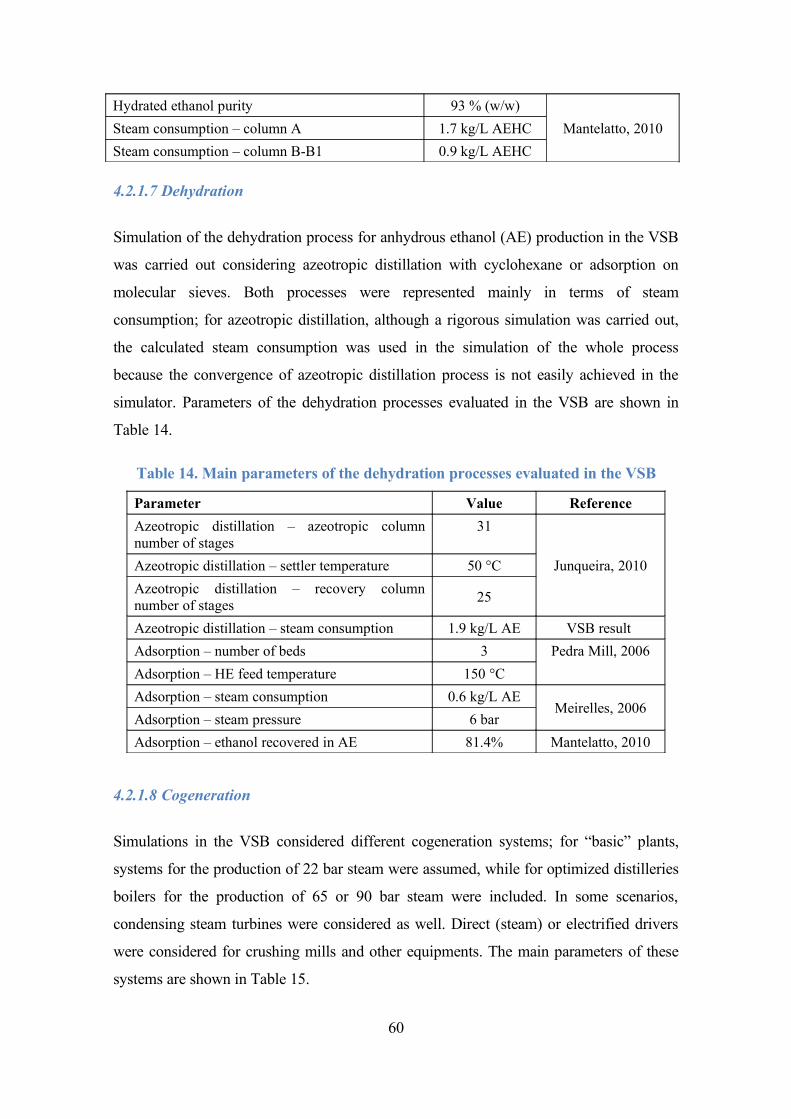
Hydrated ethanol purity 93 % (w/w)
Mantelatto, 2010Steam consumption – column A 1.7 kg/L AEHC
Steam consumption – column B-B1 0.9 kg/L AEHC
4.2.1.7 Dehydration
Simulation of the dehydration process for anhydrous ethanol (AE) production in the VSB
was carried out considering azeotropic distillation with cyclohexane or adsorption on
molecular sieves. Both processes were represented mainly in terms of steam
consumption; for azeotropic distillation, although a rigorous simulation was carried out,
the calculated steam consumption was used in the simulation of the whole process
because the convergence of azeotropic distillation process is not easily achieved in the
simulator. Parameters of the dehydration processes evaluated in the VSB are shown in
Table 14.
Table 14. Main parameters of the dehydration processes evaluated in the VSB
Parameter Value Reference
Azeotropic distillation – azeotropic column number of stages
31
Junqueira, 2010Azeotropic distillation – settler temperature 50 °C
Azeotropic distillation – recovery column number of stages
25
Azeotropic distillation – steam consumption 1.9 kg/L AE VSB result
Adsorption – number of beds 3 Pedra Mill, 2006
Adsorption – HE feed temperature 150 °C
Adsorption – steam consumption 0.6 kg/L AEMeirelles, 2006
Adsorption – steam pressure 6 bar
Adsorption – ethanol recovered in AE 81.4% Mantelatto, 2010
4.2.1.8 Cogeneration
Simulations in the VSB considered different cogeneration systems; for “basic” plants,
systems for the production of 22 bar steam were assumed, while for optimized distilleries
boilers for the production of 65 or 90 bar steam were included. In some scenarios,
condensing steam turbines were considered as well. Direct (steam) or electrified drivers
were considered for crushing mills and other equipments. The main parameters of these
systems are shown in Table 15.
60
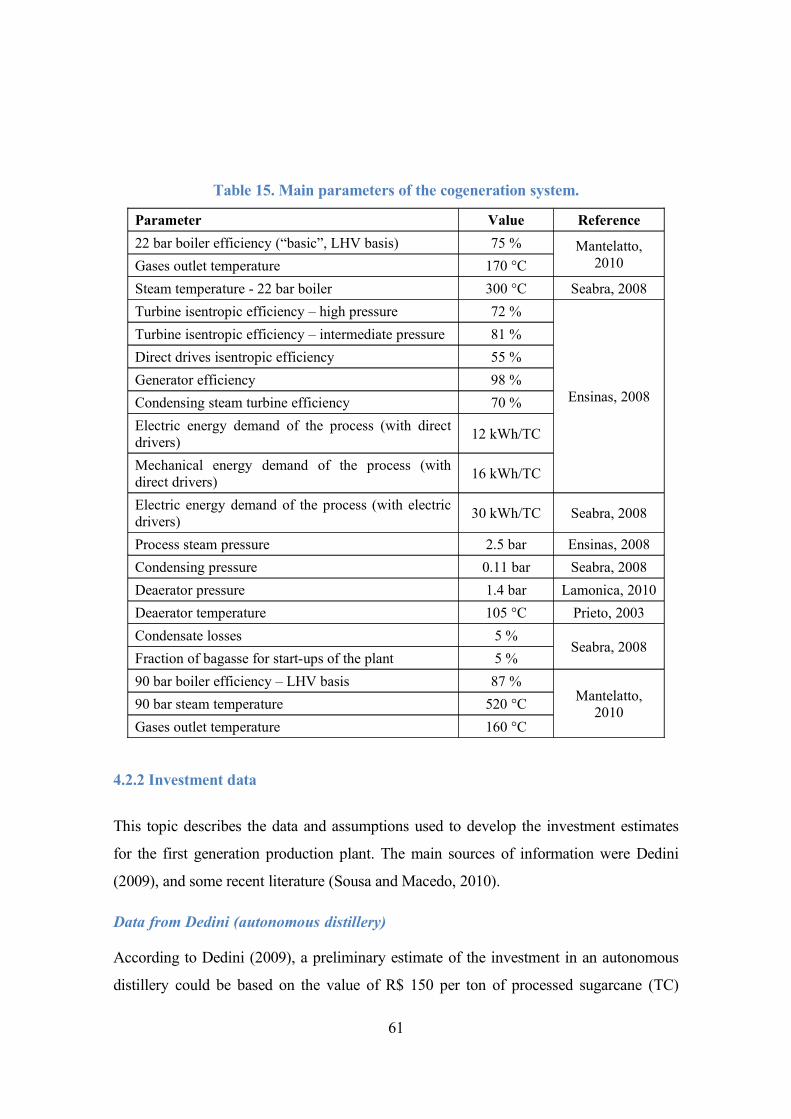
Table 15. Main parameters of the cogeneration system.
Parameter Value Reference
22 bar boiler efficiency (“basic”, LHV basis) 75 % Mantelatto, 2010Gases outlet temperature 170 °C
Steam temperature - 22 bar boiler 300 °C Seabra, 2008
Turbine isentropic efficiency – high pressure 72 %
Ensinas, 2008
Turbine isentropic efficiency – intermediate pressure 81 %
Direct drives isentropic efficiency 55 %
Generator efficiency 98 %
Condensing steam turbine efficiency 70 %
Electric energy demand of the process (with direct drivers)
12 kWh/TC
Mechanical energy demand of the process (with direct drivers)
16 kWh/TC
Electric energy demand of the process (with electric drivers)
30 kWh/TC Seabra, 2008
Process steam pressure 2.5 bar Ensinas, 2008
Condensing pressure 0.11 bar Seabra, 2008
Deaerator pressure 1.4 bar Lamonica, 2010
Deaerator temperature 105 °C Prieto, 2003
Condensate losses 5 %Seabra, 2008
Fraction of bagasse for start-ups of the plant 5 %
90 bar boiler efficiency – LHV basis 87 %Mantelatto,
201090 bar steam temperature 520 °C
Gases outlet temperature 160 °C
4.2.2 Investment data
This topic describes the data and assumptions used to develop the investment estimates
for the first generation production plant. The main sources of information were Dedini
(2009), and some recent literature (Sousa and Macedo, 2010).
Data from Dedini (autonomous distillery)
According to Dedini (2009), a preliminary estimate of the investment in an autonomous
distillery could be based on the value of R$ 150 per ton of processed sugarcane (TC)
61
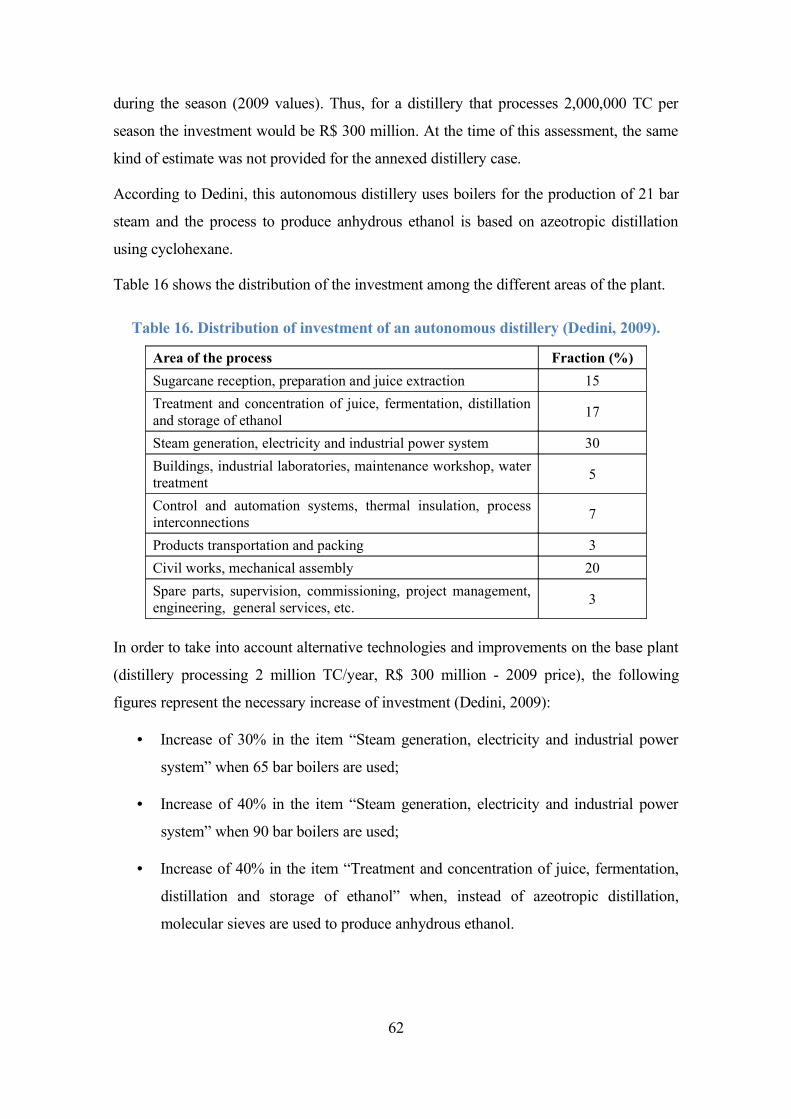
during the season (2009 values). Thus, for a distillery that processes 2,000,000 TC per
season the investment would be R$ 300 million. At the time of this assessment, the same
kind of estimate was not provided for the annexed distillery case.
According to Dedini, this autonomous distillery uses boilers for the production of 21 bar
steam and the process to produce anhydrous ethanol is based on azeotropic distillation
using cyclohexane.
Table 16 shows the distribution of the investment among the different areas of the plant.
Table 16. Distribution of investment of an autonomous distillery (Dedini, 2009).
Area of the process Fraction (%)
Sugarcane reception, preparation and juice extraction 15
Treatment and concentration of juice, fermentation, distillation and storage of ethanol
17
Steam generation, electricity and industrial power system 30
Buildings, industrial laboratories, maintenance workshop, water treatment
5
Control and automation systems, thermal insulation, process interconnections
7
Products transportation and packing 3
Civil works, mechanical assembly 20
Spare parts, supervision, commissioning, project management, engineering, general services, etc.
3
In order to take into account alternative technologies and improvements on the base plant
(distillery processing 2 million TC/year, R$ 300 million - 2009 price), the following
figures represent the necessary increase of investment (Dedini, 2009):
• Increase of 30% in the item “Steam generation, electricity and industrial power
system” when 65 bar boilers are used;
• Increase of 40% in the item “Steam generation, electricity and industrial power
system” when 90 bar boilers are used;
• Increase of 40% in the item “Treatment and concentration of juice, fermentation,
distillation and storage of ethanol” when, instead of azeotropic distillation,
molecular sieves are used to produce anhydrous ethanol.
62
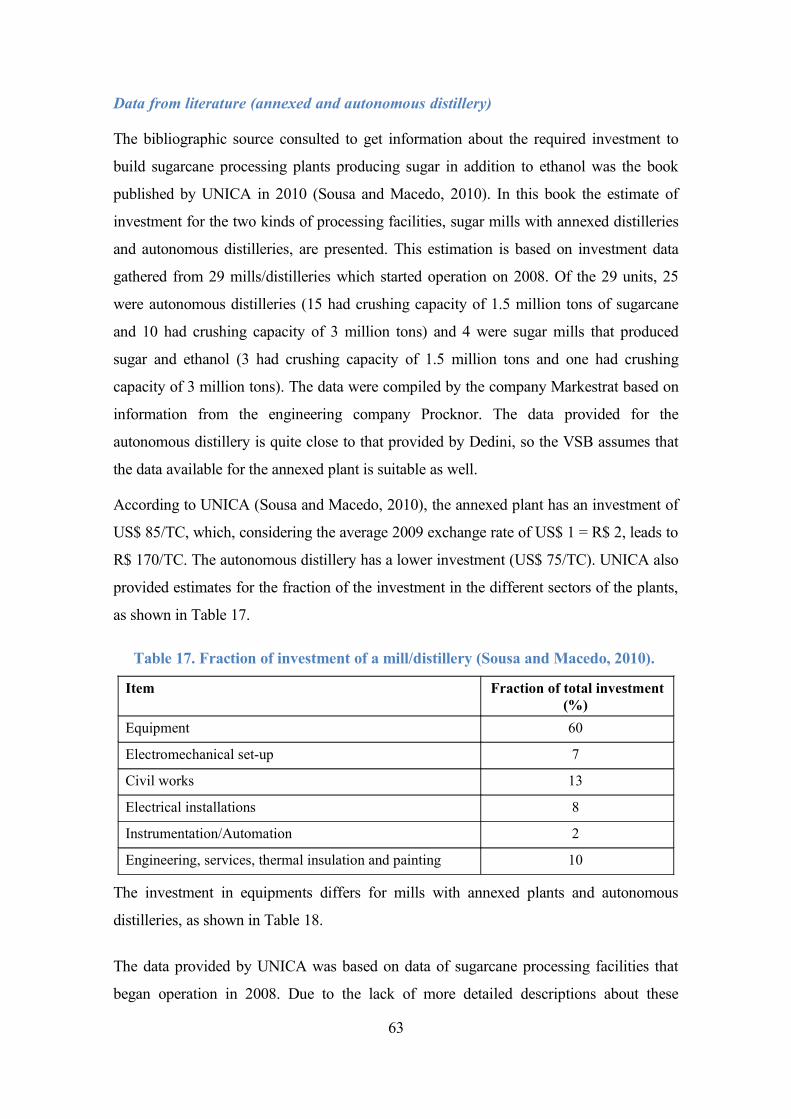
Data from literature (annexed and autonomous distillery)
The bibliographic source consulted to get information about the required investment to
build sugarcane processing plants producing sugar in addition to ethanol was the book
published by UNICA in 2010 (Sousa and Macedo, 2010). In this book the estimate of
investment for the two kinds of processing facilities, sugar mills with annexed distilleries
and autonomous distilleries, are presented. This estimation is based on investment data
gathered from 29 mills/distilleries which started operation on 2008. Of the 29 units, 25
were autonomous distilleries (15 had crushing capacity of 1.5 million tons of sugarcane
and 10 had crushing capacity of 3 million tons) and 4 were sugar mills that produced
sugar and ethanol (3 had crushing capacity of 1.5 million tons and one had crushing
capacity of 3 million tons). The data were compiled by the company Markestrat based on
information from the engineering company Procknor. The data provided for the
autonomous distillery is quite close to that provided by Dedini, so the VSB assumes that
the data available for the annexed plant is suitable as well.
According to UNICA (Sousa and Macedo, 2010), the annexed plant has an investment of
US$ 85/TC, which, considering the average 2009 exchange rate of US$ 1 = R$ 2, leads to
R$ 170/TC. The autonomous distillery has a lower investment (US$ 75/TC). UNICA also
provided estimates for the fraction of the investment in the different sectors of the plants,
as shown in Table 17.
Table 17. Fraction of investment of a mill/distillery (Sousa and Macedo, 2010).
Item Fraction of total investment (%)
Equipment 60
Electromechanical set-up 7
Civil works 13
Electrical installations 8
Instrumentation/Automation 2
Engineering, services, thermal insulation and painting 10
The investment in equipments differs for mills with annexed plants and autonomous
distilleries, as shown in Table 18.
The data provided by UNICA was based on data of sugarcane processing facilities that
began operation in 2008. Due to the lack of more detailed descriptions about these
63
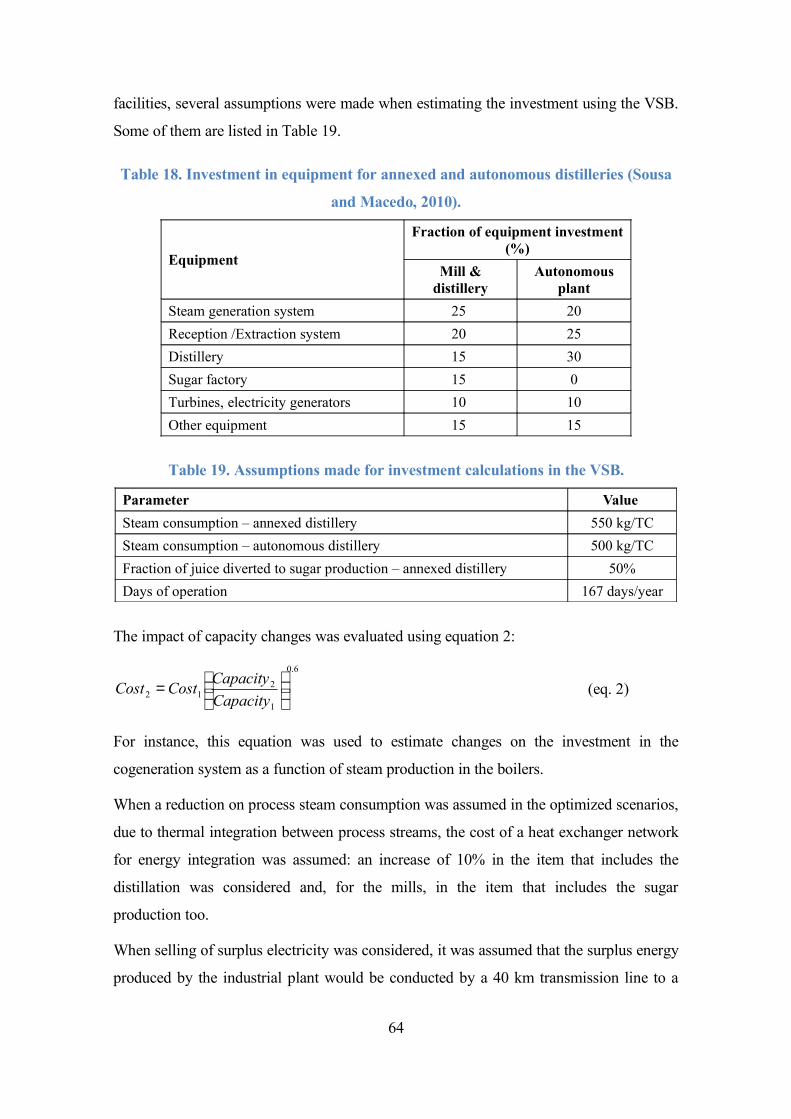
facilities, several assumptions were made when estimating the investment using the VSB.
Some of them are listed in Table 19.
Table 18. Investment in equipment for annexed and autonomous distilleries (Sousa
and Macedo, 2010).
Equipment
Fraction of equipment investment (%)
Mill & distillery
Autonomous plant
Steam generation system 25 20
Reception /Extraction system 20 25
Distillery 15 30
Sugar factory 15 0
Turbines, electricity generators 10 10
Other equipment 15 15
Table 19. Assumptions made for investment calculations in the VSB.
Parameter Value
Steam consumption – annexed distillery 550 kg/TC
Steam consumption – autonomous distillery 500 kg/TC
Fraction of juice diverted to sugar production – annexed distillery 50%
Days of operation 167 days/year
The impact of capacity changes was evaluated using equation 2:
6.0
1
212
=
Capacity
CapacityCostCost (eq. 2)
For instance, this equation was used to estimate changes on the investment in the
cogeneration system as a function of steam production in the boilers.
When a reduction on process steam consumption was assumed in the optimized scenarios,
due to thermal integration between process streams, the cost of a heat exchanger network
for energy integration was assumed: an increase of 10% in the item that includes the
distillation was considered and, for the mills, in the item that includes the sugar
production too.
When selling of surplus electricity was considered, it was assumed that the surplus energy
produced by the industrial plant would be conducted by a 40 km transmission line to a
64
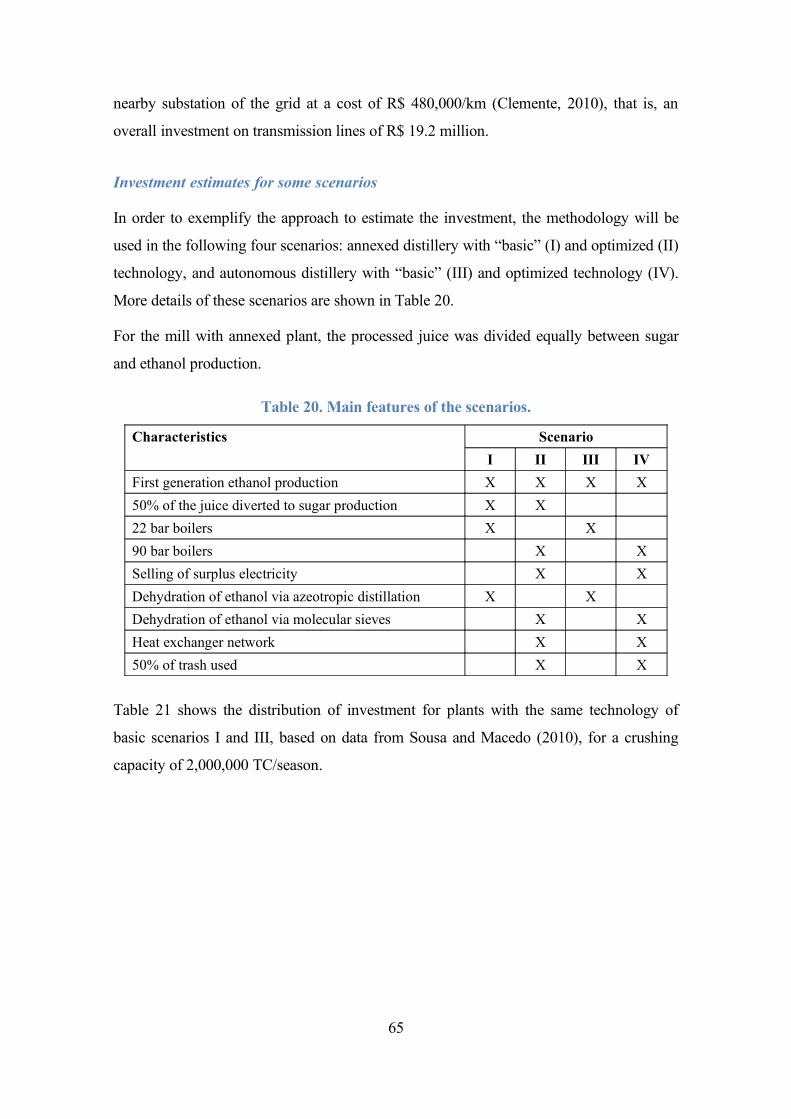
nearby substation of the grid at a cost of R$ 480,000/km (Clemente, 2010), that is, an
overall investment on transmission lines of R$ 19.2 million.
Investment estimates for some scenarios
In order to exemplify the approach to estimate the investment, the methodology will be
used in the following four scenarios: annexed distillery with “basic” (I) and optimized (II)
technology, and autonomous distillery with “basic” (III) and optimized technology (IV).
More details of these scenarios are shown in Table 20.
For the mill with annexed plant, the processed juice was divided equally between sugar
and ethanol production.
Table 20. Main features of the scenarios.
Characteristics Scenario
I II III IV
First generation ethanol production X X X X
50% of the juice diverted to sugar production X X
22 bar boilers X X
90 bar boilers X X
Selling of surplus electricity X X
Dehydration of ethanol via azeotropic distillation X X
Dehydration of ethanol via molecular sieves X X
Heat exchanger network X X
50% of trash used X X
Table 21 shows the distribution of investment for plants with the same technology of
basic scenarios I and III, based on data from Sousa and Macedo (2010), for a crushing
capacity of 2,000,000 TC/season.
65
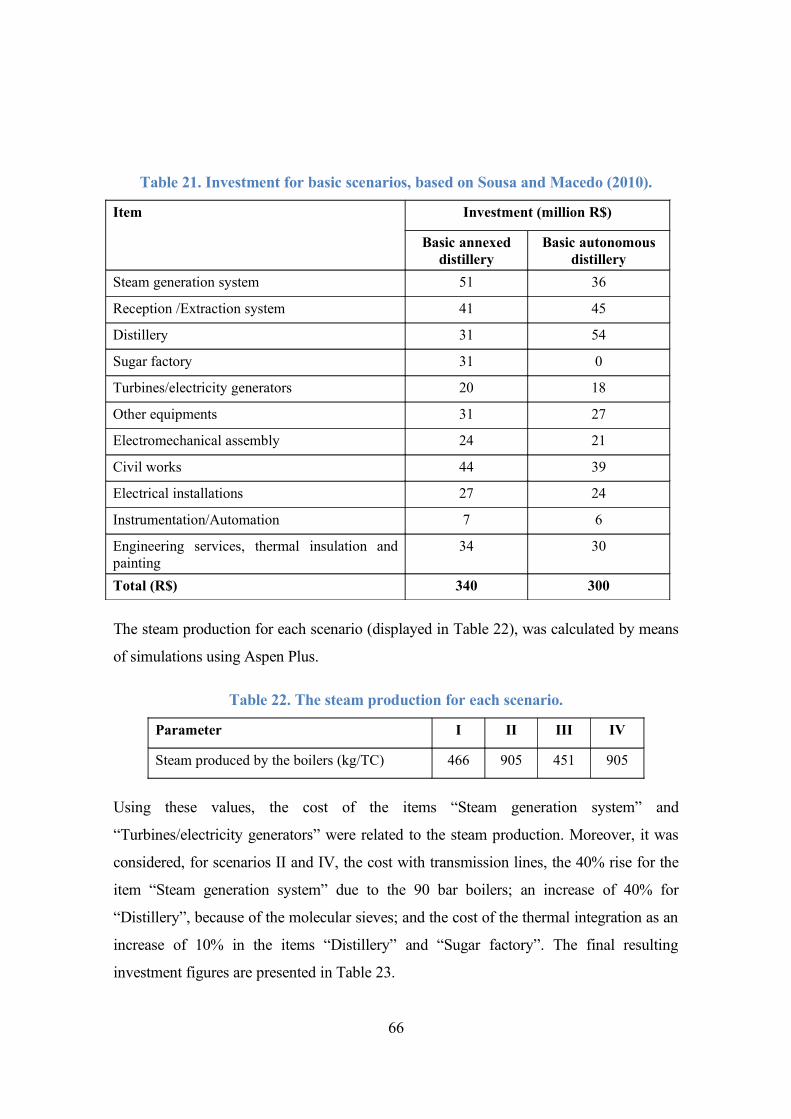
Table 21. Investment for basic scenarios, based on Sousa and Macedo (2010).
Item Investment (million R$)
Basic annexed distillery
Basic autonomous distillery
Steam generation system 51 36
Reception /Extraction system 41 45
Distillery 31 54
Sugar factory 31 0
Turbines/electricity generators 20 18
Other equipments 31 27
Electromechanical assembly 24 21
Civil works 44 39
Electrical installations 27 24
Instrumentation/Automation 7 6
Engineering services, thermal insulation and painting
34 30
Total (R$) 340 300
The steam production for each scenario (displayed in Table 22), was calculated by means
of simulations using Aspen Plus.
Table 22. The steam production for each scenario.
Parameter I II III IV
Steam produced by the boilers (kg/TC) 466 905 451 905
Using these values, the cost of the items “Steam generation system” and
“Turbines/electricity generators” were related to the steam production. Moreover, it was
considered, for scenarios II and IV, the cost with transmission lines, the 40% rise for the
item “Steam generation system” due to the 90 bar boilers; an increase of 40% for
“Distillery”, because of the molecular sieves; and the cost of the thermal integration as an
increase of 10% in the items “Distillery” and “Sugar factory”. The final resulting
investment figures are presented in Table 23.
66

67
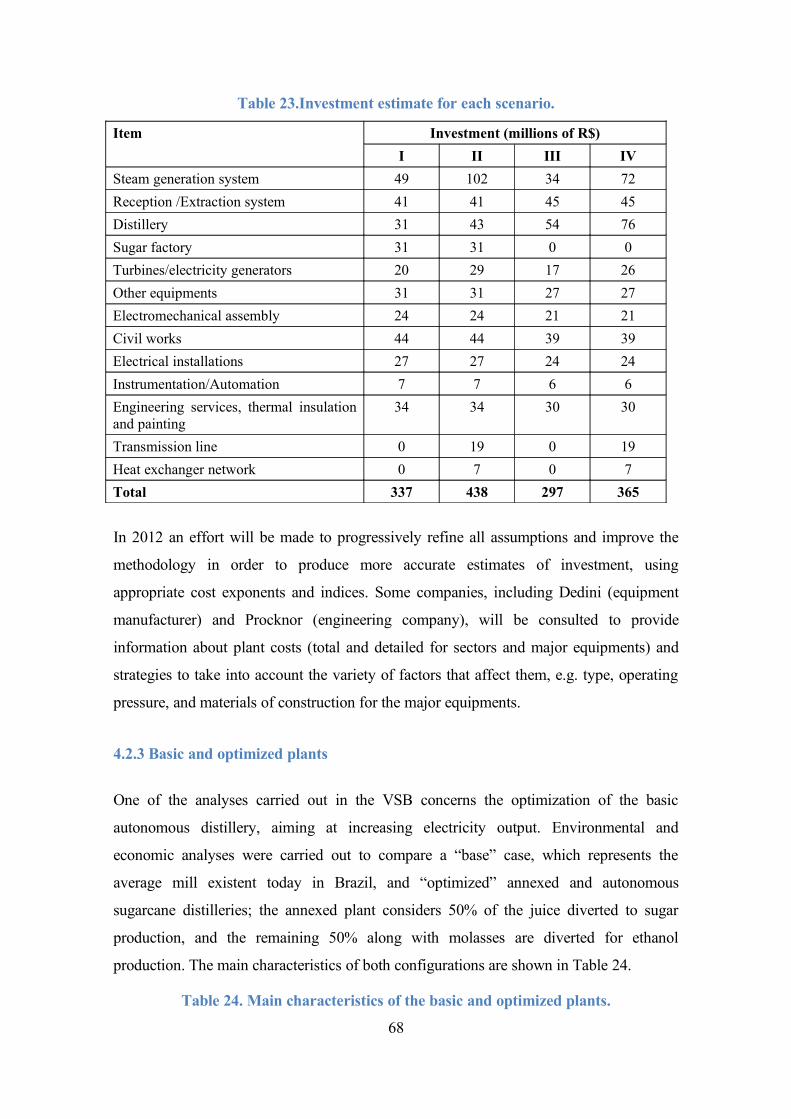
Table 23.Investment estimate for each scenario.
Item Investment (millions of R$)
I II III IV
Steam generation system 49 102 34 72
Reception /Extraction system 41 41 45 45
Distillery 31 43 54 76
Sugar factory 31 31 0 0
Turbines/electricity generators 20 29 17 26
Other equipments 31 31 27 27
Electromechanical assembly 24 24 21 21
Civil works 44 44 39 39
Electrical installations 27 27 24 24
Instrumentation/Automation 7 7 6 6
Engineering services, thermal insulation and painting
34 34 30 30
Transmission line 0 19 0 19
Heat exchanger network 0 7 0 7
Total 337 438 297 365
In 2012 an effort will be made to progressively refine all assumptions and improve the
methodology in order to produce more accurate estimates of investment, using
appropriate cost exponents and indices. Some companies, including Dedini (equipment
manufacturer) and Procknor (engineering company), will be consulted to provide
information about plant costs (total and detailed for sectors and major equipments) and
strategies to take into account the variety of factors that affect them, e.g. type, operating
pressure, and materials of construction for the major equipments.
4.2.3 Basic and optimized plants
One of the analyses carried out in the VSB concerns the optimization of the basic
autonomous distillery, aiming at increasing electricity output. Environmental and
economic analyses were carried out to compare a “base” case, which represents the
average mill existent today in Brazil, and “optimized” annexed and autonomous
sugarcane distilleries; the annexed plant considers 50% of the juice diverted to sugar
production, and the remaining 50% along with molasses are diverted for ethanol
production. The main characteristics of both configurations are shown in Table 24.
Table 24. Main characteristics of the basic and optimized plants.
68

Parameter Base Configuration Optimized Configuration
Dehydration process Azeotropic distillation Molecular sieves
Steam consumption Value from simulation 20 % reduction
Drivers Mechanical (direct) Electric
Boilers 22 bar 90 bar
Use of trash Left in the field 50 % is used in the industry
Surplus bagasse Output (sold) Burnt for production of electricity
It is important to point out that for the studies performed using the VSB in 2011, the
values were inflation-adjusted to 2010: values for 2009 were updated to 2010 considering
the inflation rate of 5.91 % in that year. Values in R$ were converted to US$ considering
the average exchange rate of US$ 1 = R$ 1.76. The scenarios evaluated are listed in Table
25.
Table 25. Scenarios evaluated in the comparison of basic and optimized plants.
Scenarios Description
E50-B 50:50 Annexed plant with basic configuration
E100-B Autonomous distillery with basic configuration
E50 50:50 Annexed plant with optimized configuration
E100 Autonomous distillery with optimized configuration
The main technical results obtained in the simulation are shown in Figure 16.
Figure 16. Main results for basic and optimized autonomous and annexed plants.
69
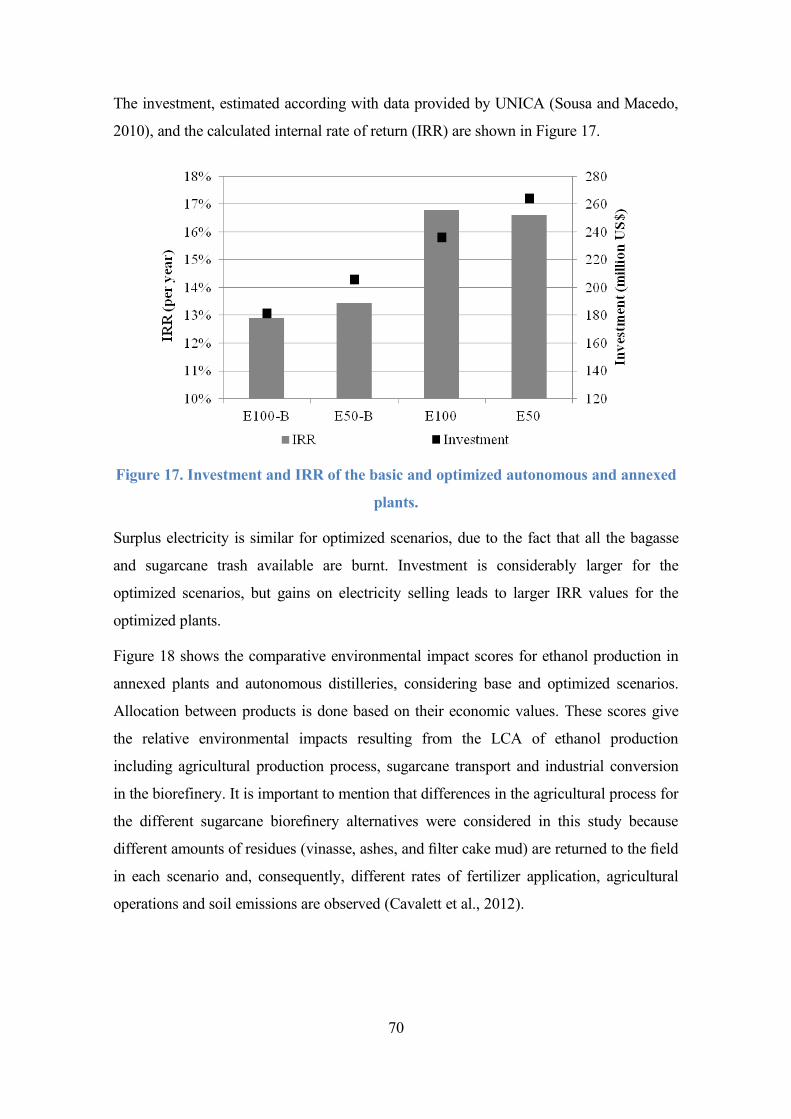
The investment, estimated according with data provided by UNICA (Sousa and Macedo,
2010), and the calculated internal rate of return (IRR) are shown in Figure 17.
Figure 17. Investment and IRR of the basic and optimized autonomous and annexed
plants.
Surplus electricity is similar for optimized scenarios, due to the fact that all the bagasse
and sugarcane trash available are burnt. Investment is considerably larger for the
optimized scenarios, but gains on electricity selling leads to larger IRR values for the
optimized plants.
Figure 18 shows the comparative environmental impact scores for ethanol production in
annexed plants and autonomous distilleries, considering base and optimized scenarios.
Allocation between products is done based on their economic values. These scores give
the relative environmental impacts resulting from the LCA of ethanol production
including agricultural production process, sugarcane transport and industrial conversion
in the biorefinery. It is important to mention that differences in the agricultural process for
the different sugarcane biorefinery alternatives were considered in this study because
different amounts of residues (vinasse, ashes, and filter cake mud) are returned to the field
in each scenario and, consequently, different rates of fertilizer application, agricultural
operations and soil emissions are observed (Cavalett et al., 2012).
70
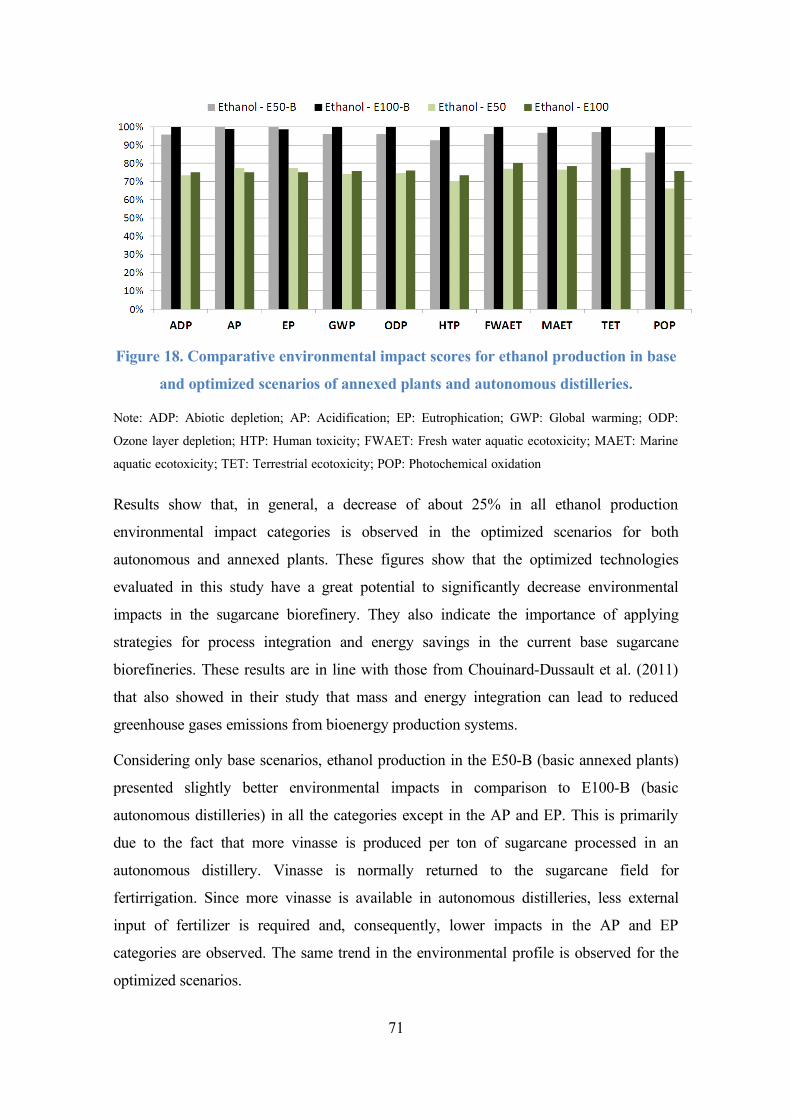
Figure 18. Comparative environmental impact scores for ethanol production in base
and optimized scenarios of annexed plants and autonomous distilleries.
Note: ADP: Abiotic depletion; AP: Acidification; EP: Eutrophication; GWP: Global warming; ODP:
Ozone layer depletion; HTP: Human toxicity; FWAET: Fresh water aquatic ecotoxicity; MAET: Marine
aquatic ecotoxicity; TET: Terrestrial ecotoxicity; POP: Photochemical oxidation
Results show that, in general, a decrease of about 25% in all ethanol production
environmental impact categories is observed in the optimized scenarios for both
autonomous and annexed plants. These figures show that the optimized technologies
evaluated in this study have a great potential to significantly decrease environmental
impacts in the sugarcane biorefinery. They also indicate the importance of applying
strategies for process integration and energy savings in the current base sugarcane
biorefineries. These results are in line with those from Chouinard-Dussault et al. (2011)
that also showed in their study that mass and energy integration can lead to reduced
greenhouse gases emissions from bioenergy production systems.
Considering only base scenarios, ethanol production in the E50-B (basic annexed plants)
presented slightly better environmental impacts in comparison to E100-B (basic
autonomous distilleries) in all the categories except in the AP and EP. This is primarily
due to the fact that more vinasse is produced per ton of sugarcane processed in an
autonomous distillery. Vinasse is normally returned to the sugarcane field for
fertirrigation. Since more vinasse is available in autonomous distilleries, less external
input of fertilizer is required and, consequently, lower impacts in the AP and EP
categories are observed. The same trend in the environmental profile is observed for the
optimized scenarios.
71

Figure 19 shows the comparative environmental impacts breakdown for ethanol
production in the E50-B. These results indicate that sugarcane production and transport
stages have very high environmental impacts in the ethanol production chain and,
consequently, the influence of different industrial alternatives is diluted and almost
negligible when the complete ethanol production chain is considered. For this reason,
environmental impacts for ethanol production considering only the industrial processing
stage are shown in Figure 20 for a better comparison of the differences in industrial
process alternatives for ethanol production.
Figure 19. Comparative environmental impacts breakdown for ethanol production
in the E50-B.
Figure 20. Comparative environmental impact scores for ethanol production in base
and optimized scenarios of annexed plants and autonomous distilleries considering
only the industrial processing stage.
72

Considering the industrial ethanol production processes separately, optimized scenarios,
in general, presented lower environmental impacts, for both annexed and autonomous
plants, in most impact categories, including important ones such as ADP, AP, GWP,
ODP, HTP and POP. However, in the categories EP, FWAET, MAET and TET industrial
optimized scenarios showed higher environmental impacts in comparison to the base
scenarios. This is mainly due to higher impacts of zeolite production used in molecular
sieves for ethanol dehydration process in optimized industrial scenarios in comparison to
production of cyclohexane used in azeotropic distillation in base industrial scenarios on
these specific categories (EP, FWAET, MAET). Both zeolite and cyclohexane were
considered only as input processes, meaning that only the impacts of production of these
materials, and not the local emission due to the use of these different materials, were
accounted for in the assessment due the system boundaries (i.e. emissions of use of
ethanol are not included in this evaluation) and lack of consistent available data for these
emissions. Local emissions of cyclohexane are recognized as an important source of
environmental impacts at the industrial site as well as its emissions as a contaminant in
the ethanol use. Once these emissions are included, results can be even better in favor to
the use of molecular sieves instead of azeotropic distillation for ethanol dehydration
process. Nevertheless, results already indicate that dehydration process using molecular
sieves can be considered an efficient optimization practice to save energy and reduce
environmental impacts of ethanol production process in most of the considered
environmental impact categories.
Comparison of ethanol production process in autonomous distillery and annexed plants
considering base and optimized scenarios indicates that annexed plants show a slightly
better environmental performance in comparison to autonomous distillery in all categories
except in GWP and ODP categories. The higher lime use in annexed plants for sugar
production is responsible for higher impacts in these two categories (GWP and ODP) in
comparison to autonomous distilleries. Higher POP impacts in autonomous distilleries in
comparison to annexed plants are related to more ethanol production in the distilleries and
consequently more ethanol losses in the distillation process. Local ethanol losses have a
strong influence in the POP category. These results indicate that controlling ethanol losses
in the distillation process deserves attention as a point for improvements, to ensure
ethanol production sustainability. In general, LCA results indicate that optimization
strategies have potential for a significant decrease in the sugarcane biorefineries
73
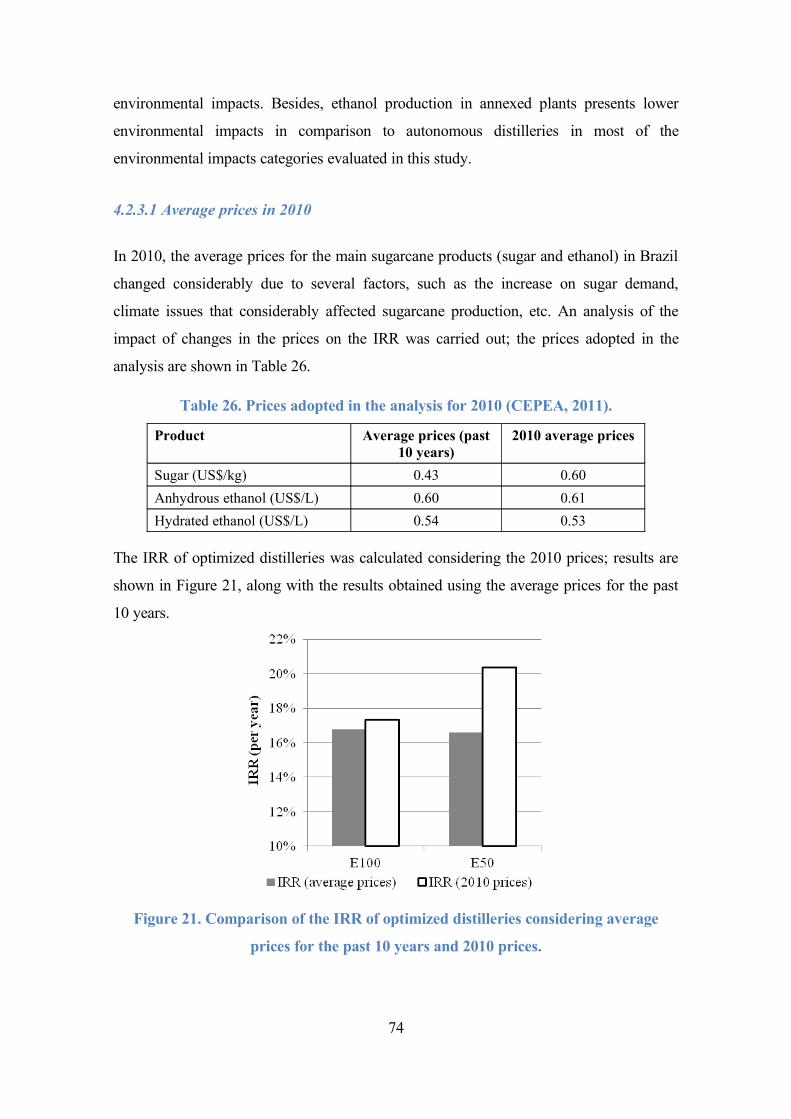
environmental impacts. Besides, ethanol production in annexed plants presents lower
environmental impacts in comparison to autonomous distilleries in most of the
environmental impacts categories evaluated in this study.
4.2.3.1 Average prices in 2010
In 2010, the average prices for the main sugarcane products (sugar and ethanol) in Brazil
changed considerably due to several factors, such as the increase on sugar demand,
climate issues that considerably affected sugarcane production, etc. An analysis of the
impact of changes in the prices on the IRR was carried out; the prices adopted in the
analysis are shown in Table 26.
Table 26. Prices adopted in the analysis for 2010 (CEPEA, 2011).
Product Average prices (past 10 years)
2010 average prices
Sugar (US$/kg) 0.43 0.60
Anhydrous ethanol (US$/L) 0.60 0.61
Hydrated ethanol (US$/L) 0.54 0.53
The IRR of optimized distilleries was calculated considering the 2010 prices; results are
shown in Figure 21, along with the results obtained using the average prices for the past
10 years.
Figure 21. Comparison of the IRR of optimized distilleries considering average
prices for the past 10 years and 2010 prices.
74
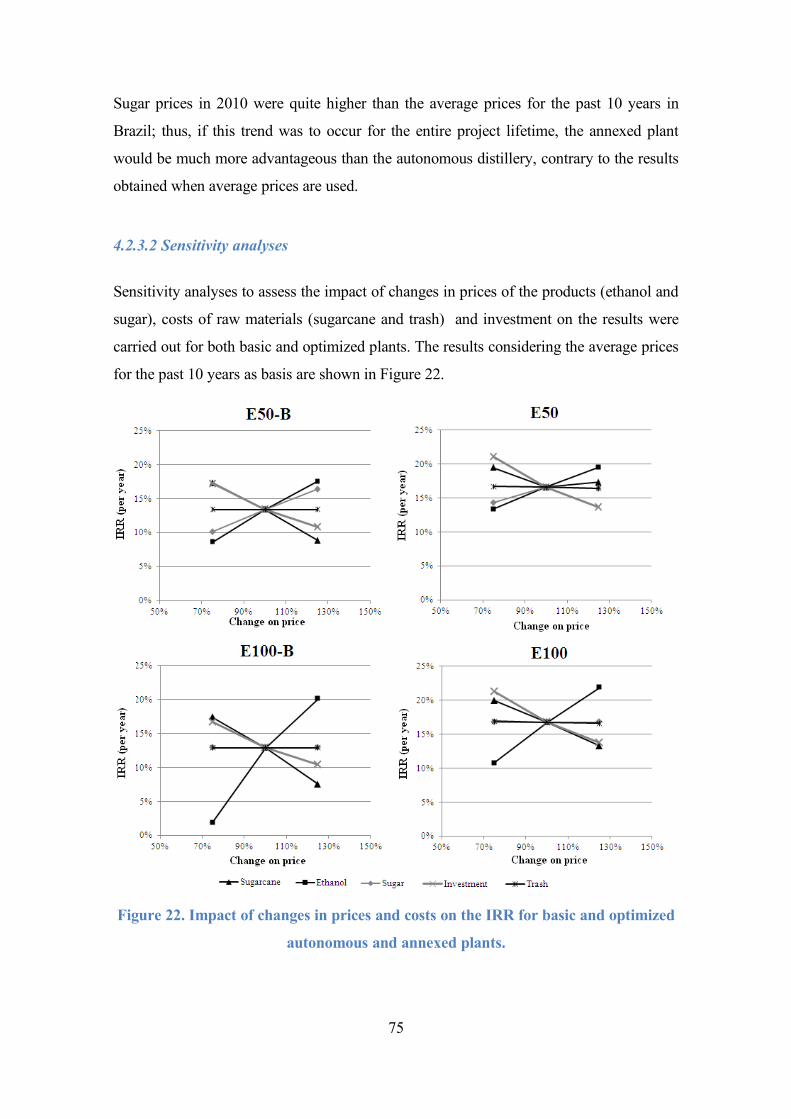
Sugar prices in 2010 were quite higher than the average prices for the past 10 years in
Brazil; thus, if this trend was to occur for the entire project lifetime, the annexed plant
would be much more advantageous than the autonomous distillery, contrary to the results
obtained when average prices are used.
4.2.3.2 Sensitivity analyses
Sensitivity analyses to assess the impact of changes in prices of the products (ethanol and
sugar), costs of raw materials (sugarcane and trash) and investment on the results were
carried out for both basic and optimized plants. The results considering the average prices
for the past 10 years as basis are shown in Figure 22.
Figure 22. Impact of changes in prices and costs on the IRR for basic and optimized
autonomous and annexed plants.
75
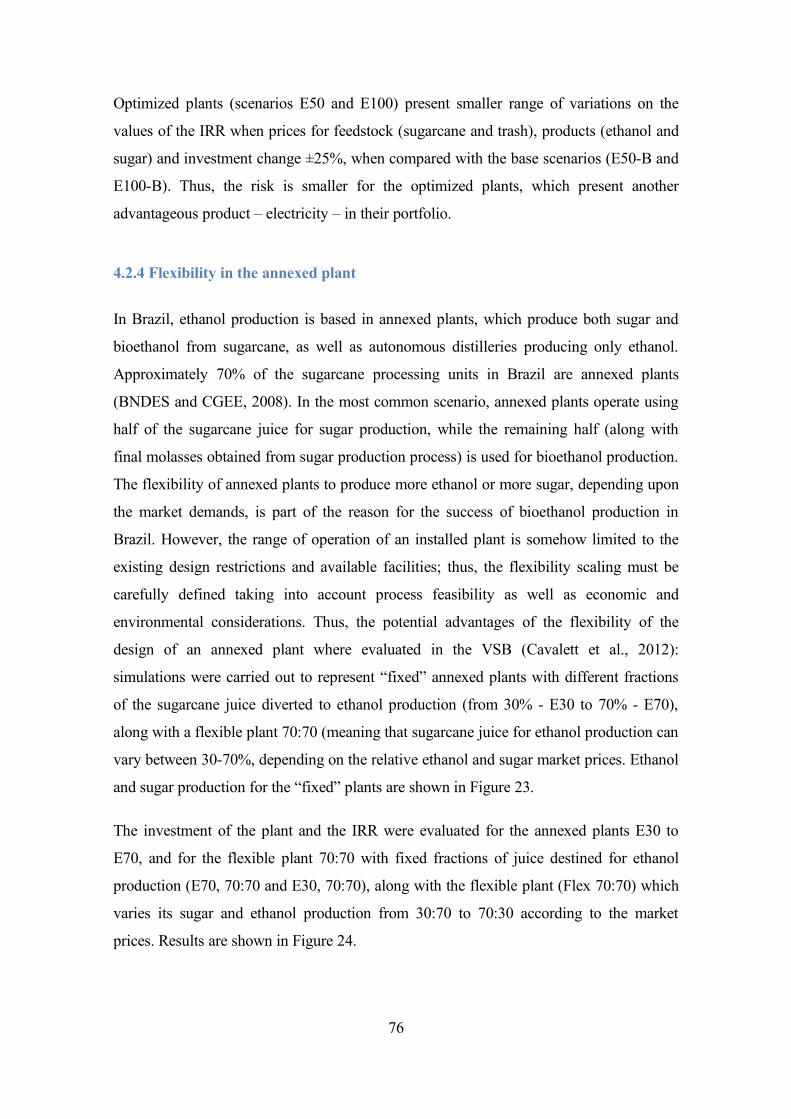
Optimized plants (scenarios E50 and E100) present smaller range of variations on the
values of the IRR when prices for feedstock (sugarcane and trash), products (ethanol and
sugar) and investment change ±25%, when compared with the base scenarios (E50-B and
E100-B). Thus, the risk is smaller for the optimized plants, which present another
advantageous product – electricity – in their portfolio.
4.2.4 Flexibility in the annexed plant
In Brazil, ethanol production is based in annexed plants, which produce both sugar and
bioethanol from sugarcane, as well as autonomous distilleries producing only ethanol.
Approximately 70% of the sugarcane processing units in Brazil are annexed plants
(BNDES and CGEE, 2008). In the most common scenario, annexed plants operate using
half of the sugarcane juice for sugar production, while the remaining half (along with
final molasses obtained from sugar production process) is used for bioethanol production.
The flexibility of annexed plants to produce more ethanol or more sugar, depending upon
the market demands, is part of the reason for the success of bioethanol production in
Brazil. However, the range of operation of an installed plant is somehow limited to the
existing design restrictions and available facilities; thus, the flexibility scaling must be
carefully defined taking into account process feasibility as well as economic and
environmental considerations. Thus, the potential advantages of the flexibility of the
design of an annexed plant where evaluated in the VSB (Cavalett et al., 2012):
simulations were carried out to represent “fixed” annexed plants with different fractions
of the sugarcane juice diverted to ethanol production (from 30% - E30 to 70% - E70),
along with a flexible plant 70:70 (meaning that sugarcane juice for ethanol production can
vary between 30-70%, depending on the relative ethanol and sugar market prices. Ethanol
and sugar production for the “fixed” plants are shown in Figure 23.
The investment of the plant and the IRR were evaluated for the annexed plants E30 to
E70, and for the flexible plant 70:70 with fixed fractions of juice destined for ethanol
production (E70, 70:70 and E30, 70:70), along with the flexible plant (Flex 70:70) which
varies its sugar and ethanol production from 30:70 to 70:30 according to the market
prices. Results are shown in Figure 24.
76
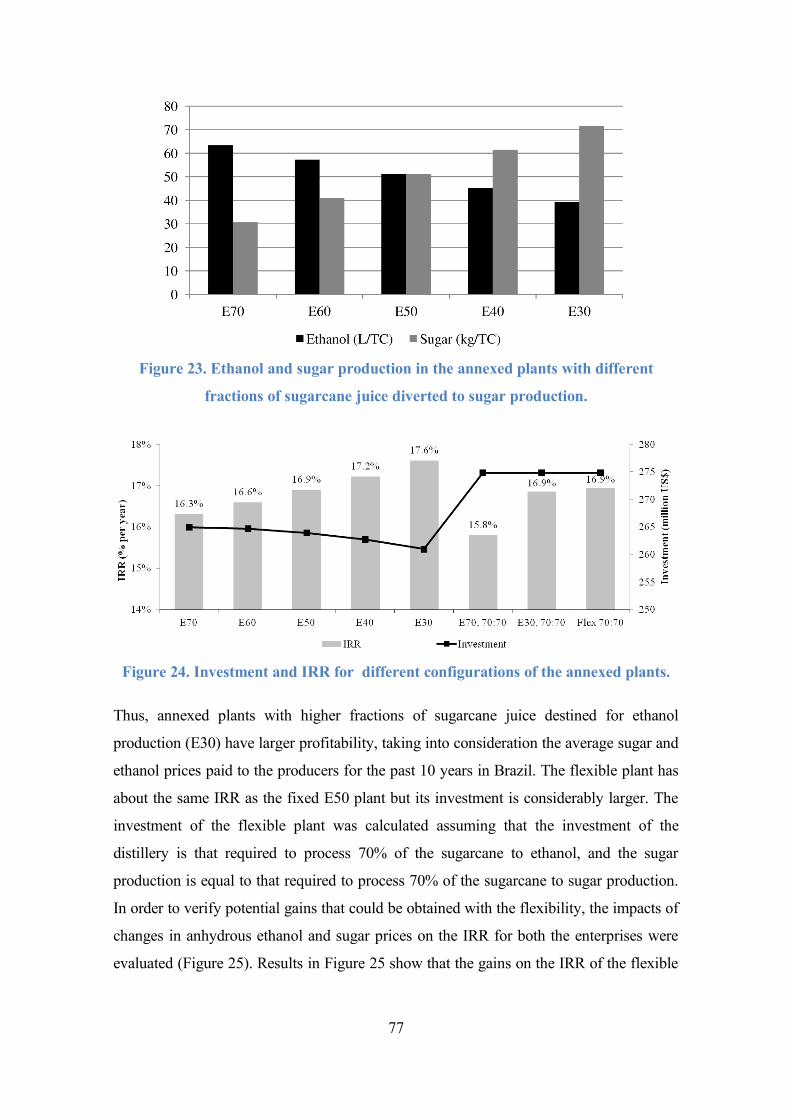
Figure 23. Ethanol and sugar production in the annexed plants with different
fractions of sugarcane juice diverted to sugar production.
Figure 24. Investment and IRR for different configurations of the annexed plants.
Thus, annexed plants with higher fractions of sugarcane juice destined for ethanol
production (E30) have larger profitability, taking into consideration the average sugar and
ethanol prices paid to the producers for the past 10 years in Brazil. The flexible plant has
about the same IRR as the fixed E50 plant but its investment is considerably larger. The
investment of the flexible plant was calculated assuming that the investment of the
distillery is that required to process 70% of the sugarcane to ethanol, and the sugar
production is equal to that required to process 70% of the sugarcane to sugar production.
In order to verify potential gains that could be obtained with the flexibility, the impacts of
changes in anhydrous ethanol and sugar prices on the IRR for both the enterprises were
evaluated (Figure 25). Results in Figure 25 show that the gains on the IRR of the flexible
77

plant (Flex 70:70) are larger for increases on ethanol and sugar prices when compared
with the fixed annexed plant (E50).
Figure 25. Impact of changes on ethanol and sugar prices on the IRR of the Flex
70:70 and E50.
It was not possible to identify significant differences between the environmental impacts
for ethanol production process in optimized annexed (E50) and flexible (Flex 70:70)
scenarios when the agricultural, sugarcane transport and industrialization inventories are
considered. More steel is required for equipment production in the flexible plant since
always 40% of the plant capacity is idle in the studied scenarios; however, as the
environmental impacts of industrial equipment production have small contribution for the
environmental impacts of the entire life cycle of ethanol (because these impacts are
diluted over the plant life span), more flexibility has little influence in these results (less
than 2% in most of environmental impacts categories). However, environmental impacts
only for the industrial processing stage are shown in Figure 26 for better comparison of
the differences in the industrial process alternatives. These results indicate that flexible
scenario presents lower environmental impact indicators for ethanol production in
comparison to the optimized fixed annexed plant (E50) scenario, except on GWP and
ODP categories where there is almost no difference. These results are related to the fact
that the flexible scenario produces more sugar than E50, because of its strategy of
economic profit optimization. It is important to notice that these results consider the
economic allocation criteria used in this assessment. If profit maximization in flexible
78

plant is obtained producing more sugar, the share of the environmental burden to sugar is
correspondingly increased in this scenario. The conclusion from the environmental point
of view is that a production strategy of taking advantage of more flexibility in annexed
plants is an interesting alternative, reducing the environmental impacts in the ethanol
production process.
Figure 26. Comparative environmental impact scores for ethanol production in E50
and Flex 70:70 considering only the industrial processing stage.
Note: ADP: Abiotic depletion; AP: Acidification; EP: Eutrophication; GWP: Global warming; ODP:
Ozone layer depletion; HTP: Human toxicity; FWAET: Fresh water aquatic ecotoxicity; MAET: Marine
aquatic ecotoxicity; TET: Terrestrial ecotoxicity; POP: Photochemical oxidation
4.2.5 Results of the validation procedure for first generation
In this item the main results of the validation of the simulation of the 1G ethanol
production, described in section 3.5.1, corresponding to the information collected in the
Mill A, that produces sugar and alcohol, are presented. The analysis was carried out
considering the month of August 2010, since the characteristics of this month, concerning
amount of rain and sugarcane quality, making it one of the best months for sugarcane
processing in this mill. presents the amount of processed sugarcane and TRS for ethanol
production and sugar and Table 28, the corresponding sugar and ethanol produced.
Table 27. Sugarcane processed in August and accumulated in season – Data from
Mill A’s bulletin.
Destination Monthly (kg) % Accumulated in the %
79
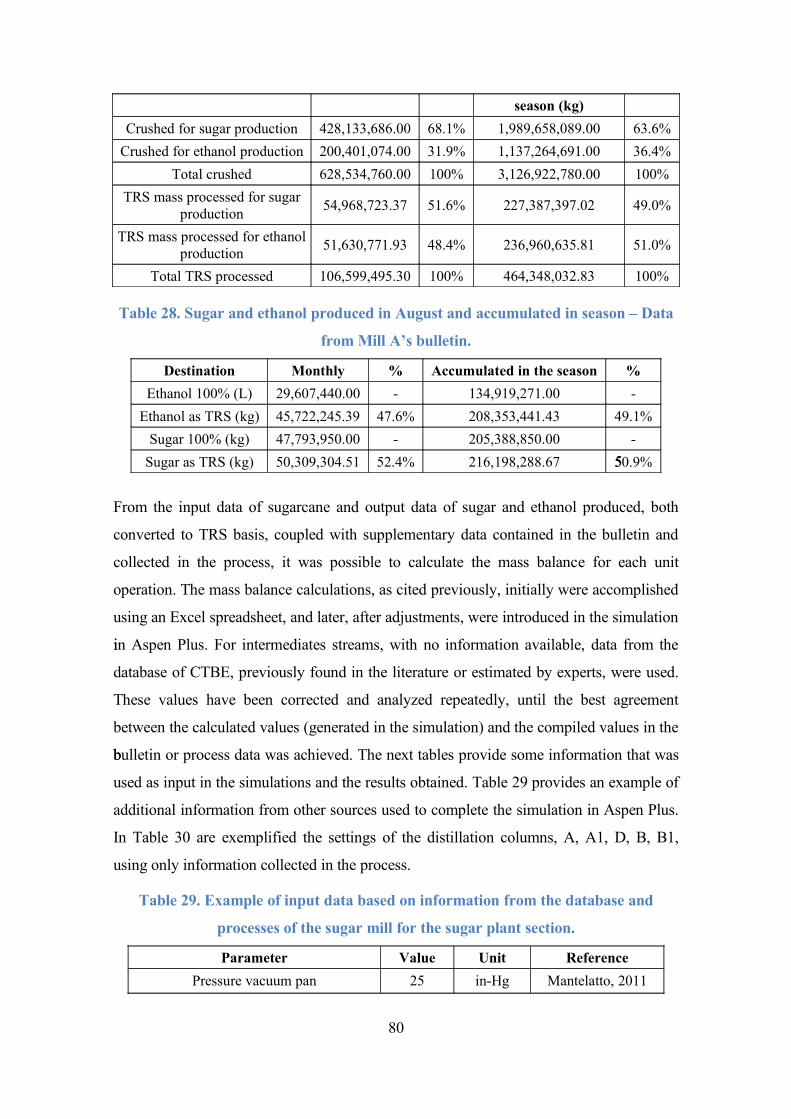
season (kg)
Crushed for sugar production 428,133,686.00 68.1% 1,989,658,089.00 63.6%
Crushed for ethanol production 200,401,074.00 31.9% 1,137,264,691.00 36.4%
Total crushed 628,534,760.00 100% 3,126,922,780.00 100%
TRS mass processed for sugar production
54,968,723.37 51.6% 227,387,397.02 49.0%
TRS mass processed for ethanol production
51,630,771.93 48.4% 236,960,635.81 51.0%
Total TRS processed 106,599,495.30 100% 464,348,032.83 100%
Table 28. Sugar and ethanol produced in August and accumulated in season – Data
from Mill A’s bulletin.
Destination Monthly % Accumulated in the season %
Ethanol 100% (L) 29,607,440.00 - 134,919,271.00 -
Ethanol as TRS (kg) 45,722,245.39 47.6% 208,353,441.43 49.1%
Sugar 100% (kg) 47,793,950.00 - 205,388,850.00 -
Sugar as TRS (kg) 50,309,304.51 52.4% 216,198,288.67 50.9%5
From the input data of sugarcane and output data of sugar and ethanol produced, both
converted to TRS basis, coupled with supplementary data contained in the bulletin and
collected in the process, it was possible to calculate the mass balance for each unit
operation. The mass balance calculations, as cited previously, initially were accomplished
using an Excel spreadsheet, and later, after adjustments, were introduced in the simulation
in Aspen Plus. i For intermediates streams, with no information available, data from the
database of CTBE, previously found in the literature or estimated by experts, were used.
These values have been corrected and analyzed repeatedly, until the best agreement
between the calculated values (generated in the simulation) and the compiled values in the
bulletin or process data was achieved. b The next tables provide some information that was
used as input in the simulations and the results obtained. Table 29 provides an example of
additional information from other sources used to complete the simulation in Aspen Plus.
In Table 30 are exemplified the settings of the distillation columns, A, A1, D, B, B1,
using only information collected in the process.
Table 29. Example of input data based on information from the database and
processes of the sugar mill for the sugar plant section.
Parameter Value Unit Reference
Pressure vacuum pan 25 in-Hg Mantelatto, 2011
80
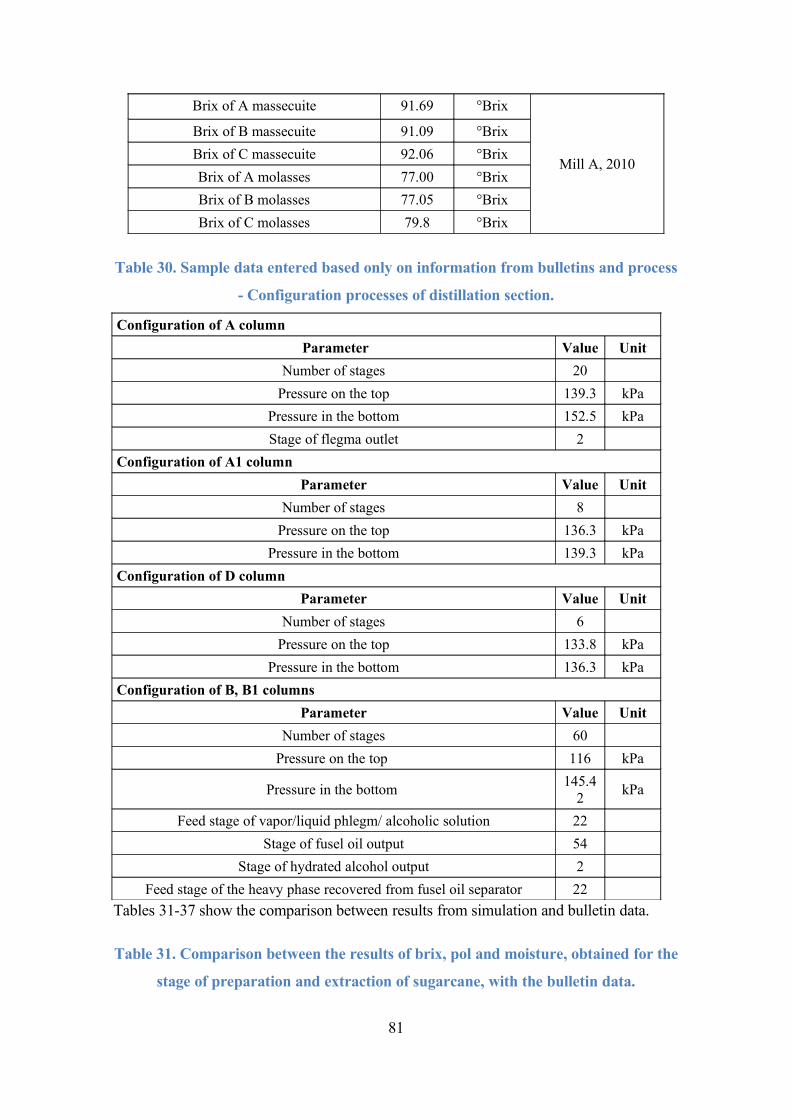
Brix of A massecuite 91.69 °Brix
Mill A, 2010
Brix of B massecuite 91.09 °Brix
Brix of C massecuite 92.06 °Brix
Brix of A molasses 77.00 °Brix
Brix of B molasses 77.05 °Brix
Brix of C molasses 79.8 °Brix
Table 30. Sample data entered based only on information from bulletins and process
- Configuration processes of distillation section.
Configuration of A column
Parameter Value Unit
Number of stages 20
Pressure on the top 139.3 kPa
Pressure in the bottom 152.5 kPa
Stage of flegma outlet 2
Configuration of A1 column
Parameter Value Unit
Number of stages 8
Pressure on the top 136.3 kPa
Pressure in the bottom 139.3 kPa
Configuration of D column
Parameter Value Unit
Number of stages 6
Pressure on the top 133.8 kPa
Pressure in the bottom 136.3 kPa
Configuration of B, B1 columns
Parameter Value Unit
Number of stages 60
Pressure on the top 116 kPa
Pressure in the bottom 145.4
2kPa
Feed stage of vapor/liquid phlegm/ alcoholic solution 22
Stage of fusel oil output 54
Stage of hydrated alcohol output 2
Feed stage of the heavy phase recovered from fusel oil separator 22
Tables 31-37 show the comparison between results from simulation and bulletin data.
Table 31. Comparison between the results of brix, pol and moisture, obtained for the
stage of preparation and extraction of sugarcane, with the bulletin data.
81
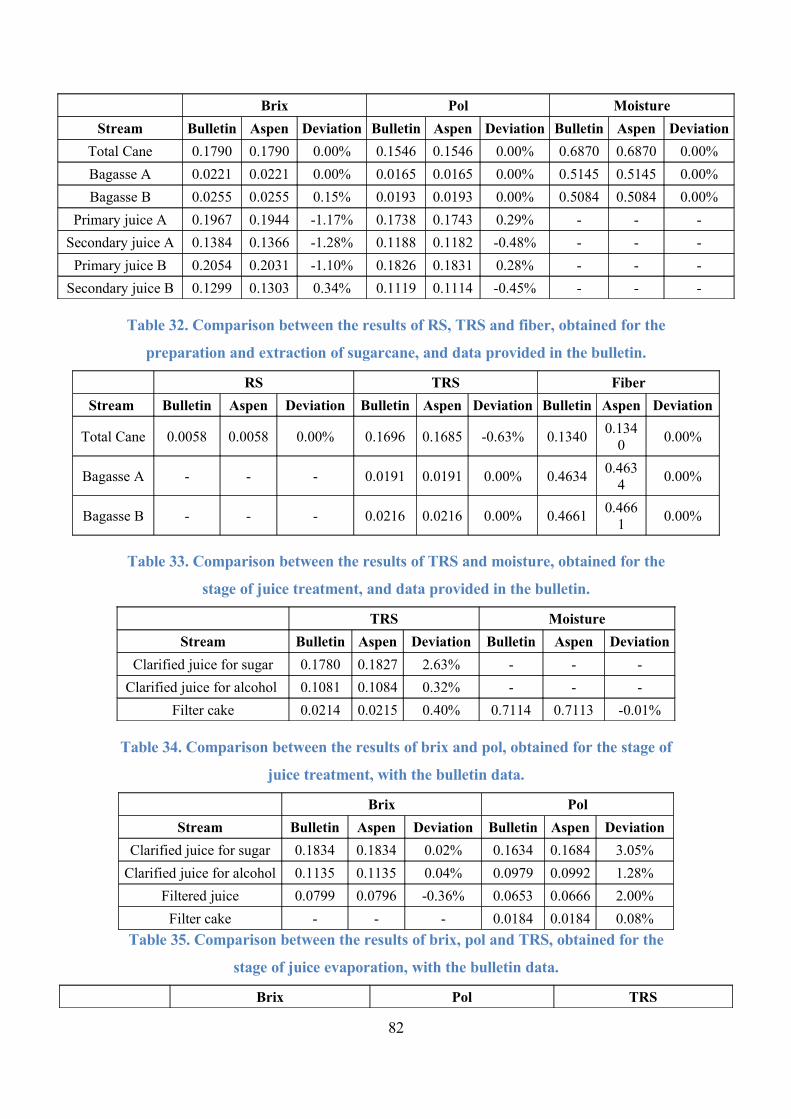
Brix Pol Moisture
Stream Bulletin Aspen Deviation Bulletin Aspen Deviation Bulletin Aspen Deviation
Total Cane 0.1790 0.1790 0.00% 0.1546 0.1546 0.00% 0.6870 0.6870 0.00%
Bagasse A 0.0221 0.0221 0.00% 0.0165 0.0165 0.00% 0.5145 0.5145 0.00%
Bagasse B 0.0255 0.0255 0.15% 0.0193 0.0193 0.00% 0.5084 0.5084 0.00%
Primary juice A 0.1967 0.1944 -1.17% 0.1738 0.1743 0.29% - - -
Secondary juice A 0.1384 0.1366 -1.28% 0.1188 0.1182 -0.48% - - -
Primary juice B 0.2054 0.2031 -1.10% 0.1826 0.1831 0.28% - - -
Secondary juice B 0.1299 0.1303 0.34% 0.1119 0.1114 -0.45% - - -
Table 32. Comparison between the results of RS, TRS and fiber, obtained for the
preparation and extraction of sugarcane, and data provided in the bulletin.
RS TRS Fiber
Stream Bulletin Aspen Deviation Bulletin Aspen Deviation Bulletin Aspen Deviation
Total Cane 0.0058 0.0058 0.00% 0.1696 0.1685 -0.63% 0.13400.134
00.00%
Bagasse A - - - 0.0191 0.0191 0.00% 0.46340.463
40.00%
Bagasse B - - - 0.0216 0.0216 0.00% 0.46610.466
10.00%
Table 33. Comparison between the results of TRS and moisture, obtained for the
stage of juice treatment, and data provided in the bulletin.
TRS Moisture
Stream Bulletin Aspen Deviation Bulletin Aspen Deviation
Clarified juice for sugar 0.1780 0.1827 2.63% - - -
Clarified juice for alcohol 0.1081 0.1084 0.32% - - -
Filter cake 0.0214 0.0215 0.40% 0.7114 0.7113 -0.01%
Table 34. Comparison between the results of brix and pol, obtained for the stage of
juice treatment, with the bulletin data.
Brix Pol
Stream Bulletin Aspen Deviation Bulletin Aspen Deviation
Clarified juice for sugar 0.1834 0.1834 0.02% 0.1634 0.1684 3.05%
Clarified juice for alcohol 0.1135 0.1135 0.04% 0.0979 0.0992 1.28%
Filtered juice 0.0799 0.0796 -0.36% 0.0653 0.0666 2.00%
Filter cake - - - 0.0184 0.0184 0.08%
Table 35. Comparison between the results of brix, pol and TRS, obtained for the
stage of juice evaporation, with the bulletin data.
Brix Pol TRS
82
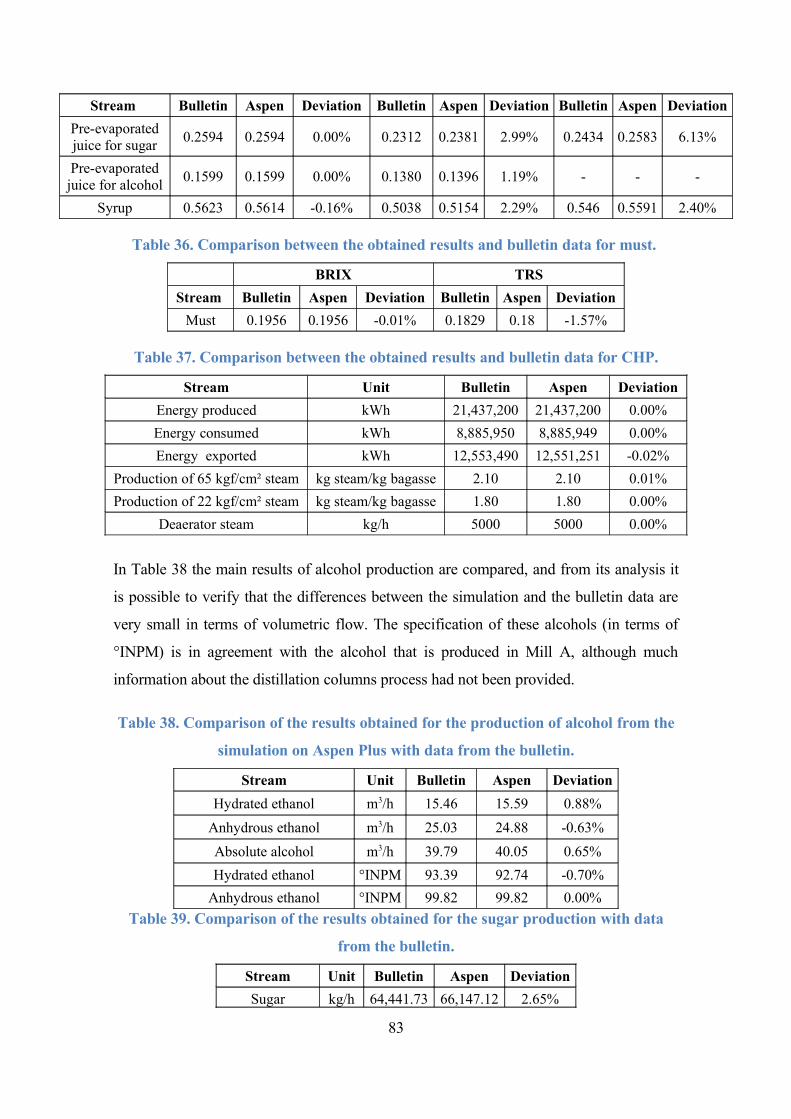
Stream Bulletin Aspen Deviation Bulletin Aspen Deviation Bulletin Aspen Deviation
Pre-evaporated juice for sugar
0.2594 0.2594 0.00% 0.2312 0.2381 2.99% 0.2434 0.2583 6.13%
Pre-evaporated juice for alcohol
0.1599 0.1599 0.00% 0.1380 0.1396 1.19% - - -
Syrup 0.5623 0.5614 -0.16% 0.5038 0.5154 2.29% 0.546 0.5591 2.40%
Table 36. Comparison between the obtained results and bulletin data for must.
BRIX TRS
Stream Bulletin Aspen Deviation Bulletin Aspen Deviation
Must 0.1956 0.1956 -0.01% 0.1829 0.18 -1.57%
Table 37. Comparison between the obtained results and bulletin data for CHP.
Stream Unit Bulletin Aspen Deviation
Energy produced kWh 21,437,200 21,437,200 0.00%
Energy consumed kWh 8,885,950 8,885,949 0.00%
Energy exported kWh 12,553,490 12,551,251 -0.02%
Production of 65 kgf/cm² steam kg steam/kg bagasse 2.10 2.10 0.01%
Production of 22 kgf/cm² steam kg steam/kg bagasse 1.80 1.80 0.00%
Deaerator steam kg/h 5000 5000 0.00%
In Table 38 the main results of alcohol production are compared, and from its analysis it
is possible to verify that the differences between the simulation and the bulletin data are
very small in terms of volumetric flow. The specification of these alcohols (in terms of
°INPM) is in agreement with the alcohol that is produced in Mill A, although much
information about the distillation columns process had not been provided.
Table 38. Comparison of the results obtained for the production of alcohol from the
simulation on Aspen Plus with data from the bulletin.
Stream Unit Bulletin Aspen Deviation
Hydrated ethanol m3/h 15.46 15.59 0.88%
Anhydrous ethanol m3/h 25.03 24.88 -0.63%
Absolute alcohol m3/h 39.79 40.05 0.65%
Hydrated ethanol °INPM 93.39 92.74 -0.70%
Anhydrous ethanol °INPM 99.82 99.82 0.00%
Table 39. Comparison of the results obtained for the sugar production with data
from the bulletin.
Stream Unit Bulletin Aspen Deviation
Sugar kg/h 64,441.73 66,147.12 2.65%
83

Sugar 100% kg/h 64,172.92 65,641.28 2.29%
Table 40. Comparison of the results obtained for the intermediate streams in sugar
production with data from the bulletin.
Brix Pol
Stream Bulletin Aspen Deviation Bulletin Aspen Deviation
Massecuite A 0.9169 0.9169 0.00% 0.8213 0.8583 4.51%
Massecuite B 0.9109 0.9109 0.00% 0.7494 0.8064 7.61%
Massecuite C 0.9206 0.9206 0.00% 0.6856 0.6949 1.36%
Magma B 0.9023 0.9824 8.87% 0.8555 0.9392 9.79%
Magma C 0.8676 0.9327 7.50% 0.8210 0.8139 -0.86%
Molasses A 0.7700 0.7750 0.65% 0.6167 0.6658 7.96%
Molasses B 0.7705 0.7705 0.01% 0.5204 0.5816 11.77%
Final molasses 0.7980 0.7981 0.02% 0.4629 0.5200 12.34%
Sugar - - - 0.9969 0.9924 -0.46%
The main results of sugar production (Table 39, for the final products, and Table 40 for
intermediate streams) are compared, and from its analysis it is possible to verify that the
sugar flow from the simulation is in agreement with the data from the bulletin. Some
intermediate streams showed some deviations compared to the bulletin data, but these
differences can be explained by the fact that the sugar production step in the Mill A is
very complex and not many details were provided in the bulletin. Because of this lack of
data, some assumptions had to be made, so these deviations were expected and, therefore,
these results can be considered satisfactory.
On Table 41 the main yields of the mill are displayed.
Table 41. Comparison of yields calculated from the results of the simulation on
Aspen Plus with data from the bulletin.
Yield on TRS base Bulletin Aspen Deviation
Total 89.92% 91.28% 1.51%
Sugar Plant 91.49% 93.82% 2.54%
Alcohol Session 86.57% 87.11% 0.62%
Table 41 indicates that the yields calculated from simulation results were very similar to
those given in the bulletin, but presenting a positive deviation. It is important to point out
84
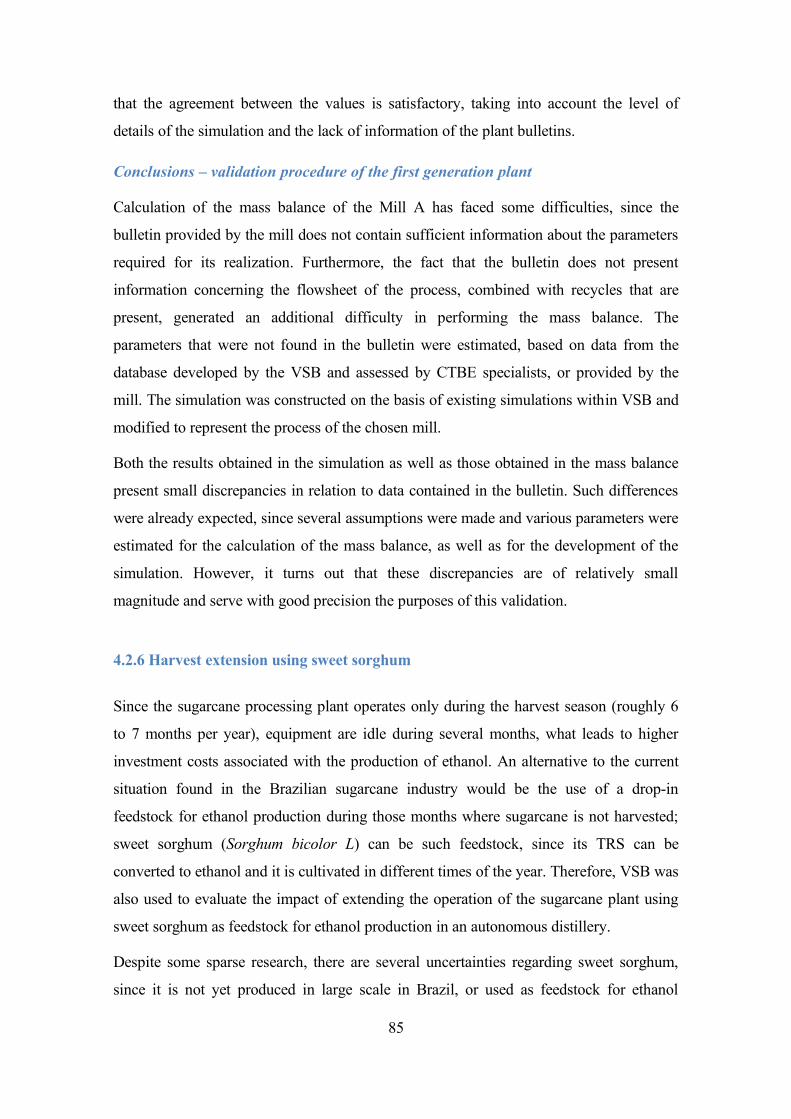
that the agreement between the values is satisfactory, taking into account the level of
details of the simulation and the lack of information of the plant bulletins.
Conclusions – validation procedure of the first generation plant
Calculation of the mass balance of the Mill A has faced some difficulties, since the
bulletin provided by the mill does not contain sufficient information about the parameters
required for its realization. Furthermore, the fact that the bulletin does not present
information concerning the flowsheet of the process, combined with recycles that are
present, generated an additional difficulty in performing the mass balance. The
parameters that were not found in the bulletin were estimated, based on data from the
database developed by the VSB and assessed by CTBE specialists, or provided by the
mill. The simulation was constructed on the basis of existing simulations within VSB and
modified to represent the process of the chosen mill.
Both the results obtained in the simulation as well as those obtained in the mass balance
present small discrepancies in relation to data contained in the bulletin. Such differences
were already expected, since several assumptions were made and various parameters were
estimated for the calculation of the mass balance, as well as for the development of the
simulation. However, it turns out that these discrepancies are of relatively small
magnitude and serve with good precision the purposes of this validation.
4.2.6 Harvest extension using sweet sorghum
Since the sugarcane processing plant operates only during the harvest season (roughly 6
to 7 months per year), equipment are idle during several months, what leads to higher
investment costs associated with the production of ethanol. An alternative to the current
situation found in the Brazilian sugarcane industry would be the use of a drop-in
feedstock for ethanol production during those months where sugarcane is not harvested;
sweet sorghum (Sorghum bicolor L) can be such feedstock, since its TRS can be
converted to ethanol and it is cultivated in different times of the year. Therefore, VSB was
also used to evaluate the impact of extending the operation of the sugarcane plant using
sweet sorghum as feedstock for ethanol production in an autonomous distillery.
Despite some sparse research, there are several uncertainties regarding sweet sorghum,
since it is not yet produced in large scale in Brazil, or used as feedstock for ethanol
85
production. Estimates where done in the VSB considering data provided by specialists
(Rossell, 2011); different scenarios where constructed to assess the potential improvement
of the sorghum quality and its processing technology, which will naturally occur if it is
going to be used as feedstock for ethanol production, just as happened for sugarcane
decades ago. The main characteristics of the sorghum composition and process yield
adopted in each scenario are shown in Table 42.
Table 42. Sweet sorghum main characteristics and process yield (Rossell, 2011).
Parameter Scenario 1 Scenario 2 Scenario 3
Sorghum TRS (kg/t) 125 137.5 150
Sorghum fiber (kg/t) 138.5 142.0 145.4
Sorghum bagasse moisture (%) 52 50 50
Global yield (%) 78.34 81.24 83.89
An optimized first generation autonomous distillery was evaluated (90 bar boilers,
adsorption on molecular sieves, juice concentration on multiple effect evaporators,
reduced steam consumption, recovery of 50% of sugarcane trash, electric drivers,
condensing-extracting steam turbines), processing 2 million tons of sugarcane (plus 50%
of the trash, during 167 days/year) and 0.72 million tons of sweet sorghum (which
corresponds to 500 tons/h of sweet sorghum during 60 days/year), producing anhydrous
ethanol and electricity.
The same equipment used in the autonomous sugarcane distillery was used for ethanol
production from sweet sorghum; thus, no increase on investment was assumed for harvest
extension in all assessed scenarios.
The following technical assumptions were made in this analysis:
• sweet sorghum fibers composition is the same of the sugarcane fibers (cellulose,
hemicellulose and lignin content);
• boiler efficiency is the same for both sweet sorghum and sugarcane bagasse
burning;
• equipment may work with different efficiencies depending on the feedstock; for
instance, extraction efficiency for sugarcane is 96%, while in scenario 1,
extraction efficiency for sweet sorghum is equal to 92%;
86

• no sweet sorghum trash is recovered and used in the industry for production of
energy;
• since the steam and electricity generation during the 60 days the plant operates
with sweet sorghum is much smaller than during the 167 days the plant operates
with sugarcane and trash, only part of the cogeneration system (for instance, only
one boiler instead of two) would be used while processing sweet sorghum;
• electricity consumption in sweet sorghum processing is proportional to the amount
of sweet sorghum processed, and equal to that adopted in sugarcane processing
(30 kWh/t).
Concerning the economic analysis, the following assumptions were made:
• sweet sorghum price was calculated as the same price of the sugarcane on a TRS
basis; an analysis of the impact of ±15% variation in the price was made;
• no changes on labor costs and equipment investment were considered;
• inputs costs were calculated as a proportion of the amount of ethanol produced.
Sugarcane cost of R$ 40.91/TC was considered; since its TRS content is 152 kg/TC, the
calculated TRS price is R$ 0.27/kg TRS. Thus, each scenario has a different price for
sweet sorghum. The results obtained for ethanol and electricity production for the
autonomous distillery processing sugarcane (scenario 1G) and processing sweet sorghum
with different quality and yields (scenarios 1-3) during 60 days of the sugarcane off-
season are shown in Figure 27.
Figure 27. Ethanol and electricity production in the optimized autonomous first
generation (1G) and scenarios for sweet sorghum.
87

In the economic analysis, IRR and production costs were calculated for Scenarios 1 – 3
considering the integrated process (using sugarcane and sweet sorghum). Calculated
sorghum prices, IRR and ethanol production costs are shown in Table 43.
Table 43. Sweet sorghum prices, IRR and ethanol production costs for the harvest
extension scenarios with sweet sorghum.
Parameter 1G Scenario 1 Scenario 2 Scenario 3
Sweet sorghum price (US$/t) - 19.06 20.96 22.87
IRR (% per year) 15.0% 17.9 % 18.5% 18.9%
Ethanol production cost (US$/L) 0.37 0.36 0.36 0.36
Due to the uncertainties on sweet sorghum price, sensitivity analyses were carried out to
evaluate the impact of changes of ±15% on its price; results are shown in Figure 28.
Figure 28. Impact of ±15% changes on sweet sorghum prices in the IRR of the
scenarios evaluated with harvest extension.
Therefore, even with an increase of 15% in sweet sorghum price and considering the
worst situation (Scenario 1, which has the poorest sorghum quality and lowest processing
yields), sugarcane harvest extension in an autonomous distillery using sweet sorghum
provides more gains (IRR higher than 17%) that those obtained with no harvest extension
(IRR of 15%).
4.3 Industrial phase - second generation: biochemical route
From the beginning the major efforts in the VSB construction were devoted to the
simulation of the second generation ethanol production, having in mind that the
88
development of this technology is one of the major goals of the Brazilian Bioethanol
Science and Technology Laboratory – CTBE (Dias et al., 2011b and Dias et al., 2012).
In the Brazilian sugarcane industry, large amounts of lignocellulosic materials (sugarcane
bagasse and trash) are produced during sugar and ethanol production. Sugarcane bagasse
is currently used as fuel, supplying the energy required for the plant, while sugarcane
trash, previously burnt to improve the harvest procedure, is today mostly left in the field
for agricultural purposes (Alonso Pippo et al., 2011). Therefore, banning of burning
practices significantly improved the amount of sugarcane trash available for use in the
industry (Seabra et al., 2010).
Second generation bioethanol, produced from lignocellulosic materials, has been
envisioned as the biofuel with the largest potential to replace fossil derived fuels with
lower impacts than the conventional, first generation bioethanol (Martín and Grossmann,
2011; Ojeda et al., 2011; Seabra et al., 2010). Besides being cheap and abundant,
production of lignocellulosic materials has limited competition with food production, thus
they do not compromise food security (Alvira et al., 2010; Čuček et al., 2011). In the
sugarcane industry another advantage for the use of lignocellulosic material as feedstock
for bioethanol production is clear: since they are already available at plant site (bagasse),
or close to it (trash), second generation bioethanol production may share part of the
infrastructure where first generation ethanol production takes place (for instance
concentration, fermentation, distillation, storage and cogeneration facilities) – this
alternative is the integrated first and second generation ethanol production. In addition,
potential fermentation inhibitors generated in the lignocellulosic material pretreatment
may have a minor effect on fermentation yields, since the hydrolyzed liquor may be
fermented mixed with sugarcane juice, diluting these inhibitors. Nevertheless, the
recalcitrance of lignocellulosic materials hinders the transformation of cellulose into
fermentable sugars; the second generation ethanol production processes therefore require
more sophisticated equipment and investment than conventional first generation ethanol
production (Nigam and Singh, 2011).
Since second generation ethanol production is not yet a commercial reality, different
process configurations have been investigated in order to develop efficient conversion
processes. In the VSB different configurations of the second generation production
89
process, integrated or not with first generation ethanol production, where evaluated. The
configurations evaluated are described in the next sections.
4.3.1 Process description - Second generation
Second generation ethanol production requires pretreatment and hydrolysis of the
lignocellulosic material. The available lignocellulosic material is sent to the pretreatment
operation, comprised by steam explosion followed, or not, by an alkaline delignification
step (depending on the configuration). In the steam explosion, most of the hemicellulose
is hydrolyzed into pentoses, with small cellulose losses and no lignin solubilization
(Ojeda et al., 2011). The pretreated solids are separated from the obtained pentoses liquor
using a filter; pentoses are either fermented into ethanol or biodigested (producing biogas
for the cogeneration system), depending on the configuration.
In some configurations the pretreatment is followed by an alkaline delignification step,
where most of the lignin is removed from the pretreated material decreasing its inhibitory
effects on the following enzymatic hydrolysis step (Rocha et al., 2012).
The solid fraction obtained after filtration is sent to enzymatic hydrolysis. The material
produced after the enzymatic hydrolysis is separated in two fractions, the hydrolyzed
liquor, rich in glucose, and the unreacted solids (residual cellulignin); the latter is used as
fuels in the cogeneration system. In the integrated process, the hydrolyzed liquor is mixed
with sugarcane juice; thus, concentration, fermentation, distillation and dehydration
operations are shared between both processes. The same conversion of first generation
fermentation reactions (conversion of glucose to ethanol) was assumed for the second
generation process, both in the integrated and stand-alone configurations.
Three technological scenarios were created in order to evaluate second generation ethanol
production from sugarcane bagasse and trash, considering different yields, solids loading
on hydrolysis and destination of pentoses (biodigestion into biogas to be used in the
cogeneration system or fermentation into ethanol). Two levels for hydrolysis were
considered: current technology (low yield, low solids loading) and a second level,
potentially available in 2015 (higher yields and solids loading, lower investment and
lower enzyme cost). In both scenarios steam explosion is the pretreatment method, but in
the 2015 technology scenario it is followed by an alkaline delignification step, which
leads to higher yields on the subsequent enzymatic hydrolysis step due to removal of
90
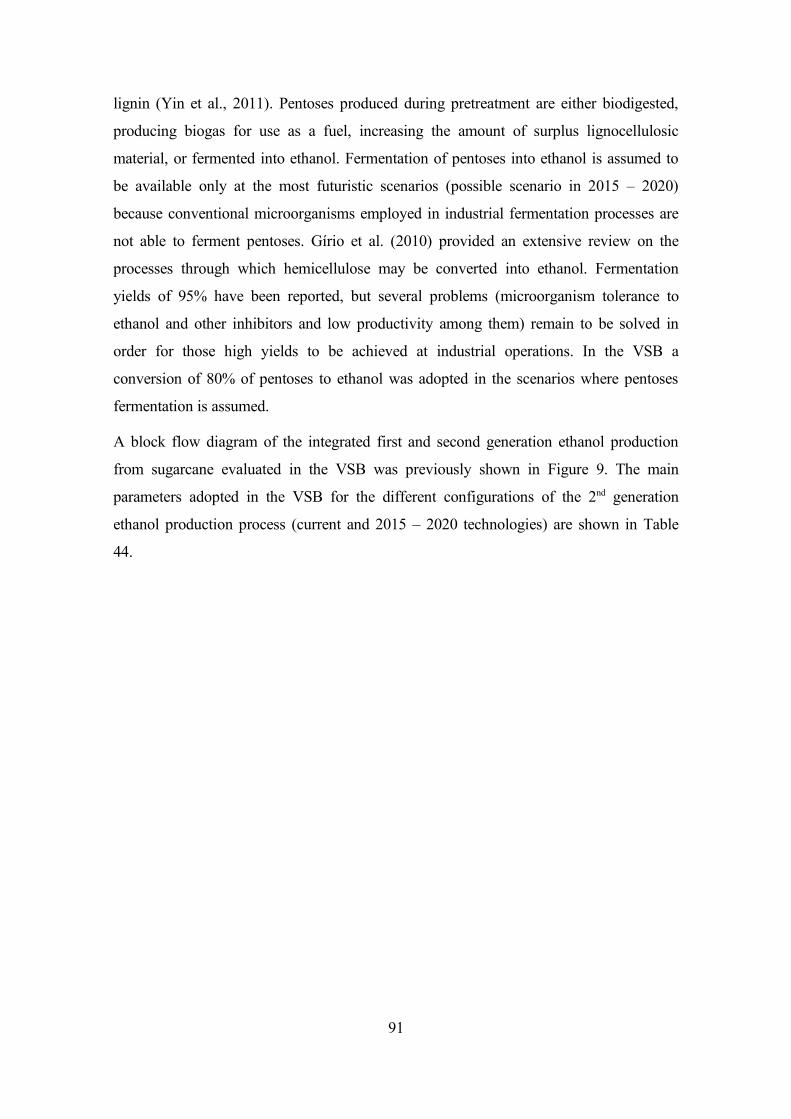
lignin (Yin et al., 2011). Pentoses produced during pretreatment are either biodigested,
producing biogas for use as a fuel, increasing the amount of surplus lignocellulosic
material, or fermented into ethanol. Fermentation of pentoses into ethanol is assumed to
be available only at the most futuristic scenarios (possible scenario in 2015 – 2020)
because conventional microorganisms employed in industrial fermentation processes are
not able to ferment pentoses. Gírio et al. (2010) provided an extensive review on the
processes through which hemicellulose may be converted into ethanol. Fermentation
yields of 95% have been reported, but several problems (microorganism tolerance to
ethanol and other inhibitors and low productivity among them) remain to be solved in
order for those high yields to be achieved at industrial operations. In the VSB a
conversion of 80% of pentoses to ethanol was adopted in the scenarios where pentoses
fermentation is assumed.
A block flow diagram of the integrated first and second generation ethanol production
from sugarcane evaluated in the VSB was previously shown in Figure 9. The main
parameters adopted in the VSB for the different configurations of the 2nd generation
ethanol production process (current and 2015 – 2020 technologies) are shown in Table
44.
91
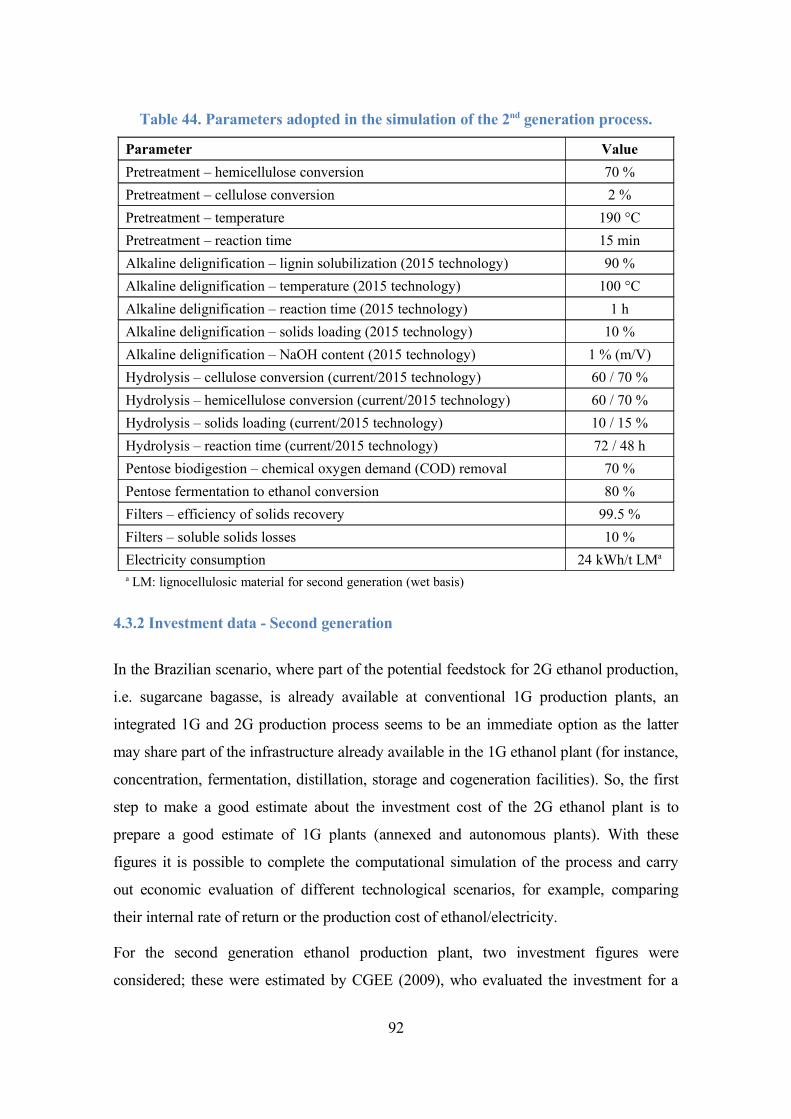
Table 44. Parameters adopted in the simulation of the 2nd generation process.
Parameter Value
Pretreatment – hemicellulose conversion 70 %
Pretreatment – cellulose conversion 2 %
Pretreatment – temperature 190 °C
Pretreatment – reaction time 15 min
Alkaline delignification – lignin solubilization (2015 technology) 90 %
Alkaline delignification – temperature (2015 technology) 100 °C
Alkaline delignification – reaction time (2015 technology) 1 h
Alkaline delignification – solids loading (2015 technology) 10 %
Alkaline delignification – NaOH content (2015 technology) 1 % (m/V)
Hydrolysis – cellulose conversion (current/2015 technology) 60 / 70 %
Hydrolysis – hemicellulose conversion (current/2015 technology) 60 / 70 %
Hydrolysis – solids loading (current/2015 technology) 10 / 15 %
Hydrolysis – reaction time (current/2015 technology) 72 / 48 h
Pentose biodigestion – chemical oxygen demand (COD) removal 70 %
Pentose fermentation to ethanol conversion 80 %
Filters – efficiency of solids recovery 99.5 %
Filters – soluble solids losses 10 %
Electricity consumption 24 kWh/t LMa
a LM: lignocellulosic material for second generation (wet basis)
4.3.2 Investment data - Second generation
In the Brazilian scenario, where part of the potential feedstock for 2G ethanol production,
i.e. sugarcane bagasse, is already available at conventional 1G production plants, an
integrated 1G and 2G production process seems to be an immediate option as the latter
may share part of the infrastructure already available in the 1G ethanol plant (for instance,
concentration, fermentation, distillation, storage and cogeneration facilities). So, the first
step to make a good estimate about the investment cost of the 2G ethanol plant is to
prepare a good estimate of 1G plants (annexed and autonomous plants). With these
figures it is possible to complete the computational simulation of the process and carry
out economic evaluation of different technological scenarios, for example, comparing
their internal rate of return or the production cost of ethanol/electricity.
For the second generation ethanol production plant, two investment figures were
considered; these were estimated by CGEE (2009), who evaluated the investment for a
92
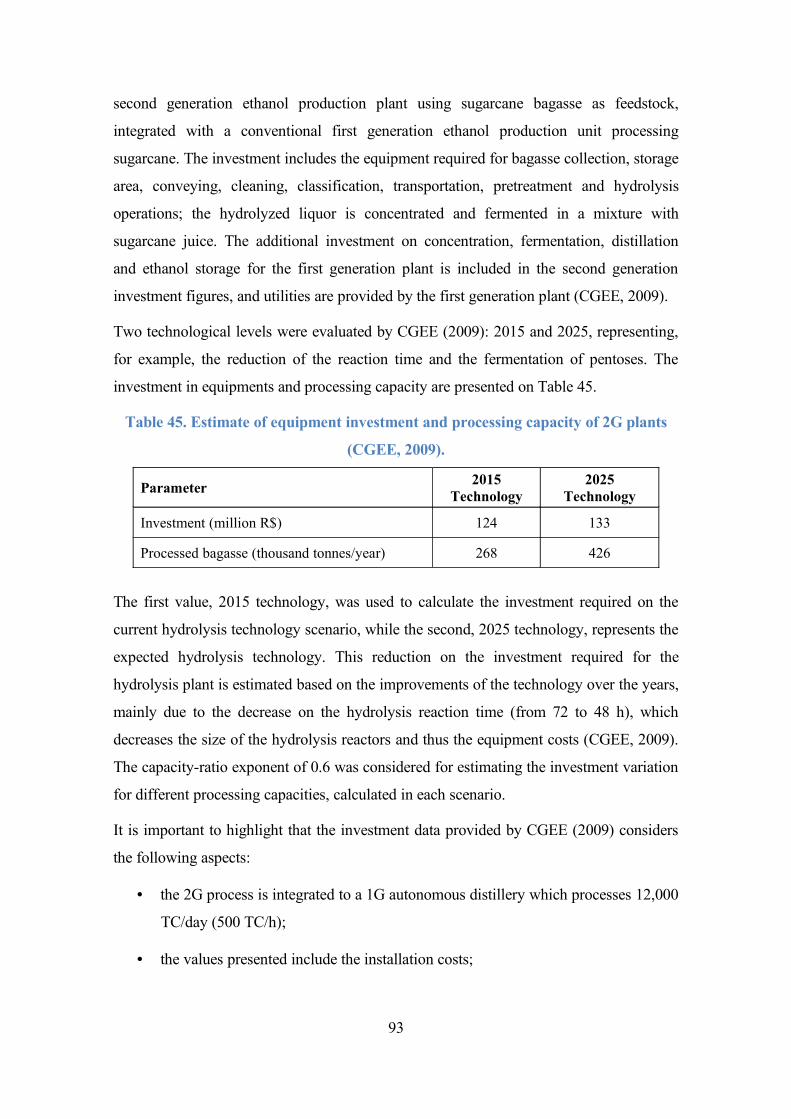
second generation ethanol production plant using sugarcane bagasse as feedstock,
integrated with a conventional first generation ethanol production unit processing
sugarcane. The investment includes the equipment required for bagasse collection, storage
area, conveying, cleaning, classification, transportation, pretreatment and hydrolysis
operations; the hydrolyzed liquor is concentrated and fermented in a mixture with
sugarcane juice. The additional investment on concentration, fermentation, distillation
and ethanol storage for the first generation plant is included in the second generation
investment figures, and utilities are provided by the first generation plant (CGEE, 2009).
Two technological levels were evaluated by CGEE (2009): 2015 and 2025, representing,
for example, the reduction of the reaction time and the fermentation of pentoses. The
investment in equipments and processing capacity are presented on Table 45.
Table 45. Estimate of equipment investment and processing capacity of 2G plants
(CGEE, 2009).
Parameter2015
Technology2025
Technology
Investment (million R$) 124 133
Processed bagasse (thousand tonnes/year) 268 426
The first value, 2015 technology, was used to calculate the investment required on the
current hydrolysis technology scenario, while the second, 2025 technology, represents the
expected hydrolysis technology. This reduction on the investment required for the
hydrolysis plant is estimated based on the improvements of the technology over the years,
mainly due to the decrease on the hydrolysis reaction time (from 72 to 48 h), which
decreases the size of the hydrolysis reactors and thus the equipment costs (CGEE, 2009).
The capacity-ratio exponent of 0.6 was considered for estimating the investment variation
for different processing capacities, calculated in each scenario.
It is important to highlight that the investment data provided by CGEE (2009) considers
the following aspects:
• the 2G process is integrated to a 1G autonomous distillery which processes 12,000
TC/day (500 TC/h);
• the values presented include the installation costs;
93

• the 2G unit is composed by: a system to collect, store and transport the bagasse,
mineral impurities removal, material classification, pretreatment and hydrolysis;
• separated hydrolysis and fermentation;
• utilities are provided by the 1G facility;
• enzymes are purchased from a supplier (in-house production is not considered);
• the calculated investment for the 2G plant takes into account the necessary
investment to increase the capacity of some areas of the 1G plant, for example:
fermentation, distillation, dehydration, vinasse treatment and ethanol storage.
4.3.3 Integrated first and second generation
The second generation ethanol production process was evaluated in an integrated process
with an optimized first generation autonomous distillery (90 bar boilers, adsorption on
molecular sieves, juice concentration on multiple effect evaporators, reduced steam
consumption, recovery of 50% of sugarcane trash, electric drivers, condensing-extracting
steam turbines), processing 2 million tons of sugarcane and 50% of the trash produced in
the field, during 167 days/year. The scenarios evaluated are illustrated in Table 46.
Table 46. Scenarios evaluated in the integrated first and second generation ethanol
production from sugarcane.
Process 1 2 3 4
Optimized 1st generation X X X X
“Current” 2nd generation technology X
“Future” 2nd generation technology X X
Pentoses biodigestion X X
Pentoses fermentation X
Simplified schemes illustrating the fraction of lignocellulosic material destined for
cogeneration or second generation ethanol production, energy and ethanol produced in the
four scenarios are shown in Figure 29.
94
Figure 29. Simplified scheme illustrating lignocellulosic material use, energy and
ethanol production in scenarios 1 through 4.
95
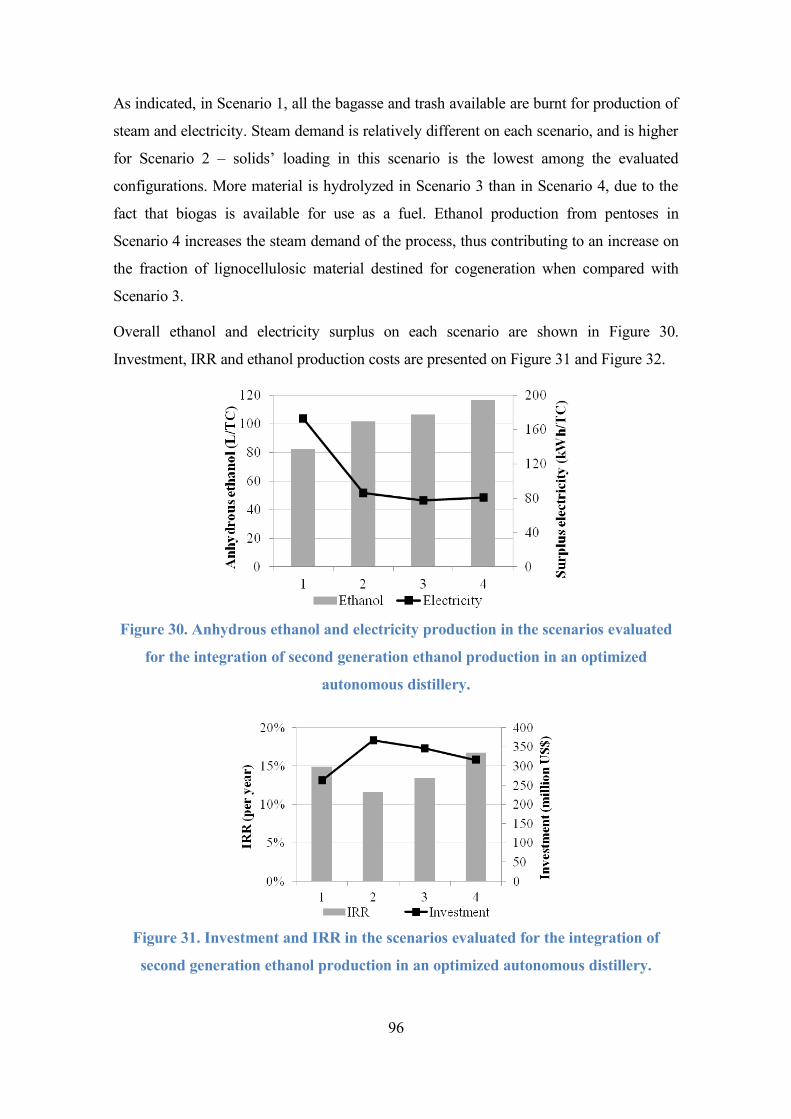
As indicated, in Scenario 1, all the bagasse and trash available are burnt for production of
steam and electricity. Steam demand is relatively different on each scenario, and is higher
for Scenario 2 – solids’ loading in this scenario is the lowest among the evaluated
configurations. More material is hydrolyzed in Scenario 3 than in Scenario 4, due to the
fact that biogas is available for use as a fuel. Ethanol production from pentoses in
Scenario 4 increases the steam demand of the process, thus contributing to an increase on
the fraction of lignocellulosic material destined for cogeneration when compared with
Scenario 3.
Overall ethanol and electricity surplus on each scenario are shown in Figure 30.
Investment, IRR and ethanol production costs are presented on Figure 31 and Figure 32.
Figure 30. Anhydrous ethanol and electricity production in the scenarios evaluated
for the integration of second generation ethanol production in an optimized
autonomous distillery.
Figure 31. Investment and IRR in the scenarios evaluated for the integration of
second generation ethanol production in an optimized autonomous distillery.
96
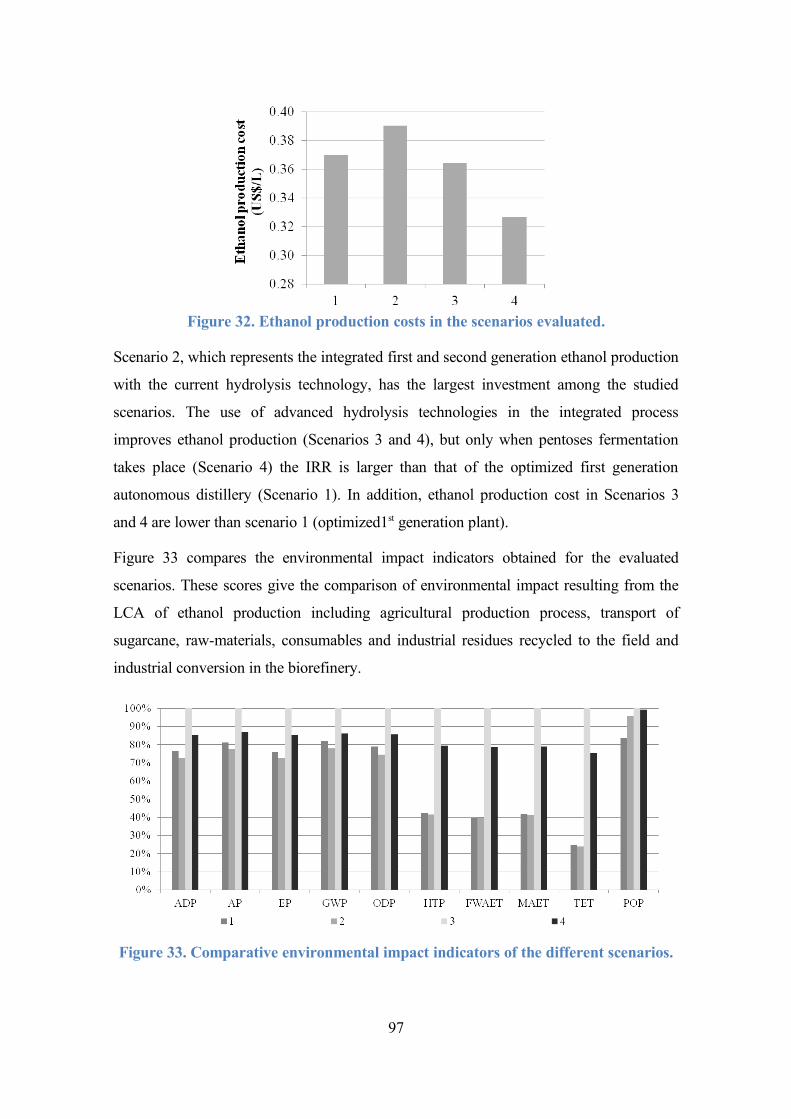
Figure 32. Ethanol production costs in the scenarios evaluated.
Scenario 2, which represents the integrated first and second generation ethanol production
with the current hydrolysis technology, has the largest investment among the studied
scenarios. The use of advanced hydrolysis technologies in the integrated process
improves ethanol production (Scenarios 3 and 4), but only when pentoses fermentation
takes place (Scenario 4) the IRR is larger than that of the optimized first generation
autonomous distillery (Scenario 1). In addition, ethanol production cost in Scenarios 3
and 4 are lower than scenario 1 (optimized1st generation plant).
Figure 33 compares the environmental impact indicators obtained for the evaluated
scenarios. These scores give the comparison of environmental impact resulting from the
LCA of ethanol production including agricultural production process, transport of
sugarcane, raw-materials, consumables and industrial residues recycled to the field and
industrial conversion in the biorefinery.
Figure 33. Comparative environmental impact indicators of the different scenarios.
97
Results show that integrating first and second generation processes using current
technology for second generation ethanol production and pentoses biodigestion (Scenario
2) presents the best environmental indicators for most categories among all the evaluated
alternatives. Higher environmental impacts presented in the future second generation
ethanol scenarios (3 and 4) are mainly related to high sodium hydroxide consumption for
alkaline delignification prior to hydrolysis. These results show that technological
improvements are necessary in this process for improving environmental sustainability of
the future second generation ethanol production; if sodium hydroxide recycling or other
methods of delignification using environmental friendly solvents are employed, the
advanced second generation ethanol production considered in this study will present
lower environmental impacts. It is also important to highlight that the database used in
this assessment was updated with Brazilian sodium hydroxide production data, which
presents environmental impacts remarkably lower than European and American
production processes according to preliminary update of these life cycle inventories
performed at CTBE.
A sensitivity analysis was performed to assess the impact of selected environmental
impact categories as well. In this analysis Scenario 4 was selected because it presented the
best results in the economic evaluation. Three important environmental impact categories
were selected: Global Warming Potential (GWP), Eutrophication Potential (EP) and
Human Toxicity Potential (HTP) (Figure 34). Quantity variation in five important process
inputs were evaluated: sodium hydroxide, zeolite and equipment weight (steel) for the
ethanol industrial process; and nitrogen fertilizer and diesel used in the agricultural
operations for sugarcane growing and harvesting. As expected by the results already
discussed in this study, sodium hydroxide is the most impacting parameter in GWP, EP
and HTP. Nitrogen fertilizers and diesel used in the agricultural operations also play an
important role in the three environmental impacts evaluated while zeolite and equipment
used in the industrial process have minor influence in the ethanol production
environmental impacts. These conclusions were confirmed by the sensitivity analysis
performed (Figure 34).
Based on the sensitivity analysis, scenarios 3 and 4 were evaluated considering that all the
sodium hydroxide is recovered in the industrial production process (no sodium hydroxide
is considered as input to the process; however, no addition processes for sodium
hydroxide recovery is included in the inventory). Results indicate that ethanol production
98

in scenario 4 presents the lowest environmental impacts among the evaluated scenarios, if
no sodium hydroxide is consumed in this process.
Figure 34. Sensitivity analyses for Global Warming Potential (GWP) (a),
Eutrophication Potential (EP) (b) and Human Toxicity Potential (HTP) (c) for
scenario 4 (integrated first and second generation ethanol production from
sugarcane, using advanced hydrolysis technologies and pentoses fermentation).
4.3.4 Stand-alone second generation
Ethanol production from lignocellulosic materials is often conceived considering
independent, stand-alone production plants; the VSB analyzed this configuration of the
second generation ethanol production process from sugarcane bagasse and trash as well.
This plant receives feedstock (surplus bagasse and trash) from an optimized first
99

generation autonomous distillery, which produces only the amount of steam required to
run the process (back-pressure steam turbines are employed). In order to evaluate this
configuration, different scenarios were simulated; their characteristics are shown in Table
47.
Table 47. Scenarios evaluated in the integrated first and second generation ethanol
production from sugarcane.
Process 1G 1G-LM 2G 1G2G
Optimized 1st generation X X X
Sell of surplus lignocellulosic material X
“Future” 2nd generation technology X X
Pentoses fermentation X X
An additional scenario (1G+2G) was evaluated to represent the real stand-alone plant,
including the first generation plant producing the feedstock and the stand alone second
generation plant. This scenario represents separate first and second generation plants and
is compared with the integrated first and second generation process (1G2G) described in
the previous section (scenario 4).
Results for ethanol and electricity production are shown in Figure 35.
Figure 35. Ethanol and electricity production in the scenarios evaluated to compare
stand-alone 2nd generation (2G), the equivalent stand-alone plant including the first
generation producing lignocellulosic material (1G + 2G) and the integrated 1st and
2nd generation (1G2G) plant.
The equivalent stand-alone plant (1G+2G) has about the same ethanol and electricity
outputs as the integrated first and second generation process (1G2G). The first generation
100
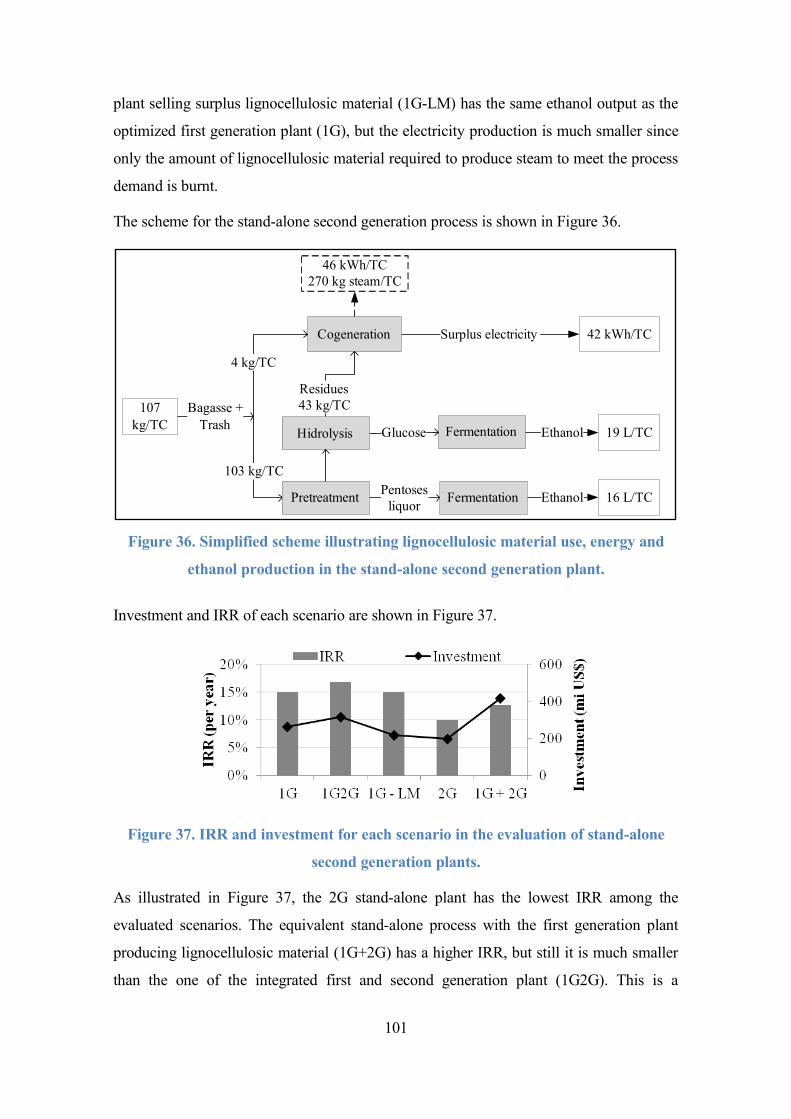
plant selling surplus lignocellulosic material (1G-LM) has the same ethanol output as the
optimized first generation plant (1G), but the electricity production is much smaller since
only the amount of lignocellulosic material required to produce steam to meet the process
demand is burnt.
The scheme for the stand-alone second generation process is shown in Figure 36.
Cogeneration
103 kg/TC
Bagasse + Trash
Pretreatment
Surplus electricity
FermentationPentoses
liquor
Hidrolysis
Residues43 kg/TC
42 kWh/TC
107kg/TC
4 kg/TC
FermentationGlucose Ethanol 19 L/TC
Ethanol 16 L/TC
46 kWh/TC270 kg steam/TC
Figure 36. Simplified scheme illustrating lignocellulosic material use, energy and
ethanol production in the stand-alone second generation plant.
Investment and IRR of each scenario are shown in Figure 37.
Figure 37. IRR and investment for each scenario in the evaluation of stand-alone
second generation plants.
As illustrated in Figure 37, the 2G stand-alone plant has the lowest IRR among the
evaluated scenarios. The equivalent stand-alone process with the first generation plant
producing lignocellulosic material (1G+2G) has a higher IRR, but still it is much smaller
than the one of the integrated first and second generation plant (1G2G). This is a
101
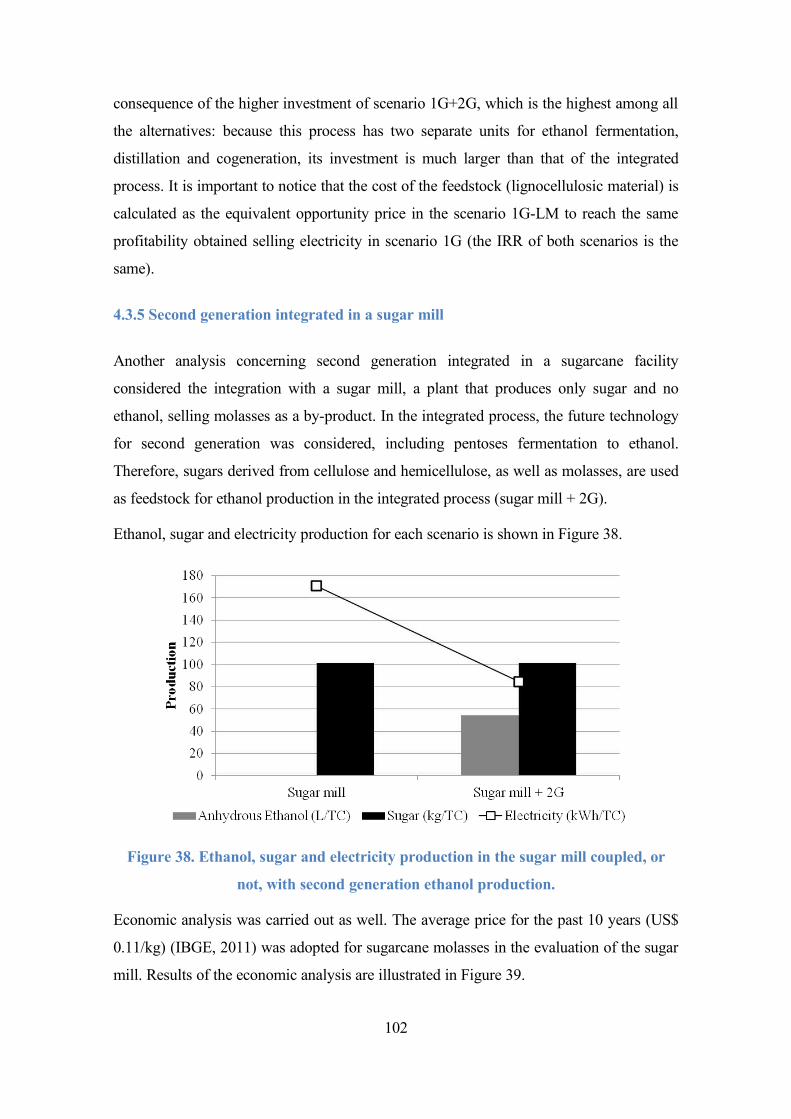
consequence of the higher investment of scenario 1G+2G, which is the highest among all
the alternatives: because this process has two separate units for ethanol fermentation,
distillation and cogeneration, its investment is much larger than that of the integrated
process. It is important to notice that the cost of the feedstock (lignocellulosic material) is
calculated as the equivalent opportunity price in the scenario 1G-LM to reach the same
profitability obtained selling electricity in scenario 1G (the IRR of both scenarios is the
same).
4.3.5 Second generation integrated in a sugar mill
Another analysis concerning second generation integrated in a sugarcane facility
considered the integration with a sugar mill, a plant that produces only sugar and no
ethanol, selling molasses as a by-product. In the integrated process, the future technology
for second generation was considered, including pentoses fermentation to ethanol.
Therefore, sugars derived from cellulose and hemicellulose, as well as molasses, are used
as feedstock for ethanol production in the integrated process (sugar mill + 2G).
Ethanol, sugar and electricity production for each scenario is shown in Figure 38.
Figure 38. Ethanol, sugar and electricity production in the sugar mill coupled, or
not, with second generation ethanol production.
Economic analysis was carried out as well. The average price for the past 10 years (US$
0.11/kg) (IBGE, 2011) was adopted for sugarcane molasses in the evaluation of the sugar
mill. Results of the economic analysis are illustrated in Figure 39.
102

Figure 39. IRR and investment for the sugar mill and the sugar mill coupled with
second generation ethanol production.
As shown in Figure 39, the IRR of the sugar mill increases significantly (from around 16
to 18.5% per year) when a second generation plant is included, producing ethanol from
the lignocellulosic fraction of the sugarcane as well as from sugar molasses.
4.4 Sugarchemistry route – butanol production
The sugarchemistry route was first developed in the VSB through the creation of a
product portfolio, based on three major references in the literature: the Brazilian
“Química Verde no Brasil” (CGEE, 2010), the Dutch Brew Project (Patel, 2006) and a
report by the USDOE (PNNL and NREL, 2004). Chemicals derived from sugars are
ranked in each of these references according to different categories, such as number of
patents, technology level, feedstock type and costs, potential of replacing fossil derived
chemicals, etc. Among the most important chemicals listed in these references are the
acetic, lactic, polylactic, itaconic, glutamic, succinic and citric acid, 1,3-propanediol,
sorbitol, and butanol.
A first configuration of the sugarchemistry route was developed in the VSB, considering
butanol production from sugarcane. Different scenarios were evaluated, considering
butanol production from sugarcane juice or from pentoses liquor obtained after
lignocellulosic material pretreatment, using either regular (wild strain) or mutant
microorganisms (with increased butanol yield) in a conventional batch fermentation
103

process. Along with butanol, acetone and ethanol are also obtained during fermentation
(so called ABE fermentation). The scenarios evaluated are indicated in Table 48.
Table 48. Description of the scenarios evaluated for butanol production in the VSB.
Scenario Description
1G E50Optimized first generation annexed plant with 50% of the juice diverted to ethanol production, 50% to sugar production
1G E75Optimized first generation annexed plant with 75% of the juice diverted to ethanol production, 25% to sugar production
1G Butanol(RS)Optimized first generation annexed plant with 50% of the juice diverted to ethanol production, 25% to sugar production and 25% to butanol production – regular microorganism strain
1G Butanol(MS)
Optimized first generation annexed plant with 50% of the juice diverted to ethanol production, 25% to sugar production and 25% to butanol production – mutant microorganism strain (improved butanol yield)
1G2GIntegrated first (E50) and second generation with pentoses biodigestion (current hydrolysis technology)
1G2G Butanol(RS)Integrated first (E50) and second generation with butanol production from pentoses using regular microorganism strain
1G2G Butanol(MS)Integrated first (E50) and second generation with butanol production from pentoses using mutant microorganism strain (improved butanol yield)
Ethanol, sugar, electricity, butanol, and acetone productions were obtained in the VSB for
each scenario. Results are shown in Table 49.
104
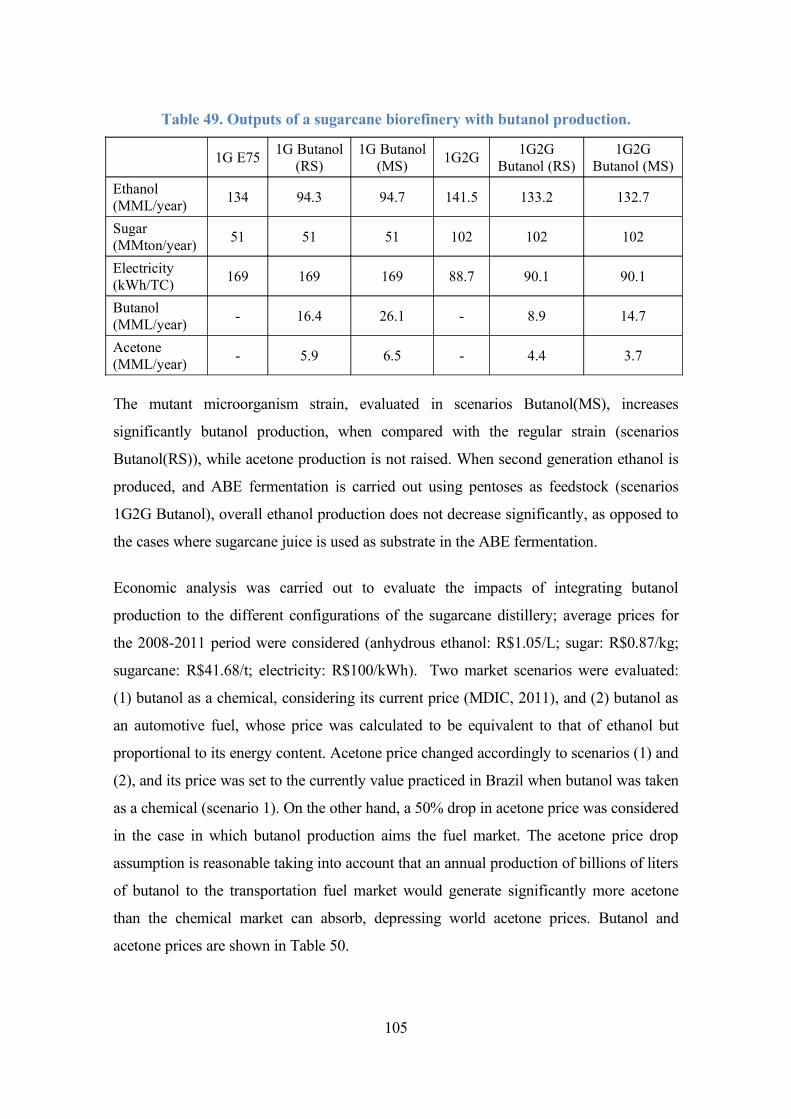
Table 49. Outputs of a sugarcane biorefinery with butanol production.
1G E751G Butanol
(RS)1G Butanol
(MS)1G2G
1G2G Butanol (RS)
1G2G Butanol (MS)
Ethanol (MML/year)
134 94.3 94.7 141.5 133.2 132.7
Sugar (MMton/year)
51 51 51 102 102 102
Electricity (kWh/TC)
169 169 169 88.7 90.1 90.1
Butanol (MML/year)
- 16.4 26.1 - 8.9 14.7
Acetone (MML/year)
- 5.9 6.5 - 4.4 3.7
The mutant microorganism strain, evaluated in scenarios Butanol(MS), increases
significantly butanol production, when compared with the regular strain (scenarios
Butanol(RS)), while acetone production is not raised. When second generation ethanol is
produced, and ABE fermentation is carried out using pentoses as feedstock (scenarios
1G2G Butanol), overall ethanol production does not decrease significantly, as opposed to
the cases where sugarcane juice is used as substrate in the ABE fermentation.
Economic analysis was carried out to evaluate the impacts of integrating butanol
production to the different configurations of the sugarcane distillery; average prices for
the 2008-2011 period were considered (anhydrous ethanol: R$1.05/L; sugar: R$0.87/kg;
sugarcane: R$41.68/t; electricity: R$100/kWh). Two market scenarios were evaluated:
(1) butanol as a chemical, considering its current price (MDIC, 2011), and (2) butanol as
an automotive fuel, whose price was calculated to be equivalent to that of ethanol but
proportional to its energy content. Acetone price changed accordingly to scenarios (1) and
(2), and its price was set to the currently value practiced in Brazil when butanol was taken
as a chemical (scenario 1). On the other hand, a 50% drop in acetone price was considered
in the case in which butanol production aims the fuel market. The acetone price drop
assumption is reasonable taking into account that an annual production of billions of liters
of butanol to the transportation fuel market would generate significantly more acetone
than the chemical market can absorb, depressing world acetone prices. Butanol and
acetone prices are shown in Table 50.
105
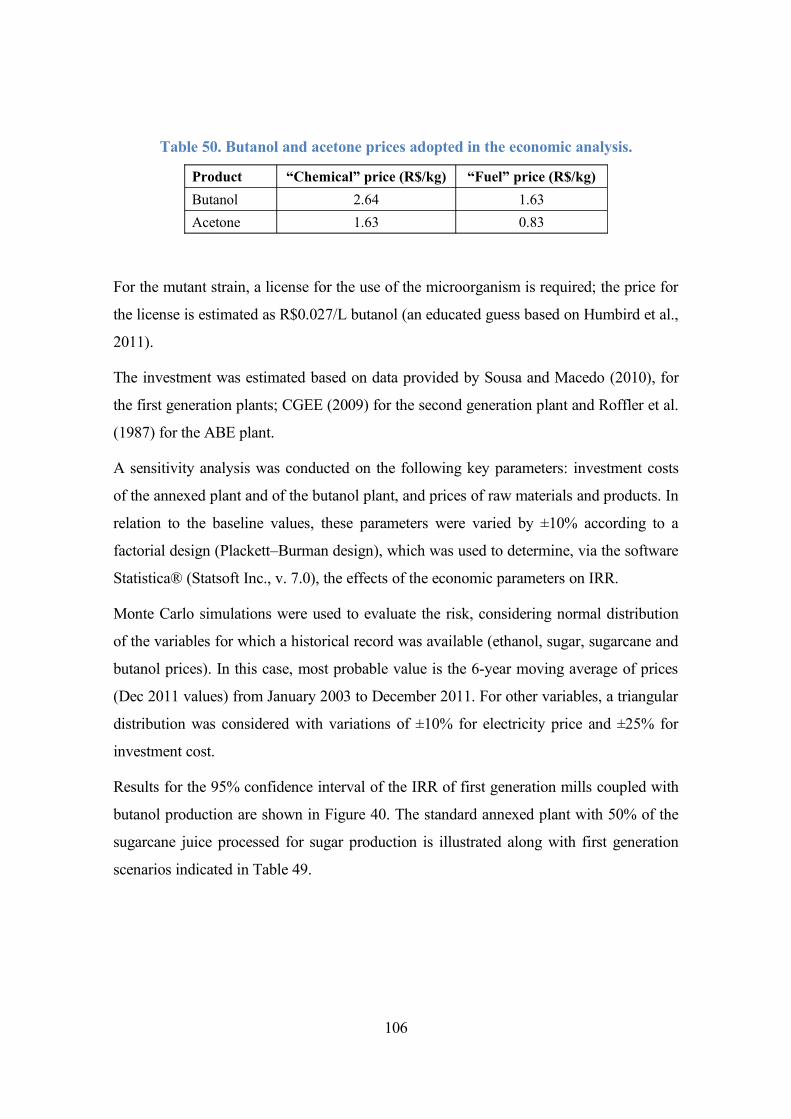
Table 50. Butanol and acetone prices adopted in the economic analysis.
Product “Chemical” price (R$/kg) “Fuel” price (R$/kg)
Butanol 2.64 1.63
Acetone 1.63 0.83
For the mutant strain, a license for the use of the microorganism is required; the price for
the license is estimated as R$0.027/L butanol (an educated guess based on Humbird et al.,
2011).
The investment was estimated based on data provided by Sousa and Macedo (2010), for
the first generation plants; CGEE (2009) for the second generation plant and Roffler et al.
(1987) for the ABE plant.
A sensitivity analysis was conducted on the following key parameters: investment costs
of the annexed plant and of the butanol plant, and prices of raw materials and products. In
relation to the baseline values, these parameters were varied by ±10% according to a
factorial design (Plackett–Burman design), which was used to determine, via the software
Statistica® (Statsoft Inc., v. 7.0), the effects of the economic parameters on IRR.
Monte Carlo simulations were used to evaluate the risk, considering normal distribution
of the variables for which a historical record was available (ethanol, sugar, sugarcane and
butanol prices). In this case, most probable value is the 6-year moving average of prices
(Dec 2011 values) from January 2003 to December 2011. For other variables, a triangular
distribution was considered with variations of ±10% for electricity price and ±25% for
investment cost.
Results for the 95% confidence interval of the IRR of first generation mills coupled with
butanol production are shown in Figure 40. The standard annexed plant with 50% of the
sugarcane juice processed for sugar production is illustrated along with first generation
scenarios indicated in Table 49.
106
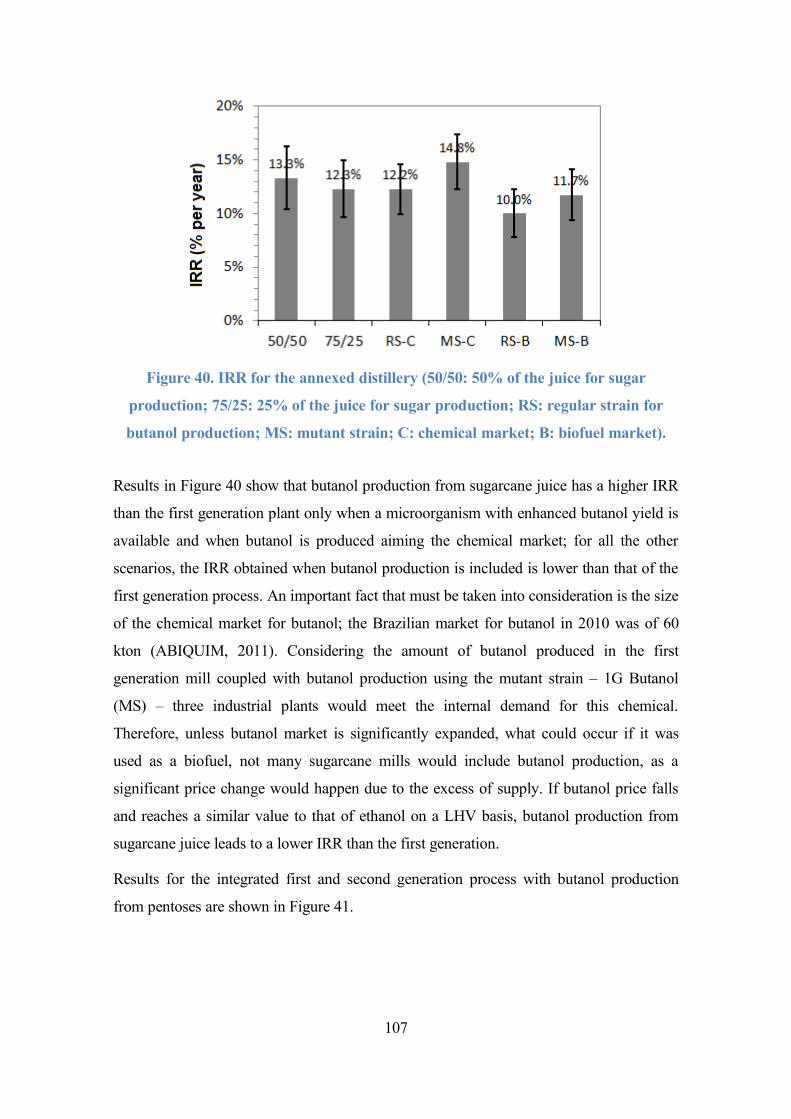
Figure 40. IRR for the annexed distillery (50/50: 50% of the juice for sugar
production; 75/25: 25% of the juice for sugar production; RS: regular strain for
butanol production; MS: mutant strain; C: chemical market; B: biofuel market).
Results in Figure 40 show that butanol production from sugarcane juice has a higher IRR
than the first generation plant only when a microorganism with enhanced butanol yield is
available and when butanol is produced aiming the chemical market; for all the other
scenarios, the IRR obtained when butanol production is included is lower than that of the
first generation process. An important fact that must be taken into consideration is the size
of the chemical market for butanol; the Brazilian market for butanol in 2010 was of 60
kton (ABIQUIM, 2011). Considering the amount of butanol produced in the first
generation mill coupled with butanol production using the mutant strain – 1G Butanol
(MS) – three industrial plants would meet the internal demand for this chemical.
Therefore, unless butanol market is significantly expanded, what could occur if it was
used as a biofuel, not many sugarcane mills would include butanol production, as a
significant price change would happen due to the excess of supply. If butanol price falls
and reaches a similar value to that of ethanol on a LHV basis, butanol production from
sugarcane juice leads to a lower IRR than the first generation.
Results for the integrated first and second generation process with butanol production
from pentoses are shown in Figure 41.
107
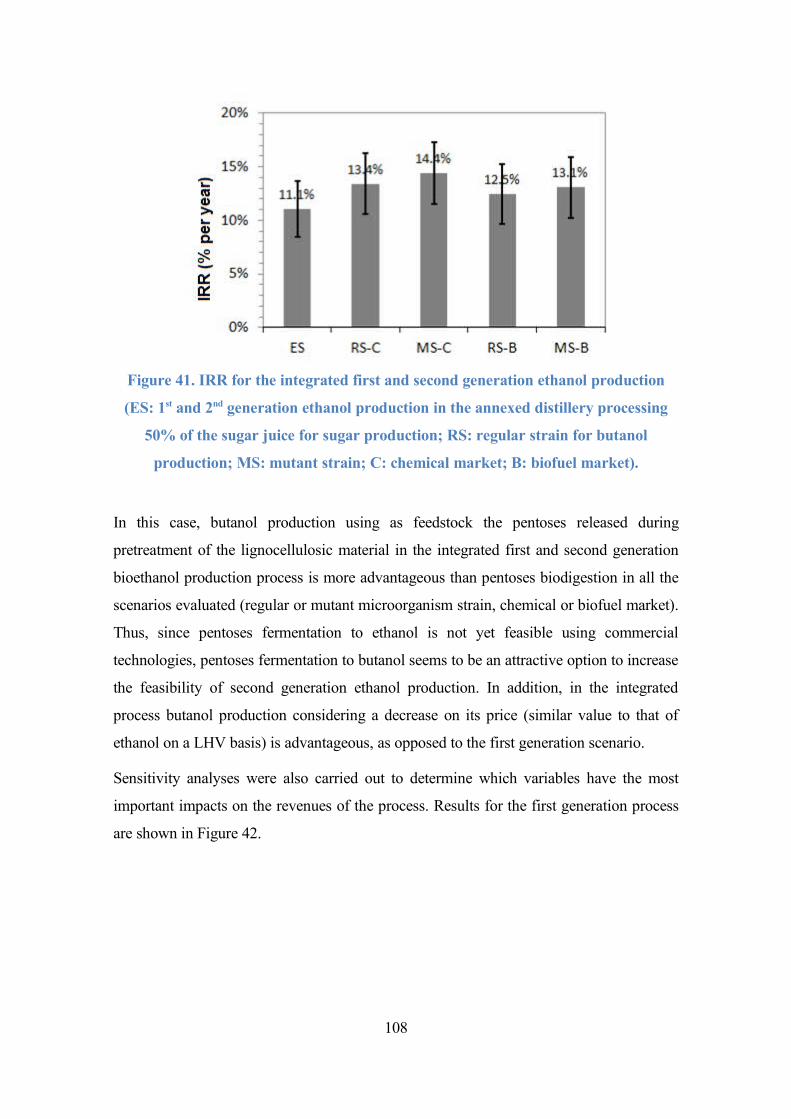
Figure 41. IRR for the integrated first and second generation ethanol production
(ES: 1st and 2nd generation ethanol production in the annexed distillery processing
50% of the sugar juice for sugar production; RS: regular strain for butanol
production; MS: mutant strain; C: chemical market; B: biofuel market).
In this case, butanol production using as feedstock the pentoses released during
pretreatment of the lignocellulosic material in the integrated first and second generation
bioethanol production process is more advantageous than pentoses biodigestion in all the
scenarios evaluated (regular or mutant microorganism strain, chemical or biofuel market).
Thus, since pentoses fermentation to ethanol is not yet feasible using commercial
technologies, pentoses fermentation to butanol seems to be an attractive option to increase
the feasibility of second generation ethanol production. In addition, in the integrated
process butanol production considering a decrease on its price (similar value to that of
ethanol on a LHV basis) is advantageous, as opposed to the first generation scenario.
Sensitivity analyses were also carried out to determine which variables have the most
important impacts on the revenues of the process. Results for the first generation process
are shown in Figure 42.
108
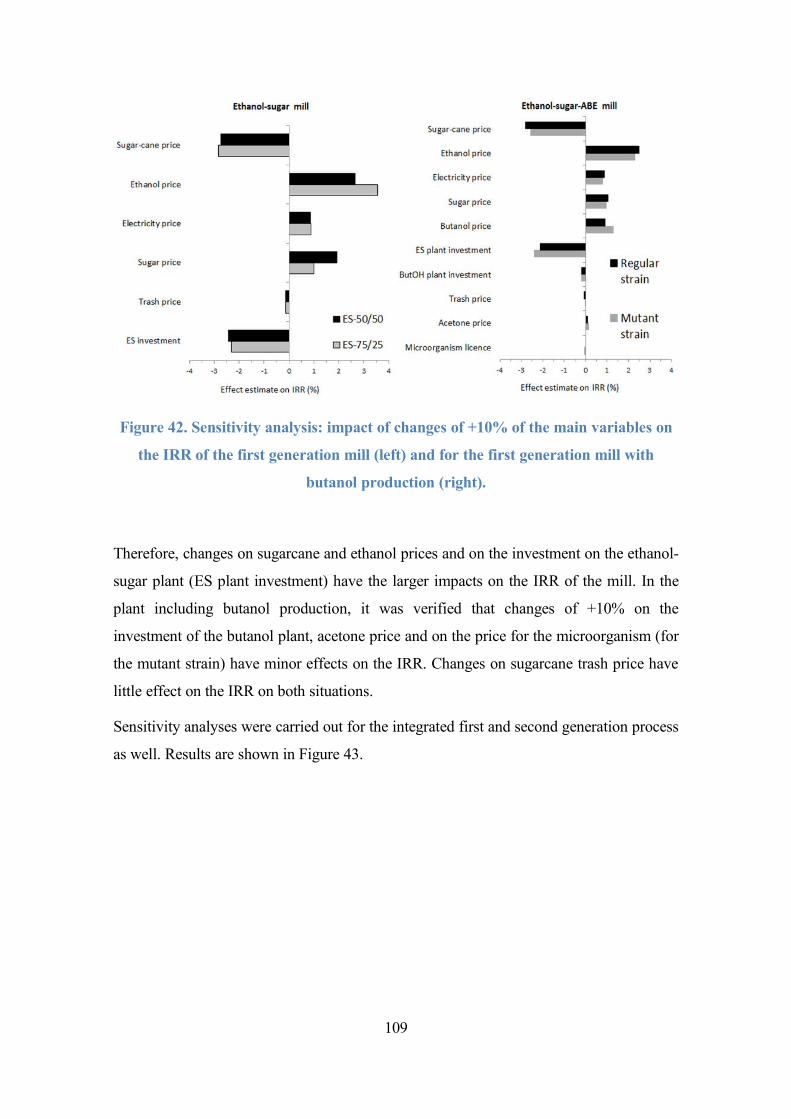
Figure 42. Sensitivity analysis: impact of changes of +10% of the main variables on
the IRR of the first generation mill (left) and for the first generation mill with
butanol production (right).
Therefore, changes on sugarcane and ethanol prices and on the investment on the ethanol-
sugar plant (ES plant investment) have the larger impacts on the IRR of the mill. In the
plant including butanol production, it was verified that changes of +10% on the
investment of the butanol plant, acetone price and on the price for the microorganism (for
the mutant strain) have minor effects on the IRR. Changes on sugarcane trash price have
little effect on the IRR on both situations.
Sensitivity analyses were carried out for the integrated first and second generation process
as well. Results are shown in Figure 43.
109

Figure 43. Sensitivity analysis: impact of changes of +10% of the main variables on
the IRR of the integrated first and second generation plant (left) and for the
integrated process with butanol production (right).
The same trends observed for the first generation mill can be noticed in Figure 43:
sugarcane, ethanol and investment on the ethanol-sugar plant have the most significant
impacts on the IRR. In this case, however, sugar price plays a more important role, since
sugar production is larger in these scenarios (when compared with the E75 scenario).
Enzyme prices have little effect on the IRR, in addition to sugarcane trash, in both
scenarios (with and without butanol production).
110
5. Final remarks
5.1 Obtained results
Focusing on the PAT’s macrogoals, the most important results obtained up to 2011 in the
construction of the VSB are listed below.
(1) Construction of the first generation (1G) VSB, with the following highlights:
• technical, economic and environmental assessment of the autonomous plants
(producing only ethanol and electricity) and annexed plants (producing ethanol,
electricity and sugar). It was considered in this analysis a standard configuration
representing the majority of 1G plants in Brazil and an optimized one using trash
(transported from the field to the plant), reducing steam demand and using a more
efficient cogeneration system, to produce steam and electricity;
• assessment of technical, economic and environmental impacts of annexed
distilleries designed with flexibility for sugar and ethanol production;
• assessment of technical, economic and environmental impacts of different electric
energy cogeneration systems;
• validation of the results of the simulation of 1G sugar and ethanol production,
with data obtained in an operating sugarcane plant in the state of São Paulo –
Brazil;
• preliminary technical and economic assessment of different scenarios of operation
extension in sugarcane plants using sweet sorghum as an additional feedstock;
• beginning of the consolidation of the energy optimization of 1G sugarcane plants;
• beginning of the assessment about the use of other feedstock, for the extension of
1G sugarcane plants operation;
• beginning of the assessment of vinasse biodigestion incorporation in 1G plants.
111
(2) Construction of second generation (2G) VSB, with the following highlights:
• preliminary technical, economic and environmental assessment of present and
future scenarios for the production of 2G ethanol from sugarcane;
• technical, economic and environmental assessment of independent 2G ethanol
plants, compared with the ones integrated with 1G plants;
• technical, economic and environmental assessment of 2G ethanol plants integrated
to autonomous 1G sugar plants;
• beginning of the construction (together with CTBE’s Industrial Program) of the
conceptual design of the “basic CTBE’s route” for the production of second
generation ethanol, developed to be use as base for comparison with other
technologies in technical, economic and environmental assessments.
(3) Construction of the VSB for other routes, with the following highlights:
• preliminary technical and economic assessment of the butanol production from
sugarcane (through the sugarchemistry route);
• initial planning of the alcoholchemistry route in the VSB;
• initial planning of the thermochemical route in the VSB.
(4) Construction of the VSB – Agricultural phase, with the following highlights:
• construction of a computational tool, incorporating operation models of the
agricultural phase of the sugarcane production for technical, economic and
environmental assessment; integration with the other operations in the sugarcane
production chain: sugarcane transport, industrial processing and use of the
biorefinery products;
• technical, economic and environmental assessment of several agricultural
scenarios of sugarcane production, using the developed tool.
(5) Sustainability indicators, with the following highlights:
• database adaptation for the Life Cycle Inventory of the main inputs in the
sugarcane production chain, considering the Brazilian conditions;
112

• improvement of the methodologies employed for the economic and environmental
assessments;
• introduction of the Input-Output methodology for evaluation of economic,
environmental and social impacts in the VSB;
• beginning of the construction of a computational tool for the assessment of the
commercialization and use of the main products in the sugarcane production
chain.
(6) Software integration and Databases construction, with the following highlights:
• integration of the simulation tools constructed to assess the different phases in the
sugarcane production chain;
• beginning of the construction of a database with the technical parameters for a real
sugarcane industrial plant;
• collaboration with equipment producers and engineering companies, to start the
construction of a database to evaluate the required investments for different
industrial plants in the biorefinery concept.
(7) Publications:
• Dias, M. O. S., Cunha, M. P., Jesus, C. D. F., Scandiffio, M. I. G., Rossell, C. E.
V., Maciel Filho, R., Bonomi, A.. Simulation of ethanol production from
sugarcane in Brazil: economic study of an autonomous distillery. Computer Aided
Chemical Engineering, 28, 733-738, 2010.
• Dias, M. O. S., Cunha, M. P., Jesus, C. D. F., Rocha, G. J. M., Pradella, J. G. C.,
Rossell, C. E. V., Maciel Filho, R., Bonomi, A.. Second generation ethanol in
Brazil: can it compete with electricity production? Bioresource Technology 102,
8964-8971, 2011.
• Dias, M. O. S., Cunha, M. P., Maciel Filho, R., Bonomi, A., Jesus, C. D. F.,
Rossell, C. E. V.. Simulation of integrated first and second generation bioethanol
production from sugarcane: comparison between different biomass pretreatment
methods. Journal of Industrial Microbiology & Biotechnology, 38, 955-966, 2011.
113

• Cavalett, O., Cunha, M. P., Junqueira, T. L., Dias, M. O. S., Jesus, C. D. F.,
Mantelatto, P. E., Cardoso, T. F., Franco, H. C. J., Maciel Filho, R., Bonomi, A..
Environmental and economic assessment of bioethanol, sugar and bioelectricity
production from sugarcane. Chemical Engineering Transactions, 25, 1007-1012,
2011.
• Junqueira, T. L., Dias, M. O. S., Jesus, C. D. F., Mantelatto, P. E., Cunha, M. P.,
Cavalett, O., Maciel Filho, R., Rossell, C. E. V., Bonomi, A.. Simulation and
evaluation of autonomous and annexed sugarcane distilleries. Chemical
Engineering Transactions, 25, 941-946, 2011.
• Dias, M. O. S., Junqueira, T. L., Jesus, C. D. F., Cavalett, O., Cunha, M. P.,
Mantelatto, P. E., Maciel Filho, R., Bonomi, A.. The Virtual Sugarcane
Biorefinery (VSB) – An Innovative Tool to Evaluate Sugarcane Production and
Processing. In: XIX International Symposium on Alcohol Fuels, 2011.
• Galdos, M., Cavalett, O., Seabra, J., Bonomi, A.. Trends in global warming and
human health impacts related to Brazilian sugarcane ethanol production
considering black carbon emissions. In: XIX International Symposium on Alcohol
Fuels, 2011.
• Dias, M.O.S., Junqueira, T.L., Cavalett, O., Cunha, M.P., Jesus, C.D.F., Rossell,
C.E.V., Maciel Filho, R., Bonomi, A.. Integrated versus stand-alone second
generation ethanol production from sugarcane bagasse and trash, Bioresource
Technology, 103, 152-161, 2012.
• Cavalett, O., Junqueira, T. L., Dias, M. O. S., Jesus, C. D. F., Mantelatto, P. E.,
Cunha, M. P., Franco, H. C. J., Cardoso, T. F., Maciel Filho, R., Rossell, C. E. V.,
Bonomi, A.. Environmental and economic assessment of sugarcane first
generation biorefineries in Brazil. Clean Technologies and Environmental Policy
14, 399-410, 2012.
5.2 Planned activities for 2012
The most important steps to be pursued in 2012 for the construction of the VSB are the
following:
114

• validation of the results of the simulation of 1G industrial operation, with data
obtained in several operating sugarcane plants, representing different
technological stages;
• simulation of 2G alternatives using parameters obtained through the conceptual
design and data from CTBE’s pilot plant;
• development of new VSB versions including simulation of new biorefinery
routes;
• validation of data, parameters and results of the computational tool for the
agricultural phase of the sugarcane production;
• introduction of the technical, economic and environmental assessment of different
logistic strategies for sugarcane trash collection and delivery to the biorefinery;
• improvement of methodologies for sustainability impacts evaluation;
• execution of the first stages of the projects to assess “good practices” in the
sugarcane production chain and the “megaexperiment” to assess experiments and
developments underway at CTBE and other partner Institutions.
5.3 Implementation of the network of institutions
The activities related to the constitution of the Network on the Mathematical Modeling
started with the identification of researchers developing relevant work in specific areas. In
order to do that a search for related works was carried out in the main Universities and
Research Institutes in Brazil. The starting point, of course, was to make use of the
knowledge of the contribution for science and technology trough the scientific papers and
research projects published and executed or in execution.
In this exercise more than three dozens of University’s representatives were contacted and
a workshop was organized. The Network was organized in sub-themes aiming to reflect
the need to elaborate more specific projects in subjects considered the necessary ones to
have an effective interdisciplinary working group. Six main sub-areas were identified.
After the workshop, the leaders of each area were identified and formally invited to act as
coordinators. Further action involved the invitation for each member to write a simplified
115
but comprehensive proposal, which was carefully analyzed either to avoid overlaps or to
guarantee that important areas would be properly covered.
Researchers from each sub-area presented drafts of projects and the proposals were
organized in such way that it served as a basis for the elaboration of an edictal or call for
projects to be submitted to CNPq. This was carried out and the exercise was quite
important to have an actual knowledge of the potential partners in the Network.
Further actions are under development to overcome possible delays due to the lack of
specific financial support through other ways to integrate the network members.
5.4 Good practices identification and assessment
The production chain and final use of sugarcane ethanol present recognized average
values for the majority of the parameters and indicators that can be considered for the
assessment of this industrial sector. Even so, behind these average values, many good
examples of technical, economic, environmental and social actions (good practices) can
be identified and, after a careful evaluation, introduced in the majority of the ethanol
plants. In 2012, CTBE, through the PAT, will plan a project aiming at identifying good
practices in the three major sectors of the sugarcane production chain: agricultural,
industrial and commercialization and usage sectors. After identifying those good
practices, their assessment will be performed, in order to evaluate their technical,
economic, environmental and social importance.
5.5 Megaexperiment
Annually, the Technological Assessment Program will coordinate a procedure for the
assessment of the ethanol technological development stage (1G, 2G, integrated 1G2G and
other routes within a biorefinery), considering ongoing developments at CTBE, as well as
developments by third parties (Megaexperiment). Although the megaexperiment will
assess the whole sugarcane production chain, including the variety of potential products,
the major focus of this coordinated effort will be the ethanol production. The
megaexperiment will assess process and operation alternatives derived from potential
alternatives based on specialist information and, experimental results obtained at
laboratory, pilot and demonstration scale.
116

6. References
ABIQUIM (Associação Brasileira da Indústria Química) (2011). Anuário da Indústria
Química Brasileira. São Paulo, ABIQUIM.
Alonso Pippo, W., Luengo, C.A., Alonsoamador Morales Alberteris, L., Garzone, P.,
Cornacchia, G., 2011. Energy recovery from sugarcane-trash in the light of 2nd
generation biofuels. Part 1: current situation and environmental aspects. Waste Biomass
Valor, 2, 1–16.
Alvira, P., Tomás-Pejó, E., Ballesteros, M., Negro, M.J., 2010. Pretreatment technologies
for an efficient bioethanol production process based on enzymatic hydrolysis: A review.
Bioresource Technology, 101, 4851-4861.
Bazico, 2010. Sugar [Açúcar] (in Portuguese). Available online at
<www.bazico.com.br/produto/com_acucar.htm>.
BNDES and CGEE (Coord.), 2008. Sugarcane bioethanol – energy for sustainable
development [Bioetanol de cana-de-açúcar – Energia para o Desenvolvimento
Sustentável] (in Portuguese), Rio de Janeiro: BNDES.
Camargo, C.A. (coord.), 1990. Energy conservation in the sugar and ethanol industry –
handbook of recommendations [Conservação de energia na indústria do açúcar e do
álcool – Manual de recomendações] (in Portuguese). São Paulo: IPT.
Cavalett, O., Junqueira, T.L., Dias, M.O.S., Jesus, C.D.F., Mantelatto, P.E., Cunha, M.P.,
Franco, H.C.J., Cardoso, T.F., Maciel Filho, R., Rossell, C.E.V., Bonomi, A., 2012.
Environmental and economic assessment of sugarcane first generation biorefineries in
Brazil. Clean Technologies and Environmental Policy, 14, 399-410.
CEPEA – Center for Advanced Studies on Applied Economics, 2011. Available online at
<http://www.cepea.esalq.usp.br>
117
CGEE, 2009. Bioethanol as a fuel: an opportunity for Brazil [Bioetanol combustível: uma
oportunidade para o Brasil] (in Portuguese). Campinas. Available online at
<www.cgee.org.br/atividades/redirect/5913>.
CGEE, 2010. Green chemistry in Brazil: 2010-2030 [Química verde no Brasil: 2010-
2030] (in Portuguese). Brasília, DF: Centro de Gestão e Estudos Estratégicos.
Chouinard-Dussault, P., Bradt, L., Ponce-Ortega, J.M., El-Halwagi, M.M., 2011.
Incorporation of process integration into life cycle analysis for the production of biofuels.
Clean Technology and Environmental Policy, 13, 673–685.
Clemente, E. Cogeração de energia elétrica a partir da cana de açúcar (Electricity
cogeneration from sugarcane) (in Portuguese). A Tribuna, 09/02/2010.
CONSECANA - Conselho dos Produtores de Cana, Açúcar e Álcool do Estado de São
Paulo, 2011. Price table [Tabela de preços] (in Portuguese).
www.udop.com.br/cana/tabela_consecana_saopaulo.pdf.
COPERSUCAR, 1987. Material for the course in Sugar Engineering: sugar production
process, part I [Apostila do curso de Engenharia açucareira: Processo de Fabricação de
Açúcar, parte I] (in Portuguese). Centro de Tecnologia Copersucar, Piracicaba.
COPERSUCAR, 1989. Basic course on juice treatment [Curso Básico sobre Tratamento
do Caldo] (in Portuguese). Centro de Tecnologia Copersucar, Piracicaba.
CTC, 2009. Handbook on water conservation and reuse in the sucroenergetic industry
[Manual de conservação e reuso da água na agroindústria sucroenergética] (in
Portuguese). Piracicaba.
Čuček, L., Martín, M., Grossmann, I.E., Kravanja, Z., 2011. Energy, water and process
technologies integration for the simultaneous production of ethanol and food from the
entire corn plant. Computers & Chemical Engineering, 35, 1547– 1557.
Dedini. Private communication – Investment data for autonomous distilleries. 2009.
118
Dias, M.O.S., Modesto, M., Ensinas, A.V., Nebra, S.A., Maciel Filho, R., Rossell,
C.E.V., 2011a. Improving bioethanol production from sugarcane: evaluation of
distillation, thermal integration and cogeneration systems, Energy 36, 3691-3703.
Dias, M.O.S., Cunha, M.P., Jesus, C.D.F., Rocha, G.J.M., Pradella, J.G.C., Rossell,
C.E.V., Maciel Filho, R., Bonomi, A., 2011b. Second generation ethanol in Brazil: can it
compete with electricity production? Bioresource Technology 102, 8964-8971.
Dias, M.O.S., Junqueira, T.L., Cavalett, O., Cunha, M.P., Jesus, C.D.F., Rossell, C.E.V.,
Maciel Filho, R., Bonomi, A., 2012. Integrated versus stand-alone second generation
ethanol production from sugarcane bagasse and trash, Bioresource Technology, 103, 152-
161.
Ecoinvent database, 2009. Swiss Centre for Life Cycle Inventories. Version 2.0.
December 2010. www.ecoinvent.ch/.
Elia Neto, A., 2009. Water use and reuse in the sugarcane industry [Uso e reuso da água
na indústria canavieira] (in Portuguese). In: Workshop on the impact of new technologies
on the sustainability of the sugarcane/bioethanol production cycle. CTBE, Campinas.
Ensinas, A.V., Nebra, S.A., Lozano, M.A., Serra, L.M, 2007. Analysis of process steam
demand reduction and electricity generation in sugar and ethanol production from
sugarcane. Energy Conversion and Management, 48, 2978–2987.
Ensinas, A.V., 2008. Thermal integration and termoeconomic optimization applied to the
industrial process of sugar and ethanol from surgarcane [Integração térmica e otimização
termoeconômica aplicadas ao processo industrial de produção de açúcar e etanol a partir
da cana-de-açúcar] (in Portuguese). Thesis (PhD in Mechanical Engineering), School of
Mechanical Engineering. University of Campinas.
Finguerut, J., 2006. Fermentation process [Processo Fermentativo] (in Portuguese). In: I
Workshop Tecnológico sobre produção de etanol. PPPP – FAPESP, Lorena.
Finnveden, G., Hauschild, M.Z., Ekvall, T., Guinee, J., Heijungs, R., Hellweg, S.,
Koehler, A., Pennington, D., Suh, S., 2009. Recent developments in life cycle assessment.
Journal of Environmental Management, 91, 1-21.
119
Garcia, V., 2008. Byproduct of fusel oil distillery: chemical composition characterization
and study of its industrial application [Subproduto de destilaria de óleo fúsel:
caracterização da composição química e estudo de sua aplicação industrial] (in
Portuguese). MSc Dissertation (Chemical and Biochemical Processes), Mauá School of
Engineering, Mauá Institute of Technology.
Getaz, M.A., Pillay, D., Julliene, L.M.S.A., 1995. The Affination of B-Sugar at
Noodsberg, Proceedings of The South African Sugar Technologists' Association.
Gírio, F.M., Fonseca, C., Carvalheiro, F., Duarte, L.C., Marques, S., Bogel-Łukasik, R.,
2010. Hemicelluloses for fuel ethanol: A review. Bioresource Technology, 101, 4775–
4800.
Guinée JB, Gorre´e M, Heijungs R, Huppes G, Kleijn R, Koning A de, van Oers L,
Wegener Sleeswijk A, Suh S, Udo de Haes HA, Bruijn H de; Duin R van; Huijbregts
MAJ (2002) Handbook on life cycle assessment. Operational guide to the ISO standards.
I: LCA in perspective. IIa: Guide. IIb: Operational annex. III: Scientific background.
Kluwer Academic Publishers, Dordrecht.
Hassuani, S.J., Leal M.R.L.V., Macedo I.C. (eds), 2005. Biomass Power Generation—
Sugarcane Bagasse and Trash. CTC and PNUD, Piracicaba.
Hugot, E., 1986. Handbook of Cane Sugar Engineering, Amsterdam: Elsevier.
Humbird, D. et al., 2011. Process Design and Economics for Biochemical Conversion of
Lignocellulosic Biomass to Ethanol - Dilute-Acid Pretreatment and Enzymatic Hydrolysis
of Corn Stover. Available online at: <www.osti.gov/bridge>.
IBGE, 2011. Annual Industry Research [Pesquisa Industrial Anual – PIA] (in
Portuguese). IBGE.
ISO 2006a, ISO 14040 - Environmental management - Life cycle assessment - Principles
and framework, The International Organization for Standardization.
ISO 2006b, ISO 14044 - Environmental management - Life cycle assessment -
Requirements and guidelines, The International Organization for Standardization.
120

Junqueira, T.L., 2010. Simulation of conventional, extractive and azeotropic distillation
for bioethanol production process using nonequilibrium model and equilibrium stage
model with efficiency [Simulação de colunas de destilação convencional, extrativa e
azeotrópica no processo de produção de bioetanol através da modelagem de não equilíbrio
e da modelagem de estágios de equilíbrio com eficiência] (in Portuguese). MSc
Dissertation (Chemical Engineering), School of Chemical Engineering, University of
Campinas.
Kamm, B., Gruber, P,R., Kamm, M., 2006. Biorefineries – Industrial Processes and
Products. Volume 1, Wiley-VCH, 441p.
Kamm, B., Kamm, M., 2004. Principles of Biorefineries. Applied Microbiology and
Biotechnology, 64,137-145.
Lamonica, H.M., 2010. Determination of electric efficiency of the sugarcane Brazilian
mills for production of sugar and/or ethanol [Determinação da eficiência elétrica das
usinas brasileiras para produção exclusiva de açúcar e/ou etanol] (in Portuguese). CTC.
Leal, M.R.L.V., 2005. Techno-economic characterization of the ethanol production in
Brazil.
Macedo, I.C., Seabra , J.E.A., Silva, J.E.A.R., 2008. Green house gases emissions in the
production and use of ethanol from sugarcane in Brazil: The 2005/2006 averages and a
prediction for 2020. Biomass and Bioenergy 32, 582-595.
Mantelatto, P. E., 2005. Study of the crystallization of impure sucrose solutions from
sugarcane by cooling [Estudo do processo de cristalização de soluções impuras de
sacarose por resfriamento] (in Portuguese). MSc dissertation (Chemical Engineering),
School of Chemical Engineering. Federal University of São Carlos, São Carlos.
Mantelatto P.E., 2009. Process for juice treatment in industrial large scale plant. In:
Workshop BIOEN FAPESP on Ethanol Production, São Paulo.
Mantelatto, P.E., 2010. Information about the sugarcane industry. Private communication.
Mantelatto, P.E., 2011. Information about the sugarcane industry. Private communication.
121
Martín, M., Grossmann, I.E, 2011. Energy Optimization of Bioethanol Production Via
Hydrolysis of Switchgrass. AIChE J. (in Press), doi: 10.1002/aic.12735.
MDIC, 2011. System Information Analysis of Foreign Trade – Butanol and Acetone
prices. Available online at http://aliceweb.desenvolvimento.gov.br/
Meirelles, A.J.A., 2006. Expansion of bioethanol production and technological
improvement of alcoholic distillation [Expansão da produção de bioetanol e melhoria
tecnológica da destilação alcoólica] (in Portuguese). Workshop Produção de etanol,
Lorena. Available online at:
www.apta.sp.gov.br/cana/anexos/PPaper_sessao_4_Antonio_Meirelles.pdf
Mill A, 2010. Technical bulletin of the Mill A.
Nigam, P.S., Singh, A., 2011. Production of liquid biofuels from renewable resources.
Progress in Energy and Combustion Science, 37, 52-68.
NREL 2012. What Is a Biorefinery? Available online at:
<www.nrel.gov/biomass/biorefinery.html>
Ojeda, K., Ávila, O., Suárez, J., Kafarov, V., 2011. Evaluation of technological
alternatives for process integration of sugarcane bagasse for sustainable biofuels
production—Part 1. Chemical Engineering Research and Design, 89, 270–279.
Patel, M. (Coord.), 2006. Medium and long-term opportunities and risks of the
biotechnological production of bulk chemicals from renewable resources – the potential
of White biotechnology. The BREW project (Final Report). Ultrecht University.
Available online at www.chem.uu.nl/brew/.
PNNL and NREL, 2004. Top Value Added Chemicals from Biomass Volume I—Results
of Screening for Potential Candidates from Sugars and Synthesis Gas. USDOE. Available
online at www1.eere.energy.gov/library/
Prieto, M.G.S., 2003. Cogeneration alternatives in the sugarcane industry – case study
[Alternativas de Cogeração na Indústria Sucro-Alcooleira, Estudo de Caso] (in
122

Portuguese). Thesis (PhD in Mechanical Engineering), School of Mechanical
Engineering, University of Campinas.
Rein, P., 2007. Cane Sugar Engineering, Verlag Dr Akbert Bartens KG: Berlin.
Ribeiro, P. R. (SMAR). The sugarcane industry and its automation [A usina de açúcar e
sua automação] (in Portuguese), 2ª Ed., 2003.
Rocha, G.J.M., Gonçalves, A.R., Oliveira, B.R., Olivares, E.G., Rossell, C.E.V., 2012.
Steam explosion pretreatment reproduction and alkaline delignification reactions
performed on a pilot scale with sugarcane bagasse for bioethanol production. Industrial
Crops and Products, 35, 274-279.
Rocha, G.J.M. et al., 2010. Compositional variability of raw, steam-exploded and
delignificated sugarcane bagasse. In: NIPE/UNICAMP. Congresso Internacional sobre
Geração Distribuída e Energia no Meio Rural (AGRENER GD 2010). Campinas.
Available online at <www.nipeunicamp.org.br/agrener/anais/2010/14-12/12/63.pdf>.
Roffler, S., Blanch, H.W., Wilke, C.R., 1987. Extractive Fermentation of Acetone and
Butanol: Process Design and Economic Evaluation. Biotechnology Progress, 3: 131–140.
Rossell, C.E.V., 2011. Data for the ethanol production process. Private communication.
Seabra, J.E.A., 2008. Technical-economic evaluation of options for whole use of
sugarcane biomass in Brazil [Avaliação técnico-econômica de opções para o
aproveitamento integral da biomassa de cana no Brasil] (in Portuguese). Thesis (PhD in
Mechanical Engineering), School of Mechanical Engineering. University of Campinas.
Seabra, J.E.A. Tao, L., Chum, H.L., Macedo, I.C., 2010. A techno-economic evaluation
of the effects of centralized cellulosic ethanol and co-products refinery options with
sugarcane mill clustering. Biomass and Bioenergy 34, 1065-1078.
Sousa, E.L.L., Macedo, I.C. (Coord.), 2010. Ethanol and Bioelectricity – Sugarcane in the
Future of the Energy Matrix [Etanol e Bioeletricidade – A cana-de-açúcar no futuro da
matriz energética] (in Portuguese). UNICA.
123

Stanmore, B.R., 2010. Generation of Energy from Sugarcane Bagasse by Thermal
Treatment. Waste Biomass Valor, 1, 77-89.
Pedra Sugar Mill, 2006. Data on the ethanol production process from sugarcane.
UNICA, 2011. Dados e cotações – Estatísticas (in Portuguese). Available online at:
www.unica.com.br/dadosCotacao/estatistica/
Walter, A. et al., 2008. A sustainability analysis of the Brazilian ethanol. A report
supported by UK Embassy and DEFRA. Available online at <www.unica.com.br>.
Wooley, R.J., Putsche, V., 1996. Development of an ASPEN PLUS Physical Property
Database for Biofuels Components. Report No. NREL/MP-425-20685, Golden,
Colorado: NREL. < www.p2pays.org/ref/22/21210.pdf >.
Yin, D., Jing, Q., AlDajani, W.W., Duncan, S., Tschirner, U., Schilling, J., Kazlauskas,
R.J., 2011. Improved pretreatment of lignocellulosic biomass using enzymatically-
generated peracetic acid. Bioresource Technology, 102, 5183–5192.
124