Virtual Site Event Quality Management Beyond the PMBOK
38
Virtual Site Event 1 Quality Management Beyond the PMBOK Presented by: Christopher Maddox October 15, 2014
Transcript of Virtual Site Event Quality Management Beyond the PMBOK

Virtual Site Event
1
Quality Management Beyond the PMBOK
Presented by:Christopher MaddoxOctober 15, 2014

Virtual Site Ground Rules
Ground Rules PMI Code of Conduct applies for this virtual presentation. The Virtual Attendees are expected to:
Participate for a minimum of 40 minutes. Login information will be verified.
Answer the question pertaining to the presentation correctly in the survey in order to obtain the PDU credit (1).
Respond to the survey within 48 hours (By Friday October 17, 2014) of participating in order to obtain the PDU credit.
Reminder: Beginning in January 2015 there will be a $10.00 charge for virtual seminars ($15.00 for non-Baltimore members).
2

www.capstanperformance.com
© 2014 Capstan Performance LLC
Quality ManagementBeyond the PMBOK®
Project Management Institute Baltimore Chapter
15 October 2014
This Presentation © 2014 Capstan Performance LLC. For use only by PMI members for non-profit educational purposes without express written consent of the copyright holder. Dilbert cartoons © United Features Syndicate and are used under Fair Use doctrine for educational purposes.
Christopher E. Maddox, PMP, MBA

www.capstanperformance.com
© 2014 Capstan Performance LLC
An Opening Thought

www.capstanperformance.com
© 2014 Capstan Performance LLC
• QM Definitions – Quality and Grade •Quality and Risk•The Economics of Quality•Understanding Cause and Effect•Statistical Tool Cautions and Tips
Topics

www.capstanperformance.com
© 2014 Capstan Performance LLC
QUALITY“the degree to which a set of inherent characteristics fulfill requirements”
GRADE“category or rank used to distinguish items
that have the same functional use but do not share the same requirements for
quality”
Quality Management Definitions
Project Management Institute, A Guide to the Project Management Body of Knowledge (PMBOK® Guide) – Fifth Edition, Project Management Institute, Inc., 2013 Pages 542 and 556

www.capstanperformance.com
© 2014 Capstan Performance LLC
Quality Management Definitions
“Sports Car” “Sports Car”
WHICH IS HIGHER GRADE?

www.capstanperformance.com
© 2014 Capstan Performance LLC
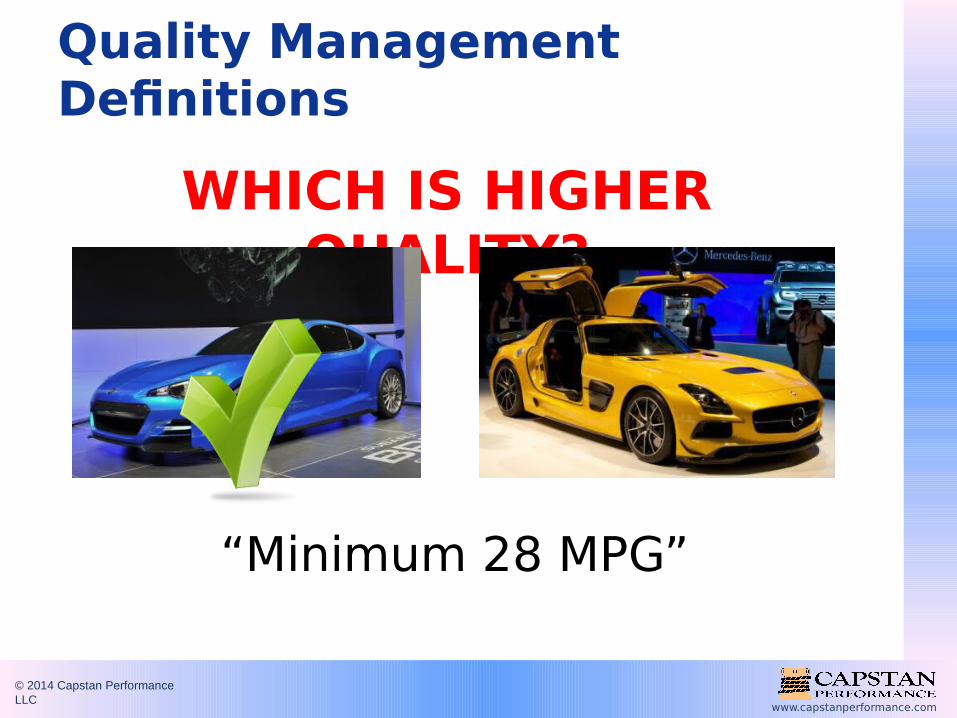
WHICH IS HIGHER QUALITY?
Quality Management Definitions
“Zero to 60 in under 5 seconds”
www.capstanperformance.com
© 2014 Capstan Performance LLC
WHICH IS HIGHER QUALITY?
Quality Management Definitions
“Minimum 28 MPG”

www.capstanperformance.com
© 2014 Capstan Performance LLC
Quality and Risk

www.capstanperformance.com
© 2014 Capstan Performance LLC
• Quality management ALWAYS involves assessment of risk
• Risks to consider– Risk related to process capability– Risk related to sampling/inspection error– Risk related to poor quality (scrap, recalls,
reputation, liability, etc)• Complete elimination of risk is
impractical in terms of time and cost; risk-based mitigation strategies are at the heart of effective QM
• Understanding risks is the first step towards prevention of quality problems
Quality and Risk

www.capstanperformance.com
© 2014 Capstan Performance LLC
• Understanding Quality / Cost / Risk Relationships– Define Acceptable Quality Level– Determine Costs of Compliance and
Noncompliance• Acceptable Quality Level
– What are the user requirements / specifications?
– What AQL is needed to meet them?• Cost of Compliance
– What is the cost of compliance (process, management, QA, QC)?
• Cost of Noncompliance– What is the cost and risk of poor quality
(scrap, returns, etc)?
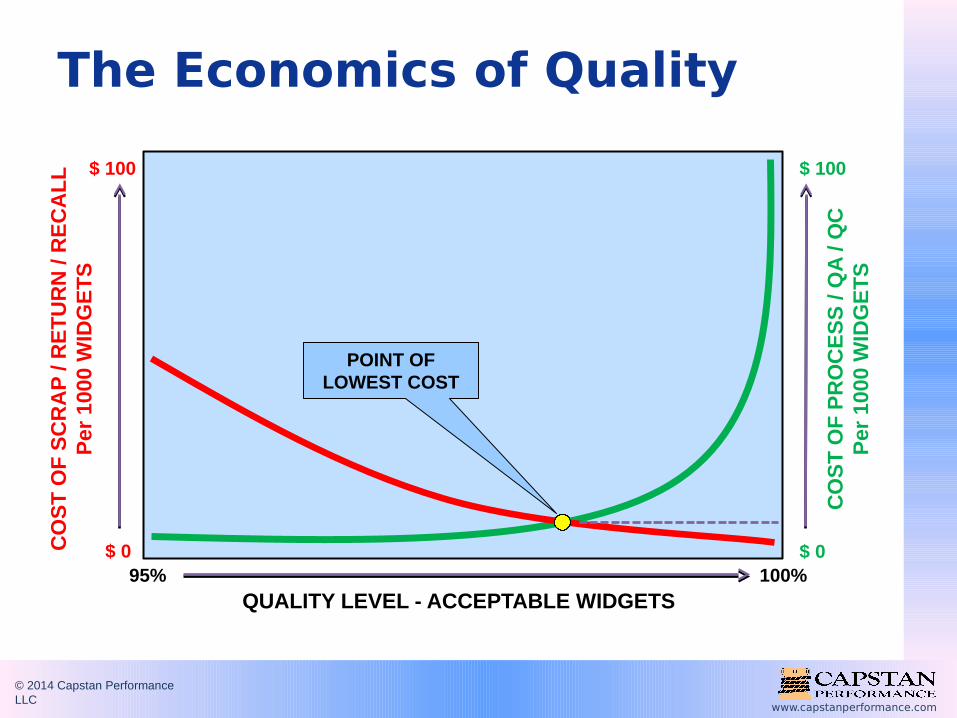
The Economics of Quality

www.capstanperformance.com
© 2014 Capstan Performance LLC
The Economics of Quality
95% 100%
QUALITY LEVEL - ACCEPTABLE WIDGETS
CO
ST
OF
PR
OC
ES
S /
QA
/ Q
CP
er 1
000
WID
GE
TS
$ 0
$ 100

www.capstanperformance.com
© 2014 Capstan Performance LLC
The Economics of Quality
95% 100%
CO
ST
OF
PR
OC
ES
S /
QA
/ Q
CP
er 1
000
WID
GE
TS
$ 0
$ 100
CO
ST
OF
SC
RA
P /
RE
TU
RN
/ R
EC
AL
LP
er 1
000
WID
GE
TS
$ 0
$ 100
QUALITY LEVEL - ACCEPTABLE WIDGETS
www.capstanperformance.com
© 2014 Capstan Performance LLC
The Economics of Quality
95% 100%
CO
ST
OF
PR
OC
ES
S /
QA
/ Q
CP
er 1
000
WID
GE
TS
$ 0
$ 100
CO
ST
OF
SC
RA
P /
RE
TU
RN
/ R
EC
AL
LP
er 1
000
WID
GE
TS
$ 0
$ 100
QUALITY LEVEL - ACCEPTABLE WIDGETS
POINT OF LOWEST COST

www.capstanperformance.com
© 2014 Capstan Performance LLC
The Economics of Quality
95% 100%
CO
ST
OF
PR
OC
ES
S /
QA
/ Q
CP
er 1
000
WID
GE
TS
$ 0
$ 100
CO
ST
OF
SC
RA
P /
RE
TU
RN
/ R
EC
AL
LP
er 1
000
WID
GE
TS
$ 0
$ 100
QUALITY LEVEL - ACCEPTABLE WIDGETS
POINT OF LOWEST COST
(Risk Averse Case)
RI
SK
www.capstanperformance.com
© 2014 Capstan Performance LLC
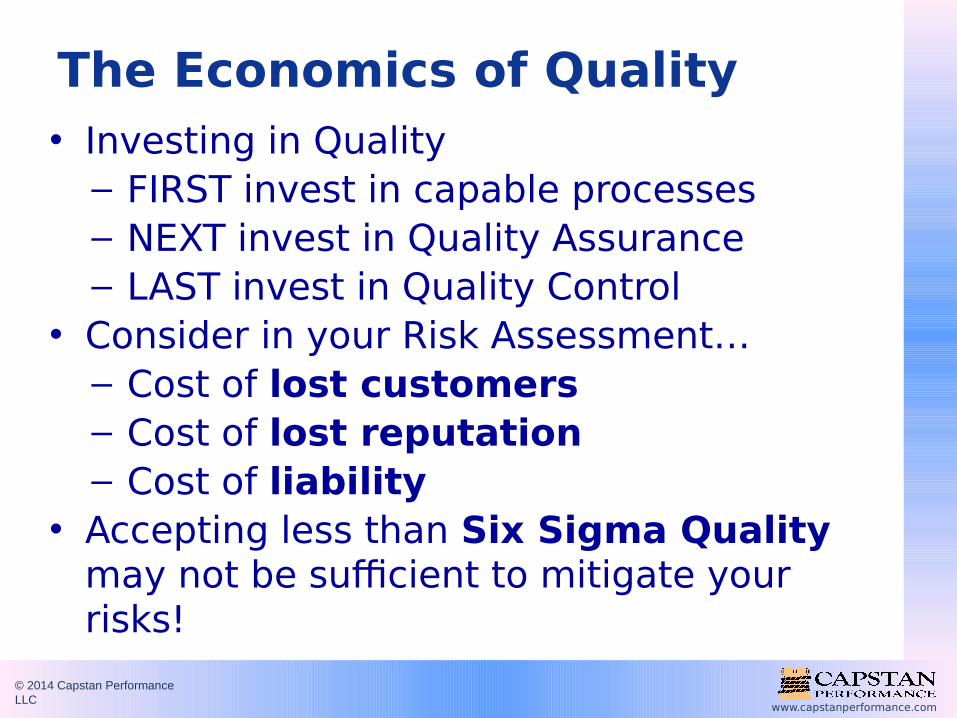
• Investing in Quality– FIRST invest in capable processes– NEXT invest in Quality Assurance– LAST invest in Quality Control
• Consider in your Risk Assessment…– Cost of lost customers– Cost of lost reputation– Cost of liability
• Accepting less than Six Sigma Quality may not be sufficient to mitigate your risks!
The Economics of Quality

www.capstanperformance.com
© 2014 Capstan Performance LLC
So… what the heck is Six Sigma?

www.capstanperformance.com
© 2014 Capstan Performance LLC
• A measure of process capability• The simple definition
– A process capable of producing not more than 3.4 defects per 1,000,000 opportunities
– That’s 99.9997% “Good”• The slightly-more-complex definition
– Acceptance range of the process is 3 standard deviations (SD, Sigma or σ) of the process’ normal distribution on either side of the desired specification point
Six Sigma

www.capstanperformance.com
© 2014 Capstan Performance LLC
Six Sigma Quality
NU
MB
ER
OF
OB
SE
RV
AT
ION
S
DEVIATION BELOW SPECIFICATION
DEVIATION ABOVE SPECIFICATION

www.capstanperformance.com
© 2014 Capstan Performance LLC
Six Sigma
NU
MB
ER
OF
OB
SE
RV
AT
ION
S
DEVIATION BELOW SPECIFICATION
DEVIATION ABOVE SPECIFICATION
“NORMAL” Distribution
Curve
Specification

www.capstanperformance.com
© 2014 Capstan Performance LLC
Six Sigma
NU
MB
ER
OF
OB
SE
RV
AT
ION
S
DEVIATION BELOW SPECIFICATION
DEVIATION ABOVE SPECIFICATION
ACCEPTANCE CRITERIA
Specification
“NORMAL” Distribution
Curve

www.capstanperformance.com
© 2014 Capstan Performance LLC
Six Sigma
NU
MB
ER
OF
OB
SE
RV
AT
ION
S
DEVIATION BELOW SPECIFICATION
DEVIATION ABOVE SPECIFICATION
1σ
2σ
3σ
99.9997%
68%
95%
NOT A SIX SIGMA PROCESS!

www.capstanperformance.com
© 2014 Capstan Performance LLC
Conforming to Six Sigma
NU
MB
ER
OF
OB
SE
RV
AT
ION
S
DEVIATION BELOW SPECIFICATION
DEVIATION ABOVE SPECIFICATION
1σ
2σ
3σ
99.9997%
68%
95%
IMPROVE PROCESS CAPABILITY
www.capstanperformance.com
© 2014 Capstan Performance LLC
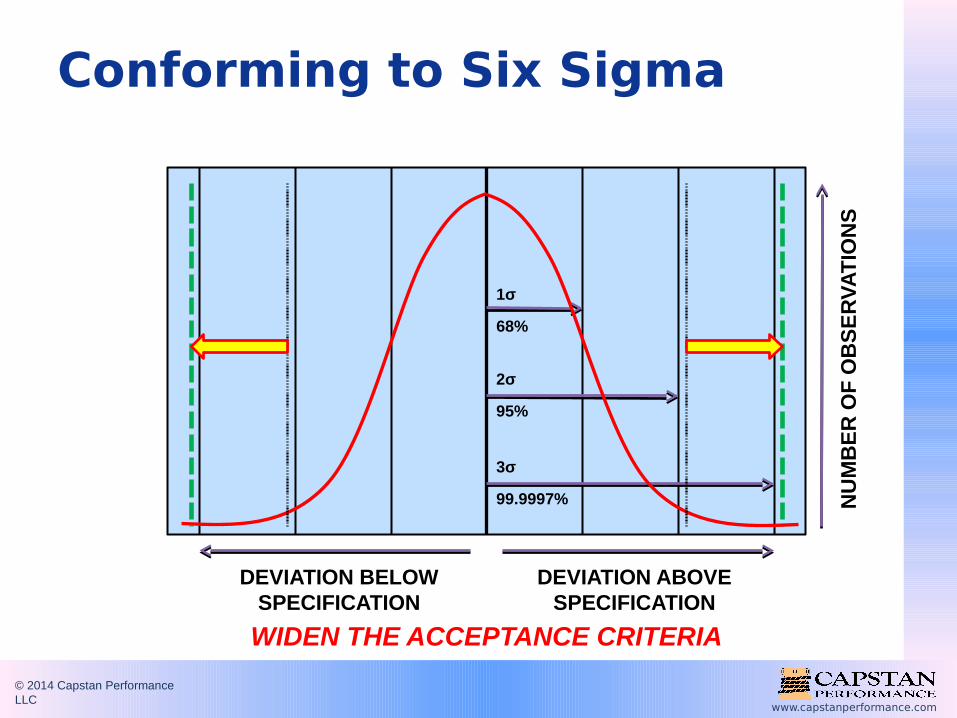
Conforming to Six Sigma
NU
MB
ER
OF
OB
SE
RV
AT
ION
S
DEVIATION BELOW SPECIFICATION
DEVIATION ABOVE SPECIFICATION
1σ
2σ
3σ
99.9997%
68%
95%
WIDEN THE ACCEPTANCE CRITERIA

www.capstanperformance.com
© 2014 Capstan Performance LLC
Understanding Cause and Effect

www.capstanperformance.com
© 2014 Capstan Performance LLC
• PMBOK®– Pareto Chart
• Categorizes failure modes and prioritizes attention• Does not establish specific causal relationships
– Ishikawa (Fishbone) Diagram• Qualitative, not ideal for complex systems with
multiple causes and effects
• Other Tools– Causal Circle
• Explores cause-effect relationships of undesirable effects (UDEs) – well suited to complex systems
– Failure Mode and Effect Analysis (FMEA) • Similar to risk register - analyzes and prioritizes
potential failures, effects and CAPAs according to probability/severity
Understanding Cause and Effect

www.capstanperformance.com
© 2014 Capstan Performance LLC
Causal CircleUDEs (Tablet Compression Project)1. Tablet chipping2. Tablet hardness variation3. Coating is not uniform4. Tablets under weight5. Press force drifting during process6. Granulation density low7. Press process too slow8. Speed control past limit
1. List and Number UDEs

www.capstanperformance.com
© 2014 Capstan Performance LLC
Causal Circle1
8 2
7
5
3
6 4
UDEs1. Tablet chipping2. Tablet hardness variation3. Coating is not uniform4. Tablets under weight5. Press force drifting during process6. Granulation density low7. Press process too slow8. Speed control past limit
2. Arrange numbers in circle

www.capstanperformance.com
© 2014 Capstan Performance LLC
Causal Circle1
8 2
7
5
3
6 4
UDEs1. Tablet chipping2. Tablet hardness variation3. Coating is not uniform4. Tablets under weight5. Press force drifting during process6. Granulation density low7. Press process too slow8. Speed control past limit
3. Establish Relationship between UDE 1 and others

www.capstanperformance.com
© 2014 Capstan Performance LLC
Causal Circle1
8 2
7
5
3
6 4
UDEs1. Tablet chipping2. Tablet hardness variation3. Coating is not uniform4. Tablets under weight5. Press force drifting during process6. Granulation density low7. Press process too slow8. Speed control past limit
4. Repeat for all UDEs
www.capstanperformance.com
© 2014 Capstan Performance LLC
Causal Circle1
8 2
7
5
3
6 4
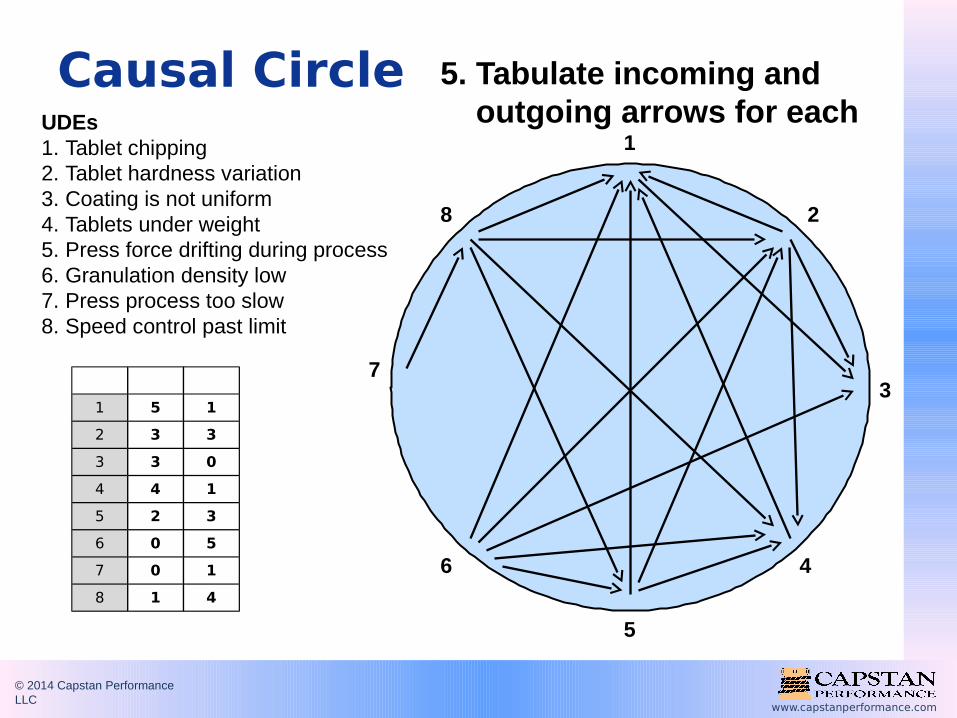
UDEs1. Tablet chipping2. Tablet hardness variation3. Coating is not uniform4. Tablets under weight5. Press force drifting during process6. Granulation density low7. Press process too slow8. Speed control past limit
5. Tabulate incoming and outgoing arrows for each
UDE IN OUT
1 5 1
2 3 3
3 3 0
4 4 1
5 2 3
6 0 5
7 0 1
8 1 4

www.capstanperformance.com
© 2014 Capstan Performance LLC
Causal Circle1
8 2
7
5
3
6 4
UDEs1. Tablet chipping2. Tablet hardness variation3. Coating is not uniform4. Tablets under weight5. Press force drifting during process6. Granulation density low7. Press process too slow8. Speed control past limit
6. Identify drivers, outcomes, contributors
UDE IN OUT
1 5 1
2 3 3
3 3 0
4 4 1
5 2 3
6 0 5
7 0 1
8 1 4
D
D
O
O
O
C
C
DRIVER
DRIVER
DRIVER
OUTCOME
OUTCOME
OUTCOME
CONTRIBUTOR
CONTRIBUTOR
D

www.capstanperformance.com
© 2014 Capstan Performance LLC
Statistical Tool Cautions and Tips

www.capstanperformance.com
© 2014 Capstan Performance LLC
• Fishbone: Beware that correlation ≠ causality (use Causal Circle for complex systems)
• Control Charts: Look for off-center trends; plot a distribution if you have enough data
• Pareto Charts: Beware that all items must be a direct cause of the defect or you can draw invalid conclusions
• Scatter Plots: Do these in Excel and you can easily plot trend lines, derive formulas and R-squared values
• Statistical Sampling: Subject to errors; know how to calc margin of error so you can create a valid sampling plan
Statistical Tool Cautions and Tips

www.capstanperformance.com
© 2014 Capstan Performance LLC
• Understand what quality is, and who defines it• Good quality management is dependent on good
risk management• Understanding the economics of quality is a
competitive advantage• Process capability is the most important factor in
quality and usually the most cost effective in the long run
• Determining cause, effect and failure mode is the only way to anticipate and investigate failure and continuously improve
• Understand what tools and statistics are telling you
Quality Management is profitable unless it is just a buzzword
Summary

www.capstanperformance.com
© 2014 Capstan Performance LLC
Questions? Comments?

www.capstanperformance.com
© 2014 Capstan Performance LLC
Thank You!
This Presentation © 2014 Capstan Performance LLC. For use only by PMI members for non-profit educational purposes without express written consent of the copyright holder. Dilbert cartoons © United Features Syndicate and are used under Fair Use doctrine for educational purposes.
Your Performance ◦ Our Passion
www.capstanperformance.com