Virtual Prairie Feeders Kurtis Sanguin Cory Holeha Brad Dempsey.
24
Virtual Prairie Feeders Kurtis Sanguin Cory Holeha Brad Dempsey
-
Upload
maximillian-booker -
Category
Documents
-
view
220 -
download
0
Transcript of Virtual Prairie Feeders Kurtis Sanguin Cory Holeha Brad Dempsey.

Virtual Prairie Feeders
Kurtis Sanguin
Cory Holeha
Brad Dempsey

Mission Statement
• Virtual Prairie Feeders is determined to expanding the feeder cattle industry in Saskatchewan by producing uniform, high quality beef animals ready for slaughter, while supporting local industry and keeping money within SK.

Operations and Human Resources Plan

Location
• Yorkton Saskatchewan
• Selection Based on:– Feed price– Feed supply– Cattle supply
Description of Operations
• Pre-purchasing phase– Locate potential feedlots– Negotiate and sign contracts

Description of Operations
• Pre-purchasing phase– Locate potential feedlots– Negotiate and sign contracts

Description of Operations
• Purchasing to selling phase– Order buyer– Tagging, branding, vaccinating– Market conditions– Weight checks– Herd status checks

Description of Operations
• Selling phase:– set up selling price– set up transportation to packers

Description of Operations
• Post Selling Phase:– Settle all accounts payable– Transfer funds to T-bills

Net Working Capital
Year 2002 2007 2011
Capital Expense:
Office Equipment 5,850 - - Capital expense
Net Working Capital:
Inventories 6,435,000 6,955,924 7,411,438
Operating Expenses 693,621 513,433 288,081 Minus LT Debt
Vet Bills 130,000 143,531 155,362 $13.00 per head
Tag and Brand 35,000 38,643 41,828 $3.50 per head
Payout to Feedlot 3,875,000 4,278,313 4,630,984
Total Direct Labour 10,125 11,179 12,100 Secretaries income
Total Fixed Overhead 11,487 12,682 13,707 Minus CCA expense
Net Working Capital Required 10,690,233 11,645,239 12,479,526
Total Capital Required $10,696,083 $11,645,239 $12,479,526
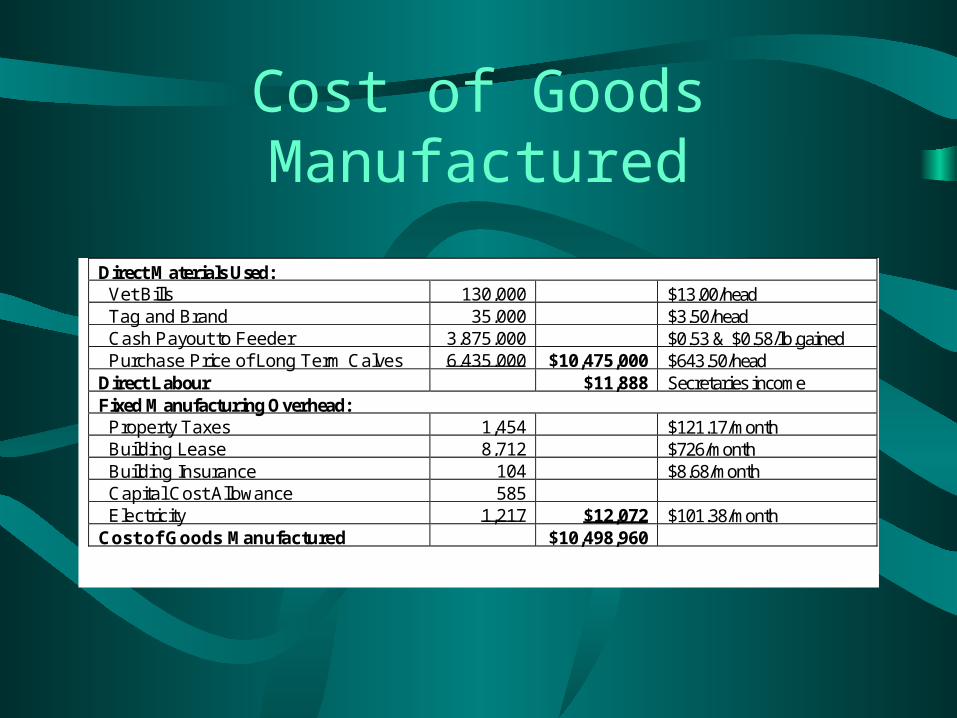
Cost of Goods Manufactured
Direct Materials Used: Vet Bills 130,000 $13.00/head Tag and Brand 35,000 $3.50/head Cash Payout to Feeder 3,875,000 $0.53 & $0.58/lb.gained Purchase Price of Long Term Calves 6,435,000 $10,475,000 $643.50/headDirect Labour $11,888 Secretaries incomeFixed Manufacturing Overhead: Property Taxes 1,454 $121.17/month Building Lease 8,712 $726/month Building Insurance 104 $8.68/month Capital Cost Allowance 585 Electricity 1,217 $12,072 $101.38/monthCost of Goods Manufactured $10,498,960

Organizational Structure
C u s to m er S e rv ice R e pe se n ta tive S e c re ta ry/A cco u n ting C le rk
M a rke tin g /G e ne ra l M a na g er

Marketing Plan
• Product– High Quality, uniform sized, finished SK steers– 1250 lb average finishing weight– Mainly to Western Canadian Beef Packers Inc.
Moose Jaw

Pricing Policy
• Price takers• Indirectly related to
– Export market (after packer)
– mainly to the U.S
– Mexico believed to be a future market
0
10
20
30
40
50
60
70
Total Beefproducts
ProcessedBeefProducts
Millions $
Year % Total Beef1988 14%1993 40%1997 53%

Competition
0
10000
20000
30000
40000
50000
60000
Months
SK Steer Exports
under600lbs
• Other feedlots• Traditionally most of
our calves exported
Under 600 lbs
76%
2%
6%
16%0%
Alb
U.S.A.
MB
Ont
other
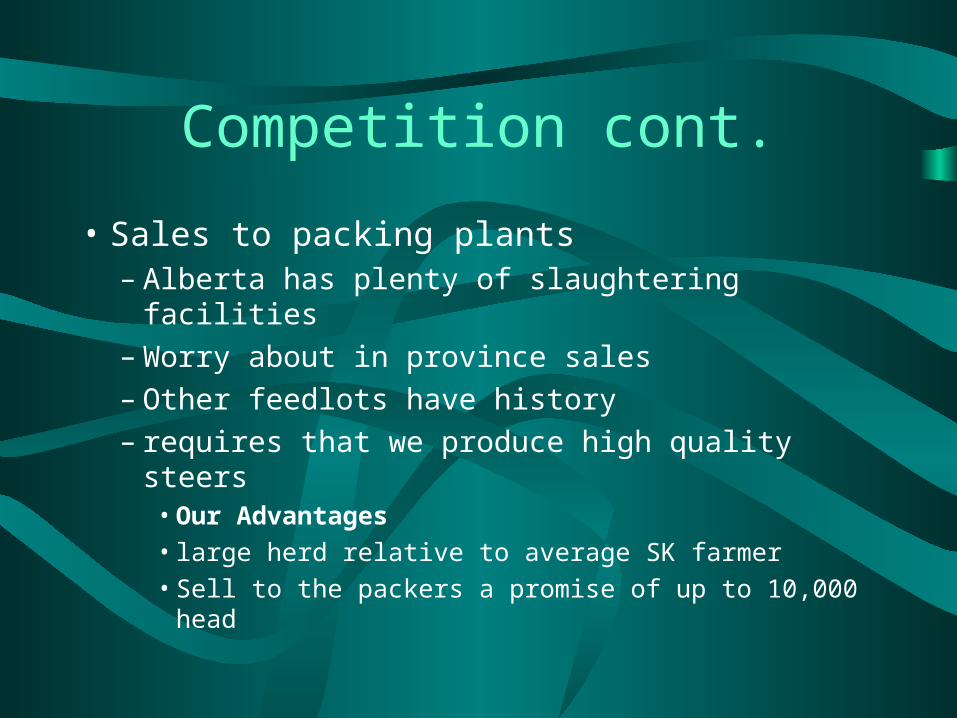
Competition cont.
• Sales to packing plants– Alberta has plenty of slaughtering facilities– Worry about in province sales– Other feedlots have history– requires that we produce high quality steers
• Our Advantages
• large herd relative to average SK farmer
• Sell to the packers a promise of up to 10,000 head

Other Competition
• Substitutes for beef

FINANCE PLAN

Required Financing
$12,500,000Total Financing
$7,500,000Share Capital
$5,000,000Long Term Bank Debt
$10,696,083 Total Financing Required

Financial Assumptions
• Long-term debt over 10 year period
• Inflation constant at 2%
• 5 year average buying and selling cattle prices reflect the highs and lows in cattle cycle
• No Accounts Receivable, Accounts Payable, or Inventory at year end

Financial Ratios
6.3%4.8%1.5%ROE
0%27.9%68.6%Debt to Equity
0%21.8%38.1%Debt Ratio
201120072002Ratio
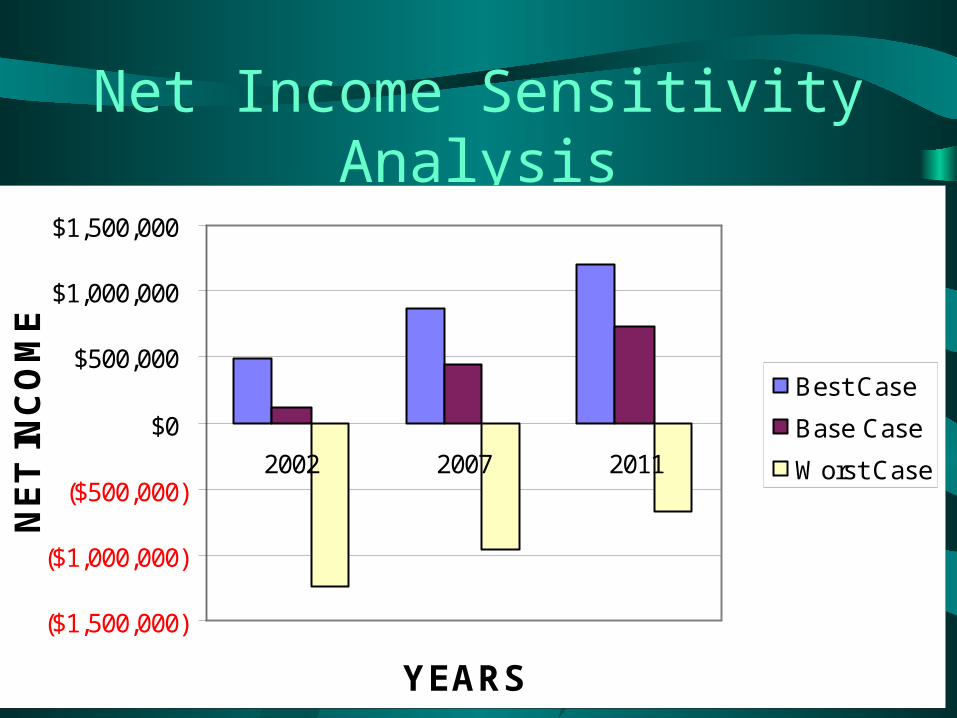
Net Income Sensitivity Analysis
($1,500,000)
($1,000,000)
($500,000)
$0
$500,000
$1,000,000
$1,500,000
2002 2007 2011
YEARS
NE
T IN
CO
ME
Best Case
Base Case
Worst Case

Summary of Financial ResultsNet Present Value
(5,098,618))
Internal Rate of Return
3.7%
2002 2007 2011
Net Cash Flows to Equity
(202,057) (60,091) 11,727,696
Net Income 111,085 444,738 738,380

Conclusions and Recommendations
• Not Feasible• Risk high relative to
potential returns• Dependant on current
market situations– feed, cattle prices,
payout to feedlots
• Too much profit going towards feedlots
• Recommendations– pay smaller farmers,
• won’t have to pay going feedlot rate