Virtual Instruments User Guide - OEM|ODM|SMT
35
Kingst Virtual Instruments User Guide www.qdkingst.com 2018-5-30 1 Virtual Instruments User Guide Qingdao Kingst Electronics Co., Ltd. Web:www.qdkingst.com E-mail:[email protected]
Transcript of Virtual Instruments User Guide - OEM|ODM|SMT
Kingst Virtual Instruments User Guide www.qdkingst.com
2018-5-30 1
Virtual Instruments
User Guide
Qingdao Kingst Electronics Co., Ltd.
Web:www.qdkingst.com
E-mail:[email protected]
Kingst Virtual Instruments User Guide www.qdkingst.com
2018-5-30 2
Contents
I. Overview ............................................................................................................ 4
1、 Basic knowledge ................................................................................................................. 4
2、 Product series ...................................................................................................................... 4
3、 Technical specification ....................................................................................................... 5
II. Brief introduction to Kingst VIS ................................................................... 7
1、 How to install software ....................................................................................................... 7
2、 Brief introduction to GUI ................................................................................................... 7
3、 Multi-language switching ................................................................................................... 8
4、 Brief introduction to the demo function.............................................................................. 8
III. Connect the device ...................................................................................... 10
1、 Connect the device to PC .................................................................................................. 10
2、 Connect the device to system under test ........................................................................... 10
3、 Multipoint grounding to increase accuracy ....................................................................... 11
IV. Details of operations ..................................................................................... 12
1、 Sampling depth and sampling rate settings ....................................................................... 12
2、 Trigger condition settings ................................................................................................. 13
3、 Get the waveform ............................................................................................................. 14
4、 Waveform check and operations ....................................................................................... 14
5、 Waveform measurement ................................................................................................... 16
6、 Analyzers .......................................................................................................................... 17
7、 Devices and channels settings........................................................................................... 19
8、 Save the settings and data ................................................................................................. 22
9、 Export the data .................................................................................................................. 23
10、 Threshold voltage setting ................................................................................................ 24
11、 The “Options...” in the main menu ................................................................................. 25
V. Settings for standard protocols ...................................................................... 27
1、 UART/232/485 ................................................................................................................. 27
2、 I2C .................................................................................................................................... 28
3、 SPI .................................................................................................................................... 28
4、 CAN .................................................................................................................................. 29
5、 Simple Parallel .................................................................................................................. 30
Kingst Virtual Instruments User Guide www.qdkingst.com
2018-5-30 3
6、 1-Wire ............................................................................................................................... 31
7、 DMX-512 ......................................................................................................................... 32
8、 UNI/O ............................................................................................................................... 32
9、 User-defined protocol analyzer ......................................................................................... 32
VI. FAQs ............................................................................................................... 33
1、 Driver installation fail with the device connected to computer ........................................ 33
2、 Identification fail or work unstably with the device connected ........................................ 33
3、 Signal glitches appear on individual channels .................................................................. 33
4、 The actual sample time is less than expected .................................................................... 33
5、 Automatic update failed .................................................................................................... 34
VII. Contact us .................................................................................................... 35
Kingst Virtual Instruments User Guide www.qdkingst.com
2018-5-30 4
I. Overview
1、 Basic knowledge
Logic analyzer is the instrument that collects and displays the digital signal from the system
under test. It is mainly used for timing judgement an analysis. Unlike the oscilloscope with many
voltage grades, It has only two grades(Logic “1” and Logic “0”). After the reference voltage is set,
the logic analyzer could decide from the test signal that the signal above the reference voltage is
logic 1, and the signal below is logic 0. The digital waveform is formed with 1 and 0. Compared
with the oscilloscope, when testing and measuring the digital systems like MCU, ARM, FPGA and
DSP, the logic analyzer could provide better accuracy, much more data and more complicated
measuring methods.
For example, if you are sampling a signal with the logic analyzer, the sample rate of which is
1MHz, and the reference voltage(threshold voltage) is set to 1.5V, the logic analyzer would
compare the current voltage with 1.5V. The signal above 1.5V would be high level(logic 1), and the
signal below 1.5V would be low level(logic 0). Thus we get a sample point, and then we could link
all these points(logic 1 and logic 0) to get a waveform, in which the user could see and analyze the
timing of the signal, logic errors, the relation between each other, etc.
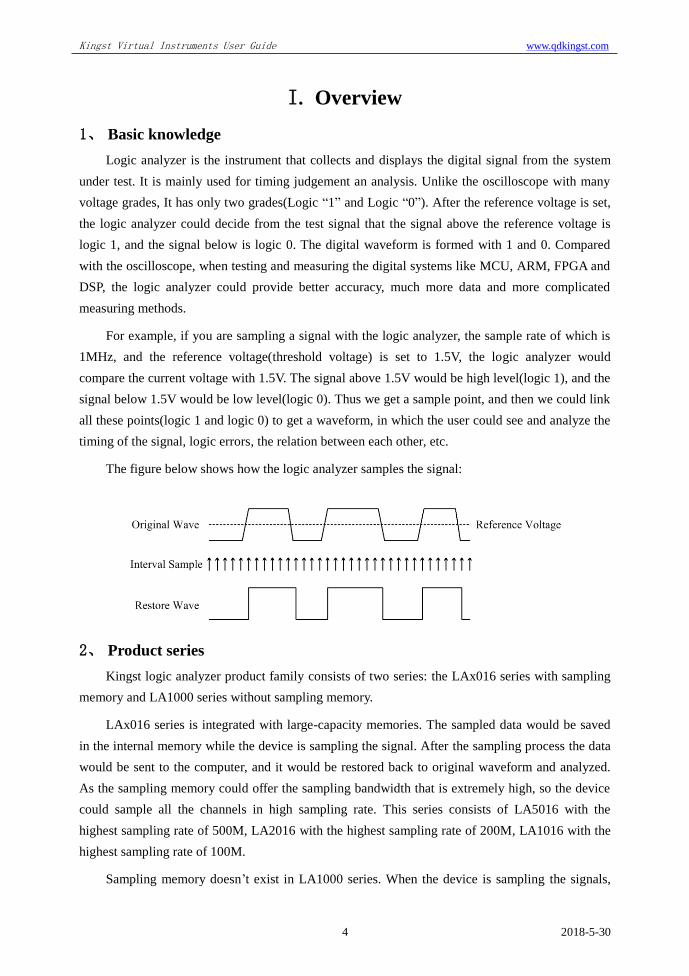
The figure below shows how the logic analyzer samples the signal:
2、 Product series
Kingst logic analyzer product family consists of two series: the LAx016 series with sampling
memory and LA1000 series without sampling memory.
LAx016 series is integrated with large-capacity memories. The sampled data would be saved
in the internal memory while the device is sampling the signal. After the sampling process the data
would be sent to the computer, and it would be restored back to original waveform and analyzed.
As the sampling memory could offer the sampling bandwidth that is extremely high, so the device
could sample all the channels in high sampling rate. This series consists of LA5016 with the
highest sampling rate of 500M, LA2016 with the highest sampling rate of 200M, LA1016 with the
highest sampling rate of 100M.
Sampling memory doesn’t exist in LA1000 series. When the device is sampling the signals,
Kingst Virtual Instruments User Guide www.qdkingst.com
2018-5-30 5
the data will be sent to the computer at the same time. The PC software compresses and the data
and saves them in PC memories, and then it would restore the waveform and analyze it. As the data
needs to be sent to the computer and saved in real time, so the bandwidth is limited to the USB
interface. As a result, when the device works with high sampling rate, only some of the channels
could be used. If you want to use all the channels, you have to reduce the sampling rate. This series
consists of LA1010 with the highest sampling rate of 100M, LA1002 with the highest sampling
rate of 24M.
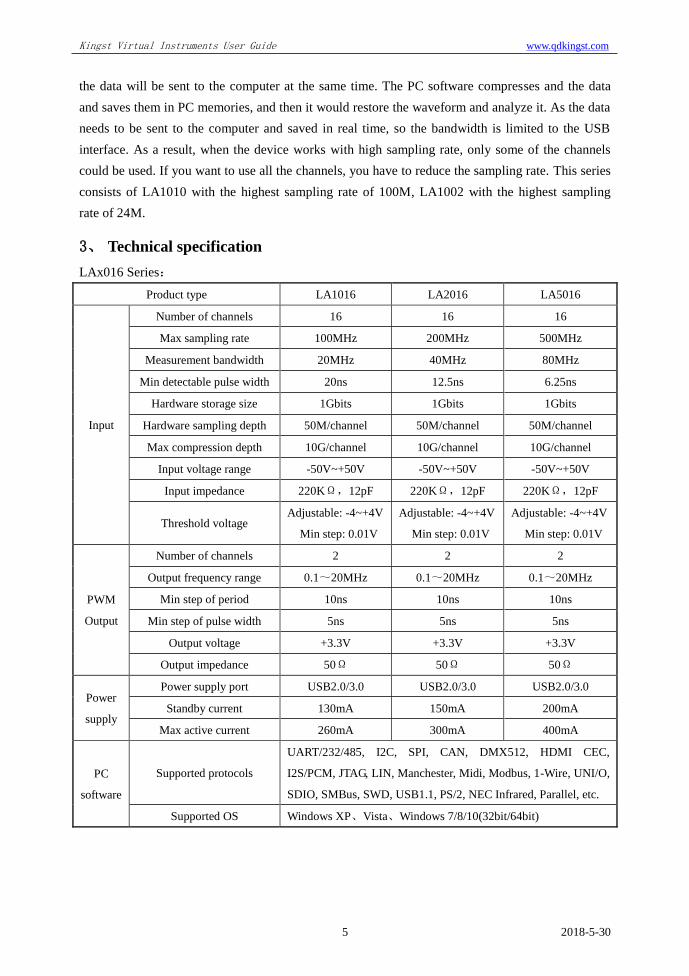
3、 Technical specification
LAx016 Series:
Product type LA1016 LA2016 LA5016
Input
Number of channels 16 16 16
Max sampling rate 100MHz 200MHz 500MHz
Measurement bandwidth 20MHz 40MHz 80MHz
Min detectable pulse width 20ns 12.5ns 6.25ns
Hardware storage size 1Gbits 1Gbits 1Gbits
Hardware sampling depth 50M/channel 50M/channel 50M/channel
Max compression depth 10G/channel 10G/channel 10G/channel
Input voltage range -50V~+50V -50V~+50V -50V~+50V
Input impedance 220KΩ,12pF 220KΩ,12pF 220KΩ,12pF
Threshold voltage Adjustable: -4~+4V
Min step: 0.01V
Adjustable: -4~+4V
Min step: 0.01V
Adjustable: -4~+4V
Min step: 0.01V
PWM
Output
Number of channels 2 2 2
Output frequency range 0.1~20MHz 0.1~20MHz 0.1~20MHz
Min step of period 10ns 10ns 10ns
Min step of pulse width 5ns 5ns 5ns
Output voltage +3.3V +3.3V +3.3V
Output impedance 50Ω 50Ω 50Ω
Power
supply
Power supply port USB2.0/3.0 USB2.0/3.0 USB2.0/3.0
Standby current 130mA 150mA 200mA
Max active current 260mA 300mA 400mA
PC
software
Supported protocols
UART/232/485, I2C, SPI, CAN, DMX512, HDMI CEC,
I2S/PCM, JTAG, LIN, Manchester, Midi, Modbus, 1-Wire, UNI/O,
SDIO, SMBus, SWD, USB1.1, PS/2, NEC Infrared, Parallel, etc.
Supported OS Windows XP、Vista、Windows 7/8/10(32bit/64bit)
Kingst Virtual Instruments User Guide www.qdkingst.com
2018-5-30 6
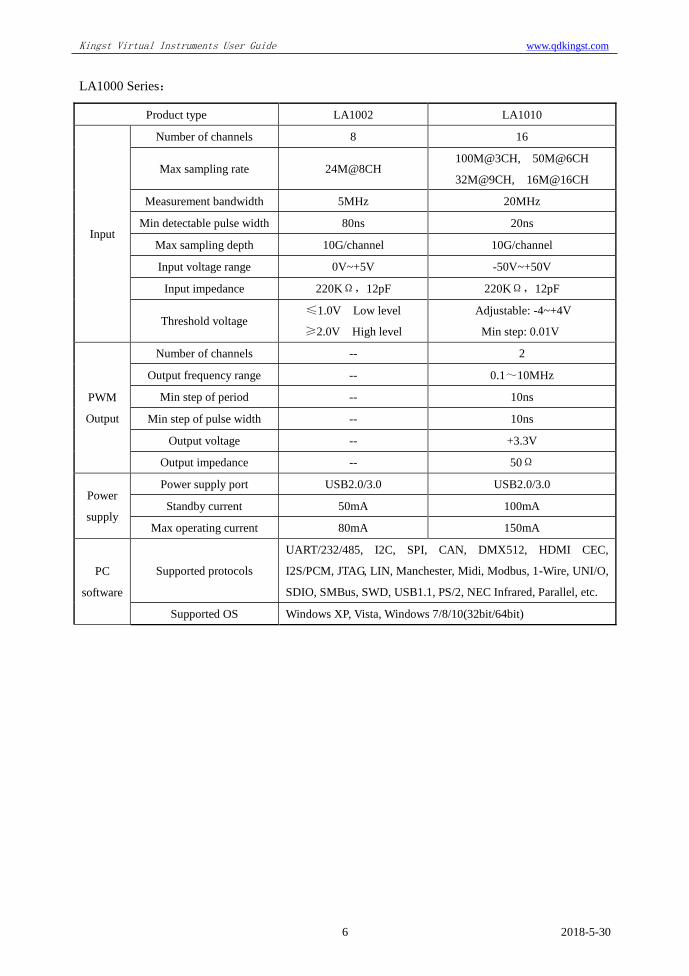
LA1000 Series:
Product type LA1002 LA1010
Input
Number of channels 8 16
Max sampling rate 24M@8CH 100M@3CH, 50M@6CH
32M@9CH, 16M@16CH
Measurement bandwidth 5MHz 20MHz
Min detectable pulse width 80ns 20ns
Max sampling depth 10G/channel 10G/channel
Input voltage range 0V~+5V -50V~+50V
Input impedance 220KΩ,12pF 220KΩ,12pF
Threshold voltage ≤1.0V Low level
≥2.0V High level
Adjustable: -4~+4V
Min step: 0.01V
PWM
Output
Number of channels -- 2
Output frequency range -- 0.1~10MHz
Min step of period -- 10ns
Min step of pulse width -- 10ns
Output voltage -- +3.3V
Output impedance -- 50Ω
Power
supply
Power supply port USB2.0/3.0 USB2.0/3.0
Standby current 50mA 100mA
Max operating current 80mA 150mA
PC
software
Supported protocols
UART/232/485, I2C, SPI, CAN, DMX512, HDMI CEC,
I2S/PCM, JTAG, LIN, Manchester, Midi, Modbus, 1-Wire, UNI/O,
SDIO, SMBus, SWD, USB1.1, PS/2, NEC Infrared, Parallel, etc.
Supported OS Windows XP, Vista, Windows 7/8/10(32bit/64bit)
Kingst Virtual Instruments User Guide www.qdkingst.com
2018-5-30 7
II. Brief introduction to Kingst VIS
1、 How to install software
Kingst virtual instruments software Kingst VIS could be found in the attached CD-ROM, or
downloaded from the web page: http://www.qdkingst.com/en/download. And the software package
is something like KingstVIS_Setup_v3.x.x.exe (v3.x.x represents the version).
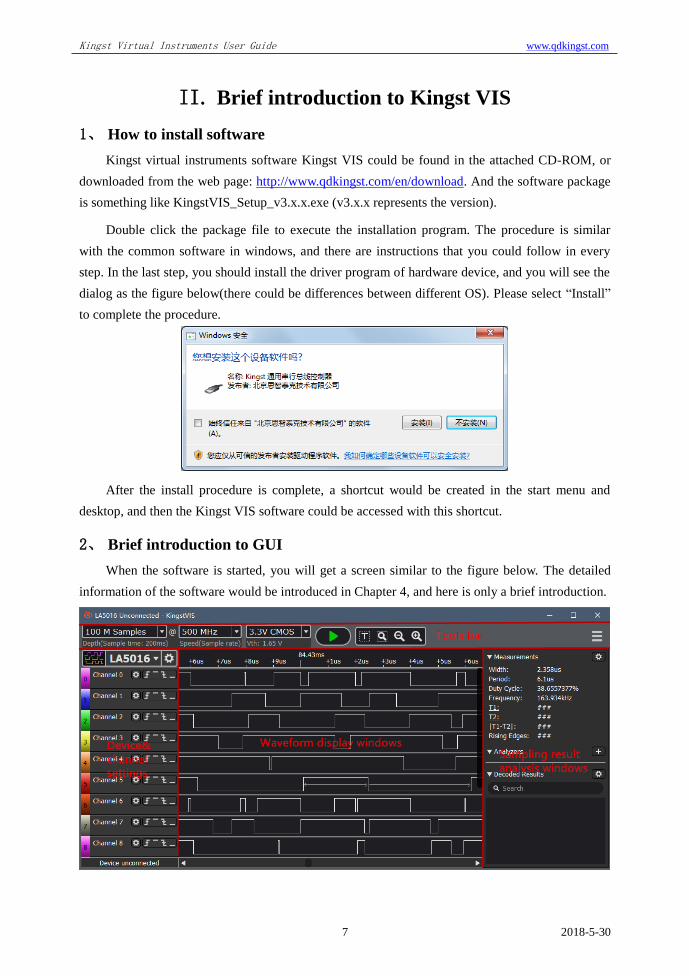
Double click the package file to execute the installation program. The procedure is similar
with the common software in windows, and there are instructions that you could follow in every
step. In the last step, you should install the driver program of hardware device, and you will see the
dialog as the figure below(there could be differences between different OS). Please select “Install”
to complete the procedure.
After the install procedure is complete, a shortcut would be created in the start menu and
desktop, and then the Kingst VIS software could be accessed with this shortcut.
2、 Brief introduction to GUI
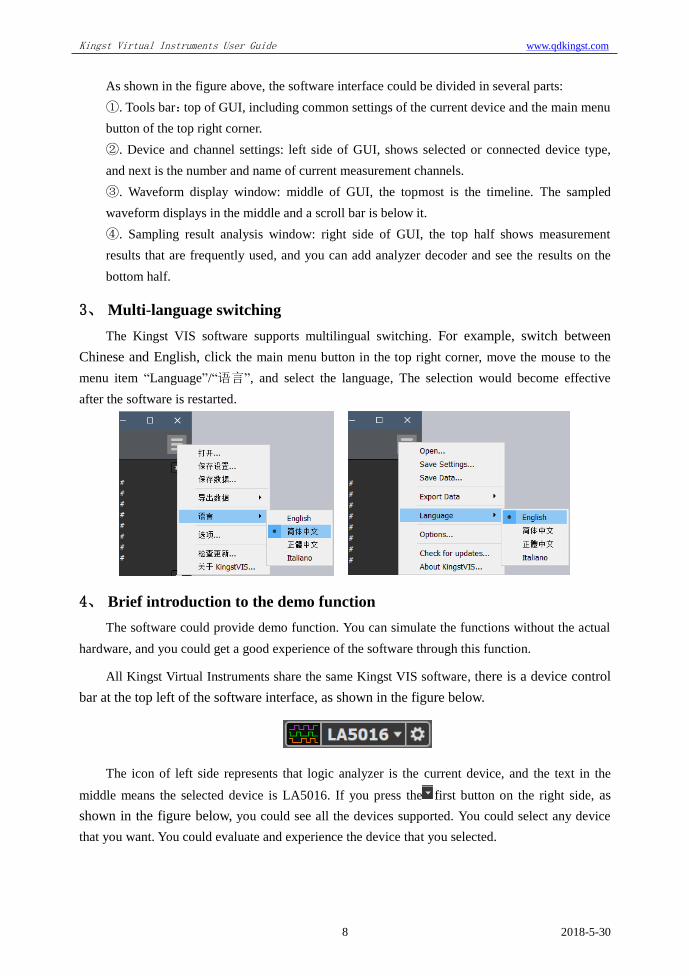
When the software is started, you will get a screen similar to the figure below. The detailed
information of the software would be introduced in Chapter 4, and here is only a brief introduction.
Kingst Virtual Instruments User Guide www.qdkingst.com
2018-5-30 8
As shown in the figure above, the software interface could be divided in several parts:
①. Tools bar:top of GUI, including common settings of the current device and the main menu
button of the top right corner.
②. Device and channel settings: left side of GUI, shows selected or connected device type,
and next is the number and name of current measurement channels.
③. Waveform display window: middle of GUI, the topmost is the timeline. The sampled
waveform displays in the middle and a scroll bar is below it.
④. Sampling result analysis window: right side of GUI, the top half shows measurement
results that are frequently used, and you can add analyzer decoder and see the results on the
bottom half.
3、 Multi-language switching
The Kingst VIS software supports multilingual switching. For example, switch between
Chinese and English, click the main menu button in the top right corner, move the mouse to the
menu item “Language”/“语言”, and select the language, The selection would become effective
after the software is restarted.
4、 Brief introduction to the demo function
The software could provide demo function. You can simulate the functions without the actual
hardware, and you could get a good experience of the software through this function.
All Kingst Virtual Instruments share the same Kingst VIS software, there is a device control
bar at the top left of the software interface, as shown in the figure below.
The icon of left side represents that logic analyzer is the current device, and the text in the
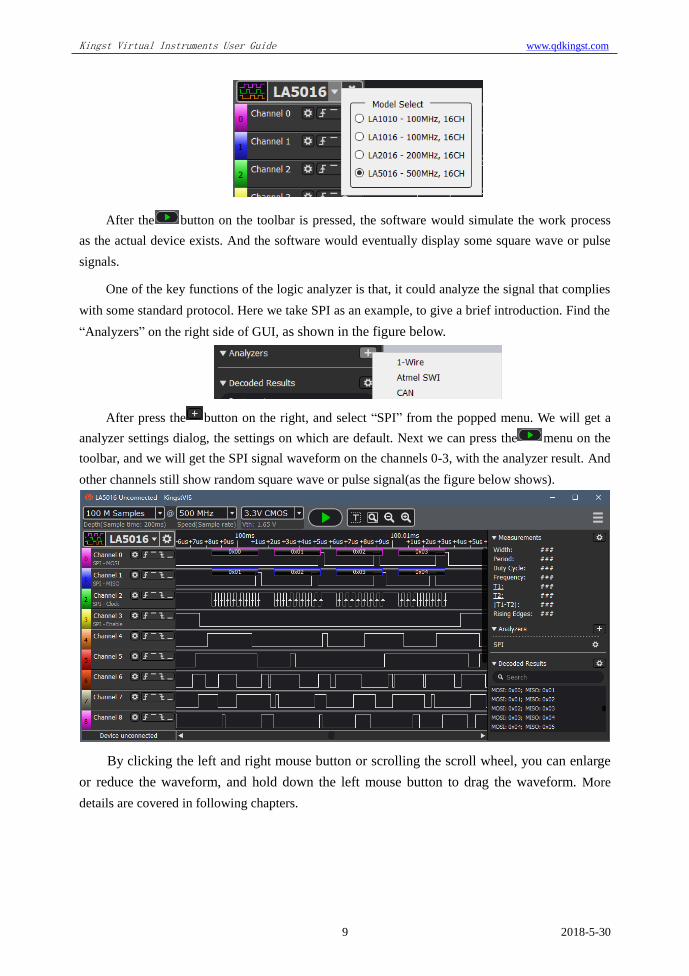
middle means the selected device is LA5016. If you press the first button on the right side, as
shown in the figure below, you could see all the devices supported. You could select any device
that you want. You could evaluate and experience the device that you selected.
Kingst Virtual Instruments User Guide www.qdkingst.com
2018-5-30 9
After the button on the toolbar is pressed, the software would simulate the work process
as the actual device exists. And the software would eventually display some square wave or pulse
signals.
One of the key functions of the logic analyzer is that, it could analyze the signal that complies
with some standard protocol. Here we take SPI as an example, to give a brief introduction. Find the
“Analyzers” on the right side of GUI, as shown in the figure below.
After press the button on the right, and select “SPI” from the popped menu. We will get a
analyzer settings dialog, the settings on which are default. Next we can press the menu on the
toolbar, and we will get the SPI signal waveform on the channels 0-3, with the analyzer result. And
other channels still show random square wave or pulse signal(as the figure below shows).
By clicking the left and right mouse button or scrolling the scroll wheel, you can enlarge
or reduce the waveform, and hold down the left mouse button to drag the waveform. More
details are covered in following chapters.
Kingst Virtual Instruments User Guide www.qdkingst.com
2018-5-30 10
III. Connect the device
1、 Connect the device to PC
After the software is installed, the logic analyzer can be connected to PC through the attached
USB cable (In case of desktop computer, use the USB port behind the tower box). Then the
computer would report that new hardware has been found. In Windows XP, there would appear a
driver installation dialog, and just select to install automatically. In Windows 7/8/10, a dialog would
appear in the lower right corner of the screen. Then the install process would start automatically,
and we just need to wait for a while. After the install process is completed, a new device called
“Kingst Instrument - Logic Analyzer” would appear in “Device Manager->Universal Serial Bus”.
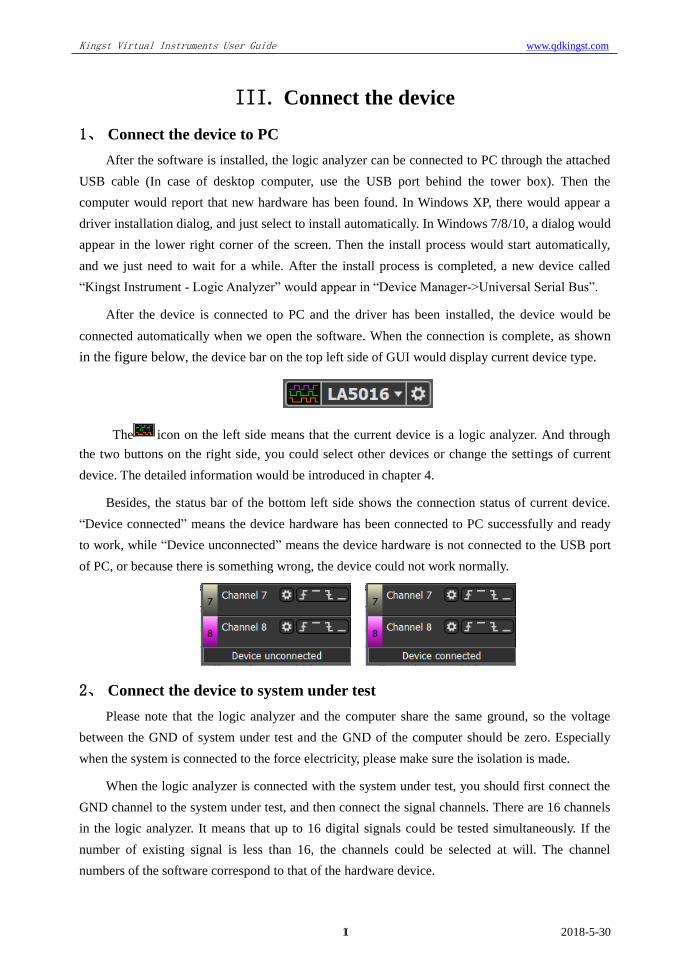
After the device is connected to PC and the driver has been installed, the device would be
connected automatically when we open the software. When the connection is complete, as shown
in the figure below, the device bar on the top left side of GUI would display current device type.
The icon on the left side means that the current device is a logic analyzer. And through
the two buttons on the right side, you could select other devices or change the settings of current
device. The detailed information would be introduced in chapter 4.
Besides, the status bar of the bottom left side shows the connection status of current device.
“Device connected” means the device hardware has been connected to PC successfully and ready
to work, while “Device unconnected” means the device hardware is not connected to the USB port
of PC, or because there is something wrong, the device could not work normally.
2、 Connect the device to system under test
Please note that the logic analyzer and the computer share the same ground, so the voltage
between the GND of system under test and the GND of the computer should be zero. Especially
when the system is connected to the force electricity, please make sure the isolation is made.
When the logic analyzer is connected with the system under test, you should first connect the
GND channel to the system under test, and then connect the signal channels. There are 16 channels
in the logic analyzer. It means that up to 16 digital signals could be tested simultaneously. If the
number of existing signal is less than 16, the channels could be selected at will. The channel
numbers of the software correspond to that of the hardware device.
Kingst Virtual Instruments User Guide www.qdkingst.com
2018-5-30 11
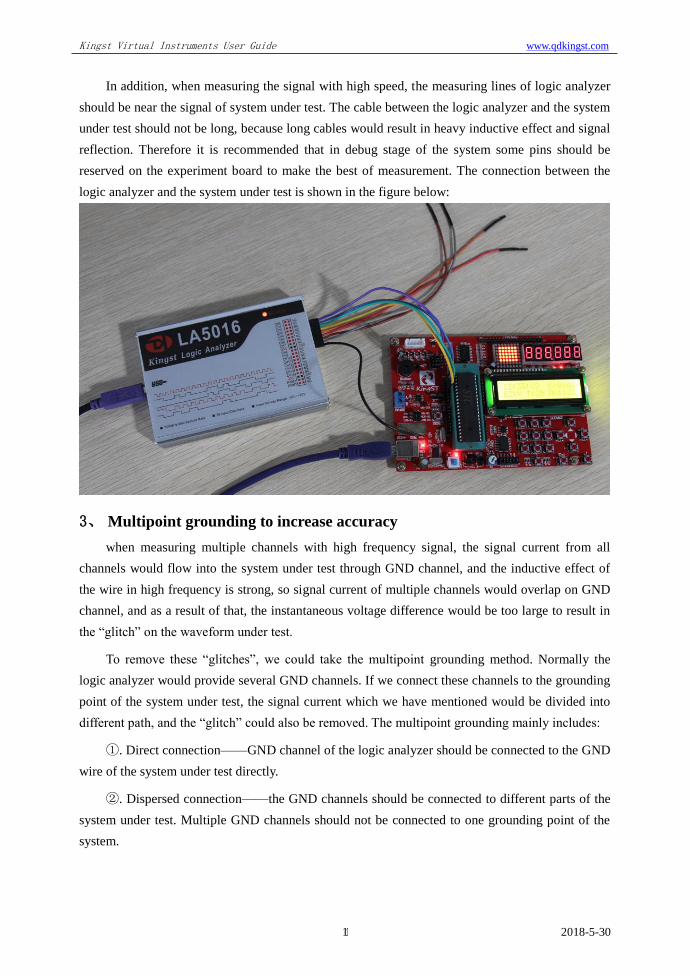
In addition, when measuring the signal with high speed, the measuring lines of logic analyzer
should be near the signal of system under test. The cable between the logic analyzer and the system
under test should not be long, because long cables would result in heavy inductive effect and signal
reflection. Therefore it is recommended that in debug stage of the system some pins should be
reserved on the experiment board to make the best of measurement. The connection between the
logic analyzer and the system under test is shown in the figure below:
3、 Multipoint grounding to increase accuracy
when measuring multiple channels with high frequency signal, the signal current from all
channels would flow into the system under test through GND channel, and the inductive effect of
the wire in high frequency is strong, so signal current of multiple channels would overlap on GND
channel, and as a result of that, the instantaneous voltage difference would be too large to result in
the “glitch” on the waveform under test.
To remove these “glitches”, we could take the multipoint grounding method. Normally the
logic analyzer would provide several GND channels. If we connect these channels to the grounding
point of the system under test, the signal current which we have mentioned would be divided into
different path, and the “glitch” could also be removed. The multipoint grounding mainly includes:
①. Direct connection——GND channel of the logic analyzer should be connected to the GND
wire of the system under test directly.
②. Dispersed connection——the GND channels should be connected to different parts of the
system under test. Multiple GND channels should not be connected to one grounding point of the
system.
Kingst Virtual Instruments User Guide www.qdkingst.com
2018-5-30 12
IV. Details of operations
After the software installation and device connection are complete, we could sample the signal
and analyze it. In this chapter we will see how to use the logic analyzer step by step. Some of these
steps need to be configured only once, and in future operations we could just skip them.
1、 Sampling depth and sampling rate settings
Sampling depth: the number of sample points that is collected in one sampling process. It
defines how much data the device could sample. The bigger the depth is, the more data the device
could sample for one time.
Sampling rate: also called sampling speed. This is the frequency the device samples, and it
equals the number of sample points per second. It defines the time accuracy of the sample result.
The higher the sampling rate is, the higher the time accuracy is. The time one sample point takes
equals “1 / Sampling rate”, that is also one sampling period.
The duration of a sampling process is equal to “sampling depth / sampling rate”. Before
sampling, you should first evaluate the signal under test, including the maximum frequency, the
sampling time, then we could select the sampling rate from the maximum frequency. To do this, the
rule we should follow is “Sampling rate must be 5 times more than the maximum frequency of the
tested signal, but 10 times would be better”. The higher the sampling rate is, the time accuracy is
higher. But the sampling rate should not be too high, as in the same sampling depth, the higher
sampling rate would result in the shorter sampling time. So when we think about the sampling time
needed, the sampling rate should be a little more than minimal requirements.
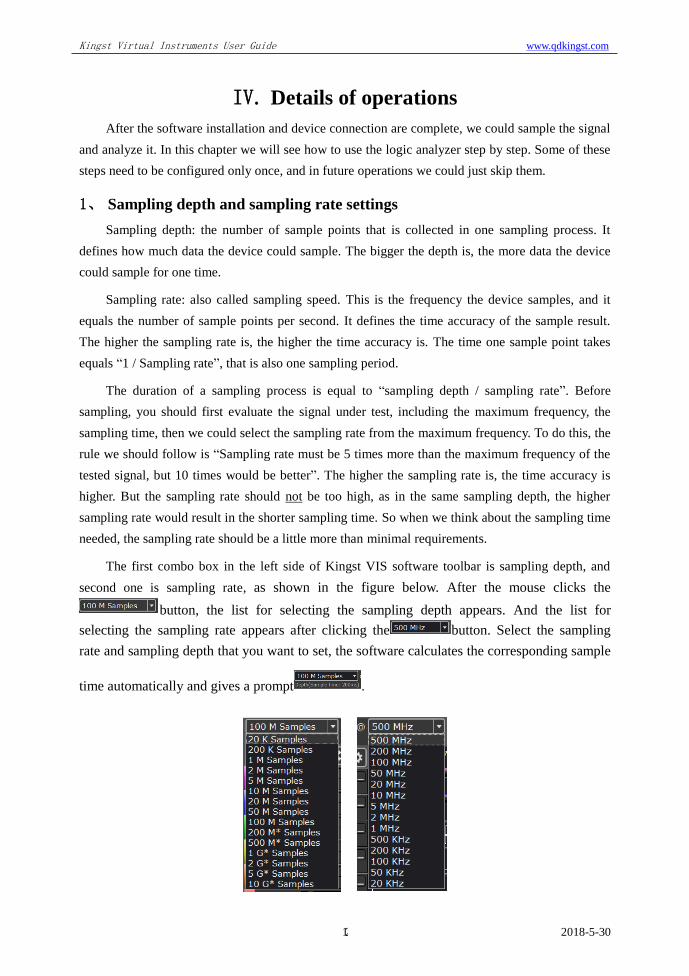
The first combo box in the left side of Kingst VIS software toolbar is sampling depth, and
second one is sampling rate, as shown in the figure below. After the mouse clicks the
button, the list for selecting the sampling depth appears. And the list for
selecting the sampling rate appears after clicking the button. Select the sampling
rate and sampling depth that you want to set, the software calculates the corresponding sample
time automatically and gives a prompt .
Kingst Virtual Instruments User Guide www.qdkingst.com
2018-5-30 13
2、 Trigger condition settings
If we have set the sampling depth to 1M and the sampling rate to 8M, we could sample the
data for 125ms. In the default settings with no trigger set, after we press the button, the logic
analyzer would begin sampling immediately, and it would stop automatically in 125ms. The
waveform of signals under test would display in PC screen. But in real environment, the signal may
not be continuous, and the user can not tell when it would occur, such as UART communication. In
this way, maybe we could not sample any effective data during the time since we pressed the
button. To solve this problem, we could utilize the trigger function.
First we set a certain condition, and then when the signal meets the condition, the data sample
would start. This is how trigger works, and the conditions here are trigger conditions, such as jump
edge of the signal, high/low level or the combinations of them. The trigger conditions should be set
based on the characteristics of the signal to test, for example, in UART communication, for the idle
state in which no data are transferred, the signal is high level, and every UART data frame is started
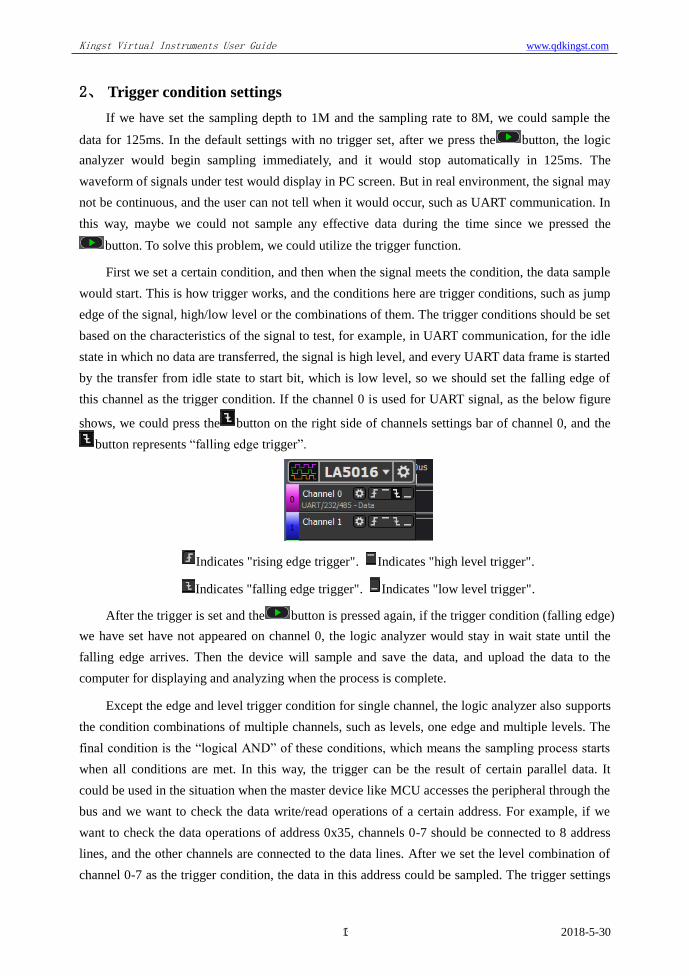
by the transfer from idle state to start bit, which is low level, so we should set the falling edge of
this channel as the trigger condition. If the channel 0 is used for UART signal, as the below figure
shows, we could press the button on the right side of channels settings bar of channel 0, and the
button represents “falling edge trigger”.
Indicates "rising edge trigger". Indicates "high level trigger".
Indicates "falling edge trigger". Indicates "low level trigger".
After the trigger is set and the button is pressed again, if the trigger condition (falling edge)
we have set have not appeared on channel 0, the logic analyzer would stay in wait state until the
falling edge arrives. Then the device will sample and save the data, and upload the data to the
computer for displaying and analyzing when the process is complete.
Except the edge and level trigger condition for single channel, the logic analyzer also supports
the condition combinations of multiple channels, such as levels, one edge and multiple levels. The
final condition is the “logical AND” of these conditions, which means the sampling process starts
when all conditions are met. In this way, the trigger can be the result of certain parallel data. It
could be used in the situation when the master device like MCU accesses the peripheral through the
bus and we want to check the data write/read operations of a certain address. For example, if we
want to check the data operations of address 0x35, channels 0-7 should be connected to 8 address
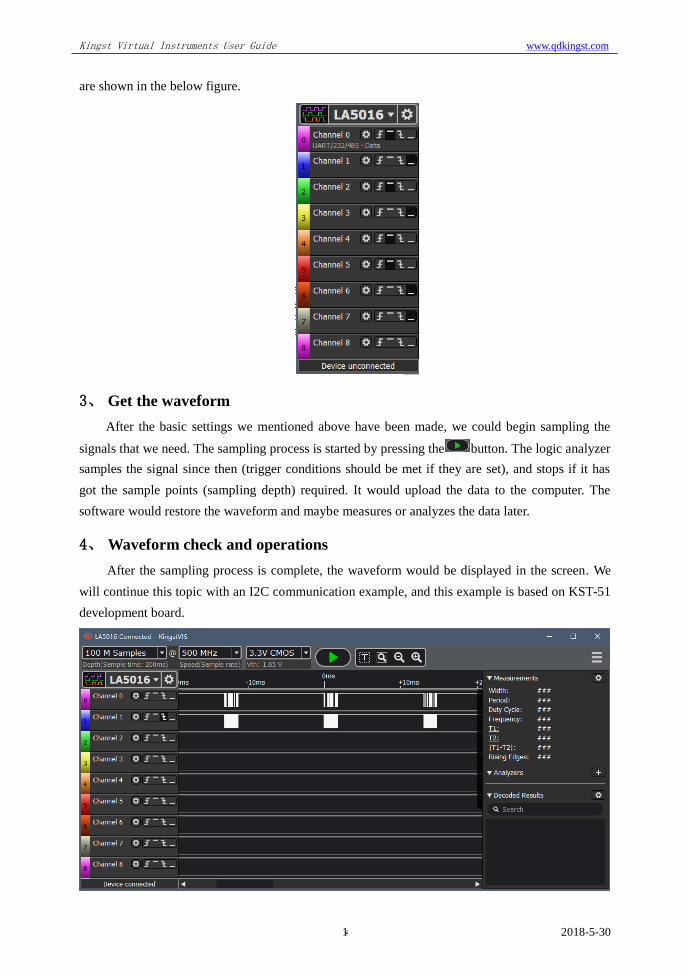
lines, and the other channels are connected to the data lines. After we set the level combination of
channel 0-7 as the trigger condition, the data in this address could be sampled. The trigger settings
Kingst Virtual Instruments User Guide www.qdkingst.com
2018-5-30 14
are shown in the below figure.
3、 Get the waveform
After the basic settings we mentioned above have been made, we could begin sampling the
signals that we need. The sampling process is started by pressing the button. The logic analyzer
samples the signal since then (trigger conditions should be met if they are set), and stops if it has
got the sample points (sampling depth) required. It would upload the data to the computer. The
software would restore the waveform and maybe measures or analyzes the data later.
4、 Waveform check and operations
After the sampling process is complete, the waveform would be displayed in the screen. We
will continue this topic with an I2C communication example, and this example is based on KST-51
development board.
Kingst Virtual Instruments User Guide www.qdkingst.com
2018-5-30 15
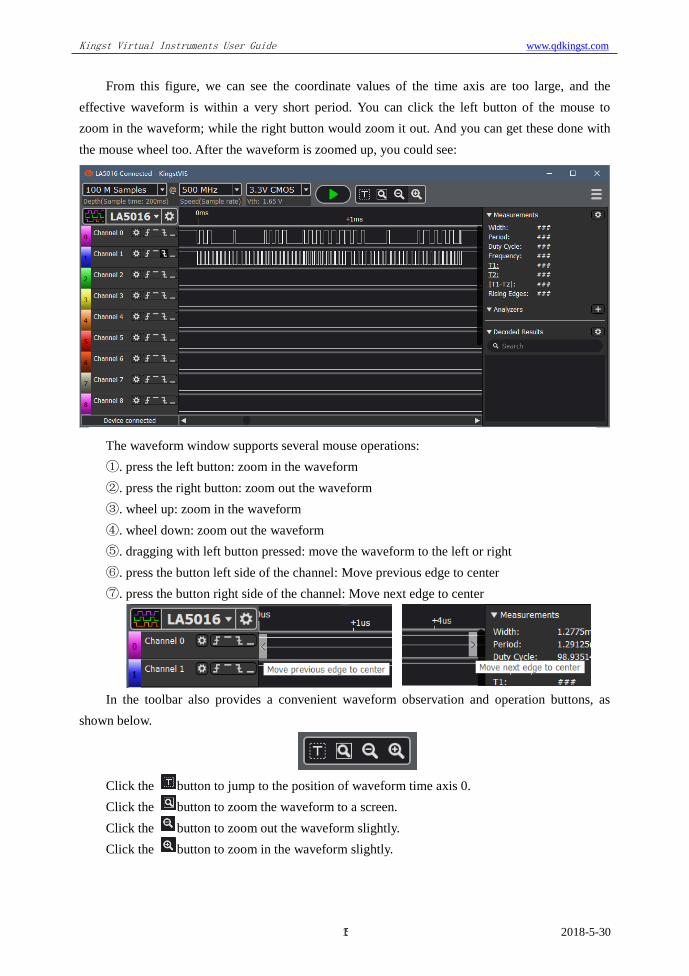
From this figure, we can see the coordinate values of the time axis are too large, and the
effective waveform is within a very short period. You can click the left button of the mouse to
zoom in the waveform; while the right button would zoom it out. And you can get these done with
the mouse wheel too. After the waveform is zoomed up, you could see:
The waveform window supports several mouse operations:
①. press the left button: zoom in the waveform
②. press the right button: zoom out the waveform
③. wheel up: zoom in the waveform
④. wheel down: zoom out the waveform
⑤. dragging with left button pressed: move the waveform to the left or right
⑥. press the button left side of the channel: Move previous edge to center
⑦. press the button right side of the channel: Move next edge to center
In the toolbar also provides a convenient waveform observation and operation buttons, as
shown below.
Click the button to jump to the position of waveform time axis 0.
Click the button to zoom the waveform to a screen.
Click the button to zoom out the waveform slightly.
Click the button to zoom in the waveform slightly.
Kingst Virtual Instruments User Guide www.qdkingst.com
2018-5-30 16
5、 Waveform measurement
Besides what we could see directly from the waveform window, we could also check some
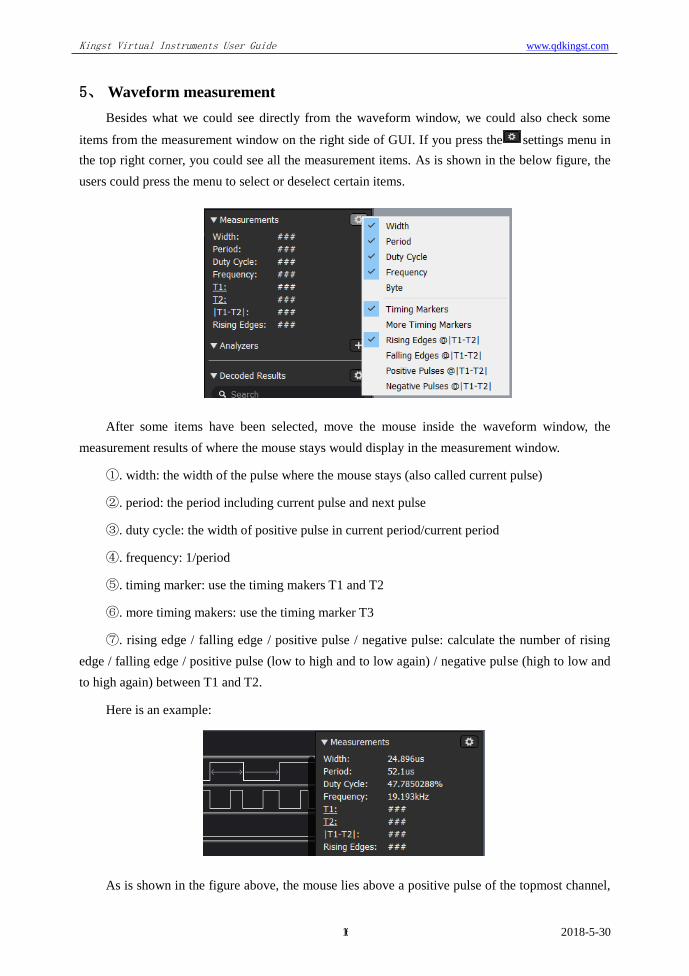
items from the measurement window on the right side of GUI. If you press the settings menu in
the top right corner, you could see all the measurement items. As is shown in the below figure, the
users could press the menu to select or deselect certain items.
After some items have been selected, move the mouse inside the waveform window, the
measurement results of where the mouse stays would display in the measurement window.
①. width: the width of the pulse where the mouse stays (also called current pulse)
②. period: the period including current pulse and next pulse
③. duty cycle: the width of positive pulse in current period/current period
④. frequency: 1/period
⑤. timing marker: use the timing makers T1 and T2
⑥. more timing makers: use the timing marker T3
⑦. rising edge / falling edge / positive pulse / negative pulse: calculate the number of rising
edge / falling edge / positive pulse (low to high and to low again) / negative pulse (high to low and
to high again) between T1 and T2.
Here is an example:
As is shown in the figure above, the mouse lies above a positive pulse of the topmost channel,
Kingst Virtual Instruments User Guide www.qdkingst.com
2018-5-30 17
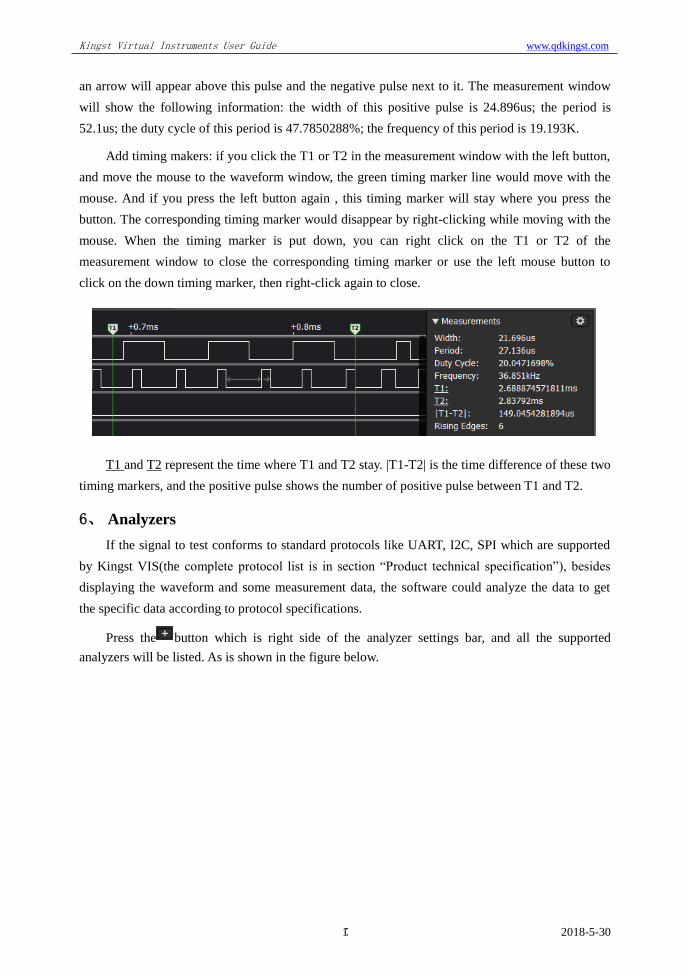
an arrow will appear above this pulse and the negative pulse next to it. The measurement window
will show the following information: the width of this positive pulse is 24.896us; the period is
52.1us; the duty cycle of this period is 47.7850288%; the frequency of this period is 19.193K.
Add timing makers: if you click the T1 or T2 in the measurement window with the left button,
and move the mouse to the waveform window, the green timing marker line would move with the
mouse. And if you press the left button again , this timing marker will stay where you press the
button. The corresponding timing marker would disappear by right-clicking while moving with the
mouse. When the timing marker is put down, you can right click on the T1 or T2 of the
measurement window to close the corresponding timing marker or use the left mouse button to
click on the down timing marker, then right-click again to close.
T1 and T2 represent the time where T1 and T2 stay. |T1-T2| is the time difference of these two
timing markers, and the positive pulse shows the number of positive pulse between T1 and T2.
6、 Analyzers
If the signal to test conforms to standard protocols like UART, I2C, SPI which are supported
by Kingst VIS(the complete protocol list is in section “Product technical specification”), besides
displaying the waveform and some measurement data, the software could analyze the data to get
the specific data according to protocol specifications.
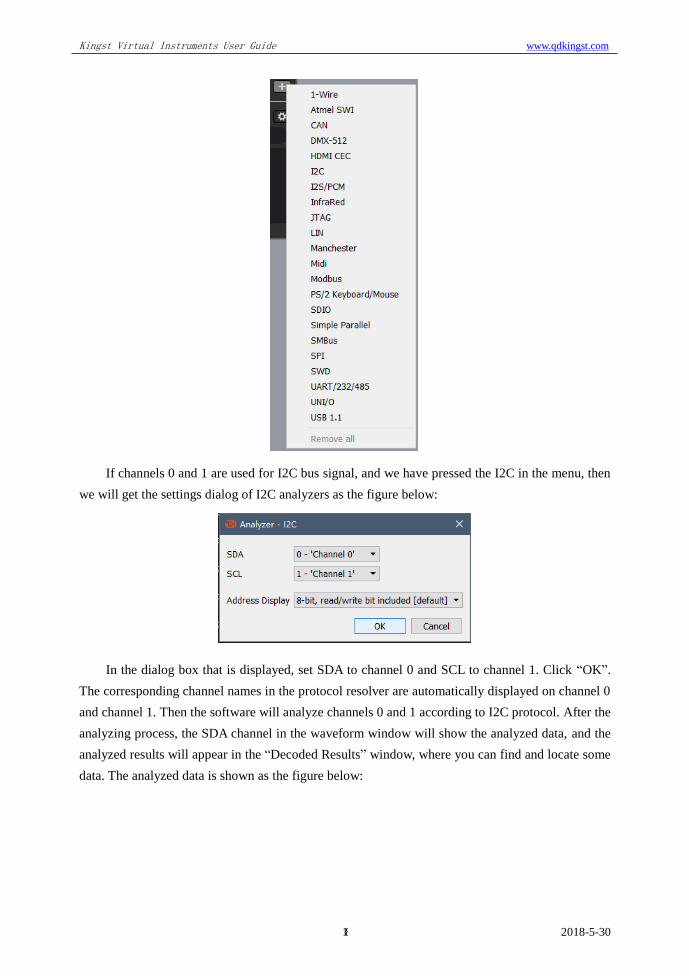
Press the button which is right side of the analyzer settings bar, and all the supported
analyzers will be listed. As is shown in the figure below.
Kingst Virtual Instruments User Guide www.qdkingst.com
2018-5-30 18
If channels 0 and 1 are used for I2C bus signal, and we have pressed the I2C in the menu, then
we will get the settings dialog of I2C analyzers as the figure below:
In the dialog box that is displayed, set SDA to channel 0 and SCL to channel 1. Click “OK”.
The corresponding channel names in the protocol resolver are automatically displayed on channel 0
and channel 1. Then the software will analyze channels 0 and 1 according to I2C protocol. After the
analyzing process, the SDA channel in the waveform window will show the analyzed data, and the
analyzed results will appear in the “Decoded Results” window, where you can find and locate some
data. The analyzed data is shown as the figure below:
Kingst Virtual Instruments User Guide www.qdkingst.com
2018-5-30 19
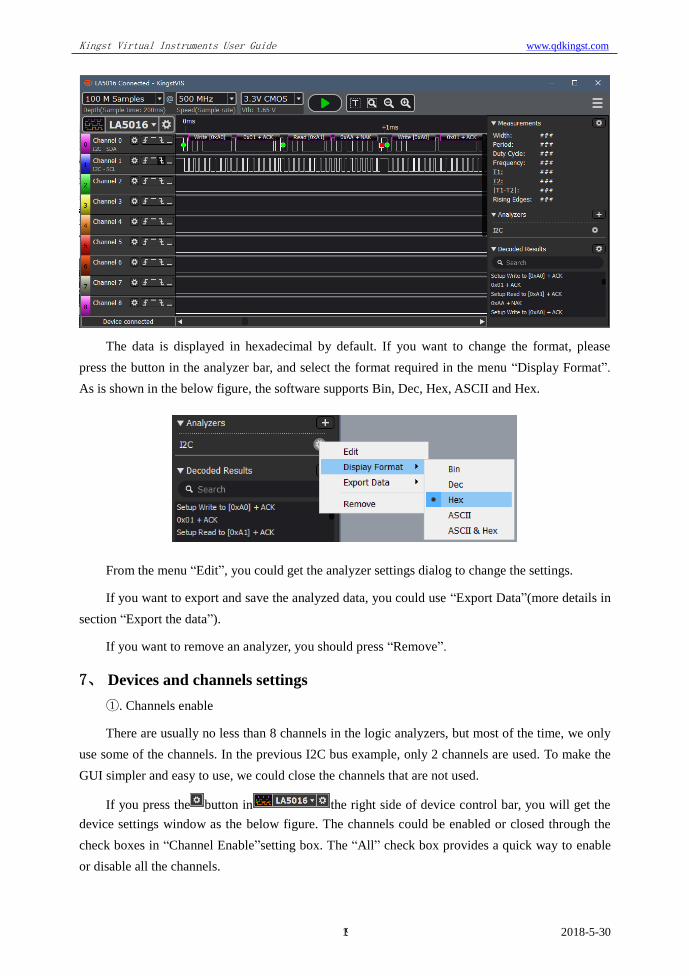
The data is displayed in hexadecimal by default. If you want to change the format, please
press the button in the analyzer bar, and select the format required in the menu “Display Format”.
As is shown in the below figure, the software supports Bin, Dec, Hex, ASCII and Hex.
From the menu “Edit”, you could get the analyzer settings dialog to change the settings.
If you want to export and save the analyzed data, you could use “Export Data”(more details in
section “Export the data”).
If you want to remove an analyzer, you should press “Remove”.
7、 Devices and channels settings
①. Channels enable
There are usually no less than 8 channels in the logic analyzers, but most of the time, we only
use some of the channels. In the previous I2C bus example, only 2 channels are used. To make the
GUI simpler and easy to use, we could close the channels that are not used.
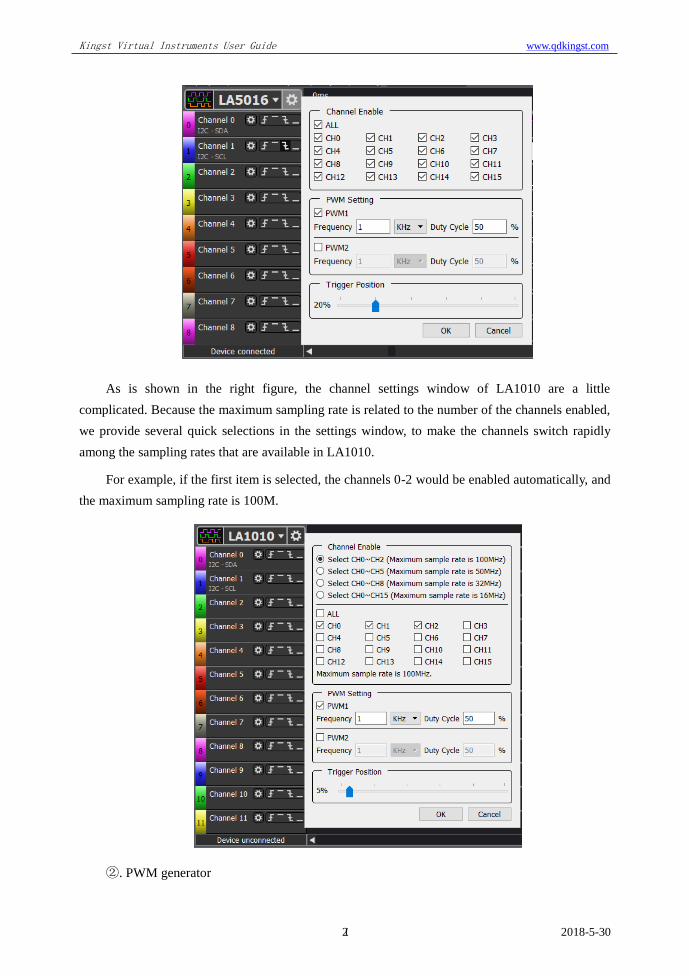
If you press the button in the right side of device control bar, you will get the
device settings window as the below figure. The channels could be enabled or closed through the
check boxes in “Channel Enable”setting box. The “All” check box provides a quick way to enable
or disable all the channels.
Kingst Virtual Instruments User Guide www.qdkingst.com
2018-5-30 20
As is shown in the right figure, the channel settings window of LA1010 are a little
complicated. Because the maximum sampling rate is related to the number of the channels enabled,
we provide several quick selections in the settings window, to make the channels switch rapidly
among the sampling rates that are available in LA1010.
For example, if the first item is selected, the channels 0-2 would be enabled automatically, and
the maximum sampling rate is 100M.
②. PWM generator
Kingst Virtual Instruments User Guide www.qdkingst.com
2018-5-30 21
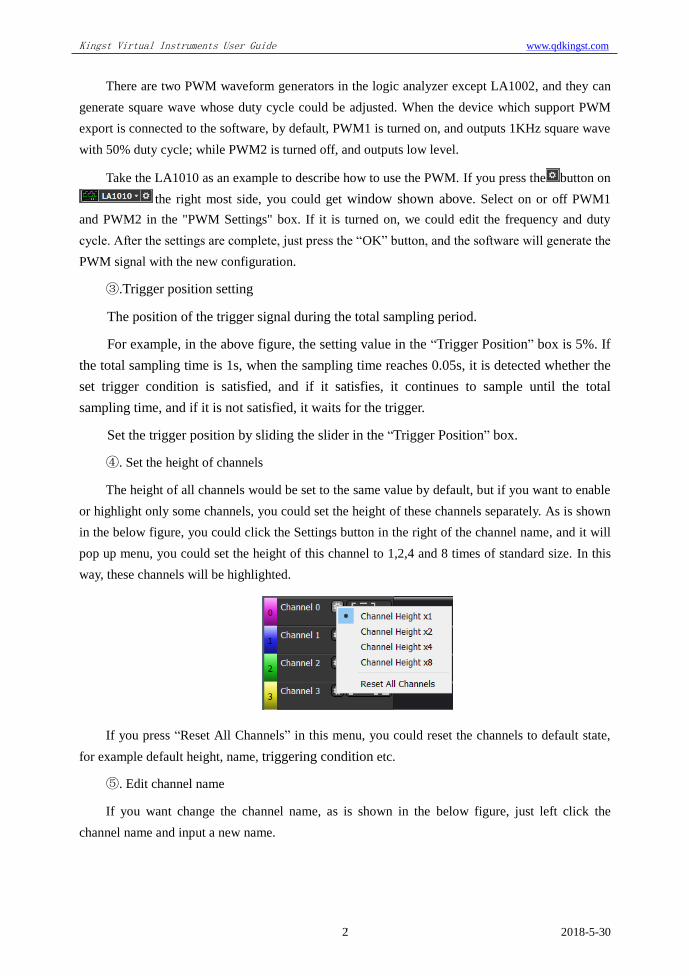
There are two PWM waveform generators in the logic analyzer except LA1002, and they can
generate square wave whose duty cycle could be adjusted. When the device which support PWM
export is connected to the software, by default, PWM1 is turned on, and outputs 1KHz square wave
with 50% duty cycle; while PWM2 is turned off, and outputs low level.
Take the LA1010 as an example to describe how to use the PWM. If you press the button on
the right most side, you could get window shown above. Select on or off PWM1
and PWM2 in the "PWM Settings" box. If it is turned on, we could edit the frequency and duty
cycle. After the settings are complete, just press the “OK” button, and the software will generate the
PWM signal with the new configuration.
③.Trigger position setting
The position of the trigger signal during the total sampling period.
For example, in the above figure, the setting value in the “Trigger Position” box is 5%. If
the total sampling time is 1s, when the sampling time reaches 0.05s, it is detected whether the
set trigger condition is satisfied, and if it satisfies, it continues to sample until the total
sampling time, and if it is not satisfied, it waits for the trigger.
Set the trigger position by sliding the slider in the “Trigger Position” box.
④. Set the height of channels
The height of all channels would be set to the same value by default, but if you want to enable
or highlight only some channels, you could set the height of these channels separately. As is shown
in the below figure, you could click the Settings button in the right of the channel name, and it will
pop up menu, you could set the height of this channel to 1,2,4 and 8 times of standard size. In this
way, these channels will be highlighted.
If you press “Reset All Channels” in this menu, you could reset the channels to default state,
for example default height, name, triggering condition etc.
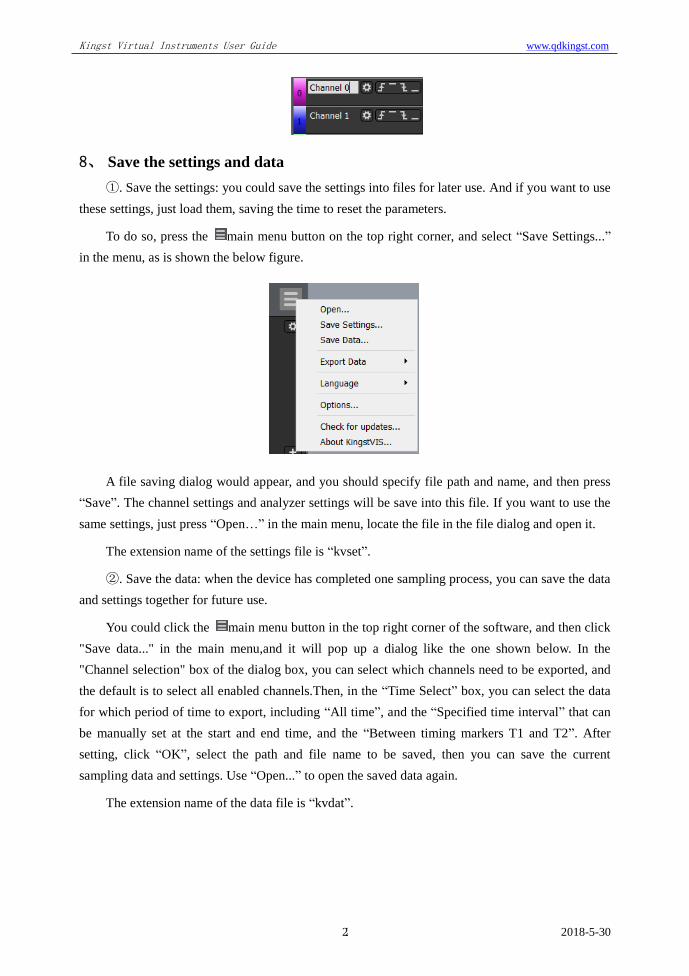
⑤. Edit channel name
If you want change the channel name, as is shown in the below figure, just left click the
channel name and input a new name.
Kingst Virtual Instruments User Guide www.qdkingst.com
2018-5-30 22
8、 Save the settings and data
①. Save the settings: you could save the settings into files for later use. And if you want to use
these settings, just load them, saving the time to reset the parameters.
To do so, press the main menu button on the top right corner, and select “Save Settings...”
in the menu, as is shown the below figure.
A file saving dialog would appear, and you should specify file path and name, and then press
“Save”. The channel settings and analyzer settings will be save into this file. If you want to use the
same settings, just press “Open…” in the main menu, locate the file in the file dialog and open it.
The extension name of the settings file is “kvset”.
②. Save the data: when the device has completed one sampling process, you can save the data
and settings together for future use.
You could click the main menu button in the top right corner of the software, and then click
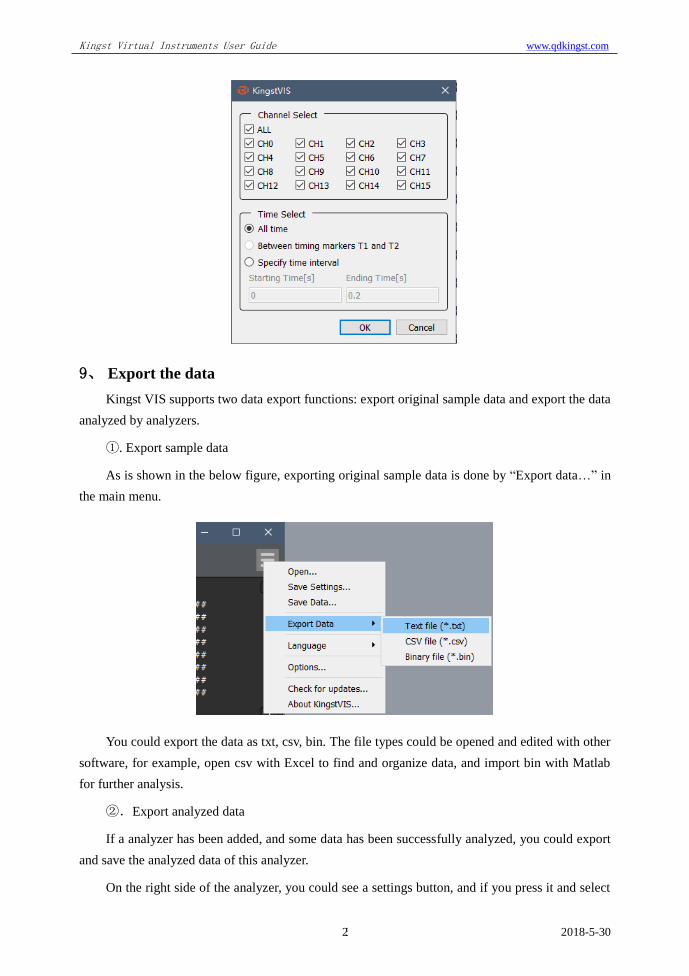
"Save data..." in the main menu,and it will pop up a dialog like the one shown below. In the
"Channel selection" box of the dialog box, you can select which channels need to be exported, and
the default is to select all enabled channels.Then, in the “Time Select” box, you can select the data
for which period of time to export, including “All time”, and the “Specified time interval” that can
be manually set at the start and end time, and the “Between timing markers T1 and T2”. After
setting, click “OK”, select the path and file name to be saved, then you can save the current
sampling data and settings. Use “Open...” to open the saved data again.
The extension name of the data file is “kvdat”.
Kingst Virtual Instruments User Guide www.qdkingst.com
2018-5-30 23
9、 Export the data
Kingst VIS supports two data export functions: export original sample data and export the data
analyzed by analyzers.
①. Export sample data
As is shown in the below figure, exporting original sample data is done by “Export data…” in
the main menu.
You could export the data as txt, csv, bin. The file types could be opened and edited with other
software, for example, open csv with Excel to find and organize data, and import bin with Matlab
for further analysis.
②.Export analyzed data
If a analyzer has been added, and some data has been successfully analyzed, you could export
and save the analyzed data of this analyzer.
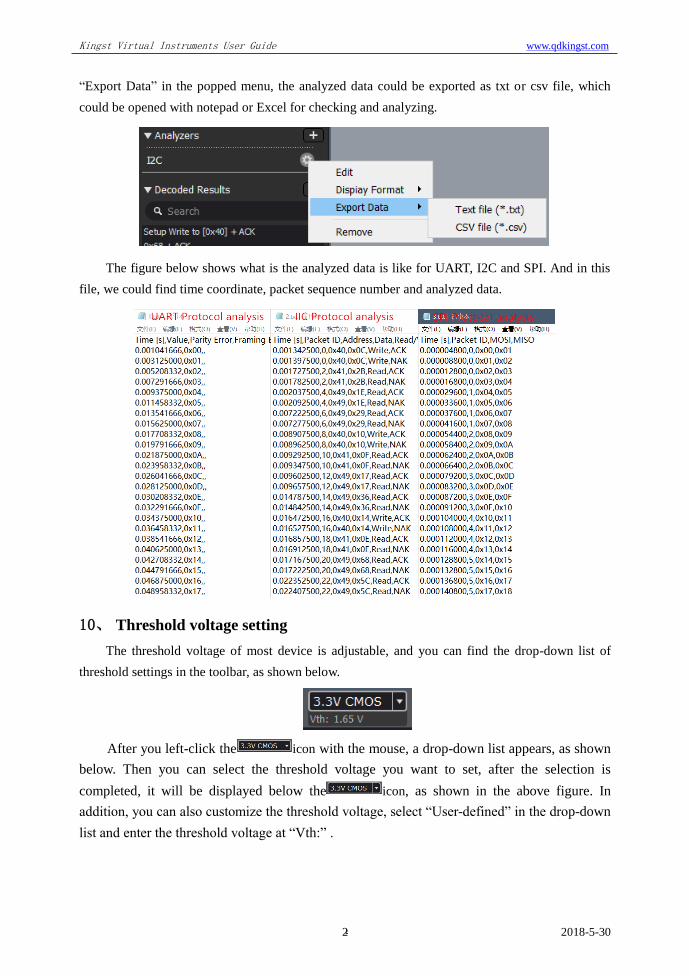
On the right side of the analyzer, you could see a settings button, and if you press it and select
Kingst Virtual Instruments User Guide www.qdkingst.com
2018-5-30 24
“Export Data” in the popped menu, the analyzed data could be exported as txt or csv file, which
could be opened with notepad or Excel for checking and analyzing.
The figure below shows what is the analyzed data is like for UART, I2C and SPI. And in this
file, we could find time coordinate, packet sequence number and analyzed data.
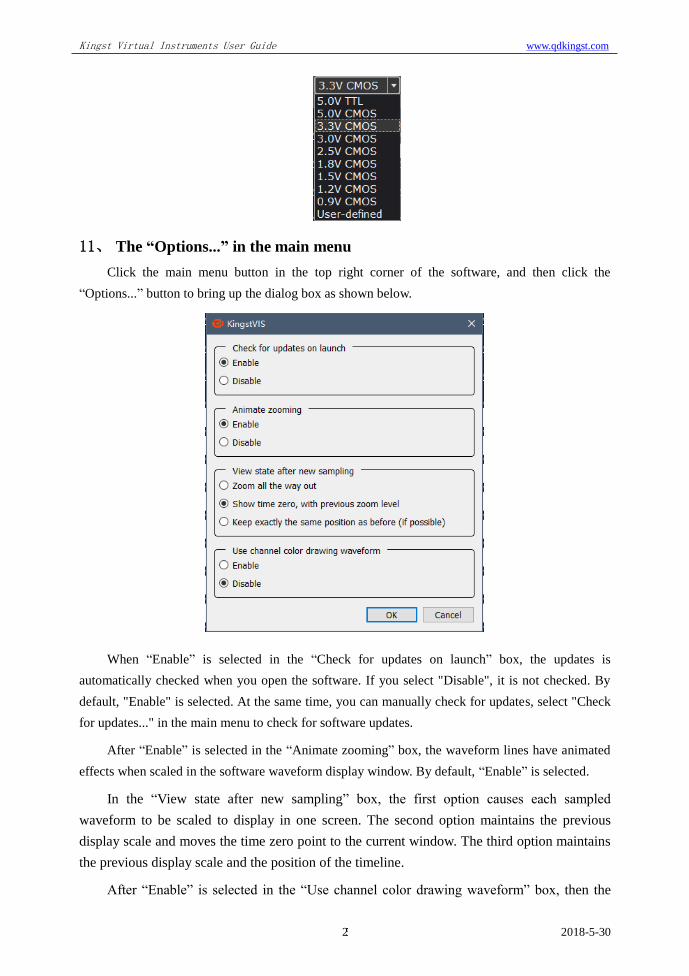
10、 Threshold voltage setting
The threshold voltage of most device is adjustable, and you can find the drop-down list of
threshold settings in the toolbar, as shown below.
After you left-click the icon with the mouse, a drop-down list appears, as shown
below. Then you can select the threshold voltage you want to set, after the selection is
completed, it will be displayed below the icon, as shown in the above figure. In
addition, you can also customize the threshold voltage, select “User-defined” in the drop-down
list and enter the threshold voltage at “Vth:” .
Kingst Virtual Instruments User Guide www.qdkingst.com
2018-5-30 25
11、 The “Options...” in the main menu
Click the main menu button in the top right corner of the software, and then click the
“Options...” button to bring up the dialog box as shown below.
When “Enable” is selected in the “Check for updates on launch” box, the updates is
automatically checked when you open the software. If you select "Disable", it is not checked. By
default, "Enable" is selected. At the same time, you can manually check for updates, select "Check
for updates..." in the main menu to check for software updates.
After “Enable” is selected in the “Animate zooming” box, the waveform lines have animated
effects when scaled in the software waveform display window. By default, “Enable” is selected.
In the “View state after new sampling” box, the first option causes each sampled
waveform to be scaled to display in one screen. The second option maintains the previous
display scale and moves the time zero point to the current window. The third option maintains
the previous display scale and the position of the timeline.
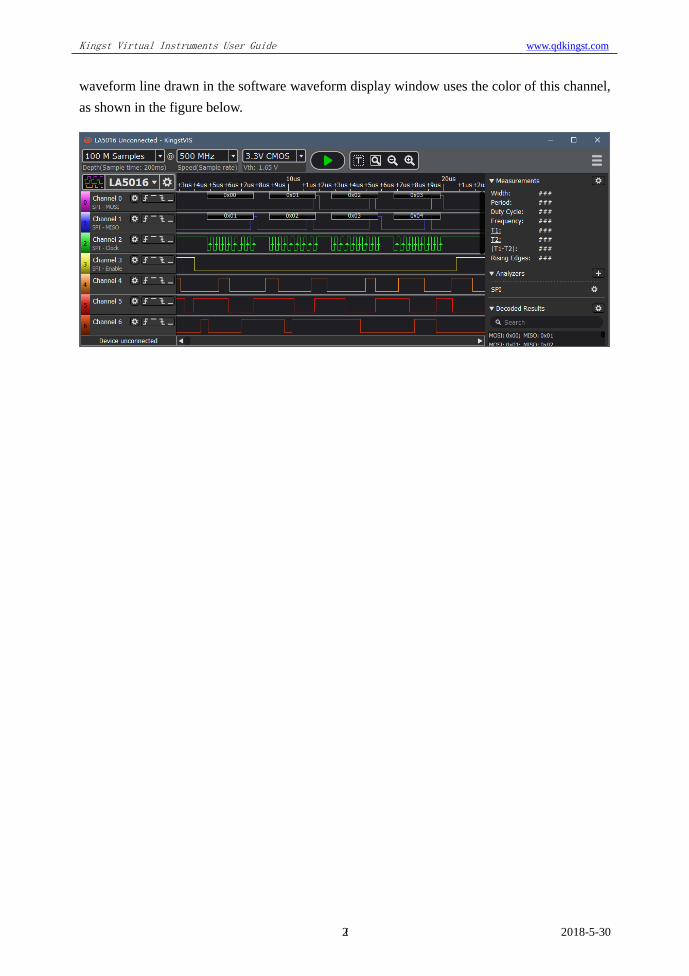
After “Enable” is selected in the “Use channel color drawing waveform” box, then the
Kingst Virtual Instruments User Guide www.qdkingst.com
2018-5-30 26
waveform line drawn in the software waveform display window uses the color of this channel,
as shown in the figure below.
Kingst Virtual Instruments User Guide www.qdkingst.com
2018-5-30 27
V. Settings for standard protocols
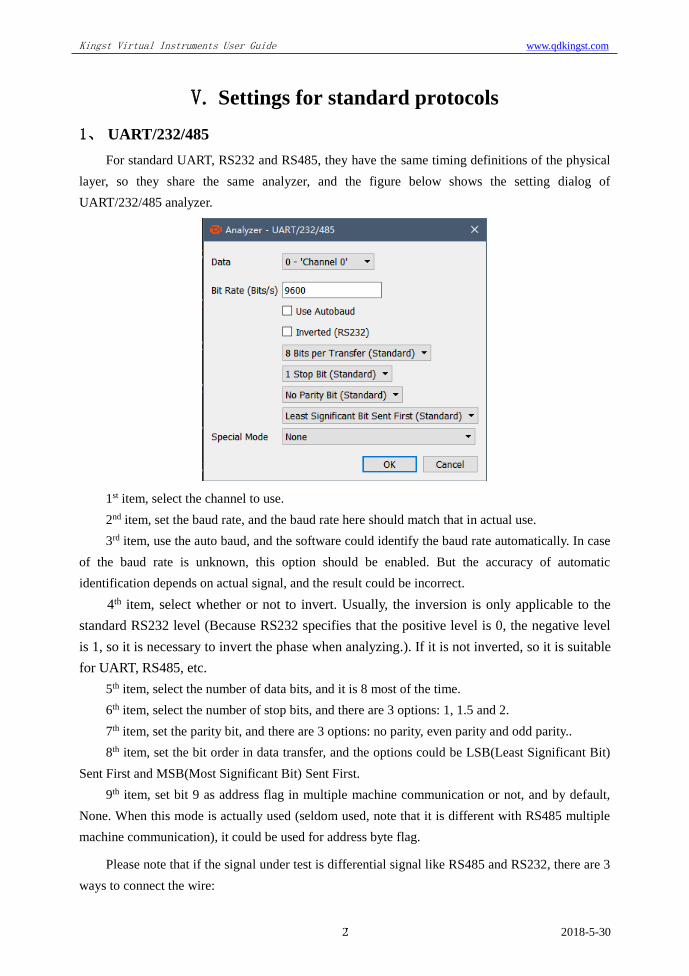
1、 UART/232/485
For standard UART, RS232 and RS485, they have the same timing definitions of the physical
layer, so they share the same analyzer, and the figure below shows the setting dialog of
UART/232/485 analyzer.
1st item, select the channel to use.
2nd item, set the baud rate, and the baud rate here should match that in actual use.
3rd item, use the auto baud, and the software could identify the baud rate automatically. In case
of the baud rate is unknown, this option should be enabled. But the accuracy of automatic
identification depends on actual signal, and the result could be incorrect.
4th item, select whether or not to invert. Usually, the inversion is only applicable to the
standard RS232 level (Because RS232 specifies that the positive level is 0, the negative level
is 1, so it is necessary to invert the phase when analyzing.). If it is not inverted, so it is suitable
for UART, RS485, etc.
5th item, select the number of data bits, and it is 8 most of the time.
6th item, select the number of stop bits, and there are 3 options: 1, 1.5 and 2.
7th item, set the parity bit, and there are 3 options: no parity, even parity and odd parity..
8th item, set the bit order in data transfer, and the options could be LSB(Least Significant Bit)
Sent First and MSB(Most Significant Bit) Sent First.
9th item, set bit 9 as address flag in multiple machine communication or not, and by default,
None. When this mode is actually used (seldom used, note that it is different with RS485 multiple
machine communication), it could be used for address byte flag.
Please note that if the signal under test is differential signal like RS485 and RS232, there are 3
ways to connect the wire:
Kingst Virtual Instruments User Guide www.qdkingst.com
2018-5-30 28
①. The GND channel of the logic analyzer is connected to the GND of the test system, and 2
signal channels are connected to RXD and TXD pins of the level shift chip respectively.
②. The GND channel of the logic analyzer is connected to the GND of the test system, and 1
signal channel is connected to the RS485-A.
③. Connect the RS485 bus to a module that transfer RS485 to TTL, and the GND and a signal
channel of the logic analyzer are connected to the GND and signal export end of the system under
test.
Most of the time, all these 3 ways could be used to sample the signal, but according to RS485
specification, the voltage which the A-B ends could identify is between 0.2~6V. In complicated
situations, such as master with many slaves or long wire, the difference of the bus end could be too
little, and the logic analyzer could not identify the signal level correctly with method 2. So method
1 and method 3 are recommended if conditions permit.
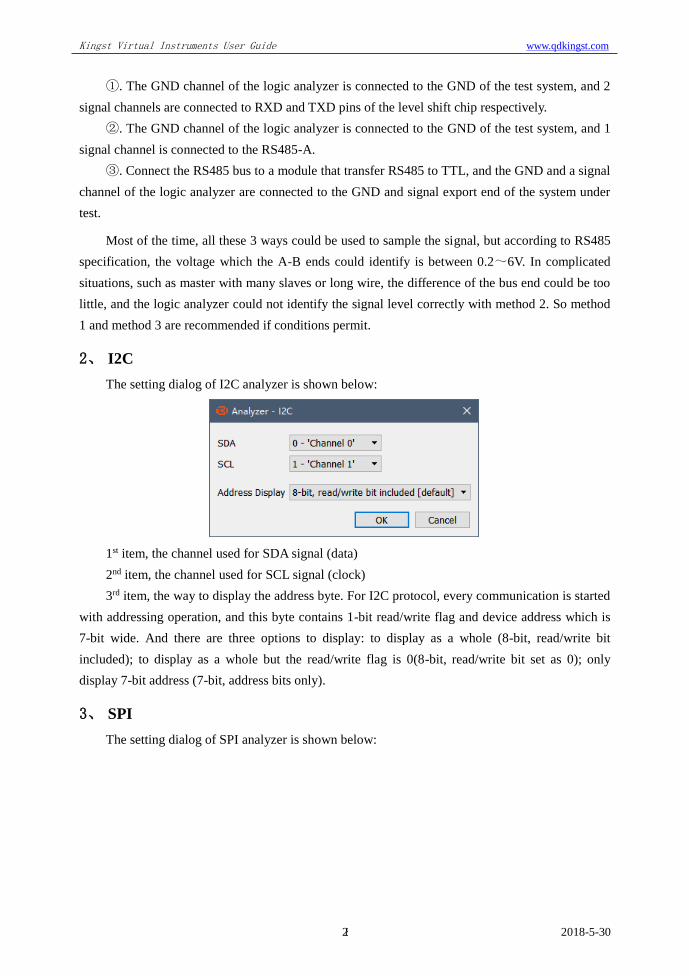
2、 I2C
The setting dialog of I2C analyzer is shown below:
1st item, the channel used for SDA signal (data)
2nd item, the channel used for SCL signal (clock)
3rd item, the way to display the address byte. For I2C protocol, every communication is started
with addressing operation, and this byte contains 1-bit read/write flag and device address which is
7-bit wide. And there are three options to display: to display as a whole (8-bit, read/write bit
included); to display as a whole but the read/write flag is 0(8-bit, read/write bit set as 0); only
display 7-bit address (7-bit, address bits only).
3、 SPI
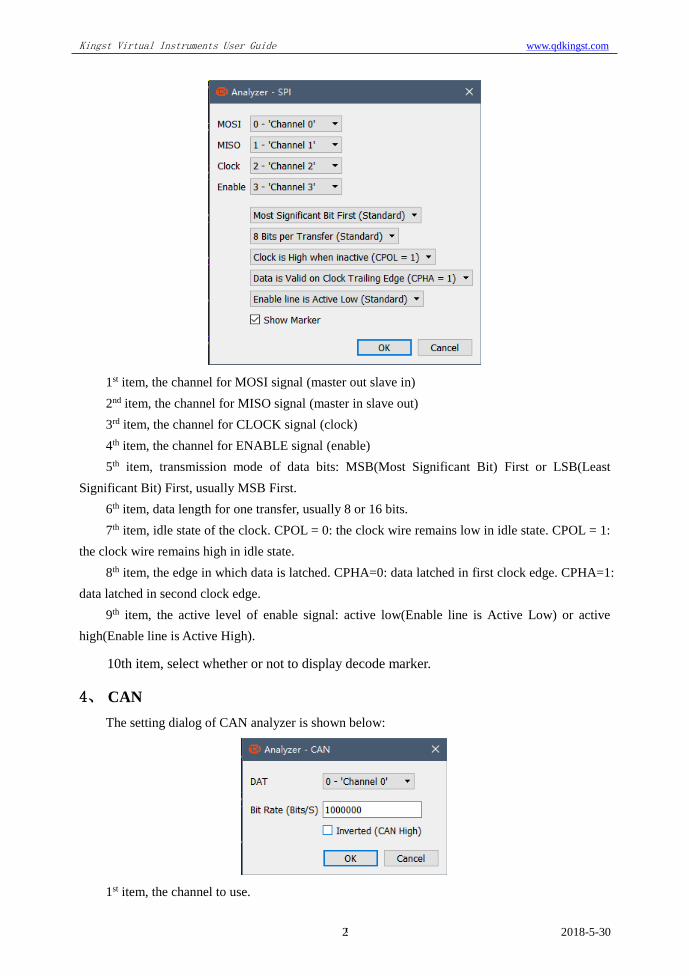
The setting dialog of SPI analyzer is shown below:
Kingst Virtual Instruments User Guide www.qdkingst.com
2018-5-30 29
1st item, the channel for MOSI signal (master out slave in)
2nd item, the channel for MISO signal (master in slave out)
3rd item, the channel for CLOCK signal (clock)
4th item, the channel for ENABLE signal (enable)
5th item, transmission mode of data bits: MSB(Most Significant Bit) First or LSB(Least
Significant Bit) First, usually MSB First.
6th item, data length for one transfer, usually 8 or 16 bits.
7th item, idle state of the clock. CPOL = 0: the clock wire remains low in idle state. CPOL = 1:
the clock wire remains high in idle state.
8th item, the edge in which data is latched. CPHA=0: data latched in first clock edge. CPHA=1:
data latched in second clock edge.
9th item, the active level of enable signal: active low(Enable line is Active Low) or active
high(Enable line is Active High).
10th item, select whether or not to display decode marker.
4、 CAN
The setting dialog of CAN analyzer is shown below:
1st item, the channel to use.
Kingst Virtual Instruments User Guide www.qdkingst.com
2018-5-30 30
2nd item, baud rate in communication.
3rd item, set the logic to invert, need to invert when measuring CAN-High signal line
directly.
Please note that the signal from CAN bus is differential, there are 3 ways to measure CAN
signal:
①. The GND channel of the logic analyzer is connected to the GND of the test system, and 2
signal channels are connected to RXD and TXD pins of the level shift chip respectively.
②. The GND channel of the logic analyzer is connected to the L end of CAN bus, and 1 signal
channel is connected to the CAN-H, and now you should select “Inverted (CAN High)”.
③. Connect the CAN bus to a module that transfer CAN to TTL, and the GND and a signal
channel of the logic analyzer are connected to the GND and signal export end of the system under
test.
Most of the time, all these 3 ways could be used to sample the signal, but according to CAN
specification, the voltage between the H-L ends is 0V and 2V. In complicated situations, such as
master with many slaves or long wire, the difference of the bus end could be too little, and the logic
analyzer could not identify the signal level correctly with method 2. In addition, the GND channel
of method 2 need to be connected to the CAN-L end, but if other signals need to be tested at the
same time, the grounding could be confusing. So method 1 and method 3 are recommended if
conditions permit.
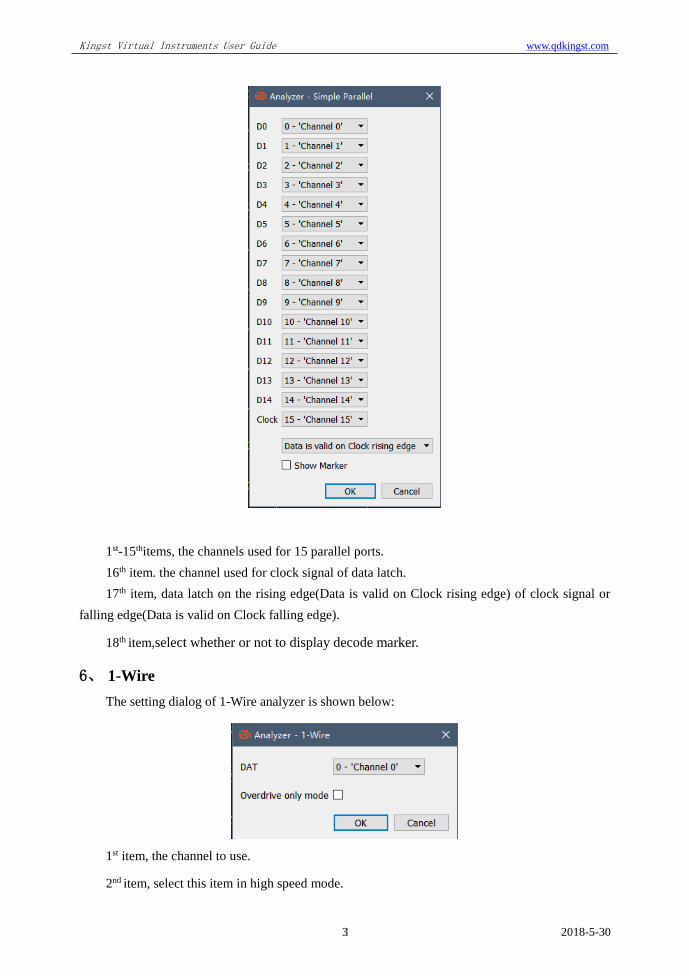
5、 Simple Parallel
The setting dialog of simple parallel analyzer is shown below:
Kingst Virtual Instruments User Guide www.qdkingst.com
2018-5-30 31
1st-15thitems, the channels used for 15 parallel ports.
16th item. the channel used for clock signal of data latch.
17th item, data latch on the rising edge(Data is valid on Clock rising edge) of clock signal or
falling edge(Data is valid on Clock falling edge).
18th item,select whether or not to display decode marker.
6、 1-Wire
The setting dialog of 1-Wire analyzer is shown below:
1st item, the channel to use.
2nd item, select this item in high speed mode.
Kingst Virtual Instruments User Guide www.qdkingst.com
2018-5-30 32
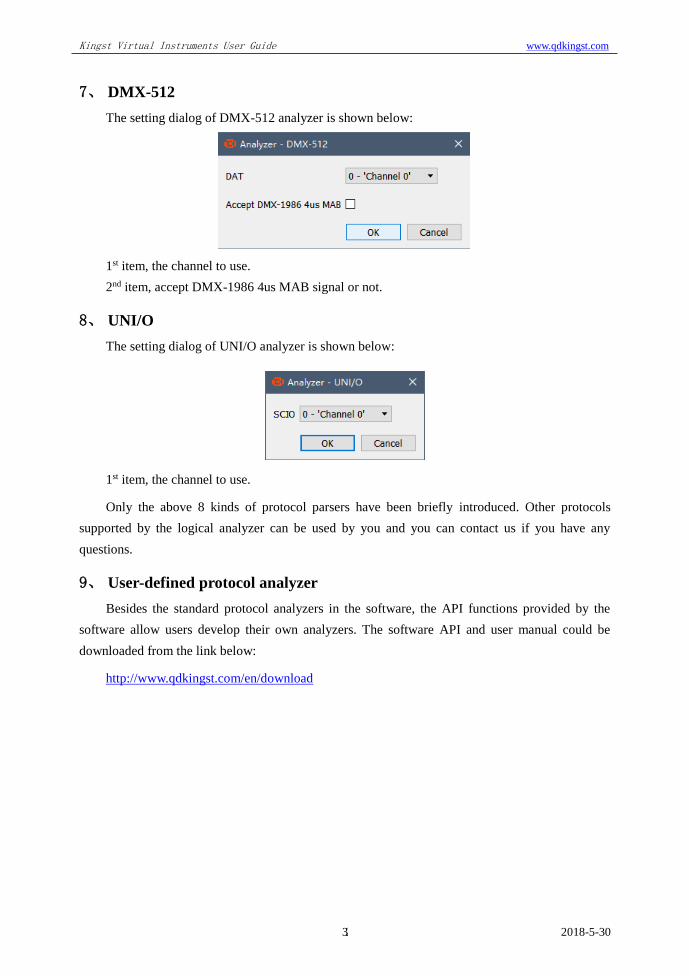
7、 DMX-512
The setting dialog of DMX-512 analyzer is shown below:
1st item, the channel to use.
2nd item, accept DMX-1986 4us MAB signal or not.
8、 UNI/O
The setting dialog of UNI/O analyzer is shown below:
1st item, the channel to use.
Only the above 8 kinds of protocol parsers have been briefly introduced. Other protocols
supported by the logical analyzer can be used by you and you can contact us if you have any
questions.
9、 User-defined protocol analyzer
Besides the standard protocol analyzers in the software, the API functions provided by the
software allow users develop their own analyzers. The software API and user manual could be
downloaded from the link below:
http://www.qdkingst.com/en/download
Kingst Virtual Instruments User Guide www.qdkingst.com
2018-5-30 33
VI. FAQs
1、 Driver installation fail with the device connected to computer
First, Kingst VIS should have been installed before connecting the device to computer. If the
software has not been installed, the OS could not find the driver, so the installation would fail. And
it would be a good idea to install the software without the hardware connected to the computer.
Second, the device driver is installed automatically by installation program during installing
process. If the driver installation is blocked unintentionally during installation process, or it is not
installed correctly due to other reasons, when you connect the device for the first time, the driver
installation would fail too. In this case, you can find the unknown hardware devices in the device
manager, click the right button to install the driver program again. Please select manual installation.
The driver program is located in “installation directory\Driver\”, and select the right directory
based on your operating system.
2、 Identification fail or work unstably with the device connected
When the logic analyzer works at full speed, there would be a lot of the current consumed
(maybe more than 500mA). So if the USB port of the computer can not supply sufficient power, the
device could be identified incorrectly or work unstably. To solve this, the laptop users could try to
switch to the USB port on the other side, and the desktop users must use the USB port behind the
tower box. If the USB-HUB is being used, please connect the device USB port directly.
3、 Signal glitches appear on individual channels
There are two cases when signal glitches appear: the unused channels are floating, or several
signals with high speed are sampled simultaneously.
It is normal that the glitch appears on unused channels, this is because the floating channel
wire is like an antenna, and it will transmit weak and alternating signal, and this would result in
glitches. We could hide such channels, or keep them and the signal channels at a longer distance.
And we should check the grounding of the logic analyzer and the system under test.
And for the glitches which appear when measuring multiple channels with high speed, the
reason for that has been explained in the section “Multipoint grounding to increase accuracy”, and
the method to handle this is multipoint grounding
4、 The actual sample time is less than expected
The logic analyzer is designed with a large-sized memory, to store the sample data temporarily.
And through compression algorithm the depth is further extended. With this compression algorithm,
the current and last sample data would be compared, if they are not the same, a new sample data
would be generated; otherwise, only the count for last state would be incremented and no new
sample data would be generated. And as a result of this, if the signal is discontinuous (for most
Kingst Virtual Instruments User Guide www.qdkingst.com
2018-5-30 34
communication system) or change slowly, the sample depth would be extended greatly. However, if
the signal change rapidly the extension effect would not be so obvious. This is why the sample time
is less than expected when the sample depth is set above 100M (all the depth items with *) and the
signal changes rapidly.
5、 Automatic update failed
The software supports auto update, when a new version is released, a message would tell the
user to update. However, because of system permission and security policy of the operating system,
the auto update could fail. It this happens, the user could download the latest Kingst VIS software
from our website, and after uninstalling the software, the user could install the new version.
The download link of the latest Kingst VIS: http://www.qdkingst.com/en/download

Kingst Virtual Instruments User Guide www.qdkingst.com
2018-5-30 35
VII. Contact us
Thanks for choosing our product, if you have any questions, please contact us in the following
ways, and we will serve you wholeheartedly.
Tel: +86-532-58738653
Mobile: +86-13780615696
Web: www.qdkingst.com
E-mail: [email protected]
AliExpress link: http://www.aliexpress.com/store/110167