Virginia Transportation Research Council research … · (PMS) system, a large portion of the...
27
Virginia Transportation Research Council, 530 Edgemont Road, Charlottesville, VA 22903-2454, www.vtrc.net, (434) 293-1900 http://www.virginiadot.org/vtrc/main/online_reports/pdf/07-r1.pdf Final Report VTRC 07-R1 research report BRIAN K. DIEFENDERFER, Ph.D. Research Scientist Determination by the Falling Weight Deflectometer of the Insitu Subgrade Resilient Modulus and Effective Structural Number for I-77 in Virginia Virginia Transportation Research Council JAVED ALAM Graduate Research Assistant KHALED A. GALAL, Ph.D. Research Scientist
Transcript of Virginia Transportation Research Council research … · (PMS) system, a large portion of the...
Virginia Transportation Research Council, 530 Edgemont Road,Charlottesville, VA 22903-2454, www.vtrc.net, (434) 293 -1900
http://www.virginiadot.org/vtrc/main/online_reports/pdf/07-r1.pdf
Final Report VTRC 07-R1
research report
BRIAN K. DIEFENDERFER, Ph.D.Research Scientist
Determinationby the Falling Weight Deflectometer
of the Insitu Subgrade Resilient Modulusand Effective Structural Number
for I-77 in Virginia
Virginia Transportation Research Council
JAVED ALAMGraduate Research Assistant
KHALED A. GALAL, Ph.D.Research Scientist

Standard Title Page - Report on State Project Report No.
Report Date
No. Pages
Type Report: Final
Project No.: 77209
VTRC 07-R1 June 2007 25 Period Covered:
Contract No.
Title: Determination by the Falling Weight Deflectometer of the In-Situ Subgrade Resilient Modulus and Effective Structural Number for I-77 in Virginia
Key Words: falling weight deflectometer, subgrade resilient modulus, pavement management system, network level pavement assessment
Authors: Khaled A.Galal, Brian K. Diefenderfer, and Javed Alam
Performing Organization Name and Address: Virginia Transportation Research Council 530 Edgemont Road Charlottesville, VA 22903
Sponsoring Agencies’ Name and Address: Virginia Department of Transportation 1401 E. Broad Street Richmond, VA 23219
Supplementary Notes
Abstract The Virginia Department of Transportation (VDOT) manages approximately 27,000 lane-miles of interstate and
primary roadways, of which interstate pavements comprise approximately 5,000 lane-miles. These pavements consist of flexible, rigid, and composite pavements. Virginia’s pavements are managed using an asset management system (AMS) that incorporates a pavement management system (PMS), which aids VDOT in determining the funding required for various levels of pavement maintenance (i.e., preventive maintenance, rehabilitation, or reconstruction activities). As part of VDOT’s AMS (PMS) system, a large portion of the interstate pavement system was visually rated annually to determine a condition index based on load-related and non–load related distresses. Recently, VDOT began using an automated distress collection procedure for this task that incorporates the measurement of pavement condition data such as the international roughness index, rutting in both wheel paths, cracking, and number of patches and potholes. However, there is no current protocol to assess the structural capacity of the pavement on a network level and thus determine the remaining load-carrying capacity (service life) of a pavement structure.
Many state departments of transportation use the falling weight deflectometer (FWD) to collect pavement deflection
data at the project or network level. The analysis of these data provides the effective roadway resilient modulus, the effective in-situ structural number, the pavement layer moduli, the effective in-situ layer coefficient, or all of these parameters. This process is accomplished through a backcalculation procedure using routines that use the FWD deflection data, known as the deflection basins; the FWD load history; and the pavement layer thicknesses as inputs to this procedure.
VDOT currently uses the 1993 AASHTO Guide for Design of Pavement Structures for the design of its new or
rehabilitated pavement structures. As VDOT moves to implement the proposed Mechanistic-Empirical Pavement Design Guide (MEPDG), characterizing existing pavement conditions, including the resilient modulus of the subgrade, is necessary to ensure optimum designs.
This study collected the in-situ layer conditions, the in-situ structural number, and the in-situ subgrade resilient modulus and deflection data for Virginia’s I-77 using FWD network level testing. This testing was found to be a viable tool to classify existing structural network conditions. The information can be used by pavement designers and pavement management engineers to address network needs in terms of rehabilitation strategies and fund management. The study recommends that structural testing on the network level be conducted for all interstate and primary routes in Virginia and used in conjunction with VDOT’s AMS. Obtaining such data through traditional destructive testing requires coring and boring operations that incur traffic control, equipment, and personnel costs. To conduct such operations at the network level would cost VDOT approximately $5.06 million annually. The costs for the FWD network level testing used in this study are estimated at $83,200 annually, resulting in an annual cost savings for VDOT of almost $5 million.

FINAL REPORT
DETERMINATION BY THE FALLING WEIGHT DEFLECTOMETER OF THE IN-SITU SUBGRADE RESILIENT MODULUS AND EFFECTIVE
STRUCTURAL NUMBER FOR I-77 IN VIRGINIA
Khaled A. Galal, Ph.D. Research Scientist
Brian K. Diefenderfer, Ph.D.
Research Scientist
Javed Alam
Graduate Research Assistant
Virginia Transportation Research Council
(A partnership of the Virginia Department of Transportation and the University of Virginia since 1948)
Charlottesville, Virginia
June 2007
VTRC 07-R1

ii
DISCLAIMER
The contents of this report reflect the views of the authors, who are responsible for the facts and the accuracy of the data presented herein. The contents do not necessarily reflect the official views or policies of the Virginia Department of Transportation, the Commonwealth Transportation Board, or the Federal Highway Administration. This report does not constitute a standard, specification, or regulation.
Copyright 2007 by the Commonwealth of Virginia. All rights reserved.

iii
ABSTRACT
The Virginia Department of Transportation (VDOT) manages approximately 27,000 lane-miles of interstate and primary roadways, of which interstate pavements comprise approximately 5,000 lane-miles. These pavements consist of flexible, rigid, and composite pavements. Virginia’s pavements are managed using an asset management system (AMS) that incorporates a pavement management system (PMS), which aids VDOT in determining the funding required for various levels of pavement maintenance (i.e., preventive maintenance, rehabilitation, or reconstruction activities). As part of VDOT’s AMS (PMS) system, a large portion of the interstate pavement system was visually rated annually to determine a condition index based on load-related and non–load related distresses. Recently, VDOT began using an automated distress collection procedure for this task that incorporates the measurement of pavement condition data such as the international roughness index, rutting in both wheel paths, cracking, and number of patches and potholes. However, there is no current protocol to assess the structural capacity of the pavement on a network level and thus determine the remaining load-carrying capacity (service life) of a pavement structure.
Many state departments of transportation use the falling weight deflectometer (FWD) to
collect pavement deflection data at the project or network level. The analysis of these data provides the effective roadway resilient modulus, the effective in-situ structural number, the pavement layer moduli, the effective in-situ layer coefficient, or all of these parameters. This process is accomplished through a backcalculation procedure using routines that use the FWD deflection data, known as the deflection basins; the FWD load history; and the pavement layer thicknesses as inputs to this procedure.
VDOT currently uses the 1993 AASHTO Guide for Design of Pavement Structures for
the design of its new or rehabilitated pavement structures. As VDOT moves to implement the proposed Mechanistic-Empirical Pavement Design Guide (MEPDG), characterizing existing pavement conditions, including the resilient modulus of the subgrade, is necessary to ensure optimum designs.
This study collected the in-situ layer conditions, the in-situ structural number, and the in-situ subgrade resilient modulus and deflection data for Virginia’s I-77 using FWD network level testing. This testing was found to be a viable tool to classify existing structural network conditions. The information can be used by pavement designers and pavement management engineers to address network needs in terms of rehabilitation strategies and fund management. The study recommends that structural testing on the network level be conducted for all interstate and primary routes in Virginia and used in conjunction with VDOT’s AMS. Obtaining such data through traditional destructive testing requires coring and boring operations that incur traffic control, equipment, and personnel costs. To conduct such operations at the network level would cost VDOT approximately $5.06 million annually. The costs for the FWD network level testing used in this study are estimated at $83,200 annually, resulting in an annual cost savings for VDOT of almost $5 million.
FINAL REPORT
DETERMINATION BY THE FALLING WEIGHT DEFLECTOMETER OF THE IN-SITU SUBGRADE RESILIENT MODULUS AND EFFECTIVE
STRUCTURAL NUMBER FOR I-77 IN VIRGINIA
Khaled A. Galal, Ph.D. Research Scientist
Brian K. Diefenderfer, Ph.D.
Research Scientist
Javed Alam
Graduate Research Assistant
INTRODUCTION
The Virginia Department of Transportation (VDOT) manages approximately 27,000 lane-miles of interstate and primary roadways, of which interstate pavements comprise approximately 5,000 lane-miles. These pavements consist of flexible, rigid, and composite pavements. Virginia’s pavements are managed using an asset management system (AMS) that incorporates a pavement management system (PMS), which aids VDOT in determining the funding required for various levels of pavement maintenance (i.e., preventive maintenance, rehabilitation, or reconstruction activities). As part of VDOT’s AMS (PMS) system, a large portion of the interstate pavement system was visually rated annually to determine a condition index based on load-related and non–load related distresses. Recently, VDOT began using an automated distress collection procedure for this task that incorporates the measurement of pavement condition data such as the international roughness index, rutting in both wheel paths, cracking, and number of patches and potholes. However, there is no current protocol to assess the structural capacity of the pavement and thus determine the remaining load-carrying capacity (service life) of a pavement structure.
Many state departments of transportation are using the falling weight deflectometer
(FWD) to collect pavement deflection data at the project and network levels (Hossain et al., 2000; Noureldin et al., 2004; Zaghloul et al., 1998). The analysis of these data provides the in-situ subgrade resilient modulus, the in-situ structural number, the pavement layer moduli, the in-situ layer coefficient, or all of these parameters. This process is accomplished through a backcalculation procedure using numerous in-house or commercial backcalculation routines that use the FWD deflection data, known as the deflection basins; the FWD load history; and the pavement layer thicknesses as inputs. A limited number of programs do not use the layer thickness for the backcalculation process (Hoffman, 2003).
VDOT currently uses the 1993 American Association of State Highway and
Transportation Officials’ (AASHTO) Guide for Design of Pavement Structures (AASHTO,

2
1993) for the design of its new or rehabilitated pavement structures. The guide is based on empirical relationships developed in the 1960s as a result of the AASHO road test (AASHTO, 1993). As VDOT moves to implement the proposed Mechanistic-Empirical Pavement Design Guide (MEPDG), characterizing the existing pavement conditions, including the resilient modulus of the subgrade, will ensure optimum pavement designs (Galal and Chehab, 2005; National Cooperative Highway Research Program [NCHRP], 2004).
FWD testing has grown in popularity to become one of the most effective tools in the
evaluation and characterization of existing pavement structures for rehabilitation purposes and for construction of new pavements (Noureldin et al., 2004). It has been recommended that FWD data and subsequent data analysis results be used as input for the MEPDG to determine rehabilitation strategies for exiting pavement structures because of their high degree of reliability (NCHRP, 2004).
PURPOSE AND SCOPE The purpose of this study was to collect the in-situ layer conditions, the in-situ structural number, and the in-situ subgrade resilient modulus and deflection data for Virginia’s I-77 using FWD network level testing. A second objective was to develop an optimum method for FWD network level testing.
METHODS
I-77 was selected as the first interstate to be tested as part of the FWD network level
testing plan. I-77 connects Virginia with North Carolina and West Virginia and is approximately 69 mi long. This route was chosen to be tested first because the deflection results could be compiled and presented in a timely fashion.
Testing was conducted at 0.1-mi intervals and at four drop levels. One of the important
outcomes of this initial phase of FWD network level testing was a comprehensive statistical analysis to determine the minimum FWD testing intervals (10 versus 5 or 3 locations per mi) and the minimum number of loads (4 versus 3 or 2 drop levels), based on sound statistical approaches.
The entire length of I-77 was tested in both directions (northbound and southbound travel
lanes) except for the segment of the road that overlaps with I-81 (see Figure 1). This segment of the road will be tested in the future as part of I-81. The analysis included (1) the resilient modulus of the subgrade computed using the ELMOD software, (2) the resilient modulus of the subgrade computed using the 1993 AASHTO methodology (AASHTO, 1993), and (3) the California bearing ratio [CBR] computed using the U.S. Army Corps of Engineers equations in accordance with VDOT guidelines (VDOT, 2000). In addition, the effective pavement modulus, the in-situ structural number using the 1993 AASHTO equations, and the pavement layer moduli were backcalculated using ELMOD.

3
Figure 1. Proposed Experimental Network
FWD Deflection Testing
FWD deflection testing was conducted in the travel lane of the northbound and southbound directions of I-77. The Highway Traffic Record Information System (HTRIS) database was used to group the various pavement structures into 18 and 10 homogeneous sections for the northbound and southbound directions, respectively. These sections were defined as homogeneous pavement sections.
Pavement sections were selected and identified as homogeneous pavement sections based on the total thickness of the bound material (asphalt or concrete) and the total pavement thickness. If the “total” thickness of the bound material and the total pavement thickness were within plus or minus 1 inch, the section was called a homogeneous pavement section. If the total thickness was outside this range, a new section was defined. In addition, a new section started at the beginning of each county and ended at the end of the county line.
Testing and analysis were conducted at 0.1-mi intervals and at four drop levels. For each site, the FWD load plate was placed in the right wheel path, approximately 2 to 3 ft from the edge of the pavement. FWD deflection testing was conducted using four load levels (6,000, 9,000, 12,000, and 16,000 lb); at each drop level, two deflection basins were recorded.
Pavement In-Situ Structural Properties
The in-situ subgrade resilient modulus and the effective pavement modulus were
calculated using the FWD deflection data and the 1993 AASHTO methodology (AASHTO, 1993). The AASHTO 1993 method incorporated in the MODTAG program (developed jointly

4
by VDOT’s Materials Division and the Cornell University Local Roads Program) was frequently used to compare the correctness of the results obtained using the VTRC programmed version of the 1993 equations. Backcalculation of individual layer moduli was performed using ELMOD (Version 5.0), based on the equivalent thickness methodology and deflection basin fit routine, developed by the Dynatest Company.
Resilient Modulus (MR)
The subgrade resilient modulus (MR) is a fundamental engineering material property that describes the subgrade strength and ability to resist deformation under repeated traffic loadings (Huang, 2004; NCHRP, 2004). The AASHTO methodology computes the MR of the subgrade based on Boussinesq’s equation (AASHTO, 1993). The AASHTO-based MR is computed using the following equation:
( )
r
2
R d*r*1*PM
πµ−
= [Eq. 1]
where MR = subgrade resilient modulus (psi)
P = applied load (lb) µ = Poisson’s ratio r = radial distance at which the deflection is measured (in)
dr' = measured deflection at a radial distance, r (mils).
ELMOD uses an equivalent thickness methodology incorporated in a deflection basin best-fit routine to compute the resilient modulus (MR) of the subgrade using the last deflection sensors and the pavement layer moduli. ELMOD considers the depth to bed rock and the non-linear behavior of the subgrade in its calculations.
Poisson’s ratio is recommended in the range of 0.30 to 0.50 (AASHTO, 1993). A Poisson’s ratio of 0.40 was used for the calculation of the subgrade MR. AASHTO (1993) also recommends correcting this value of MR for use in flexible pavement designs by employing the following equation:
3/MM RcorrectedR = [Eq. 2] This correction is provided to adjust the calculated resilient modulus results to those obtained from laboratory results. Correction results were reported from the range of 1:1 to 5:1 (AASHTO, 1993). In addition, resilient modulus values for pavement structures that were 40% to 100% higher than prior construction results (AASHTO, 1993; Rahim and George, 2003) were reported after construction

5
California Bearing Ratio (CBR)
CBR has been used in Virginia and elsewhere in the United States to characterize the subgrade strength for pavement design purposes (Huang, 2004). VDOT uses two empirical relationships to correlate the CBR with MR (VDOT, 2000). These relationships were used in this study to give an indication of the MR ranges compared to the more familiar CBR values.
For fine-grained subgrade soil (soaked CBR between 5% and 10%), the relationship
between CBR and MR is shown as follows: MR = 1500 * CBR [Eq. 3] For coarse-grained soils (soaked CBR greater than 10%), the following equation is
typically used: MR = 3000 * CBR0.65 [Eq. 4] For simplification of the analysis in this report, fine-grained “cohesive” soil along I-77
was assumed and used to calculate the CBR for the northbound and southbound directions of I-77 (Eq. 3).
It is important to note that detailed soil investigation and testing are necessary to calculate
CBR and to select the appropriate empirical relationship to use (Eq. 3 vs. Eq. 4) for the conversion between CBR and MR. MR is determined directly from FWD deflection data. Effective Pavement Modulus (Ep)
The effective pavement modulus (Ep) is the effective modulus of all combined pavement layers on top of the subgrade soil. The Ep is used to calculate the pavement effective structural number.
The Ep was calculated using Eq. 5 (AASHTO, 1993). The deflection under the load plate
(d0) comes directly from the FWD data. Knowing the total pavement thickness and calculating or assuming the subgrade resilient modulus, the only unknown in Eq. 5 is the effective pavement modulus, which can be calculated using an iterative process (AASHTO, 1993).

6
+
−
+
+
=p
2
2
3
r
pr
0 EaD1
11
ME
aD1M
1a*P*5.1d [Eq. 5]
where do = deflection under load plate (mils) P = contact pressure (psi) MR = subgrade resilient modulus (psi) D = total pavement thickness above the subgrade (in) a = radius of load plate (in) Ep = effective pavement modulus of all layers above the subgrade (psi). Effective Structural Number (SNeff)
The pavement effective structural number (SNeff) is calculated using Eq. 6, the effective pavement modulus computed from Eq. 5, and the total pavement thickness (AASHTO, 1993): 3 peff E*D*0045.0SN = [Eq. 6] where
SNeff = effective structural number D = total pavement thickness above the subgrade (in) Ep = effective pavement modulus of all layers above the subgrade (psi).
The total pavement thickness and the pavement layer type and thickness may be determined through coring. In addition, boring operations may be conducted to determine soil types and CBR. Although these two processes are necessary to evaluate the pavement structural conditions, they are destructive and time-consuming. Given their nondestructive nature and high degree of reliability, it is appealing to use Eqs. 1, 5, and 6 (developed and incorporated in the 1993 AASHTO guide) to determine the effective structural number of the in-service asphalt pavements as an alternative.
The pavement structural number and the resilient modulus are the two major inputs in the
guide (AASHTO, 1993). In addition, using the effective structural number, the traffic data, and the difference between the initial and terminal serviceability indices, the reaming life of the

7
pavement can be determined for different pavement structures. Many state departments of transportation have adopted Eqs. 1, 5, and 6 for FWD deflection network level testing and analysis (Hossain et al., 2000; Noureldin et al., 2003; Zaghloul et al., 1998).
Statistical Methodology Response Parameters
The resilient modulus (MR) and the effective structural number (SNeff) of the pavement
along I-77 were chosen as the response parameters and were calculated using the 1993 AASHTO methodology (AASHTO, 1993). ELMOD was also used to backcalculate FWD deflection data, using the equivalent thickness methodology incorporated in a deflection basin fit routine, to compute the layer moduli of the pavement. Homogeneous pavement sections were modeled as a three-layer system, and the respective moduli of the layers were backcalculated by ELMOD. The moduli of the surface (E1) and the subgrade (E3) layers were also used as response variables in these statistical analyses. FWD Network Level Testing Intervals
To investigate the minimum number of FWD test points per mile for sufficient network level analysis, a statistical analysis was conducted by comparing the mean values of MR, SNeff, E1, and E3 for all homogeneous pavement sections on the northbound and southbound lanes. This was done to determine the effect of reducing the number of points per mile from 10 to 5 or possibly 3. A two-sample t-test was performed with MINITAB on the FWD-analyzed data versus two subsets of the data. The first subset included data from even 0.1-mi increments (e.g., 0.2, 0.4, 0.6), resulting in 5 test locations per mile (Case A). The second subset included data from odd 0.1-mi increments (e.g., 0.1, 0.3, 0.5), also resulting in 5 test locations per mile (Case B). This comparison was performed for all sections in the northbound and southbound lanes, respectively.
Taking every alternate point (both odd and even) may result in having a distribution of
data that is dissimilar to that of the original dataset. Therefore, to ensure a sound approach in conducting the difference in means analysis, the same analysis was repeated by randomly selecting 5 locations per mile (Case C) per each homogeneous pavement section (randomly selected 50% locations) verses the original collected data at 10 locations per mile.
As the testing for 5 locations per mile showed positive results, further tests were
performed taking 3 locations per mile. Two subsets of data were created taking every third point (e.g., 0.3, 0.6, 0.9 and 0.1, 0.4, 0.7; Case D and Case E, respectively). Another subset was created by randomly selecting one-third of the 10 locations per mile (Case F). All of these three subsets were compared to the original collected data at 10 locations per mile.

8
FWD Number of Drop Loads for Network Level Testing
The current VDOT FWD testing protocol calls for four load levels (6,000, 9,000, 12,000, 16,000 lb) at each test location (VDOT, 2005). To improve the production rate and reduce the cost of testing, there was great interest in VDOT and the research team to reduce the number of load levels used when conducting FWD testing on the network level without compromising the pavement characterization process through the use of multiple drop levels.
A similar statistical analysis was performed to verify whether there was any significant
difference in the mean values of MR, SNeff, E1, and E3 when comparing four load levels versus a decreasing number of load levels, with two deflection basins collected at each drop level. The three largest sections in each of the northbound and southbound directions were taken as sample sections, and all the response parameters were tested. These homogeneous pavement sections covered 42% and 62% of the northbound and southbound directions, respectively. The values of these parameters were determined for the following combination of load levels:
Combination A: 6,000, 9,000, 12,000, 16,000 lb Combination B: 9,000, 12,000, 16,000 lb Combination C: 9,000, 12,000 lb Combination D: 9,000 lb. The mean values of the response variables obtained using load level Combination A were
compared to the mean values obtained using the other three combinations. A two-sample t-test was performed by comparing Combination A with each of Combinations B, C, and D.
RESULTS AND DISCUSSION
FWD data were obtained and analyzed for each homogeneous section. Subsequently, results were stitched together to show the entire northbound or southbound direction. The provided data include jurisdiction, route identification number, beginning mile post (MP), ending MP, FWD deflection (Sensors D1 through D9), surface and air temperatures, total pavement thickness and bound layer thickness, effective pavement modulus (Ep), effective structural number (SNeff), subgrade resilient modulus (MR), and surface modulus (Eo).
.
Resilient Modulus (MR)
Figures 2 and 3 show the backcalculated MR for the northbound and southbound directions, respectively, using ELMOD. Figures 4 and 5 show the MR results calculated using the AASHTO methodology described in Eq. 1 for the northbound and southbound directions, respectively. Figures 6 and 7 show the corrected MR results as described in Eq. 2 with a correction value of 0.33 for the northbound and southbound directions, respectively. The results presented in these figures represent the average backcalculated results at a load of 9,000 lb.

9
Figure 2. Northbound I-77 Backcalculated MR Using ELMOD
Figure 3. Southbound I-77 Backcalculated MR Using ELMOD

10
Figure 4. Northbound I-77 MR Based on AASHTO (1993)
Figure 5. Southbound I-77 MR Based on AASHTO (1993)

11
Figure 6. Northbound I-77 Corrected MR, based on AASHTO (1993)
Figure 7. Southbound I-77 Corrected MR Based on AASHTO (1993)

12
California Bearing Ratio (CBR) As discussed in the Methods section, for simplification, the subgrade along I-77 was
assumed to be a fine-grained cohesive soil. Thus, Eq. 3 was used to calculate the CBR for the northbound and southbound directions that is presented in Figures 8 and 9, respectively.
Figure 8. Northbound I-77 CBR
Figure 9. Southbound I-77 CBR
13
The resilient modulus results are shown in Figures 2 through 7. The backcalculated resilient modulus using ELMOD (Figures 2 and 3) was less than the resilient modulus calculated using the AASHTO (1993) methodology (Figures 4 and 5). However, the corrected AASHTO resilient modulus (Figures 6 and 7) was similar to the resilient modulus backcalculated using ELMOD.
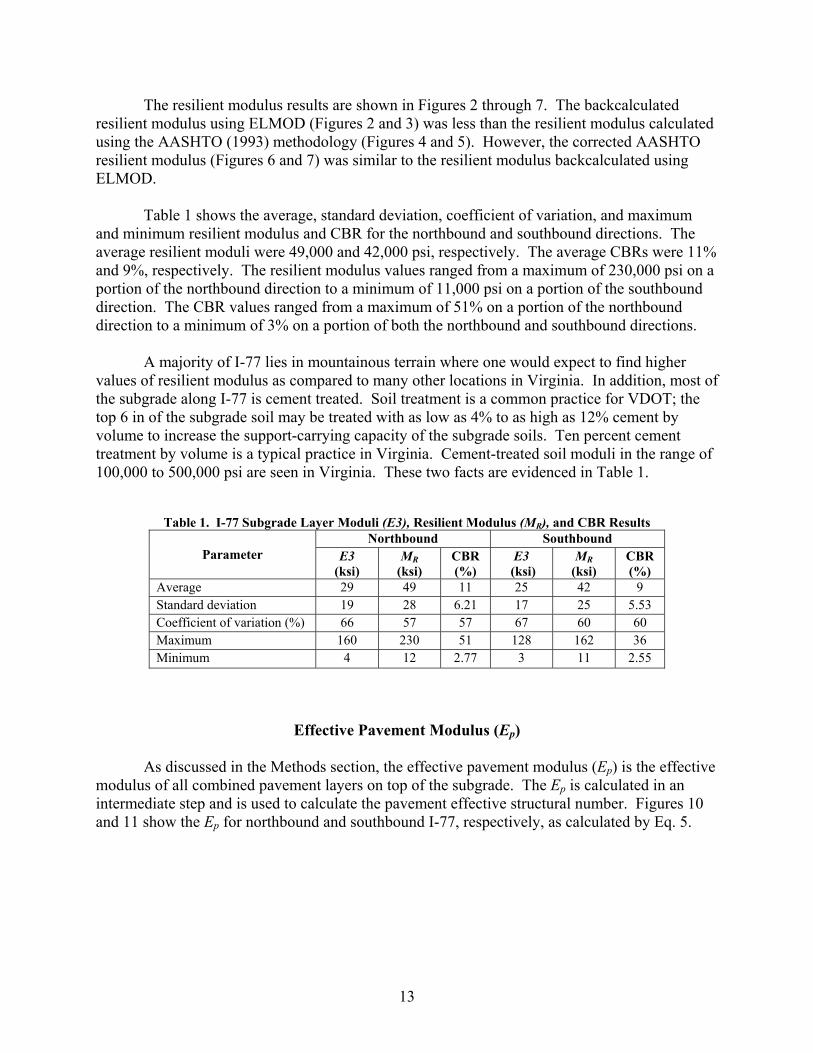
Table 1 shows the average, standard deviation, coefficient of variation, and maximum
and minimum resilient modulus and CBR for the northbound and southbound directions. The average resilient moduli were 49,000 and 42,000 psi, respectively. The average CBRs were 11% and 9%, respectively. The resilient modulus values ranged from a maximum of 230,000 psi on a portion of the northbound direction to a minimum of 11,000 psi on a portion of the southbound direction. The CBR values ranged from a maximum of 51% on a portion of the northbound direction to a minimum of 3% on a portion of both the northbound and southbound directions.
A majority of I-77 lies in mountainous terrain where one would expect to find higher
values of resilient modulus as compared to many other locations in Virginia. In addition, most of the subgrade along I-77 is cement treated. Soil treatment is a common practice for VDOT; the top 6 in of the subgrade soil may be treated with as low as 4% to as high as 12% cement by volume to increase the support-carrying capacity of the subgrade soils. Ten percent cement treatment by volume is a typical practice in Virginia. Cement-treated soil moduli in the range of 100,000 to 500,000 psi are seen in Virginia. These two facts are evidenced in Table 1.
Table 1. I-77 Subgrade Layer Moduli (E3), Resilient Modulus (MR), and CBR Results Northbound Southbound
Parameter E3 (ksi)
MR (ksi)
CBR (%)
E3 (ksi)
MR (ksi)
CBR (%)
Average 29 49 11 25 42 9 Standard deviation 19 28 6.21 17 25 5.53 Coefficient of variation (%) 66 57 57 67 60 60 Maximum 160 230 51 128 162 36 Minimum 4 12 2.77 3 11 2.55
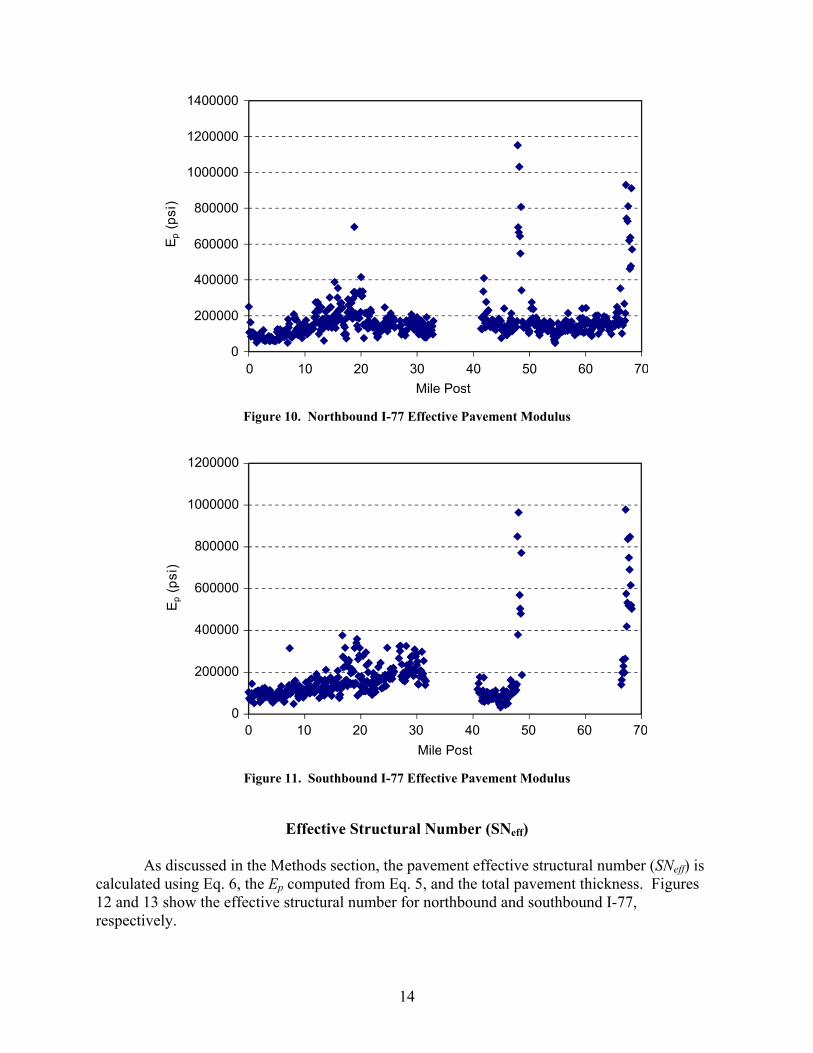
Effective Pavement Modulus (Ep) As discussed in the Methods section, the effective pavement modulus (Ep) is the effective
modulus of all combined pavement layers on top of the subgrade. The Ep is calculated in an intermediate step and is used to calculate the pavement effective structural number. Figures 10 and 11 show the Ep for northbound and southbound I-77, respectively, as calculated by Eq. 5.
14
Figure 10. Northbound I-77 Effective Pavement Modulus
Figure 11. Southbound I-77 Effective Pavement Modulus
Effective Structural Number (SNeff)
As discussed in the Methods section, the pavement effective structural number (SNeff) is calculated using Eq. 6, the Ep computed from Eq. 5, and the total pavement thickness. Figures 12 and 13 show the effective structural number for northbound and southbound I-77, respectively.

15
Figure 12. Northbound I-77 Effective Structural Number
Figure 13. Southbound I-77 Effective Structural Number Table 2 summarizes the effective pavement modulus and the structural number results by
listing the average, standard deviation, coefficient of variation, maximum, and minimum for the northbound and southbound directions. Figures 10 and 11 show a relatively high effective pavement modulus between MP 48.2 and MP 48.9 and between MP 67.1 and MP 68.3. This reflects the fact that the surface layer in these two locations is constructed with portland cement concrete. The structural numbers of these two areas are also shown to be very high in Figures 12 and 13. It is appropriate to remove the results of these two concrete sections (tunnels) from the results, as I-77 is composed of mainly asphalt pavements.

16
Table 2. Effective Pavement Modulus (Ep) and Effective Structural Number (SNeff) Northbound Southbound
Parameter (Ep) (psi) SNeff (Ep) (psi) SNeff
Average 166,864 6.40 166,340 6.37 Standard deviation 118,433 1.77 130,595 1.92 Coefficient of variation (%) 71 27.61 79 30.09 Maximum 1,150,409 17.20 977,731 16.21 Minimum 48,059 3.47 32,498 3.73
Layer Moduli
As discussed in the Methods section, using ELMOD and dividing the pavement into a three-layer system, the pavement layer moduli were backcalculated. The three-layer pavement model was selected as the asphalt bound layer (or the concrete layer in the two-tunnel sections), the support aggregate layer (treated or not treated), and the semi-infinite half space subgrade layer.
Figures 14 and 15 show the backcalculated layer moduli for northbound and southbound
I-77, respectively. E1 represents the combined elastic modulus of all asphalt layers; E2 represents the combined elastic modulus of all aggregate layers, treated or not treated; and E3 represents the resilient modulus of the subgrade. Figures 14 and 15 clearly show E1, the upper bound layer moduli, to be higher at the two locations representing the concrete pavement layers in the tunnel sections.
Figure 14. Northbound I-77 Backcalculated Layer Moduli

17
Figure 15. Southbound I-77 Backcalculated Layer Moduli
Table 3 shows the backcalculated average, standard deviation, coefficient of variation, and maximum and minimum layer moduli obtained by ELMOD. The backcalculated results clearly distinguished between the asphalt sections (most of I-77) and the two concrete tunnel sections on I-77.
. Table 3. Backcalculated Layer Moduli from ELMOD
Northbound Southbound Parameter E1 (ksi) E2 (ksi) E3 (ksi) E1 (ksi) E2 (ksi) E3 (ksi)
Average 369 93 29 392 79 25 Standard deviation 340 116 19 444 83 17 Coefficient of variation (%) 92 125 66 113 106 67 Maximum 3,679 1,049 160 4,432 648 128 Minimum 115 7 4 97 3 3
E1 = combined elastic modulus of all asphalt layers; E2 = combined elastic modulus of all aggregate layers; E3 = subgrade resilient modulus.
Analysis of Material Stress Sensitivity
FWD testing can be used to check the stress sensitivity of the pavement layers,
determine the depth to bed rock, and detect non-linear behavior of pavement layers by subjecting a section to different load levels. It has been shown that stress hardening or stress softening trends of in-situ pavement layers can be evaluated and detected (Stubstad et al., 1994). This is done by checking the trends of the load versus layer moduli and/or load versus the measured deflection. This information is particularly useful in predicting the type of subgrade prior to boring operations and subsequent laboratory investigations. For example, stress softening usually results from clay or silty materials whereas stress hardening usually results from sandy or coarser materials. Materials that were cement or lime stabilized show no stress sensitivity.
18
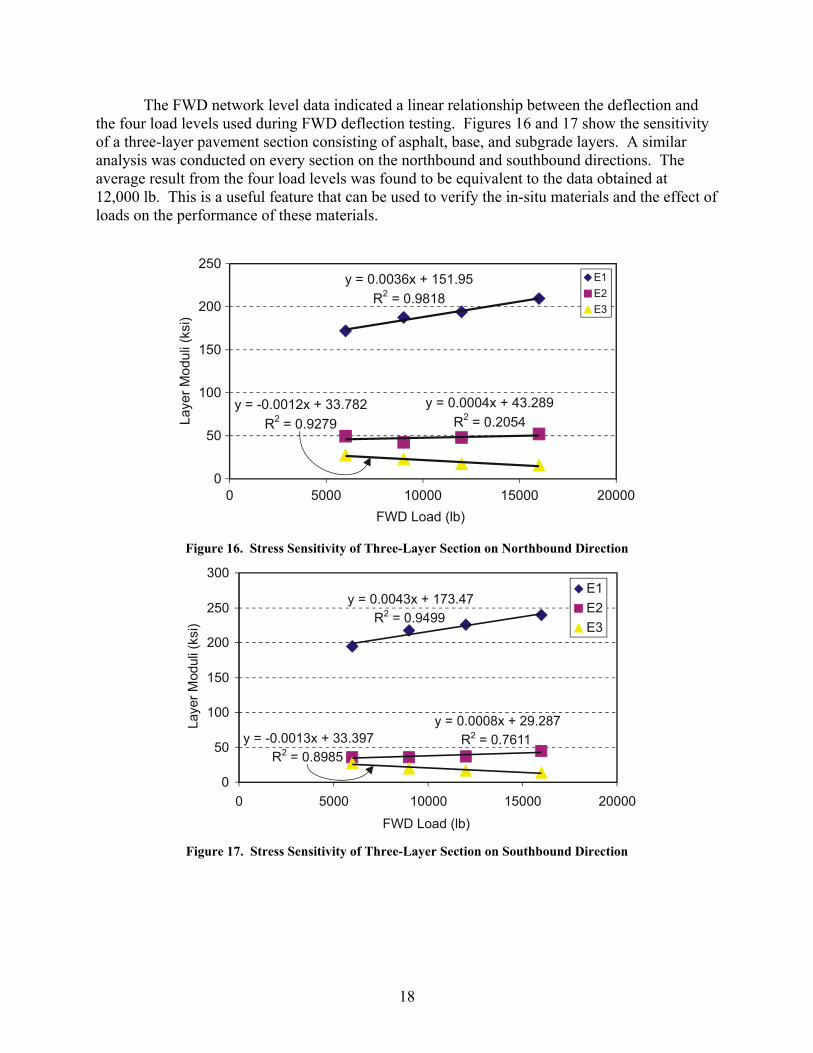
The FWD network level data indicated a linear relationship between the deflection and the four load levels used during FWD deflection testing. Figures 16 and 17 show the sensitivity of a three-layer pavement section consisting of asphalt, base, and subgrade layers. A similar analysis was conducted on every section on the northbound and southbound directions. The average result from the four load levels was found to be equivalent to the data obtained at 12,000 lb. This is a useful feature that can be used to verify the in-situ materials and the effect of loads on the performance of these materials.
y = -0.0012x + 33.782R2 = 0.9279
y = 0.0036x + 151.95R2 = 0.9818
y = 0.0004x + 43.289R2 = 0.2054
0
50
100
150
200
250
0 5000 10000 15000 20000FWD Load (lb)
Laye
rMod
uli(
ksi)
E1E2E3
Figure 16. Stress Sensitivity of Three-Layer Section on Northbound Direction
y = -0.0013x + 33.397R2 = 0.8985
y = 0.0008x + 29.287R2 = 0.7611
y = 0.0043x + 173.47R2 = 0.9499
0
50
100
150
200
250
300
0 5000 10000 15000 20000
FWD Load (lb)
Laye
rMod
uli(
ksi)
E1E2E3
Figure 17. Stress Sensitivity of Three-Layer Section on Southbound Direction

19
Figure 16 shows the strong stress hardening for E1 and E3 (asphalt modulus and subgrade resilient modulus calculated by ELMOD). Stress hardening for E1 can be explained by the asphalt material undergoing higher confining stresses at higher loads, whereas stress hardening for E3 can be explained by the presence of a cohesive material such as clay or silty clay. On the other hand, E2 (modulus of the intermediate layer as calculated by ELMOD) indicated no significant stress hardening, which was expected as the material is composed of a treated or strong aggregate layer. Similar results can be seen in Figure 17; however, E2 in Figure 17 indicates stress hardening behavior.
CONCLUSIONS • FWD network level testing is a viable tool to classify existing structural network conditions.
The information can be used by pavement designers and pavement management engineers to address network needs in terms of rehabilitation strategies and fund management.
• There is no statistical difference in the results when calculating the moduli of the asphalt
(E1) or the subgrade (E3) layers using 5 test locations per mile versus using 10 test locations per mile.
• There is no statistical difference in the results when calculating the subgrade resilient
modulus (MR), effective pavement modulus (Ep), or the moduli of the asphalt (E1) or the subgrade (E3) layers using four load levels (6,000, 9,000, 12,000, 16,000 lb) versus using one load level of 9,000 lb.
• A comparison of the stress sensitivity may be used to verify the condition of the underlying
subgrade.
RECOMMENDATIONS
1. VDOT’s Asset Management Division and Materials Division should conduct FWD network level testing for all interstate and primary routes in Virginia to be used in conjunction with currently collected surface-observable distresses.
2. VDOT’s Asset Management Division and Materials Division should consider using the FWD
network level testing protocol developed in this study: one test location every 0.2 mile with four load levels at each test location.
3. VDOT’s Materials Division should conduct coring operations on the 18 northbound and the
10 southbound pavement sections of I-77 to verify the layer thicknesses and materials types. In addition, soil samples should be collected to correlate the backcalculated resilient modulus results and the existing soil conditions.

20
4. The Virginia Transportation Research Council (VTRC) and VDOT’s Materials Division should conduct laboratory investigations to verify and correlate the stress sensitivity results and the in-situ pavement condition found in this study. VTRC should continue this practice and perform additional analyses in future FWD network level testing because stress sensitivity can be a practical means to detect in-situ material types.
5. VDOT’s Materials Division should use the backcalculated resilient modulus for design
purposes as it moves forward in adopting the MEPDG. 6. VDOT’s Materials Division should consider FWD project level testing (15 to 20 points per
mile) and a forensic investigation for low or unrealistic pavement moduli values obtained for any homogeneous pavement section when conducting network level testing.
COSTS AND BENEFITS ASSESSMENT
The long-term value of the FWD non-destructive network level testing conducted in this study is estimated to be very high. The in-situ subgrade resilient modulus and the effective structural number were accurately determined. Databases developed in this project are available for use by VDOT’s Asset Management Division and VDOT’s Materials Division for allocation of future funds, pavement design, maintenance, and rehabilitative strategies. FWD network level testing will provide critical data needed for the implementation of the MEPDG. The costs of obtaining subgrade resilient modulus results alone through destructive testing in terms of coring and boring operations and the associated traffic control cost, equipment cost, and personal time cost are very high.
The following example calculates the benefit associated with using the FWD versus
traditional coring and boring operations: Pavement boring operations are estimated at $1,500 per test site. VDOT’s interstate
system is composed of approximately 2,200 directional miles. If a boring is taken every mile, the total cost for the interstate system is $3.3 million ($1,500 per test × 2,200 miles). Soil characterization costs per sample include approximately $100 for soil classification, $300 for CBR determination, and $400 for resilient modulus determination. The total cost for soil characterization is $1.76 million ($800 total per sample × 2,200 miles). Thus the total cost for subgrade determination is estimated at $5.06 million. This will provide one piece of data for every mile of interstate.
FWD deflection testing can be used to characterize subgrade soils every tenth of a mile.
At this interval, 17 miles per day can be tested. In order to test the entire interstate system, 130 days of testing is required. The FWD cost per day is approximately $640. Thus, the total cost for FWD testing on the entire interstate system is approximately $83,200 ($640 per day × 130 days).

21
Therefore, by using the FWD rather than traditional coring and boring operations, VDOT’s annual savings could total almost $5 million.
ACKNOWLEDGMENTS
The authors acknowledge the assistance of Charles Larson and Tanveer Chowdhury of VDOT’s Asset Management Division; Michael Wells, Thomas Freeman, and David Thacker of VDOT’s Materials Division; and Thomas Tate of VDOT’s Hampton Roads District. The authors also acknowledge Randy Combs and Ed Deasy of VTRC for their assistance with the graphics. The authors acknowledge Linda Evans of VTRC for her valuable editorial efforts throughout the publication process. The authors also acknowledge the leadership teams of VTRC, VDOT’s Asset Management Division, and VDOT’s Materials Division for providing necessary funds for this research project.
REFERENCES
American Association of State Highway & Transportation Officials. Guide for Design of
Pavement Structures. Washington, DC, 1993. Galal K., and Chehab G.R. Considerations for Implementing the 2002 M-E Design: Procedure
Using a HMA Rehabilitated Pavement Section in Indiana. In Transportation Research Record No. 1919. Transportation Research Board, Washington, DC, 2002, pp. 121-133.
Hoffman, M.S. Direct Method for Evaluating Structural Needs of Flexible Pavements with
Falling-Weight Deflectometer Deflections. In Transportation Research Record No. 1860. Transportation Research Board, Washington, DC, 2002, pp. 41-47.
Huang, Y.H. Pavement Analysis and Design. 2nd Ed. Pearson–Prentice Hall, Upper Saddle
River, NJ, 2004. National Cooperative Highway Research Program. Guide for Mechanistic Empirical Design
Guide of New and Rehabilitated Pavement Structures. Final Report, Project 1-37A. Washington, DC, 2004.
Rahim, A., and George, K.P. Falling Weight Deflectometer for Estimating Subgrade Elastic
Moduli. Journal of Transportation Engineering, Vol. 129, Issue 1, 2003, pp. 100-107. Noureldin, S., Zhu, K., Harris, D., and Li, S. Non-Destructive Estimation of Pavement
Thickness, Structural Number, and Subgrade Resilience Along INDOT Highways. Final JTRP Report, Contract No.SPR-2408. Purdue University, West Lafayette, IN, 2004.

22
Noureldin, S., Zhu, K., Li, S., and Harris, D. Network Pavement Evaluation with Falling-Weight Deflectometer and Ground-Penetrating Radar. In Transportation Research Record No. 1860. Transportation Research Board, Washington, DC, 2003, pp. 90-99.
Hossain, M., Chowdhury, T., Chitrapu, S., and Gisi, A.J. Network-Level Pavement Deflection
Testing and Structural Evaluation. Journal of Testing and Evaluation, Vol. 28, 2000, pp. 199-206.
Stubstad, R.N., Mahoney, J.P., and Coetzee, N.F. Effect of Material Stress Sensitivity on
Backcalculated Moduli and Pavement Evaluation. In Nondestructive Testing of Pavements and Backcalculation of Moduli: Second Volume, H.L. Von Quintas, A.J. Bush III, G.Y. Baladi, Eds. STP 1198-EB ASTM International West Conshohocken, PA, 1994.
Virginia Department of Transportation, Materials Division. Guidelines for 1993 AASHTO
Pavement Design. Richmond, 2000. Virginia Department of Transportation. Virginia Test Method 68: Nondestructive Pavement
Deflection Testing with a Falling-Weight-Type-Impulse Load Device. Richmond, 2005. Zaghloul, S.M., He. Z., Vitillo, N., Kerr, J.B. Project Scoping Using Falling Weight
Deflectometer Testing: New Jersey Experience. In Transportation Research Record No. 1643. Transportation Research Board, Washington, DC, 1998, pp. 34-43.