Virginia Transportation Research Council research … D. Fontaine, Lance E. Dougald, and Chiranjivi...
44
Virginia Transportation Research Council, 530 Edgemont Road, Charlottesville, VA 22903-2454, www.vtrc.net, (434) 293-1900 http:/www.virginiadot.org/vtrc/main/online_reports/pdf/10-r12.pdf Final Report VTRC 10-R12 research report Evaluation of Truck Lane Restrictions in Virginia: Phase II Virginia Transportation Research Council LANCE E. DOUGALD Associate Research Scientist CHIRANJIVI SARMA BHAMIDIPATI Graduate Research Assistant MICHAEL D. FONTAINE, Ph.D., P.E. Senior Research Scientist
-
Upload
truongduong -
Category
Documents
-
view
218 -
download
3
Transcript of Virginia Transportation Research Council research … D. Fontaine, Lance E. Dougald, and Chiranjivi...

Virginia Transportation Research Council, 530 Edgemont Road,Charlottesville, VA 22903-2454, www.vtrc.net, (434) 293 -1900
http:/www.virginiadot.org/vtrc/main/online_reports/pdf/10-r12.pdf
Final Report VTRC 10-R12
research reportEvaluation of Truck Lane
Restrictions in Virginia: Phase II
Virginia Transportation Research Council
LANCE E. DOUGALDAssociate Research Scientist
CHIRANJIVI SARMA BHAMIDIPATIGraduate Research Assistant
MICHAEL D. FONTAINE, Ph.D., P.E.Senior Research Scientist

Standard Title Page—Report on State Project Type Report: Final
Project No.: 87969
Report No.: VTRC 10-R12
Report Date: October 2009
No. Pages: 44
Period Covered: 10/22/07-9/30/09
Contract No.:
Title: Evaluation of Truck Lane Restrictions in Virginia: Phase II Author(s): Michael D. Fontaine, Lance E. Dougald, and Chiranjivi Sarma Bhamidipati Performing Organization Name and Address: Virginia Transportation Research Council 530 Edgemont Road Charlottesville, VA 22903
Key Words: Truck restrictions Truck safety Climbing lanes
Sponsoring Agencies’ Name and Address: Virginia Department of Transportation 1401 E. Broad Street Richmond, VA 23219
Supplementary Notes: This project was financed with state research funds at an estimated cost of $105,751.
Abstract: Virginia, like many other states, has used truck lane restrictions on parts of its interstate system in an attempt to improve mobility and safety. The Code of Virginia currently specifies two types of lane restrictions. First, trucks may not travel in the left-most lane of interstates with three or more lanes by direction (1) when the speed limit is 65 mph or higher, (2) along all of I-81, and (3) along interstates in the Virginia Department of Transportation’s (VDOT) Northern Virginia District. Second, trucks may not travel in the left lane of two-lane directional interstate segments when their speed is below the posted speed limit; this restriction was enacted in 2007 and was intended to reduce cases of trucks impeding traffic flow on steep grades in the western part of the state. This report describes Phase II of a 2007 study that found that the safety impact of the first type of restriction appeared to be affected by traffic volume. Safety was enhanced on low- volume roads (i.e., annual average daily traffic [AADT] less than 10,000 vehicles per day per lane [vpdpl]) but degraded on high-volume roads (i.e., AADT above 10,000 vpdpl). Given that most of the high-volume interstates investigated were in Northern Virginia, there was a need to re-examine the safety analysis to ensure that the findings were not a product of the growing congestion in the region but rather were attributable to the effects of the truck lane restrictions. The purpose of this study was to provide a detailed assessment of the safety and mobility impacts of Virginia’s truck lane restrictions, expanding on the Phase I study. First, crashes on high-volume interstates with three or more lanes by direction noted in the Phase I study were re-examined. Individual crash reports were reviewed, and any crashes that were not influenced by the restriction were removed from subsequent analysis. An empirical Bayes analysis was then used to re-assess safety using the screened crashes. Second, the operational and safety impacts of the restriction on two-lane segments of interstate were examined. Third, the effect of an enforcement campaign on compliance with the restriction for two-lane segments was determined. The crash analysis for the high-volume, three-lane segments confirmed that crashes were higher than expected after the restriction was put in place and thus were not merely the products of growing congestion. The safety and operational impacts of the restriction for two-lane interstates revealed no significant benefits, likely because the level of non-compliance with the restriction was high. With regard to the effect of the concentrated enforcement campaign, compliance improved, but the improvement was relatively modest. The study recommends that VDOT (1) pursue a legislative modification to remove truck lane restrictions on high-volume interstates with three or more lanes in each direction; (2) determine if signing could be modified to improve compliance; (3) partner with the Virginia State Police and the Virginia Trucking Association to increase compliance on the two-lane directional segments of interstate; and (4) direct a study to re-evaluate the effectiveness of the two-lane restrictions once at least 3 years of “after” crash data are available. Removal of the truck restrictions on the specified high-volume interstates should create crash reduction benefits. If crash costs are converted into dollars, an estimated $266,996 of crashes would be eliminated statewide annually through removal of these restrictions. Those costs accrue to drivers. Additional direct savings to VDOT would occur through the reduction of signing.

FINAL REPORT
EVALUATION OF TRUCK LANE RESTRICTIONS IN VIRGINIA: PHASE II
Michael D. Fontaine, Ph.D., P.E. Senior Research Scientist
Lance E. Dougald
Associate Research Scientist
Chiranjivi Sarma Bhamidipati Graduate Research Assistant
Virginia Transportation Research Council (A partnership of the Virginia Department of Transportation
and the University of Virginia since 1948)
Charlottesville, Virginia
October 2009 VTRC 10-R12

ii
DISCLAIMER
The contents of this report reflect the views of the authors, who are responsible for the facts and the accuracy of the data presented herein. The contents do not necessarily reflect the official views or policies of the Virginia Department of Transportation, the Commonwealth Transportation Board, or the Federal Highway Administration. This report does not constitute a standard, specification, or regulation. Any inclusion of manufacturer names, trade names, or trademarks is for identification purposes only and is not to be considered an endorsement.
Copyright 2009 by the Commonwealth of Virginia. All rights reserved.

iii
ABSTRACT Virginia, like many other states, has used truck lane restrictions on parts of its interstate system in an attempt to improve mobility and safety. The Code of Virginia currently specifies two types of lane restrictions. First, all trucks are restricted from the left-most lane of interstates with three or more lanes by direction when the speed limit is 65 mph or higher, along all of I-81, and in northern Virginia. Second, trucks may not travel in the left lane of two-lane directional interstate segments when their speed is below the posted speed limit. This second type of restriction was enacted in 2007 and was intended to reduce cases of trucks impeding traffic flow on steep grades in the western part of the state. This report represents a continuation of an earlier study published by the Virginia Transportation Research Council in 2007. That study found that the safety impact of the truck lane restrictions on interstates with three or more lanes by direction appeared to be affected by traffic volume. The restrictions produced safety benefits on lower volume roads, but degraded safety on higher volume roads. Given that most of the high volume interstates studied were located in northern Virginia, there was a need to re-examine the safety analysis to ensure that the findings were not a product of the growing congestion in the region. This study consisted of several major tasks. First, crashes on high-volume interstates with three or more lanes by direction were re-examined. Individual crash reports were reviewed and any crashes that were not influenced by the restrictions were removed from subsequent analysis. An empirical Bayes analysis was then used to re-assess safety using the screened crashes. Next, the operational and safety impacts of the 2007 restrictions on two-lane segments of interstate were examined. Finally, the effect of a concentrated enforcement campaign on compliance with the two-lane restrictions was examined. Several important findings were produced from these analyses. The crash analysis of high-volume, three lane segments confirmed that crashes were indeed higher than expected after the restrictions were installed. This is likely attributable to increased difficulty merging on and off the highway due to the restrictions. The safety and operational analysis of the two-lane restrictions revealed no significant benefits, likely because of high non-compliance with the restrictions. The examination of the concentrated enforcement campaign revealed some improvement in compliance, however changes were relatively modest. The report provides several recommendations. First, the Virginia Department of Transportation Traffic Engineering Division (TED) should pursue a legislative change to remove the restrictions from higher volume facilities with three or more lanes by direction. TED should also pursue several avenues that could increase the effectiveness of the two-lane restrictions, such as improving signing and increasing enforcement. Finally, the effectiveness of the two-lane recommendations should be revisited once 3 years of crash data are available to determine if that program should be modified.

FINAL REPORT
EVALUATION OF TRUCK LANE RESTRICTIONS IN VIRGINIA: PHASE II
Michael D. Fontaine, Ph.D., P.E.
Senior Research Scientist
Lance E. Dougald Associate Research Scientist
Chiranjivi Sarma Bhamidipati Graduate Research Assistant
INTRODUCTION
Virginia, like many other states, has implemented truck lane restrictions in an effort to improve safety and mobility. Restricting trucks to certain lanes could increase the opportunity for vehicles to pass slow-moving trucks, potentially increasing average travel speeds. This could have a substantial benefit in terms of mobility on highways with steep grades and a limited number of lanes. Safety could also be improved by reducing (1) the number of instances where fast-moving vehicles have to decelerate rapidly upon approaching slow-moving trucks and (2) the number of cases where vehicles must change lanes to get around slow-moving trucks in the left lane.
Virginia has implemented a number of truck lane restrictions that apply to the interstate system. The restrictions in the Code of Virginia and their subsequent modifications are shown below in chronological order:
• When the posted speed limit is 65 mph, commercial motor vehicles are prohibited from the left-most lane of any interstate highway having more than two lanes in each direction. This was enacted in 1997.
• In the Eighth Planning District (analogous to the Virginia Department of
Transportation’s (VDOT) Northern Virginia District) and on I-81, commercial motor vehicles are prohibited from the left-most lane of any interstate highway having more than two lanes in each direction, regardless of the posted speed limit. This was enacted in 2000.
• Every commercial motor vehicle must keep to the right-most lane when operating at a
speed of 15 mph or more below the posted speed limit on an interstate highway with two lanes in each direction. This was enacted in July 2004.

2
• Every commercial motor vehicle must keep to the right-most lane when operating at a speed below the posted speed limit on an interstate highway with two lanes in each direction. This took effect in July 2007, and superseded the 2004 restrictions. The signs posting this new restriction were installed in VDOT’s Northwest and Southwest Operations Regions in late August 2007.
The sections establishing these restrictions in the Code of Virginia are included in
Appendix A. These provisions do not apply to buses, to commercial vehicles entering or exiting a highway using a left side ramp, or to vehicles being used to perform maintenance or construction work. Violations of these restrictions are classified as traffic infractions and are subject to a fine of up to $250 and the addition of three points on the driver’s license. Figure 1 shows the regulatory sign posted at sites with three or more lane in each direction where these restrictions apply. Figure 2 shows the signs posted based on the 2007 restrictions on two-lane directional segments.
Figure 1. Truck Restriction Sign Used on Interstates with Three or More Directional Lanes
Figure 2. 2007 Truck Restriction Sign Used on Interstates with Two Directional Lanes and Steep Grades

3
Even though some of these restrictions had been in effect since the late 1990s, there had never been a formal evaluation of their effectiveness until recently. In January 2007, the Virginia Transportation Research Council (VTRC) published a study that examined the safety and operational impacts of the restrictions that were in place at that time.1 The major findings of that study were:
• The two-lane sites where trucks were restricted from the median lane when traveling more than 15 mph below the posted speed limit showed positive operational and safety improvements. The overall number of crashes was estimated to have declined by 23 percent, and overall average travel speeds were estimated to have increased by about 5.5 mph. These differences were both statistically significant, however the findings were based on a comparison of operations between interstates and comparable primary roads and incorporated only one year of “after” crash data.
• The operational analysis of the sites with truck restrictions and three or more lanes
by direction did not reveal any statistically significant improvement in mobility. Speeds were estimated to be approximately 0.5 mph higher at sites with restrictions, but this was not statistically significant.
• The safety impact of the three-lane restrictions appeared to differ substantially
between the lower volume and higher volume sites. The safety analysis showed a reduction in crashes at sites with truck restrictions that had an annual average daily traffic (AADT) of less than 10,000 vehicles per day per lane (vpdpl). Crashes were estimated to have increased at sites with truck restrictions that exceeded this volume threshold. Since most of the sites that exceeded this volume threshold were in Northern Virginia, it was unclear whether the restrictions or growing congestion in that part of the state was responsible for this finding, however.
• Compliance with the restrictions was reasonable at the three-lane sites, but there was
significant noncompliance at the two-lane sites. Less than 6 percent of trucks were not complying with the restrictions at the sites with three or more lanes by direction. At two-lane sites, over 75 percent of trucks traveling 15 mph or more below the posted speed limit were traveling in the unrestricted lane, thus approximately 25 percent of slow-moving trucks were in violation of the restriction. This raises the question as to whether the positive safety benefits observed were really attributable to the presence of the restrictions.
While the 2007 study provided insight into the safety and operational impacts of the truck
lane restrictions, it also identified several areas where more research would have helped improve the understanding of the performance of these restrictions. Furthermore, the effect of the 2007 legislative change for the two-lane directional interstate segments was not considered. Specific areas where the need for more research was identified include:
• A detailed safety analysis of the crashes involving trucks at sites with three or more lanes by direction and AADTs greater than 10,000 vpdpl was needed to determine how many crashes could be directly or indirectly attributed to the restrictions. This
4
analysis was needed to determine if the larger than anticipated number of crashes at these sites was connected to the restrictions or simply related to the growing congestion in Northern Virginia.
• Safety and operational analysis of the new truck lane restrictions on two-lane
directional interstate segments was needed to ascertain whether this new restriction was creating improvements in safety and mobility.
Given these research needs, a second phase of the truck lane restriction study was initiated.
PURPOSE AND SCOPE
The purpose of this project was to provide a detailed assessment of the safety and mobility impacts of Virginia’s truck lane restrictions, expanding earlier research performed by VTRC.1 The specific objectives included:
• Perform a thorough assessment as to whether truck lane restrictions are having a negative safety impact on interstates with three or more lanes per direction and volumes greater than 10,000 vpdpl.
• Determine the safety and operational impacts of the new truck restriction legislation
requiring that trucks operating below the posted speed limit travel in the right lane.
• Evaluate the potential for enforcement to change compliance with the truck restrictions.
Only interstate facilities were examined and specific recommendations were provided to
the VDOT Traffic Engineering Division as to whether any policy or legislative changes were warranted.
METHODOLOGY
The methodology used in this research consisted of five major tasks:
1. Review the literature to identify other studies that have examined the safety and/or mobility impacts of truck lane restrictions.
2. Conduct a safety assessment of the high volume sites with three or more lanes that
were identified as being areas of concern in the 2007 study.1 3. Collect and analyze traffic operational data at two-lane sites following the
implementation of the new restriction legislation.

5
4. Collect and analyze traffic safety data at two-lane sites following the implementation
of the new restriction legislation. 5. Evaluate the impacts of a targeted enforcement campaign on restriction compliance at
two-lane sites following the implementation of the 2007 restrictions. The methodology used to conduct each of these tasks is summarized in this section.
Literature Review
The literature review that was conducted for the earlier VTRC project1 was updated to reflect the most recent research on truck lane restrictions. The Virginia Transportation Research Council library, the University of Virginia library, and relevant Transportation Research Board databases were used to identify research that was related to this project.
Safety Assessment of Restrictions on High Volume, Three or More Lane Sites
The interstate sites with three or more lanes by direction and volumes above 10,000 vpdpl were re-assessed to determine if the findings from the first phase of this study were truly attributable to the lane restrictions. The safety assessment of the restrictions on high volume interstates with three or more lanes consisted of two major tasks. First, the crashes were screened to determine how many truck-involved crashes may have been influenced by the restriction. Next, an empirical Bayes (EB) analysis was performed on that screened data set.
As previously noted, the earlier VTRC research1 showed there were more crashes than expected on segments with restrictions that had three or more lanes by direction and volumes exceeding 10,000 vpdpl. That assessment was based on examining the aggregate crash data from sites with these characteristics (primarily in Northern Virginia) and comparing them to similar sites without restrictions (primarily in Hampton Roads). In this task, these crash data were re-examined to determine whether the prior finding was related to the presence of truck restrictions, or symptomatic of the higher levels of congestion found on roads in Northern Virginia.
The high volume sites with restrictions (“test sites”) and similar sites without restrictions (“comparison sites”) were the same used in the 2007 study1, and crash data from 2000 to 2005 were examined. This was done to ensure consistency with the earlier study. The comparison sites had similar roadside characteristics and volumes as the test sites. The sites used in the assessment are shown in Table 1. It should be noted that the test sites generally had a higher percentage of trucks than the comparison sites. Furthermore, the sites where active major work zones existed during the study period (such as the area around the Springfield Interchange) were removed from the analysis due to the negative influence of those activities on safety.

6
Table 1. Sites with Restrictions and Comparison Sites Evaluated Interstate Direction Start MP End MP Length
(mi) 2005
AADT 2005
Truck % Restrictions?
64 W 177.25 179.51 2.26 30,468 7.9 Yes 66 E 47.6 64 16.4 75,079 9.5 Yes 66 W 47.6 64 16.4 72,020 10.6 Yes 95 N 89.24 101.33 12.09 43,215 15.2 Yes 95 N 101.33 116.87 15.54 37,946 15.2 Yes 95 N 116.87 132.44 15.57 53,914 15.2 Yes 95 N 132.44 148 15.56 65,490 9.6 Yes 95 S 89.24 101.33 12.09 45,882 15.0 Yes 95 S 101.33 117.07 15.74 38,707 17.3 Yes 95 S 117.07 132.68 15.61 54,561 18.0 Yes 95 S 132.68 148 15.32 68,376 11.7 Yes 64 E 180 186 6 53,479 2.0 No 64 E 191 194 3 38,964 6.9 No 64 E 277 292 15 64,782 8.0 No 64 W 180 186 6 49,585 4.0 No 64 W 191 194 3 44,450 6.9 No 64 W 277 292 15 66,591 5.0 No 95 N 52 74 22 46,933 11.1 No 95 S 52 74 22 46,854 11.0 No 264 E 9 25 16 65,583 5.0 No 264 W 9 25 16 67,609 5.0 No MP = Milepost, AADT = Annual Average Daily Traffic Identification of Truck-Involved Crashes Related to Restrictions
The FR-300 crash reports for crashes involving at least one truck were examined for the sites in Table 1. The earlier analysis1 estimated that the restrictions on roads with 3 or more lanes by direction caused the total number of crashes involving trucks on these high volume roads to be about 37 percent higher than anticipated and the number of truck-involved crashes with a fatality or injury to be 27 percent higher than expected. Given these significant trends, the focus of this project’s analysis was on examining truck-involved crashes. The term “truck involved” denotes that a truck was one of the vehicles involved in the crash, and is not meant to imply that the truck was at fault in the crash.
Relevant crash report numbers were identified by examining data from the Highway Traffic Records Information System (HTRIS). FR-300s are available on line for viewing on the VDOT intranet. While the crash codes recorded in HTRIS provide some relevant data, the actual FR-300s include the crash diagram and narrative reported by the police officer. These data elements helped the researchers assess the degree to which the truck restrictions may have acted as a contributing factor in the crash. Cases where the restrictions may have contributed to the crash were identified and recorded. These include:
• Sideswipe (same direction), angle, or rear end crashes between a truck in the right lane and vehicles merging on or off of the highway
• Rear-end crashes between a vehicle and a leading truck in the lanes open to trucks
that occur during uncongested time periods while both are moving straight ahead.
7
• Sideswipe (same direction) or angle crashes created by a vehicle swerving/changing lanes around a truck in the lanes open to trucks during uncongested periods of the day.
Crashes that were not attributed to the restrictions included:
• Crashes that occurred while the truck was traveling in the far left lane
• Rear-end, angle, or sideswipe crashes that occurred during congestion, defined as crashes under stop-and-go traffic or estimated travel speeds at or below 35 mph
• Any crashes attributable to alcohol or drugs
• Deer/animal crashes
• Work zone crashes
• Fixed object, run-off-the-road crashes that are not the result of drivers overcorrecting
while taking evasive maneuvers near a truck, including cases of over height vehicles striking bridges or sign structures
• Single vehicle truck crashes related to fatigue or other factors not related to the
restrictions
• Crashes during snow or ice where no drivers were cited for an offense
• Crashes that occurred wholly on interchange ramps and miscoded to the mainline of the road
• Crashes created by mechanical problems or flat tires
• Crashes that involved a truck traveling in the restricted lane.
A permissive approach to screening out crashes was used. In other words, crashes were
retained if there was any question as to whether the restriction may have played a role in the crash. The process was carried out for both the test sites and the comparison sites shown in Table 1. Analysis of Crashes Potentially Related to Lane Restrictions The analysis of the crashes consisted of two phases. First, the number of crashes potentially attributable to the restrictions was examined. Differences in the proportion of crashes between test and comparison sites were examined, and compared to observed truck percentages at the sites.
8
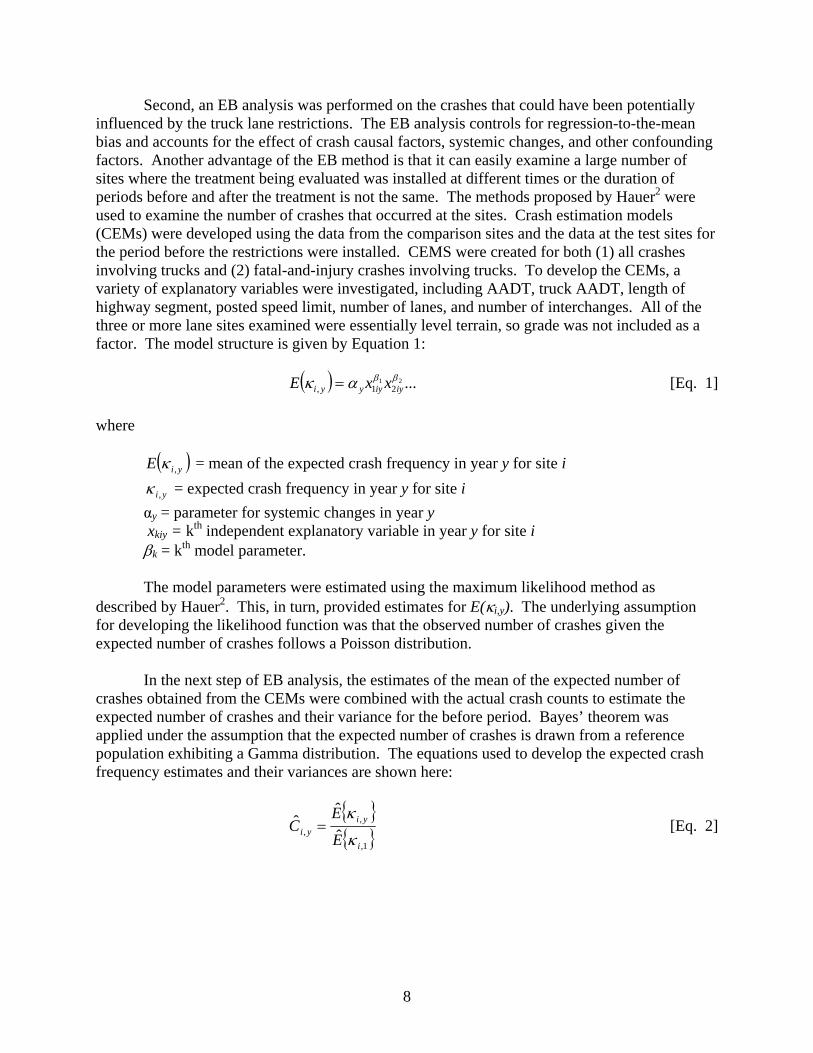
Second, an EB analysis was performed on the crashes that could have been potentially influenced by the truck lane restrictions. The EB analysis controls for regression-to-the-mean bias and accounts for the effect of crash causal factors, systemic changes, and other confounding factors. Another advantage of the EB method is that it can easily examine a large number of sites where the treatment being evaluated was installed at different times or the duration of periods before and after the treatment is not the same. The methods proposed by Hauer2 were used to examine the number of crashes that occurred at the sites. Crash estimation models (CEMs) were developed using the data from the comparison sites and the data at the test sites for the period before the restrictions were installed. CEMS were created for both (1) all crashes involving trucks and (2) fatal-and-injury crashes involving trucks. To develop the CEMs, a variety of explanatory variables were investigated, including AADT, truck AADT, length of highway segment, posted speed limit, number of lanes, and number of interchanges. All of the three or more lane sites examined were essentially level terrain, so grade was not included as a factor. The model structure is given by Equation 1:
( ) ...2121,ββακ iyiyyyi xxE = [Eq. 1]
where
( )yiE ,κ = mean of the expected crash frequency in year y for site i
yi,κ = expected crash frequency in year y for site i αy = parameter for systemic changes in year y xkiy = kth independent explanatory variable in year y for site i βk = kth model parameter.
The model parameters were estimated using the maximum likelihood method as
described by Hauer2. This, in turn, provided estimates for E(κi,y). The underlying assumption for developing the likelihood function was that the observed number of crashes given the expected number of crashes follows a Poisson distribution.
In the next step of EB analysis, the estimates of the mean of the expected number of crashes obtained from the CEMs were combined with the actual crash counts to estimate the expected number of crashes and their variance for the before period. Bayes’ theorem was applied under the assumption that the expected number of crashes is drawn from a reference population exhibiting a Gamma distribution. The equations used to develop the expected crash frequency estimates and their variances are shown here:
{ }{ }1,
,, ˆ
ˆˆ
i
yiyi E
EC
κ
κ= [Eq. 2]

9
{ } ∑
∑Υ
=
Υ
=
+
+=
i
i
yyi
i
yyi
i
CE
b
Kb
1,
1,
1,
1,
ˆˆ
ˆ
ˆ
ˆ
κ
κ [Eq. 3]
( )
{ }
2
1,
1,
1,
1,
ˆˆ
ˆ
ˆ
ˆˆ
⎟⎟⎠
⎞⎜⎜⎝
⎛+
+=
∑
∑Υ
=
Υ
=
i
i
yyi
i
yyi
i
CE
b
KbraV
κ
κ [Eq. 4]
1,,, ˆˆˆ iyiyi C κκ = [Eq. 5]
( ) ( )1,2,, ˆˆˆˆˆ iyiyi raVCraV κκ = [Eq. 6]
where
yiC ,ˆ = ratio of estimates for means of the expected number of crashes in year y to that of
year 1 for site i b̂ = dispersion parameter for the Gamma distribution that was simultaneously estimated in the maximum likelihood estimation
yiK ,ˆ = actual number of crashes in year y for site i
( )yiraV ,ˆ κ = variance of expected crash frequency in year y for site i Yi = total number of years in the before period for site i.
Equations 2 and 5 were used to obtain estimates of the predicted number of crashes that
would have occurred had truck lane restrictions not been implemented.
The unbiased estimation of the index of effectiveness, θ given by Equation 7, was used to measure the effect of truck lane restrictions on safety. θ represents the ratio of the crashes that actually occurred to what was predicted if no truck restrictions had been installed. A θ less than 1.0 shows a positive safety benefit, and a θ greater than 1.0 indicates that more crashes occurred than were predicted based on the comparison data and pre-existing conditions. The formula for variance of θ is given by Equation 8.
( )[ ]2ˆˆ1ˆ
ˆ πππλθ Var+⎟⎠⎞
⎜⎝⎛= [Eq. 7]
( ) ( )[ ] ( )[ ]{ } ( )[ ]22222 ˆˆ1ˆˆˆˆˆ ππππλλθθ VarVarVarraV ++= [Eq. 8]

10
where
π̂ = sum of the predicted number of crashes at all sites during the after period λ = sum of actual number of crashes at all sites during the after period.
The model that resulted in a high maximum likelihood function value and a low variance of θ was selected for each crash type investigated. The screened data were then analyzed to determine whether the restrictions were still anticipated to produce a negative safety effect once crashes unrelated to the restrictions were removed.
Operational Analysis of New Truck Restrictions on Two-Lane Sites
The operational impacts of the 2007 truck lane restrictions enacted in the Northwest and Southwest regions were examined using before-and-after data. Four operational measures of effectiveness (MOEs) were evaluated:
• Average speed across all lanes: This provides a measure of whether overall mobility has been improved.
• Average speed in the left lane only: Since the restrictions are intended to reduce the
number of slow-moving trucks in the left lane, the left lane should exhibit increases in average speed if the restrictions have been effective.
• Total number of trucks traveling in the left lane under 65 mph: This shows whether
the restrictions have created a tangible reduction in the number of slower-moving trucks in the left lane. This is a measure of compliance with the restriction during the “after” period.
• Total number of vehicles in a left-lane platoon led by a truck traveling under 65 mph:
This MOE examines the number of instances where a slow-moving truck leads a platoon of traffic in the left lane. A platoon is defined as a truck traveling with a headway of 3 seconds or more, followed by one or more vehicles with a headway of 2 seconds or less.
Both regions provided locations of the sites where signs for these new restrictions were to be installed. A subset of sites representing a range of traffic volumes, truck volumes, roadway grades, and lengths of grade were then selected for data collection. Sites located within 5 miles downstream of other sites with restrictions were not evaluated since the upstream site could bias the compliance and operations results. Data Collection Process
The Smart Travel Van (STV) was used to collect traffic data. The STV offers the ability to collect detailed, individual-level vehicle information in a non-intrusive manner. It has two AutoscopeTM video cameras that are affixed to an extendable mast which are used in conjunction

11
with video detection software to collect traffic characteristics of vehicles as they pass. A picture of the STV is shown in Figure 3. For this study, vehicle speed, classification, and headway were collected by lane for each individual vehicle. Data were collected for approximately 4 hours at each site during daylight conditions.
Prior to recording any information, the speed data collected by the video detection system were compared to measurements produced using a light detection and ranging (LIDAR) speed detection unit. Calibration factors in the AutoscopeTM software were then modified to ensure that the video detection system produced speed estimates that were in agreement with the LIDAR data.
The STV was located at least 0.5 miles from any entrance or exit ramps so that ramp impacts could be minimized. It was also located as close to the top of the grade as possible in order to create a “worst case” scenario for the trucks in terms of their likely deceleration. If not positioned properly, large trucks in the right lane can occlude the camera’s view of vehicles in the left lane, which will result in undercounting of traffic and errors in speed estimation. As a result, the STV was parked on the right shoulder of the roadway and positioned to balance the goals of getting as close to the edge line as possible (to minimize occlusion), while simultaneously providing enough space between the STV and traffic to ensure safety and minimize the impact of the STV on motorists’ lane choice.
Figure 3. Smart Travel Van Set Up
Following the field data collection, a quality assurance check was performed on the data.
The STV video feed was recorded, and the computer data file was checked by comparing the

12
videotape to the text data file. Cases of occlusion and false detector activations were identified during this process, and the data file was modified to ensure that only correct data were retained. Analysis of Operational Data
If the restrictions have been effective, the value of each of the MOEs evaluated should be a function of the geometric and traffic characteristics of the site, as well as the restriction type that was in place when data were collected. These MOEs were initially generated by aggregating the data into 15-minute time intervals. The data were then subjected to t-tests by site in order to gain a high level understanding of how the MOEs changed at each location. This allowed for an examination of the impact of the restrictions on each measure while holding geometric characteristics constant. The data from the individual sites were then aggregated together, and analysis of variance (ANOVA) testing was performed to examine broader trends across multiple sites.
While the t-tests and ANOVA provide some indication of the effects of the restrictions, they do not explicitly account for changes in other variables, such as traffic volume or differing geometric characteristics among sites. As a result, linear regression was used to try to gain a better understanding of how a variety of traffic, geometric, and traffic control characteristics influenced the MOEs evaluated. The form of the regression model was as shown in Equation 9: εββββ +++++= nn XXXY ...22110 [Eq. 9] where
Y = Response variable based on MOE being described βi = Model coefficient for variable i when 1≤i≤n; and intercept constant when i = 0 Xi = Variable i ε = Error term
The intent of the regression analysis was not to create predictive models that could be
generalized and applied to other sites, but rather to help better describe the role of a variety of different factors on the performance of the sites. Although geometric characteristics for a given site did not change during this evaluation, traffic characteristics such as volume and truck percentage did fluctuate during data collection. Constructing regression models allows for these factors to be considered simultaneously along with the impact of the restriction.
Safety Analysis of New Truck Restrictions on Two-Lane Sites
The safety analysis of the two lane restrictions consisted of two elements. First, the crash rates at the sites where the 2007 restrictions were posted were compared before and after the installation of the 2004 and 2007 restrictions. This provided for a comparison, normalized by exposure. Second, a naïve before-and-after analysis was conducted to determine whether the restrictions created any significant changes in crash frequency.

13
Since the new restrictions were installed in late August 2007, only a limited amount of data existed to perform a crash analysis. As a result, it was not possible to perform a robust analysis of the data, as was done with the restrictions on roads with three or more lane by direction. Instead, the safety analysis consisted of a naïve before-and-after study, using the methodology recommended by Hauer2. As was performed with the EB analysis described in the previous section, an index of effectiveness parameter, θ, was generated to indicate whether the restrictions produced a positive safety benefit.
The naïve before-and-after methodology approximately assumes the same annual trends would hold in the before and after period if no treatment had been applied. Control sites could not be used in this evaluation because the restrictions applied to all roads in Virginia, therefore no similar control sites within the state existed. While this methodology allowed for an analysis of safety impacts using a limited data set, it does not account for confounding factors, such as changes in weather or the vehicle fleet, which could impact crash trends. Thus, differences in crashes may not be solely attributable to the presence or absence of the restriction.
Analysis of Impact of Enforcement on Restriction Compliance The final task in this project involved determining whether increased enforcement could create changes in compliance with the restrictions on two-lane interstate segments. The Virginia State Police conducted a concentrated commercial vehicle enforcement campaign on I-64 westbound at Afton Mountain on Friday June 6, 2008 and Monday, June 9, 2008. The STV was used to collect data on Afton Mountain at Milepost 100.2. Trucks experience an average of a 4.2 percent grade over 5 miles leading up to this data collection point, so this was expected to be a “worst case scenario” in terms of truck speeds. Speed and compliance data were collected the day before enforcement activities started and the day after they ended. This provided a comparison immediately before and after the enforcement activities.
RESULTS
Literature Review
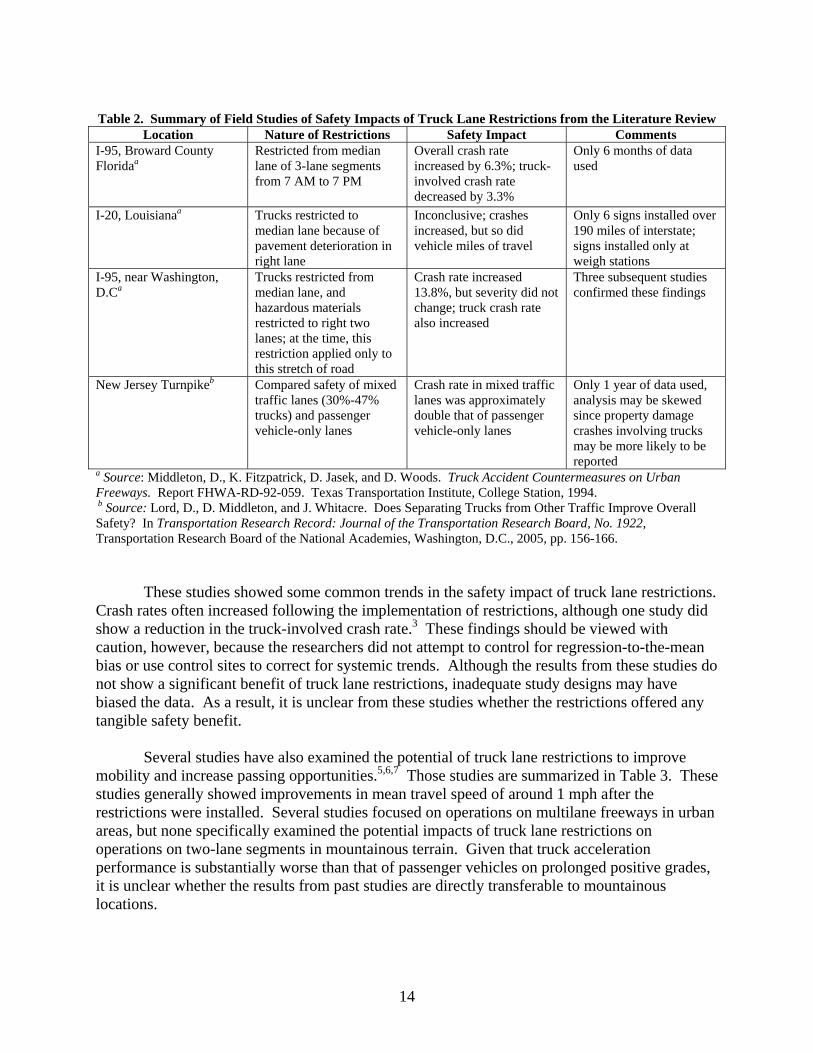
A survey conducted by the Federal Highway Administration (FHWA) in 1988 found that 26 states used truck restrictions.3 The objectives of the restrictions varied, but they were usually implemented to improve operations, reduce crashes, and/or preserve deteriorating pavement. Although the use of truck lane restrictions is widespread, relatively few studies have performed objective evaluations on their safety impacts. In many cases, the restrictions were implemented for political reasons and lacked any type of formal analysis of their impacts following implementation. In cases where evaluations were performed, conclusions were often based on an analysis of 1 year (or less) of crash data. Cases where a safety evaluation did occur are summarized in Table 2.3,4
14
Table 2. Summary of Field Studies of Safety Impacts of Truck Lane Restrictions from the Literature Review
Location Nature of Restrictions Safety Impact Comments I-95, Broward County Floridaa
Restricted from median lane of 3-lane segments from 7 AM to 7 PM
Overall crash rate increased by 6.3%; truck-involved crash rate decreased by 3.3%
Only 6 months of data used
I-20, Louisianaa Trucks restricted to median lane because of pavement deterioration in right lane
Inconclusive; crashes increased, but so did vehicle miles of travel
Only 6 signs installed over 190 miles of interstate; signs installed only at weigh stations
I-95, near Washington, D.Ca
Trucks restricted from median lane, and hazardous materials restricted to right two lanes; at the time, this restriction applied only to this stretch of road
Crash rate increased 13.8%, but severity did not change; truck crash rate also increased
Three subsequent studies confirmed these findings
New Jersey Turnpikeb Compared safety of mixed traffic lanes (30%-47% trucks) and passenger vehicle-only lanes
Crash rate in mixed traffic lanes was approximately double that of passenger vehicle-only lanes
Only 1 year of data used, analysis may be skewed since property damage crashes involving trucks may be more likely to be reported
a Source: Middleton, D., K. Fitzpatrick, D. Jasek, and D. Woods. Truck Accident Countermeasures on Urban Freeways. Report FHWA-RD-92-059. Texas Transportation Institute, College Station, 1994. b Source: Lord, D., D. Middleton, and J. Whitacre. Does Separating Trucks from Other Traffic Improve Overall Safety? In Transportation Research Record: Journal of the Transportation Research Board, No. 1922, Transportation Research Board of the National Academies, Washington, D.C., 2005, pp. 156-166.
These studies showed some common trends in the safety impact of truck lane restrictions. Crash rates often increased following the implementation of restrictions, although one study did show a reduction in the truck-involved crash rate.3 These findings should be viewed with caution, however, because the researchers did not attempt to control for regression-to-the-mean bias or use control sites to correct for systemic trends. Although the results from these studies do not show a significant benefit of truck lane restrictions, inadequate study designs may have biased the data. As a result, it is unclear from these studies whether the restrictions offered any tangible safety benefit.
Several studies have also examined the potential of truck lane restrictions to improve mobility and increase passing opportunities.5,6,7 Those studies are summarized in Table 3. These studies generally showed improvements in mean travel speed of around 1 mph after the restrictions were installed. Several studies focused on operations on multilane freeways in urban areas, but none specifically examined the potential impacts of truck lane restrictions on operations on two-lane segments in mountainous terrain. Given that truck acceleration performance is substantially worse than that of passenger vehicles on prolonged positive grades, it is unclear whether the results from past studies are directly transferable to mountainous locations.

15
Table 3. Summary of Past Operational Evaluations of Truck Restrictions from the Literature Review Location Restriction Type Site Characteristics Operational Impacts
Texas – Houston, Fort Worth, and Dallasa
Trucks restricted from median lane of 6-lane freeways
Three sites 5 to 9 miles long with AADTs between 32,000 and 87,000
1 to 12 percent reduction in trucks in left lane, less than 1 mph change in speeds
Seattle areab Trucks restricted from left lane of 3 and 4 lane roads. Trucks restricted from 2 leftmost lanes of 5 lane roads.
Three sites with lengths between 1 and 3 miles. Grades were between +4 and +5.1%. Trucks were 2 to 3 percent of the AADT. Sites had 3, 4, and 5 lanes by direction.
No change in compliance, but mean speeds increased by 0.7 mph after restrictions installed.
Wisconsin and Chicagoc
Trucks restricted from median lane
Two 3-lane sections with AADTs of 23,500 and 78,500 and one 2-lane section with an AADT of 4,478. Truck percentages were between 13 and 21 percent.
1 to 10 percent of trucks were not complying with restrictions. No significant differences in speeds between sites with restrictions and comparison sites.
AADT = Annual average daily traffic. a Source: Zavoina, M.C., T. Urbanik, and W. Winshaw. Operational Evaluation of Truck Restrictions on I-20 in Texas. In Transportation Research Record 1320, TRB, National Research Council, Washington, D.C., 1991, pp. 24-31. b Source: Mannering, F.L., Koehne, J.L., and Araucto, J. Truck Restriction Evaluation: The Puget Sound Experience. WA-RD 307.1. Washington State Transportation Center, Seattle, WA, 1993. c Source: Hanscom, F.R. Operational Effectiveness of Truck Lane Restrictions. In Transportation Research Record 1281, TRB, National Research Council, Washington, D.C., 1990, pp. 119-126.
The Seattle evaluations did examine road segments with positive grades, but they all had at least 3 lanes in each direction and trucks represented a small proportion of the total traffic stream.6 Only the evaluation in Wisconsin and Chicago examined a two-lane directional segment, but that section of road had an AADT of only 4,478 vpd and was located in essentially flat terrain.7 Further, there is no indication from the literature as to whether speed-based truck lane restrictions could create positive mobility benefits.
In summary, the prior studies reviewed generally showed that truck restrictions produced minimal operational benefits, and may actually degrade safety on some roads. Limitations in data sets and study designs are often present in past studies, however, and there has been no reported experience outside of Virginia in using speed-based truck lane restrictions to improve mobility on two-lane directional segments in mountainous terrain.
Safety Assessment of Restrictions on High Volume, Three or More Lane Sites
First, truck percentages on the three-lane test sections were compared to the percentage of crashes where at least one truck was involved. This provided a check to determine whether truck crashes appeared to be overrepresented at the test sites as a percentage of traffic. Table 4 summarizes this comparison. At sites with restrictions, trucks averaged 14.0 percent of the traffic stream, but they were involved in an average of 16.5 percent of all crashes. The comparison sites had a similar trend. Trucks comprised an average of 7.0 percent of the traffic stream, but were involved in an average of 9.2 percent of all crashes. Even though the

16
comparison sites had lower truck percentages, truck crashes were slightly over-represented in both cases relative to their volume.
Table 4. Comparison of Truck % to Truck-involved Crashes After Restrictions Were Implemented Interstate Direction Start
MP End MP Truck
% % of Crashes Involving
Trucks Restrictions?
64 W 177.25 179.51 7.5 3.7 Yes 66 E 47.6 64 8.5 11.7 Yes 66 W 47.6 64 8.8 10.2 Yes 95 N 89.24 101.33 16.2 22.8 Yes 95 N 101.33 116.87 17.5 19.8 Yes 95 N 116.87 132.44 17.8 18.6 Yes 95 N 132.44 148 12.0 14.5 Yes 95 S 89.24 101.33 16.3 22.9 Yes 95 S 101.33 117.07 18.2 21.8 Yes 95 S 117.07 132.68 18.8 20.6 Yes 95 S 132.68 148 12.8 14.8 Yes 64 E 180 186 2.7 6.3 No 64 E 191 194 7.0 12.6 No 64 E 277 292 8.6 7.4 No 64 W 180 186 3.4 8.0 No 64 W 191 194 6.6 10.1 No 64 W 277 292 7.3 5.7 No 95 N 52 74 11.6 16.6 No 95 S 52 74 12.1 16.8 No 264 E 9 25 5.6 3.9 No 264 W 9 25 5.4 4.3 No MP = Milepost
Next, crashes involving trucks were individually examined to determine if the restriction potentially had any role in the crash. The individual crash reports were screened according to the criteria shown in the methodology. After the screening process was complete, 743 crashes at the restricted sites and 441 crashes at the comparison sites remained for further analysis (before and after periods combined). This represented 43.5 percent and 37.4 percent of the original crash count for the test and comparison sites, respectively. Congested conditions resulted in the largest single cause for eliminating crashes. A total of 526 crashes at the restricted sites and 271 crashes at the comparison sites were eliminated because they occurred during congestion. As expected, crashes during congestion accounted for a larger proportion of crashes at the restricted sites (30.8%) than at the comparison sites (23.0%). Many of the restricted sites were located in Northern Virginia where the duration and extent of congestion is much larger than in other areas of the state, therefore it was expected that this would be a major reason for removing crashes.
It should be noted that there are potential interactions between the truck restrictions and congestion. If a high proportion of trucks are traveling in the rightmost lane, they may interfere with vehicles merging on or off the road. This additional interference could result in congestion as well as safety problems. On the other hand, congestion unrelated to truck restrictions could create a situation where more crashes occur due to increased opportunity for driver error during stop-and-go conditions. These crashes would be unrelated to the restrictions, and merit

17
elimination. Ultimately, all crashes during congestion were eliminated from further analysis since the crash reports were often not specific enough to determine whether the restriction may have been a factor during congested conditions. As a result, it is possible that the analysis using the screened data set may cause crash estimates to be lower than the true effect of the restrictions.
CEMs were then estimated using the screened crash data. The new CEMs are shown in Table 5 along with the original CEMs developed using all crashes in the phase one study.1 Generally speaking, the form of the CEMs for screened crashes was similar to the form when all crashes were used. The AADT variable was not significant for the overall truck-involved screened crash model, but all other model factors developed in the earlier project1 were retained in the models using the screened data. Speed limit and interchange density were not found to offer strong predictive value in any of the models evaluated.
Table 5. CEMs Developed Parameter for Explanatory Variables
Measure Sites Used AADT Truck AADT Length No. of Lanes High volume (all crashes)
0.002 0.012 0.830 N/A Truck-involved crashes
High volume (screened crashes)
N/A 0.137 1.128 N/A
High volume (all crashes)
N/A 0.107 0.682 2.564 Truck-involved fatal/injury crashes High volume
(screened crashes) N/A 0.342 0.837 0.165
AADT = Annual Average Daily Traffic.
Table 6 summarizes the results of the EB analysis for the screened restriction-related crashes involving trucks. As can be seen, the total number of crashes continued to remain higher than expected, with the total number of crashes about 23 percent higher than estimated if no restrictions were present. There was no statistically significant difference in the number of fatal and injury crashes versus what was expected if restrictions were not present. Although the estimated impact of the truck lane restrictions on crashes was not as high as when the unscreened crashes are used, it reinforces the findings in the prior research by VTRC1 that crashes are higher than expected at higher volume sites. This analysis indicates that the implementation of truck lane restrictions on these higher volume roads is having a negative safety impact, even when a conservative approach to removing crashes that are unrelated to the restrictions was applied.
Table 6. EB Analysis of Screened Truck-Involved Crashes Related to Truck Lane Restrictions Crashes
Actual Crashes
Predicted Crashes
Difference
95th% Confidence Interval
Index of Effectiveness
95th% Confidence Interval
All 638 517.14 120.86 120.86 ± 53.51 1.23 1.23 ± 0.11 Fatal and injury
218 210.22 7.78 7.78 ± 29.15 1.04 1.04 ± 0.14
Operational Analysis of New Truck Restrictions on Two-Lane Sites
18
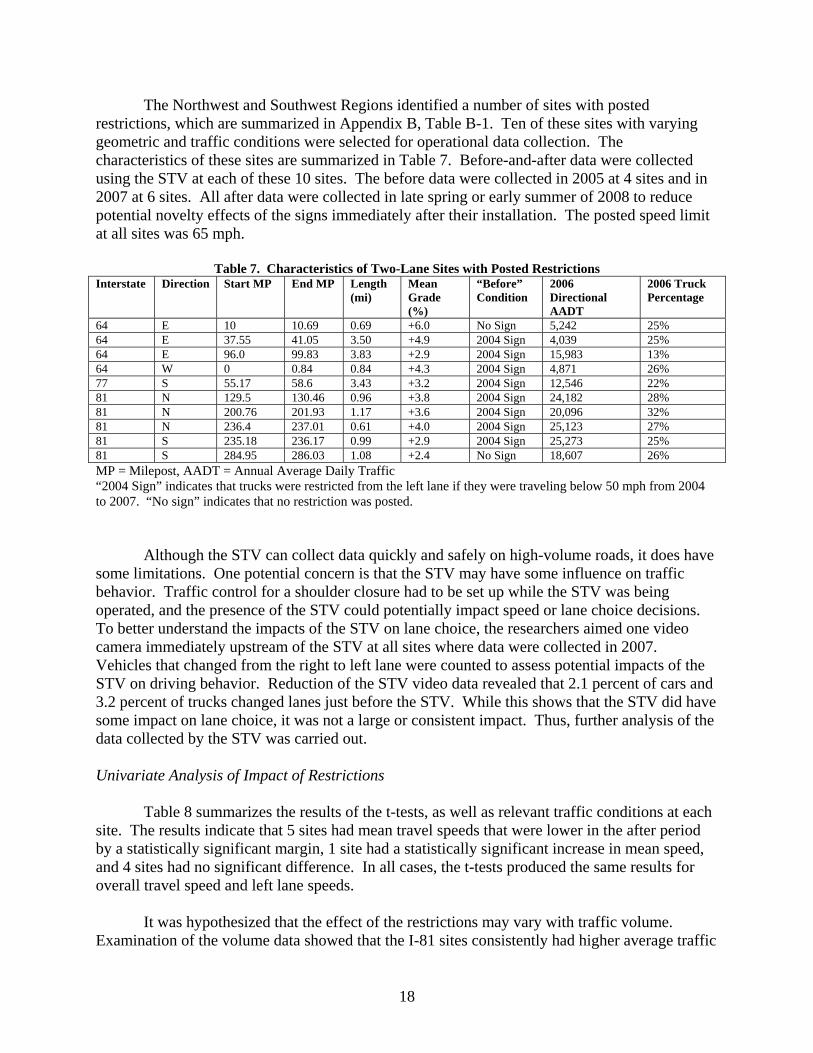
The Northwest and Southwest Regions identified a number of sites with posted restrictions, which are summarized in Appendix B, Table B-1. Ten of these sites with varying geometric and traffic conditions were selected for operational data collection. The characteristics of these sites are summarized in Table 7. Before-and-after data were collected using the STV at each of these 10 sites. The before data were collected in 2005 at 4 sites and in 2007 at 6 sites. All after data were collected in late spring or early summer of 2008 to reduce potential novelty effects of the signs immediately after their installation. The posted speed limit at all sites was 65 mph.
Table 7. Characteristics of Two-Lane Sites with Posted Restrictions Interstate Direction Start MP End MP Length
(mi) Mean Grade (%)
“Before” Condition
2006 Directional AADT
2006 Truck Percentage
64 E 10 10.69 0.69 +6.0 No Sign 5,242 25% 64 E 37.55 41.05 3.50 +4.9 2004 Sign 4,039 25% 64 E 96.0 99.83 3.83 +2.9 2004 Sign 15,983 13% 64 W 0 0.84 0.84 +4.3 2004 Sign 4,871 26% 77 S 55.17 58.6 3.43 +3.2 2004 Sign 12,546 22% 81 N 129.5 130.46 0.96 +3.8 2004 Sign 24,182 28% 81 N 200.76 201.93 1.17 +3.6 2004 Sign 20,096 32% 81 N 236.4 237.01 0.61 +4.0 2004 Sign 25,123 27% 81 S 235.18 236.17 0.99 +2.9 2004 Sign 25,273 25% 81 S 284.95 286.03 1.08 +2.4 No Sign 18,607 26% MP = Milepost, AADT = Annual Average Daily Traffic “2004 Sign” indicates that trucks were restricted from the left lane if they were traveling below 50 mph from 2004 to 2007. “No sign” indicates that no restriction was posted.
Although the STV can collect data quickly and safely on high-volume roads, it does have some limitations. One potential concern is that the STV may have some influence on traffic behavior. Traffic control for a shoulder closure had to be set up while the STV was being operated, and the presence of the STV could potentially impact speed or lane choice decisions. To better understand the impacts of the STV on lane choice, the researchers aimed one video camera immediately upstream of the STV at all sites where data were collected in 2007. Vehicles that changed from the right to left lane were counted to assess potential impacts of the STV on driving behavior. Reduction of the STV video data revealed that 2.1 percent of cars and 3.2 percent of trucks changed lanes just before the STV. While this shows that the STV did have some impact on lane choice, it was not a large or consistent impact. Thus, further analysis of the data collected by the STV was carried out. Univariate Analysis of Impact of Restrictions
Table 8 summarizes the results of the t-tests, as well as relevant traffic conditions at each site. The results indicate that 5 sites had mean travel speeds that were lower in the after period by a statistically significant margin, 1 site had a statistically significant increase in mean speed, and 4 sites had no significant difference. In all cases, the t-tests produced the same results for overall travel speed and left lane speeds.
It was hypothesized that the effect of the restrictions may vary with traffic volume. Examination of the volume data showed that the I-81 sites consistently had higher average traffic
19
volumes than the I-64 and I-77 sites. Therefore, ANOVA testing was performed using three different analysis groups:
1. all sites combined 2. all I-81 sites combined 3. I-64 and I-77 sites combined
The analysis indicated that the combined I-64 and I-77 sites showed a statistically significant decline in overall travel speed, as did the results for all sites combined. Neither one of those groups exhibited a statistically significant change in left lane speed. The I-81 sites did not show a statistically significant reduction in speed across all lanes or in the left lane.
Table 8. Analysis of Speed Data Before and After Restrictions Were Installed Mean Speed (mph)
Speed Analysis
P-valueb Significant?c
Site “Before” Conditiona
Period Hrs. of Data
Mean Volume (vph)
Mean Truck % All Left
All Left All Left Before 4 351.3 20.7 56.77 57.63 I-64 EB,
MP 10.69
No Signs After 3.25 264.6 26.4 56.99 58.76
0.730 0.104 No No
Before 4.25 308.2 26.3 57.36 60.48 I-64 EB, MP 41.05
2004 Sign After 4 221.5 34.9 54.40 57.15
0.000 0.000 Yes, B>A
Yes, B>A
Before 2.25 1007.1 14.2 60.23 63.12 I-64 EB, MP 99.83
2004 Sign After 4.75 850.1 18.9 61.10 63.02
0.440 0.920 No No
Before 4.5 394.7 26.5 65.41 66.73 I-64 WB, MP 0.0
2004 Sign After 4 300.3 27.5 62.97 65.16
0.000 0.000 Yes, B>A
Yes, B>A
Before 4 693.3 23.3 59.11 62.25 I-77 SB, MP 55.17
2004 Sign After 4 661.5 34.3 56.47 60.23
0.000 0.000 Yes, B>A
Yes, B>A
Before 1.5 1762.0 21.3 59.49 60.89 I-81 NB, MP 130.46
2004 Sign After 4 1278.0 35.0 55.08 55.57
0.001 0.002 Yes, B>A
Yes, B>A
Before 4.25 1354.4 34.1 58.75 60.10 I-81 NB, MP 201.93
2004 Sign After 4 1295.3 32.7 57.91 59.94
0.191 0.820 No No
Before 4.25 1743.3 29.3 61.59 63.50 I-81 NB, MP 237.01
2004 Sign After 4 1423.8 33.1 60.68 62.45
0.005 0.006 Yes, B>A
Yes, B>A
Before 4.5 2416.4 20.1 61.11 61.66 I-81 SB, MP 235.18
2004 Sign After 4 1420.8 32.9 63.93 67.13
0.00 0.00 Yes, B<A
Yes, B<A
Before 4.25 1236.2 28.1 65.49 66.24 I-81 SB, MP 284.95
No Signs After 4 1050.5 42.1 65.60 67.02
0.745 0.052 No No
Before 19 59.85 62.08 I-64 and I-77 After 20 58.53 61.02
0.027 0.060 Yes, B>A
No
Before 18.75 61.55 62.70 I-81 After 20 60.64 62.42
0.105 0.651 No No
Before 37.75 60.69 62.39 All Sites
After 40
59.59 61.72 0.009 0.112 Yes,
B>A No

20
a “2004 Sign” indicates that signs restricting trucks to the right lane were when traveling below 50 mph were posted at the site during the before period. “No Sign” indicates that no sign was present, even though the restriction was in effect. b P-values were generated from t-tests for individual sites, and ANOVA for the combined I-64 and I-77 sites, combined I-81 sites, and all sites combined. c Significance is determined at α=0.05. “B” represents the before period, and “A” represents the after period.
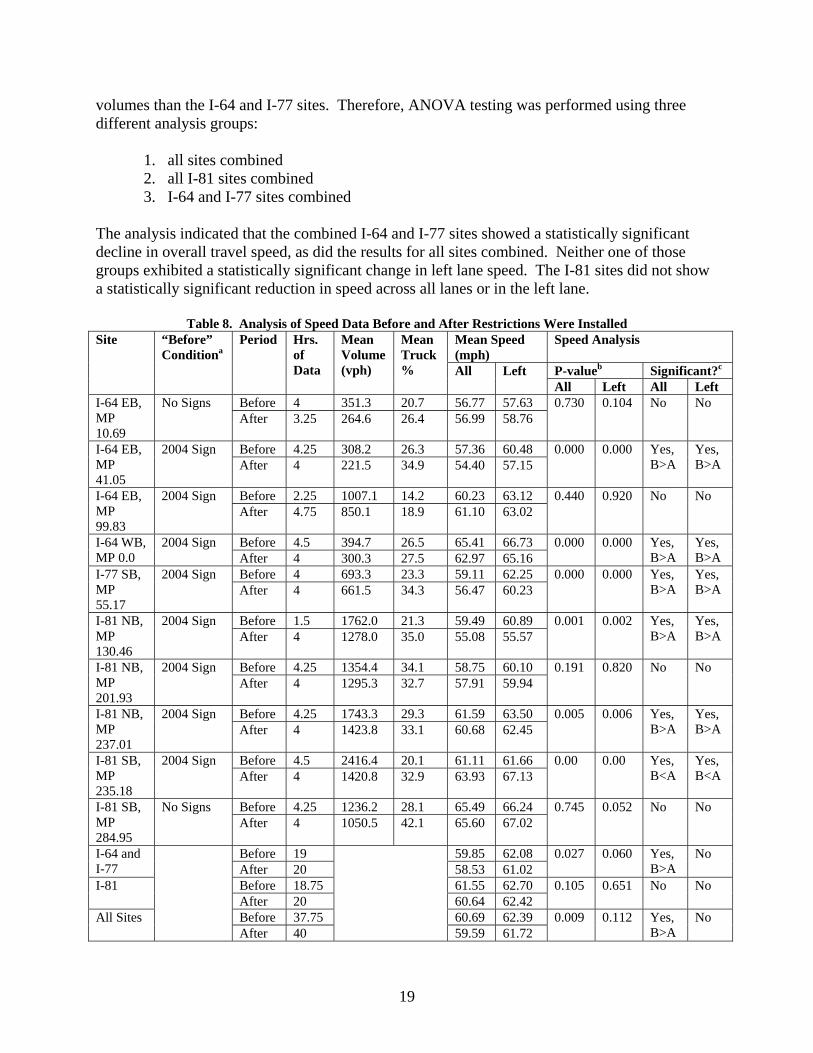
At first glance, these results are non-intuitive as one would expect the restrictions to have a positive or neutral effect on travel speeds. These results may be explained by examining the volumes and speeds of passenger car and truck traffic. Table 8 shows that, in general, the “after” period had lower overall average volumes and higher truck percentages than the “before” period. While the reasons for this trend are unknown, it may be partially attributable to changes in travel due to higher fuel prices, differences in seasonal or daily travel patterns, or the economic downturn. Table 9 provides specific information on the changes in speed and volume for passenger vehicles and trucks between the before and after periods. On average, the after period had 27.7 percent fewer passenger vehicles than in the before period, while the truck volume increased by 5 percent. As a result, trucks represented a larger proportion of the total traffic stream, thereby exerting a larger influence on mean speed measures. Table 9 shows that the truck speeds were often significantly lower than passenger car speeds at these sites, especially when grades were steep.
Table 9. Comparison of Passenger Vehicle and Truck Volumes and Speeds Site Period Mean # of
Passenger Vehicles (vph)
Mean Passenger Vehicle Speed (mph)
Mean # of Trucks (vph)
Mean Truck Speed (mph)
Before 278.6 58.51 72.7 50.19 After 194.7 59.45 69.9 49.75
I-64 EB, MP 10.69
Change -30.1% +0.94 -3.9% -0.44 Before 227.1 60.52 81.1 48.40 After 144.2 59.3 77.3 44.71
I-64 EB, MP 41.05
Change -36.5% -1.15 -4.7% -3.69 Before 864.1 60.52 143.0 58.70 After 689.4 62.40 160.7 55.43
I-64 EB, MP 99.83
Change -20.2% +1.88 +12.4% -3.27 Before 290.1 67.10 104.6 60.84 After 217.7 65.40 82.6 56.73
I-64 WB, MP 0.0
Change -25.0% -1.70 -21.0% -4.11 Before 531.8 60.74 161.5 53.69 After 434.6 60.89 226.9 48.10
I-77 SB, MP 55.17
Change -18.3% +0.15 +40.5% -5.59 Before 1386.7 60.84 375.3 54.93 After 830.7 56.42 447.3 52.51
I-81 NB, MP 130.46
Change -40.1% -4.42 +19.2% -2.42 Before 892.5 59.96 461.9 55.80 After 871.7 59.65 423.6 54.20
I-81 NB, MP 201.93
Change -2.3% -0.31 -8.3% -1.60 Before 1232.5 62.17 510.8 60.06 After 952.5 61.80 471.3 58.54
I-81 NB, MP 237.01
Change -22.7% -0.37 -7.7% -1.52 I-81 SB, MP Before 1930.7 60.97 485.7 60.75
21
After 953.4 64.54 467.4 62.79 235.18 Change -50.6% +3.57 -3.8% +2.04 Before 888.8 65.64 347.4 64.93 After 608.2 66.39 442.3 64.55
I-81 SB, MP 284.95
Change -31.5% +0.75 +27.3% -0.38 All Sites Combined Mean
Change -27.7% -0.07 +5.0% -2.10
vph = vehicles per hour
When Tables 8 and 9 are compared, specific volume trends were observed at sites where “before” speeds were higher than “after” speeds. These locations all experienced significant reductions in the mean number of passenger cars and either a small decline or increase in the number of trucks. Because of this phenomenon, it is difficult to attribute the speed changes to the presence or absence of restrictions. It appears that the findings in Table 8 are likely attributable primarily to the increased proportion of trucks in the traffic stream.
Next, the number of trucks traveling below 65 mph in the left lane was examined to determine the impact of the restrictions on the lane choice of slow-moving trucks. Again, t-tests and ANOVA were used to analyze the data. The results of this analysis are summarized in Table 10. Similar to the average speed results, 5 sites exhibited a statistically significant increase in the number of trucks traveling in the left lane below 65 mph, while only 1 site showed a statistically significant reduction. Noncompliance with the posted restrictions was significant in the after period, ranging from 13 to over 50 percent of all trucks in violation of the posted restriction. Once again, it is difficult to assign causality to these findings, since changes in truck and overall traffic volume may have been a much stronger factor in the increases in noncompliance than the presence of the restrictions.
There are limitations with only examining the number of trucks traveling below 65 mph in the left lane. First, this approach does not account for trucks traveling in a queue behind slower moving vehicles. In such cases, the driver of the truck is probably not intentionally violating the restriction and is not likely to get a citation. Field observations also showed that there were sometimes instances where the slow moving trucks could not move out of the left lane easily due to high volumes in the right lane. This would have acted as an impediment to compliance as well. Second, it does not account for trucks adversely impacting other vehicles. It could be argued that trucks should be allowed to pass at speeds below the posted speed limit if they are not impeding other vehicles.
To address this issue, the number of vehicles traveling in a platoon behind a lead truck going below 65 mph was analyzed to determine how many vehicles were being negatively impacted by slow-moving trucks. Table 10 summarizes those results. After the 2007 restrictions were implemented, only one site exhibited a statistically significant reduction in the average number of vehicles in a platoon led by a violator truck, with another exhibiting a statistically significant increase in the number of platooned vehicles. There was no statistically significant difference at the other 8 sites. Across all sites, there was no statistically significant difference in the average number of platooned vehicles. The lower volume I-64 and I-77 sites had a statistically significant increase in platooned vehicles, while the I-81 sites had a statistically significant reduction in platooned vehicles.

22
Based on the results, it is clear that the univariate analysis does not provide a strong
explanation of the impact of the restrictions on operations. A before-and-after study design was originally selected with the expectation that traffic volumes would remain reasonably consistent in the two periods. However, the data showed that there were significant changes in the overall traffic volumes and truck percentages, which makes it difficult to directly compare the before and after periods without correcting for the changes in flow characteristics. As a result, regression models were constructed to better understand what role, if any, the restrictions had on operations at these sites.
Table 10. Analysis of Trucks Traveling Below 65 mph in Left Lane # of Trucks < 65 mph in Left Lane # of Vehicles in a Platoon in Left
Lane Led by a Truck < 65 mph Site “Before”
Conditiona Period
Mean Volume (vph)
% of Trucks
P-value
Sig.?b Mean Volume (vph)
% of Traffic
P-valueb
Sig.?c
Before 40.5 55.7 17.8 5.1 I-64 EB, MP 10.69
No Signs After 39.7 56.8
0.904 No 17.5 6.6
0.969 No
Before 21.4 26.4 9.4 3.1 I-64 EB, MP 41.05
2004 Sign After 38.0 49.2
0.001 Yes, B<A 8.8 4.0
0.828 No
Before 20.9 14.6 18.2 1.8 I-64 EB, MP 99.83
2004 Sign After 45.5 28.3
0.000 Yes, B<A 39.6 4.7
0.003 Yes, B<A
Before 24.2 23.1 11.6 2.9 I-64 WB, MP 0.0
2004 Sign After 33.3 40.3
0.041 Yes, B<A 13.5 4.5
0.613 No
Before 36.3 22.4 29.3 4.2 I-77 SB, MP 55.17
2004 Sign After 44.8 19.7
0.199 No 35.8 5.4
0.398 No
Before 90.0 24.0 181.3 10.3 I-81 NB, MP 130.46
2004 Sign After 143.5 32.1
0.000 Yes, B<A 166.8 13.0
0.684 No
Before 152.5 33.0 220.0 16.2 I-81 NB, MP 201.93
2004 Sign After 159.0 37.6
0.652 No 216.0 16.7
0.920 No
Before 136.5 26.8 215.1 12.3 I-81 NB, MP 237.01
2004 Sign After 185.3 39.4
0.001 Yes, B<A 226.5 15.9
0.690 No
Before 126.0 25.9 268.0 10.5 I-81 SB, MP 235.18
2004 Sign After 63.8 13.6
0.000 Yes, B>A 74.8 5.3
0.000 Yes, B>A
Before 49.9 14.3 57.4 4.9 I-81 SB, MP 284.95
No Signs After 65.8 14.9
0.127 No 63.3 6.0
0.686 No
Before 29.15 26.7 16.9 3.4 I-64 and I-77 After 40.45 31.9
0.000 Yes, B<A 23.9 5.0
0.020 Yes, B<A
Before 114.24 25.6 190.5 11.2 I-81 After 123.45 27.4
0.304 No 149.5 11.6
0.022 Yes, B>A
Before 71.42 25.8 103.1 9.4 All Sites
After 81.95 28.4 0.114 No
86.7 9.8 0.185 No
a “2004 Sign” indicates that signs restricting trucks to the right lane when traveling at 50 mph or below were posted at the site during the before period. “No Sign” indicates that no sign was present, even though the restriction was in effect. b P-values were generated from t-tests for individual sites, and ANOVA for the combined I-64 and I-77 sites, combined I-81 sites, and all sites combined. c Significance is determined at α=0.05. “B” represents the before period, and “A” represents the after period.

23
Regression Models
Linear regression models were developed to help explain the influence of traffic volumes, roadway geometry, and traffic control factors on the response variables. It should again be emphasized that these models are intended to explain only what was occurring at these 10 sites, and are not intended to be transferable to other locations. All of the data collected were used to construct these models, and were not validated against data from other sites.
Stepwise linear regression was used to construct ordinary least squares regression models. The explanatory variables investigated included mean grade, length of grade, total traffic volume, truck volume, restriction type, and various interaction terms for these factors. Variables were entered into the model if their significance level was less than 0.05, and were removed from the model if their significance level exceeded 0.10.
The restriction type was specified as a binary categorical variable, with “0” representing cases where trucks traveling below 50 mph were restricted from the left lane and “1” representing cases where trucks traveling below 65 mph were restricted. Some consideration was given to creating a separate category for the two sites where no signs were installed in the “before” period, but there was insufficient data to develop robust models for those locations.
Initially, models were constructed using data summarized in 15-minute time intervals. Although this created a large data set for model building, extreme values sometimes exerted undue influences on the models. This was particularly problematic at the lower volume sites, where small numbers of slow-moving vehicles sometimes produced significant impacts on the model, degrading the goodness of fit. As a remedy, data were re-summarized into one hour time periods to reduce the impact of extreme values. This produced 74 1-hour records that were used in the regression, 35 from the before period and 39 from the after period. This aggregation improved the model fit, while still capturing the effect of site level variations of the traffic characteristics.
Goodness of fit was measured in terms of the adjusted coefficient of multiple determination value (R2
a). The R2a value accounts for the number of variables in the model,
thereby giving preference to simpler models with fewer terms. The signs of the coefficients were examined to ensure that they were intuitive based on known traffic flow characteristics (for example, higher positive grades should not produce increases in speed).
Standardized coefficients for the model parameters were also examined to help understand the relative importance of each variable. The standardized coefficients are normalized based on the mean and standard deviation of each variable. Since each variable has different units, the standardized coefficients help to explain how a change in one variable would impact the dependent variable, if all other variables were held constant.
The results of the modeling of the average speed across all lanes are shown in Table 11. The R2
a value for the fitted model is 0.620. The grade of the segment, the length of the grade,

24
and the volume of trucks were all found to be significant. The coefficients for these variables were all negative, indicating that any increase in these variables will result in a decrease in the average overall speed. The variable for the restriction was not found to be statistically significant, indicating that the restriction played no significant role in dictating the average speed at each site.
Table 11. Regression Model for Overall Average Speed, One Hour Data Variable Coefficient
Estimate Standard Error
t Value Significance Standardized Coefficient
Intercept 84.551 2.477 34.140 0.000 Grade (%) -4.103 0.405 -10.123 0.000 -1.270 Truck Volume (vph) -0.017 0.003 -6.718 0.000 -0.829 Length (mi) -2.601 0.299 -8.700 0.000 -0.809
Table 12 shows the regression model for the number of trucks traveling in the left lane below 65 mph. The R2
a for this model was 0.729. Once again, the grade, the length of the grade, and the truck volume were found to be significant variables. The signs for the coefficients of these variables were all positive, indicating that a larger number of slower-moving trucks will travel in the left lane as each of these factors increase in value. The standardized coefficient shows that the grade of the road plays a particularly important role, with a change of one standard deviation in grade accounting for more than 5 times the change in the response variable as compared to a one standard deviation change in truck volume. Once again, the truck restriction variable was not found to be a significant factor. This indicates that the number of trucks violating the restriction is a function of the geometry and traffic characteristics on the road, and not the restriction signage.
Table 12. Regression Model for Hourly Number of Trucks Below 65 mph in Left Lane Variable Coefficient
Estimate Standard Error
t Value Significance Standardized Coefficient
Intercept -138.335 32.119 -4.307 0.000 Grade (%) 24.019 5.256 4.569 0.000 1.199 Length (mi) 11.511 3.877 2.969 0.004 0.485 Truck Volume (vph) 0.375 0.033 11.494 0.000 0.233
Table 13 summarizes the results of the stepwise regression for the number of vehicles platooned behind a truck traveling less than 65 mph. The R2
a for this model was 0.761, and the grade, length of grade, truck volume, and overall volume were found to be significant factors. The standardized coefficients show that the overall and truck volumes play a particularly important role in explaining the number of platooned vehicles. All coefficients are positive, indicating that as each of these factors increase, the number of platooned vehicles will increase. Once again, the presence or absence of truck restrictions was not found to have a statistically significant impact on the model. Thus, the restrictions had no discernable effect on the number of vehicles being impeded by trucks traveling less than 65 mph in the left lane at the study sites. Table 13. Regression Model for Hourly Number of Vehicles in a Platoon Behind a Truck Traveling < 65 mph
in the Left Lane Variable Coefficient Standard t Value Significance Standardized

25
Estimate Error Coefficient Intercept -240.052 51.848 -4.630 0.000 Grade (%) 33.652 8.459 3.978 0.000 0.397 Length (mi) 14.531 6.218 2.337 0.022 0.172 Truck Volume (vph) 0.361 0.079 4.578 0.000 0.674 Total Volume (vph) 0.081 0.020 3.981 0.000 0.514
The regression results indicate that the trends seen in the univariate analysis were a function of the changing traffic characteristics of the sites in the before and after period. The presence of the new truck lane restriction in the after period did not appear to create any difference in any of the MOEs investigated. Field Observations During Data Collection Field observations and discussions with Virginia State Police field personnel revealed some possible limitations of the current signing plan used on the two-lane segments with restrictions. Currently, one sign is posted at the bottom of the grade in the median. There are several potential limitations to this signing plan:
• Signs in the median may be obscured due to traffic, particularly at high volume sites. This may limit their visibility to traffic in the right lane.
• As shown in Table B-1, some of the sites with posted restrictions have sustained
grades over 3 miles long. It is possible that truck drivers may have forgotten about the restrictions by the time they reach the top of the grade where the operational data were collected.
Additional redundant signing or increased sign conspicuity may potentially help improve compliance. Signs could be posted on both sides of the road at the start of the grade, and additional signage could be installed to remind drivers of the restrictions.
Safety Analysis of New Truck Restrictions on Two-Lane Sites Tables B-1 and B-2 in Appendix B show the site characteristics and crash counts at the sites with the new two-lane truck restrictions, respectively. A total of 25 sites were analyzed, and crash data from 2001 to 2008 were used for these facilities. All sites were located in the western parts of Virginia on I-64, I-77, and I-81 where steep grades on the interstate were present. At 6 of these sites, no truck restrictions were ever posted prior to the installation of the 2007 restrictions. The remaining 19 sites had the 2004 restrictions posted prior to the installation of the 2007 restrictions. Crash Rate Table 14 summarizes the overall crash rate by year for the two-lane sites with restrictions. Between September 2001 and August 2004, none of the sites had truck restrictions

26
posted. Between September 2004 and August 2007, 19 sites (76%) had posted restrictions that prohibited trucks from traveling in the left lane below 50 mph. The remaining 6 sites (24%) had no posted restriction during this period. The table separates the crash rates for those two groups during that time period. From September 2007 to August 2008, all sites had posted restrictions that prohibited trucks from traveling in the left lane below 65 mph.
Table 14. Yearly Crash Rates by Year at Two-Lane Sites with Restrictions Crash Rate (Crashes per 100 Million VMT) Date Range Truck Lane Restrictions in
Effect All Sites Sites With 2004 Sign
Sites Without 2004 Signs
9/01-8/02 None 37.94 9/02-8/03 None 50.52 9/03-8/04 None 50.87
N/A
9/04-8/05 Trucks < 50 mph cannot be in left lane
40.27 36.78 70.47
9/05-8/06 Trucks < 50 mph cannot be in left lane
40.33 39.61 46.86
9/06-8/07 Trucks < 50 mph cannot be in left lane
49.54 48.28 59.66
9/07-8/08 Trucks < 65 mph cannot be in left lane
45.24 N/A
VMT = vehicle miles of travel. The table shows that there were some year-to-year fluctuations in crash rate during the analysis period. The average crash rate from September 2001 to August 2004 was 46.44 crashes per 100 million VMT. The average crash rate from September 2004 to August 2007 was 41.56 crashes per 100 million VMT for the sites that restricted trucks from the left lane when traveling below 50 mph and 59.0 crashes per 100 million VMT for sites with no restrictions. The overall crash rate for all sites 43.38 crashes per 100 million VMT. The crash rate from September 2007 to August 2008 was 45.24 crashes per 100 million VMT. Thus, it appears that when all sites are examined together there was not much variation in crash rate during the seven years analyzed. As a point of reference, the average crash rate for all of I-81 varied between 41 and 53 crashes per 100 million VMT during this same period. This means that the crash rates of the sites were generally close to typical sections along I-81. Crash Frequency Analysis The naïve before-and-after study design was used to examine changes in crash frequency between several different time periods and treatments. The analyses performed included comparisons between:
• No restrictions posted vs. 2004 restrictions posted. This comparison used “before” data from 2001 to 2004 and “after” data from 2004 to 2007 for sites that had posted signs with the 2004 restrictions. This comparison used data from 19 sites. This comparison was performed to assess whether the results reported in the first phase of this research1 were still observed with the three years worth of “after” data.

27
• No restrictions posted vs. 2004 and 2007 restrictions posted. This comparison used a “before” data set consisting of all years where no truck restriction signs were posted vs. an “after” period that used either the 2004 or 2007 restriction. This utilized all available years of data from all of the sites listed in Appendix B. The purpose of this comparison was to determine if any type of truck restriction created safety benefits.
• No restrictions posted vs. 2007 restriction posted. This comparison used data from
the 6 sites where no restrictions were posted until 2007, when the 2007 restriction were posted.
• No restriction posted or 2004 restriction posted vs. 2007 restriction posted. This
comparison utilized data from all sites shown in Appendix B. It compared all possible before conditions to what occurred after the 2007 restriction was installed.
• 2004 restriction posted vs. 2007 restriction posted. This comparison examined
whether there was any change in crash performance for the sites that transitioned from the 2004 restriction to the 2007 restriction. It used data from the 19 sites where 2004 restrictions were posted.
Table 15 shows the results of this analysis. None of the comparisons showed a statistically significant change in the overall number crashes between the different before and after periods. Thus, it appears that the restrictions did not create any significant changes in safety versus when no signs were present.
Table 15. Crash Frequency Results of Naïve Before-and-After Study “Before” Condition
“After” Condition
Observed “Before” Crashes
Observed “After” Crashes
Predicted “After” Crashes
Difference (Observed-Predicted)
Index of Effectiveness
Index of Effectiveness 95th % Confidence Interval
No sign 2004 Sign 253 242 253 -11 0.95 0.95 ± 0.17 No sign 2004 and
2007 Sign 335 338 351 -13 0.95 0.95 ± 0.15
No sign 2007 Sign 82 17 13.7 +3.3 1.23 1.23 ± 0.63 No sign or 2004 Sign
2007 Sign 577 96 96.2 -0.2 1.00 1.00 ± 0.22
2004 Sign 2007 Sign 242 79 80.67 -1.67 0.98 0.98 ±0.25 “2004 Sign” indicates that trucks were restricted from the left lane if traveling at 50 mph or below. “2007 Sign” indicates that trucks were restricted from the left lane if traveling below 65 mph. Predicted crashes were generated assuming that trends from the “before” period were carried through to the “after” period at the same levels, adjusted for exposure time.
The results shown in Table 15 differ from the crash analysis findings from the first phase of this study.1 That study estimated that the 2004 restrictions produced a 23 percent reduction in crashes, but it was based on only 1 year of data after the 2004 restrictions were put in place. This project’s analysis utilized 3 years of data following the implementation of the 2004 restrictions, and found a more modest 5 percent reduction in crashes during that period. This reduction was not statistically significant, however. The comparison between no restrictions being posted and

28
either the 2004 or 2007 restriction being posted, and the comparison between the 2004 and 2007 restrictions both showed small reductions in crashes, but they were not statistically significant.
There are several possible explanations to explain the difference in safety findings between the earlier phase of this study and this phase. First, it may be possible that compliance with the restrictions was initially high and eroded over time. Comparison of data at four sites where data were collected during both phases of this research casts doubt on this explanation, however. Immediately after the 2004 restrictions were put in place, an average of 6.4 percent of all trucks were traveling below 50 mph in the left lane across all four sites. This number increased to 7.3 percent three years later. This 0.9 percent increase in non-compliance is not a likely explanation for the change in the crash findings. Instead, it is probably more plausible that the reduced estimate of the safety effect of the restrictions is a result of increasing the sample size available in this phase of the study..
Analysis of Impact of Enforcement on Restriction Compliance Table 16 compares the data collected before and after the enforcement effort on Afton Mountain. Data were collected between 9:30 AM and 1:30 PM on both days. T-tests were used to evaluate speeds and levels of compliance. The analysis found that there was no statistically significant difference in the average speed across all lanes between the before and after data collection. There was, however, an increase in the average speed in the left lane of 1.4 mph following the enforcement. This was statistically significant at α = 0.05. The number of trucks violating the restriction was also found to have declined by an average of 8.5 trucks per hour (a 3.8 percent reduction in violators). This was statistically significant at α=0.10. The “before” and “after” period had the same number of slow moving trucks impeding traffic in the left lane. In the “after” period, these trucks were actually impeding more vehicles than in the “before” period. Thus, it appears that the enforcement effort may have created some modest improvements in left lane speeds by reducing the rate of violations, but significant changes in driver behavior were not achieved.
Table 16. Results of Enforcement Analysis Measure of Effectiveness Before After
Hours of Data 4.08 4.08 Left 2087 veh,
511.7 vph 1783 veh, 436.9 vph
Right 1533 veh. 375.8 vph
1418 veh, 347.5 vph
Number of Vehicles [Total, average per hour]
Total 3620 veh, 887.5 vph
3201 veh, 784.4 vph
Left 236 veh, 57.9 vph
216 veh, 52.9 vph
Right 515 veh, 126.3 vph
504 veh, 123.5 vph
Number of Trucks [Total, average per hour]
Total 751 veh, 184.1 vph
720 veh, 176.4 vph
All Lanes 59.85 mph 59.30 mph Mean Speed Left Lane Only 60.88 mph 62.32 mph
Trucks in Left Lane < 65 mph Number 168 134

29
% of Trucks 22.4% 18.6% Number 51 veh 51 veh % of Trucks 6.8% 7.1% Mean Speed of Impeding Trucks
55.61 mph 52.98 mph
Number of Vehicles Impeded
116 veh 134 veh
Trucks in Left Lane < 65 and Impeding at Least 1 Vehicle (Follower(s) with headways ≤ 2.0 sec)
% of Left Lane Traffic in Impeded Platoon
8.0% 10.4%
It should be noted that several factors other than enforcement may have influenced these results. Even though the same number of hours of data were collected in both periods, the total traffic volume in the “after” period was 11.6 percent lower than in the before period. The lower traffic volume may result in higher average speeds, totally independent of the impact of enforcement. The truck volumes were only 4 percent lower in the “after” period, however.
CONCLUSIONS • When the crashes on interstates with three or more lanes and volumes above 10,000 vpdpl
were screened to remove crashes not potentially influenced by the restrictions, the number of truck-involved crashes was 23 percent higher than expected. This reinforced the findings of the previous study that truck lane restrictions do not improve safety on higher volume roadways.1 The increase in crashes on the three or more lane sites upon implementation of the restrictions may be partially attributable to increased difficulty in merging and diverging at interchanges due to increased truck volumes even in uncongested conditions. Crash impacts during congestion may increase this number even higher.
• The results of the operational analysis of two-lane sites indicate that the truck lane
restrictions appear to be having no significant effect on driver behavior or mobility on the study segments. An average of over 28 percent of all trucks at the two-lane sites were driving below 65 mph in the left lane after the restrictions were posted. The level of non-compliance ranged from 13.6 percent to 56.8 percent of all trucks. The changes in traffic flow characteristics between the before and after periods made it difficult to directly assess the impact of the restrictions on operations using hypothesis testing. The regression models accounted for the influence of a variety of factors on different MOEs, but they showed that the presence of truck restrictions was never a strong predictor variable. As a result, it does not appear that the posting of truck lane restrictions has produced noticeable improvements in operations.
• The safety analysis of two-lane sites did not indicate that the restrictions implemented in
2004 or 2007 resulted in any significant improvement in safety. Slight reductions were noted for some comparisons, but none of the improvements were statistically significant. This differs from the findings of the earlier VTRC study which only used one year of after data to study the 2004 restrictions.

30
• Given the limited observed benefits of the two-lane restrictions, measures to increase compliance should be investigated. Increased enforcement of the two-lane restrictions may result in modest operational and compliance improvements. Improvements in signing may also be beneficial.
RECOMMENDATIONS 1. The Traffic Engineering Division should pursue a legislative modification to remove truck
lane restrictions on interstates with 3 or more lanes in each direction and an AADT higher than 10,000 vpdpl. This will primarily impact I-95 and interstates in Northern Virginia. Restrictions should be retained on lower volume roads, as the first phase of this research has shown that they improve safety on those facilities.1 This modification would not apply to truck climbing lanes where there are 3 lanes in one direction and two lanes in the other direction.
2. The Traffic Engineering Division should re-examine the signing shown in Traffic
Engineering Memorandum MM-330 to determine if it could be modified to improve compliance. TED may wish to assess whether signing should be provided on both sides of the road to increase sign visibility and whether additional signing may also be beneficial on long grades where reinforcement of the restriction may be needed. TED should consider whether the language on the sign should be simplified to improve readability and whether yellow advisory plaques could be used to help increase the conspicuity of the sign.
3. The Traffic Engineering Division should partner with the Virginia State Police and the
Virginia Trucking Association to increase compliance on the two-lane directional segments of interstate. This study showed that a short-term targeted enforcement effort could generate modest improvements in compliance. TED should continue to encourage State Police to enforce these restrictions. TED should also pursue discussions with the Virginia Trucking Association so that they can reinforce compliance with the restrictions within their membership.
4. The Traffic Engineering Division should direct a study to re-evaluate the effectiveness of the
two-lane restrictions once at least 3 years of “after” crash data are available. This study would assess whether the two-lane restrictions are effective after recommendations 2 and 3 are implemented. This would provide a formal assessment of whether increased compliance could produce benefits on two-lane facilities.
COSTS AND BENEFITS ASSESSMENT
The research revealed that some safety benefits could accrue by removing the truck lane restrictions from higher volume roadways. The VDOT Highway Safety Improvement Program

31
(HSIP) costs for crashes were used to estimate a monetary benefit from crash reductions.8 Those costs are:
• Fatality: $3,760,000 • Injury: $22,900 to $188,000, depending on severity of injury • Property Damage Only (PDO): $6,500
Application of the index of effectiveness values in Table 6 indicates that removal of the restrictions on the high volumes roadways studied would have resulted in a reduction of 0.1 fatalities, 8.3 injuries, and 110.9 PDOs during the 53 site-years analyzed. If the lowest injury cost value used by HSIP is used, a total benefit of $1,286,920 in crash reductions would be obtained if the restrictions were removed. This translates into an average savings of approximately $116,993 per site. Since restrictions were in place an average of 4.82 years, this would be an average annual crash reduction benefit of approximately $266,996 across all sites, or $24,272 per site per year. Additional cost savings would also accrue through the reduction in signage on the road. The restrictions on two-lane segments were found to have neutral effect on safety and operations. Given that there are no positive effects, the only costs incurred are for the installation and maintenance of the roadside signing. If additional signing and/or enforcement are implemented, additional costs will be borne by VDOT and the State Police. Potential benefits may be realized if such increases in signage and/or enforcement translate into positive safety and mobility trends.
REFERENCES 1. Fontaine, M.D. and Torrance, K. Evaluation of Truck Lane Restrictions in Virginia. Report
07-CR11. Virginia Transportation Research Council, Charlottesville, VA, 2007. 2. Hauer, E. Observational Before-After Studies in Road Safety. Pergamon, New York, 2002. 3. Middleton, D., K. Fitzpatrick, D. Jasek, and Woods, D. Truck Accident Countermeasures on
Urban Freeways. Report FHWA-RD-92-059. Texas Transportation Institute, College Station, 1994.
4. Lord, D., D. Middleton, and Whitacre, J. Does Separating Trucks from Other Traffic
Improve Overall Safety? In Transportation Research Record: Journal of the Transportation Research Board, No. 1922, Transportation Research Board of the National Academies, Washington, D.C., 2005, pp. 156-166.
5. Zavoina, M.C., T. Urbanik, and Winshaw, W. Operational Evaluation of Truck Restrictions
on I-20 in Texas. In Transportation Research Record 1320, TRB, National Research Council, Washington, D.C., 1991, pp. 24-31.

32
6. Mannering, F.L., Koehne, J.L., and Araucto, J. Truck Restriction Evaluation: The Puget Sound Experience. WA-RD 307.1. Washington State Transportation Center, Seattle, WA, 1993.
7. Hanscom, F.R. Operational Effectiveness of Truck Lane Restrictions. In Transportation
Research Record 1281, TRB, National Research Council, Washington, D.C., 1990, pp. 119-126.
8. VDOT Traffic Engineering Division. Highway Safety Improvement Program, Fiscal Year
2008-2009. Virginia Department of Transportation, Richmond, VA, 2007.

33
APPENDIX A
TRUCK RESTRICTIONS IN THE CODE OF VIRGINIA

34
§ 46.2-803.1. Commercial motor vehicles limited to use of certain lanes of certain interstate highways. Except where the posted speed limit is less than 65 miles per hour, no person shall drive any commercial motor vehicle, as defined in § 46.2-341.4, on the left-most lane of any interstate highway having more than two lanes in each direction. Furthermore, within the Eighth Planning District and on Interstate Route 81, no person shall drive any commercial motor vehicle, as defined in § 46.2-341.4, on the left-most lane of any interstate highway having more than two lanes in each direction, regardless of the posted speed limit. Every commercial motor vehicle shall keep to the right-most lane when operating at a speed of 15 miles per hour or more below the posted speed limit on an interstate highway with no more than two lanes in each direction. The provisions of this section shall not apply to (i) buses or school buses or (ii) other commercial vehicles when (a) preparing to exit a highway via a left exit or (b) being used to perform maintenance or construction work on an interstate highway. § 46.2-804. Special regulations applicable on highways laned for traffic. Whenever any roadway has been divided into clearly marked lanes for traffic, drivers of vehicles shall obey the following: 1. Any vehicle proceeding at less than the normal speed of traffic at the time and place and under the conditions existing, shall be driven in the lane nearest the right edge or right curb of the highway when such lane is available for travel except when overtaking and passing another vehicle or in preparation for a left turn or where right lanes are reserved for slow-moving traffic as permitted in this section; 2. A vehicle shall be driven as nearly as is practicable entirely within a single lane and shall not be moved from that lane until the driver has ascertained that such movement can be made safely; 3. Except as otherwise provided in subdivision 5 of this section, on a highway which is divided into three lanes, no vehicle shall be driven in the center lane except when overtaking and passing another vehicle or in preparation for a left turn or unless such center lane is at the time allocated exclusively to traffic moving in the direction the vehicle is proceeding and is signed or marked to give notice of such allocation. Traffic-control devices may be erected directing specified traffic to use a designated lane or designating those lanes to be used by traffic moving in a particular direction regardless of the center of the roadway and drivers of vehicles shall obey the directions of every such device; 4. The Commonwealth Transportation Board, or local authorities in their respective jurisdictions, may designate right lanes for slow-moving vehicles and the Virginia Department of Transportation shall post signs requiring trucks and combination vehicles to keep to the right on Interstate Highway System components with no more than two travel lanes in each direction

35
where terrain is likely to slow the speed of such vehicles climbing hills and inclines to a speed that is less than the posted speed limit; 5. Wherever a highway is marked with double traffic lines consisting of a solid line immediately adjacent to a broken line, no vehicle shall be driven to the left of such line if the solid line is on the right of the broken line, but it shall be lawful to make a left turn for the purpose of entering or leaving a public, private, or commercial road or entrance. Where the middle lane of a highway is marked on both sides with a solid line immediately adjacent to a broken line, such middle lane shall be considered a left-turn or holding lane and it shall be lawful to drive to the left of such line if the solid line is on the right of the broken line for the purpose of turning left into any road or entrance, provided that the vehicle may not travel in such lane further than 150 feet; 6. Wherever a highway is marked with double traffic lines consisting of two immediately adjacent solid lines, no vehicle shall be driven to the left of such lines, except when turning left.

36
APPENDIX B
SITE INFORMATION FOR TWO LANE SITES WITH TRUCK RESTRICTIONS

37

38
Table B-1: Site Characteristics of Two-Lane Sites With Truck Restrictions AADT Site Direction Start
MP End MP
Length (mi)
% Grade
2004 Sign Install Date 9/01-
8/02 9/02-8/03
9/03-8/04
9/04-8/05
9/05-8/06
9/06-8/07
9/07-8/08
I-64 EB 10 10.69 0.69 6.0 No Sign 4945 4943 5089 5255 5265 5247 5013 I-64 EB 37.55 41.05 3.5 4.9 12/04 4860 4860 4457 4145 4056 4119 3926 I-64 EB 43.0 43.59 0.59 4.7 No Sign 4274 4344 4473 4407 4312 4298 4059 I-64 EB 96.0 99.83 3.83 2.9 8/04 12746 13097 14534 15223 15733 16360 16195 I-64 WB 2.65 6.4 3.75 4.1 1/05 5083 5167 5319 5045 4896 4919 4777 I-64 WB 9.18 10.0 0.82 3.8 No Sign 4317 4626 4761 5201 5414 5441 4832 I-64 WB 41.83 43.0 1.17 5.0 No Sign 3868 3930 4324 4350 4287 4112 3849 I-64 WB 46.08 48.04 1.96 4.0 1/05 4358 4428 4558 4448 4383 4404 4223 I-77 NB 44.1 46.44 2.34 4.2 8/04 13675 13759 13841 13755 13715 13586 12987 I-77 SB 19.95 23.0 3.05 3.2 12/04 17733 18275 18893 19119 19535 19320 18404 I-77 SB 55.17 58.6 3.43 3.2 8/04 13498 13378 13538 13348 12756 12440 12566 I-81 NB 39.09 40.41 1.32 3.1 8/04 15127 15014 16778 17629 17641 15956 14589 I-81 NB 105.6 107.34 1.74 2.2 10/04 16306 17089 20934 22400 22496 20681 18983 I-81 NB 129.5 130.46 0.96 3.8 10/04 23706 24392 25281 25279 24487 24215 23216 I-81 NB 200.76 201.93 1.17 3.6 12/04 18010 18010 19408 19781 19937 21066 20744 I-81 NB 236.4 237.01 0.61 4.0 8/04 17859 21004 23313 24029 24803 25128 24245 I-81 NB 283.72 285.22 1.5 1.4 No Sign 19896 20315 21291 20011 19169 19173 20467 I-81 NB 299.2 299.98 0.78 4.0 1/05 22732 23556 24688 21198 19217 19221 22874 I-81 SB 93.93 95.5 1.57 2.9 10/04 18418 18658 19405 20915 21740 21829 18892 I-81 SB 121.78 124.0 2.22 3.7 10/04 22269 23389 23726 23562 23738 23913 22949 I-81 SB 166.64 167.5 0.86 3.7 10/04 16511 16939 17650 17624 17653 17718 16850 I-81 SB 182.52 183.45 0.93 4.0 12/04 17502 17957 17431 16799 16826 18305 17789 I-81 SB 189.19 190.04 0.85 2.9 9/04 17406 17858 17742 17305 17333 18478 17921 I-81 SB 235.18 236.17 0.99 2.9 10/04 21383 21992 23898 24687 25065 25158 23474 I-81 SB 284.95 286.03 1.08 2.4 No Sign 19219 19311 20238 18979 18457 18618 21475 AADT = Annual average daily traffic, MP = milepost An entry of “No Sign” under the “2004 Sign Install Date” column indicates that no sign indicating that trucks traveling at or below 50 mph were prohibited from
traveling in the left lane was ever installed. AADTs were calculated by determining a weighted average AADT across the two years in each column.

39
Table B-2: Crashes at Two-Lane Sites with Truck Restrictions. Total Crashes Site Direction Start
MP End MP
2004 Sign Install Date 9/01-8/02 9/02-8/03 9/03-8/04 9/04-8/05 9/05-8/06 9/06-8/07 9/07-8/08
I-64 EB 10 10.69 No Sign 3 1 1 1 0 2 4 I-64 EB 37.55 41.05 12/04 2 1 1 4 4 1 0 I-64 EB 43.0 43.59 No Sign 0 1 0 2 1 0 2 I-64 EB 96.0 99.83 8/04 10 20 18 13 19 21 21 I-64 WB 2.65 6.4 1/05 1 1 3 1 1 4 1 I-64 WB 9.18 10.0 No Sign 1 0 3 1 1 2 0 I-64 WB 41.83 43.0 No Sign 0 5 2 2 2 2 4 I-64 WB 46.08 48.04 1/05 0 3 2 1 1 3 0 I-77 NB 44.1 46.44 8/04 1 3 1 1 1 5 7 I-77 SB 19.95 23.0 12/04 7 2 12 10 11 13 8 I-77 SB 55.17 58.6 8/04 6 5 3 1 8 4 3 I-81 NB 39.09 40.41 8/04 2 6 2 4 3 5 3 I-81 NB 105.6 107.34 10/04 2 3 4 7 2 8 7 I-81 NB 129.5 130.46 10/04 1 6 3 3 3 1 2 I-81 NB 200.76 201.93 12/04 3 4 13 7 2 0 4 I-81 NB 236.4 237.01 8/04 1 3 3 3 3 2 1 I-81 NB 283.72 285.22 No Sign 4 10 8 9 5 7 6 I-81 NB 299.2 299.98 1/05 4 0 3 1 2 4 2 I-81 SB 93.93 95.5 10/04 11 13 10 5 6 6 0 I-81 SB 121.78 124.0 10/04 8 4 10 3 2 7 10 I-81 SB 166.64 167.5 10/04 1 4 0 1 3 1 0 I-81 SB 182.52 183.45 12/04 2 1 0 0 0 0 0 I-81 SB 189.19 190.04 9/04 2 6 4 2 4 4 7 I-81 SB 235.18 236.17 10/04 4 3 5 4 2 5 3 I-81 SB 284.95 286.03 No Sign 1 0 0 2 2 1 1 Totals 77 105 111 88 88 108 96 MP = Milepost An entry of “No Sign” under the “2004 Sign Install Date” column indicates that no sign indicating that trucks traveling at or below 50 mph were prohibited from traveling in the left lane was ever installed.