Virginia Tech...Extended Abstract The Effects of Business Process Management Cognitive Resources and...
436
The Effects of Business Process Management Cognitive Resources and Individual Cognitive Differences on Outcomes of User Comprehension by Bret R. Swan Dissertation submitted to the Faculty of the Virginia Polytechnic Institute and State University In partial fulfillment of the requirements for the degree of Doctor of Philosophy in Industrial and Systems Engineering Dr. Eileen M. Van Aken (Chair) Dr. Steven E. Markham (Co-Chair) Dr. C. Patrick Koelling Dr. Tonya Smith-Jackson Dr. David P. Tegarden March 26, 2007 Blacksburg, Virginia Keywords: Business Process Management (BPM), BPM Systems, Business Process Modeling, Enterprise Modeling, Graphical Process Models, Tacit Knowledge, Explicit Knowledge, Metagraphs, UML, User Comprehension, Ontological Completeness © Copyright 2007 Bret R. Swan
Transcript of Virginia Tech...Extended Abstract The Effects of Business Process Management Cognitive Resources and...

The Effects of Business Process Management Cognitive Resources and Individual Cognitive Differences
on Outcomes of User Comprehension
by
Bret R. Swan
Dissertation submitted to the Faculty of the Virginia Polytechnic Institute and State University
In partial fulfillment of the requirements for the degree of
Doctor of Philosophy in
Industrial and Systems Engineering
Dr. Eileen M. Van Aken (Chair) Dr. Steven E. Markham (Co-Chair)
Dr. C. Patrick Koelling Dr. Tonya Smith-Jackson
Dr. David P. Tegarden
March 26, 2007 Blacksburg, Virginia
Keywords: Business Process Management (BPM), BPM Systems, Business Process Modeling, Enterprise
Modeling, Graphical Process Models, Tacit Knowledge, Explicit Knowledge, Metagraphs, UML,
User Comprehension, Ontological Completeness
© Copyright 2007 Bret R. Swan

E x t e n d e d A b s t r a c t
The Effects of Business Process Management Cognitive Resources and User Cognitive Differences on
Outcomes of User Comprehension
by
Bret R. Swan
EXTENDED ABSTRACT
There is a growing need to study factors that affect user comprehension of Business Process Management (BPM) information portrayed by graphical process models (GPMs). For example, deployment of BPM Systems, unique types of enterprise-level information systems, has dramatically increased in recent years. This increase is primarily because BPM Systems give a variety of managers across an enterprise the ability to directly design, configure, enact, monitor, diagnose, and control business processes that other types of enterprise systems do not. This is possible because BPM Systems uniquely rely on GPMs derived from formal graph theory. Besides controlling the business processes, these GPMs, such as metagraphs and Unified Modeling Language (UML) diagrams, portray business process information (BPI) and prompt BPM managers to apply their training and expertise to deal with BPM situations. As a result, GPMs are the primary information artifacts for decision-making and communication among different, often geographically dispersed stakeholders.
Therefore, user comprehension of these unique GPMs is critical to the efficient and effective development, deployment, and utilization of BPM Systems. User comprehension outcomes are jointly affected by the (1) BPM cognitive resources available to each manager (including the type of GPM, BPI, and user educational training and experience), and (2) cognitive differences between individual BPM managers (such as their mental workload, cognitive styles and cognitive abilities). Although research has studied GPMs in various contexts, there is apparently no empirical research investigating GPM user comprehension in the context of BPM Systems. This research makes an important contribution by addressing this gap in the literature.
Statement of the Objective
The purpose of this research is to empirically study how BPM cognitive resources and cognitive differences between individuals affect outcomes of GPM user comprehension. This research centered on the following objectives:
A. Investigate whether more positive user comprehension outcomes are produced by novice users if a single GPM technique is used to portray different types of BPI (e.g., as with metagraphs) or if different GPM techniques are used to portray different types of BPI (e.g., as with UML diagrams).

B. Investigate whether one type of BPI is more easily comprehended and interpreted by novice users irrespective of the type of GPM or the type of educational training of the user.
C. Investigate whether users with a specific type of user educational training can more easily comprehend and interpret BPM information irrespective of the type of GPM or the type of BPI.
D. Evaluate influences of individual cognitive differences (i.e., mental workload, cognitive styles, and cognitive abilities) on outcomes of user comprehension.
In order to accomplish these objectives, this study: (a) defined a theoretical framework conceptualizing user comprehension outcomes in terms of the interaction between cognitive resources external to the user and individual differences affecting how users cognitively process BPI, (b) empirically tested an operational research model of GPM user comprehension that is based on the theoretical framework, and (c) interpreted the experimental results in the context of related literatures.
Description of Research Methods
This study empirically tested relationships between several variables representing BPM cognitive resources and individual cognitive differences hypothesized as influencing the outcomes of user comprehension. A laboratory experiment, involving 87 upper-level undergraduate students from two universities, analyzed relationships between participant comprehension of two types of GPMs (i.e., metagraphs and UML diagrams) used to portray three types of BPI (i.e., task-centric, resource-centric, and information-centric BPI) by novice GPM users possessing different educational training (i.e., industrial engineering, business management, and computer science training). Dependent variables included assessments of task accuracy, task timeliness, subjective mental workload, and self-efficacy. Covariate effects were also analyzed for two types of participant cognitive abilities (i.e., general cognitive ability (GCA) and attentional abilities) and two types of participant cognitive styles (extroversion-introversion and sensing-intuitive). Multivariate analysis techniques were used to analyze and interpret the data.
Discussion of Results
The type of GPM and participants’ GCA produced significant effects on the dependent variables in this study. For example, metagraph users produced significantly more desirable results than UML users across all dependent variables, contrary to what was hypothesized. However, if only the BPM cognitive resources (i.e., GPM Type, BPM Type, and the Type of Participant Education) were studied in relation to user comprehension outcomes, spurious conclusions would have been reached. When individual cognitive differences were included in the research model and analyses, results showed participants with higher GCA produced significantly more positive user comprehension outcomes compared to participants with lower GCAs. Also, many of the impacts of differences in the types of BPI and the types of UET were moderated by the differences in participants’ GCA and attentional abilities. In addition, the relationship between subjective mental workload and task performance (i.e., accuracy and timeliness) suggest a possible GPM cognitive ‘profile’ for user comprehension tasks in a BPM Systems context. These results have important implications for future research and practice in several bodies of knowledge, including GPM user comprehension in management systems engineering, BPM modeling, BPM Systems, HCI, and cognitive ergonomics literature.
Page iii of xiv
ACKNOWLEDGEMENTS
Meaning no disrespect to the many people that have given me so much help in completing this dissertation, but the most important person that has made this dissertation possible is my wife Niki. She is the brightest light in my life and has sacrificed so much to make this possible. I can never repay her for her hard work, encouragement, and sacrifices.
Next, I want to acknowledge the sacrifices of my children, Trent, Tauna, and Kinley, who have given up so much of their time they wanted to spent with me. They have boosted my faith and encouraged me on numerous occasions when I wanted to quit, but the simple faith of my children has sustained me and Niki at times I didn’t expect. I am also grateful to them for the times they tried to pick up the slack around the house to make life easier on their mom and I during times that I was away.
I want to specifically give a special and heart-felt thank you to Dr. Eileen M. Van Aken, the chair of my dissertation committee, for the years of friendship and support, especially because she has mentored, guided, and encouraged me in pursuing my research interests. She is an excellent example of dedication, hard work, perseverance, support, and, most importantly, my life-long friend.
In terms of life-long friends and mentors, there are none more important to me than my Dissertation Committee Co-Chair, Dr. Steven E. Markham. For a decade, he has encouraged me, taught me, and given me great consulting and research experiences that have determined the direction of my career. I cannot express how grateful I am to Dr Markham.
I also wish to express my gratitude for the support, encouragement, and friendship of my committee members: Dr Tonya Smith-Jackson, Dr. David Tegarden, and Dr. C. Patrick Koelling. I have learned so much from each of you, both professionally and personally, and look forward to our ongoing associations.
I also don’t know how to express my love and gratitude to my sister, Shanae Dee Branham, for her years of believing in me, encouraging me, mentoring me in my writing, and editing this dissertation for me. She has helped open my eyes to my potential. She is a great example and is truly inspiring to me.
I would be amiss if I did not also acknowledge the support, love, and counsel of my father, Gary Swan, who has always been there for me to help me keep going when I was at the end of my energies and did not know how to proceed.
I also want to acknowledge and thank Dee and Marylou Whittier, James and Linda Evans, and Scott and Joyce Hendricks for taking me into their families and supporting me through my ups and downs during my years at Virginia Tech.
Additionally, I am grateful for Don Colton, Department Chair of Information Systems, and Bret Ellis, Dean of the School of Computing, at Brigham Young University in Hawaii for their continuous encouragement and support as I completed this dissertation.
Last, but not least, Clint and Lesley Arnoldus, my in-laws, have made great sacrifices, encouraged me, and supported my family in such tremendous ways that have made it possible for me to finally complete this dissertation.
I cannot express the gratitude I feel or repay the friendship and support for me and my family that all of you have given, both named and unnamed. Thank you.

Page iv of xiv
TABLE OF CONTENTS
EXTENDED ABSTRACT............................................................................................................................... i
ACKNOWLEDGEMENTS........................................................................................................................... iii
LIST OF FIGURES........................................................................................................................................ ix
LIST OF TABLES......................................................................................................................................... xii
CHAPTER 1 - INTRODUCTION AND SCOPE OF THIS RESEARCH............................................... 1
1.1 Problem Statement.................................................................................................................................. 1 1.1.1 Trends Have Changed the Focus of Enterprises to Business Processes ........................................... 1 1.1.2 Prevalence of BPM Systems .............................................................................................................. 2 1.1.3 BPM Systems Facilitate Knowledge-Intensive BPM........................................................................ 4
1.2 GPM User Comprehension in the Context of BPM Systems ............................................................ 5 1.2.1 BPM Cognitive Resources Affecting User Comprehension ............................................................. 6 1.2.2 Individual Cognitive Differences Affecting User Comprehension................................................... 7 1.2.3 The Need for GPM User Comprehension Research in the Context of BPM Systems..................... 8
1.3 Research Purpose and Objectives......................................................................................................... 9
1.4 Research Questions................................................................................................................................. 9
1.5 Operational Research Model............................................................................................................... 10
1.6 Research Hypotheses ............................................................................................................................ 11
1.7 Overview of the Research Methodology ............................................................................................ 12
1.8 Contributions of this Research............................................................................................................ 13
Page v of xiv
CHAPTER 2 – REVIEW OF LITERATURE........................................................................................... 17
2.1 BPM Systems Research Overview...................................................................................................... 18 2.1.1 Knowledge-Intensive BPM and BPM Systems............................................................................... 18 2.1.2 Unique Features of BPM Systems Supporting Knowledge-Intensive BPM .................................. 22 2.1.3 Empirical GPM User Comprehension Is Needed............................................................................ 24 2.1.4 Summarizing GPM User Comprehension Research in BPM Systems Contexts ........................... 27
2.2 User Comprehension in Related Literature ...................................................................................... 28 2.2.1 Cognition and User Comprehension ................................................................................................ 29 2.2.2 Outcomes of User Comprehension .................................................................................................. 30 2.2.3 Information Processing Theory and User Comprehension ............................................................. 31 2.2.4 Information Processing Theory in Related Research ...................................................................... 36
2.3 BPM Cognitive Resources and User Comprehension...................................................................... 38 2.3.1 Type of Graphical Process Model and GPM User Comprehension ............................................... 38 2.3.2 Explicit BPM Knowledge Operationalized as the Type of Business Process Information............ 53 2.3.3 Tacit BPM Knowledge Operationalized as Different Types of User Educational Training.......... 55
2.4 Individual Cognitive Differences and User Comprehension........................................................... 61 2.4.1 Mental Workload, Task Performance, and the Yerkes-Dodson Law ............................................. 61 2.4.2 Subjective Mental Workload and Self-Efficacy .............................................................................. 67 2.4.3 Cognitive Styles and User Comprehension ..................................................................................... 70 2.4.4 Cognitive Abilities and User Comprehension ................................................................................. 74
2.5 Theoretical Frameworks to Integrate Hypotheses Related to GPM User Comprehension ........ 78 2.5.1 The Need for a Theoretical Framework for GPM User Comprehension Research........................ 78 2.5.2 Theoretical Perspectives to Guide Development of the Theoretical Framework........................... 80
2.6 Summarizing the Literature - the Research Model.......................................................................... 87

Page vi of xiv
CHAPTER 3 - RESEARCH METHODOLOGY...................................................................................... 89
3.1 Description of the GPM User Comprehension Tasks ...................................................................... 90
3.2 Participants............................................................................................................................................ 90
3.3 Variables and Instrumentation ........................................................................................................... 90 3.3.1 Independent Variables ...................................................................................................................... 91 3.3.2 Dependent Variables......................................................................................................................... 93 3.3.3 Moderating Variables ....................................................................................................................... 97 3.3.4 Blocking Variables ......................................................................................................................... 102
3.4 Materials, Equipment, and Facilities................................................................................................ 103 3.4.1 Participant Materials....................................................................................................................... 103 3.4.2 Equipment ....................................................................................................................................... 103 3.4.3 Facilities .......................................................................................................................................... 104 3.4.4 Incentives for Participation............................................................................................................. 104
3.5 Experimental Procedure .................................................................................................................... 104
3.6 Experimental Design .......................................................................................................................... 109 3.6.1 A Priori Determination of Statistical Power and Sample Size ...................................................... 109 3.6.2 Estimated Degrees of Freedom and Resulting Sample Sizes........................................................ 111
3.7 Data Analyses to Test Hypotheses .................................................................................................... 111 3.7.1 Hypothesis 1 Analyses – Impacts of the Type of Graphical Process Model ................................ 112 3.7.2 Hypothesis 2 Analyses – Impacts of the Type of Business Process Information......................... 112 3.7.3 Hypothesis 3 Analyses – Impacts of the Type of User Educational Training .............................. 112 3.7.4 Hypothesis 4 Analyses – Subjective Mental Workload Correlations with Task Performance .... 113 3.7.5 Hypothesis 5 Analyses – Subjective Mental Workload Correlation with Self-Efficacy.............. 113 3.7.6 Hypothesis 6 Analyses – Cognitive Style and Subjective Mental Workload............................... 113 3.7.7 Hypothesis 7 Analyses – General Cognitive Abilities and Subjective Mental Workload ........... 114 3.7.8 Hypothesis 8 Analyses – Attentional Abilities and Subjective Mental Workload ....................... 114
3.8 Premises ............................................................................................................................................... 114 3.8.1 A Lab Experiment is More Appropriate than Field Research to Test these Hypotheses ............. 114 3.8.2 University Students are Suitable Participants for this Study......................................................... 115 3.8.3 Boundaries of the Cognitive System Extends Beyond the Individual .......................................... 115
3.9 Threats to Validity .............................................................................................................................. 115 3.9.1 Threats to Internal Validity ............................................................................................................ 116 3.9.2 Threats to External Validity ........................................................................................................... 119 3.9.3 Threats to Statistical Validity ......................................................................................................... 122

Page vii of xiv
CHAPTER 4 – EXPERIMENTAL RESULTS........................................................................................ 125
4.1 Descriptive Statistics........................................................................................................................... 125 4.1.1 Dataset Characteristics ................................................................................................................... 125 4.1.2 Participant Demographics .............................................................................................................. 126 4.1.3 Summarizing the Dataset................................................................................................................ 127
4.2 Descriptions of Individual Variable Results.................................................................................... 129 4.2.1 Dependent Variable: Accuracy ...................................................................................................... 129 4.2.2 Dependent Variable: Timeliness .................................................................................................... 132 4.2.3 Dependent Variable: Subjective Mental Workload....................................................................... 137 4.2.4 Dependent Variable: Self-Efficacy ................................................................................................ 142 4.2.5 Moderating Variable: Cognitive Styles (MBTI)............................................................................ 146 4.2.6 Moderating Variable: General Cognitive Abilities (WPT scores) ................................................ 149 4.2.7 Moderating Variable: Attentional Abilities (DAPI) ...................................................................... 151
4.3 Preliminary Analyses of the Dataset................................................................................................. 155
4.4 Results Testing Research Hypotheses .............................................................................................. 156 4.4.1 Hypothesis 1 Results – Impacts of the Type of Graphical Process Model ................................... 157 4.4.2 Hypothesis 2 Results – Type of Business Process Information Impacts ...................................... 161 4.4.3 Hypothesis 3 Results – Type of User Educational Training Results ............................................ 166 4.4.4 Hypothesis 4 Results – Subjective Mental Workload Correlations with Performance................ 171 4.4.5 Hypothesis 5 Results – Subjective Mental Workload Correlation with Self-Efficacy................. 173 4.4.6 Hypothesis 6 Results – Cognitive Style and Subjective Mental Workload.................................. 176 4.4.7 Hypothesis 7 Results – General Cognitive Abilities and Subjective Mental Workload .............. 177 4.4.8 Hypothesis 8 Results – Attentional Abilities and Subjective Mental Workload .......................... 180
CHAPTER 5 – DISCUSSION OF RESULTS ......................................................................................... 185
5.1 Effect of BPM Cognitive Resources on User Comprehension....................................................... 187 5.1.1 Type of Graphical Process Model and GPM User Comprehension ............................................. 187 5.1.2 Type of Business Process Information and GPM User Comprehension ...................................... 197 5.1.3 Type of User Educational Training and GPM user Comprehension ............................................ 198 5.1.4 Joint Effects of BPM Cognitive Resources on GPM User Comprehension................................. 200
5.2 Effect of Individual Cognitive Differences on GPM User Comprehension................................. 201 5.2.1 Subjective Mental Workload and the Yerkes-Dodson Law.......................................................... 201 5.2.2 Subjective Mental Workload and Self-Efficacy ............................................................................ 205 5.2.3 Cognitive Styles and Subjective Mental Workload during Task Performance ............................ 208 5.2.4 General Cognitive Abilities and Subjective Mental Workload during Task Performance .......... 211 5.2.5 Attentional Abilities and Mental Workload during Task Performance ........................................ 213 5.2.6 Integrating Individual Cognitive Differences and their Impacts on User Comprehension .......... 214
5.3 The Relationship between Cognitive Resources and Individual Cognitive Differences During GPM User Comprehension................................................................................................................ 214

Page viii of xiv
CHAPTER 6 – CONCLUSIONS AND FUTURE DIRECTIONS ........................................................ 217
6.1 Conclusions and Future Research Directions ................................................................................. 217 6.1.1 The Impacts of the BPM Information Artifact: the Type of Graphical Process Model ............... 217 6.1.2 The Impact of Explicit BPM Knowledge: The Type of Business Process Information............... 218 6.1.3 The Impact of Tacit BPM Knowledge: The Type of User Educational Training ........................ 218 6.1.4 The Impact of Subjective Mental Workload on Task Performance.............................................. 219 6.1.5 The Impact of Subjective Mental Workload on Self-Efficacy...................................................... 220 6.1.6 Cognitive Styles as Moderating Factors: Extroversion-Introversion and Sensing-Intuition........ 220 6.1.7 Cognitive Abilities as Moderating Factors: General Cognitive Ability........................................ 221 6.1.8 Cognitive Abilities as Moderating Factors: Attentional Abilities................................................. 221 6.1.9 Integration of Research Findings ................................................................................................... 222
6.2 Limitations of this Research .............................................................................................................. 223
6.3 Implications for the Literature.......................................................................................................... 224 6.3.1 Practitioner Implications for Management Systems Engineering and BPM ................................ 224 6.3.2 Implications for Management Systems Engineering and BPM .................................................... 225 6.3.3 Implications for GPM User Comprehension Research in the Context of BPM Systems ............ 225 6.3.4 Implications for Future Empirical Cognitive Research in a BPM System Context ..................... 227 6.3.5 Implications for Related Areas of Industrial Engineering............................................................. 229
REFERENCES............................................................................................................................................. 231
APPENDIX................................................................................................................................................... 251
VITA.............................................................................................................................................................. 420

Page ix of xiv
LIST OF FIGURES
Figure 1-1. Operational Research Model for testing GPM user comprehension in the context of BPM and BPM Systems......................................................................................................................................... 11
Figure 1-2. GPM user comprehension takes place at the information portrayal/information perception interface between the BPM cognitive resources and the BPM System user........................................ 14
Figure 2-1. Category of knowledge intensity of a business process based on the dynamics of the processes
and the knowledge resources................................................................................................................. 19 Figure 2-2. Support for the phases of the BPM lifecycle by BPM Systems compared to workflow
management systems. ............................................................................................................................ 23 Figure 2-3. An Information-Processing Theoretical Model of a Cognitive System..................................... 33 Figure 2-4. A UML conceptual model of a task-centric BPI of a loan application process as may be found
in a BPM System. .................................................................................................................................. 43 Figure 2-5. A UML conceptual model of a resource-centric BPI of a loan application process as may be
found in a BPM System......................................................................................................................... 44 Figure 2-6. A UML conceptual model of the information-centric BPI of a loan application process as may
be found in a BPM System.................................................................................................................... 45 Figure 2-7. A metagraph of the task-centric BPI of a loan application process as may be found in a BPM
System. ................................................................................................................................................... 46 Figure 2-8. A metagraph of the resource-centric BPI of a loan application process as may be found in a
BPM System. ......................................................................................................................................... 47 Figure 2-9. A metagraph of the information-centric BPI of a loan application process as may be found in a
BPM System. ......................................................................................................................................... 48 Figure 2-10. Metagraph vs. UML diagrams and how they relate to the principle of Ontological
Completeness. ........................................................................................................................................ 52 Figure 2-11. How mental workload and cognitive load relates to cognitive memory stores. ...................... 64 Figure 2-12. Illustration how differences in task difficulty is conceptualized by the Yerkes-Dodson Law.65 Figure 2-13. Conceptual relationships between BPM cognitive resources and individual differences
affecting GPM user comprehension.44................................................................................................. 78 Figure 2-14. The structure of an AT activity includes the relationship between the subject and object
mediated by the tool to produce an outcome. ....................................................................................... 81 Figure 2-15. AT applied to a GPM user comprehension activity.................................................................. 83 Figure 2-16. Areas and constructs of interest to DC vs. IP theory. .............................................................. 86 Figure 2-17. Operational Research Model that tests GPM user comprehension. ......................................... 88 Figure 3-1. Experimental strategy for each experimental treatment group................................................. 105 Figure 4-1. The mean accuracy for UML diagram users was lower than Metagraph users across all types of
User Educational Training................................................................................................................... 131 Figure 4-2. The mean accuracy for UML diagram users was lower than Metagraph users across all types of
Business Process Information.............................................................................................................. 131

Page x of xiv
Figure 4-3. The type of User Educational Training appears to influence accuracy results as well as the type of Business Process Information. ........................................................................................................ 132
Figure 4-4. The type of Graphical Process Model appears to significantly influence timeliness results along with small interaction due to the type of User Educational Training................................................. 135
Figure 4-5. The type of Graphical Process Model appears to influence timeliness results in relation to the type of Business Process Information. ................................................................................................ 136
Figure 4-6. The type of Business Process Information appears to influence timeliness results with a small interaction due to the type of User Educational Training................................................................... 136
Figure 4-7. Subjective mental workload shows a difference between metagraphs and UML diagrams as well as between types of User Educational Training.......................................................................... 139
Figure 4-8. Subjective mental workload shows a difference between metagraphs and UML diagrams as well as slight between types of Business Process Information. ......................................................... 140
Figure 4-9. Subjective mental workload shows a difference between the types of Business Process Information as well as between types of User Educational Training................................................. 140
Figure 4-10. Self-efficacy scores showing box plots for each type of User Educational Training graphed by the type of GPM................................................................................................................................... 146
Figure 4-11. Box plots of continuous extrovert to introvert scores (+ scores = Extroverted tendencies; - scores = Introverted tendencies). by the type of GPM and type of UET. .......................................... 148
Figure 4-12. Box plots of continuous sensing to intuitive scores (+ scores = Sensing tendencies; - scores = Intuitive tendencies). by the type of GPM and type of UET.............................................................. 148
Figure 4-13. Distribution of WPT scores by the type of Graphical Process Model and type of User Educational Training. .......................................................................................................................... 151
Figure 4-14. Distribution of DAPI construct scores according to the type of Graphical Process Model. . 153 Figure 4-15. Distribution of DAPI construct scores by the type of User Educational Training. ............... 154 Figure 4-16. Box-plot showing users of metagraphs produced higher accuracy results compared to users of
UML diagrams..................................................................................................................................... 157 Figure 4-17. Box-plot showing users of metagraphs spending lower time on task (i.e., higher timeliness)
compared to users of UML diagrams.................................................................................................. 158 Figure 4-18. Box-plot showing metagraph users reported similar but slightly lower TLX subjective mental
workload than users of UML diagrams............................................................................................... 159 Figure 4-19. Box-plot showing metagraph users reported higher average self-efficacy than users of UML
diagrams. .............................................................................................................................................. 159 Figure 4-20. Graph showing the accuracy results of participants according to the different types of Business
Process Information. ............................................................................................................................ 163 Figure 4-21. Graph showing the timeliness results of participants according to the different types of
Business Process Information.............................................................................................................. 164 Figure 4-22. Graph showing the subjective mental workload results of participants according to the
different types of Business Process Information................................................................................. 164 Figure 4-23. Graph showing the experimental task accuracy results of the participants by their different
types of User Educational Training..................................................................................................... 168 Figure 4-24. Graph showing the TLX subjective mental workload results of the participants by their
different types of User Educational Training...................................................................................... 169 Figure 4-25. Graph showing the average self-efficacy results of the participants by their different types of
User Educational Training................................................................................................................... 169 Figure 4-26. Trend line showing a slight inverse relationship between accuracy and subjective mental
workload............................................................................................................................................... 172 Figure 4-27. Trend line showing a slight inverse relationship between accuracy and subjective mental
workload............................................................................................................................................... 172

Page xi of xiv
Figure 5-1. GPM user comprehension research model in the context of BPM Systems............................ 185 Figure 5-2. This study evaluates user comprehension of Metagraph and UML Diagram constructs only (to
the right of the dashed line); not their interpretation back to real-world constructs (across the dashed line)....................................................................................................................................................... 190
Figure 5-3. Example of how metagraph complexity increases as the number of components increases or one component is central to multiple components..................................................................................... 194
Figure 5-4. Example of how UML activity diagram complexity increases as the number of components increases and resources and information elements are added. ........................................................... 195
Figure 5-5. The accuracy of task performance is higher above the average accuracy for participants with higher WPT scores............................................................................................................................... 212
Figure 6-1. Integrating individual conclusions: the hierarchy of factors affecting GPM user comprehension..
.............................................................................................................................................................. 221

Page xii of xiv
LIST OF TABLES
Table 3-1. Independent Variables Descriptions and Levels ........................................................................... 91 Table 3-2. Dependent Variables and Associated Sources of Data ................................................................. 92 Table 3-3. Descriptions of the NASA TLX Dimensions................................................................................ 95 Table 3-4. Description and Instrumentation of Control Variables ................................................................. 97 Table 3-5. Design Matrix for Experiment for Minimum Desired Number of Participants ......................... 108 Table 3-6. Degrees of Freedom for Minimum Desired Number of Participants ......................................... 110 Table 4-1. Demographics of Participants (n = 87). ...................................................................................... 126 Table 4-2. Cell numbers, means, and standard deviations for task accuracy in percent correct (n = 87)... 128 Table 4-3. Relevant MANOVA results describing between-subject main effects and interactions for task
accuracy (see Table 4-26) (n = 87). ..................................................................................................... 129 Table 4-4. Relevant MANOVA results describing within-subject main effects and interactions for task
accuracy (see Table 4-28) (n = 87). ..................................................................................................... 130 Table 4-5. Cell numbers, means, and standard deviations for task timeliness (n = 87). ............................. 133 Table 4-6. Relevant MANOVA results describing between-subject main effects and interactions for task
timeliness (n = 87). ............................................................................................................................... 134 Table 4-7. Relevant MANOVA results describing within-subject main effects and interactions for timeliness
(n = 87).................................................................................................................................................. 135 Table 4-8. Cell sizes, means, and standard deviations for NASA TLX assessments of subjective mental
workload (n = 87). ................................................................................................................................ 137 Table 4-9. Relevant MANOVA results describing between-subject main effects and interactions for
subjective mental workload (n = 87). .................................................................................................. 138 Table 4-10. Relevant MANOVA results describing within-subject main effects and interactions for
subjective mental workload (n = 87). .................................................................................................. 139 Table 4-11. Cell sizes, means, and standard deviations for participants’ ratings of the six constructs making
up for the NASA TLX mental workload scores (n = 87).................................................................... 141 Table 4-12. Descriptive information for participant weightings created by pairwise comparisons between the
six NASA TLX mental workload constructs (n = 87)......................................................................... 141 Table 4-13. Correlation matrix of the six constructs making up NASA TLX in relation to the associated
NASA TLX mental workload scores (n = 261)................................................................................... 142 Table 4-14. Cell sizes, Means, and standard deviations for the nine self-efficacy questions and the average
of these questions (ordinal scale 1 to 10). ............................................................................................ 143 Table 4-15. Correlations of the nine self-efficacy questions and the overall participant averages (n = 87).144 Table 4-16. Two-way, between-subject ANOVA results for average self-efficacy showing the type of GPM
and the type of User Educational Training as significant (n = 87). .................................................... 145 Table 4-17. Counts of the MBTI Cognitive Styles of the participants grouped by the between-subject
independent variables (n = 87)............................................................................................................. 147 Table 4-18. One-way ANOVA of the MBTI Cognitive Styles of the participants in context of the type of
GPM (n = 87)........................................................................................................................................ 149 Table 4-19. One-way ANOVA of the MBTI Cognitive Styles of the participants in context of the type of
User Educational Training (n = 87). .................................................................................................... 149 Table 4-20. Descriptive statistics for the WPT scores by the type of GPM used by participants (n = 87). 150

Page xiii of xiv
Table 4-21. Two-way, between-subjects ANOVA of the WPT scores for the type of GPM and the type of User Educational Training (n = 87). .................................................................................................... 150
Table 4-22. Descriptive statistics of DAPI constructs (n = 87).................................................................... 152 Table 4-23. Correlations of DAPI constructs (n = 87). ................................................................................ 152 Table 4-24. One-way ANOVAs showing no statistical difference exist of DAPI attentional abilities
between-subjects existed between groups that used different types of GPMs (n = 87). .................... 153 Table 4-25. One-way ANOVAs showing only participants with DAPI moderately-focused attentional
abilities differed statistically between groups of different types of User Educational Training (n = 87)................................................................................................................................................................ 155
Table 4-26. Repeated measures, between-subject MANOVA results testing Hypotheses 1 and 3 (n = 87)................................................................................................................................................................ 156
Table 4-27. Summary of Hypothesis 1 Results............................................................................................. 160 Table 4-28. Repeated measures, within-subjects MANOVA results for Hypothesis 2 testing the type of
Business Process Information (n = 87). ............................................................................................... 161 Table 4-29. Partial results of tests of within-subjects simple contrasts (combined first and last) between
conditions of the types of Business Process Information (n = 87)...................................................... 162 Table 4-30. Hypothesis 2 Results .................................................................................................................. 165 Table 4-31. Results of Planned Comparisons using simple contrast methodologies which indicate direction
and significance between the types of User Educational Training (n = 87). ...................................... 167 Table 4-32. Hypothesis 3 Results .................................................................................................................. 170 Table 4-33. Correlations between subjective mental workload and performance variables (n = 261)....... 171 Table 4-34. Hypothesis 4 Results .................................................................................................................. 173 Table 4-35. Correlations between-subjects relating TLX mental workload to average self-efficacy (n = 87).
............................................................................................................................................................... 174 Table 4-36. Hypothesis 5 Results .................................................................................................................. 175 Table 4-37. Correlations between-subjects relating TLX mental workload to MBTI Cognitive Styles (n =
87).......................................................................................................................................................... 175 Table 4-38. Tests of MBTI Cognitive Styles as covariates of between-subjects, MANCOVA (n = 87)... 176 Table 4-39. Tests of MBTI Cognitive Styles as covariates of within-subjects, repeated measures
MANCOVA (n = 87). .......................................................................................................................... 176 Table 4-40. Hypothesis 6 Results .................................................................................................................. 177 Table 4-41. Correlations between-subjects relating TLX mental workload to General Cognitive Abilities
(WPT) (n = 87). .................................................................................................................................... 178 Table 4-42. MANCOVA between-subjects results that include the covariate General Cognitive Abilities
(WPT scores) (n = 87). ......................................................................................................................... 179 Table 4-43. MANCOVA tests of General Cognitive Abilities (WPT scores) as covariates (n = 87). ....... 179 Table 4-44. Hypothesis 7 Results .................................................................................................................. 180 Table 4-45. Correlations between-subjects relating TLX mental workload to DAPI assessments of
attentional abilities (n = 87). ................................................................................................................ 180 Table 4-46. Between-subject MANCOVA results evaluating the covariate DAPI Dual Cognitive-Physical
Tasks (n = 87). ...................................................................................................................................... 182 Table 4-47. Partial within-subject MANCOVA results evaluating the covariate DAPI Dual Cognitive-
Physical Tasks (n = 87). ....................................................................................................................... 183 Table 4-48. Hypothesis 8 Results .................................................................................................................. 184 Table 5-1. Exploratory Factor Analysis showing the loadings of the three factors underlying TLX mental
workload results (n = 261). .................................................................................................................. 205

Page xiv of xiv

Bret R. Swan Chapter 1 - Introduction
Page 1 of 420
C h a p t e r O n e
CHAPTER 1 - INTRODUCTION AND SCOPE OF THIS RESEARCH
This chapter introduces the topic of this research: the study of the extent to which graphical process
models (GPMs) facilitate user comprehension of Business Process Management (BPM) cognitive resources
despite cognitive differences between individuals. First, this chapter summarizes the context and need for
GPM user comprehension research related to BPM and BPM Systems. Next, the research objectives,
questions, and hypotheses are presented. Lastly, this chapter outlines the research model, research
methodology, and contributions of this study to related literatures.
1.1 PROBLEM STATEMENT
Dynamic business environments and an increasing reliance on BPM Systems are driving the
restructuring of enterprises around knowledge-intensive business processes. BPM Systems are unique types
of enterprise-level information system that are based on and driven by GPMs derived from formal graph
theory. These distinctive GPMs give users of BPM Systems the ability to cross-functionally understand,
manage, control, and reconfigure business processes from across an enterprise without having to rely
heavily on information technology (IT) personnel. There is apparently no research investigating whether
BPM managers, with differing educational training and experience, can efficiently and effectively
comprehend the business process information (BPI) portrayed by these types of GPMs. Without accurate
and timely user comprehension of BPI portrayed by these GPMs, BPM decision-makers may not be able to
properly manage and adapt the business processes that create and sustain a competitive advantage in today’s
dynamic organizations and markets. Therefore, empirical research is needed that takes into account key
BPM cognitive resources and individual cognitive differences affecting GPM user comprehension in the
context of BPM and BPM Systems.
1.1.1 Trends Have Changed the Focus of Enterprises to Business Processes
The term business process refers to the sets of value-adding tasks that convert specified inputs to
outputs for an internal or external customer or market (Crowston, 1997; Davenport & Beers, 1995; Hammer

Bret R. Swan Chapter 1 - Introduction
Page 2 of 420
& Champy, 2003; Malone, Crowston, & Herman, 2003; Schael, 1998). BPM refers to the practices and
technologies used to manage business processes (Smith & Fingar, 2003; Wolf & Harmon, 2006).
Recent market forces and organizational trends are shifting the focus of many business enterprises
to reorganize themselves around their business processes, as opposed to hierarchal forms of organization
(Crowston, 1997; Hammer, 1996; Smith & Fingar, 2003; Wensley, 2003; Weske, van der Aalst, & Verbeek,
2004). Examples of such trends include E-business (Lowry, Cherrington, & Watson, 2002), E-commerce
(Turban, King, Lee, Warkentin, & Chung, 2002), fast-response micromarketing (Basu & Blanning, 2000),
reengineering (Hammer & Champy, 2003), outsourcing (Marc, 2005), agile manufacturing (Basu &
Blanning, 2000), knowledge management (KM) (Apostolou & Mentzas, 2003), supply chain management
(SCM) (Serve, Yen, Wang, & Lin, 2002), customer relationship management (CRM) (Chen & Popvich,
2003), enterprise architectures (Vernadat, 2002), workflow management (zur Muehlen, 2004b), and virtual
enterprises (Goranson, 1999). These trends make business processes, as well as the management of these
processes, more dynamic and knowledge-intensive than in the past (Eppler, Seifried, & Ropnack, 1999;
Markus, Majchrzak, & Gasser, 2002; Osborn, 1998; Weske et al., 2004). As a result, business processes
have come to be characterized as more or less knowledge-intensive depending on the stable or dynamic
natures of both the business processes and their associated knowledge resources (1998).
As a result of this recent shift in focus, new types of enterprise-level information systems have been
developed to help organizations manage their knowledge-intensive business processes more efficiently and
effectively. Examples of such enterprise systems include Enterprise Resource Planning (ERP) systems,
Supply Chain Management (SCM) systems, workflow management systems, and BPM Systems (Vernadat,
2002; Weske et al., 2004; zur Muehlen, 2004b). This study centers on the comprehension of BPI portrayed
in BPM Systems. BPM Systems are unique from other enterprise systems in that they allow “BPM process
owners armed with business process management orchestration tools [the ability to] change process and
information flows using graphically based tools with little or no involvement of the traditional IT
department” (Light, 2005, p. 1).
1.1.2 Prevalence of BPM Systems
In recent years, the development and implementation of BPM Systems have become essential to
keep organizations and enterprises competitive in current market environments (Light, 2005; Wensley,

Bret R. Swan Chapter 1 - Introduction
Page 3 of 420
2003; Weske et al., 2004). Miers, Harmon, and Hall (2006) in their 2006 “BPM Suites Report” described
19 difference BPM Systems currently used in industry:
• ACI Worldwide: WorkPoint (formerly Insession) • Appian Corp.: Appian Enterprise • Ascentn Corporation: AgilePoint • B2Binternet: XicoBPM • Chordiant: Chordiant Enterprise Platform • Clear Technology Inc.: Tranzax • CommerceQuest Inc.: TRAXION Enterprise Business Process Management Suite • eg Solutions Ltd.: eg work manager • FileNet Corp.: FileNet Business Process Manager • Global 360 Inc.: Global 360 Enterprise BPM Suite • Graham Technology: GT Product Suite • HandySoft Global Corporation: BizFlow • IBM: IBM WebSphere BPM Suite • M1 Global Solutions Inc.: Business Convergence Suite • Oracle Corporation: BPEL Process Manager • PegaSystems Inc.: Pegasystems SmartBPM Suite • Singularity: Singularity Process Platform • TIBCO Software Inc.: TIBCO Staffware Process Suite • Ultimus Inc.: Ultimus BPM Suite
Practitioner literature describes how the adoption of BPM Systems has increased substantially over
the last several years. The Delphi Group found that early adopter deployments of these advanced BPM
Systems more than doubled between 2001 and 2003 (indicated by 20% of respondents using BPM systems
in 2003 compared to less than 10% in 2001) (Palmer, 2003). A 2004 Forrester Research study found that a
third of U.S. companies were either using or piloting BPM Systems (Crosman, 2004). In 2006, Wolf and
Harmon’s (2006, p. 24) “State of BPM Report” surveyed 348 respondents that represented a broad cross-
section of large, medium, and small companies of industries from around the world, and found:
“Ninety percent (90%) of small companies are spending under $500,000 on BPM. Sixty percent (60%) medium sized companies are spending under $500,000, 23% are spending between $500,000 and $999,999, and 15% are spending between $1 and $5 million. Thirteen respondents described large companies that they said were spending over $10 million on [BPM Systems].”
The Gartner Group, a leading industry research organization, predicted that by the year 2015 (Light, 2005,
p. 1):

Bret R. Swan Chapter 1 - Introduction
Page 4 of 420
“A significant shift will occur to embrace process-focused mind-sets toward managing the business. There will be an explosion of interest in business process management suites and their integration with underlying software infrastructure.”
These statistics reflect a growing industry recognition that competitive advantages can be achieved
through an end-to-end, enterprise-level focus on BPM supported by BPM Systems (Basu & Kumar, 2002;
van der Aalst, 2004; Weske et al., 2004). Trends promoting BPM and BPM Systems will continue as long
as organizations attempt to respond to the increasingly dynamic natures of their business processes and
environments in the new networked economy (Aguilar-Saven, 2004; Osborn, 1998; Sheth, van der Aalst, &
Arpinar, 1999).
1.1.3 BPM Systems Facilitate Knowledge-Intensive BPM
BPM Systems help facilitate the management of knowledge-intensive business processes using
GPMs. BPM Systems are “generic software systems driven by explicit process models [that] enact and
manage operational business processes” (Weske et al., 2004, p. 1). The explicit process models (i.e., GPMs)
that drive BPM Systems are unique because they are derived from graph theory formalisms. Because these
GPMs are based on graph theory, they make BPM systems “process-aware,” meaning they permit
mathematical modeling that facilitates the management and control business processes in ways that other
enterprise systems cannot (Basu & Blanning, 2000; Curtis, Kellner, & Over, 1992). Several formal GPM
techniques have been developed or extended to be used in BPM Systems: for example, Petri nets (van der
Aalst, 2000), and metagraphs (Basu & Blanning, 2000), and Unified Modeling Language (UML) diagrams
(Vernadat, 2002).
According to BPM, knowledge management, and information systems (IS) literature, the
management of knowledge-intensive business processes involve both tacit and explicit knowledge. Explicit
knowledge is knowledge that can be codified and transmitted in a systematic and formal representation or
language (such as GPMs) (Gronau & Weber, 2004; Ramesh & Tiwana, 1999). In contrast, tacit knowledge
is knowledge that is difficult to formalize, record, articulate, or encode because it is developed through
personal experimentation and experience (Gronau & Weber, 2004; Markus et al., 2002; Ramesh & Tiwana,
1999).
Both individuals and information artifacts possess or store tacit and explicit knowledge for future
use (Amaravadi & Lee, 2005; Davenport & Beers, 1995; Eppler et al., 1999; Madhavan & Grover, 1998).

Bret R. Swan Chapter 1 - Introduction
Page 5 of 420
Individuals (e.g., process managers, executives, and IT managers) possess both tacit and explicit knowledge
in their memories. Information artifacts (also referred to as IT artifacts) are “those bundles of material and
cultural properties packaged in some socially recognizable form such as hardware and/or software”
(Orlikowski & Iacono, 2001, p. 121) that store and portray explicit knowledge to users (e.g., email,
databases, documents, information systems, and GPMs) (Basu & Blanning, 2000; Hollan, Hutchins, &
Kirsh, 2000).
Therefore, in this study, the information artifact of interest is the type of GPM used to portray BPI
in BPM Systems. BPM Systems facilitate knowledge-intensive BPM because they (1) provide access to
required BPI, (2) facilitate the communication and transfer of BPM knowledge between managers across an
enterprise, and (3) provide direct control and reconfiguration of BPM Systems1. For example,
transformation of BPM knowledge from individuals and information artifacts into efficient and effective
BPM decisions is accomplished through the user comprehension of two types of BPM knowledge.
Managers comprehend the explicit BPM knowledge, e.g., the type of BPI needed for a specific task,
portrayed by the information artifacts, i.e., the GPMs, using the BPM System. Managers use their tacit
BPM knowledge, e.g., the educational training of the user, as they comprehend the GPMs (Gronau &
Weber, 2004; Markus et al., 2002; Sampler & Short, 1998). The decisions made by BPM managers
are then enacted and implemented, in part, using BPM Systems (Basu & Blanning, 2000; Basu & Kumar,
2002; van der Aalst, Desel, & Oberweis, 2000; Weske et al., 2004; zur Muehlen, 2004b).
1.2 GPM USER COMPREHENSION IN THE CONTEXT OF BPM SYSTEMS
In this study, the term cognition refers to mental processes that involve perception, thinking,
memory, and action (van Duijn, Keijzer, & Franken, 2006). User comprehension is one aspect of cognition
(Just & Carpenter, 1992), and in this study, refers to the ability of an individual to grasp the meaning of
something (Agarwal, De, & Sinha, 1999; Just & Carpenter, 1992; Kintsch, 2005). User comprehension
outcomes are the result of the mental processes (e.g., reasoning, intuition, or perception) of cognitive
resources (i.e., information, knowledge, and experience). User comprehension outcomes are assessed in
several ways, including task performance indicators (e.g., accuracy and timeliness) and the mental workload
individuals experience during task performance (cf. Kintsch, 1988; Nordbotten & Crosby, 1999; Shoval,
1-1 See Section 2.1.2 for more information about BPM Systems.

Bret R. Swan Chapter 1 - Introduction
Page 6 of 420
Danoch, & Balabam, 2004). Self-efficacy refers to peoples’ perceptions their own capabilities to organize
and execute tasks up to the level of performance that is required of them (Bandura, 1986), and is considered
an outcome of user comprehension, as well as an antecedent of task performance (Compeau, Higgins, &
Huff, 1999; Staples, Hulland, & Higgins, 1999).
1.2.1 BPM Cognitive Resources Affecting User Comprehension
The above overview of BPM Systems-related literature identify three types of BPM cognitive
resources: (1) the information artifact represented by the type of GPM, (2) explicit BPM knowledge
represented by the type of BPI, and (2) tacit BPM knowledge represented in this study by the type of
educational training of the user. For BPM to occur, managers cognitively process these three resources to
produce user comprehension outcomes..
This study compares two types of GPMs proposed for use in BPM Systems: Unified Modeling
Language (UML) diagrams (Eriksson & Penker, 2000; Marshall, 2000; Vernadat, 2002) and metagraphs
(Basu & Blanning, 2000)2. These two GPM techniques were chosen for this study for several reasons.
First, they have both been specifically developed or extended for use in BPM Systems. Second, UML
diagrams are becoming the standard GPM technique for development of enterprise systems. Metagraphs
have been developed to specifically counter the weaknesses of UML diagrams for user comprehension.
Lastly, these techniques clearly match the criteria to test the principle of Ontological Completeness (see
Sections 1.1.3, 2.3.1.1, and 2.3.1.4 for further discussions).
Three different types of BPI are of interest in this study: (1) task-centric BPI that documents the
sequential flow of business process activities; (2) resource-centric BPI that depicts relationships between
resources (i.e. physical, personnel, or information resources); and (3) information-centric BPI3. Prior
research shows various views or perspectives are required to model all the real-world constructs needed for
BPM (Basu & Blanning, 2000; Green & Rosemann, 2000; van der Aalst, 2004; Vernadat, 2002). Previous
research agrees that the three BPI perspectives chosen for this study are required in all BPM systems. These
three types of BPI exist in both metagraph and UML diagram formats, and are designed to define critical
BPM information flows, data relationships, and aid in checking completeness and correctness of models of
1-2 For examples of different Types of GPMs see section 2.3.1. 1-3 For examples of different Types of BPI see section 2.3.2.

Bret R. Swan Chapter 1 - Introduction
Page 7 of 420
the business process (Basu & Blanning, 2000; Vernadat, 2002) (see Sections 1.1.3 and 2.3.2 for further
discussions).
Lastly, this study operationalizes the tacit BPM knowledge of managers using participants with
industrial engineering, computer science, and business management types of user educational training. As
discussed above, BPM Systems are expected to support the BPM needs of a variety of managers across the
enterprise, including executive managers, process managers, and IT managers. Participants with business
management education are selected to approximate executive managers’ tacit BPM knowledge. Participants
with industrial engineering education are selected to approximate process managers’ tacit BPM knowledge.
Lastly, participants with computer science education are selected to approximate the education of IT
managers’ tacit BPM knowledge (see Section 1.1.3 and 2.3.3 for further discussions).
1.2.2 Individual Cognitive Differences Affecting User Comprehension
Literature related to user comprehension identify several individual differences that affect user
cognition. Three of the most commonly-studied individual cognitive differences include mental workload,
cognitive styles and cognitive abilities.
When the cognitive resources used as inputs to an individual’s mind approaches or exceeds the
limits of the individual’s cognitive capacity, the mental workload the individual experiences is increased (cf.
Baddeley, 2003; Braarud, 2001; Miyake, 2001; Paas, Tuovinen, Tabbers, & Van Gerven, 2003).
Psychological and subjective assessments of mental workload are found in related literature. This study
uses assessments of subjective mental workload as an indicator of how taxing the process of GPM user
comprehension is on individuals as they mental process BPM cognitive resources.
Cognitive styles are often described as different genetically-based dimensions of human personality
(Gardner & Martinko, 1996; Myers & Myers, 1995) as well as “consistent individual differences in
preferred ways of organizing and processing information and experience” (Sadler-Smith, 2001, p. 610).
Two cognitive styles are identified from related literature as important to in this study: (1) how users prefer
to interact with the world around them (i.e., assessed using subjective reports of extroversion vs.
introversion preferences) and (2) how users prefer to perceive information (i.e., assessed using subjective
reports of sensing vs. intuition preferences) (Gardner & Martinko, 1996; Myers & Myers, 1995).
A cognitive ability refers to an individual’s ability to learn (Schmidt, 2002) or what Woltz (2003)
calls cognitive processes that represent an individual’s aptitudes for learning. Cognitive abilities act as the

Bret R. Swan Chapter 1 - Introduction
Page 8 of 420
set of mental tools an individual uses to control or manage their cognitive processing of information when
performing a task (Goldstein, Yusko, & Nicolopoulos, 2001; Hartmann, Sunde, Kristensen, & Martinussen,
2003; Schmidt, 2002; Woodcock, 2002). An individual’s cognitive abilities are much more effected by
experience and practice than an individual’s cognitive styles. Two evaluations of participants cognitive
abilities are included in this study: (1) a broad measure of a participant’s cognitive abilities evaluating their
ability to learn (i.e., General Cognitive Abilities (GCA)) and (2) an assessment of how well a participant can
focus their attention during GPM user comprehension tasks (i.e., their attentional abilities). General
Cognitive Abilities (GCA) represent a survey of a range of narrow cognitive aptitudes (e.g., numerical
aptitude, spatial aptitude, verbal aptitude, etc.) (Schmidt, 2002; Woodcock, 2002). Attentional abilities
assess an individual’s ability to focus their attention under different task conditions (Crawford, Brown, &
Moon, 1993; Rose, Murphy, Byard, & Nikzad, 2002; Woltz, Gardner, & Gyll, 2001).
1.2.3 The Need for GPM User Comprehension Research in the Context of BPM Systems
GPMs are expected to facilitate user comprehension of different types of BPI irrespective of the
background and expertise of the BPM managers using a BPM System (Basu & Blanning, 2000; Light, 2005;
Weske et al., 2004; zur Muehlen, 2004a). Without accurate and timely comprehension of the BPI portrayed
by GPMs, BPM managers may not be able to properly manage and adapt their business processes to create
and sustain a competitive advantage in today’s dynamic organizations and markets (Crosman, 2004; van der
Aalst, ter Hofstede, & Weske, 2003; Weske et al., 2004).
Although research has studied GPMs in various contexts, there is apparently no research in BPM,
BPM Systems, information systems, enterprise modeling, Human-Computer Interaction (HCI), cognitive
ergonomics, and cognitive psychology literature that empirically investigates GPM user comprehension in
the context of BPM Systems. While related literature contains some empirical GPM user comprehension in
various contexts, such as requirements analysis and general information visualization, no empirical research
was found on the topic of this study. Additionally, no user comprehension research was found that has been
guided by a theoretically-based framework that integrates the cognitive resources and the individual
cognitive differences of interest in this study. Therefore, this empirical study begins to address several
needs in related literature by proposing a theoretical framework for GPM user comprehension and then
testing this framework through the use of a experimental research methodology.

Bret R. Swan Chapter 1 - Introduction
Page 9 of 420
1.3 RESEARCH PURPOSE AND OBJECTIVES
The purpose of this research is to empirically study how BPM cognitive resources and cognitive
differences between individuals affect outcomes of GPM user comprehension in the context of BPM
Systems. Consequently, this study seeks to accomplish the following research objectives:
A. Investigate whether more positive user comprehension outcomes are produced by novice users
if a single GPM technique is used to portray different types of BPI (e.g., as with metagraphs) or
if different GPM techniques are used to portray different types of BPI (e.g., as with UML
diagrams).
B. Investigate whether one type of BPI is more easily comprehended and interpreted by novice
users irrespective of the type of GPM or the type of educational training of the user.
C. Investigate whether users with a specific type of user educational training can more easily
comprehend and interpret BPM information irrespective of the type of GPM or the type of BPI.
D. Evaluate influences of individual cognitive differences (i.e., mental workload, cognitive styles,
and cognitive abilities) on outcomes of user comprehension.
In order to accomplish these objectives, this study: (a) defined a theoretical framework
conceptualizing user comprehension outcomes in terms of the interaction between BPM cognitive resources
external to the user and individual differences affecting how users cognitively process BPI, (b) empirically
tested an operational research model of GPM user comprehension that is based on the theoretical
framework, and (c) interpreted the experimental results in the context of related literature.
1.4 RESEARCH QUESTIONS
This study addresses the following research questions (RQs):
RQ1: How do different types of GPM influence user task performance, subjective mental workload, and self-efficacy when interpreting graphical business process information?
RQ2: How do different types of BPI influence user task performance, subjective mental workload, and self-efficacy when interpreting graphical business process information?

Bret R. Swan Chapter 1 - Introduction
Page 10 of 420
RQ3: How do different types of user educational training influence user task performance, subjective mental workload, and self-efficacy when interpreting graphical business process information?
RQ4: When interpreting graphical business process information, does the relationship between user subjective mental workload and task performance follow the Yerkes-Dodson Law (an inverted-U relationship)?
RQ5: When interpreting graphical business process information, how does user subjective mental workload relate to their self-efficacy after task completion?
RQ6: How do user cognitive styles affect the subjective mental workload they experience when interpreting graphical business process information?
RQ7: How do user general cognitive abilities affect the subjective mental workload they experience when interpreting graphical business process information?
RQ8: How do user attentional abilities affect the subjective mental workload they experience when interpreting graphical business process information?
1.5 OPERATIONAL RESEARCH MODEL
The research model shown in Figure 1-1 relates the variables of interest in this study based on
related literature. Drawing on BPM, HCI, cognitive ergonomic, cognitive psychology, and user
comprehension research, this study investigates the relationships between three BPM cognitive resources
cognitive resources and individual cognitive differences that hypothetically affect GPM user comprehension
task performance, mental workload, and self-efficacy outcomes. In this experiment, BPM Systems are
conceptualized as portraying explicit BPM knowledge (operationalized as different types of BPI) using its
primary information artifact, the GPM. Additionally, users also possess different types of tacit BPM
knowledge (operationalized as the type of user educational training) that participants draw on during GPM
user comprehension tasks. As participants mentally process BPM cognitive resources, their cognitive styles
and cognitive abilities impact GPM comprehension; resulting in differences in the mental workload
participants experience during GPM user comprehension. Task performance (i.e., accuracy and timeliness)
and self-efficacy outcomes are also hypothesized to be affected by the mental workload participants
experience during the GPM user comprehension.

Bret R. Swan Chapter 1 - Introduction
Page 11 of 420
Figure 1-1. Operational Research Model for testing GPM user comprehension in the context of BPM and BPM Systems.
1.6 RESEARCH HYPOTHESES
These research questions and variables of interest were operationalized into the following
hypotheses (illustrated in Figure 1-1):
Hypothesis 1: The type of graphical process model will significantly affect participants’ task performance (i.e., accuracy and timeliness), subjective mental workload and self-efficacy.
Hypothesis 2: The type of business process information will significantly affect participants’ task performance (i.e., accuracy and timeliness) and subjective mental workload4.
1-4 Self-efficacy was not measured within-subjects so it is not included in this hypothesis.

Bret R. Swan Chapter 1 - Introduction
Page 12 of 420
Hypothesis 3: The type of User Educational Training of participants will significantly affect participants’ task performance (i.e., accuracy and timeliness), subjective mental workload, and self-efficacy.
Hypothesis 4. Participants’ subjective mental workload will significantly affect task performance (i.e., task accuracy and timeliness) in inverted-U relationships (in accordance with the Yerkes-Dodson Law).
Hypothesis 5: Participants’ subjective mental workload will significantly and negatively affect self-efficacy results.
Hypothesis 6: Participants’ cognitive styles will significantly affect the subjective mental workload they experience during task performance.
Hypothesis 7: Participants with high general cognitive abilities will experience significantly lower subjective mental workload.
Hypothesis 8: Participants scoring high on attentional abilities will experience significantly lower subjective mental workload during task performance.
A detailed discussion of the rationale for the proposed theoretical framework and development of
these hypotheses5 is discussed in Chapter 2.
1.7 OVERVIEW OF THE RESEARCH METHODOLOGY
In this experiment, data were collected using a 2 (GPM) x 3 (UET) x 3 (BPI) factorial design, with
repeated measures on the third variable, the type of BPI. These data were analyzed using three-way mixed
MANOVAs that included two between-subjects variables (the type of GPM and the type of user educational
training (UET)) and one within-subjects variable (the type of BPI). Dependent variables assessed included
user comprehension accuracy, timeliness, subjective mental workload, and self-efficacy. Additionally, the
effects of the following moderating variables were statistically controlled for: general cognitive abilities
(GCA), attentional abilities, extroversion-introversion cognitive style, and perceptual cognitive style (i.e.,
sensing-intuition).
The total sample size was 87 participants. The participants were third and fourth year university
students majoring in Industrial Engineering (IE), Business Management (MGT), and Computer Science
(CS) at a large southeastern U.S. university and a small U.S. university in Hawaii. Each group of
1-5 Several sub-hypotheses are discussed in Chapter 2.

Bret R. Swan Chapter 1 - Introduction
Page 13 of 420
participants, that possessed different types of educational training, were presented with different treatment
combinations of the types of GPM and BPI manipulated according to the experimental treatment and
assessment strategy (see Section 3.5). Assessments of participants’ cognitive styles were made using the
Myers-Briggs Type Indicator (MBTI) (Myers, McCaulley, & Most, 1985). Assessments of participants’
cognitive abilities were made using the Wonderlic Personnel Test (WPT) (Dodrill, 1981) and the
Differential Attentional Processes Instrument (DAPI) (Grumbles & Crawford, 1981). Experimental
treatments, as well as assessments of participants’ cognitive styles and cognitive abilities, were analyzed in
relation to task accuracy (assessed as the percent of correct answers on a task questionnaire), task timeliness
(assessed by a stopwatch as time on task), subjective mental workload (assessed using the NASA Task Load
Index [TLX]) (Hart & Staveland, 1988a, 1988b), and self-efficacy (assessed by a questionnaire adapted
from an existing computer self-efficacy instrument).
These data were, by definition, multivariate, because the same data set collected on three
independent variables were used to analyze the results of four dependent variables. Cell sizes for the
between-subject independent variables were unequal, but each contained a minimum treatment cell size of
at least twelve participants. Preliminary analyses were conducted to help ensure these data were analyzed
and interpreted appropriately (see Appendices M and N). Also, preliminary analyses were conducted to
describe data representing each dependent and moderating variable while taking into account the unequal
cell sizes and the multivariate nature of the data. Univariate and multivariate statistical techniques were
used to analyze data testing the research hypotheses.
More detailed information about the research methodology used in this study is discussed in
Chapter 3. The results are detailed in Chapter 4 (see also Appendices N and O). Discussions of the results
and conclusions appear in Chapters 5 and 6, respectively.

Bret R. Swan Chapter 1 - Introduction
Page 14 of 420
1.8 CONTRIBUTIONS OF THIS RESEARCH
This study has implications for management systems engineering in BPM and BPM Systems
contexts, as well as several related bodies of knowledge including HCI, cognitive ergonomics, and
information systems. This study is targeted at the information portrayal/information perception interface
between the BPM manager and the BPM System in the Management System Model (see Figure 1-2).
Work System
ManagementInformation System
Decision
Action Measurement
Data
Information Portrayal
Information Perception
Management SystemManagement System
(WHO MANAGES)
BPM MANAGER (USER)Individual Cognitive Differences
• Mental Workload• Cognitive Styles
• Cognitive Abilities
(WHAT IS USED TO MANAGE)
BPM SYSTEM (IT)BPM Cognitive Resources
• Type of Graphical Process Model• Type of Business Process Information• Type of User Educational Training
(WHAT IS MANAGED)
BUSINESS PROCESSES
OutputsInputs CustomersCustomersSuppliersSuppliers
Figure 1-2. GPM user comprehension takes place at the information portrayal/information perception interface between the BPM cognitive resources and the BPM System user6.
In general, the Management System Model illustrates the management information-flow
relationships between the people, technology, and the work system being managed (Kurstedt, 2000). This
study refers to a system as an assembly or combination of parts that form a complex unifying whole
(Blanchard & Fabrycky, 2006) that maintains and functions as a whole through the interaction of its parts
(O'Connor & McDermott, 1997). For the purposes of this study, the definition of a management system is
1-6 Adapted from George W. L. Sousa’s adaptation of Kurstedt’s (2000) Management Systems Model.

Bret R. Swan Chapter 1 - Introduction
Page 15 of 420
adapted to include both a work system and a management information system. A work system includes
aspects of the organization that actually does the work that produces value for the organization or enterprise,
such as value-adding business processes. The management information system includes the individuals and
IT that gathers, processes, analyzes, portrays, and controls the flow of information used to help managers
make decisions and take actions that affect the work system.
The focus of this study is on the management information system that describes the interaction
between BPM Systems (the IT) with BPM managers. As a result, this study takes into account the BPM
cognitive resources facilitated by BPM systems as well as the individual cognitive differences between
managers that affect BPM of an enterprise-level work system. Because GPMs facilitate the interactions
between the manager and IT components of the management information system, GPM user comprehension
is conceptualized as taking place within the management information system at the information
portrayal/information perception interface (see Figure 1-2).
Therefore, this study specifically contributes to management systems engineering by adding needed
empirical research to the areas of BPM and BPM Systems. Also, this study appears to be one of the first to
theoretically integrate and empirically study the major BPM cognitive resources and individual cognitive
differences affecting GPM user comprehension in the context of BPM and BPM Systems. This study
contributes to the HCI, cognitive ergonomics, and information systems related research by extending
empirical GPM user comprehension research to BPM Systems contexts. This study also provides
practitioners guidance to aid in GPM design, manager training, and matching BPM user comprehension
tasks to individual abilities. This research framework and these results can be used in future studies to
compare and interpret past studies, as well as extend and refine future research and practice.

Bret R. Swan Chapter 1 - Introduction
Page 16 of 420

Bret R. Swan Chapter 2 – Review of Literature
Page 17 of 420
C h a p t e r T w o
CHAPTER 2 – REVIEW OF LITERATURE This study explores user comprehension of graphical process modeling (GPM) techniques that are
required for the development and operation of business process management (BPM) systems. This research
is unique from related literature in three specific ways. First, this research uses a laboratory experimental
design to empirically study the effects of variations in three types of BPM cognitive resources (the type of
GPM, the type of business process information [BPI], and the type of user educational training [UET]) on
four user comprehension outcomes (task accuracy, task timeliness, subjective mental workload, and self-
efficacy). Second, this study attempts to account for the moderating effects of cognitive differences
between individuals (e.g., user cognitive styles and cognitive abilities) on GPM user comprehension
outcomes. Lastly, this study integrates various individual hypotheses from related literatures into a
theoretical framework and research model to guide the empirical tests of BPM cognitive resources and
individual cognitive differences on GPM user comprehension outcomes.
Despite the fact that BPM Systems have received a large amount of attention in recent years, no
theory-based research model was found that incorporated the key BPM cognitive resources and individual
cognitive differences pertinent to GPM user comprehension in the context of BPM Systems. The lack of
empirical research on GPM user comprehension requires development of a theoretical framework to study
this topic. Therefore, using concepts found in Activity Theory and Distributed Cognition Theory as an
organizing framework, an operational research model is developed that integrates various research
constructs and theory-based relationships from related literature.
This chapter discusses relevant literature used to operationalize this study’s eight research questions
(RQs) and supports the derivation of the operational research model presented in Chapter 1. Consequently,
this chapter serves several purposes:
• Reviews BPM Systems literature and related GPM techniques (Section 2.1).
• Reviews user comprehension research in related literature (Section 2.2).
• Reviews literature relating BPM cognitive resources to user comprehension (Sections 2.3).
• Reviews literature relating individual cognitive differences to user comprehension (Section 2.4).

Bret R. Swan Chapter 2 – Review of Literature
Page 18 of 420
• Reviews theory used as a framework for integrating impacts of BPM cognitive resources and
individual cognitive differences on GPM user comprehension (Section 2.5).
• Summarizes the operational model and research hypotheses that relate the independent, dependent,
and moderating variables of interest in this study (Section 2.6).
2.1 BPM SYSTEMS RESEARCH OVERVIEW
This section proceeds by defining knowledge-intensive business processes and their relationship to
BPM Systems. Next, unique features of BPM Systems are discussed as well as the need for empirical
research. Finally, prior GPM user comprehension research is described in relation to BPM and BPM
Systems
2.1.1 Knowledge-Intensive BPM and BPM Systems
In this study. the term business process refers to a business process as “the combination of a set of
activities within an enterprise with a structure describing their logical order and dependence whose objective
is to produce a desired result” (Aguilar-Saven, 2004, p. 129). In other words, a business process is a
“sequence of functions that are necessary to transform a business relevant object (e.g., purchase order,
invoice)” (Green & Rosemann, 2000, p. 78). For the purposes of this study, business process are
categorized as more or less knowledge-intensive depending on whether both the business process and
associated knowledge resources are stable or dynamic (Osborn, 1998).
Researchers and practitioners have used the term BPM in different ways. Some authors use BPM to
mean Business Process Management, and others prefer Business Performance Management (Wolf &
Harmon, 2006). Some authors use the term in a broad way to refer to any business practice or technology
used in the management of business processes (Smith & Fingar, 2003), while others use the term more
narrowly to refer to the use of software techniques and technologies that manage the runtime execution of
business processes (Weske, van der Aalst, & Verbeek, 2004; Wolf & Harmon, 2006). In this study, the term
BPM is used broadly to refer to both the practices and technologies used to manage business processes.
BPM Systems are an example of what is meant by the latter, more narrow use of the term BPM.

Bret R. Swan Chapter 2 – Review of Literature
Page 19 of 420
2.1.1.1 Knowledge-Intensity of Business Processes
The management of knowledge-intensive business processes has become a popular topic and an
important area of research in recent years; primarily due to advances in information and communication
technologies that provide managers with an abundance of BPI (Amaravadi & Lee, 2005; T. H. Davenport &
Beers, 1995; Hlupic, 2003). For example, Sampler and Short (1998) review research strategies and laid out
an agenda for the study of dynamic, knowledge-intense business environments. Hlupic, Pouloudi, and
Rzevski (2002) describe three types of knowledge and business process management issues: hard, soft, and
abstract. Markus et al. (2002) describe the management needs of highly dynamic, knowledge-intensive
business processes. Eppler et al. (1999) classify business processes in terms of knowledge intensity vs.
process complexity. They also categorize different types of BPM knowledge as (a) knowledge about the
process, (b) knowledge within the process, and (c) knowledge from the process. Lastly, Gronau and Weber
(2004, p. 165) define the knowledge-intensity of a business process by how much of the process value can
only be produced by fulfillment of the knowledge requirements of the business process managers.
The Dynamic Nature of the Business Process
The Dynamic Nature of
BPM Knowledge Resources
Low
High
Formal
Semi-Formal
Emergent
Categorizing Knowledge-Intensive Business Processes
Low High
The Dynamic Nature of the Business Process
The Dynamic Nature of
BPM Knowledge Resources
Low
High
Formal
Semi-Formal
Emergent
Categorizing Knowledge-Intensive Business Processes
Low High
Figure 2-1. Category of knowledge intensity of a business process based on the dynamics of the processes and the knowledge resources.

Bret R. Swan Chapter 2 – Review of Literature
Page 20 of 420
These studies are based on the idea that business processes can be conceptualized as more or less
knowledge-intensive. By integrating the concepts in these studies, the relationship between BPM
knowledge resources and business processes result in the categorization of business processes as either
formal, semi-formal, or emergent (see Figure 2-1) (Eppler et al., 1999; Gronau & Weber, 2004; Markus et
al., 2002; Osborn, 1998):
• A formal business process is defined as relatively stable and explicitly definable (such as a
manufacturing assembly process or a financial audit process). A formal business process does not
change frequently. As a result, explicit BPM knowledge (such as BPI portrayed by GPMs) can be
more easily automated and documented. Consequently, BPM of a formal business process relies
heavily on explicit knowledge. BPM Systems allow the control of formal business processes
through the executable GPMs that portray the BPI, which contains explicit knowledge of the
business process.
• A semi-formal business process is described as more dynamic than a formal process and can be
only partially defined explicitly because of relatively frequent changes to the process (such as a
brand management, billing, or management exception handling process). BPM of semi-formal
processes require access to more people with relevant tacit knowledge than do formal processes,
because the frequency of changes to the process make explicitly documenting the process more
difficult. Thus, there tends to be less explicit knowledge of documented BPI available to managers
compared to a formal business process. BPM Systems support semi-formal business processes by
providing explicit BPI that helps trigger managers’ to apply their relevant tacit BPM knowledge.
Because of the timely comprehension of explicit knowledge portrayed by BPM Systems, managers
are more easily able to communicate and codify their tacit BPM knowledge to make BPM
decisions.
• An emergent business process is either highly dynamic or can emerge through creativity of the
participants (such as a new product development or strategy-making process). BPM of an emergent
business process relies heavily on the tacit knowledge of the managers involved, which cannot be
easily documented, because it is highly situational and experience-based. Thus, an emergent
process is difficult to support with BPM Systems due to the dynamic nature of the business process
and lack of explicit BPM knowledge available for control of an emergent process.
Therefore, BPM Systems are primarily used to support formal and semi-formal business processes.
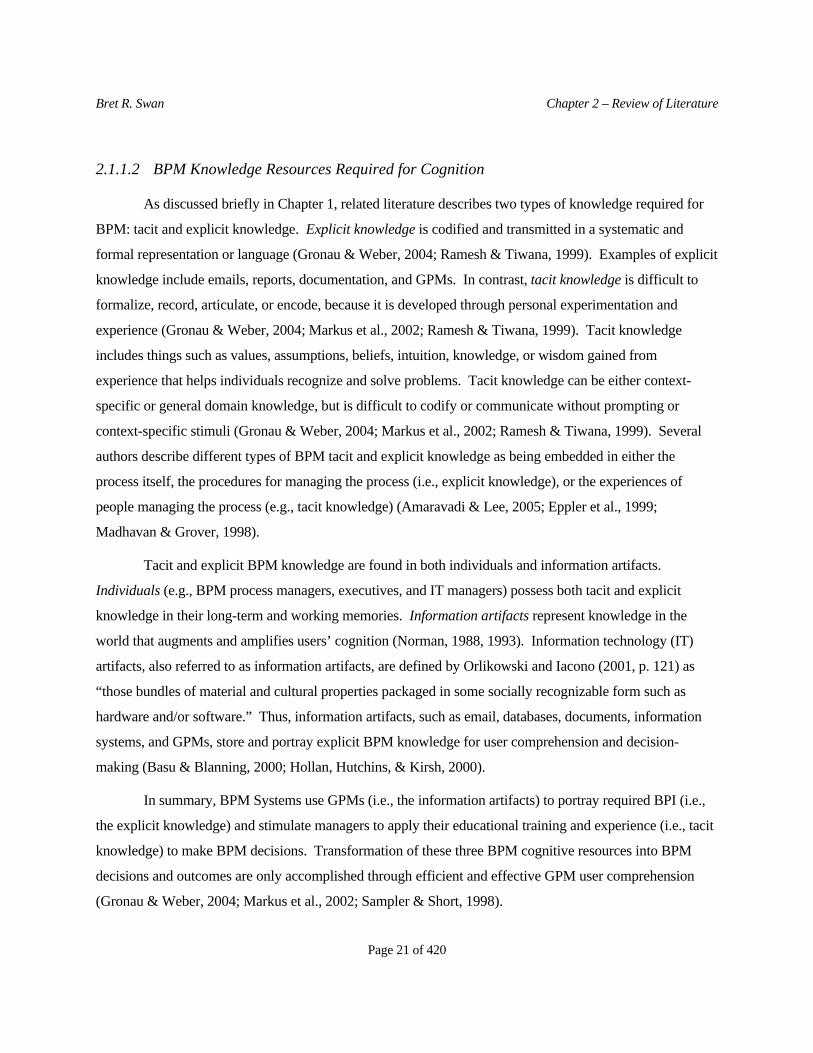
Bret R. Swan Chapter 2 – Review of Literature
Page 21 of 420
2.1.1.2 BPM Knowledge Resources Required for Cognition
As discussed briefly in Chapter 1, related literature describes two types of knowledge required for
BPM: tacit and explicit knowledge. Explicit knowledge is codified and transmitted in a systematic and
formal representation or language (Gronau & Weber, 2004; Ramesh & Tiwana, 1999). Examples of explicit
knowledge include emails, reports, documentation, and GPMs. In contrast, tacit knowledge is difficult to
formalize, record, articulate, or encode, because it is developed through personal experimentation and
experience (Gronau & Weber, 2004; Markus et al., 2002; Ramesh & Tiwana, 1999). Tacit knowledge
includes things such as values, assumptions, beliefs, intuition, knowledge, or wisdom gained from
experience that helps individuals recognize and solve problems. Tacit knowledge can be either context-
specific or general domain knowledge, but is difficult to codify or communicate without prompting or
context-specific stimuli (Gronau & Weber, 2004; Markus et al., 2002; Ramesh & Tiwana, 1999). Several
authors describe different types of BPM tacit and explicit knowledge as being embedded in either the
process itself, the procedures for managing the process (i.e., explicit knowledge), or the experiences of
people managing the process (e.g., tacit knowledge) (Amaravadi & Lee, 2005; Eppler et al., 1999;
Madhavan & Grover, 1998).
Tacit and explicit BPM knowledge are found in both individuals and information artifacts.
Individuals (e.g., BPM process managers, executives, and IT managers) possess both tacit and explicit
knowledge in their long-term and working memories. Information artifacts represent knowledge in the
world that augments and amplifies users’ cognition (Norman, 1988, 1993). Information technology (IT)
artifacts, also referred to as information artifacts, are defined by Orlikowski and Iacono (2001, p. 121) as
“those bundles of material and cultural properties packaged in some socially recognizable form such as
hardware and/or software.” Thus, information artifacts, such as email, databases, documents, information
systems, and GPMs, store and portray explicit BPM knowledge for user comprehension and decision-
making (Basu & Blanning, 2000; Hollan, Hutchins, & Kirsh, 2000).
In summary, BPM Systems use GPMs (i.e., the information artifacts) to portray required BPI (i.e.,
the explicit knowledge) and stimulate managers to apply their educational training and experience (i.e., tacit
knowledge) to make BPM decisions. Transformation of these three BPM cognitive resources into BPM
decisions and outcomes are only accomplished through efficient and effective GPM user comprehension
(Gronau & Weber, 2004; Markus et al., 2002; Sampler & Short, 1998).

Bret R. Swan Chapter 2 – Review of Literature
Page 22 of 420
2.1.2 Unique Features of BPM Systems Supporting Knowledge-Intensive BPM
Most enterprise systems, including ERP systems, CRM systems, and SCM systems, are: (1) data-
focused as opposed to process-focused, meaning they are solely based on models of the data structures of
business processes they support; (2) cannot be readily adapted or reconfigured as business processes change;
and (3) provide only limited support for the different phases of the BPM lifecycle (Basu & Blanning, 2000;
Basu & Kumar, 2002; Weske et al., 2004). In contrast, BPM Systems possess several characteristics that
distinguish them from other types of enterprise systems in addition to the fact that they are based on unique
types of GPMs.
2.1.2.1 Graph Theory Formalisms are a Critical Component of BPM Systems
First, the GPMs that underlie BPM Systems are “actual representation(s) of the business process in
terms of a business process model using a process language” (Weske et al., 2004, p. 1). These GPM process
languages are derived from graph theory formalisms, which permits mathematical modeling and direct
control business processes (Aguilar-Saven, 2004; Basu & Kumar, 2002; van der Aalst, ter Hofstede, &
Weske, 2003; Weske et al., 2004). Examples of these formal GPMs include metagraphs, Petri nets, and
Unified Modeling Language (UML) diagrams. Informal graphical modeling techniques (such as
flowcharts) do not permit this kind of mathematical analysis and control.
In general, BPM Systems use formal GPMs for three levels of abstraction and control of business
processes: the business level, the execution level, and the evaluation level. These formal GPMs are used to
model business-level graphs that define business processes symbolically in ways that capture and
communicate BPI between various BPM managers (e.g., business managers, operational process managers,
and IT personnel). These business graphs are then transformed into execution graphs to effect control of
business processes. Finally, specific executions of business processes are evaluated, creating an audit trail
that is then dynamically mapped back to the business graphs. which allows BPM managers the ability to
understand the dynamics and performance of the business process (Basu & Blanning, 2000; Basu & Kumar,
2002; Karagiannis, Junginger, & Strobl, 1996). Thus, BPM managers make decisions that manage and
control the business processes based on how they comprehend the GPMs used in BPM Systems.

Bret R. Swan Chapter 2 – Review of Literature
Page 23 of 420
2.1.2.2 BPM Systems Support all Phases of the BPM Lifecycle
Second, BPM Systems support all phases of the BPM lifecycle illustrated in Figure 2-2. Weske
(2004, p. 3) explains that BPM Systems support the design, configuration, enactment, and diagnosis phases
of BPM. Other process-oriented enterprise systems, such as workflow management systems1, provide only
partial support for the BPM lifecycle (2004c, p. 86).
Process Monitoring
Goals, Environmental
Analysis, Organizational
Analysis
ProcessDesign
ProcessEnactment
ProcessEvaluation
Animation,Simulation
ProcessImplementation
ProcessMetrics
Other ReportingPurposes
ProcessMetrics
ProcessModels
MetricsTargets
Impl
emen
ted
Pro
cess
Mea
sure
s fo
rIm
prov
emen
t
Targ
et V
alue
s
BPM Lifecycle
Workflow Management
Systems
BPM Systems
Mea
sure
-men
ts
Figure 2-2. Support for the phases of the BPM lifecycle by BPM Systems compared to
workflow management systems2.
2-1 The term workflow management refers to another area of research that includes process-aware information systems (called
workflow management systems) that are considered predecessors of BPM Systems. In recent literature, the terms workflow management and workflow management systems are often used synonymously with the terms BPM and BPM Systems respectively (van der Aalst, 2004; Weske et al., 2004).
2-2 Adapted from zur Muehlen (2004c, p. 86). Used by permission.

Bret R. Swan Chapter 2 – Review of Literature
Page 24 of 420
2.1.2.3 BPM Systems Can Control and Reconfigure Business Processes
Third, BPM Systems are “process-aware” in that they facilitate the management and control of
business processes by operational-level managers in ways that other enterprise systems cannot (van der
Aalst, 2004; Weske et al., 2004). BPM Systems allow “BPM process owners armed with business process
management orchestration tools [the capability to] change process and information flows using graphically
based tools with little or no involvement of the traditional IT department” (Light, 2005, p. 1). Most
enterprise systems are limited to the management and control of the flow of data that aids BPM. They are
not designed to allow the direct control of the business processes by operational-level managers. This
unique feature of BPM Systems has allowed managers to monitor, change, and rapidly adapt business
processes and data flows to meet the changing needs of dynamic business environments despite these
managers being geographically dispersed (Basu & Blanning, 2000; Basu & Kumar, 2002; Light, 2005;
Ould, 2003; Weske et al., 2004).
2.1.2.4 BPM Systems Integrate with Various Enterprise Architectures
Lastly, BPM Systems support the collection and integration of real-time BPI by interfacing with a
variety of enterprise systems, architectures, and technologies (Hall & Harmon, 2006; Vernadat, 2002a).
Enterprise integration literature describe how information technologies both model and utilize information
for enterprise management (Vernadat, 2002a; Wagter, 2005; Zachman, 1999). However, other enterprise
systems do not typically support access to real-time business process data across a variety of enterprise
architectures without significant modifications; nor do they support direct control of these business
processes (van der Aalst, 2004; Weske et al., 2004). A BPM System integrates several major IT
components and areas of research, including: process modeling tools, simulation tools, business rule
management tools, BPM applications, business process monitoring tools, software modeling and
development tools, enterprise architecture integration tools, workflow tools, business process modeling
languages, and organization and enterprise modeling tools (Hall & Harmon, 2006).
2.1.3 Empirical GPM User Comprehension Is Needed
Using BPM Systems efficiently and effectively requires the study of how managers cognitively
perceive, comprehend, and apply the explicit BPM knowledge portrayed by GPMs so that they can be used

Bret R. Swan Chapter 2 – Review of Literature
Page 25 of 420
to prompt managers to apply their tacit BPM knowledge in a given situation (Agarwal, De, & Sinha, 1999;
Aguilar-Saven, 2004; Basu & Blanning, 2000; Karagiannis et al., 1996; Osborn, 1998; zur Muehlen, 2004a).
2.1.3.1 The Importance of GPM User Comprehension Research
BPM Systems and enterprise modeling literature describes modeling techniques for the
development and implementation of enterprise systems. Yet, these bodies of knowledge suffer from a lack
of empirical research on GPM user comprehension (cf. Aguilar-Saven, 2004; Curtis, Kellner, & Over, 1992;
Lenz & Oberweis, 2003; Morabito, Sack, & Bhate, 1999; O'Rourke, Fishman, & Selkow, 2003; Wagter,
2005; Zachman, 1999; zur Muehlen, 2004b). According to Aguilar-Saven (2004), the primary purpose of
business process modeling is to enable common understanding, analysis, and comprehension of business
processes by users across an enterprise. Boland et al. (1994, p. 457) describe why efficient and effective
GPM user comprehension is so important to BPM:
“…[managers] who act autonomously within a decision domain, make interpretations of their situation and exchange them with others with whom they have interdependencies so that each [individual] may act with an understanding of their own situations and that of others.”
Unfortunately, managers often experience a lack of timely access and comprehension of BPI due to
information overload, trouble locating the necessary information in a timely manner, and difficulty in
understanding the way the information was portrayed (Basu & Blanning, 2000; Zhang, 1996a).
Research describing the need for GPMs that standardize the interchange and communication of
business process information, knowledge, and expertise is identified as the single greatest need by BPM
practitioners. BPM managers are often geographically distributed across an enterprise with limited ability to
identify and interact in a timely manner with other managers that possess relevant BPI (Agarwal et al., 1999;
Basu & Blanning, 2000). Agarwal et al. (1999, p. 542) describe this need using an enterprise systems
development example:
“The lack of attention to model comprehension is all the more disturbing as models play a crucial role in providing a communication mechanism among different stakeholders during the systems development process. For instance, systems analysts use requirements analysis models to verify with users if all their requirements have been captured, as well as to communicate those requirements to systems designers. For large software systems [such as BPM Systems], teams may be geographically distributed and models constitute the primary communication vehicle among developers.”

Bret R. Swan Chapter 2 – Review of Literature
Page 26 of 420
The Delphi Group, in their BPM 2005 Market Milestone Report, state that the visualization of business
processes is the single biggest benefit of BPM Systems (Palmer, 2005, p. 8):
“The indication of visualizing and simulating business processes as the single greatest benefit (nearly a 100% increase over 2003 findings) represents the growing awareness for the need of process visibility”
Additionally, the Delphi Group report the standardized interchange of process models is the most important
feature defined by respondents as needed in BPM Systems but is missing in current commercial offerings
(Palmer, 2005). Agarwal et al. (1999, p. 542) summarize why empirical research on user comprehension of
GPMs is so important:
“Because effective communication can only result if the models themselves are easily comprehensible, and because the ultimate quality of any large-scale system is, in turn, dependent on the quality of communication among the multiple parties involved, it is imperative that we examine the issue of comprehension of models developed using different [research] methods.”
2.1.3.2 BPM Research Lacks Empirical Studies
There is a lack of empirical research that has studied whether the GPMs used in BPM Systems truly
facilitate user comprehension of tacit and explicit BPM knowledge. There has been a great deal written in
recent years about GPM modeling in relation to BPM Systems (cf. Basu & Blanning, 2000; Curtis et al.,
1992; van der Aalst, Desel, & Oberweis, 2000; zur Muehlen, 2004c). Several papers illustrate a particular
application, define a derivative GPM, describe potential user benefits of different GPM techniques, or
discuss issues related to the development of BPM Systems (Basu & Blanning, 2000; Curtis et al., 1992; van
der Aalst, 2004; Vernadat, 2002b; zur Muehlen, 2004a). However, no empirical research was found that has
sought to validate claims that one type of GPM facilitates better user comprehension than another in this
context.
2.1.3.3 GPM User Comprehension Research is Lacking in BPM Contexts
Several authors cite a general lack of empirical research that relate enterprise systems to
organizational contexts. Basu and Kumar (2002, pp. 11-12), in a recent literature review of BPM System-
related issues in E-business, recommend that future research needs to focus on linking the BPM Systems
with the organizational context:
Bret R. Swan Chapter 2 – Review of Literature
Page 27 of 420
“Traditional information systems research has focused on problems such as application development and database management, which have gained significant maturity. On the other hand, the inherently hybrid (combination of automation and manual) nature of business process workflows, particularly when spread across multiple locations, resources, and organizational entities, present new challenges for IS researchers [i.e., referring to the challenges inherent to independencies between individuals and information artifacts in distributed work environments]. In the volatile, dynamic context of E-business, these problems not only become more complex, but their solutions also become critical determinants of success.”
There is empirical research in the information systems and enterprise modeling literature that has
studied user comprehension of different GPM techniques on topics such as requirements analysis and
systems design (cf. Agarwal et al., 1999; Kabeli & Shoval, 2005a; Mayes, Sims, & Koonce, 2001).
However, no empirical research was found that has studied user comprehension of formal GPMs in the
either BPM Systems literature or in the general context of BPM.
2.1.4 Summarizing GPM User Comprehension Research in BPM Systems Contexts
A critical issue impacting BPM Systems and supporting knowledge-intensive business processes is
that managers and stakeholders must be able to accurately and efficiently comprehend BPM tacit and
explicit knowledge resources and envision the impact of their decisions on business processes using GPMs
(Basu & Blanning, 2000; Eppler et al., 1999; Markus et al., 2002; Osborn, 1998; Sampler & Short, 1998;
Schael, 1998; Sheth, van der Aalst, & Arpinar, 1999). The GPMs used in BPM Systems are the primary
information artifacts that portray essential BPI and facilitate communication among different BPM
managers that tap into their tacit BPM knowledge (Agarwal et al., 1999; Aguilar-Saven, 2004; Basu &
Blanning, 2000; Curtis et al., 1992). There has been a great deal written in recent years about GPM
techniques and the development of BPM Systems. However, there is apparently no empirical BPM System
research, nor GPM research that utilize theory integrating the key variables affecting GPM user
comprehension in the context of BPM and BPM Systems.
Users of formal GPMs used in BPM Systems must be able to be accurately and efficiently
comprehend the BPI they portray. To accomplish this, it is suggested that GPM user comprehension
research include how GPM techniques used in BPM Systems (Basu & Blanning, 2000):
(a) Facilitate user comprehension of a variety of BPI (e.g., task-centric, resource-centric, and
information-centric BPI) by operational managers.

Bret R. Swan Chapter 2 – Review of Literature
Page 28 of 420
(b) Minimize unnecessary process complexity that impair user comprehension, thus minimizing the
time and effort required to comprehend and interpret BPI while maintaining accuracy of user
comprehension.
(c) Facilitate comprehension of relevant tacit and explicit BPM knowledge despite cognitive
differences between individual users.
Zur Meuhlen (2004, p. 288) in his review of BPM/workflow management organizational issues state that
experimental research on process modeling approaches is a necessary next step:
“The use of workflow technology for human-centric processes presents both a technical and organizational challenge. Consequently, it has to be addressed from both the community of workflow vendors and the community of workflow users…. An evaluation and validation of the different modeling and management approaches presented in this paper is the next step. Experimental research is needed to determine the effects of workflow applications on organizational structures and their management, and to establish the success factors for workflow-enabled organizations.”3 [emphasis added]
Therefore, this study seeks to address this need by experimentally studying GPM user
comprehension in the context of BPM and BPM Systems. This experiment includes three BPM cognitive
resources required for user cognition during user comprehension: the type of GPM, BPI, and user
educational training. The next section reviews research related to GPM user comprehension and the
cognitive differences between individuals.
2.2 USER COMPREHENSION IN RELATED LITERATURE
Because of the lack of research studying GPM user comprehension in the context of BPM and BPM
Systems, several reference literatures were needed to study this topic including Human Computer-
Interaction (HCI), cognitive ergonomics, and cognitive psychology. HCI is “concerned with understanding
how people make use of devices and systems that incorporate or embed computation, and how such devices
and systems can be more useful and more usable” (John M. Carroll, 2003, p. 1). HCI literature overlaps and
borrows from social, behavioral, and IT literature. As a result, the dominant theoretical perspective in
2-3 Zur Meuhlen uses the term “workflow” to refer to an executed instance of a business process. Thus, when he refers to “workflow
management,” “workflow-enabled,” or “workflow management systems,” he is discussing essentially the same concepts as what this study calls “BPM” or “BPM Systems” (zur Muehlen, 2004c).

Bret R. Swan Chapter 2 – Review of Literature
Page 29 of 420
comes from information processing theory from cognitive psychology to aid in the study and development
of more effective environments and information artifacts (John M. Carroll, 2003). Cognitive ergonomics
research intersects the HCI, ergonomics, and cognitive science literatures. Relative to this study, cognitive
ergonomics helps with the design of information artifacts and contexts so that individuals are capable of
perceiving information, making decisions, and performing tasks more effectively and efficiently (Boff,
2006; Hollnagel & Woods, 2005; MacLeod, 2004). Both HCI and cognitive ergonomics research borrow
from cognitive science and cognitive psychology literature because they study the processes and individual
differences that affect cognition, learning, and decision-making (Baddeley, 2003a; Huitt, 2004; Neisser,
1967). This section defines the terminology theoretical relationships from these reference literatures that
relate to user comprehension.
2.2.1 Cognition and User Comprehension
Cognition is a core concept in behavioral and cognitive sciences, but there is no single, generally
accepted definition and efforts to reach one is a matter of controversy in the cognitive sciences (van Duijn,
Keijzer, & Franken, 2006). Ulric Neisser, who coined the term cognitive psychology, defines cognition as
referring to all processes by which the sensory input is transformed, reduced, elaborated, stored, recovered,
and used (Neisser, 1967, p. 4), however transformation is no longer generally considered part of cognition.
In a more practical sense, the term cognition, from the Latin cognoscere meaning "to know," generally
refers to the process of knowing, acquiring knowledge, or knowledge that is acquired by the use of
reasoning, intuition, or perception (Kintsch, 2005; Wickens, 1992). Varela, Thompson, and Rosh (1999)
define cognition as “embodied action” ( p. 172) or an enactment that results in a new version “from a
background of understanding” (p. 149).
According to van Duijn, Keijzer, and Franken (2006), there is a strong consensus that cognition
involves perception, thinking, memory, and action. Gershenson (2006, p. 151) summarizes cognitive
systems as having the following general characteristics:
• “Systems can be judged to be cognitive only inside a specific context. For example, in a chess-
playing context, a bee is not cognitive, but in a navigational context, it is. People agree in
contexts, and these are contrasted with experience of a shared world….

Bret R. Swan Chapter 2 – Review of Literature
Page 30 of 420
• “Cognition is a description we give of systems, not an intrinsic constituent of them, i.e. systems
do not have cognition as an element, we observe cognition from a specific context. The
cognition of a system does not depend on its implementation.
• “If a system performs a successful action, we can say that it knows what to do in that specific
situation. This success is tied to a context and to an observer. Therefore, any system
performing a successful action can be considered to be a cognitive system.”
Gershenson (2006, p. 151) refers to this conceptualization as a “general notion of cognition” with which
other definitions and conceptualizations of cognition can be applied “in different contexts with different
purposes: without contradicting these general characteristics. Cognitive psychology seeks to understand the
thinking processes that influence human actions and behavior. This literature has studied various aspects of
cognition including perception, thinking, language, memory, attention and problem solving.
Comprehension is viewed by cognitive psychologists as one aspect of cognition (Just & Carpenter,
1992). Cognitive psychology literature depicts comprehension as a vague term that is difficult to define
because it represents a continuum that depends on context as opposed to possessing a specific meaning
(Kintsch, 2005). Kintsch (2005, p. 125) explains the comprehension continuum, “We can talk about
comprehending a problem, which would put us at one end of the continuum, or comprehending a perceptual
scene, which would put us at the other end.” In the cognitive psychology literature, comprehension has
come to have roughly the same meaning as understanding in that it refers to the ability of a person to grasp
the meaning of something (Agarwal et al., 1999; Just & Carpenter, 1992; Kintsch, 2005). For example, text
comprehension research measures the understanding of a passage of text (Kellogg, 2001). User
comprehension outcomes are achieved through the mental processing (i.e., reasoning, intuition, or
perception) of cognitive resources (i.e., information, knowledge, and experience).
2.2.2 Outcomes of User Comprehension
Because many cognitive differences, components, capacities, and processes are not directly
observable, their outcomes have to be assessed indirectly through behavior, recall, and self-evaluation
(Huitt, 2004; Strickland, 2001a). It is typical for researchers to assess comprehension by asking participants
to recall, summarize, or verify statements and answer questions about cognitive resources. User
comprehension research often assess three different outcomes: task accuracy, task timeliness, and mental

Bret R. Swan Chapter 2 – Review of Literature
Page 31 of 420
workload. (cf. Baddeley, 2003a; Kintsch, 1988; Marmaras & Kontogiannis, 2001; Nordbotten & Crosby,
1999; Shoval, Danoch, & Balabam, 2004; Sinha & Vessey, 1992)
Task accuracy is a measure of correctness of an individual’s task solution compared to a known,
correct answer for example:
“Discourse comprehension, from the viewpoint of a computational theory, involves constructing a representation of a discourse upon which various computations can be performed, the outcomes of which are commonly taken as evidence for comprehension. Thus, after comprehending a text, one might reasonably expect to be able to answer questions about it, recall or summarize it, verify statements about it, paraphrase it, and so on” (Kintsch, 1988, p. 164).
Consequently, comprehension is often assessed by the number or percent of correct answers to
questionnaires. Similarly, GPM user comprehension is measured by the accuracy of participant responses to
questions that assess understanding of information portrayed by GPMs (Agarwal et al., 1999; Kabeli &
Shoval, 2005a; Moody, 2004). In this study, task accuracy is assessed by the percent of correct answers to
questions asking users to interpret GPMs.
Task timeliness is a measure of the amount of time spent by an individual in performing a task
(Baddeley, 2003a; Dunn & Grabski, 2001; Sinha & Vessey, 1992). For example, Mayes, Sims, and
Koonce (2001) conducted two experiments to determine if reading information from a computer monitor vs.
paper resulted in poorer user comprehension outcomes. Thus, the time participants take to learn,
understand, or interpret information is often a dependent variable in studies of user comprehension. In this
study, task timeliness refers to the time a user took to complete their interpretation of GPMs.
Subjective mental workload and self-efficacy are also common outcomes of user comprehension
found in user comprehension research, and is included in this study. Literature reviewing each of these
outcomes are discussed in Sections 2.4.1 and 2.4.2, respectively.
2.2.3 Information Processing Theory and User Comprehension
The history of cognitive psychology states that its original purpose was to study and understand the
cognitive processes at work within the minds of individuals that help explain differences in task
performance, based primarily on Human Information-Processing (IP) theory (Baddeley, 2003b; Eysenck &
Flanagan, 2000; Miller, 1956). IP theory was created as cognitive psychologists sought to explain cognition
and comprehension (Newell & Simon, 1972). The purpose of IP theory is to help describe the components,

Bret R. Swan Chapter 2 – Review of Literature
Page 32 of 420
structures, and functions related to the way people take in, process, and act on information within specific
contexts, environments, or ecologies (Huitt, 2004). Prior to IP theory which focuses on the innate mental
capacities of individuals, cognitive theory was based on behaviorist approaches focused on conditioned,
externally observable behavior (Strickland, 2001a). Beginning in the 1950s, both cognitive psychology and
IP theory emerged from the work of George A. Miller, Herb Simon, and others, because there was a
growing dissatisfaction with behaviorist theory and the realization that stimuli and feedback internal to the
individual play a significant role in affecting task performance (Eysenck & Flanagan, 2000; Huitt, 2004). IP
theory is used extensively in cognitive psychology, because it seeks to understand intellectual task
performance on topics such as:
• Attention - e.g., directing mental effort towards important aspects of a situation or event.
• Memory strategies - e.g., using mnemonics such as Every Good Boy Deserves Fruit for the
notes on a music staff.
• Study and comprehension skill - e.g., highlighting key points and making summaries.
• Concept mapping - e.g., setting out the relationship between key ideas in a topic in diagram
forming.
• Problem solving - e.g., understanding the role of knowledge, the way problems may be
represented.
• Metacognition - e.g., thinking about thinking and deciding how best to manage mental
processes.
• Pattern recognition - e.g., identifying meaningful relationships.
• Elaboration - e.g., bringing together what we know about something in order to integrate our
knowledge.
• Learning – e.g., Primarily through the study of memory (Miller, 1956).
Because of these properties, IP theory has become the fundamental theoretical perspective underlying
cognitive psychology (Huitt, 2003; Neisser, 1967), cognitive ergonomics (Marmaras & Kontogiannis,
2001), and HCI research (Hollan et al., 2000; Perry, 2003).
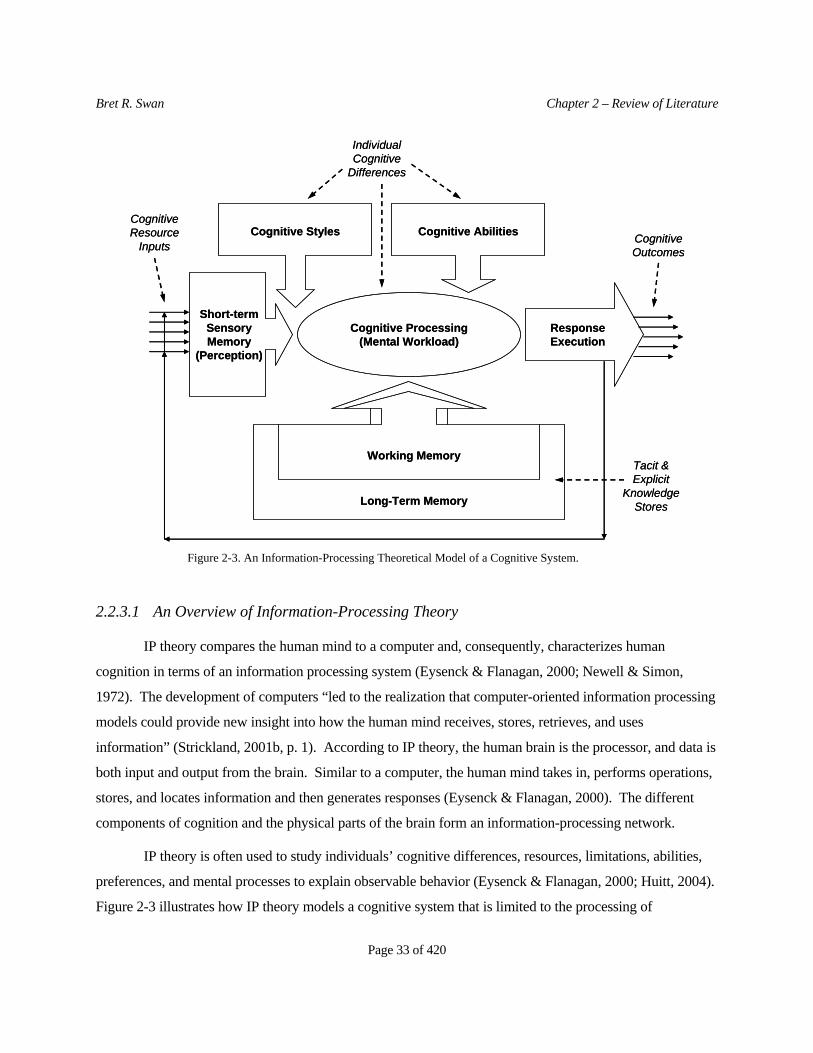
Bret R. Swan Chapter 2 – Review of Literature
Page 33 of 420
Cognitive Styles Cognitive Abilities
Cognitive Processing(Mental Workload)
ResponseExecution
Short-termSensoryMemory
(Perception)
Working Memory
Long-Term Memory
Tacit & Explicit
KnowledgeStores
Individual Cognitive
Differences
Cognitive Resource
InputsCognitive Outcomes
Cognitive Styles Cognitive Abilities
Cognitive Processing(Mental Workload)
ResponseExecution
Short-termSensoryMemory
(Perception)
Working Memory
Long-Term Memory
Tacit & Explicit
KnowledgeStores
Individual Cognitive
Differences
Cognitive Resource
InputsCognitive Outcomes
Figure 2-3. An Information-Processing Theoretical Model of a Cognitive System.
2.2.3.1 An Overview of Information-Processing Theory
IP theory compares the human mind to a computer and, consequently, characterizes human
cognition in terms of an information processing system (Eysenck & Flanagan, 2000; Newell & Simon,
1972). The development of computers “led to the realization that computer-oriented information processing
models could provide new insight into how the human mind receives, stores, retrieves, and uses
information” (Strickland, 2001b, p. 1). According to IP theory, the human brain is the processor, and data is
both input and output from the brain. Similar to a computer, the human mind takes in, performs operations,
stores, and locates information and then generates responses (Eysenck & Flanagan, 2000). The different
components of cognition and the physical parts of the brain form an information-processing network.
IP theory is often used to study individuals’ cognitive differences, resources, limitations, abilities,
preferences, and mental processes to explain observable behavior (Eysenck & Flanagan, 2000; Huitt, 2004).
Figure 2-3 illustrates how IP theory models a cognitive system that is limited to the processing of
Bret R. Swan Chapter 2 – Review of Literature
Page 34 of 420
information within the mind of an individual and involves relationships between several cognitive
components (Baddeley, 2003a; Huitt, 2004; Marmaras & Kontogiannis, 2001). IP theory hypothesizes that
cognition is accomplished through several stages including gathering and representing information in
sensory and working memory (also called encoding), holding information in short-term and long-term
memory (also called retention), mental processing of information (processing), and accessing the stored
information when needed (called retrieval) (Huitt, 2004). Sensory memory retains an exact copy of what is
experienced by the senses at a given moment. Working memory is limited and retains information from the
sensory and long-term memories that is focused on a given moment. This information can be held in
working memory for approximately 20 seconds without maintenance or rehearsal. Long-term memory is
the brain’s permanent storehouse for information and is virtually unlimited in capacity.
During cognition information received from external or internal stimuli (such as representations of
GPM symbols) is inputted through the senses and transformed by a variety of mental operations. The mind
receives information through the perceptual processes and then is stored in either working or long-term
memory. There the newly perceived information interacts with previously-stored information (i.e., tacit and
explicit knowledge) to generate a response. Research has shown that when an individual experience
problems with recall of information the reason is usually related to the method of retrieval from long-term
memory (Huitt, 2004; Strickland, 2001a).
These cognitive stages take place in a number of different arrangements: serial, parallel, and in
hybrid combinations of the two (Huitt, 2003). A serial model of cognitive processing takes place when
these stages are executed in succession, like a chain reaction, with the output of each stage becoming the
input of the succeeding one. These stages can also occur simultaneously; an event known as parallel
processing. Serial and parallel processing can combine in what is known as a hybrid arrangement.
2.2.3.2 Four Principles of IP Theory
There are four main principles of IP theory that guide its application in several research domains.
The first principle is the assumption that certain components of a cognitive system have a limited capacity:
short-term and working memory. In contrast, long-term memory and sensory memory are theorized as
having unlimited capacity. This means that restrictions in the flow and processing of information occur at
specific points in a cognitive system. Therefore, the amount of information that can be processed is
constrained by differences in the cognitive capabilities of different individuals (Huitt, 2003; Just &
Bret R. Swan Chapter 2 – Review of Literature
Page 35 of 420
Carpenter, 1992; Kellogg, 2001; Miller, 1956). For example, Miller (1956) found that short-term memory
has a limited capacity of 7 2 “chunks” of information. This principle has become a basic element of all
subsequent theories of memory and is the basis of Cognitive Load Theory (CLT) in learning literature and
the concept of mental workload in cognitive ergonomics and cognitive science literature (Hart & Staveland,
1988; Hollnagel, 1997; Hollnagel & Woods, 2005).
±
The second principle of IP theory is that a control mechanism is required (commonly referred to as
the executive function) to oversee the encoding, transformation, processing, storage, and retrieval of
information in the cognitive system (Baddeley, 2003b) much like the central processing unit (CPU) in a
computer. Like the computer, the human mind takes in information, stores and locates the information,
performs operations to change the form and content of the information, and generates responses to the
information it perceives and comprehends. Like the CPU in a computer, the executive function uses some
of the limited capacity of the mind’s cognitive system to oversee cognitive processing. For example, when
an individual is learning a new task or seeks to understand new information, the executive function requires
more of an individual’s limited cognitive processing power than when the same individual is either
performing a routine task or possesses some form of prior expertise or experience with the task (i.e., tacit
knowledge) (Baddeley, 2003b; Huitt, 2003). This increase in cognitive processing power is often referred to
as cognitive load or mental workload. The mental workload and efficiency of each stage in the cognitive
process depends on whether certain other stages are operating at the same time (Baddeley, Chincotta, &
Adlam, 2001).
The third principle of IP theory is the assumption of a two-way flow of information as individuals
try to comprehend information, tasks and the environment around them. People constantly gather
information through their senses (referred to as bottom-up processing) and from their memory (referred to as
top-down processing) as they dynamically construct meaning from other people, information resources, and
the task environment (Kintsch, 2005). Huitt (2003) says that these two ways of perceiving information is
analogous to the differences between inductive reasoning (going from specific instances to general
conclusions) and deductive reasoning (going from a general principle to specific examples).
Finally, the fourth principle of IP theory is that humans are genetically predisposed to process
information in specific ways that are influenced by specific individual differences affecting a person’s
cognitive processing (Huitt, 2003). Consequently, two individuals can be predisposed to processing the
same information in different ways resulting in different outcomes and behaviors. These individual
cognitive differences affect user comprehension outcomes and can be genetic or influenced by practice and

Bret R. Swan Chapter 2 – Review of Literature
Page 36 of 420
experience (Sadler-Smith, 2001). Examples of two categories of individual cognitive differences affecting
user comprehension in all people are their cognitive styles and cognitive abilities. According to Sadler-
Smith (2001, pp. 609-610) cognitive styles and abilities of individuals represent different layers of a
cognitive “onion”:
“The ‘core’ of the onion is the central personality dimension; as one passes outwards from the centre, the constructs (cognitive style, learning style [i.e., cognitive abilities], and learning preferences) become increasingly open to introspection, more context-dependent and less fixed….If the field is to progress there is a need to delineate … separate constructs [along this continuum] (if indeed they are such).”
A large amount of cognitive science research studies how individual cognitive differences affect user
comprehension. (See Sections 2.4.3 and 2.4.4 for further discussions on cognitive styles and cognitive
abilities.)
One noticeably missing element of IP theory is the influence of differences in cognitive resources.
As mentioned above, this is because the original purpose of IP theory was to discover the components and
processes going on within the mind of individuals (Baddeley, 2003b; Eysenck & Flanagan, 2000; Miller,
1956). Although not explicitly included in the IP theoretical model, cognitive psychologists recognize that
constraints on cognitive resources help explain individual differences in comprehension (Carpenter, Miyake,
& Just, 1995).
2.2.4 Information Processing Theory in Related Research
As the role of computers and information artifacts has grown in society, IP theory has been applied
to the study of study socio-technical systems in various disciplines where information is presented,
perceived, and task outcomes are observed. Cognitive psychology research describes both language or text
comprehension as involving the processing of a sequence of symbols that are produced and perceived over
time (Just & Carpenter, 1992). In similar fashion, IP theory is used in HCI, cognitive ergonomics,
information systems, and computer-assisted learning literatures to help explain how an individual’s behavior
is affected by external representations, influences, and mental capabilities. For instance, Kuutti (1995, p.
16) classifies HCI-related research in three broad “traditions”:
“The ‘technical’ one, having roots already in the old ‘know-and-dial’ ergonomics, concentrating human perceptive abilities and motor skills and corresponding features of technical devices, the ‘conceptual’ one that has formed the information processing
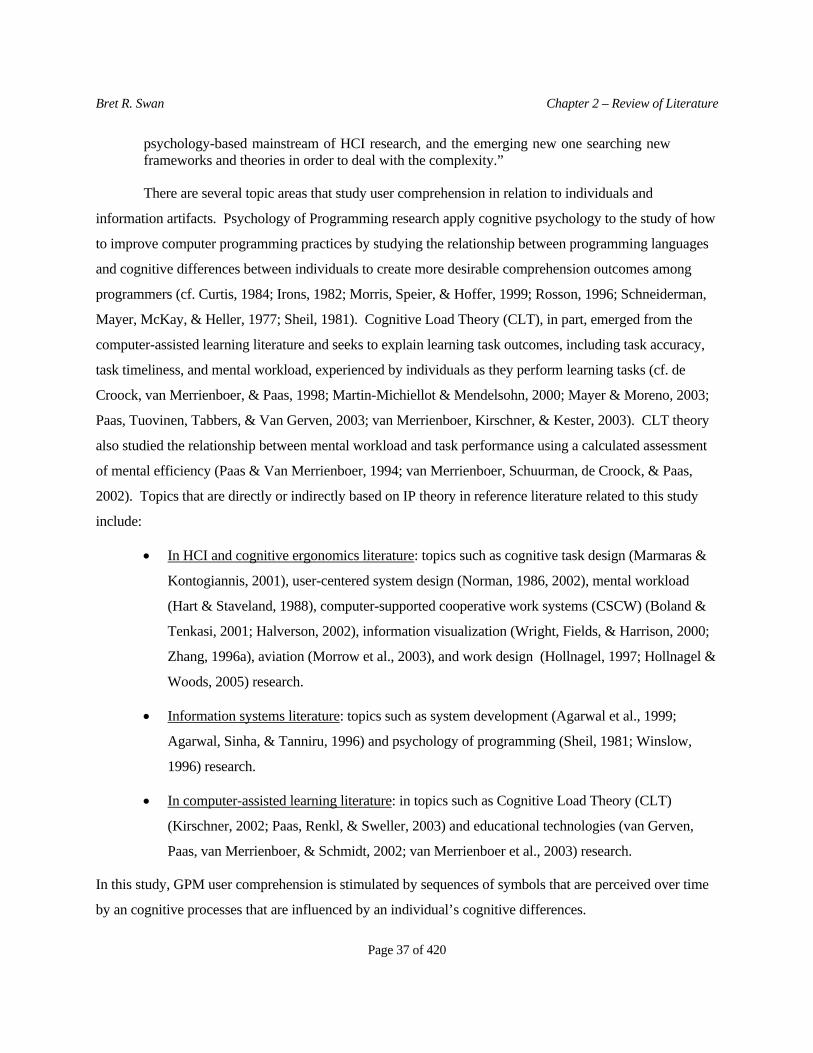
Bret R. Swan Chapter 2 – Review of Literature
Page 37 of 420
psychology-based mainstream of HCI research, and the emerging new one searching new frameworks and theories in order to deal with the complexity.”
There are several topic areas that study user comprehension in relation to individuals and
information artifacts. Psychology of Programming research apply cognitive psychology to the study of how
to improve computer programming practices by studying the relationship between programming languages
and cognitive differences between individuals to create more desirable comprehension outcomes among
programmers (cf. Curtis, 1984; Irons, 1982; Morris, Speier, & Hoffer, 1999; Rosson, 1996; Schneiderman,
Mayer, McKay, & Heller, 1977; Sheil, 1981). Cognitive Load Theory (CLT), in part, emerged from the
computer-assisted learning literature and seeks to explain learning task outcomes, including task accuracy,
task timeliness, and mental workload, experienced by individuals as they perform learning tasks (cf. de
Croock, van Merrienboer, & Paas, 1998; Martin-Michiellot & Mendelsohn, 2000; Mayer & Moreno, 2003;
Paas, Tuovinen, Tabbers, & Van Gerven, 2003; van Merrienboer, Kirschner, & Kester, 2003). CLT theory
also studied the relationship between mental workload and task performance using a calculated assessment
of mental efficiency (Paas & Van Merrienboer, 1994; van Merrienboer, Schuurman, de Croock, & Paas,
2002). Topics that are directly or indirectly based on IP theory in reference literature related to this study
include:
• In HCI and cognitive ergonomics literature: topics such as cognitive task design (Marmaras &
Kontogiannis, 2001), user-centered system design (Norman, 1986, 2002), mental workload
(Hart & Staveland, 1988), computer-supported cooperative work systems (CSCW) (Boland &
Tenkasi, 2001; Halverson, 2002), information visualization (Wright, Fields, & Harrison, 2000;
Zhang, 1996a), aviation (Morrow et al., 2003), and work design (Hollnagel, 1997; Hollnagel &
Woods, 2005) research.
• Information systems literature: topics such as system development (Agarwal et al., 1999;
Agarwal, Sinha, & Tanniru, 1996) and psychology of programming (Sheil, 1981; Winslow,
1996) research.
• In computer-assisted learning literature: in topics such as Cognitive Load Theory (CLT)
(Kirschner, 2002; Paas, Renkl, & Sweller, 2003) and educational technologies (van Gerven,
Paas, van Merrienboer, & Schmidt, 2002; van Merrienboer et al., 2003) research.
In this study, GPM user comprehension is stimulated by sequences of symbols that are perceived over time
by an cognitive processes that are influenced by an individual’s cognitive differences.

Bret R. Swan Chapter 2 – Review of Literature
Page 38 of 420
2.3 BPM COGNITIVE RESOURCES AND USER COMPREHENSION
Based on the review of literature thus far, three categories of BPM cognitive resources are inputs to
GPM user comprehension:
• The primary information artifact used by the BPM System to portray BPI (operationalized as the
type of GPM).
• The explicit BPM knowledge portrayed using GPMs in a BPM System (operationalized as the type
of BPI needed to perform a specific BPM task).
• Managers’ tacit BPM knowledge related to interpreting the BPI portrayed by a BPM System
(operationalized as the type of user educational training).
This section reviews theoretical bases for relating these BPM cognitive resources to GPM user
comprehension outcomes to test the research questions of this study.
2.3.1 Type of Graphical Process Model and GPM User Comprehension
Research Question 1: How do different types of GPM influence user task performance, subjective
mental workload, and self-efficacy when interpreting graphical business process information?
2.3.1.1 Types of GPMs Used in BPM Systems
As mentioned above, BPM Systems use formal GPM techniques because they permit the
mathematical analyses and control of business processes (Basu & Blanning, 2000; Curtis et al., 1992). This
means that for a formal GPM to control a business process, this process model must describe the control
flow of the business process (Curtis et al., 1992; Green & Rosemann, 2000). Although informal process
modeling is not new, the basic formal process modeling grammar, called Petri nets, on which most formal
GPMs are based comes from Petri’s (1962) doctoral dissertation. Since that time, a great deal of research on
formal process modeling has resulted (Curtis et al., 1992; Vernadat, 1996). Examples of these formal GPM
techniques used to model business processes include Petri nets (van der Aalst, 2000), Unified Modeling
Language (UML) diagrams (Vernadat, 2002b), state charts (Harel & Gery, 1997), and metagraphs (Basu &
Blanning, 2000).

Bret R. Swan Chapter 2 – Review of Literature
Page 39 of 420
Green and Roseman (2000, p. 79) summarize the research and state that formal process modeling to
address the various purposes of BPM needs three new main requirements4. First, the process model must
include more BPI than the just the control flow. They propose that a comprehensive, formal process model
should include at least:
1. Information about the organizational units (e.g. internal and external persons,
departments, (project) groups) that are involved in the process by having to execute
certain tasks or be responsible for the performance of those tasks.
2. The input and output data that are necessary for a function to process and the data that
result from the execution of a function.
3. References to existing libraries or repositories that describe the functions and business
processes within an enterprise.
4. The output (product and services) which describes the results of the business processes.
5. The integration of business objectives, business partners (e.g., customers and vendors),
temporal aspects (e.g., deadlines), access to BPM knowledge (e.g., tacit and explicit),
and/or other resources such as application systems.
Second, a formal GPM should not only be comprehensive but it must also be easy to understand because (1)
manual organizational activities are involved and (2) so that it can be used as a platform for communication
between various business people and managers who may not be familiar with process modeling. They
quote Curtis et al. (Curtis et al., 1992, p. 751) to further explain, “Process modeling is distinguished from
other types of modeling in computer science because many of the phenomena modeled must be enacted by a
human rather than a machine.” Third, formal GPMs should be based on a meta model that serves as a well-
defined starting point for the development of workflow-based applications, such as BPM Systems.
Additional applications of process models include animation and simulation. They conclude by stating, “All
in all, process models that are not only used for the purpose of developing software must be comprehensive,
understandable and formal at the same time.” (Green & Rosemann, 2000, p. 79).
4 This paragraph is paraphrased directly and in its entirety from Green and Roseman (2000, p. 79)

Bret R. Swan Chapter 2 – Review of Literature
Page 40 of 420
Regarding the comprehensibility of GPMs, most BPM practitioners have some experience with
informal graphical modeling techniques. Business processes are often modeled using informal graphical
methods, such as basic flowcharts, because these techniques are perceived to be more intuitive to novice
users. On the other hand, most managers have not been trained to interpret formal GPM techniques (Basu &
Blanning, 2000; Schael, 1998). Van der Aalst et al. (2003, p. 8) believe that formal GPM techniques can be
easily comprehended by novice users:
“In some products, a pragmatic approach to process modeling is preferred to a formal one; especially if the main goal of process modeling is discussion with domain experts rather than process analysis or process enactment. However, we mention that formal semantics of process languages and intuitiveness and ease of use are not contradicting goals, and recent approaches seem to support this observation.”
This study of formal GPM user comprehension focuses on two types of GPMs: Unified Modeling
Language (UML) diagrams (Eriksson & Penker, 2000; Marshall, 2000; Vernadat, 2002b) and metagraphs
(Basu & Blanning, 2000). There are several reasons why these two GPM techniques were chosen for this
study. First, metagraphs and UML diagram extensions have been specifically developed be used in BPM
Systems, while other GPM techniques can only partially meet the needs of BPM Systems (Basu &
Blanning, 2000; Eriksson & Penker, 2000; Marshall, 2000; Vernadat, 2002b). Second, UML diagrams are
becoming the defacto standard for modeling business processes for development of enterprise systems
(Basu & Blanning, 2000; Eriksson & Penker, 2000; Marshall, 2000; Vernadat, 2002b), and thus should be
included in GPM user comprehension research. Metagraphs have apparently not actually been used in the
development of enterprise systems, however metagraphs have been developed and proposed as an
alternative to counter the weaknesses of UML diagrams (Basu & Blanning, 2000). Third, metagraphs and
UML diagram extensions have been specifically developed be used to model business processes in BPM
Systems. Other GPM techniques can only partially meet the needs of BPM Systems (Basu & Blanning,
2000). For example, although Petri-net related research is extensive, they have not been comprehensively
applied to model the necessary BPI needed in a business applications (Green & Rosemann, 2000).
However, UML version 2.0 does include a version of a Petri net to offer control flow
Finally, the nature of UML diagrams and metagraphs lend themselves nicely to being compared and
tested for user comprehension using the theoretical principle of Ontological Completeness (see Section
2.3.1.4 for further discussion on this topic). For these reasons, metagraphs and UML diagrams were
selected as the best possibly alternatives to test GPM user comprehension using the theoretical framework
developed for this research.

Bret R. Swan Chapter 2 – Review of Literature
Page 41 of 420
2.3.1.2 Using UML Diagrams in BPM Systems to Model Business Processes
UML diagrams possess several advantages for use in BPM Systems: they support object-oriented
systems analysis and design, are easily extended to specific BPM contexts, and include a variety of
diagrams to thoroughly model both processes and data from different BPI perspectives (Eriksson & Penker,
2000; Marshall, 2000; Vernadat, 2002b). UML version 2.0 includes thirteen different diagramming
techniques, each for modeling a different perspective or aspect of an information system (Anonymous,
2007; Eriksson & Penker, 2000; Marshall, 2000; Wohed, van der Aalst, Dumas, ter Hofstede, & Russell,
2004).
UML diagrams have several advantages when used in BPM Systems. One advantage is that several
individual UML diagram modeling techniques closely resemble traditional, informal flow charting
techniques that may be more familiar to novice users, while allowing the formal mathematical analyses
required for BPM Systems development and process analysis and enactment. Another advantage is that
UML techniques have been extended to model enterprise business processes. For example, Vernadat
(2002b) proposes UML extensions for use in enterprise systems that he calls the Unified Enterprise
Modeling Language (UEML). Eriksson and Penker (2000) propose different BPM extensions of UML
diagrams to model different perspectives of a business process; for example, task-centric, resource-centric,
and information-centric BPI.
On the other hand, critics argue that UML diagrams can be difficult to learn and comprehend
because users must learn to read and understand a different set of modeling notations, symbols, and
component relationships for each type of BPI being modeled. For example, UML diagram depictions5 of
task, resource, and information-centric BPI are each modeled using different set of GPM symbols and
notations (see Figures 2-4, 2-5, and 2-6 respectively). This significantly increases the learning curve and
complexity for novice users, particularly non-IT BPM managers having limited exposure to UML diagrams
(Basu & Blanning, 2000; Gou, Huang, Liu, & Li, 2003). As a result, only a few of the UML diagrams are
typically utilized in practice, and then only by information systems professionals – not the operational
2-5 The UML diagrams used in this experiment are created using Eriksson and Penker (2000) extensions for BPM modeling and are
simplified by eliminating extraneous syntax. Also, the terminology used to describe the actual UML diagrams were replaced with the tack-centric, resource-centric, and information-centric BPI so that participants could focus on learning the symbols and what they represented, not on the names of the diagrams.

Bret R. Swan Chapter 2 – Review of Literature
Page 42 of 420
managers and executives envisioned to be the users of BPM Systems (Basu & Blanning, 2000; Gou et al.,
2003).
2.3.1.3 Using Metagraphs in BPM Systems to Model Business Processes
Metagraphs, as a graph theoretic formalism, have been around for decades, but have only recently
been recommended by its proponents for users and developers of workflow management and BPM Systems
(Basu & Blanning, 2000, 2003). Metagraphs are proposed by Basu and Blanning (2000; 2003) as a superior
alternative to UML diagrams for use in BPM Systems. Like UML diagrams, metagraphs can be used to
model different business process perspectives. Unlike UML diagrams, metagraphs use the same graphical
symbols, semantics, and nomenclature to model different types of BPI. The following figures illustrate
metagraph depictions of task-centric BPI (Figure 2-7), resource-centric BPI (Figure 2-8), and information-
centric BPI (Figure 2-9) perspectives of the same bank loan application process portrayed by UML
diagrams in Figures 2-4, 2-5, and 2-6, respectively.
Consequently, one proposed advantage of using metagraphs is that users are required to learn only
one set of modeling symbols and notations. Basu and Blanning (2000) argues that this makes metagraphs
easier to comprehend for a variety of BPM managers who are novice users who possess a variety of BPM-
related education, training, and experience. The main disadvantage of metagraphs is that they have not been
used by either researchers or practitioners in the development of actual workflow management or BPM
systems. Therefore, claims of metagraph user comprehension superiority over UML diagrams have yet to
be empirically studied.

Bret R. Swan Chapter 2 – Review of Literature
Page 43 of 420
Figure 2-4. A UML conceptual model of a task-centric BPI of a loan application process as may be found in a BPM System6.
2-6 This is an original drawing based on UML extensions for business process modeling found in Eriksson and Penker (2000).
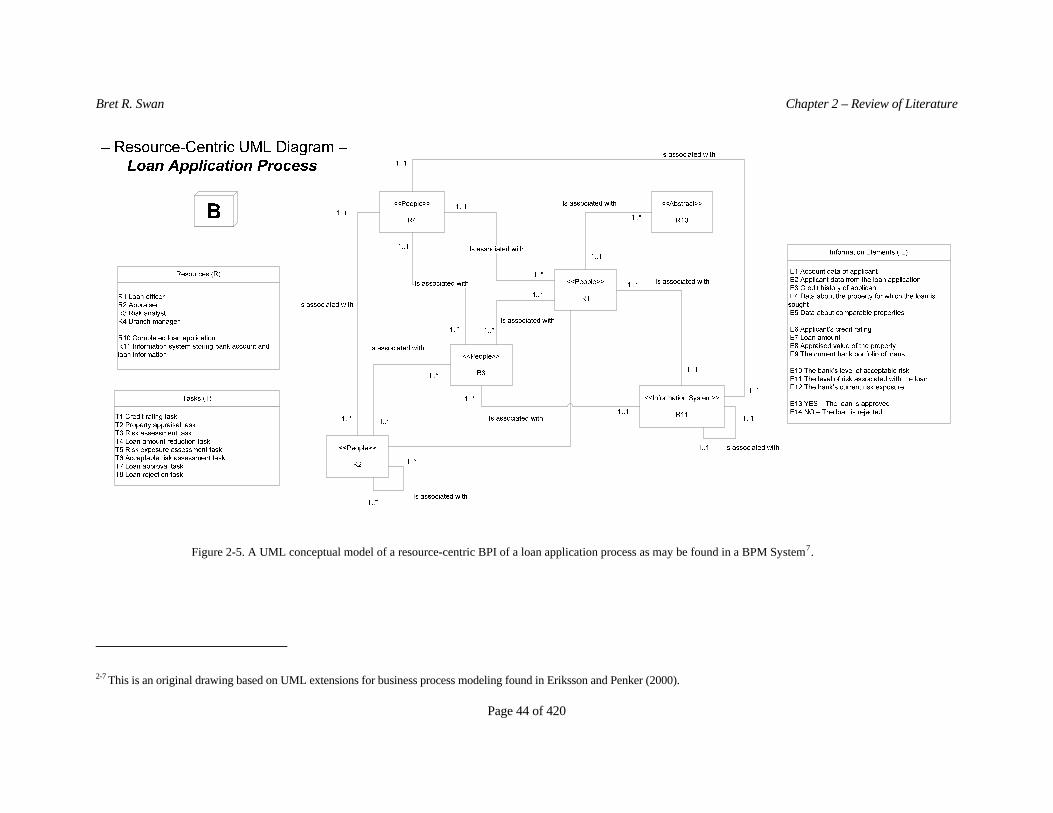
Bret R. Swan Chapter 2 – Review of Literature
Page 44 of 420
Figure 2-5. A UML conceptual model of a resource-centric BPI of a loan application process as may be found in a BPM System7.
2-7 This is an original drawing based on UML extensions for business process modeling found in Eriksson and Penker (2000).

Bret R. Swan Chapter 2 – Review of Literature
Page 45 of 420
Figure 2-6. A UML conceptual model of the information-centric BPI of a loan application process as may be found in a BPM System8.
2-8 This is an original drawing based on UML extensions for business process modeling found in Eriksson and Penker (2000).

Bret R. Swan Chapter 2 – Review of Literature
Page 46 of 228
Figure 2-7. A metagraph of the task-centric BPI of a loan application process as may be found in a BPM System9.
2-9 This drawing is an adaptation of a metagraph diagram from Basu and Blanning (2000). Used by permission.
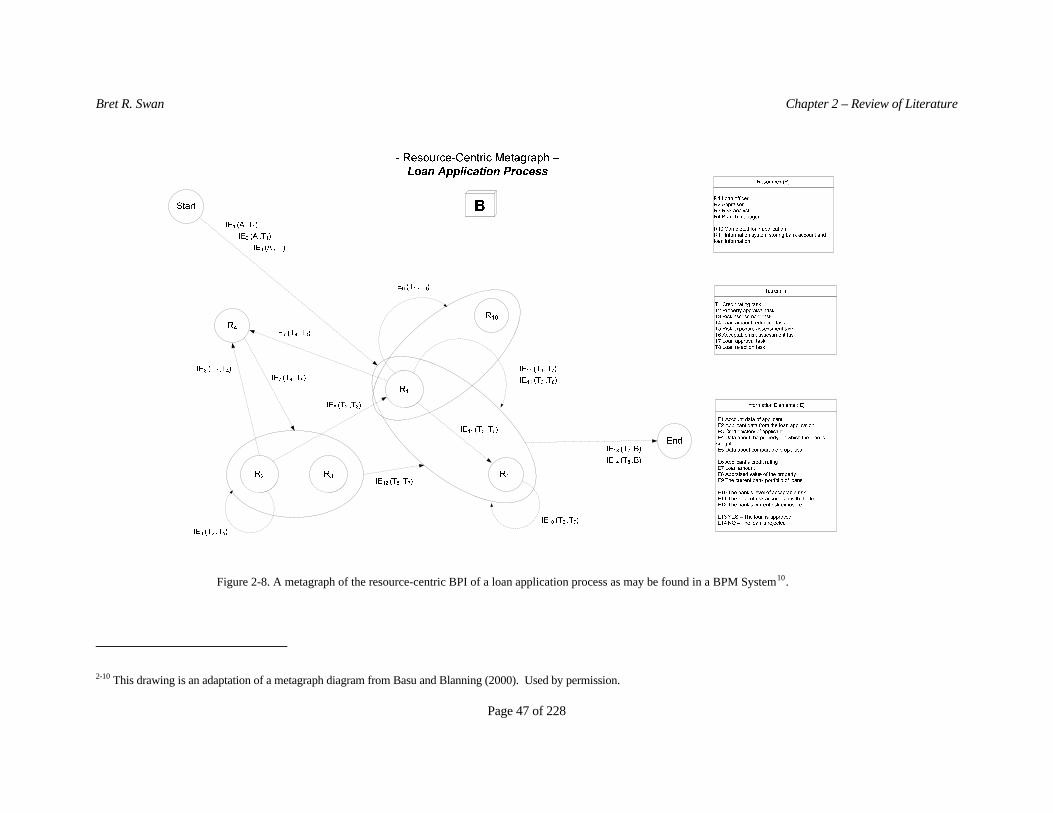
Bret R. Swan Chapter 2 – Review of Literature
Page 47 of 228
Figure 2-8. A metagraph of the resource-centric BPI of a loan application process as may be found in a BPM System10.
2-10 This drawing is an adaptation of a metagraph diagram from Basu and Blanning (2000). Used by permission.

R. Swan Chapter 2 – Review of Literature
Page 48 of 228
Figure 2-9. A metagraph of the information-centric BPI of a loan application process as may be found in a BPM System11.
2-11 This drawing is an adaptation of a metagraph diagram from Basu and Blanning (2000). Used by permission.
Bret
Bret R. Swan Chapter 2 – Review of Literature
Page 49 of 420
No empirical BPM Systems research was found that has studied the effects of formal GPMs on user
comprehension of essential tacit and explicit BPM knowledge. Most of the BPM Systems literature has
studied topics such as the application of GPM techniques to solve different BPM issues (cf. Basu &
Blanning, 2000; Curtis et al., 1992; van der Aalst, 1994; Wohed et al., 2004), BPM Systems development
issues (cf. van der Aalst et al., 2000; zur Muehlen, 2004c), BPM enterprise architectures and integration (cf.
Vernadat, 2002a; Zachman, 1999; Zelm, Vernadat, & Kosanke, 1995), and case studies of BPM Systems
(cf. Palmer, 2005; van der Aalst et al., 2003; Weske et al., 2004; zur Muehlen, 2004c). However, a primary
goal of this research is to investigate if one type of GPM is more easily comprehended by novice users than
another.
Some empirical research was found in cognitive ergonomics, information systems, and computer-
assisted learning literature that has studied different GPM techniques in relation to user comprehension and
task performance. For example, Agarwal, De, and Sinha (1999) experimentally compare user
comprehension of object-oriented (OO) and process-oriented (PO) models in requirements analysis.
Comprehension was assessed using the accuracy of participants' responses to questionnaires. Kabeli and
Shoval (2005b) also compares user comprehension of PO vs. OO modeling approaches in the context of
system development. In two controlled experiments, researchers compare GPM user comprehension of both
industrial engineers and information systems analysts using advanced undergraduate students from two
universities. Although these studies compare specific PO vs. OO modeling techniques, they do not provide
a theoretical basis to help guide this study, because in this study, both UML and metagraph GPMs contain
elements of both PO and OO models. These studies are typical of the topics and GPMs in prior empirical
GPM user comprehension literature.
In a broader context, a great deal of research explores the use of external representations in
stimulating memory and mental model development. For example, Cognitive Fit research seeks to explain
task performance as the outcome of the “fit” between the external problem representation (i.e., an
information artifact such as a GPM) and characteristics of the problem solving task (Agarwal et al., 1999;
Sinha & Vessey, 1992; Vessey, 1991). Research on user comprehension of computer vs. paper displays of
relevant information has shown mixed results. For example, Mayes et al (2001) found that users of
computer monitors took significantly longer to comprehend information than users reading from paper.
They also found the way in which information is displayed on computer screens affects the time it takes
someone to read the information. Additionally, the best medium for conveying information seems to
Bret R. Swan Chapter 2 – Review of Literature
Page 50 of 420
depend on which aspect of performance was most important and on how the information was displayed
(e.g., illustrations, text, or both) (Mayes et al., 2001).
These studies suggest that a GPM that produces more positive user comprehension outcomes would
better “fit” or “match” the task or problem characteristics. However, these studies lack an explanation or
theory for why one GPM is a better “fit” or “match” than another. They also do not include all three of the
BPM cognitive resources of interest in this study, nor do they suggest theory describing the interactions of
the three BPM cognitive resources.
Another problem is that prior GPM user comprehension research does not typically involve the
formal GPMs used in BPM Systems. Although GPM user comprehension research helps identify variables
and assessment instruments for this study, prior research provides little guidance on which to base
theoretical models and hypotheses. What theory that exists does not explain inconsistencies in research
results. Inconsistent results may be because cognitive differences in the way individuals process
information are not taken into account in these studies.
2.3.1.4 Ontological Completeness and GPM User Comprehension
The principle of Ontological Completeness (Wand & Weber, 1993) provides a theoretical basis for
generating hypotheses to test the impacts of different GPMs on user comprehension. A primary objective of
GPMs in BPM Systems is to minimize the time and mental workload required for various managers to
accurately comprehend cross-functional BPI (Basu & Blanning, 2000; Luqi, Barnes, & Zyda, 1990;
Vernadat, 2002b). BPM Systems literature suggests that some types of GPMs are better than others for
reducing information overload that users experience when working with multiple views of a process (Basu
& Blanning, 2000; Luqi et al., 1990; Vernadat, 2002b), but there is apparently no empirical research to
support these claims.
The fundamental issue in this study is which type of GPM technique facilitates better user
comprehension: a single modeling language to represent multiple views of a process (e.g., metagraphs)
(Basu & Blanning, 2000; van der Aalst, 2004) or a different modeling language for each different view of a
process (e.g., UML diagrams) (Eriksson & Penker, 2000; Vernadat, 2002b; Wand & Weber, 1993). Some
authors claim that when a single GPM modeling technique is used to model multiple types of BPI, users
have an easier time comprehending all the BPI portrayed. Basu and Blanning (2000) suggest that

Bret R. Swan Chapter 2 – Review of Literature
Page 51 of 420
metagraphs are easier to comprehend, because there are only a few symbols used to model multiple types of
business processes and BPI, compared to UML diagrams.
In contrast, several authors take the position that user comprehension is higher when different types
of BPI are portrayed with different types of GPMs (Eriksson & Penker, 2000; Vernadat, 2002b; Wand &
Weber, 1993). The principle of Ontological Completeness is an example of the latter position and provides
a theoretical perspective to investigate this issue.
The principle of Ontological Completeness states that there needs to be a direct relationship
between the design constructs used in GPMs and the ontological real-world constructs they represent (Wand
& Weber, 1993). From an Ontological Completeness perspective, design constructs are symbols, notations,
and semantics (i.e., GPM constructs) are used to explicitly map ontological (e.g., real-world) constructs.
Users interpret these design constructs according to the meanings of the ontological constructs in the real-
world from their individual points of view. Wand and Weber used the term ‘completeness’ to mean that a
graphical grammar (e.g., the GPMs used in this study) must contain “constructs that enable it to model any
real-world phenomenon in which a user is interested” (Wand & Weber, 1993, p. 220).
Therefore, ontologically speaking, once users are trained to read the symbols, they should be able to
comprehend the BPI portrayed in GPMs when there is a one-to-one relationship between the graphical
symbol and its meaning in the real-world (Wand & Weber, 1993). UML extensions designed for enterprise
modeling are examples of this principle. Each type of BPI is mapped using different sets of graphical
design constructs (symbols, semantics, notations, etc.). For example, activity diagrams use different
symbols for modeling task-centric BPI than class diagrams use for modeling resource-centric BPI (compare
Figures 2-4 to 2-5). Although proponents of UML expect it to take longer for users to learn to interpret the
various UML diagrams, once trained the principle of Ontological Completeness suggests that user
comprehension will be more accurate and timely than metagraphs (Wand & Weber, 1993) (see Figure 2-10
below).
This is because, from an ontological completeness point of view, metagraphs are expected to
produce just the opposite result – construct overload (see Figure 2-10). Metagraphs are expected to cause
construct overload because it uses the same set of symbols to represent multiple meanings in the real world.
For example, metagraphs use the same symbols to represent all types of BPI, whether task-centric, resource-
centric, or information-centric. Construct overload causes a user to have a difficult time comprehending the
real-world meanings of the graphical design constructs represented by the GPMs because each graphical

Bret R. Swan Chapter 2 – Review of Literature
Page 52 of 420
construct represents multiple meanings in the real-world. Therefore, metagraph user comprehension
outcomes are expected to be less desirable than the results for users of UML diagrams (see Figure 2-10
below). Although this is a logical argument, no empirical evidence has been found to support either of these
two positions.
Figure 2-10. Metagraph vs. UML diagrams and how they relate to the principle of Ontological Completeness12.
2.3.1.5 Hypotheses Concerning the Type of Graphical Process Model
Based on the theory of Ontological Completeness, it is hypothesized that UML diagrams will
produce more favorable GPM user comprehension outcomes than metagraphs.
Hypothesis 1: The type of graphical process model will significantly affect participants’ task performance (i.e., accuracy and timeliness), subjective mental workload, and self-efficacy.
Hypothesis 1.1: Participants using UML diagrams will produce significantly higher accuracy than participants using metagraphs.
Hypothesis 1.2: Participants using UML diagrams will produce significantly better timeliness time than participants using metagraphs.
Hypothesis 1.2: Participants using UML diagrams will experience significantly lower subjective mental workload than participants using metagraphs.
2-12 Adapted from Wand & Weber (1993). Used by permission.

Bret R. Swan Chapter 2 – Review of Literature
Page 53 of 420
Hypothesis 1.4: Participants using UML diagrams will experience significantly higher self-efficacy than participants using metagraphs.
2.3.2 Explicit BPM Knowledge Operationalized as the Type of Business Process Information
Research Question 2: How do different types of BPI influence user task performance, subjective
mental workload, and self-efficacy when interpreting graphical business process information?
When using BPM Systems, making good decisions requires managers to comprehend different
types of BPI portrayed by GPMs (Crosman, 2004; van der Aalst et al., 2003; Weske et al., 2004). For
example, Green and Roseman (2000) analyzed five different views of a business process and concluded that
the process-BPI view (what is referred to as the task-centric BPI view) alone is not enough to model all the
real-world constructs required in relation to BPM. This study compares three types of BPI necessary for
BPM (Basu & Blanning, 2000; Vernadat, 2002b):
• Task-centric BPI documents the sequential flow of business process activities so that BPM
systems can simulate, monitor, analyze, and control aspects of these business processes.
Relationships between tasks and their supporting resources and information elements can also
be displayed (see Figures 2-4 and 2-7).
• Resource-centric BPI depicts relationships between resources (i.e., physical, personnel, or
information-related resources). They also depict relationships between tasks and information
elements in order to show the impacts of resource allocation configurations on business
processes (see Figures 2-5 and 2-8).
• Information-centric BPI defines BPM documentation, information flows, data relationships,
and aid in checking completeness and correctness of BPI. They can also show the relationships
of information elements to resources and tasks (see Figures 2-6 and 2-9).
2.3.2.1 Type of Business Process Information and GPM User Comprehension
Nevertheless, a variety of research suggests that the type of BPI will affect GPM user performance
(Basu & Blanning, 2000; Vessey, 1991; Zhang, 1996b). For example, Relationship Informational Display
(RID) research states that better task performance will result when the information perceived from an

Bret R. Swan Chapter 2 – Review of Literature
Page 54 of 420
information display exactly matches the information required for task performance (Zhang, 1996b, 1997;
Zhang & Norman, 1994). For example, if users of information-centric BPI perform worse than users of
task-centric BPI, the RID perspective says that the reason for poor task performance is that there is a poor
match between the way information-centric BPI is portrayed and the BPI requirements of the task.
However, RID literature does not explain why the relation between the information and the task produces
good or poor performance.
2.3.2.2 Hypotheses Concerning the Type of Business Process Information
Based on the previous research, albeit limited, it is hypothesized that differences in the type of BPI
will produce more favorable GPM user comprehension outcomes. Specific sub-hypotheses are based more
on practical logic than prior research, because there was no specific research found that provide guidance for
these sub-hypotheses. Training on process flowcharts is a common element across all BPM manager
education and experience (to one extent or another). Thus, GPM portrayals of task-centric BPI is expected
to be more familiar to all participants, because task-centric BPI is interpreted to be similar to process
flowcharts. Regarding resource-centric BPI, the impacts of one resource on another is seldom modeled.
Thus, resource-centric BPI is hypothesized to be the least recognizable and most difficult for users to
comprehend. Information-centric BPI is hypothesized to be more familiar than resource-centric BPI,
because its graphical portrayal often resembles task-centric BPI diagrams but it is not interpreted in the same
way.
Hypothesis 2: The type of business process information will significantly affect participants’ task performance (i.e., accuracy and timeliness) and subjective mental workload13.
Hypothesis 2.1: Participants using GPMs portraying task-centric BPI will produce significantly higher accuracy compared to resource- or information-centric BPI. Hypothesis 2.2: Participants using GPMs portraying task-centric BPI will produce significantly better timeliness compared to resource- or information-centric BPI.
Hypothesis 2.3: Participants using GPMs portraying task-centric BPI will experience significantly lower subjective mental workload compared to resource- or information-centric BPI.
13 Self-efficacy was not measured within-subjects so it is not included in this hypothesis.
Bret R. Swan Chapter 2 – Review of Literature
Page 55 of 420
Hypothesis 2.4: Participants using GPMs portraying resource-centric BPI will experience significantly lower accuracy compared to task- or information-centric BPI.
Hypothesis 2.5: Participants using GPMs portraying resource-centric BPI will produce significantly worse timeliness compared to task- or information-centric BPI.
Hypothesis 2.6: Participants using GPMs portraying resource-centric BPI will experience significantly higher subjective mental workload compared to task- or information-centric BPI.
Hypothesis 2.7: Participants using GPMs portraying information-centric BPI will produce significantly higher accuracy compared to resource-centric BPI.
Hypothesis 2.8: Participants using GPMs portraying information-centric BPI will produce significantly better timeliness compared to resource-centric BPI.
Hypothesis 2.9: Participants using GPMs portraying information-centric BPI will experience significantly higher subjective mental workload compared to resource-centric BPI.
2.3.3 Tacit BPM Knowledge Operationalized as Different Types of User Educational Training
Research Question 3: How do different types of User Educational Training influence user task
performance, subjective mental workload, and self-efficacy when interpreting graphical business process
information?
Thus, this question seeks to understand the effect of tacit BPM knowledge on GPM user
comprehension. As described above, tacit knowledge can be acquired through both education and
experience but is difficult to express or document without specific situational cues (Hislop, 2002). Because
GPMs portray explicit BPM knowledge, GPMs are capable of only partially mapping the knowledge
necessary to manage business processes, especially when these processes become more dynamic and
knowledge-intensive (Gronau & Weber, 2004) (see Section 2.1.1). Consequently, BPM Systems can only
portray explicit BPM knowledge and do not portray tacit BPM knowledge. However, GPM comprehension
of BPI facilitates and stimulates users to apply their tacit knowledge to make BPM decisions (see Section
2.3.3). Therefore, BPM Systems are expected to facilitate user comprehension, irrespective of the type of
tacit BPM knowledge and educational training a manager may possess (Basu & Blanning, 2000; Light,
2005; Weske et al., 2004; zur Muehlen, 2004a):
“Senior executives need to understand what information elements are required and produced by a process and what resources are needed. Process managers need to
Bret R. Swan Chapter 2 – Review of Literature
Page 56 of 420
understand how the tasks in each workflow14 interact with each other through the information elements they use and produce. Information technology managers need to understand how information elements, tasks, and resources interact, so that effective operational and decision support systems can be designed.” (Basu & Blanning, 2000, p. 17) [emphasis added]
However, past research describes how differences in user tacit knowledge affect their comprehension of the
same information.
2.3.3.1 Schema Theory and GPM User Comprehension
Prior tacit and explicit knowledge significantly affects user comprehension outcomes because of
their cognitive schema and mental models. A schema, introduced by Bartlett (1932), are ‘‘mental
representations of general categories of objects, events, or people’’ (Bernstein, Roy, Skrull, & Wickens,
1991, p. 321). Schema theory also include knowledge structures used in human memory (Satzinger, 1998).
Piaget described schemas as the basic building blocks of knowledge, learning, and intellectual development
that people use to understand the world around them and suggests learning is achieved by forming new
schemas and building upon previous schemas (Piaget, 1983). He proposed that two processes that guide
learning: the creation of new schemas and the adaptation of existing schemas. According to Piaget, the
adaptation of schemas involves the incorporation of new information into existing schemas or the adaptation
of existing schemas to include new information that may not fit into existing schemas (Gruber & Gruber,
1977; Piaget, 1983). Schemas are interrelated, and multiple conflicting schemata can be applied to the same
situation.
People use their schemas to reduce the amount of effort they used to understand the situations they
experience. People quickly organize new perceptions into schemas and then use these schemas to act
effectively, almost automatically, with little mental effort. In cognition theory, this is referred to as
accessibility; meaning how easily and quickly a schema comes to mind. Accessibility is determined by
individual experience and expertise (Chalmers, 2003). For example, expert interpreters of GPMs will rely
on their schemas to quickly process and understand information portrayed by GPMs. Novice learners are
those who have little or no knowledge of a given topic or situation. Novice GPM users possess few
schemas that can aid them in user comprehension, therefore the mental workload they experience will be
2-14 In this instance, the term workflow refers to a single execution of an instance of a business process (Basu & Kumar, 2002). Thus,
when “workflow” is used in this study, it means essentially the same as the term “business process.”
Bret R. Swan Chapter 2 – Review of Literature
Page 57 of 420
high due to a much higher amount of cognitive effort to perceive and process GPM information and
organize it into new schemas.
Relating schema theory to this study means that an individual’s tacit knowledge related to BPM and
GPMs is expected to allow greater accessibility and application of an individual’s relevant schema.
Consequently, GPM user comprehension should produce higher accuracy, greater timeliness, lower mental
workload, and greater self-efficacy than those that cannot access or create relevant schemas. For example, a
manager with tacit knowledge in computer science and object modeling should comprehend information-
centric views of a business process more accurately, quickly, and efficiently than a manager without tacit
knowledge gained from computer science education.
2.3.3.2 Mental Models, Schema Theory, and GPM User Comprehension
Within these cognitive schemas, individuals develop specific mental models from their experiences
which they use to cognitively process and understand information in specific situations (Gentner & Stevens,
1983). Individuals instinctively rely on their mental models, as well as their cognitive schema, to
cognitively process information when making decisions and taking action when performing a new task.
Even though an individual may possess schemas that apply to a general topic or situation, without the
associated mental models, they will not be able to understand the specific complexities of different
situations. For example, novices may possess an understanding of the syntax of a programming language,
but without the associated mental models they will be unable to successfully understand complex concepts
or employ more difficult aspects of problem solving in their programming (George, 2000).
A mental model is an explanation of an individual’s thought process for how something works in
the real world (Gentner & Gentner, 1983; Gentner & Stevens, 1983; Norman, 1983). The concept of mental
models in relation to cognition was introduced by Craik (1943). He proposed that individuals use their
internal mental models of the external world to help them better understand and react to the situations they
encounter. Mental models are created by an individual’s interaction with external events in their life. Craik
suggests that people think, reason, or understand by manipulating internal symbolic representations and
translate them back into actions, or that they recognize relationships between their internal mental models
and external events. There are at least two bodies of research related to mental models: (1) mental models
concerned with analogy and insight problems involving classical syllogisms (Johnson-Laird, 1983) and (2)

Bret R. Swan Chapter 2 – Review of Literature
Page 58 of 420
mental models as theoretical constructs used to account for various aspects of behavior especially in novel
problem solving situations (Gentner & Gentner, 1983; Norman, 1983).
This research primarily concerned with mental models as a participant’s specific mental
representations, knowledge of processes, or complex tasks or systems related specifically to how to interpret
different types of GPMs which allows the participant to reason, predict and understand the particular GPM
syntax, GPM type, or business process (c.f. J. M. Carroll & Olson, 1987; Eysenck & Keane, 1990; George,
2000; Kieras & Bovair, 1984). As a result, more positive outcomes should result when an individual’s
schema and mental models are aligned with GPM user comprehension task requirements.
2.3.3.3 Prior Expertise and GPM User Comprehension
Several literatures report that individuals possessing specific tacit knowledge from prior education
or experience achieve higher levels of task performance than individuals without prior expertise (Shayo,
Olfman, & Teitelroit, 1999). For example, Agarwal, Sinha, and Tanniru (1996) found that prior experience
helped in developing solutions to object-oriented tasks, but did not have an impact on developing solutions
to process-oriented tasks (Agarwal et al., 1996; Morris et al., 1999). Several studies in the psychology of
programming literature report that when an individual had prior knowledge or experience in interpreting
different types of information, their task performance was improved (cf. Schneiderman et al., 1977; Sheil,
1981; Soloway, Ehrlich, & Bonar, 1982; Winslow, 1996). Several other experimental studies show prior
education and experience affects task performance in a variety of research topics, including educational
technologies (cf. Kalyuga, Ayres, Chandler, & Sweller, 2003; Moreno, 2002; Valcke & Dochy, 1992) and
HCI (cf. Decortis, Noirfalise, & Saudelli, 2000; Hollnagel, 1997; Marmaras & Kontogiannis, 2001; Morrow
et al., 2003; Postrel, 2002).
Literature describing just how “expert” users should be in UML or metagraphs is nonexistent.
Related literatures, such as operations research and the psychology of programming literatures, have
explored various ways to determine if someone is an expert or not. Winslow (1996) reviews research
related to determining the characteristics of novice vs. expert programmers. Shanteau, Weiss, Thomas, &
Pounds (2002) propose the use of the Cochran-Weiss-Shanteau survey instrument “in the absence of a gold
standard” for determining expertise in specific domains. Developing an approach to determine novice vs.
expert GPM users that includes specific BPM expertise characteristics may be of value in the future.

Bret R. Swan Chapter 2 – Review of Literature
Page 59 of 420
2.3.3.4 GPMs are Expected to Mitigate Differences in Prior Expertise
Wand and Weber (2002, p. 372) suggest that a goal of GPM techniques and training is to mitigate
expert-novice differences in user comprehension. This outcome may possibly result from GPMs being able
to validate both conceptual models and users conceptual schema at the same time (Fonseca, 2007).
Although apparently never studied, Wand and Weber’s (1993) theoretical assertions explain the mixed
results in prior GPM user comprehension research. In other words, the principle of Ontological
Completeness may explain why more variation in GPM user comprehension outcomes than differences
between user education and tacit knowledge.
2.3.3.5 Hypotheses Concerning the Type of User Educational Training
Despite Wand and Weber’s (1993; 2002) assertions, the preponderance of research on prior
expertise cannot be ignored. Therefore, Hypothesis 3 says there will be differences in user comprehension
between participants possessing different user educational training. In this study, tacit BPM knowledge is
operationalized as user educational training in a BPM-related general functional domain (e.g., industrial
engineering (IE), business management (MGT), or computer science (CS)). Participants with MGT
educational training are selected to approximate the education of senior executives’ and other business
managers and, as a result, approximate a major part of their management tacit BPM knowledge.
Participants with IE educational training are selected to approximate the education of process managers’
and, as a result, approximate a major part of their business process tacit BPM knowledge. Lastly,
participants with CS educational training are selected to approximate the education of IT managers and, as a
result, approximate their IT tacit BPM knowledge (see also Section 3.9.2.1).
Specific sub-hypotheses are based more on practical logic than previous research, because there was
no specific research on BPM-related GPM user educational training to provide guidance for these sub-
hypotheses. These sub-hypotheses propose that CS majors will perform more favorably than both IE and
MGT majors for several reasons. CS students are highly trained in mathematical modeling, which is the
fundamental difference between the formal GPMs used in BPM systems and traditional flowcharts. CS
students also receive training in information systems development, such as object-oriented programming
and database modeling, which should help them understand the resource and information-centric BPI
relationships being modeled in this study, regardless of which type of GPM they use.

Bret R. Swan Chapter 2 – Review of Literature
Page 60 of 420
In contrast to CS and IE student education, MGT students typically do not receive training in the
mathematical modeling of processes, information system development, object-oriented programming, or
database modeling. However, most MGT students have been exposed to traditional process flowcharting
techniques.
In contrast to MGT and CS students, IE students are highly trained and experienced in mathematical
modeling, particularly of business processes, but typically do not receive training or experience in
information systems development or database modeling-related knowledge. Therefore, it is hypothesized
that CS students will produce more positive user comprehension outcomes, followed by IE students. MGT
students will product the worst overall user comprehension outcomes. The following research hypotheses
are proposed to test the direct effects of user educational training on GPM user comprehension outcomes:
Hypothesis 3: The type of user educational training of participants will significantly affect participants’ task performance (i.e., accuracy and timeliness), subjective mental workload, and self-efficacy.
Hypothesis 3.1: Computer science majors will produce significantly higher accuracy compared to Industrial Engineering and Management majors.
Hypothesis 3.2: Computer science majors will produce significantly better timeliness compared to Industrial Engineering and Management majors.
Hypothesis 3.3: Computer science majors will experience significantly lower subjective mental workload compared to Industrial Engineering and Management majors.
Hypothesis 3.4: Computer science majors will experience significantly higher self-efficacy compared to Industrial Engineering and Management majors.
Hypothesis 3.5: Management majors will produce significantly lower accuracy compared to Industrial Engineering and Computer Science majors.
Hypothesis 3.6: Management majors will produce significantly worse timeliness compared to Industrial Engineering and Computer Science majors.
Hypothesis 3.7: Management majors will experience significantly higher subjective mental workload compared to Industrial Engineering and Computer Science majors.
Hypothesis 3.8: Management majors will experience significantly lower self-efficacy compared to Industrial Engineering and Computer Science majors.
Hypothesis 3.9: Industrial Engineering majors will produce significantly higher accuracy compared to Management majors.

Bret R. Swan Chapter 2 – Review of Literature
Page 61 of 420
Hypothesis 3.10: Industrial Engineering majors will produce significantly better timeliness compared to Management majors.
Hypothesis 3.11: Industrial Engineering majors will experience significantly lower subjective mental workload compared to Management majors.
Hypothesis 3.12: Industrial Engineering majors will experience significantly higher self-efficacy compared to Management majors.
2.4 INDIVIDUAL COGNITIVE DIFFERENCES AND USER COMPREHENSION
GPM user comprehension is influenced by individual cognitive differences between users that
impact how the BPM cognitive resources are mentally processed during user comprehension. Pearson et al.
(2002) said the consideration of social phenomena and human factors in modeling enterprise networks has
been neglected and must be considered. As a result, related literature, such as HCI and cognitive
ergonomics, often includes variables assessing individual cognitive differences based on IP theory and
cognitive psychology research.
This section reviews three primary types of individual cognitive differences between individuals
that cognitive science literature suggest can jointly influence user comprehension: mental workload,
cognitive styles, and cognitive abilities. Mental workload attempts to assess, subjectively or
physiologically, how taxing the mental processing of information is on a user when performing a task. The
cognitive styles of a user corresponds to personality-based filters that affect how a user cognitively
processes information. The cognitive abilities of a user corresponds to a variety of inherent and learned
cognitive and attentional abilities that affect an individual’s ability to cognitively process information.
2.4.1 Mental Workload, Task Performance, and the Yerkes-Dodson Law
Research Question 4: When interpreting graphical business process information, does the
relationship between user subjective mental workload and task performance follow the Yerkes-Dodson Law
(an inverted-U relationship)? This question investigates the relationship between mental workload, task
accuracy, and task timeliness in the context of BPM and BPM Systems.
Wickens (1992) defines workload as the relationship between task demand and the supplied
resources. According to Wickens’ definition, both task complexity and the type of cognitive resource can

Bret R. Swan Chapter 2 – Review of Literature
Page 62 of 420
be seen as elements of mental workload. When the information that is inputted to an individual’s mind
approaches or exceeds the limits of an individual’s cognitive capacity, the mental workload experienced by
the individual is increased and the individual manifests physical and psychological indicators (cf. Baddeley,
2003b; Braarud, 2001; Kirschner, 2002; Miyake, 2001; Paas, Tuovinen et al., 2003; Wickens, 1992).
2.4.1.1 Physiological Indicators of Mental Workload
Mental workload is used as both an indicator of cognitive processing load and an outcome of
comprehension. Often physiological indicators of mental workload are used to indirectly assess the
cognitive load a person experiences during task performance (Wilson & Russell, 2003). Physiological
mental workload indicators that are found in the literature include heart rate variability (Miyake, 1997),
blood pressure (Van Roon, Mulder, Althaus, & Mulder, 2004), respiration patterns (Wilson & Russell,
2003), perspiration (Miyake, 2001), finger plethysmogram amplitude (Miyake, 2001), electrodermal
assessments (Collet, Petit, Champely, & Dittmar, 2003), neurophysiological measures such as
electroencephalography (EEG) and electrocardiography (ECG) (Dussault, Jouanin, Philippe, & Guezennec,
2005), and eye movements related to the operator's blinking and fixation on regions of interests (Ha, Kim,
Lee, & Seong, 2006).
Physiological measures of mental workload have not proved consistently reliable (Miyake, 2001;
Rubio, Díaz, Martín, & Puente, 2004; Vitense, Jacko, & Emery, 2003). They have been shown to produce
inconsistent results when assessing mental workload (cf. Hart & Wickens, 1990; Miyake, 1997, 2001;
Vitense et al., 2003; Wickens, 1992; Wilson & Russell, 2003). Although sensitive to workload, Miyake
(1997) found heart rate variability, respiration patterns, and perspiration has not been found to be consistent
and reliable indicators of mental workload. On the other hand, Dussault (2005) asserted that
electrophysiological changes expressed variations in mental workload during different flight simulator
sequences. These inconsistencies are partly due to a variety of environmental and psychological factors that
can influence physiological indicators but they have little to do with mental workload. Additionally, results
of the task specific physiological responses are affected by individual characteristics like a Type A behavior
patterns (Miyake, 1997). Another disadvantage is that physiological measures cannot be easily administered
to a large number of people at one time (Yeung, Lee, Pena, & Ryde, 2000).

Bret R. Swan Chapter 2 – Review of Literature
Page 63 of 420
2.4.1.2 Subjective Indicators of Mental Workload
Subjective self-reports of mental workload are assessed immediately after task performance, where
individuals are asked to evaluate the mental workload they experience during task performance.
Assessments of subjective mental workload are generally accepted as being composed of multiple subscales
or dimensions (cf. Hart & Staveland, 1988; Paas, Tuovinen et al., 2003; Yeung et al., 2000):
• The task is highly mentally or physically demanding (cf. Hart & Staveland, 1988; Paas,
Tuovinen et al., 2003; Yeung et al., 2000).
• A high level of concentration or mental effort is required (cf. Fisher & Ford, 1998; Hart &
Staveland, 1988; Yeung et al., 2000).
• Time pressure in performing the task (cf. Fisher & Ford, 1998; Hart & Staveland, 1988;
Mullane & McKelvie, 2001; Yeung et al., 2000).
• Negative affect or frustration with the task (cf. Hart & Staveland, 1988; Yeung et al., 2000).
• Satisfaction with the individual’s task performance (cf. Dunn & Grabski, 2001; Hart &
Staveland, 1988; Reinig, 2003; Yeung et al., 2000).
A variety of subjective mental workload research is found in cognitive ergonomics literature (cf.
Braarud, 2001; Hart & Staveland, 1988; Miyake, 1997; Wickens, 1992). For example, the NASA Task
Load Index (TLX) (Hart & Staveland, 1988) has been used to assess subjective mental workload in several
contexts, including research on the use of mobile telephones while driving (Alm & Nilsson, 1995), radar
systems for air traffic control (Bierwagen, Eyferth, & Helbing, 1996), as well as, nuclear reactor simulation
or operational situations (Braarud, 2001). Another derivation of subjective mental workload is called
Cognitive Load Theory (cf. Kirschner, 2002; Paas, Tuovinen et al., 2003; Yeung et al., 2000) found
primarily in learning and educational technology literature.

Bret R. Swan Chapter 2 – Review of Literature
Page 64 of 420
Sensory Memory
Buffer
Short-term & Working Memories
Long-term Memory
Mental Workload = Cognitive Resources are Consumed Here
Cognitive Load = Encoding &
Transfer Here
Consciousness Exists Here
Tacit & Explicit Knowledge are
Stored Here
Sensory Memory
Buffer
Short-term & Working Memories
Long-term Memory
Mental Workload = Cognitive Resources are Consumed Here
Cognitive Load = Encoding &
Transfer Here
Consciousness Exists Here
Tacit & Explicit Knowledge are
Stored Here
Figure 2-11. How mental workload and cognitive load relates to cognitive memory stores.
Although related, subjective evaluations of mental workload and cognitive load assess and
influence different areas of memory and cognition (see Figure 2-11). Mental workload is associated with
the processing of cognitive resources in short-term and working memories (Hart & Wickens, 1990; Miyake,
2001). Cognitive load is associated with the encoding and transfer of tacit and explicit knowledge between
the short-term, working, and long-term memories (Kirschner, 2002; Paas, Renkl et al., 2003). This research
is focused on mental workload and not cognitive load.
Self-report measures of subjective mental workload constructs, such as the NASA-TLX, were
shown to be both valid and reliable (cf. Annett, 2002; Braarud, 2001; Collet et al., 2003; Hart & Wickens,
1990; Hill et al., 1992; Jung & Jung, 2001; Kirschner, 2002; Miyake, 2001; Moroney, Biers, & Eggemeier,
1995; Nygren, 1991; Paas, Tuovinen et al., 2003; Rubio et al., 2004; Vitense et al., 2003; Wickens, 1992;
Wickens & Carswell, 1995; Wilson & Russell, 2003). However, subjective mental workload assessments
can suffer from the disadvantages of self-report instruments and sometimes differences in statistical validity
results (Annett, 2002; Braarud, 2001; Hart & Wickens, 1990; Moroney et al., 1995; Rubio et al., 2004). As
a consequence, physiological assessments are often used in conjunction with subjective mental workload
assessments to triangulate and interpret results (cf. Ha et al., 2006; Lee & Liu, 2003; Miyake, 1997, 2001;
Vitense et al., 2003; Wickens, 1992).

Bret R. Swan Chapter 2 – Review of Literature
Page 65 of 420
2.4.1.3 The Yerkes-Dodson Law Relating Mental Workload and Task Performance
Research shows that mental workload and task performance (including task accuracy and task
timeliness) are distinct but interrelated constructs. For example, different individuals may experience
identical levels of task accuracy and timeliness when performing the same task, but the mental workload
they experience may differ considerably. Paas, Tuovinen, Tabbers, and Van Gerven (2003, p. 67) explains
this interrelationship:
“Within the limits of their cognitive capacity, learners can compensate for an increase in mental load (e.g., increasing task complexity) by investing more mental effort, thereby maintaining performance at a constant level. Consequently, the cognitive costs associated with a certain performance level cannot be consistently inferred from performance-based measures. Instead, the combination of measures of mental effort and performance can reveal important information about cognitive load, which is not necessarily reflected by performance and mental load measures alone.”
Although Paas et al. are proponents of Cognitive Load Theory, this quote describes the a generic
relationship between mental workload and performance that is better conceptualized as the Yerkes-Dodson
Law (Yerkes & Dodson, 1908).
C
B
A
Mental Workload
Task Performance
Low
High
Low HighMental
Workload
Task Performance
Low
High
Low High
C
B
A
Simple Task Difficult Task
C
B
A
Mental Workload
Task Performance
Low
High
Low HighMental
Workload
Task Performance
Low
High
Low High
C
B
A
Simple Task Difficult Task
Figure 2-12. Illustration how differences in task difficulty is conceptualized by the Yerkes-Dodson Law.
Introductory psychology textbooks describe the relationship between mental workload and task
performance as having an inverted-U relationship; commonly referred to as the Yerkes-Dodson Law
(Hancock & Ganey, 2003; Teigen, 1994; Winton, 1987). In general, the Yerkes-Dodson Law suggests that
an increase in mental workload is expected to create an increase in task performance. Reduced performance

Bret R. Swan Chapter 2 – Review of Literature
Page 66 of 420
is expected when mental workload exceeds the available cognitive capacities of the individual. For
example, a manager can compensate for increases in task complexity by applying greater concentration and
mental effort when performing a task, and consequently may achieve higher levels of task performance (see
A in Figure 2-12). When a manager reaches the limit of his or her mental capacity, the highest level of task
performance is reached. At this point, an optimal relationship exists where the lowest level of mental
workload an individual experiences produces the highest level of task performance without overwhelming
or underwhelming the individual (see B in Figure 2-12). After this point, a manager has exceeded his or her
mental capabilities and may feel overwhelmed or overloaded. Any increase in mental workload beyond this
optimal point produces a decrease in task performance despite applying greater attention or mental effort
(see C in Figure 2-12).
Figure 2-12 also demonstrates the effect of task difficulty on the relationship between mental
workload and task performance as conceptualized by the Yerkes and Dodson Law. When people perceive a
task as simple, a higher level of task performance can be achieved by exerting more mental workload.
However, when a task is perceived as difficult, the optimal level of task performance in achieved as a lower
level of mental workload. After this point, more mental effort only results in decreased levels of
performance. As a result, simpler tasks can achieve relatively higher levels of performance compared to
more difficult tasks.
Although widely accepted as a basic psychological relationship, empirical research has not reliably
supported the Yerkes-Dodson relationship (Broadhurst, 1959; Teigen, 1994). For example, Fisher and Ford
(1998) finds subjective mental workload subscales as strong predictors of time on task and learner outcomes
(including accuracy). On the other hand, Rose et al.’s (2002) study of vigilance tasks15 concludes that
subjective mental workload and task performance do not always relate to one another (a finding also
supported by several studies Rose et al. (2002) cite). This lack of support for the Yerkes-Dodson law was
not entirely unexpected. Teigen’s (1994) historical analysis found that the original Yerkes and Dodson
research has been adapted over the last century to fit the needs of various researchers while often
disregarding or ignoring the fundamental constructs Yerkes and Dodson originally studied. Teigen (1994, p.
543) traced the history of the Yerkes-Dodson law from its inception in 1908 until the present, summarizing
their findings in this way:
2-15 A “vigilance task” is a task that requires sustained, concentrated attention over time to complete (Rose et al., 2002).

Bret R. Swan Chapter 2 – Review of Literature
Page 67 of 420
“These reanalyses underscore the discrepancy between the schematic, idealized textbook presentations of the [Yerkes-Dodson] ‘law’, and its more messy empirical and historical basis.”
Most authors citing Yerkes’ and Dodson’s research have altered the meaning of the original variables and
excluded task difficulty as a key factor (Broadhurst, 1959; Teigen, 1994). As a result, the so-called Yerkes-
Dodson, inverted-U relationship has primarily come to be more of a simplified tool for communicating
psychological relationships than an empirically verifiable psychological “law.”
Nevertheless, the Yerkes-Dodson Law is well-established in cognitive ergonomics and cognitive
psychology literature. No alternative theory was found; therefore, this study will test this relationship to
extend this concept to BPM Systems and add more empirical evidence that either asserts or refutes its
applicability to GPM user comprehension research.
2.4.1.4 Hypotheses Relating Subjective Mental Workload to User Comprehension Outcomes
These hypotheses test the Yerkes-Dodson Law in the context of GPM user comprehension. Both
measures of task performance in this study (accuracy and timeliness) are hypothesized to produce an
inverted-U relationship when graphed against NASA TLX assessments (Hart & Staveland, 1988) of
subjective mental workload.
Hypothesis 4: Participants’ subjective mental workload will significantly affect task performance (i.e., task accuracy and timeliness) in inverted-U relationships (in accordance with the Yerkes-Dodson Law).
Hypothesis 4.1: Low subjective mental workload will be associated with low accuracy.
Hypothesis 4.2: Moderate subjective mental workload will be associated with high accuracy.
Hypothesis 4.3: High subjective mental workload will be associated with low accuracy.
Hypothesis 4.4: Low subjective mental workload will be associated with low timeliness.
Hypothesis 4.5: Moderate subjective mental workload will be associated with high timeliness.
Hypothesis 4.6: High subjective mental workload will be associated with low timeliness.
2.4.2 Subjective Mental Workload and Self-Efficacy

Bret R. Swan Chapter 2 – Review of Literature
Page 68 of 420
Research Question 5: When interpreting graphical business process information, how does user
subjective mental workload relate to their self-efficacy after task completion?
As more and more users utilize BPM Systems, user self-confidence in interpreting formal GPMs is
important to take into account. Therefore, the relationship between self-efficacy and subjective mental
workload is important to study in the context of GPM user comprehension tasks.
2.4.2.1 Self-Efficacy
Most self-efficacy research is based on Social Cognitive Theory (Bandura & Locke, 2003; Wood &
Bandura, 1989). Self-efficacy is defined by Bandura (1986, p. 391) refers to:
“People's judgments of their capabilities to organize and execute courses of action required to attain designated types of performances. It is concerned not with the skills one has but with the judgments of what one can do with whatever skills one possesses.”
Self-efficacy has been studied as an antecedent, mediator, and outcome of such dependent variables as
anxiety, task performance, outcome expectancy, and computer usage (cf. Bandura & Locke, 2003;
Compeau, Higgins, & Huff, 1999; Fagan, Neill, & Wooldridge, 2003; Marakas, Yi, & Johnson, 1998; Ryan,
Bordoloi, & Harrison, 2000; Wood & Bandura, 1989). “People with strong self-efficacy beliefs exert
greater efforts to master a challenge while those with weak self-efficacy beliefs are likely to reduce their
efforts or even quit.” (Staples, Hulland, & Higgins, 1999, p. 759). Consequently, self-efficacy is considered
an outcome of user comprehension, as well as an antecedent of task performance.
2.4.2.2 Self-Efficacy is Highly Task-Specific
Self-efficacy refers to what a person perceives their capabilities to be with regard to a specific task
(Marakas et al., 1998). Self-efficacy is highly task or context-specific (Staples et al., 1999). For example,
Staples et al. (1999) empirically concludes that there is a difference between remote work self-efficacy vs.
information technology self-efficacy. Wood, Atkins, & Tabernero (2000) study asserted that there are
distinctive differences between information search efficacy and information processing efficacy on complex
tasks. However, no research has studied GPM user comprehension self-efficacy or self-efficacy in the
context of BPM. Consequently, no self-efficacy instrument exists for use in this study.

Bret R. Swan Chapter 2 – Review of Literature
Page 69 of 420
2.4.2.3 Self-Efficacy as an Outcome of Mental Workload
Self-efficacy literature discusses antecedents of self-efficacy that directly relate to subjective mental
workload constructs and provides a basis for establishing a conceptualizing self-efficacy in the context of
GPM user comprehension tasks. Self-efficacy has been studied as an antecedent or mediator of such
dependent variables as anxiety, task performance, outcome expectancy, and computer usage (Bandura &
Locke, 2003; Compeau et al., 1999; Fagan et al., 2003; Marakas et al., 1998; Ryan et al., 2000; Wood &
Bandura, 1989). Although, apparently no research has explicitly studied subjective mental workload as an
antecedent to self-efficacy, several studies have shown specific antecedent relationships between self-
efficacy and emotional arousal (i.e., stress, anxiety) that is associated with mental workload (Fagan et al.,
2003; Staples et al., 1999). For example, Bandura’s Social Cognitive Theory listed several antecedents or
correlates of self-efficacy that are directly related to the subjective mental workload constructs discussed in
Section 2.4.1 (Bandura, 1986; Hart & Staveland, 1988; Johnson & Marakas, 2000; Staples et al., 1999):
• Anxiety is associated with the TLX construct frustration.
• Outcome expectancy is associated with TLX perception of performance.
• Physical load is associated with TLX physical demand.
• Mental effort is associated with self-efficacy.
Only the TLX mental workload constructs relating to mental demand and temporal demand are not
explicitly linked to self-efficacy in previous literature. It is logical that mental demand and temporal
demand are not antecedents of self-efficacy because they are defined as originating from the nature of the
task itself instead of from an individual’s perception of their capabilities (Hart & Staveland, 1988).
Therefore, it is reasonable to hypothesize that TLX subjective mental workload subscales are antecedents of
GPM user self-efficacy in this study.
Because participants in this study are university students, with no prior task-specific BPI
comprehension experience, there is no basis to determine users’ prior GPM self-efficacy. In order to
establish a baseline for future GPM self-efficacy research, this experiment explores the antecedents of GPM
self-efficacy.

Bret R. Swan Chapter 2 – Review of Literature
Page 70 of 420
2.4.2.4 Hypotheses Relating Subjective Mental Workload to Self-Efficacy
Based on the literature reviewed, it is reasonable to expect that improved BPM should result if
managers increase their self-efficacy about their abilities to interpret different types of BPI portrayed by
GPMs. Therefore, participants who experience higher or negative subjective mental workload, are
expected to experience lower GPM user comprehension self-efficacy.
Hypothesis 5: Participants’ subjective mental workload will significantly and negatively affect self-efficacy results.
2.4.3 Cognitive Styles and User Comprehension
Research Question 6: How do user cognitive styles affect the subjective mental workload they
experience when interpreting graphical business process information?
Cognitive science literature suggests that mental workload and task performance will vary
according to differences in user cognitive styles (Garner, 2002; Myers & Myers, 1995). Cognitive styles
have been defined as “consistent individual differences in preferred ways of organizing and processing
information and experience” (Sadler-Smith, 2001, p. 610). They are often described as different dimensions
of human personality (Gardner & Martinko, 1996; Myers & Myers, 1995).
Cognitive styles act as filters people use when perceiving and cognitively process information.
They represent a “bridge between two fairly distinct areas of psychological investigation: cognition and
personality” (Sternberg & Grigorenko, 1997, p. 700). They are considered primarily genetically-based
rather than experience-based, and consequently, are less affected by practice and experience than an
individual’s cognitive abilities (Gardner & Martinko, 1996; Moreno, 2002; Myers & Myers, 1995; Sadler-
Smith, 2001). Cognitive styles are used in several literatures to explain or predict behaviors and
performance in areas such as social information processing (Edwards, Lanning, & Hooker, 2002), telework
(Barkhi, 2002), job performance (Gardner & Martinko, 1996), and decision support systems (Davis &
Elnicki, 1984). Thus, it is important to include cognitive styles in this study so that the impact of BPM
cognitive resources on user comprehension outcomes can be better understood. Two general cognitive
styles are of interest in this study: (1) how users prefer to cognitively interact with the world around them
(i.e., the extroversion vs. introversion), and (2) how users prefer to perceive information (i.e., the sensing vs.
intuition dimension).
Bret R. Swan Chapter 2 – Review of Literature
Page 71 of 420
2.4.3.1 Cognitive Style: Extraversion vs. Introversion
The cognitive style of extroversion vs. introversion has been studied in the psychology literature for
a number of years primarily based on self-report data. Individuals’ who are extroverts tend to be motivated
by stimuli external to their own mind and tend to not be as easily mentally overloaded by information as
introverts. In contrast, individuals who are introverts seek stimuli from within their own mind and tend to
be more easily mentally overloaded when processing information than extroverts (Garner, 2002; Myers &
Myers, 1995).
Extrovert vs. introvert tendencies have been found to display some measure of biological and
psychological validity (Gardner & Martinko, 1996). Biological research in cognitive science shows a direct
link between extroversion-introversion and brain biology. Neuroscience and cognitive psychology literature
has identified two independent motivational systems that exist within the human brain. These two
motivational systems, the Behavioral Activation System (BAS) and the Behavioral Inhibition System (BIS),
are based on Gray’s personality model and describe appetitive or aversive behavior in individuals (J. A.
Gray, 1981, 1987; J. R. Gray & Burgess, 2004). The BAS is activated by conditioned signals or perceptions
of reward and nonpunishment that result in outputs such as enhancement of arousal, an inhibition toward
ongoing behavior, and a redirection of attention toward relevant environmental stimuli. The BIS is activated
by conditioned signals or perceptions of punishment or nonreward that promote suppression of
inappropriate behavior, facilitation of stimulus analysis, and enhanced response selection. All people
possess both motivational systems to some extent over and above other individual differences (cf. Avila,
2001; J. A. Gray, 1972, 1981, 1987; J. R. Gray & Burgess, 2004). Additionally, recent neurobiological
evidence has linked people with an overactive BAS and/or an underactive BIS to positive affect and
extroversion. Conversely, people with an overactive BIS and/or an underactive BAS have been linked to
negative affect and introversion (cf. Chi et al., 2005; Gable, Reis, & Elliot, 2000; J. R. Gray et al., 2005;
Hewig, Hagemann, Seifert, Naumann, & Bartussek, 2006; Jorm et al., 1999; Sutton & Davidson, 1997).
Psychological research has produced years of subjective, self-report data collection, and analysis
that have shown individuals whose extrovert-introvert cognitive styles exhibit consistent behavioral
tendencies in task performance (cf. Gardner & Martinko, 1996; Myers & Myers, 1995; Wheeler, Jessup, &
Martinez, 2002). On the one hand, Myers-Briggs Type Indicator (MBTI) research (Myers & Myers, 1995)
conceptualizes extroversion-introversion as two ends of a single dimension, and states that under conditions

Bret R. Swan Chapter 2 – Review of Literature
Page 72 of 420
of stress, extroverts experience lower mental workload and become more cognitively overloaded later than
introverts (Gardner & Martinko, 1996). Introverts tend to approach new tasks from a holistic perspective,
while extroverts tend to take on new tasks in manageable parts, one step at a time. Thus, extroverts are
more easily overwhelmed by large amounts of information than introverts.
BPM managers who are extroverts may not like GPM user comprehension tasks, but they may
perform better than introverts because they typically approach the task in small pieces, one step at a time,
rather than try to holistically understand it as introverts tend to do. However, extroverts may be more easily
overwhelmed than introverts at the same task, because of the large amount of information they have to
process in order to answer a user comprehension question. Because of these contradictory tendencies
related to GPMs, it is difficult to predict the specific ways in which cognitive styles will influence GPM user
comprehension.
The BAS/BIS literature suggests that participants high on introversion should experience higher
subjective mental workload in user comprehension tasks. When faced with large quantities of information
and the complexity of the GPM user comprehension task, they should experience a negative stimulus and
their BIS should be activated. Participants with higher MBTI extrovert scores are expected to be less
overwhelmed than introverts; activating their BIS to a lesser degree than introverts and experiencing less
subjective mental workload on the same experimental task. This is in part because extroverts only seek to
understand enough information to answer the immediate question and also because their BIS does not
activate as quickly as introverts.
2.4.3.2 Cognitive Style: Sensing vs. Intuition
Cognitive style describes how individuals prefer to input and process the information they perceive.
MBTI research conceptualizes cognitive style as a continuous scale of one dimension with two ends:
sensing and intuitive. Individuals scoring high on the sensing end of the dimension prefer to process
information for decision-making through their five senses. Also, as long as detailed information is
available, sensors will tend to be more confident and take more time compared to intuitives (Gardner &
Martinko, 1996; Myers & Myers, 1995; Wheeler et al., 2002). Individuals scoring high on the intuitive end
of the scale prefer to use their intuition to process information. Sensors prefer operational level of decision-
making tasks that are structured, routine, systematic, logical, and analytical compared to intuitives (cf.
Gardner & Martinko, 1996; Myers & Myers, 1995; Wheeler et al., 2002).
Bret R. Swan Chapter 2 – Review of Literature
Page 73 of 420
According to Gardner and Martinko’s (1996) review of the MBTI literature, research on the sensing
vs. intuition cognitive style has produced mixed results. On the one hand, participants with MBTI scores
leaning toward sensing are expected to expend less subjective mental workload than intuitives in learning
tasks. This is because sensors only try to comprehend enough information to answer each individual
question, tended to lose or ignore details when overwhelmed with information, and are less frustrated with
losing details when overwhelmed with information (cf. Barkhi, 2002; Gardner & Martinko, 1996; Myers &
Myers, 1995; Rubio et al., 2004). Participants scoring higher on the MBTI intuitive scale experience more
subjective mental workload than participants scoring higher in sensing, because intuitives are less
overwhelmed with the amount of information on the GPMs as they try to holistically gather and understand
all of the information presented (cf. Barkhi, 2002; Gardner & Martinko, 1996; Myers & Myers, 1995; Rubio
et al., 2004).
On the other hand, intuitives are expected to expend less mental workload, because they prefer
graphically-oriented information (i.e., GPMs) while sensors prefer raw data (Gardner & Martinko, 1996).
Participants with MBTI scores leaning toward the intuitive dimension should prefer abstract summaries that
stress possibilities. They also try to holistically gather and understand more information than is necessary to
answer a user comprehension question (cf. Barkhi, 2002; Gardner & Martinko, 1996; Myers & Myers,
1995; Rubio et al., 2004). These examples illustrate the mixed results that MBTI research has produced
related to GPM user comprehension.
2.4.3.3 Hypotheses Relating Cognitive Styles to Subjective Mental Workload
Due to the lack of cognitive style research related to GPM user comprehension in the context of
BPM Systems, hypotheses are developed based on the BAS/BIS literature and the MBTI research described
in the previous section.
Hypothesis 6: Participants’ cognitive styles will significantly affect the subjective mental workload they experience during task performance.
Hypothesis 6.1: Participants’ scoring high on the cognitive style of extroversion will experience significantly lower subjective mental workload than participants scoring high on introversion.
Hypothesis 6.2: Participants’ scoring high on the cognitive style of sensing will experience significantly lower subjective mental workload than participants scoring high on intuition.

Bret R. Swan Chapter 2 – Review of Literature
Page 74 of 420
2.4.4 Cognitive Abilities and User Comprehension
Cognitive abilities refer to an individual’s intellectual abilities and mental aptitudes that affect
learning and the ability to manipulate different types of information (Bowman, Markham, & Roberts, 2001;
Jensen & Weng, 1994; Schmidt, 2002; Woodcock, 1990, 2002). Cognitive abilities act as mental tools
people use to control or manage the cognitive processing of information when performing a task (Goldstein,
Yusko, & Nicolopoulos, 2001; Hartmann, Sunde, Kristensen, & Martinussen, 2003; Schmidt, 2002;
Woodcock, 2002). An individual’s cognitive abilities are affected to a greater extent by practice and
experience than the cognitive styles of the individual. Using the cognitive ‘onion’ analogy mentioned in
Section 2.2.3.2, cognitive abilities are conceptualized as another layer further out from the “core” of the
cognitive “onion” than the cognitive styles layer. Cognitive abilities bridge the gap between cognitive styles
and what Sadler-Smith (2001) refers to as learning styles.
Several different types of cognitive abilities have been studied. For example, an individual’s ability
to learn (cf. Bowman et al., 2001; Jensen & Weng, 1994; Schmidt, 2002; Schmidt & Hunter, 2004;
Woodcock, 2002) or to focus attention during learning or performing a task (Crawford, Brown, & Moon,
1993; Lyons & Crawford, 1997; Schmidt, 2002; Yeung et al., 2000). Consequently, the two types of
cognitive abilities included in this study are users General Cognitive Abilities (GCA), a broad assessment of
users’ cognitive aptitudes that affect their ability to learn, and their attentional abilities.
2.4.4.1 General Cognitive Abilities and User Comprehension
Research Question 7: How do user general cognitive abilities affect the subjective mental workload
they experience when interpreting graphical business process information?
Recent literature organize various cognitive abilities into nine broad categories and more than sixty
narrow cognitive aptitudes of thinking abilities, acquired-knowledge abilities, and cognitive efficiencies that
an individual may possess (Woodcock, 2002). Salgado et al. (2003, p. 1068) define GCA as “any measure
that combines two, three, or more specific aptitudes, or any measure that includes a variety of items
measuring specific abilities (e.g., verbal, numerical, spatial).” Examples of different GCA assessments
include compilation tests, such as the Wonderlic Personnel Test (WPT), Otis Employment Test, Raven’s
Progressive Matrices Test, and the Wechsler Adult Intelligence Scale. Examples of other specific tests on
narrow cognitive aptitudes combined into a single test battery of tests include the General Aptitude Test

Bret R. Swan Chapter 2 – Review of Literature
Page 75 of 420
Battery, Differential Aptitude Tests, or the Primary Mental Aptitude Tests (Salgado et al., 2003; Schmidt,
2002). The theories on which most GCA assessments are based include Cattell-Horn-Carroll (CHC)
three-stratum theory of intelligence, the general factor of intelligence (also referred to as “g”), and the
Intelligence Quotient (IQ) theory (Jensen & Weng, 1994; Woodcock, 2002).
Cognitive and industrial psychology literature contains a large body of empirical research reporting
how GCA affects learning (Bowman et al., 2001; Woodcock, 2002) and task performance (Schmidt, 2002;
Schmidt & Hunter, 2004). For example, Eyring, Johnson, and Francis (1993, p. 810) found that GCA (as
assessed by the WPT) significantly predict the learning-rate constant, meaning that, for every unit of
change in GCA, there is a 0.19 increase in the learning-rate constant. In other words, those subjects with
higher GCA took longer to achieve the same percentage of performance increase than those subjects with
low ability. Subjects with high GCA scores learned faster and reported higher self-efficacy than those
with low GCA scores. In general, individuals with higher GCA experience lower mental workload and
higher task performance than individuals with low GCA (cf. Edinger, Shipley, Watkins, & Hammett, 1985;
Jensen & Weng, 1994; Salgado et al., 2003, p. 1068; Schmidt, 2002; Schmidt & Hunter, 2004; Woodcock,
2002).
However, given the above discussion of the relationship between mental workload and task
performance, and the fact that cognitive abilities affect the processing of information, the relationship
between cognitive abilities and task performance is indirect. According to IP theory, cognitive abilities
should directly impact an individual’s mental workload (see Figure 2-12 in Section 2.4.1.3 above), but no
research was found that has studied this relationship. No research was found that assessed GCA in the
context of BPM and BPM Systems. Therefore, GCA is assessed in this study to determine its effects on
mental workload in GPM user comprehension tasks.
2.4.4.2 Hypotheses Relating General Cognitive Abilities to Subjective Mental Workload
According to the research reviewed, the GCA of BPM managers is important to include in GPM
user comprehension research. BPM Systems literature indirectly indicates that GPMs are expected to
facilitate user comprehension irrespective of the cognitive abilities a manager may possess (cf. Basu &
Blanning, 2000; Light, 2005; Weske et al., 2004; zur Muehlen, 2004a). However, prior research on
cognitive abilities suggests that participants with high GCA should experience less mental workload and,
consequently, improve their task performance, compared to participants with lower GCA. Therefore, this

Bret R. Swan Chapter 2 – Review of Literature
Page 76 of 420
hypothesis explores whether general cognitive abilities (GCA), as assessed by the Wonderlic Personnel Test
(WPT), affects the subjective mental workload users experience during GPM use.
Hypothesis 7: Participants with high general cognitive abilities will experience significantly lower subjective mental workload.
2.4.4.3 Attentional Abilities and User Comprehension
Research Question 8: How do user attentional abilities affect the subjective mental workload they
experience when interpreting graphical business process information?
Whether an individual is able to pay attention and not get distracted during task performance is
another important cognitive ability (cf. Aks & Coren, 1990; Crawford et al., 1993; Lens & de Volder, 1980;
Teigen, 1994). For example, Aks and Coren (1990) assess the effects of individual differences in
attentional focus on measures of different cognitive abilities using 272 university undergraduates. They
found that highly distractible students scored an average of 9.4 percentile points lower than low-
distractible students on assessments of narrow cognitive aptitudes. This study suggests that attentional
abilities are an important facet of measured intelligence.
Several different attentional abilities are considered independent of GCA (Lyons & Crawford,
1997; Yeung et al., 2000). Crawford et al. (1993) identifies four cognitive abilities related to an individual’s
ability to focus attention and ignore distractions in both single and dual task situations:
1. Moderately focused attention refers to an individual’s perceived ability to sustain moderately
focused attention despite being surrounded by and aware of distractions.
2. Extremely focused attention assesses an individual’s perceived tendency to engage one’s total
attention to a task without being aware of outside stimuli and distractions.
3. Dual attention to cognitive-cognitive tasks assesses an individual’s ability to focus their attention
while performing two cognitive tasks simultaneously.
4. Dual attention to cognitive-physical tasks assesses an individual’s ability to focus their attention
while performing a cognitive task and a physical task simultaneously.
Several studies found that when individuals are not motivated to perform a task (e.g., they are
distracted, overwhelmed, or do not feel challenged by the task) they most likely exert less attentional control
and mental effort (Lens & de Volder, 1980; Teigen, 1994). Consequently, these individuals experience a

Bret R. Swan Chapter 2 – Review of Literature
Page 77 of 420
subsequent decrease in task performance and, possibly, higher mental workload (Lyons & Crawford, 1997;
Yeung et al., 2000). In contrast, other studies show that individuals who can easily focus their attention on a
task can experience lower mental workload and improve task performance (Crawford et al., 1993; Lyons &
Crawford, 1997). Therefore, the attentional abilities of the participants are expected to impact the subjective
mental workload they experience during GPM user comprehension.
2.4.4.4 Hypotheses Relating Attentional Abilities to Subjective Mental Workload
Attentional abilities have not been considered in the GPM user comprehension research. This study
will evaluate the effect of participants’ attentional abilities on the subjective mental workload they
experience during GPM use. Therefore, individuals reporting higher abilities to focus their attentional
resources (i.e., higher DAPI scores) will experience less mental workload, and, consequently, more
favorable task performance than individuals with lower DAPI scores.
Hypothesis 8: Participants scoring high on attentional abilities will experience significantly lower subjective mental workload during task performance.
Hypothesis 8.1: Participants’ that score high on moderate-focus attentional abilities will experience significantly lower subjective mental workload.
Hypothesis 8.2: Participants’ that score high on extreme-focus attentional abilities will experience significantly lower subjective mental workload.
Hypothesis 8.3: Participants’ that score high on dual cognitive-cognitive task focus attentional abilities will experience significantly lower subjective mental workload.
Hypothesis 8.4: Participants’ that score high on dual cognitive-physical task focus attentional abilities will experience significantly lower subjective mental workload.
2.4.4.5 A Theoretical Framework is Needed to Study GPM User Comprehension
It follows from this review of the literature that, conceptually, users of BPM Systems must interpret
and apply BPM cognitive resources, facilitated by GPMs, to make BPM decisions. Users cognitively
process and interpret these BPM cognitive resources via their cognitive reasoning and perceptual abilities
(i.e., cognitive differences between individuals) thus producing outcomes of user comprehension (see Figure
2-13).

Bret R. Swan Chapter 2 – Review of Literature
Page 78 of 420
Figure 2-13. Conceptual relationships between BPM cognitive resources and individual differences affecting GPM user comprehension.44
2.5 THEORETICAL FRAMEWORKS TO INTEGRATE HYPOTHESES RELATED TO GPM USER
COMPREHENSION
A problem with the hypotheses in this study is that no conceptual or empirical research was found
that takes into account all the BPM cognitive resources and individual cognitive differences that affect GPM
user comprehension outcomes in this study. Additionally, no single theory or theoretical framework was
found that has been used to guide empirical GPM user comprehension in the context of BPM and BPM
Systems. The previously reviewed theoretical relationships are limited in their ability to account for and
include all the variables of interest in this study.
2.5.1 The Need for a Theoretical Framework for GPM User Comprehension Research
2.5.1.1 Limitations of Related Literature
The literature reviewed in relation to this study suffers from several weaknesses. First, several
theoretical perspectives applicable to GPM user comprehension take into account variations in different
cognitive resources, but they do not account for influences of cognitive psychological factors (e.g., like
those related to IP theory), such as the Cognitive Fit Model (Sinha & Vessey, 1992; Vessey, 1991) and
Relational Informational Display studies (Zhang, 1996b; Zhang & Norman, 1994) (discussed in Section
2.3.1),. Nor do these theoretical perspectives specifically explain or predict why variations in cognitive
resources affect or do not affect task performance.
As mentioned earlier, contextual factors are not typically accounted for in IS research. In their
review of research on conceptual modeling and IS research, Wand and Weber (2002, p. 372) state that
several individual contextual factors have received little attention in IS research related to GPM user
comprehension: including expert-novice differences, cognitive abilities, cognitive complexities, cognitive

Bret R. Swan Chapter 2 – Review of Literature
Page 79 of 420
styles, and context-specific issues. They recommend these factors be included in future IS research
agendas. They specifically recommend that future research include the impact of the types of GPMs,
differences in user cognitive abilities, and differences in user cognitive styles. Also that future research
should seek understand how modeling techniques can be used to mitigate expert-novice differences in GPM
user comprehension.
Although theoretical relationships can be found to individually account for all the factors of interest
in this study, no theoretical framework was found that integrates and accounts for relationships between all
the factors proposed as necessary for this research. The related literature reviewed in relation to this study
lacks a coherent underlying theoretical framework because (1) it is fragmented in terms of sub areas and
theoretical approaches, and (2) much of this literature has difficulty finding a connection between simple
cognitive psychology theory and practical guidelines. For example, HCI research has approached the
problem by studying successful solutions in an effort to understand why they are successful. But, for the
most part, this research is unable to provide guidance on how successful HCI should be developed (Kuutti,
1995). “The guide-lines then are usually derived from practical experience and there is no connecting
background model behind them” (Kuutti, 1995, p. 18). In recent years, there has been a concerted effort to
develop, adapt, and apply theory to overcome this shortcoming.
To address this need, a good deal of related literature borrows IP theory from cognitive science.
Although IP theory accounts for variations in individual cognitive differences, it does not provide a
theoretical framework that can account for variations in cognitive resources (see Section 2.5.1.2). In recent
years, IP theory has received a great deal of criticism in the HCI, cognitive ergonomic, and cognitive science
literature.
2.5.1.2 Limitations of IP Theory in Studying GPM User Comprehension
IP theory has several limitations that make it inadequate as a guiding theoretical framework for
studying GPM user comprehension. As originally applied in the cognitive psychology literature, IP theory
defines a cognitive system as limited to the mind of an individual (Boland et al., 1994; Hollan et al., 2000;
Hutchins, 1995). Thus, IP theory cannot account for the impact of variations in cognitive resources, because
it was designed to model and explain the individual cognitive differences and mental processes going on
within the mind of an individual (Madhavan & Grover, 1998; Wright et al., 2000; Zhang, 1996a). Another
limitation is that IP theory is not designed to account for variations in the quality of knowledge resources

Bret R. Swan Chapter 2 – Review of Literature
Page 80 of 420
(i.e., tacit and explicit BPM knowledge) that affect user comprehension (Marmaras & Kontogiannis, 2001;
Wright et al., 2000). In summary, IP theory cannot account for how individuals offload information to
external representations (i.e., information artifacts such as GPMs) when performing user comprehension
tasks (Hollan et al., 2000; Norman, 2002; Perry, 2003).
2.5.1.3 Characteristics Needed in a Theoretical Framework for HCI User Comprehension
A user comprehension theoretical framework is needed that provides direction for integrating
differing variables and theoretical relationships into a cohesive research model. This framework must
account for variations in cognitive resources, i.e., tacit and explicit BPM knowledge as well as information
artifacts. This framework must also incorporate relationships between individual cognitive differences from
IP theory and cognitive psychology that affect user comprehension. For example, this means the integrative
framework must incorporate the affects of mental workload, cognitive styles, and cognitive abilities on user
comprehension outcomes. The framework must be able to be adapted to different cognitive tasks and
contexts. This framework can then be used to map and compare past research as well as guide future
research.
2.5.2 Theoretical Perspectives to Guide Development of the Theoretical Framework
These issues and constraints have provided recent impetus for development of the HCI theoretical
perspectives known Activity Theory (Kuutti, 1995; Leont'ev, 1974; Nardi, 1998) and Distributed Cognition
theory (Hollan et al., 2000; Hutchins, 1995; Norman, 1988). Activity Theory and Distributed Cognition
theory account for both cognitive resources and individual cognitive differences, and therefore, can provide
a theoretical basis on which to develop a conceptual theoretical framework and operational research model
that integrates the variables and relationships relevant to this research.
2.5.2.1 Activity Theory
Activity Theory (AT) originated in the former Soviet Union and referred to a cultural-historical
research tradition that explored the relationships between activities, objects, subjects, tools, and outcomes
over time (cf. Kuutti, 1995; Leont'ev, 1978, 1989; Nardi, 1998). AT is not interested in “activities” in
general, nor is it a well-defined operational “theory” in the classic scientific tradition (Kuutti, 1995).
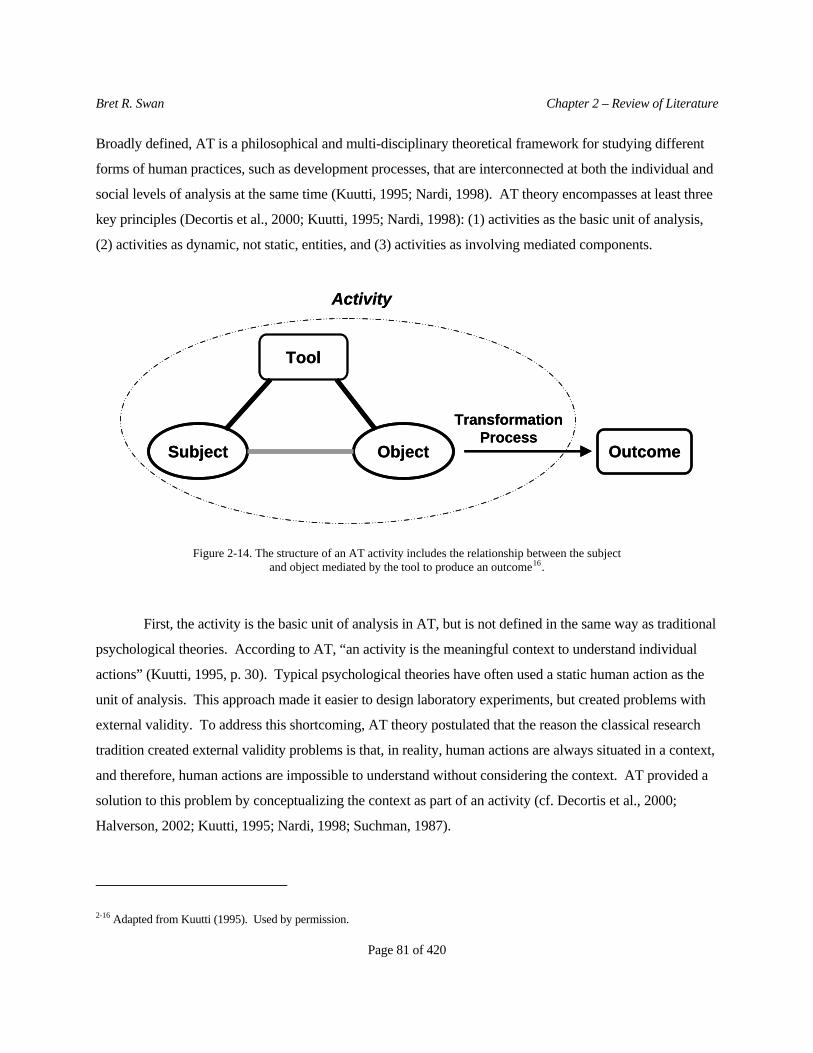
Bret R. Swan Chapter 2 – Review of Literature
Page 81 of 420
Broadly defined, AT is a philosophical and multi-disciplinary theoretical framework for studying different
forms of human practices, such as development processes, that are interconnected at both the individual and
social levels of analysis at the same time (Kuutti, 1995; Nardi, 1998). AT theory encompasses at least three
key principles (Decortis et al., 2000; Kuutti, 1995; Nardi, 1998): (1) activities as the basic unit of analysis,
(2) activities as dynamic, not static, entities, and (3) activities as involving mediated components.
Tool
Subject Object Outcome
Transformation Process
Activity
Tool
Subject Object Outcome
Transformation Process
Activity
Figure 2-14. The structure of an AT activity includes the relationship between the subject and object mediated by the tool to produce an outcome16.
First, the activity is the basic unit of analysis in AT, but is not defined in the same way as traditional
psychological theories. According to AT, “an activity is the meaningful context to understand individual
actions” (Kuutti, 1995, p. 30). Typical psychological theories have often used a static human action as the
unit of analysis. This approach made it easier to design laboratory experiments, but created problems with
external validity. To address this shortcoming, AT theory postulated that the reason the classical research
tradition created external validity problems is that, in reality, human actions are always situated in a context,
and therefore, human actions are impossible to understand without considering the context. AT provided a
solution to this problem by conceptualizing the context as part of an activity (cf. Decortis et al., 2000;
Halverson, 2002; Kuutti, 1995; Nardi, 1998; Suchman, 1987).
2-16 Adapted from Kuutti (1995). Used by permission.

Bret R. Swan Chapter 2 – Review of Literature
Page 82 of 420
Second, AT theory conceptualizes activities as dynamic, as opposed to static, entities. Activities are
under continuous change and development. As a result, activity development is usually uneven, sporadic,
and non-linear. AT theory postulates that an activity has a history that contains the remnants of previous
phases of the activity. Therefore, historical analysis of the activity is often required to understand the
context and situation of interest (cf. Decortis et al., 2000; Halverson, 2002; Kuutti, 1995; Nardi, 1998;
Suchman, 1987).
Third, an activity contains various artifacts that mediate relationships between the components that
make up the activity. These artifacts, such as tools, are themselves created and transformed using the
history and development of the activity itself. These artifacts are one way that activities are dynamic,
because the tools carry a culture or history of the development of the artifact. For example, according to
AT, a basic activity is made up of the relationship between a subject and an object mediated by a tool17 (see
Figure 2-14). A basic activity takes place in a given context and is structured to include a minimum of four
components: the subject, the object, the tool (or artifact) and an outcome. An object is a physical thing,
something less tangible (like a plan) or something intangible (like an idea). The critical issue is that objects
must be able to be shared and manipulated by participants in the activity (Kuutti, 1995). The activity is
motivated by the transformation of the object into an outcome. Because an AT activity is a dynamic
process, the component relationships are transformed over time, producing outcomes of the activity. The
object and motivation are revealed and undergo changes only in the process of how the activity is done. The
tool mediator possesses the history of the relationship. Kuutti (1995, p. 29) explains the role of the tool
mediator in this way:
“Thus, the (reciprocal) relationship between the subject or actor and the object of activity is mediated by a ‘tool’ into which the historical development of the relationship between the subject and object thus far is condensed. The ‘tool’ is at the same time both enabling and limiting: it empowers the subject in the transformation process with the historically collected experience and skill ’crystallized’ to it but it also restricts the interaction to be from the perspective of that particular tool or instrument only - other potential features of [the] object remain ‘invisible’ to [the] subject.”
2-17 An activity can be extended to include relationships between the subject and the community mediated by rules and between the
object and community mediated by the division of labor. This multilevel, systemic conceptualization is beyond the scope and needs of this study. However, if this study is extended to field studies of users of actual BPM Systems, this more extensive conceptualization of an activity will be necessary. For further information see Kuutti (1995), Decortis (2000), Halverson (2002), and Nardi (1998).

Bret R. Swan Chapter 2 – Review of Literature
Page 83 of 420
Kuutti (1995) identifies three perspectives in which AT contributes related research. First, AT
provides a theoretical conceptualization for studying multilevel attributes and activities in an integrated
framework. Second, AT enables the study of interaction embedded in a social context. AT and how it
conceptualizes an activity creates a starting point for studying and comparing the dynamics of interactions
embedded in their context. Third, AT studies the dynamics and development of an activity. According to
Kuuti (1995), how research deals with the dynamics and developmental attributes of human practices has
largely been ignored. By conceptualizing the dynamics and development of activities across levels of
analysis, AT provides an opportunity to address these fundamental issues.
GPM
Manager BPI Outcomes
Transformation Process
BPM User Comprehension Activity
GPM
Manager BPI Outcomes
Transformation Process
BPM User Comprehension Activity
Figure 2-15. AT applied to a GPM user comprehension activity18.
Figure 2-15 illustrates how AT is applied to this study of a GPM user comprehension activity in the
unique context of BPM and BPM Systems. The subject is the individual BPM manager. The object of the
activity is the BPI. The tool that mediates the relationship between the manager and the BPI is the GPM.
The transformation process of this activity produces user comprehension outcomes.
2.5.2.2 Distributed Cognition Theory vs. Information-Processing Theory
The theory of Distributed Cognition (DC) was developed more recently than AT, but, similarly
addresses the limitations of IP theory as they apply to both practical and theoretical issues emerging in
related research. DC theory was first suggested by Norman (1988) and then popularized by Hutchins (1995)
2-18 Adapted from Kuutti (1995). Used by permission.

Bret R. Swan Chapter 2 – Review of Literature
Page 84 of 420
and Hollans et al. (2000). Almost all the current DC literature is comprised of conceptual papers, qualitative
ethnographies, or case studies in various contexts. For example, DC theory has been applied in U.S. Navy
ship navigation (Hutchins, 1995), airplane cockpit design (Hollan et al., 2000), new product development
(Madhavan & Grover, 1998), business representation online (Flor & Maglio, 1997, 2004), and computer-
supported collaborative work (CSCW) (Boland et al., 1994; Hislop, 2002). DC literature also contains
several conceptual papers on topics such as medical informatics (Cimino, 1998; Horsky, Kaufman,
Oppenheim, & Patel, 2003), collaborative learning (Daradoumis & Marques, 2002; Dehler, 1998),
interactive graphical representations (Garbis, 2000; Giordano, 2002), knowledge sharing (Ackerman &
Halverson, 2000; Cabrera & Cabrera, 2002; E. Davenport & Hall, 2002; de Haan, 2002; Wright et al.,
2000), and papers that compare DC theory to other research perspectives (Decortis et al., 2000; Halverson,
2002; Kaptelinin et al., 2003; Norman, 1988; Susi & Ziemke, 2001).
DC theory is a socio-technical systems approach designed to account for the practical reality that a
great deal of human cognitive activity is mediated through information artifacts, because individuals cannot
access, store, or cognitively process within their heads all information necessary for task performance
(Perry, 2003; Wright et al., 2000). According to DC theory, cognition is defined as being “distributed”
because the available tacit and explicit knowledge needed to perform a task is often divided between both
individuals and information artifacts, which is in sharp contrast to IP theory (see Figure 2-16) (Hollan et al.,
2000; Hutchins, 1995).
DC theory has several advantages over IP theory-based research models. First, DC theory seeks to
explain how the distribution of cognitive resources between individuals and information artifacts affects task
performance. When performing tasks, people free up their limited internal cognitive resources whenever
possible by off-loading cognitive processing and information storage needs onto information artifacts and
the task environment (Hollan et al., 2000; Wright et al., 2000). For example, individuals create to-do lists,
take notes, create appointments in a calendar, and maintain contact lists of important information that they
cannot immediately recall or remember without help. In a classic ethnographic study, Hutchins (1995)
describes how ship navigation is accomplished using several individuals and information artifacts working
together in a distributed cognitive system. Related to this study, DC theory reflects the reality that a BPM
task performance is achieved through the interaction of the individual manager and the GPMs used in BPM
Systems.

Bret R. Swan Chapter 2 – Review of Literature
Page 85 of 420
Second, DC theory can be used to study tasks and task outcomes beyond the individual level of
analysis. The DC perspective allows researchers the flexibility to define a cognitive system at a level of
analysis appropriate for their research. Because IP theory restricts the boundaries of a cognitive system to
what takes place within the mind of an individual, it limits the level of analysis to the cognitive system
boundaries, resources, mechanisms, and processes to those that occur within the mind of a single individual
(Hollan et al., 2000; Huitt, 2004). By extending the boundaries of the cognitive system, DC theory inherits
the advantages of IP theory while taking into account a variety of cognitive resources that can be used to
conceptualize multiple levels of analyses (Boland & Tenkasi, 2001; Madhavan & Grover, 1998; Wright et
al., 2000). Using DC theory, a cognitive system can be defined as small as one individual with no
information artifact or as large as multiple individuals and information artifacts interacting to produce both
individual and collective task outcomes (Hollan et al., 2000; Perry, 2003; Rogers, 1997). For example,
Hutchins (1995) uses DC theory to study both (a) the collective task of navigating a U.S. naval vessel, and
(b) the individual performance of one crewmember using a single piece of navigation equipment.
Third, although it extends the cognitive system beyond the mind of the individual, DC theory
continues to incorporate traditional psychology and IP theory constructs in socio-technical research models
(Hollan et al., 2000; Norman, 1988). Because DC theory is rooted in traditional cognitive psychology and
IP theory, it is inherently inclusive of constructs and relationships describing the mental processing of
cognitive resources within the minds of individuals (see Figure 2-16) (Boland et al., 1994; Hollan et al.,
2000; Norman, 1988). Several DC studies suggest that superior task accuracy, task timeliness, and mental
workload can be achieved when interfaces are designed that take into account DC principles. For example,
Madhaven and Grover (1998) describe how cognitive abilities and cognitive styles, such as T-shaped and A-
shaped skills, affect both trust and the richness of personal interaction in the creation of new knowledge.
Hollan et al. (2000) describe DC research that identifies individual cognitive differences in how pilots
perceive information as important factors to consider in cockpit design. Therefore, using DC theory, a
theoretical framework that includes variables from IP theory as well as BPM cognitive resources can be
theoretically justified and compared. (cf. Boland et al., 1994; Cimino, 1998; Daradoumis & Marques, 2002;
de Haan, 2002; Dehler, 1998; Giordano, 2002; Hollan et al., 2000; Madhavan & Grover, 1998; Moore &
Rocklin, 1998; O'Donnell, 1998; Perry, 2003; Winsor, 2001; Zhang & Norman, 1994).
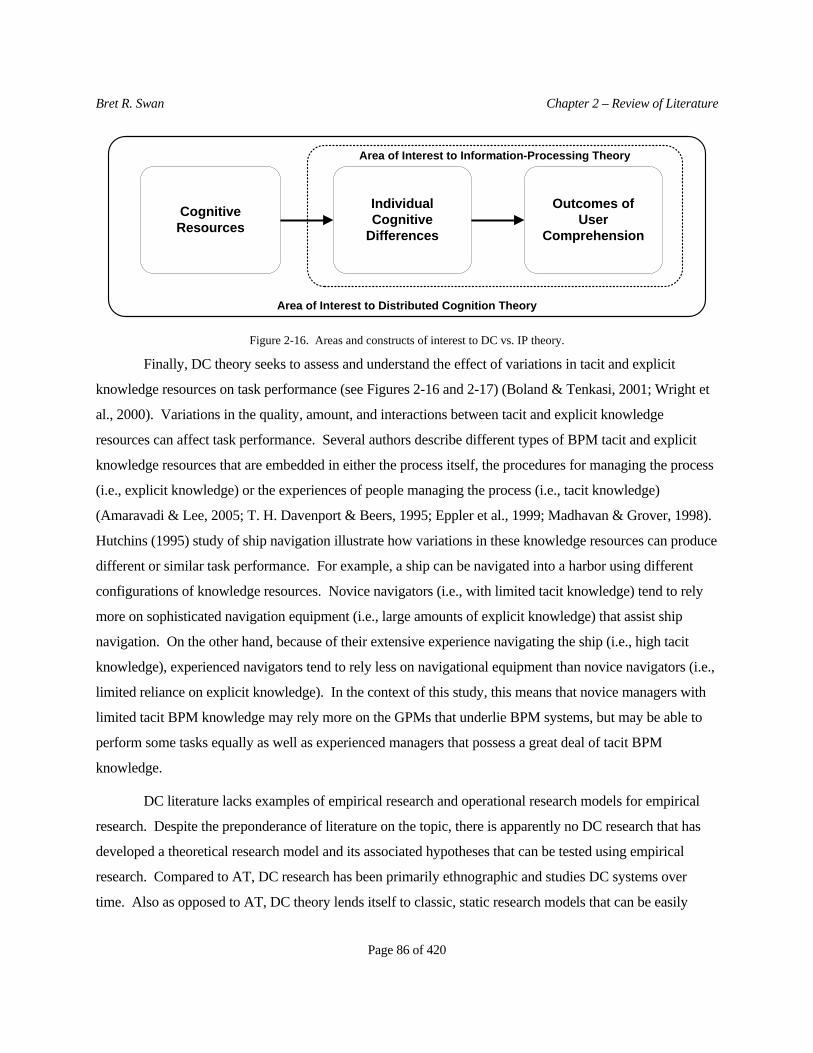
Bret R. Swan Chapter 2 – Review of Literature
Page 86 of 420
Outcomes of User
Comprehension
Individual Cognitive
Differences
Cognitive Resources
Area of Interest to Distributed Cognition Theory
Area of Interest to Information-Processing Theory
Figure 2-16. Areas and constructs of interest to DC vs. IP theory.
Finally, DC theory seeks to assess and understand the effect of variations in tacit and explicit
knowledge resources on task performance (see Figures 2-16 and 2-17) (Boland & Tenkasi, 2001; Wright et
al., 2000). Variations in the quality, amount, and interactions between tacit and explicit knowledge
resources can affect task performance. Several authors describe different types of BPM tacit and explicit
knowledge resources that are embedded in either the process itself, the procedures for managing the process
(i.e., explicit knowledge) or the experiences of people managing the process (i.e., tacit knowledge)
(Amaravadi & Lee, 2005; T. H. Davenport & Beers, 1995; Eppler et al., 1999; Madhavan & Grover, 1998).
Hutchins (1995) study of ship navigation illustrate how variations in these knowledge resources can produce
different or similar task performance. For example, a ship can be navigated into a harbor using different
configurations of knowledge resources. Novice navigators (i.e., with limited tacit knowledge) tend to rely
more on sophisticated navigation equipment (i.e., large amounts of explicit knowledge) that assist ship
navigation. On the other hand, because of their extensive experience navigating the ship (i.e., high tacit
knowledge), experienced navigators tend to rely less on navigational equipment than novice navigators (i.e.,
limited reliance on explicit knowledge). In the context of this study, this means that novice managers with
limited tacit BPM knowledge may rely more on the GPMs that underlie BPM systems, but may be able to
perform some tasks equally as well as experienced managers that possess a great deal of tacit BPM
knowledge.
DC literature lacks examples of empirical research and operational research models for empirical
research. Despite the preponderance of literature on the topic, there is apparently no DC research that has
developed a theoretical research model and its associated hypotheses that can be tested using empirical
research. Compared to AT, DC research has been primarily ethnographic and studies DC systems over
time. Also as opposed to AT, DC theory lends itself to classic, static research models that can be easily

Bret R. Swan Chapter 2 – Review of Literature
Page 87 of 420
adapted to lab settings. Finally, in describing the needs for future DC research agendas, Hollan et al. (2000)
cites empirical research as a critical next step in the advancement of DC theory. This study makes a
contribution to the DC literature by proposing and testing a research model based on DC theory in an
empirical study.
2.6 SUMMARIZING THE LITERATURE - THE RESEARCH MODEL
AT and DC theory provide theoretical justification for integrating BPM cognitive resources and
individual cognitive differences into a theoretical framework for assessing their impact on GPM user
comprehension. However, no theoretical model was found in either of these theories that defined the
relationships between the variables on interest in this study. Therefore, a research models is created for this
study by integrating the various theoretical construct relationships reviewed in Sections 2.3 and 2.4 using a
framework based on AT and DC theory.
The research model relates the constructs (in bold type) and conceptual relationships of interest in
this study (see Figure 2-17). It incorporates relationships between three BPM cognitive resources, three
factors evaluating cognitive differences between individuals, and outcomes of GPM user comprehension.
Conceptually, variations in tacit and explicit BPM knowledge, as well as variations in the BPM information
artifact (that portrays the explicit BPM knowledge), are perceived and cognitively processed by users of
BPM Systems. During cognitive processing, the user’s cognitive styles, cognitive abilities, and mental
workload are effected. Besides the mental workload users experience, user comprehension produces task
performance (accuracy and timeliness) and self-efficacy outcomes specific to GPM user comprehension in
the context of BPM and BPM Systems. The operationalized variables and eight hypotheses, described in
this chapter, are integrated to create the relationships depicted in the research model in Figure 2-17. Chapter
3 discusses the research methodology used to experimentally test this research model and its hypotheses.

Bret R. Swan Chapter 2 – Review of Literature
Page 88 of 420
Figure 2-17. Operational Research Model that tests GPM user comprehension.

Bret R. Swan Chapter 3 – Research Methodology
Page 89 of 420
C h a p t e r T h r e e
CHAPTER 3 - RESEARCH METHODOLOGY The purpose of this chapter is to describe how the laboratory experiment was conducted to test the
following research hypotheses:
Hypothesis 1: The type of graphical process model will significantly affect participants’ task performance (i.e., accuracy and timeliness), subjective mental workload and self-efficacy.
Hypothesis 2: The type of business process information will significantly affect participants’ task performance (i.e., accuracy and timeliness) and subjective mental workload1.
Hypothesis 3: The type of user educational training of participants will significantly affect participants’ task performance (i.e., accuracy and timeliness), subjective mental workload, and self-efficacy.
Hypothesis 4. Participants’ subjective mental workload will significantly affect task performance (i.e., task accuracy and timeliness) in inverted-U relationships (in accordance with the Yerkes-Dodson principle).
Hypothesis 5: Participants’ subjective mental workload will significantly and negatively affect self-efficacy results.
Hypothesis 6: Participants’ cognitive styles will significantly affect the subjective mental workload they experience during task performance.
Hypothesis 7: Participants with high general cognitive abilities will experience significantly lower subjective mental workload.
Hypothesis 8: Participants scoring high on attentional abilities will experience significantly lower subjective mental workload during task performance.
This chapter proceeds by describing the GPM user comprehension tasks used in the experiment
(Section 3.1). Section 3.2 describes the participants of this study. Section 3.3 describes the variables and
instruments used to collect data. The materials and equipment needed to conduct the experiment are
discussed in Section 3.4. The procedures for the experiment are explained in Section 3.5. Section 3.6
describes the experimental design that was used to collect data. Section 3.7 reports the analyses used to test
3-1 Self-efficacy was not measured within-subjects so it is not included in this hypothesis.

Bret R. Swan Chapter 3 – Research Methodology
Page 90 of 420
the individual hypotheses. Section 3.8 describes the premises of this study. Finally, Section 3.9 describes
potential threats to validity.
3.1 DESCRIPTION OF THE GPM USER COMPREHENSION TASKS
The GPM user comprehension tasks in this experiment were based on existing BPM System
literature. The graphical process models, as well as the task accuracy questionnaires, used in the experiment
were based on the real-world bank loan process presented found in Basu and Blanning (2000) (see
Appendices B, C, and D).
3.2 PARTICIPANTS
The participants in this study were third and fourth year college students from two universities: a
large southeastern U.S. university and a small U.S. university in the Hawaiian Islands. Participants were
volunteers from students majoring in industrial engineering (IE), business management (MGT), and
computer science (CS) recruited to represent BPM System users with different types of educational training.
Students were recruited from courses where the instructors either elected to require students to participate or
gave them the chance to volunteer based on specific courses in which they were currently enrolled. As a
result, they were a sample of the population but were not selected in a strictly random fashion. The IE
students were required to participate by their instructor. Instructors of all CS and MGT students elected to
allow their students to volunteer for this experiment. See Section 4.2.1 for details about the number of
participants.
3.3 VARIABLES AND INSTRUMENTATION
The instruments used in this study were specifically chosen to collect data to statistically test the
research hypotheses in this study.

Bret R. Swan Chapter 3 – Research Methodology
Page 91 of 420
3.3.1 Independent Variables
The independent variables in this experiment operationalized three types of cognitive resources
used to perform BPM tasks using BPM systems. The categories of these variables were selected from prior
literature and were manipulated in different treatment combinations in this experiment. Table 3-1 lists the
independent variables and their selected levels that were manipulated in this experiment.
Table 3-1. Independent Variables Descriptions and Levels
INDEPENDENT VARIABLES CATEGORIES OF INDEPENDENT VARIABLE
Type of Graphical Process Model (GPM) (Between-Subjects Factor)
UML Diagrams Metagraphs
Type of Business Process Information (BPI) (Within-Subjects Factor)
Task-Centric BPI Resource-Centric BPI Information-Centric BPI
Type of User Educational Training (UET) (Between-Subjects Factor)
Industrial Engineering Management Computer Science
3.3.1.1 Type of Graphical Process Model
BPI was portrayed using one of two types of GPM techniques: UML diagrams and metagraphs.
The type of GPM technique used to portray BPI was conceptualized as a between-subjects factor in the
experimental design and the primary cognitive resource of interest in this study. (See Sections 2.3.1 for a
description of these GPMs, and Appendices C, D, E, F, J and K for the GPMs used in the pilot study and the
actual experiment.)
3.3.1.2 Type of Business Process Information
Each experimental treatment required participants to interpret and answer questionnaires assessing
user comprehension of three types of BPI (see Section 2.3.2):
1. Process flow BPI using a task-centric GPM.

Bret R. Swan Chapter 3 – Research Methodology
Page 92 of 420
2. Resource allocation BPI using a resource-centric GPM.
3. Data structures using an information-centric GPM.
Each participant was asked to comprehend and interpret all three types of explicit BPM task information.
Thus, the independent variable, type of BPI, was conceptualized as a within-subjects factor (see Section
2.3.2).
3.3.1.3 Type of User Educational Training
The type of UET was conceptualized as a between-subjects factor in this study. In order to take
tacit BPM knowledge of users into account, operationalized as UET, participants were selected that possess
a minimum level of expertise in three educational domains related to BPM task performance (i.e. industrial
engineering, business management, and computer science) (see Section 2.3.3 for a more detailed
discussion). Industrial engineering students possessed quantitative and analytic expertise in process-
oriented analysis perspectives. Students majoring in computer science were educated and trained in
quantitative and analytic expertise relative to object-oriented modeling and programming perspectives.
Students majoring in business management were not usually trained in process-oriented or object-oriented
analytic perspectives.
Table 3-2. Dependent Variables and Associated Sources of Data
DEPENDENT VARIABLES SOURCE OF DATA
Task Accuracy Percent of questions answered correctly Post-task Questionnaire
Task Timeliness
Time on task (seconds) Stopwatch Subjective Mental Workload
Mental Demand NASA-Task Load Index (TLX) Physical Demand NASA-Task Load Index (TLX) Temporal Demand NASA-Task Load Index (TLX) Performance NASA-Task Load Index (TLX) Effort NASA-Task Load Index (TLX) Frustration NASA-Task Load Index (TLX)
Self-Efficacy Average rating Post-task Questionnaire

Bret R. Swan Chapter 3 – Research Methodology
Page 93 of 420
3.3.2 Dependent Variables
The dependent variables in this experiment operationalized assessments of task performance
(accuracy and timeliness), subjective mental workload, and self-efficacy in relation to GPM user
comprehension outcomes. Table 3-2 summarizes these variables and how the associated assessment
instruments.
3.3.2.1 Task Accuracy
Task accuracy was operationalized as a measure of correctness of an individual’s task solution
compared to a known, correct answer (Baddeley, 2003; Marmaras & Kontogiannis, 2001; Umanath &
Vessey, 1994). It is a frequent measure of task effectiveness and solution quality in various HCI and
cognitive science-related literature such as cognitive fit (cf. Dunn & Grabski, 2001; Vessey, 1991),
cognitive load (cf. Paas, Renkl, & Sweller, 2003; van Merrienboer, Kirschner, & Kester, 2003), and user
comprehension of IS data models (cf. Agarwal, De, & Sinha, 1999; Shoval, Danoch, & Balabam, 2004).
The task accuracy questionnaires used in this study were created based on recommendations by
Basu and Blanning (2000) as to the kinds of BPM questions that managers should be able to comprehend
and answer from the GPMs used in BPM Systems. Each type of question was asked at least twice in the
questionnaire, one more difficult than the other. The questionnaire was designed with a total of 30 questions
for participants to answer: eight task-centric GPM questions, eight resource-centric GPM questions, eight
information-centric GPM questions, and six questions assessing participants’ integration of BPI across
maps2 (see Appendix J.3 for experimental task questionnaires). Different versions of the questionnaire were
created that changed the order of the questions based on the order that the task, resource, or information-
centric GPMs were presented to participants.
Task accuracy was measured by calculating the percent of correct answers to these questionnaires.
In this experiment, accuracy scores for each participant were collected three times within-subjects: once
after users completed their interpretation of each GPM that portrayed each different type of BPI (see
Appendices B and I for instructions and scripts, and Section 4.2.1 for task accuracy results).
3-2 Data from these last six questions are not related to the hypotheses tested in this study but were used in future analyses.

Bret R. Swan Chapter 3 – Research Methodology
Page 94 of 420
3.3.2.2 Task Timeliness
Task timeliness was measured by the amount of time participants spent performing the task.
“High” task timeliness is associated with smaller amounts of time. “Low” task timeliness is associated with
larger amounts of time (see Section 2.2.2). In this experiment, separate measures of task timeliness for each
participant were collected using a stopwatch as participants performed the training and experimental tasks.
In this experiment, timeliness data for each participant were collected three times within-subjects: once after
users completed their interpretation of each GPM portraying each different type of BPI (see Section 4.2.2
for timeliness results).
3.3.2.3 Subjective Mental Workload: The NASA-Task Load Index
This study used an established assessment of subjective mental workload: the NASA-Task Load
Index (TLX) (Hart & Staveland, 1988a, 1988b). The latest version of the NASA-TLX is a product of
several iterations, and has been demonstrated as both valid and reliable. For example, Rubio et al. (2004)
evaluated the methodological and psychometric properties of three different types of subjective mental
workload instruments. They found the NASA TLX to have acceptable correlations (r > 0.65) with their two
measures of task performance (time and accuracy). In addition, Hill et al. (1992) comparisons of four
subjective workload scales, found the TLX and one other measure to be consistently superior (cf. Hart &
Staveland, 1988a; Hart & Wickens, 1990; Hill et al., 1992; Nygren, 1991; Rubio et al., 2004; Vitense,
Jacko, & Emery, 2003) (Jung & Jung, 2001). (See Section 2.4.1 and 2.4.2 for a review of mental workload
literature.).
The NASA-TLX is a multi-dimensional rating procedure that provides an overall workload score
based on a weighted average of six dimensions: mental demand, physical demand, temporal demand,
performance, effort, and frustration (Hart & Staveland, 1988a, 1988b). The definitions of these dimensions
are shown in Table 3-3.
Ratings for each TLX dimension were obtained by participants responding to questions related to
each dimension on a continuous, bipolar scale. In addition, a weighting procedure was used to combine
ratings of the six individual dimensions into a global score for each participant based on paired comparisons
between all combinations of the six dimensions. The number of times a dimension was chosen in the paired
comparisons by the participant meant it received a heavier weighting for a given task. A TLX workload
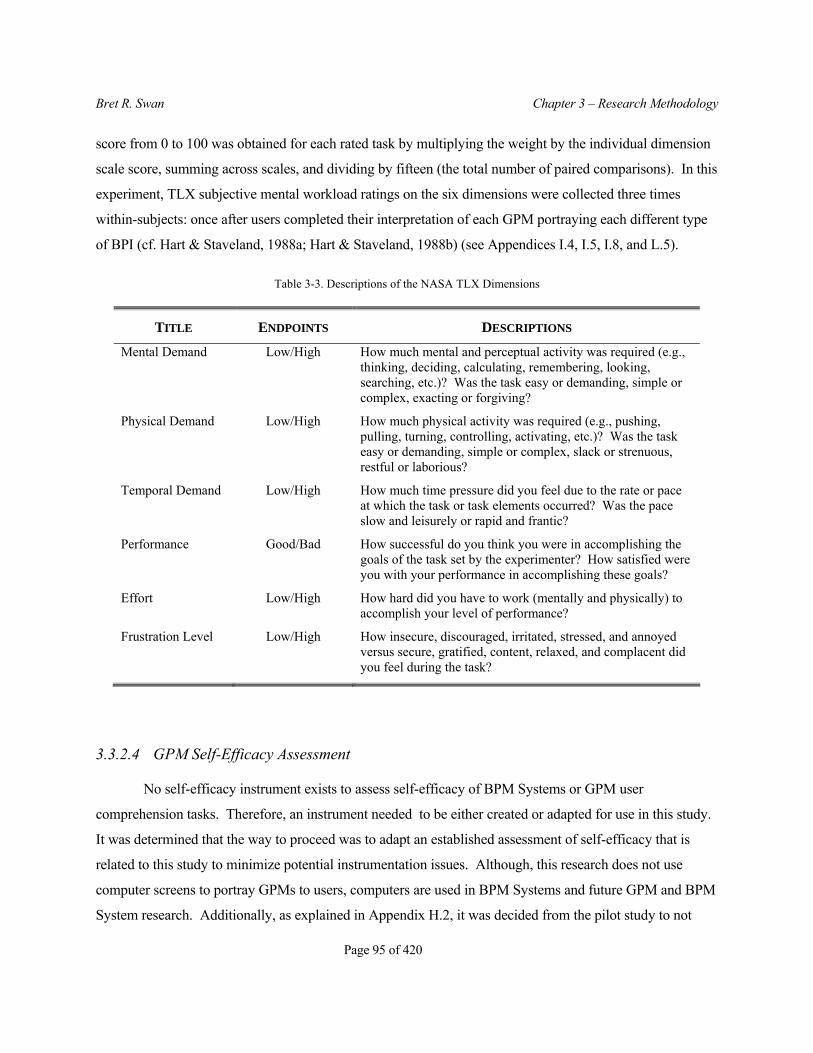
Bret R. Swan Chapter 3 – Research Methodology
Page 95 of 420
score from 0 to 100 was obtained for each rated task by multiplying the weight by the individual dimension
scale score, summing across scales, and dividing by fifteen (the total number of paired comparisons). In this
experiment, TLX subjective mental workload ratings on the six dimensions were collected three times
within-subjects: once after users completed their interpretation of each GPM portraying each different type
of BPI (cf. Hart & Staveland, 1988a; Hart & Staveland, 1988b) (see Appendices I.4, I.5, I.8, and L.5).
Table 3-3. Descriptions of the NASA TLX Dimensions
TITLE ENDPOINTS DESCRIPTIONS
Mental Demand Low/High How much mental and perceptual activity was required (e.g., thinking, deciding, calculating, remembering, looking, searching, etc.)? Was the task easy or demanding, simple or complex, exacting or forgiving?
Physical Demand Low/High How much physical activity was required (e.g., pushing, pulling, turning, controlling, activating, etc.)? Was the task easy or demanding, simple or complex, slack or strenuous, restful or laborious?
Temporal Demand Low/High How much time pressure did you feel due to the rate or pace at which the task or task elements occurred? Was the pace slow and leisurely or rapid and frantic?
Performance Good/Bad How successful do you think you were in accomplishing the goals of the task set by the experimenter? How satisfied were you with your performance in accomplishing these goals?
Effort Low/High How hard did you have to work (mentally and physically) to accomplish your level of performance?
Frustration Level Low/High How insecure, discouraged, irritated, stressed, and annoyed versus secure, gratified, content, relaxed, and complacent did you feel during the task?
3.3.2.4 GPM Self-Efficacy Assessment
No self-efficacy instrument exists to assess self-efficacy of BPM Systems or GPM user
comprehension tasks. Therefore, an instrument needed to be either created or adapted for use in this study.
It was determined that the way to proceed was to adapt an established assessment of self-efficacy that is
related to this study to minimize potential instrumentation issues. Although, this research does not use
computer screens to portray GPMs to users, computers are used in BPM Systems and future GPM and BPM
System research. Additionally, as explained in Appendix H.2, it was decided from the pilot study to not

Bret R. Swan Chapter 3 – Research Methodology
Page 96 of 420
portray GPMs on screens so that user comprehension outcomes are not confounded by variables related to
the manipulation of the GPM on the screen. Using the same self-efficacy instrument from this study, future
studies can identify the effect of computer vs. paper portrayals on GPM user self-efficacy.
Therefore, it was decided that the self-efficacy instrument chosen for is study should also be able to
be used in future studies using actual GPMs and BPM Systems. As a result, a often-used computer self-
efficacy instrument was adapted for use in this study. Self-efficacy was assessed by adapting a computer
self-efficacy instrument developed by Compeau and Higgins (1995). It was primarily developed as a
general assessment of an individual’s self-efficacy in using computers (Compeau & Higgins, 1995;
Compeau, Higgins, & Huff, 1999; Fagan, Neill, & Wooldridge, 2003). This instrument was chosen because
of its history of extensive use in the literature, and because computer self-efficacy was closely related to the
self-efficacy needed by users of GPMs as part of BPM Systems. Compeau and Higgins’s original computer
self-efficacy instrument included ten statements for participants to evaluate. Nine of the ten statements were
adapted to assess GPM user self-efficacy using a likert-type scale where 1 equals low self-efficacy and 10
equals high self-efficacy (see Appendix L.9):
• Self-Efficacy Question #1-If the user was alone and no one to tell them what to do.
• Self-Efficacy Question #2-If the user never used these types of diagrams before.
• Self-Efficacy Question #3-If the user had only the training handouts for reference.
• Self-Efficacy Question #4-If the user had seen others using these diagrams before trying them.
• Self-Efficacy Question #5-If the user could ask someone for help if they got stuck.
• Self-Efficacy Question #6-If someone helped the user get started.
• Self-Efficacy Question #7-If the user had a lot of time to complete the task.
• Self-Efficacy Question #8-If only the materials used in training were available.
• Self-Efficacy Question #9-If the user had used these diagrams before to do similar tasks.
The question that was not included asked if the user could complete the task if someone was there to show
them how to do it first. This question was dropped because of the redundancy when the questions were
adapted for this experiment. This question seemed redundant with Question #4. No other question seemed
redundant, although several were related to one another.
While Compeau and Higgins (1995) questionnaire has been used in several computer self-efficacy
studies, no sources were found that reported the internal consistency and validity for the instrument. Despite

Bret R. Swan Chapter 3 – Research Methodology
Page 97 of 420
this drawback, Compeau & Higgins’ questionnaire (1995) was selected for this research because it allowed
the greatest comparison to other HCI self-efficacy research.
This assessment was applied at the end of the experiment for two main reasons. First, self-efficacy
is typically assessed and conceptualized as an antecedent to performance (see Section 2.4.2). Participants in
other studies that include computer self-efficacy, typically, have had some experience with computers and
could provide an evaluation of self-efficacy prior to the specific study’s experimental task. However, in this
experiment, participants had limited or no prior experience with these GPMs or the with interpretation of
BPI in the context of this experiment. Therefore, the participants in this experiment had no basis to judge
their GPM user self-efficacy in this experiment until after the task was completed. Second, the primary
issue studied in this research was the effect of GPM type on user comprehension. Thus, it was decided to
assess self-efficacy after each participant completed their interpretation of their assigned GPM Type. The
approach to assessing self-efficacy in this study laid a foundation for assessing future GPM user
comprehension research in BPM task contexts.
Table 3-4. Description and Instrumentation of Control Variables
CONTROL VARIABLES SOURCE OF DATA
Cognitive Styles
Extrovert vs. Introvert Myers-Briggs Type Indicator (MBTI) – Continuous Scores Sensing vs. Intuitive Myers-Briggs Type Indicator (MBTI) – Continuous Scores
Cognitive Abilities General Cognitive Ability (GCA) Wonderlic Personnel Test (WPT) Attentional Abilities (Overall)
Moderately-focused attention Differential Attentional Processes Indicator (DAPI) Extremely-focused attention Differential Attentional Processes Indicator (DAPI) Dual attention to tasks (cognitive-physical) Differential Attentional Processes Indicator (DAPI)
Dual attention to tasks (cognitive-cognitive) Differential Attentional Processes Indicator (DAPI)
3.3.3 Moderating Variables

Bret R. Swan Chapter 3 – Research Methodology
Page 98 of 420
Table 3-4 summarizes the moderating variables and the instruments used to assess them. Because
of the difficulty of manipulating these variables as independent variables, their covariate effects on the
relationship between cognitive resources and GPM user comprehension task outcome variables were
controlled for using statistical analyses.
3.3.3.1 Cognitive Styles: The Myers-Briggs Type Indicator
This study used the Myers-Briggs Type Indicator (MBTI) (Myers & Myers, 1995) to assess
cognitive styles. The MBTI is described as an explicit operationalization of Jung’s theory of psychological
type (Myers, 1993; Myers & McCaulley, 1989). Form F of the MBTI includes 166 forced-choice items
used to provide scores along four scales: Extraversion/Introversion (EI), Thinking/Feeling (TF),
Sensing/Intuiting (SN), and Judging/Perceiving (JP). MBTI research has found that individuals’ cognitive
styles for perceiving and processing information consistently align along four different dimensions:
extrovert-introvert, sensing-intuition, thinking-feeling, and judging-perceiving.
The MBTI is the most used instrument for assessing cognitive styles and personality traits in
management and decision-making literature. For example, Hough and Ogilvie (2005), who studied the use
of cognitive style as antecedents of strategic decision processes or performance, suggest three reasons why
the MBTI dominate the strategic decision-making research on cognitive style. First, the cognitive styles
represented by the MBTI are conceptually related to the information gathering and information evaluation
aspects of decision making (Myers, 1993). Second, it is widely used and understood within organizations
allowing for direct transfer from research to practice (Gardner & Martinko, 1996) primarily because the use
of MBTI preferences is reported as less threatening to managers and more easily understood as opposed to
absolute measures of cognitive ability, such as IQ (Hayes & Allinson, 1994). Finally, research supports the
conceptual, construct, and predictive validity of the MBTI (Bess, Harvey, & Swartz, 2003; Capraro &
Capraro, 2002; Myers & McCaulley, 1989; Myers, McCaulley, & Most, 1985; Tzeng, Outcalt, Boyer,
Ware, & Landis, 1984).
Academic researchers have been divided over the subject of MBTI validity and reliability. Several
studies have found MBTI research based on continuous scores to have high face validity and reliability
(Gardner & Martinko, 1996). Related to continuous MBTI scores of Form F used in this dissertation
research, Myers and McCaulley (1985) report Form F continuous scores for each of the four MBTI
dimensions to have the following Cronbach’s α coefficients: EI = 0.83, SN = 0.83, TF = 0.76, and JP = 0.80.

Bret R. Swan Chapter 3 – Research Methodology
Page 99 of 420
Additionally, Cronbach’s α were computed for large sample studies collected from the Center for
Applications of Psychological Type (CAPT) databank. These scores exhibited reliability coefficients
averaging EI = 0.79, SN = 0.84, TF = 0.74, and JP = 0.82 on more than 32,000 participants and a range of
EI = 0.74 to 0.83, SN = 0.74 to 0.85, TF = 0.64 to 0.82, and JP = 0.78 to 0.84 on more than 10,000
participants (Myers et al., 1985). Harvey (1996) reports results of a meta-analysis on the studies
summarized in the MBTI Manual (Myers et al., 1985) for which data are given by gender on a sample of
102,174 respondents. This meta-analysis gave corrected split-half estimates on men and women,
respectively: EI, 0.82 and 0.83; SN, 0.83 and 0.85; TF, 0.82 and 0.80; JP, 0.87 and 0.86. Thus, meta-
analyses report that the administrations of the MBTI examined in the present study indicated that the MBTI,
on average, tends to yield scores with acceptable reliability across studies (Harvey, 1996). Test-retest
reliabilities for MBTI scores suggest score consistency over time. Test-retest coefficients from 1 week to
2.5 year intervals ranged from 0.93 to 0.69 on the SN scale, 0.93 to 0.75 on the EI scale, 0.89 to 0.64 on the
JP scale, and 0.89 to 0.48 on the TF scale (Myers & McCaulley, 1989). It is reported that when respondents
do show a change in type, it is usually only in one preference and then in scales where they were originally
not strongly differentiated (Myers et al., 1985).
Several researchers have studied the construct validity of the MBTI scores. Validity of MBTI
scores is typically established by correlating the scores with findings from various personality instruments
and inventories of interest. Statistically significant correlations have been found between MBTI scores,
behaviors reflective of MBTI constructs, and persons’ self-assessment of their own MBTI type (De Vito,
1985; Myers & McCaulley, 1989). Additionally, confirmatory factor analysis found significant higher
support for MBTI construct validity when using data from real-world managers compared to construct
validity studies using students (Bess et al., 2003). Saggino, Cooper, and Kline (2001) report several studies
examining research on the MBTI (Carlson, 1985; Carlyn, 1977; Carskadon, 1979; Murray, 1990) and
conclude that the MBTI seems to be a reasonably valid instrument, even if further studies are needed on its
construct validity. Tischler (1994, p. 30) state that “factor analysis provided unusually strong evidence that
the MBTI items are correlated with their intended scales: the scales are almost factorially pure.”
However, there are several controversies in the literature as to the reliability and validity of the
MBTI, often related to the indicator’s measurement characteristics (Capraro & Capraro, 2002; Saggino et
al., 2001). For example, studies report that there is insufficient evidence to support the premises and
conclusions of the MBTI (Pittenger, 1993). Other researchers do not believe the MBTI does not adequately
represent Jungian theory (Saggino et al., 2001). The forced-choice response format and false assumptions

Bret R. Swan Chapter 3 – Research Methodology
Page 100 of 420
that all people can be divided into groups have also been criticized (Vacha-Haase & Thompson, 2002).
Another criticism is regarding gender weighting because different weights are applied for men and women
on the TF. This leads to difficulties in comparing men and women on the TF scale (Vacha-Haase &
Thompson, 2002). Also, criticism is related to either using student data to support reliability and validity
(Bess et al., 2003). Like all measures, the MBTI yields scores that are dependent on sample characteristics
and testing conditions. Most statistical validity problems and discrepancies in MBTI results were found to
involve the use of categorical MBTI scales (Gardner & Martinko, 1996). Therefore, much of the criticism
of MBTI research is reported to stem from a lack of MBTI research based on continuous data in analyses
(Gardner & Martinko, 1996).
Despite these criticisms, the use of MBTI Form F was used in this study due to the amount of the
amount of literature supporting its reliability and validity. This study used MBTI scores to assess two of
these MBTI cognitive styles:
• Extroversion vs. Introversion: refers to the participants’ preference for cognitively processing
information based on their being more interested in the world around them, i.e. extroversion, or the
world of ideas within their own minds, i.e., introversion.
• Sensing vs. Intuition: refers to the participants’ degree of dependence on either their five senses, i.e.,
sensing, or on their intuition to gather and perceive information.
MBTI continuous data have been collected in two forms: individual dimension scores (e.g., separate
sensing scores and intuition scores) and dichotomous scores (e.g., a single score representing both sensing
and intuition). Due to the exploratory nature of this study and to address concerns in the MBTI literature,
this study used dichotomous, continuous scores for the extroversion-introversion and sensing-intuition
cognitive styles calculated from data collected using Form F of the MBTI. This approach maximized the
potential reliability and validity of the MBTI Form F cognitive style data.
3.3.3.2 General Cognitive Abilities: The Wonderlic Personnel Test
Assessments of General Cognitive Abilities (GCA) have been generally misrepresented by
practitioners as measures of “intelligence” instead of assessments of a broad range of cognitive abilities
(Bowman, Markham, & Roberts, 2001; Schmidt, 2002; Woodcock, 2002). GCA was assessed in this study
by a single numerical score resulting from each participant taking the Wonderlic Personnel Test (WPT)

Bret R. Swan Chapter 3 – Research Methodology
Page 101 of 420
Form A (Dodrill, 1983; Dodrill & Warner, 1988). Although a variety of instruments were available to
assess broad cognitive abilities and narrow cognitive aptitudes, most of these instruments were long,
cumbersome to administer, and better suited for specific cognitive psychological research. Because
cognitive abilities were not the central focus of this study, it was decided that an instrument measuring a
broad range of GCA that is widely used and relatively easy to administer was better suited for this
exploratory research. The WPT was selected, because it fit these requirements. The WPT aggregates an
individual’s quantitative scores on a variety of cognitive abilities into a single score representing the
individual’s GCA (McCutcheon, 2002; Schmidt, 2002; Woodcock, 2002).
The WPT Form A is a self-administered, 12-minute, pencil-and-paper test designed as a brief
assessment of a broad range of intellectual cognitive abilities. An individual’s WPT score can range from
one to fifty, where fifty equals high GCA. The WPT is based on the more extensive Weschler Adult
Intelligence Scale (WAIS) (Dodrill & Warner, 1988). As a result, the WPT was reported to be highly
correlated with the WAIS (0.91 to 0.93), with 90% of the subjects scores allowing IQ predictions with
discrepancies of no more than ten points. Long-term validity comparisons of the WPT to the WAIS found
that test-retest reliability of the WPT is 0.94, which is roughly equivalent to the WAIS (Dodrill, 1983)
(Dodrill & Warner, 1988). Furthermore, the predictive validity of the WPT is reported as not being
compromised by characteristics, such as, age, sex, years of education, and emotional adjustment (Dodrill,
1981) (cf. Dodrill, 1983; Dodrill & Warner, 1988; Hawkins, Faraone, Pepple, Seidman, & Tsuang, 1990)
(See Appendix L.6 for a sample of the WPT).
3.3.3.3 Attentional Abilities: The Differential Attentional Processes Inventory
Attentional Abilities of participants were assessed using the Differential Attention Processes
Inventory (DAPI) (Crawford, Brown, & Moon, 1993; Lyons & Crawford, 1997). The DAPI assesses
participants’ ability to focus their attention during task performance under various conditions. It consists of
forty self-descriptive statements relating an individual’s experiences with their ability to focus attention,
ignore distractions, and, simultaneously carry out two types of tasks. Participants were asked to rate
themselves as to the degree to which they typically can carry out the activities on a seven-point scale of 1
(not at all) to 7 (always). The DAPI includes four subscales previously validated by factor analysis
(Crawford et al., 1993; Grumbles & Crawford, 1981):
Bret R. Swan Chapter 3 – Research Methodology
Page 102 of 420
1. Moderately-focused attention (8 items): this construct assesses an individual’s perceived ability to
sustain moderately focused attention amid distractions.
2. Extremely-focused attention (12 items): this construct assesses an individual’s perceived ability to
engage their total attentional resources to a task without awareness of outside stimuli or distractions.
3. Dual attention cognitive-cognitive tasks (4 items): this construct assesses whether two cognitive
tasks can simultaneously be easily performed, for example, reading or studying easily while at the
same time listening to the radio or TV.
4. Dual attention cognitive-physical tasks (5 items): this construct assesses whether one cognitive task
and one physical task can be easily performed simultaneously, for example, carrying out a motor
activity easily while listening to a conversation.
Yanchar (1984) reports on internal consistency for the DAPI (Cronbach’s α = 0.88). Lichtenberg et
al. (2004) reports Cronbach α for different DAPI constructs: 0.84 for the extremely focused attention, 0.86
for moderately focused attention, 0.71 for cognitive-physical, and 0.88 for cognitive-cognitive subscales. A
similar study reports that the test-retest reliability for a college sample over 4 weeks was 0.90, and the
Cronbach’s α for the two testing periods was 0.91 and 0.94 (Lyons & Crawford, 1997). (See Section 2.4.3
for a discussion of attentional abilities and Appendix L.7 for an example of the DAPI.)
3.3.4 Blocking Variables
In addition, the following blocking variables were analyzed to eliminate potential bias in the data:
• Age: Age in years of the participant.
• Gender: Male or female.
• Major: Declared academic educational training of the participants, i.e., IE, MGT, or CS.
• Prior Experience with specific GPM techniques: Including flowcharts, metagraphs, Petri nets, UML diagrams, etc.
• Prior Experience with business process modeling software: Participants listed software packages that they have used to model business processes.
• Experience modeling business processes: Participants rated their experience with modeling business processes as either beginner, adequate, or advanced.
• Order of BPI Tasks within Treatments: The order of the BPI tasks was varied to eliminate learning bias as much as possible.

Bret R. Swan Chapter 3 – Research Methodology
Page 103 of 420
• Treatment date: The date each participant completed the experimental task.
• Undergraduate/Graduate Courses Taken: Specific courses taken by participants related or their declared major.
• Undergraduate/Graduate Total Credits: Total credits completed at the time of the experiment.
3.4 MATERIALS, EQUIPMENT, AND FACILITIES
This section outlines the instrumentation and materials needed to perform this experiment. Details
regarding each of these items is contained in Appendices B, C, D, E, F, G, H, I, J, K, and L.
3.4.1 Participant Materials
• IRB Experiment Purpose and Participant Rights (see Appendix A.2)
• IRB Participant Consent Form (see Appendix A.2)
• Demographics Questionnaire (see Appendix L.1 or L.2)
• MBTI Form F (see Appendix L.8)
• Differential Attentional Processes Inventory (DAPI) (see Appendix L.7)
• Wonderlic Personnel Test - Form A (see sample WPT in Appendix L.6)
• Training Task Instructions (see Appendix I.1)
• Training Task FAQ Sheet (see Appendix I.2 or I.3)
• Training Task GPMs (see Appendix J or K)
• Training Task Assessment Packet: It includes task accuracy questionnaires, the NASA-TLX,
and the GPM self-efficacy questionnaire (see Appendix I.4 or I.5)
• Experimental Task Instructions and Scripts (see Appendix I.6 and I.7)
• Experimental Task GPMs (see Appendix C or D)
• Experimental Task Assessment Packet: It includes task accuracy questionnaires, the NASA-
TLX, and the GPM self-efficacy questionnaire (see Appendix I.8 or I.9)
3.4.2 Equipment
• A clipboard was needed for each participant in a treatment group.

Bret R. Swan Chapter 3 – Research Methodology
Page 104 of 420
• Wall-mounted GPMs printed on 22” x 34” (Paper Size D) – two sets of three metagraph and
three UML diagrams modeling the different BPI perspectives of the same business process. In
this study, the process modeled was a bank loan application process.
• Microsoft Word 2003 software
• Microsoft Visio 2003 software
• Microsoft Excel 2003 software
• SPSS 14.0 software
3.4.3 Facilities
• Classroom Facilities with wall space to mount the GPMs.
• A desk and chair for each participant to fill out the assessments.
3.4.4 Incentives for Participation
3.4.4.1 Motivation to Participate
• Course instructor requirements and points toward course grade, or pizza and soda.
3.4.4.2 Motivation to Optimize Performance
• Three $100 gift certificates for top performer from each academic major (type of UET).
• $200 gift certificate for top overall performer.
3.5 EXPERIMENTAL PROCEDURE
A pilot study was conducted to test and refine the procedures prior to the actual experiment. The
pilot study GPMs and materials are located in Appendices B, C, D, E, and F. Pilot study procedures and
findings are discussed in Appendices G and H, respectively. This section describes the experimental
procedures used in this study.

Bret R. Swan Chapter 3 – Research Methodology
Page 105 of 420
Oa = Pretest assessments of prior expertise, GCA, DAPI, MBTI and demographics were conducted prior to the experiment.
R = The random assignment of approximately equal numbers of participants with different types of User Educational Training (UET1, UET2, UET3) were assigned to either metagraphs or UML GPM treatments.
X#1 = Participants that were assigned the task set portraying BPI using UML diagrams (GPM1 = X#1). The actual order of the UML diagrams representing different BPI types were assigned to each participant to minimize learning order bias.
X#2 = Participants that were assigned the task set portraying BPI using Metagraphs (GPM2 = X#2). The actual order of the metagraph diagrams representing different BPI types were assigned to each participant to minimize learning order bias.
O##b = Repeated measures of the same set of dependent variables was completed after each participant interpreted each type of BPI: subjective mental workload (NASA TLX) and task accuracy (questionnaire).
T## = Repeated measures of task timeliness was documented representing how long each participant took to interpret each type of BPI.
O4 = After completion of the entire experiment, participants completed the self-efficacy questionnaire and paired comparison weightings of the NASA-TLX mental workload dimensions.
Figure 3-1. Experimental strategy for each experimental treatment group.
Figure 3-1 illustrates and describes the order of the procedures that participants followed as part of a
treatment group during the actual experiment. Participants completed three separate user comprehension
tasks in a treatment: one about task-centric BPI, one about resource-centric BPI, and one about information-
centric BPI. The following is a detailed outline of the procedure used to conduct the experimental
treatments based on lessons learned from the pilot study:
1. Training and experimental GPM task sets, assessment packages, and timeliness data collection
procedures were prepared for experiment participants.
2. Third and fourth year university students were recruited for the experiment in various IE, MGT, and
CS courses. If they chose to participant, students were provided an overview of the experiment and
the motivations for participation were described. Participants signed up for a treatment group time
and were given a pre-experiment assessment packet that they were to complete and bring to the
experiment. Pre-experiment assessment packets included:
A. The Experiment Announcement
B. An IRB Informed Consent form

Bret R. Swan Chapter 3 – Research Methodology
Page 106 of 420
C. The Demographic and Prior Experience Questionnaire
D. The MBTI Form F
E. The Differentional Attentional Processes Inventory (DAPI)
3. Treatment task sets (either MG or UML) were assigned to participant groups based on the time
students signed up to participate.
4. Participants in a treatment group arrived at the scheduled time for experiment, and the experiment’s
purpose and initial instructions were given to the treatment group.
5. Pre-experiment assessments were collected including:
A. A signed IRB Informed Consent form.
B. A completed Demographic and Prior Experience Questionnaire
C. A completed MBTI Form F.
D. A completed Differentional Attentional Processes Inventory (DAPI).
6. The 12-minute, Wonderlic Personnel Test (WPT) Form A was administered to participants in the
treatment group.
7. Participants received the training handouts and training instruction from the facilitator. The
facilitator was careful to answer questions using only the information available in the training
handouts.
8. When the training began, participants interpreted simplified sample GPMs and worked through the
sample questions checking their answers against correct answers on the back of the page. Time on
task was not collected for the training task, because the training task involved participants studying
the correct answers to the training. Thus, it did not reflect the actual time to complete a training
task.
9. When students completed their interpretations and were given a chance to ask questions, the
facilitator provided instruction on completing the NASA TLX dimensions, TLX paired comparison
ratings, and the GPM self-efficacy questionnaire.
10. Participants completed the assessments in number 9 in relation to the training task they had recently
experienced.
11. Training task assessments were collected by the facilitator.
12. The facilitator handed out the instructions and scenario for the experimental tasks. He verbally read
through these documents with the participants and answered last minute questions. Again, in
answering questions, the facilitator was careful to point participants to the training materials and not

Bret R. Swan Chapter 3 – Research Methodology
Page 107 of 420
provide any information that did not exist in these materials. Participants were then allowed to use
all the training and experiment handouts during the experimental tasks.
13. Experimental assessment packets were distributed to the participants. Participants were instructed
on the order in which they were to complete interpretation of the three GPMs.
A. The order participants were assigned to complete their interpretations of the three types of BPI
was counterbalanced to reduce learning order bias in the results. For example, approximately
a third of the participants completed the experiment by interpreting the GPMs in the following
order: (1) task-centric BPI, (2) resource-centric BPI, and finally (3) information-centric BPI.
Approximately a third of the participants completed their experiment by interpreting the
GPMs in this order: (1) resource-centric BPI, (2) information-centric BPI, and finally, (3)
task-centric BPI. Approximately a third of the participants completed their experiment by
interpreting the GPMs in this order: (1) information-centric BPI, (2) task-centric BPI, and
finally, (3) resource-centric BPI.
B. The order that the participants were presented the different types of BPI was assigned and
counterbalanced to assure an almost equal number of participants per BPI order in each GPM
Type.
14. The facilitator started all the participants at the same time. A stopwatch was used to keep track of
the time on task.
15. After a participant completed the task accuracy questionnaires, data were collected in the following
ways:
A. When the participant said, “Stop,” then the time on task (in seconds) was recorded by the
facilitator.
B. The participant rated each of the dimensions of the NASA-TLX in relation to that specific
type of BPI.
C. The participant prepared him or herself for the next type of BPI, and notified the facilitator
when they were ready to begin.
16. The facilitator looked at the stopwatch, told the participant to start their next GPM, and recorded the
stopwatch time that the participant had begun interpretation of the next GPM.
17. Each participant completed their second BPI interpretation task according to number 15 above.
18. The facilitator started each participant on their third BPI interpretation task according to number 16
above.

Bret R. Swan Chapter 3 – Research Methodology
Page 108 of 420
19. Each participant completed their third BPI interpretation task according to number 15-A and 15-B
above. Additionally, they completed:
A. Fifteen NASA-TLX paired comparison ratings of the TLX subjective mental workload
dimensions.
B. The GPM self-efficacy questionnaire.
20. After completion of the experimental set of user comprehension tasks, the facilitator collected the
assessment packets from each participant.
21. Experiment participants were then thanked and excused. They were told that the promised
motivational rewards would be given to the winning participants after completion of the data
analysis.
22. The facilitator completed notes on observations made during the experiment.
Table 3-5. Design Matrix for Experiment for Minimum Desired Number of Participants
Task-
Centric BPI Resource-
Centric BPI Information-Centric BPI
(BPI1) (BPI2) (BPI3)
UML (GPM1) < - - - - n1-12 - - - - > Industrial Engineering Expertise (UET1) Metagraph (GPM2) < - - - - n37-48 - - - - >
UML (GPM1) < - - - - n13-24 - - - - > Management Expertise (UET2) Metagraph (GPM2) < - - - - n49-60 - - - - >
UML (GPM1) < - - - - n25-36 - - - - > Computer Science Expertise (UET3) Metagraph (GPM2) < - - - - n61-72 - - - - >
UETi=type of User Educational Training GPMi=type of Graphical Process Modeling Technique BPIi=type of Business Process Information
ni = ith participant

Bret R. Swan Chapter 3 – Research Methodology
Page 109 of 420
3.6 EXPERIMENTAL DESIGN
Data were collected using a 2 (type of GPM) x 3 (type of UET) x 3 (type of BPI) factorial design,
with repeated measures on the third variable (BPI Type), and analyzed using three-way mixed MANOVAs
that included two between-subjects variables (GPM Type and UET Type) and one within-subjects variable
(BPI Type). In addition, the following variables were statistically controlled as covariates using
MANOVAs for moderating effects of general cognitive abilities (GCA), attentional abilities, extroversion-
introversion cognitive style, and perceptual cognitive style (i.e., sensing-intuition).
3.6.1 A Priori Determination of Statistical Power and Sample Size
Determining the appropriate statistical power, sample size, and Effect Size (ES) was difficult due to
the fact that this form of GPM user comprehension research has not been performed, the multivariate nature
of the data, and practical issues involved in running large numbers of participants through this experiment.
No analysis results from past literature were found that could be used to determine the ES and total sample
size for the multivariate data assessed in this experiment. This is because the instruments used in this
experiment have either not been used in GPM user comprehension research or were developed specifically
for this experiment so there is no past power or ES results available (as in the case of the questionnaires
assessing task accuracy). In addition to past research, pilot study data is often used to calculate a prior
statistical power and sample size. However, the pilot study in this study revealed that the experiment, as
originally designed, was too difficult and took so long to complete that it created unnecessary mental fatigue
in the participants. This was an unexpected result and, consequently, the actual experiment was redesigned.
Time constraints for experiment data collection did not allow for a second pilot study. Academic course
instructors were understandably reluctant to require students to participate and made it difficult to recruit
large enough numbers of students to participate in the experiment in a timely fashion (ultimately creating
time constraints on the completion of data collection). Thus, it was necessary to rely on statistical charts and
estimates to determine a priori power level and sample size for this experiment. Consequently, after
redesigning the experiment, the very limited pilot study did not produce enough data to determine an
appropriate apriori ES or power level to estimate sample size. Therefore, an a priori power analysis was
conducted using recommendations from statistical literature (Lipsey, 1990; Winer, Brown, & Michels,
1991).

Bret R. Swan Chapter 3 – Research Methodology
Page 110 of 420
A limited review of statistical literature revealed lack of recommendations for determining power in
multivariate data. The power, ES, and sample size was determined using a two-tailed α-level of 0.05 based
on instructions and Figure 2.1 from Lipsey (1990). A medium ES = 0.50 and a minimum of n = 72
participants generates an acceptable power level (1-β) of approximately 0.84 (Lipsey, 1990, p. 44). This
figure assists in the determination of power levels and sample sizes for one-way ANOVAs was suggested as
appropriate (Lipsey, 1990) because individual ANOVAs are the basis of MANOVAs. Table 3-5 shows the
design matrix based on the minimum target number of participants per cell determined by a priori power
analysis. Each of the six treatment cells in the experimental design was assigned a minimum of twelve
students to produce sufficient power to detect a medium result. Table 3-6 shows the degrees of freedom
computations for this experiment based on a minimum of 12 participants per treatment cell.
Table 3-6. Degrees of Freedom for Minimum Desired Number of Participants
Sources of Variation df df* Between Subjects abn-1 (2)(3)(12)-1 = 71
A = type of Graphical Process Model (GPM) a-1 2-1 = 1
B = type of Tacit PM Knowledge (TK) b-1 3-1 = 2
AB (a-1)(b-1) (2-1)(3-1) = 2
Subjects between groups (error between) ab(n-1) (2)(3)(12-1) = 66
Within Subjects abn(c-1) (2)(3)(12)(3-1) = 144
C = type of Explicit BPM Task Information c-1 3-1 = 2
AC (a-1)(c-1) (2-1)(3-1) = 2
BC (b-1)(c-1) (3-1)(3-1) = 4
ABC (a-1)(b-1)(c-1) (2-1)(3-1)(3-1) = 4
C x Subjects within groups (error within) ab(n-1)(c-1) (2)(3)(12-1)(3-1) = 132
Overall abcn-1 (2)(3)(3)(12)-1 = 215 *a=2, b=3, c=3, n=12

Bret R. Swan Chapter 3 – Research Methodology
Page 111 of 420
3.6.2 Estimated Degrees of Freedom and Resulting Sample Sizes
However, due to the nature of the experimental procedures (see Section 3.5 above) and the
schedules of the participants, the actual experiment did not produce an equal number of participants across
treatment cells. A total of eighty-seven students from two universities participated in the experiment,
including twenty-four (24) IE students, thirty-five (35) MGT students, and twenty-eight (28) CS students
representing the independent variable, the type of UET. The number of participants using each type of
GPM also were not equal. Of the IE students, twelve students completed the experiment using metagraphs
and twelve students used UML diagrams. Of the MGT students, seventeen used metagraphs and the other
eighteen used UML diagrams. Of the CS students who participated, twelve used metagraphs and sixteen
used UML diagrams. All eighty-seven (87) participants completed each of the three conditions of the
within-subjects independent variable type of BPI.
3.7 DATA ANALYSES TO TEST HYPOTHESES
The statistical methods used to analyze the data were different depending on the type of test and the
specific hypotheses being tested. The dataset was multivariate in nature, because the three independent
variables used the same set of participants to assess four different dependent variables (Rencher, 2001).
This fact alone required multivariate statistical analyses to verify assumptions of multivariate normality, to
test for preservation of the experiment-wise error rate in future univariate analyses, evaluate the
independence of measures of the dependent variables, test scale reliability, evaluate the cognitive style
distributions between groups, and test for homogeneity of variance and covariance. Therefore, several
preliminary analyses were performed to test the underlying assumptions that permit parametric statistical
analyses of this dataset. The methodologies required and the results of these preliminary analyses are
reported in Appendices M and N. The preliminary analyses did not reveal any results that negatively
impacted the statistical testing of these hypotheses.
Analyses to test the hypotheses of this experiment required several analytic methods, including
correlations, factor analyses, and three-way, mixed multivariate analyses of variance (MANOVAs) and
multivariate analyses of covariance (MANCOVAs). The following sections discuss the specific analyses
used to test each of the hypotheses in this study.

Bret R. Swan Chapter 3 – Research Methodology
Page 112 of 420
3.7.1 Hypothesis 1 Analyses – Impacts of the Type of Graphical Process Model
Hypothesis 1, and associated sub-hypotheses, state that the type of GPM significantly affect
participants’ task performance (i.e., accuracy and timeliness), self-efficacy, and subjective mental workload.
The between-subjects portion of a three-way mixed MANOVA was used to test this hypothesis. The
direction of these statistical results were illustrated using box-plots for the dependent variables accuracy,
timeliness, subjective mental workload, and GPM self-efficacy. (See Section 4.4.1 for these results.)
3.7.2 Hypothesis 2 Analyses – Impacts of the Type of Business Process Information
Hypothesis 2, and its sub-hypotheses, state that the type of BPI significantly affects participants’
task performance (both accuracy and timeliness) and subjective mental workload. Self-efficacy data were
not included in Hypothesis 2 because it was evaluated between-subjects (i.e., once by each participant at the
end of the entire experiment) compared to other dependent variables that were evaluated within-subjects
after each BPI Type. The within-subjects portion of a three-way mixed MANOVA was used to test this
hypothesis. Tests of within-subjects simple contrasts (using both first and last methodologies) were used to
indicate both direction and significance between the different types of BPI: task-centric, resource-centric,
and information-centric BPI. The direction of these statistical results were illustrated using box-plots for the
dependent variables accuracy, timeliness, and subjective mental workload. (See Section 4.4.2 for these
results.)
3.7.3 Hypothesis 3 Analyses – Impacts of the Type of User Educational Training
Hypothesis 3, and associated sub-hypotheses, states that the type of User Educational Training of
participants significantly affect participants’ task performance (i.e., accuracy and timeliness), self-efficacy,
and subjective mental workload. The between-subjects portion of a three-way mixed MANOVA was used
to test this hypothesis. The direction of these statistical results were illustrated using box-plots for the
dependent variables accuracy, timeliness, and subjective mental workload. Additionally, planned
comparisons using simple contrast methodologies were used to indicate both direction and significance
between the different types of UET: IE, MGT, and CS. (See Section 4.4.3 for these results.)

Bret R. Swan Chapter 3 – Research Methodology
Page 113 of 420
3.7.4 Hypothesis 4 Analyses – Subjective Mental Workload Correlations with Task
Performance
Hypothesis 4, and associated sub-hypotheses, state that participants’ task performance is correlated
with subjective reports of mental workload. NASA TLX mental workload was assessed within-subject
three times per participants – at the same point in the experiment as accuracy and timeliness. Because TLX
mental workload was measured within-subjects, three TLX mental workload scores were calculated for each
participant: one for task, resource, and information-centric BPIs. Then, by applying TLX paired comparison
weightings, three TLX mental workload scores were calculated for each participant (for a total n = 261 data
points) (Hart & Staveland, 1988b) (see Appendix L.5). Pearson’s correlations were used to test these
hypotheses relating subjective mental workload to accuracy and time. In addition, plots of cubic polynomial
equations and the statistical significance of the curve fit lines were used to evaluate the negative quadratic,
inverted-U inverse relationship specified by the Yerkes-Dodson law. (See Section 4.4.4 for these results.)
3.7.5 Hypothesis 5 Analyses – Subjective Mental Workload Correlation with Self-Efficacy
Hypothesis 5 states that GPM self-efficacy is negatively correlated with the subjective mental
workload participants experience during task performance. Self-efficacy was measured between subjects
using nine separate questions and an overall score per participant was averaged from participant’s responses
to these questions (see Section 4.3.4 for details). An overall TLX mental workload score for each
participant (n = 87) was created by averaging the three ratings of each TLX dimension and then the TLX
paired comparison ratings were applied. Pearson’s correlations were used to test this hypothesis.
Additionally, a factor analysis of between-subjects self-efficacy assessments and evaluations of TLX mental
workload were performed to evaluate the associations between these variables. (See Section 4.4.5 for these
results.)
3.7.6 Hypothesis 6 Analyses – Cognitive Style and Subjective Mental Workload
Hypothesis 6 states that participants’ cognitive styles of extraversion-introversion and sensing-
intuition, as assessed by the Myers-Briggs Type Indicator (MBTI), significantly affects the subjective
mental workload participants experience during task performance. Pearson’s correlations were used to test
this hypothesis; additionally, tests of these MBTI cognitive styles were evaluated as covariates using both
the between-subjects and within-subjects sections of a MANCOVA. (See Section 4.4.6 for these results.)
Bret R. Swan Chapter 3 – Research Methodology
Page 114 of 420
3.7.7 Hypothesis 7 Analyses – General Cognitive Abilities and Subjective Mental Workload
Hypothesis 7 states that participants’ general cognitive abilities, as assessed by the WPT,
significantly affect the subjective mental workload they experience during task performance. Pearson’s
correlations were used to test this hypothesis. Additionally, participants’ General Cognitive Abilities scores
(using WPT scores) were tested as covariates in both the between-subjects and within-subjects portions of a
MANCOVA. (See Section 4.4.7 for these results.)
3.7.8 Hypothesis 8 Analyses – Attentional Abilities and Subjective Mental Workload
Hypothesis 8 states that participants’ attentional abilities, as assessed by the DAPI, significantly
affect the subjective mental workload they experience during task performance. Pearson’s correlations were
used to test the relationship between evaluations of TLX mental workload and DAPI assessments of four
attentional abilities. Four MANCOVAs testing each of the four DAPI constructs as covariates were also
used to test these hypotheses. (See Section 4.4.8 for these results.)
3.8 PREMISES
Several premises are fundamental to the design and accomplishment of this study as outlined here.
The following sections outline these fundamental premises.
3.8.1 A Lab Experiment is More Appropriate than Field Research to Test these Hypotheses
Because of the abundance of prior related literature but empirical research was limited in studying
BPM Systems, a lab experiment was selected a logical starting point to establish an empirical baseline for
comparison in future research. Agarwal et al. (1999, p. 542) states that:
“… experiments are a preferred research strategy when the cumulative body of knowledge related to a specific phenomenon is limited. It increases the internal validity of the study, albeit at the expense of some realism. Experimental findings can then be used to refine existing theory or develop new theory to be tested in the field.”
However, a laboratory experimental research strategy is often criticized because of various threats
to validity. Despite methodological drawbacks, the BPM System and GPM user comprehension literature

Bret R. Swan Chapter 3 – Research Methodology
Page 115 of 420
can benefit from this study as it can be used to refine and extend the research model for future experimental
research and in future field studies.
3.8.2 University Students are Suitable Participants for this Study
Besides providing a measure of control for tacit BPM knowledge (see Section 3.10.2.1), students
were appropriate for this research because the GPMs used in this study are not yet widely used by BPM
managers. Practitioners that use BPM Systems are novices when it comes to interpreting metagraphs and
UML diagrams. Although UML diagrams are becoming the defacto standard for information system
developers (Basu & Blanning, 2000; Vernadat, 2002), the literature does not report UML diagrams as being
used extensively by managers in BPM Systems. The literature only reports UML diagrams as proposed
extensions for BPM system development (Eriksson & Penker, 2000; Vernadat, 2002). In like manner,
metagraphs have been proposed, but not utilized, as yet, in BPM Systems (Basu & Blanning, 2000).
Therefore, students are suitable substitutes for BPM managers because they are also novices in
understanding how to use and interpret these types of GPMs.
3.8.3 Boundaries of the Cognitive System Extends Beyond the Individual
This research also rests on the premise that the boundaries of a cognitive system can be extended to
include cognitive resources external to the participants as well as individual cognitive differences that exist
within the minds of the participants (Hollan, Hutchins, & Kirsh, 2000; Nardi, 1998) (see Section 2.5). This
means it is appropriate to operationalize these elements as impacting GPM user comprehension.
3.9 THREATS TO VALIDITY
A lab experiment was selected as the most appropriate strategy for studying GPM user
comprehension in the context of BPM and BPM Systems. However, an experimental research strategy is
also often criticized for threats to internal and statistical validity, in addition to low generalizability. For
example, Jarvenpaa, Dickson, and DeSanctis (1985) describe the lack of an underlying theory, the
proliferation of measurement instruments, inappropriate research designs, and a diversity of experimental
tasks as some of the weaknesses often found in experimental lab research. The following sections briefly

Bret R. Swan Chapter 3 – Research Methodology
Page 116 of 420
discuss the potential threats to validity and how the experimental methodology in this dissertation addresses
these threats.
3.9.1 Threats to Internal Validity
There were several possible threats to internal validity that needed to be addressed in this study, for
example, training effects, task order, participant assignment to treatment groups, treatment date and time,
lab condition, and proliferation of instruments.
3.9.1.1 Bias Due to Training Effects
Participants’ lack of experience with a given GPM modeling technique may affect the internal
validity of this research due to learning effects (Pedhazur & Schmelkin, 1991). This means that the results
for each experimental task may be biased due to a learning curve during the within-subjects portions of the
experimental tasks or due to participant differences in learning during training. The students did not have
experience interpreting the GPMs or answering the questionnaires that ask them to interpret each type of
BPI. Thus, novice participants’ performance may be due more to what they learned from interpreting the
prior type of BPI than their ability to interpret the current BPI. Or, differences in what participants gain out
of training may affect GPM user comprehension outcomes. These issues can make it difficult to separate
the learning effects from the actual task performance effects.
To address this issue, a training task and training procedure was designed to give participants
experience with every GPM symbol, question, and assessment instrument they would see during the actual
experiment. All participants were given the same verbal and written instructions and allowed to practice
interpreting all the BPI and GPM symbols. Participants were given examples of all types of questions,
asked to figure out the answers, and checked their answers on the back of the questionnaires. Participants
were also allowed to use the training handouts during the experiment. This strategy helped to minimize the
extraneous effects due to learning bias.
Originally, participants were to be given three simple GPM models to interpret and get 100%
correct during the training phase before being allowed to proceed to the experiment. However, during the
pilot study, this approach provide impractical. It took participants too long to complete the training. Also,
since participants completed the training at different times, management of the participants in the treatment

Bret R. Swan Chapter 3 – Research Methodology
Page 117 of 420
groups was too difficult. Therefore, the training phase was changed to reflect the process described in the
previous paragraph and Section 3.5. Consequently, a limitation of this experiment is that there is no data
that demonstrate all participants have the same minimum level of training.
3.9.1.2 Bias Due to Task Order Effects
The order that the experimental tasks was presented to participants can create bias in these data
(Pedhazur & Schmelkin, 1991; Winer et al., 1991). To address this issue, the order that the BPM tasks were
presented to participants were counterbalanced reduce order effects (as discussed in Section 3.5 number 13).
A pilot study was also conducted that assessed potential threats to validity due to order effects and to ensure
that the materials were administered without variability between the treatment groups.(see Appendix G and
H for pilot study details).
3.9.1.3 Bias Due to Assignment of Participants to Treatment Groups
These results may be suffer from bias created by participants’ not being assigned to treatment
groups in a way that balanced their cognitive styles, cognitive abilities, or tacit knowledge (Pedhazur &
Schmelkin, 1991; Winer et al., 1991). For example, if too many participants from a single academic major
or possessing similar cognitive styles were assigned to one treatment group, the results would likely be
biased towards that specific cognitive ability or cognitive style. Consequently, the statistical analyses may
show a significant effect due to cognitive styles or cognitive abilities of the participants when, in fact, the
result was due to another variable.
The ability to recruit participants with a balance of cognitive styles was not possible in this
experiment. In the real-world, individuals self-select to their particular field of study, which causes a bias
toward a particular profile of cognitive styles (Kroeger, Thuesen, & Rutledge, 2002). Additionally, since
the participation was both voluntary or required, and treatment group scheduling did not lend itself to
counterbalancing cognitive styles within groups, there was no way to control for participant cognitive styles
in this experiment. The cognitive styles of participants within treatment groups may have caused problems
with external validity because it was impossible to completely randomize the assignment of participants to
treatment groups.

Bret R. Swan Chapter 3 – Research Methodology
Page 118 of 420
This experiment was designed with interventions to help reduce or account for this bias. First,
participants were recruited based on a self-selected types of user educational training. The cognitive styles
of participants may reflect similar cognitive styles of BPM managers that obtain degrees from the same
academic field. It is hoped that this provided a measure of external validity and reflects a representative
sample of their counterpart BPM practitioners. However, specific cognitive style research have not been
conducted on BPM practitioners, so there are no studies to validate this supposition.
Second, participants cognitive styles and cognitive abilities were assessed and their impacts
evaluated in hypotheses and post-hoc analyses. Third, the participants’ prior experience with GPMs,
modeling software, and BPM were assessed and evaluated, as well as the academic courses that students
that have taken that relate to GPM user comprehension (see Appendices L.1 or L.2). These three strategies
should give an understanding of the cognitive style and prior experience profiles of the participants to
determine if the treatment group assignment caused biased results due to their cognitive styles, cognitive
abilities, and tacit knowledge. (See Appendix O results of exploratory analyses results related to these
variables.)
3.9.1.4 Bias Due to Treatment Date and Time
The date, time of day, or location could bias participants’ results (particularly timeliness) (Pedhazur
& Schmelkin, 1991). For example, people might have performed better if the experimental task was
scheduled in the morning when they were rested as opposed to the end of the day when they were tired. To
address this issue, treatment times were scheduled, as far as possible, in the later afternoon or evenings.
Also, the date and time of the experiment was tracked for possible analysis as a blocking variable.
3.9.1.5 Bias Due to Lab Conditions
Differences in lab conditions and environments could bias the results (Pedhazur & Schmelkin,
1991; Winer et al., 1991). Due to participants coming from different universities and different academic
majors, the experiment needed to be conducted in different rooms and locations. The design of the
experiment itself helped control for this bias. Due to the fact that the GPMs were wall mounted and the
assessments were on paper, the experiment was easily portable. The requirements for the experiment were
that the GPMs could be mounted on walls in a classroom that allowed participants enough room to
comfortably view the GPMs while standing. Also, desks and clipboards were made available so that

Bret R. Swan Chapter 3 – Research Methodology
Page 119 of 420
participants could either sit or stand comfortably completing the assessment instruments. This design
allowed for comparable lab conditions across lab experiment locations.
3.9.1.6 Proliferation of Instrumentation
Threats to internal validity can also be due to the proliferation of assessment instruments in an
experiment (Jarvenpaa et al., 1985). For example, participants may be asked to complete so many
assessment instruments that they become mentally fatigued and do not concentrate on what is being
assessed. Also, the variety of assessment instruments may produce different types of data (e.g., categorical,
interval, ordinal, or continuous) that cannot be easily or justifiably compared or statistically analyzed.
Two methodological design choices were made to address these issues. First, the instruments used
in this research were designed to gather, as far as possible, continuous data from well-documented,
validated, and widely-used instruments. For example, the continuous data collected included accuracy
(percent correct), time (in seconds), NASA TLX subjective mental workload dimension scores (using a
continuous scale in millimeters), the WPT score (numerical), and the MBTI dimension scores (numerical).
Only the DAPI and the GPM self-efficacy assessments used likert-type scales.
Second, the number of assessment instruments that participants had to fill out at one time were
minimized to reduce mental fatigue. For example, MBTI, demographics, and DAPI assessments were filled
out by participants on their own time and were brought to the experiment already completed. Task accuracy
questionnaires were filled out during the experiment and NASA-TLX dimensions were able to be quickly
assessed after task accuracy questionnaires were completed. The end of the experiment was the only time
that participants had to fill out multiple assessments: the last TLX dimension assessment, the paired
comparisons, and the GPM self-efficacy questionnaire. Even if they were fatigued, these three assessments
were so dissimilar that participants had to exert a measure of concentration to complete them. The self-
efficacy instrument could be the most vulnerable to instrument proliferation issues as it was easy for
participants to take lightly, because it was the last instrument they filled out in the entire experiment.
3.9.2 Threats to External Validity
Lab experiments in the classical scientific tradition suffer from threats to external validity (Kuutti,
1995; Pedhazur & Schmelkin, 1991). As a result, this lab study could have suffered from several types of

Bret R. Swan Chapter 3 – Research Methodology
Page 120 of 420
threats to external validity as it relates to real-world BPM contexts (Pedhazur & Schmelkin, 1991; Winer et
al., 1991), including using students as substitutes for BPM managers, external validity of real-world tasks,
and student participant motivation.
3.9.2.1 Using Students as Substitutes for BPM Practitioners
The primary threat to external validity was that this study uses students to represent real-world
managers with BPM expertise. In real-world BPM contexts, even general domain knowledge is based on
experience over time in one or more specific contexts. Student participants did not have real-world BPM
System experience. The risk is that results obtained from these students might not be applicable to BPM
System practitioners.
However, if real-world BPM managers were used in this experiment instead of students, the amount
and type of UET could not be easily controlled for in an experiment. Variations in tacit BPM knowledge in
real-world managers is difficult to control, since their knowledge is usually specific to a given organization,
business process, and affected by other factors, such as, age, years of experience in the company, or
particular job responsibilities. This reality would likely confound the results if real-world BPM managers
were participants in this experiment.
Students provide a measure of control for tacit BPM knowledge, operationalized in this study as
UET. Students within a specific academic major were likely to have a similar level of educational training
(although individual grades may vary), because they were required to take same major courses with similar
course content. These similar educational experiences give students similar levels of tacit knowledge and
experience related to BPM and the GPMs used in this study. Also, because students were self-selecting to
their professional pursuits and academic majors, they are more likely to possess cognitive abilities and
cognitive styles similar to BPM practitioners with the same educational training and who also self-selected
to their particular jobs and academic education.
Students were not asked to perform BPM tasks that require actual BPM expertise. Instead, students
were asked to interpret general types of BPI portrayed in the GPMs. Because specific BPM tasks were not
the focus of this study and held constant in this experiment, differences in tacit BPM knowledge of
participants were conceptualized as user educational training. It is assumed that the cognitive processes are
similar for students as well as BPM managers as they interpret BPI portrayed from GPMs. Thus, students
were believed to be good substitutes for BPM practitioners.

Bret R. Swan Chapter 3 – Research Methodology
Page 121 of 420
Furthermore, BPM Systems and these types of GPMs are not yet widely used by BPM practitioners.
It was highly unlikely that BPM IT managers, process managers, management executives, and other middle
managers would have any experience with these GPMs. Since practitioners would likely be novices in
using these GPMs, research using university students would provide an indicator of how easily these GPMs
can be understood. Therefore, students serve as the best possible surrogates for BPM practitioners and
should provide a measure of external validity to real-world contexts that BPM practitioners could not
provide because of the wide range of BPM contexts.
3.9.2.2 Lack of External Validity to Real World BPM Tasks
Lab experiments are criticized for being unrealistic when results are extrapolated to real-world
tasks. Experimental tasks in the context of BPM Systems are even more difficult to create, because so many
BPM tasks are unique to an organization, their business processes, and the required BPI.
These issues were addressed in this research in two ways. First, this experiment only required
participants to understand and interpret BPI. This experiment did not require participants to apply this
knowledge to a specific BPM decision-making context. As a result, GPM user comprehension is likely a
similar cognitive activity for the experiment participants and BPM practitioners. These strategies should
help these results be relatively generalizeable to the real world.
Second, using a real-world BPM task would provide a level of external validity of the results. The
GPM user comprehension tasks in this study were modeled using a bank loan process that is similar across
many financial organizations. Also, participants were not required to understand the business process to
interpret the GPMs. Answers to questions used generic reference labels. Participants were provided with
legends describing what the reference labels meant in relation to the bank loan process to help the
interpretation of the GPMs. Thus, the experimental tasks in this research should provide a degree of
external validity greater than many other lab experiments.
3.9.2.3 Motivation of Student Participants
Another issue is that students in lab experiments are usually not motivated to perform tasks in the
same way as real-world managers, thus decreasing external validity. Interventions were needed to motivate

Bret R. Swan Chapter 3 – Research Methodology
Page 122 of 420
students to both participate and to optimize their individual performance on the experimental tasks as per
motivational literature (Campbell, Dunnette, Lawler, & Weick, 1970; Hertzberg, 1968; Klein, 1982).
Regarding students’ motivation to participate, CS and MGT students volunteered without additional
motivators for the experiment. IE students were required by their professor to participate and given points
toward their course grade for participation. At the small U.S. university in Hawaii, MGT and CS students
received an additional motivation to participate, pizza and soda, because not enough students volunteered
initially. This incentive was not offered to CS, IE, or MGT students that volunteered at the large
southeastern U.S. university.
Regarding students’ motivation to optimize their performance, the motivation was the same for all
students. The students were told that the top performing student in each academic major would be given a
$100 gift certificate to the retailer of their choice. The top overall performer in the experiment would be
given a $200 gift certificate. Although based on prior research, these two categories of motivation did not
directly correlate to real-world practitioner motivations. This is a drawback of lab studies, regardless of
whether students or practitioners are used as participants.
3.9.3 Threats to Statistical Validity
Threats to statistical validity in this study included multivariate data analyzed using univariate
statistics and statistical power related to the sample size (Pedhazur & Schmelkin, 1991; Winer et al., 1991).
3.9.3.1 Multivariate Data Analyzed with Univariate Statistics
The greatest threat to statistical validity is the improper analysis and interpretation of the
multivariate data by the misapplication of univariate statistics. Multivariate data require preliminary
statistical tests be passed before the data can be analyzed to test hypotheses (Rencher, 2001). When
preliminary multivariate hypothesis tests are conducted, the results and conclusions can be statistically
supportable. Without passing preliminary multivariate tests of independence, there is no way to be sure the
experiment-wise error-rate is preserved in further univariate analyses. (For a more detailed discussion and
results pertaining to this topic, see Appendices M and N.)

Bret R. Swan Chapter 3 – Research Methodology
Page 123 of 420
3.9.3.2 Sample Size and Statistical Power
Another potential problem with statistical validity is that there might not be enough statistical power
to detect differences in the results. Statistical power was calculated based on several factors: level of
significance, effect size, sample size, and the degrees of freedom for the F-ratios (Winer et al., 1991, p. 126).
The factor most under control of the researcher was sample size. The power, ES, and sample size was
determined using a two-tailed α-level of 0.05 based on instructions and Figure 2.1 from Lipsey (1990). A
medium ES = 0.50 and a minimum of n = 72 participants generates an acceptable power level (1-β) of
approximately 0.84 (Lipsey, 1990, p. 44). Therefore, a minimum of twelve participants in each of the six
treatment cells (for a total n = 72 participants) was deemed appropriate to provide statistical power
sufficient to detect medium ES in the results (see Tables 3-5 and 3-6).
In summary, the research methodology used in this dissertation addresses the common problems in
experimental research (Jarvenpaa et al., 1985). Consequently, the lab experiment methodology used in this
study is expected to provide a sufficient level of internal, external, and statistical validity. The next chapter
presents the data, results, and analyses produced by these research methods.

Bret R. Swan Chapter 3 – Research Methodology
Page 124 of 420

Bret R. Swan Chapter 4 – Experimental Results
Page 125 of 420
C h a p t e r F o u r
CHAPTER 4 – EXPERIMENTAL RESULTS
This chapter summarizes the experiment and reports its results. The descriptive statistics are
presented in Section 4.1. Section 4.2 describes the results of each of the dependent and moderating
variables. Section 4.3 discusses the results of preliminary analyses. Results from testing each of the
hypotheses are presented in Section 4.4. Finally, Section 4.5 summarizes the overall results of the
experiment.
4.1 DESCRIPTIVE STATISTICS
As described in chapter 3, the resulting multivariate data were based on an experimental design that
combined three independent variables: two between-subjects variables (the type of Graphical Process Model
[GPM] and the type of User Educational Training [UET]) and one within-subjects variable (the type of
Business Process Information [BPI]). The following two subsections describe the dataset and demographic
variables pertinent to this study.
4.1.1 Dataset Characteristics
There were a total of 87 students from two universities who participated in the experiment. Table
4-1 provides a breakdown of the participants according to several categorical variables pertinent to this
study. Due to student participation in the study being primarily voluntary (except for the industrial
engineering students), the number of participants were not equal across groups representing two of the three
independent variables. There were a total of 24 industrial engineering (IE) majors, 35 business management
(MGT) majors, and 28 computer science (CS) majors that participated in the experiment as representatives
for the independent variable, the type of User Educational Training (UET1-3). The number of participants
representing groups who used each type of Graphical Process Models (GPM1-2) were also not equal. Of the
24 IE students, 12 students completed the experiment using metagraphs and 12 students used UML
diagrams. Of the MGT students, 18 used UML diagrams and the other 17 used metagraphs in the
experiment. CS students participated with 12 using metagraphs and 16 using UML diagrams. All 87

Bret R. Swan Chapter 4 – Experimental Results
Page 126 of 420
participants completed each of the three conditions of the within-subjects independent variable type of
Business Process Information (BPI1-3).
Table 4-1. Demographics of Participants (n = 87).
Type of User
Educational Training
Type of Graphical Process Model
Type of Business Process
Information
University Attending Gender
Learned English as 1st
Language Age
(UET1-3) (GPM1-2) (BPI1-3)* A B Male Female Yes No Mean Std. Dev.
UML (GPM1)
12 12 0 8 4 7 5 21.83 1.08
Metagraph (GPM2)
12 12 0 7 5 10 2 22.00 2.22
Industrial Engineering (IE) (UET1)
UET1 Totals 24 24 0 15 9 17 7 21.92 1.69
UML (GPM1)
18 8 10 12 6 12 6 23.17 2.83
Metagraph (GPM2)
17 5 12 11 6 13 4 24.00 3.14 Management (MGT) (UET2)
UET2 Totals 35 13 22 23 12 25 10 23.57 2.97
UML (GPM1)
16 11 5 12 4 13 3 21.94 2.18
Metagraph (GPM2)
12 7 5 12 0 8 4 22.25 2.09 Computer Science (CS) (UET3)
UET3 Totals 28 18 10 24 4 21 7 22.07 2.48
Experiment Totals 87 45 32 62 25 63 24 22.63 2.61
*All Participants interpreted all three types of BPI portrayed by a GPM: BPI1 = Task-Centric BPI BPI2 = Resource-Centric BPI BPI3 = Information-Centric BPI
Total n = 87
4.1.2 Participant Demographics
Table 4-1 also shows the breakdown of the results of categorical variables representing the
university, gender, first language, and age of the participants. Complete data from 87 students were used in
this experiment. The average age of the participants was 22.63 years (SD = 2.61). There were a total of 62
men (average age, M = 23.15, SD = 2.80) and 25 women (average age, M = 21.36, SD = 1.41) that
participated, 38% of the IE, 34% of the MGT, and 14% of the CS majors being women. Of all the
participants, 24 of the 87 participants did not learn English as their first or native language. The

Bret R. Swan Chapter 4 – Experimental Results
Page 127 of 420
representation of non-native English speakers in each of the three educational groups was almost evenly
spread between 25% and 30%. Forty-five (45) participants were from University A with the other 32
participants coming from University B. It is important to note that all 24 IE students that took part in this
experiment came from University A, because university B did not have an industrial engineering program.
Also, it was very difficult to recruit MGT students from university A to participate in this experiment while
university B participants were more willing to participate. As a consequence, more MGT students
participated from university A than university B.
4.1.3 Summarizing the Dataset
In summary, the dataset of 87 participants was multivariate by definition, since the same dataset of
three independent variables was used to analyze the results of four dependent variables. Cell sizes for two
of the between-subject independent variables were unequal, but each contained a minimum complete
treatment cell size of at least 12 participants. There seemed to be a fairly balanced representation of men to
women (except from CS students), and there appeared to be a relatively equal balance of native to non-
native English speakers across groups. There was not a equal percentage of women in CS between
participant experimental groups from university A and B.
Preliminary analyses were conducted to assure the data was analyzed and interpreted properly.
Subsequent data analyses testing the hypotheses in this study describes the data representing each variable,
takes into account the unequal cell sizes, and the multivariate nature of the data.

Bret R. Swan Chapter 4 – Experimental Results
Page 128 of 420
Table 4-2. Cell numbers, means, and standard deviations for task accuracy in percent correct (n = 87)..
Dependent Variable: Accuracy (Percent Correct)
Type of GPM Type of User Educational Training
Type of Business Process Information n Mean
Std. Deviation
UML Diagrams IE: Industrial Engineering Task-centric 12 59.38 12.07 Resource-centric 12 63.33 18.75 Information-centric 12 57.14 19.26 Total 36 59.95 16.72 MGT: Management Task-centric 18 63.19 15.14 Resource-centric 18 51.11 18.44 Information-centric 18 55.56 20.14 Total 54 56.62 18.38 CS: Computer Science Task-centric 16 62.50 16.46 Resource-centric 16 58.75 23.63 Information-centric 16 64.29 18.07 Total 48 61.85 19.35 Total Task-centric 46 61.96 14.66 Resource-centric 46 56.96 20.64 Information-centric 46 59.01 19.19 Total 138 59.31 18.33 Metagraphs IE: Industrial Engineering Task-centric 12 82.29 9.91 Resource-centric 12 83.33 14.36 Information-centric 12 77.38 18.73 Total 36 81.00 14.59 MGT: Management Task-centric 17 75.00 11.69 Resource-centric 17 70.59 21.35 Information-centric 17 65.55 17.54 Total 51 70.38 17.42 CS: Computer Science Task-centric 12 80.21 9.91 Resource-centric 12 70.00 23.36 Information-centric 12 71.43 18.27 Total 36 73.88 18.12 Total Task-centric 41 78.66 10.91 Resource-centric 41 74.15 20.61 Information-centric 41 70.73 18.34 Total 123 74.51 17.30 Total IE: Industrial Engineering Task-centric 24 70.83 15.93 Resource-centric 24 73.33 19.26 Information-centric 24 67.26 21.26 Total 72 70.48 18.85 MGT: Management Task-centric 35 68.93 14.66 Resource-centric 35 60.57 21.96 Information-centric 35 60.41 19.32 Total 105 63.30 19.13 CS: Computer Science Task-centric 28 70.09 16.44 Resource-centric 28 63.57 23.76 Information-centric 28 67.35 18.18 Total 84 67.00 19.65 Total Task-centric 87 69.83 15.43 Resource-centric 87 65.06 22.25 Information-centric 87 64.53 19.59 Total 261 66.47 19.37

Bret R. Swan Chapter 4 – Experimental Results
Page 129 of 420
4.2 DESCRIPTIONS OF INDIVIDUAL VARIABLE RESULTS
The following section reports basic statistics for each dependent and moderating variable used in
this experiment in relation to the independent variables. The default level of significance used in this study
was p ≤ 0.05. In addition, several analyses used estimated marginal means due to unbalanced group sizes.
4.2.1 Dependent Variable: Accuracy
Task accuracy was measured by the percent of correct answers to questionnaires about participants’
interpretation of eight task-centric, five resource-centric, and seven information-centric BPI questions (see
Appendix L.3 for the task accuracy questionnaire). Table 4-2 lists the cell numbers, means, and standard
deviations for the accuracy results related to the three independent variables. Eighty-seven (87) participants
were measured three times during the experiment (i.e., after interpreting each of the types of BPI), hence,
producing a total of 261 degrees of freedom. Table 4-3 and 4-4 shows the relevant sections of results for
accuracy from the between and within portions of the repeated measures MANOVA (reported in Tables 4-
26 and 4-29).
Table 4-3. Relevant MANOVA results describing between-subject main effects and interactions for task accuracy (see Table 4-26) (n = 87).
Dependent Variable: Accuracy (Percent Correct)
Source Type III Sum
of Squares df Mean
Square F Sig. GPM Type 15420.835 1 15420.83 41.56 .000*** UET Type 2208.76 2 1104.38 2.98 .057† GPM Type X UET Type 877.04 2 438.52 1.18 .312 Error 30053.89 81 371.04
†p < 0.10 *p < 0.05 **p < 0.01 ***p < 0.001

Bret R. Swan Chapter 4 – Experimental Results
Page 130 of 420
Table 4-4. Relevant MANOVA results describing within-subject main effects and interactions for task accuracy (see Table 4-28) (n = 87).
Dependent Variable: Accuracy (Percent Correct)
Source Sphericity Correction
Type III Sum of Squares df
Mean Square F Sig.
BPI Type Huynh-Feldt 1293.52 1.93 670.14 2.29 .107
BPI Type X GPM Type Huynh-Feldt 318.63 1.93 165.07 .56 .564
BPI Type X UET Type Huynh-Feldt 1175.30 3.86 304.45 1.04 .387
BPI Type X GPM Type X UET Type Huynh-Feldt 509.69 3.86 132.03 .45 .765
Error (BPI Type) Huynh-Feldt 45765.93 156.35 292.72 †p < 0.10 *p < 0.05 **p < 0.01 ***p < 0.001 a Computed using alpha = 0.05
The results from Table 4-3 show , at the level of the whole individual, that there was a significant
effect of GPM type on task accuracy, F(1,81)=41.562, p = 0.000. There was no significant effect of the
type of UET on task accuracy at the p = 0.05 level of significance, F(1,81)=2.98, p = 0.057. Within-
subjects, the type of BPI was not significant below p < 0.05 even when corrections were made for sphericity
(see Table 4-4). These results are illustrated below in Figures 4-1, 4-2, and 4-3.

Bret R. Swan Chapter 4 – Experimental Results
Page 131 of 420
Type of Graphical Process ModelMetagraphsUML Diagrams
Estim
ated
Mar
gina
l Mea
ns85
80
75
70
65
60
55
CS: Computer Science
MGT: Management
IE: Industrial Engineering
Type of User Educational Training
Estimated Marginal Means of Task Accuracy (Percent Correct)
Figure 4-1. The mean accuracy for UML diagram users was lower than Metagraph users across all types of User Educational Training.
Type of Graphical Process ModelMetagraphsUML Diagrams
Estim
ated
Mar
gina
l Mea
ns
80
75
70
65
60
55
Estimated Marginal Means of Task Accuracy (Percent Correct)
Information-related Process Information
Resource-related Process Information
Task-related Process Information
Type of Business Process Information
Figure 4-2. The mean accuracy for UML diagram users was lower than Metagraph users across all types of Business Process Information.

Bret R. Swan Chapter 4 – Experimental Results
Page 132 of 420
Type of Business Process Information
Information-related Process Information
Resource-related Process Information
Task-related Process Information
Estim
ated
Mar
gina
l Mea
ns
72.5
70
67.5
65
62.5
60
Estimated Marginal Means of Accuracy (Percent Correct)
CS: Computer Science
MGT: Management
IE: Industrial Engineering
Type of User Educational Training
Figure 4-3. The type of User Educational Training appears to influence accuracy results
as well as the type of Business Process Information.
Figures 4-1 and 4-2 show the strong effect of the type of GPM overshadowing the impacts of the
type of UET and the type of BPI. Figure 4-3 shows differences, although not statistically significant below
p < 0.05, in accuracy due to both the type of UET and the types of BPI .
4.2.2 Dependent Variable: Timeliness
Timeliness was measured by evaluating the time that participants took to complete the task,
resource, and information-centric BPI questionnaires (in seconds). In this study, low timeliness was
interpreted as taking a long time to finish the questionnaires. Conversely, high timeliness was interpreted as
shorter amounts of time taken to finish experiment questionnaires. Timeliness was measured at the same
three times as the accuracy measures. Table 4-5 lists the cell numbers, means, and standard deviations for
the timeliness results related to the three independent variables. Tables 4-6 and 4-7 show the relevant
MANOVA sections for the timeliness results.

Bret R. Swan Chapter 4 – Experimental Results
Page 133 of 420
Table 4-5. Cell numbers, means, and standard deviations for task timeliness (n = 87).
Dependent Variable: Timeliness (Seconds)
Type of GPM Type of User Educational Training
Type of Business Process Information n Mean
Std. Deviation
UML Diagrams IE: Industrial Engineering Task-centric 12 315.58 107.96 Resource-centric 12 355.33 157.83 Information-centric 12 352.58 160.83 Total 36 341.17 141.28 MGT: Management Task-centric 18 308.67 90.86 Resource-centric 18 342.22 83.87 Information-centric 18 398.11 96.39 Total 54 349.67 96.29 CS: Computer Science Task-centric 16 273.19 42.75 Resource-centric 16 332.63 78.29 Information-centric 16 375.56 97.55 Total 48 327.13 85.88 Total Task-centric 46 298.13 83.21 Resource-centric 46 342.30 104.25 Information-centric 46 378.39 115.50 Total 138 339.61 106.36 Metagraphs IE: Industrial Engineering Task-centric 12 205.75 46.42 Resource-centric 12 209.00 45.55 Information-centric 12 263.83 82.70 Total 36 226.19 64.88 MGT: Management Task-centric 17 255.59 98.72 Resource-centric 17 259.00 82.30 Information-centric 17 319.18 104.97 Total 51 277.92 98.40 CS: Computer Science Task-centric 12 248.75 50.99 Resource-centric 12 320.42 165.10 Information-centric 12 315.25 142.12 Total 36 294.81 129.72 Total Task-centric 41 239.00 75.38 Resource-centric 41 262.34 112.45 Information-centric 41 301.83 111.62 Total 123 267.72 103.79 Total IE: Industrial Engineering Task-centric 24 260.67 98.75 Resource-centric 24 282.17 135.99 Information-centric 24 308.21 133.03 Total 72 283.68 123.56 MGT: Management Task-centric 35 282.89 97.15 Resource-centric 35 301.80 92.12 Information-centric 35 359.77 106.93 Total 105 314.82 103.33 CS: Computer Science Task-centric 28 262.71 47.18 Resource-centric 28 327.39 120.62 Information-centric 28 349.71 120.16 Total 84 313.27 107.38 Total Task-centric 87 270.26 84.54 Resource-centric 87 304.62 114.81 Information-centric 87 342.31 119.39 Total 261 305.73 110.94

Bret R. Swan Chapter 4 – Experimental Results
Page 134 of 420
The MANOVA results listed in Table 4-6 (from the relevant sections of Table 4-26) show, at the
level of the whole individual, there was a significant effect of the type of GPM on task timeliness,
F(1,81)=17.51, p = 0.000. The effects of the type of UET on task timeliness was not statistically
significant. Within-subjects, there was a significant effect of BPI type on task timeliness, F(1,81)=17.94,
p = 0.000 (see Table 4-7). These differences are illustrated in Figures 4-4, 4-5, and 4-6 below.
Table 4-6. Relevant MANOVA results describing between-subject main effects and interactions for task timeliness (n = 87).
Dependent Variable: Timeliness (in seconds)
Source Type III Sum
of Squares df Mean
Square F Sig. GPM Type 337171.15 1 337171.15 17.51 .000*** UET Type 43710.18 2 21855.09 1.14 .327 GPM Type X UET Type 65593.62 2 32796.81 1.70 .189 Error 1559935.88 81 19258.47 †p < 0.10 *p < 0.05 **p < 0.01 ***p < 0.001
Figures 4-4 and 4-5 show that users of metagraphs took significantly less time (i.e., greater
timeliness) compared to users of UML Diagrams. Figure 4-6 also illustrates the slight interaction between
the type of GPM and the type of UET. CS participants took the least amount of time using UML diagrams,
but took the most amount of time when using metagraphs compared to the other two categories of UET.
Figure 4-6 shows differences for timeliness results between different types of BPI. Task-centric BPI was
interpreted in the least amount of time (more timely) compared to information-centric BPI that was
interpreted in the largest amount of time (less timely) across all types of UET.

Bret R. Swan Chapter 4 – Experimental Results
Page 135 of 420
Table 4-7. Relevant MANOVA results describing within-subject main effects and interactions for timeliness (n = 87).
Dependent Variable: Timeliness (in seconds)
†p < 0.10 *p < 0.05 **p < 0.01 ***p < 0.001
Source Type III Sum
of Squares df Mean
Square F Sig.
BPI Type Sphericity Assumed 203676.36 2 101838.18 17.94 .000***
BPI Type X GPM Type Sphericity Assumed 3750.26 2 1875.13 .33 .719
BPI Type X UET Type Sphericity Assumed 28679.85 4 7169.96 1.26 .287
BPI Type X GPM Type X UET Type
Sphericity Assumed 19068.67 4 4767.17 .84 .502
Error (BPI Type)
Sphericity Assumed 919765.56 162 5677.56
a Computed using alpha = 0.05
Type of Graphical Process ModelMetagraphsUML Diagrams
Estim
ated
Mar
gina
l Mea
ns
340
320
300
280
260
240
220
CS: Computer Science
MGT: Management
IE: Industrial Engineering
Type of User Educational Training
Estimated Marginal Means of Time (Seconds)
Figure 4-4. The type of Graphical Process Model appears to significantly influence timeliness results along with small interaction due to the type of User Educational
Training.
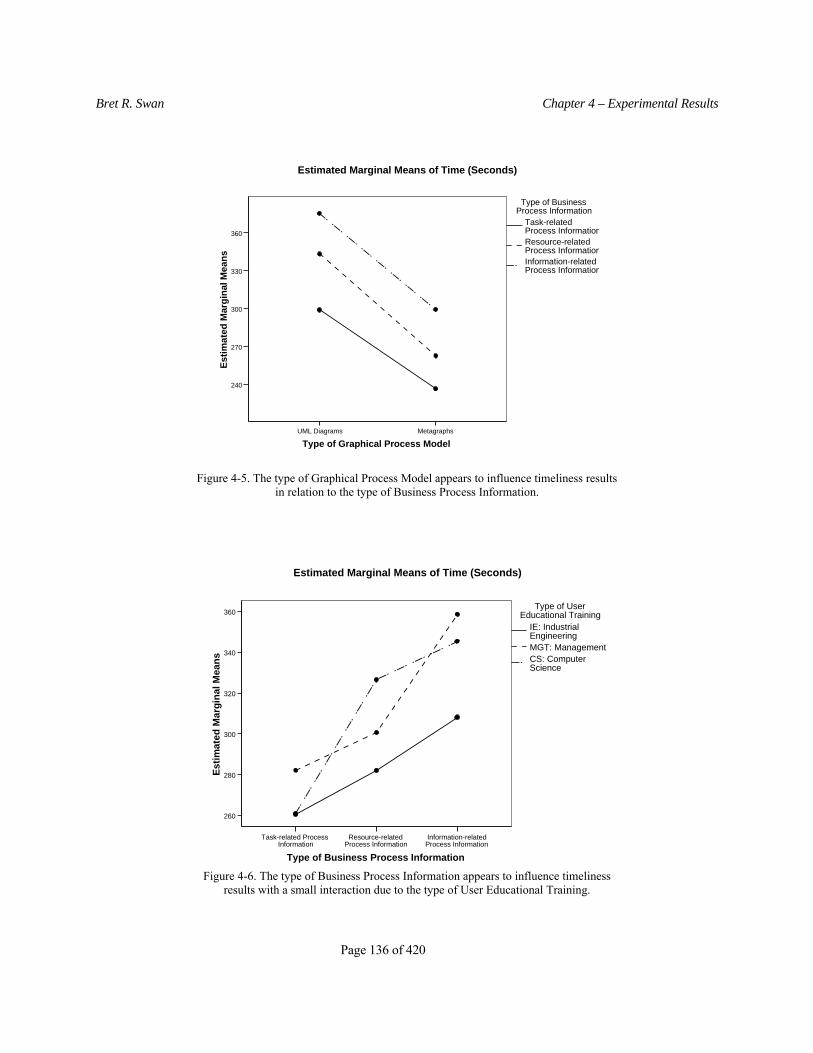
Bret R. Swan Chapter 4 – Experimental Results
Page 136 of 420
Type of Graphical Process ModelMetagraphsUML Diagrams
Estim
ated
Mar
gina
l Mea
ns360
330
300
270
240
Information-related Process Information
Resource-related Process Information
Task-related Process Information
Type of Business Process Information
Estimated Marginal Means of Time (Seconds)
Figure 4-5. The type of Graphical Process Model appears to influence timeliness results in relation to the type of Business Process Information.
Type of Business Process Information
Information-related Process Information
Resource-related Process Information
Task-related Process Information
Estim
ated
Mar
gina
l Mea
ns
360
340
320
300
280
260
CS: Computer Science
MGT: Management
IE: Industrial Engineering
Type of User Educational Training
Estimated Marginal Means of Time (Seconds)
Figure 4-6. The type of Business Process Information appears to influence timeliness
results with a small interaction due to the type of User Educational Training.

Bret R. Swan Chapter 4 – Experimental Results
Page 137 of 420
4.2.3 Dependent Variable: Subjective Mental Workload
Table 4-8 lists the cell numbers, means, and standard deviations for the NASA TLX subjective
mental workload results related to the three independent variables. Tables 4-9 and 4-10 list the between and
within-subject repeated measures MANOVA results. Table 4-9 shows a significant effect of the type of
UET on subjective mental workload, F(1,81)=3.31, p = 0.042. The type of GPM was not statistically
significant below p < 0.05, F(1,81)=3.45, p = 0.067. Table 4-10 shows a within-subjects effect of the type
of BPI on subjective mental workload, F(2,162)=5.19, p = 0.007, as well as for the interaction between the
type of BPI and the type of UET on subjective mental workload, F(4,162)=3.26, p = 0.013. These
differences and interactions are illustrated in Figures 4-7, 4-8, and 4-9 below.
Table 4-8. Cell sizes, means, and standard deviations for NASA TLX assessments of subjective mental workload (n = 87).
Dependent Variable: NASA TLX Mental Workload
Type of GPM Type of User Educational Training
Type of Business Process Information n Mean
Std. Deviation
UML Diagrams IE: Industrial Engineering Task-centric BPI 12 67.34 18.14 Resource-centric BPI 12 75.36 17.50 Information-centric BPI 12 68.77 15.49 Total 36 70.49 16.96 MGT: Management Task-centric BPI 18 72.88 13.82 Resource-centric BPI 18 73.50 12.21 Information-centric BPI 18 77.25 13.00 Total 54 74.54 12.93 CS: Computer Science Task-centric BPI 16 56.80 21.62 Resource-centric BPI 16 63.93 19.38 Information-centric BPI 16 58.73 21.42 Total 48 59.82 20.61 Total Task-centric BPI 46 65.84 18.92 Resource-centric BPI 46 70.65 16.78 Information-centric BPI 46 68.60 18.44 Total 138 68.36 18.05 Metagraphs IE: Industrial Engineering Task-centric BPI 12 58.85 10.81 Resource-centric BPI 12 58.92 12.73 Information-centric BPI 12 63.63 11.29 Total 36 60.47 11.53 MGT: Management Task-centric BPI 17 59.44 14.00 Resource-centric BPI 17 63.99 18.29 Information-centric BPI 17 72.96 12.30 Total 51 65.46 15.82 CS: Computer Science Task-centric BPI 12 61.76 9.28 Resource-centric BPI 12 66.10 10.16 Information-centric BPI 12 60.41 15.88 Total 36 62.76 12.04

Bret R. Swan Chapter 4 – Experimental Results
Page 138 of 420
Type of GPM Type of User Educational Training
Type of Business Process Information n Mean
Std. Deviation
Total Task-centric BPI 41 59.94 11.65 Resource-centric BPI 41 63.12 14.67 Information-centric BPI 41 66.56 14.01 Total 123 63.21 13.66 Total IE: Industrial Engineering Task-centric BPI 24 63.10 15.24 Resource-centric BPI 24 67.14 17.16 Information-centric BPI 24 66.20 13.51 Total 72 65.48 15.26 MGT: Management Task-centric BPI 35 66.34 15.31 Resource-centric BPI 35 68.88 15.98 Information-centric BPI 35 75.16 12.66 Total 105 70.13 15.05 CS: Computer Science Task-centric BPI 28 58.92 17.35 Resource-centric BPI 28 64.86 15.87 Information-centric BPI 28 59.45 18.93 Total 84 61.08 17.43 Total Task-centric BPI 87 63.06 16.10 Resource-centric BPI 87 67.11 16.18 Information-centric BPI 87 67.63 16.44 Total 261 65.93 16.31
Table 4-9. Relevant MANOVA results describing between-subject main effects and interactions for subjective mental workload (n = 87).
Dependent Variable: NASA TLX Mental Workload
Source Type III Sum
of Squares df Mean
Square F Sig. GPM Type 1837.91 1 1837.91 3.45 .067† UET Type 3525.18 2 1762.59 3.31 .042* GPM Type X UET Type 2169.93 2 1084.96 2.04 .137 Error 1559935.88 81 19258.47
†p < 0.10 *p < 0.05 **p < 0.01 ***p < 0.001

Bret R. Swan Chapter 4 – Experimental Results
Page 139 of 420
Table 4-10. Relevant MANOVA results describing within-subject main effects and interactions for subjective mental workload (n = 87).
Dependent Variable: NASA TLX Mental Workload
Source
Type III Sum of Squares df
Mean Square F Sig.
BPI Type Sphericity Assumed 954.32 2 477.16 5.19 .007**
BPI Type X GPM Type Sphericity Assumed 303.17 2 151.59 1.65 .196
BPI Type X UET Type Sphericity Assumed 1198.06 4 299.52 3.26 .013*
BPI Type X GPM Type X UET Type
Sphericity Assumed 520.37 4 130.09 1.42 .231
Error (BPI Type) Sphericity Assumed 14898.61 162 91.97
†p < 0.10 *p < 0.05 **p < 0.01 ***p < 0.001
Type of Graphical Process ModelMetagraphsUML Diagrams
Estim
ated
Mar
gina
l Mea
ns
75.0
70.0
65.0
60.0
55.0
CS: Computer Science
MGT: Management
IE: Industrial Engineering
Type of User Educational Training
Estimated Marginal Means of NASA TLX Mental Workload (MWL)
Figure 4-7. Subjective mental workload shows a difference between metagraphs and UML diagrams as well as between types of User Educational Training.

Bret R. Swan Chapter 4 – Experimental Results
Page 140 of 420
Type of Graphical Process ModelMetagraphsUML Diagrams
Estim
ated
Mar
gina
l Mea
ns
72.0
70.0
68.0
66.0
64.0
62.0
60.0
Information-related Process Information
Resource-related Process Information
Task-related Process Information
Type of Business Process Information
Estimated Marginal Means of NASA TLX Mental Workload (MWL)
Figure 4-8. Subjective mental workload shows a difference between metagraphs and UML diagrams as well as slight between types of Business Process Information.
Type of Business Process Information
Information-related Process Information
Resource-related Process Information
Task-related Process Information
Estim
ated
Mar
gina
l Mea
ns
75.0
70.0
65.0
60.0
CS: Computer Science
MGT: Management
IE: Industrial Engineering
Type of User Educational Training
Estimated Marginal Means of NASA TLX Mental Workload (MWL)
Figure 4-9. Subjective mental workload shows a difference between the types of Business Process Information as well as between types of User Educational Training.
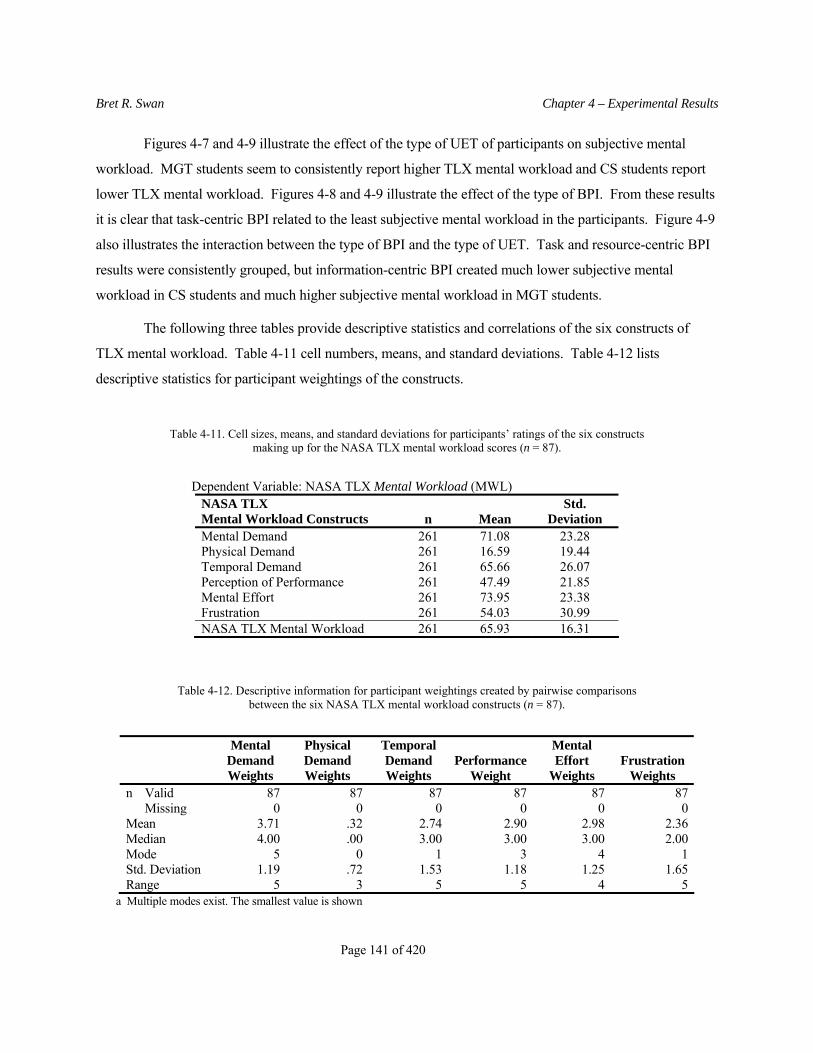
Bret R. Swan Chapter 4 – Experimental Results
Page 141 of 420
Figures 4-7 and 4-9 illustrate the effect of the type of UET of participants on subjective mental
workload. MGT students seem to consistently report higher TLX mental workload and CS students report
lower TLX mental workload. Figures 4-8 and 4-9 illustrate the effect of the type of BPI. From these results
it is clear that task-centric BPI related to the least subjective mental workload in the participants. Figure 4-9
also illustrates the interaction between the type of BPI and the type of UET. Task and resource-centric BPI
results were consistently grouped, but information-centric BPI created much lower subjective mental
workload in CS students and much higher subjective mental workload in MGT students.
The following three tables provide descriptive statistics and correlations of the six constructs of
TLX mental workload. Table 4-11 cell numbers, means, and standard deviations. Table 4-12 lists
descriptive statistics for participant weightings of the constructs.
Table 4-11. Cell sizes, means, and standard deviations for participants’ ratings of the six constructs making up for the NASA TLX mental workload scores (n = 87).
Dependent Variable: NASA TLX Mental Workload (MWL) NASA TLX Mental Workload Constructs n Mean
Std. Deviation
Mental Demand 261 71.08 23.28 Physical Demand 261 16.59 19.44 Temporal Demand 261 65.66 26.07 Perception of Performance 261 47.49 21.85 Mental Effort 261 73.95 23.38 Frustration 261 54.03 30.99 NASA TLX Mental Workload 261 65.93 16.31
Table 4-12. Descriptive information for participant weightings created by pairwise comparisons between the six NASA TLX mental workload constructs (n = 87).
Mental Demand Weights
Physical Demand Weights
Temporal Demand Weights
Performance Weight
Mental Effort
Weights Frustration
Weights n Valid 87 87 87 87 87 87 Missing 0 0 0 0 0 0Mean 3.71 .32 2.74 2.90 2.98 2.36Median 4.00 .00 3.00 3.00 3.00 2.00Mode 5 0 1 3 4 1Std. Deviation 1.19 .72 1.53 1.18 1.25 1.65Range 5 3 5 5 4 5
a Multiple modes exist. The smallest value is shown
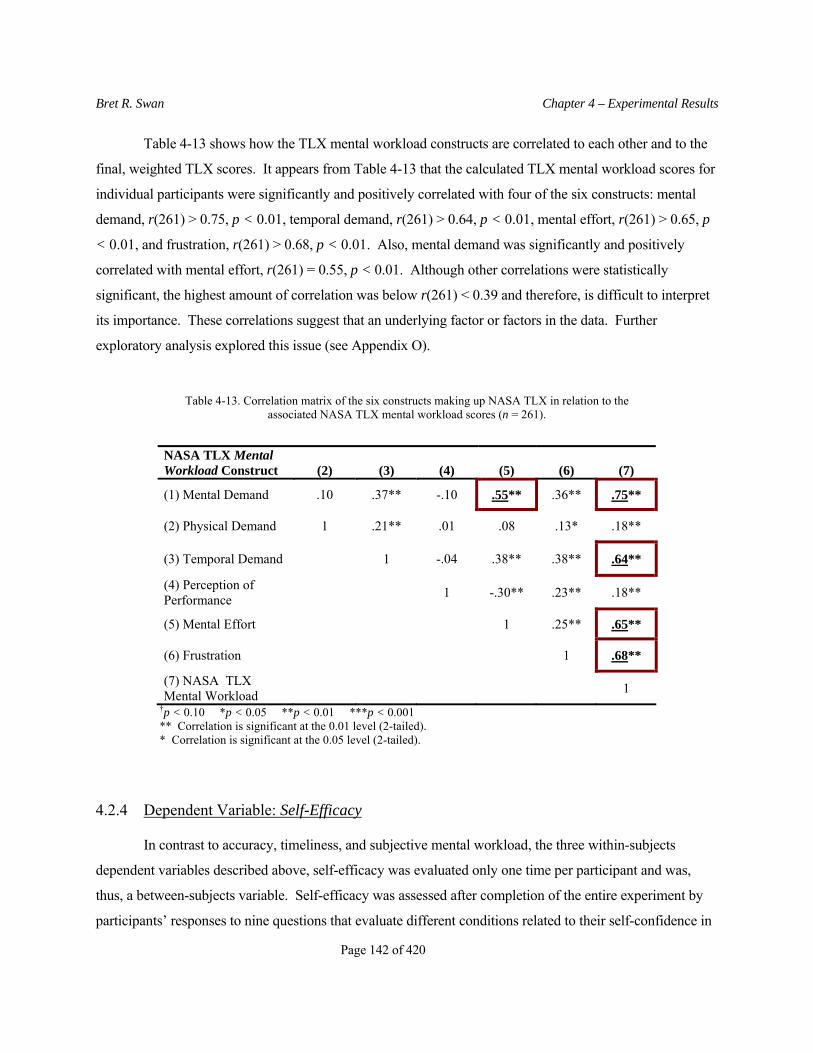
Bret R. Swan Chapter 4 – Experimental Results
Page 142 of 420
Table 4-13 shows how the TLX mental workload constructs are correlated to each other and to the
final, weighted TLX scores. It appears from Table 4-13 that the calculated TLX mental workload scores for
individual participants were significantly and positively correlated with four of the six constructs: mental
demand, r(261) > 0.75, p < 0.01, temporal demand, r(261) > 0.64, p < 0.01, mental effort, r(261) > 0.65, p
< 0.01, and frustration, r(261) > 0.68, p < 0.01. Also, mental demand was significantly and positively
correlated with mental effort, r(261) = 0.55, p < 0.01. Although other correlations were statistically
significant, the highest amount of correlation was below r(261) < 0.39 and therefore, is difficult to interpret
its importance. These correlations suggest that an underlying factor or factors in the data. Further
exploratory analysis explored this issue (see Appendix O).
Table 4-13. Correlation matrix of the six constructs making up NASA TLX in relation to the associated NASA TLX mental workload scores (n = 261).
NASA TLX Mental Workload Construct (2) (3) (4) (5) (6) (7)
(1) Mental Demand .10 .37** -.10 .55** .36** .75**
(2) Physical Demand 1 .21** .01 .08 .13* .18**
(3) Temporal Demand 1 -.04 .38** .38** .64**
(4) Perception of Performance 1 -.30** .23** .18**
(5) Mental Effort 1 .25** .65**
(6) Frustration 1 .68**
(7) NASA TLX Mental Workload 1
†p < 0.10 *p < 0.05 **p < 0.01 ***p < 0.001 ** Correlation is significant at the 0.01 level (2-tailed). * Correlation is significant at the 0.05 level (2-tailed).
4.2.4 Dependent Variable: Self-Efficacy
In contrast to accuracy, timeliness, and subjective mental workload, the three within-subjects
dependent variables described above, self-efficacy was evaluated only one time per participant and was,
thus, a between-subjects variable. Self-efficacy was assessed after completion of the entire experiment by
participants’ responses to nine questions that evaluate different conditions related to their self-confidence in

Bret R. Swan Chapter 4 – Experimental Results
Page 143 of 420
completing the experimental task. An overall score per participant was averaged from participant’s
responses to these questions. Therefore, its results were analyzed using a separate ANOVA. (Note that the
type of BPI was a within-subjects variable and therefore, was not included in this analysis.)
Tables 4-14 reports demographic information for the self-efficacy questions and the overall average.
It showed that participants felt the most confident about questions 5, 6, 7, 8, and 9. They were least
confident on questions 1 and 2. This appeared consistent, because questions 1 and 3 were similar to
questions 5, 6, and 9, but were phrased oppositely.
Table 4-14. Cell sizes, Means, and standard deviations for the nine self-efficacy questions and the average of these questions (ordinal scale 1 to 10).
n Mean Std.
Deviation
Minimum (No
Confidence)
Maximum (Highly
Confident) Self-Efficacy Question 1: If Alone & No One Was Available to Help 87 4.16 3.08 0 10
Self-Efficacy Question 2: If Never Used MG or UML Diagrams Before 87 3.41 2.75 0 10
Self-Efficacy Question 3: If Had Only the Training Handouts for Reference 87 5.55 2.42 0 10
Self-Efficacy Question 4: If Had Seen Others Using MG or UML Diagrams 87 5.79 2.72 0 10
Self-Efficacy Question 5: If Could Call on Someone for Help 87 7.64 2.27 0 10
Self-Efficacy Question 6: If Someone Helped You Get Started 87 7.25 2.31 0 10
Self-Efficacy Question 7: If Had a lot of Time 87 7.69 2.47 0 10
Self-Efficacy Question 8: If Had Training Handouts 87 6.10 2.53 0 10
Self-Efficacy Question 9: If Used MG or UML Diagrams on Similar Tasks 87 7.43 2.37 0 10
Average Individual Self-Efficacy Score 87 6.11 1.87 -- --

Bret R. Swan Chapter 4 – Experimental Results
Page 144 of 420
Table 4-15. Correlations of the nine self-efficacy questions and the overall participant averages (n = 87).
Dependent Variable: Self-Efficacy Questions (2) (3) (4) (5) (6) (7) (8) (9) (10) (1) Self-Efficacy-Question 1: If Alone & No One Was Available to Help
.66** .52** .52** .38** .27** .33** .58** .26** .71**
(2) Self-Efficacy-Question 2: If Never Used MG or UML Diagrams Before
1 .57** .52** .33** .32** .19** .51** .31** .69**
(3) Self-Efficacy-Question 3: If Had Only the Training Handouts for Reference
1 .57** .47** .49** .34** .62** .49** .77**
(4) Self-Efficacy-Question 4: If Had Seen Others Using MG or UML Diagrams
1 .67** .59** .49** .48** .52** .81**
(5) Self-Efficacy-Question 5: If Could Call on Someone for Help
1 .76** .56** .51** .45** .76**
(6) Self-Efficacy-Question 6: If Someone Helped You Get Started
1 .51** .51** .65** .75**
(7) Self-Efficacy-Question 7: If Had a lot of Time
1 .41** .59** .66**
(8) Self-Efficacy-Question 8: If Had Training Handouts
1 .52** .78**
(9) Self-Efficacy-Question 9: If Used MG or UML Diagrams on Similar Tasks
1 .71**
(10) Average Self Efficacy Score 1
** Correlation is significant at the p = 0.01 level (2-tailed).
Table 4-15 shows the correlation matrix of the nine self-efficacy questions and participant average
self-efficacy scores. Many of the nine questions were highly positively correlated at the p < 0.01 level of
significance. These results suggest an underlying factor or factors driving the self-efficacy results.

Bret R. Swan Chapter 4 – Experimental Results
Page 145 of 420
Exploratory analysis revealed two clear underlying factors. The first factor in Table O-7 includes most self-
efficacy questions associated with receiving help from others to interpret GPMs. The second factor
associated questions with the user being alone when interpreting GPMs. These results suggest participants
self-efficacy is greatly influenced by whether their receive help from others when comprehending these
GPMs (see Appendix O.10).
Table 4-16 reports results of a between-subjects ANOVA of average self-efficacy scores. There
was a significant effect of the type of GPM on average self-efficacy, F(1,86)=6.09, p = 0.016. There was
not a significant effect of the type of UET on average self-efficacy, F(2,86)=2.28, p = 0.107. No
interactions were statistically significant.
Table 4-16. Two-way, between-subject ANOVA results for average self-efficacy showing the type of GPM and the type of User Educational Training as significant (n = 87).
Dependent Variable: Average Self Efficacy Score
Source Type III Sum
of Squares df Mean
Square F Sig.
Corrected Model 39.906(a) 5 7.98 2.45 .040
Intercept 3231.435 1 3231.44 993.67 .000
GPM Type 19.785 1 19.79 6.08 .016*
UET Type 14.810 2 7.41 2.28 .109
GPM Type X UET Type 2.970 2 1.49 .46 .635
Error 263.413 81 3.25
Total 3556.469 87
Corrected Total 303.320 86 †p < 0.10 *p < 0.05 **p < 0.01 ***p < 0.001 a R Squared = 0.248 (Adjusted R Squared = 0.126)
Figure 4-10 shows the breakdown of the self-efficacy average scores by the type of GPM and the
type of UET of the participants. Although similar to results for metagraph participants, there seemed to be a
difference between average self-efficacy results for users of UML diagrams with different types of UET.

Bret R. Swan Chapter 4 – Experimental Results
Page 146 of 420
Type of Graphical Process ModelMetagraphsUML Diagrams
Ave
rage
Sel
f Effi
cacy
Sco
re
10.00
8.00
6.00
4.00
2.00
0.0021
48
3849
CS: Computer Science
MGT: Management
IE: Industrial Engineering
Type of User Educational Training
Figure 4-10. Self-efficacy scores showing box plots for each type of User Educational Training graphed by the type of GPM.
The following three sections describe variables hypothesized as moderating the relationship
between the independent and dependent variables during GPM user comprehension. These potential
moderators included participants’ cognitive styles (measured by the Myers-Briggs Type Indicator (MBTI)),
general cognitive abilities (measured by the Wonderlic Personnel Test (WPT)), and attentional abilities
(assessed by the Differential Attentional Processes Inventory (DAPI)).
4.2.5 Moderating Variable: Cognitive Styles (MBTI)
The MBTI was used to assess two types of cognitive styles of the participants: (1) extraversion vs.
introversion and (2) sensing vs. intuition. In this experiment, continuous scores for each participant were
calculated for both MBTI extrovert-introvert and sensing-intuition dimensions of cognitive styles. A
positive number described the reported strength of MBTI extrovert as well as sensing cognitive styles. A
negative number described the reported strength of MBTI introvert or intuitive cognitive styles. These

Bret R. Swan Chapter 4 – Experimental Results
Page 147 of 420
cognitive styles were random variables and organized in Table 4-17 according to the between-subject
independent variables used in this study.
Table 4-17. Counts of the MBTI Cognitive Styles of the participants grouped by the between-subject independent variables (n = 87).
Moderating Variable: Cognitive Styles (MBTI)
Type of GPM
Type of User Educational Training
MBTI Extrovert (E) Count
MBTI Introvert (I) Count
MBTI Sensor (S)
Count
MBTI Intuitive
(N) Count UML Diagrams IE: Industrial Engineering 7 5 9 3 MGT: Management 10 8 11 7 CS: Computer Science 9 7 7 9 Total 26 20 27 19 Metagraphs IE: Industrial Engineering 8 4 5 7 MGT: Management 7 10 12 5 CS: Computer Science 5 7 9 3 Totals 20 21 26 15 Experiment Totals n = 87 46 41 53 34
Table 4-17 gives an overview of the distribution of the participants’ evaluations of extroversion,
introversion, sensing, and intuition, as well as balances of participants across both the type of GPM and the
type of UET. Table 4-17 shows the MBTI scores of the participants that were slightly introverted (M = -
2.43, SD = 27.30, n = 87) and slightly sensing (M = 6.66, SD = 23.23, n = 87). The number of IE students
using UML diagrams that were sensors (9) vs. intuitives (3) was quite different from those using metagraphs
(5 sensors vs. 7 intuitives). IE students reported a similar balance of extroverts vs. introverts using UML (7
vs. 5) vs. metagraphs (8 vs. 4), but there was a difference between the balance of sensors (UML 9 vs.
metagraphs 5) vs. intuitives (UML 3 vs. metagraph 7). MGT students reported a difference between
extroverts (10) vs. introverts (8) that used UML diagrams vs. metagraphs (7 vs. 10). MGT sensors vs.
intuitives were similar for both groups of participants using different type of GPMs (UML – 11 vs. 12,
metagraphs 7 vs. 5).
CS students reported different distributions of extroverts (9 using UML diagrams vs. 5 using
metagraphs); while there were seven (7) introverts for both types of GPMs. CS sensors vs. intuitives were
quite different for the two types of GPMs: sensors using UML diagrams (7) vs. metagraphs (9), and
intuitives using UML diagrams (9) vs. metagraphs (3). There was a discrepancy between CS students using
UML vs. metagraphs both on the extraversion vs. introversion and sensing vs. intuition cognitive styles.

Bret R. Swan Chapter 4 – Experimental Results
Page 148 of 420
Additionally, there was a difference in the number of participants with extraversion vs. introversion
cognitive styles who used UML diagrams (26 vs. 20) vs. metagraphs (20 vs. 21). Figures 4-11 and 4-12
further illustrate these distributions and statistics.
Type of Graphical Process ModelMetagraphsUML Diagrams
MB
TI D
iffer
ence
Sco
re b
etw
een
Extr
over
sion
vs
Intr
over
sion
50.00
25.00
0.00
-25.00
-50.00
CS: Computer Science
MGT: Management
IE: Industrial Engineering
Type of User Educational Training
Figure 4-11. Box plots of continuous extrovert to introvert scores (+ scores = Extroverted tendencies; - scores = Introverted tendencies). by the type of GPM and type of UET.
Type of Graphical Process ModelMetagraphsUML Diagrams
MB
TI D
iffer
ence
Sco
re b
etw
een
Sens
ing
vs In
tuiti
ve 50
25
0
-25
-50
2
CS: Computer Science
MGT: Management
IE: Industrial Engineering
Type of User Educational Training
Figure 4-12. Box plots of continuous sensing to intuitive scores (+ scores = Sensing tendencies; - scores = Intuitive tendencies). by the type of GPM and type of UET.

Bret R. Swan Chapter 4 – Experimental Results
Page 149 of 420
Table 4-18. One-way ANOVA of the MBTI Cognitive Styles of the participants in context of the type of GPM (n = 87).
Factor: Type of GPM Sum of Squares df
Mean Square F Sig.
Between Groups 198.29 1 198.29 .26 .609Within Groups 63904.98 85 751.82
MBTI Difference Score between Extroversion vs. Introversion Total 64103.26 86
Between Groups 52.89 1 52.89 .10 .756Within Groups 46356.76 85 545.37
MBTI Difference Score between Sensing vs. Intuitive Total 46409.66 86
†p < 0.10 *p < 0.05 **p < 0.01 ***p < 0.001
Table 4-19. One-way ANOVA of the MBTI Cognitive Styles of the participants in context of the type of User Educational Training (n = 87).
Factor: Type of User Educational Training
Sum of Squares df
Mean Square F Sig.
Between Groups 2979.95 2 1489.98 2.05 .135Within Groups 61123.31 84 727.66
MBTI Difference Score between Extroversion vs. Introversion Total 64103.26 86
Between Groups 688.14 2 344.07 .63 .534Within Groups 45721.52 84 544.30
MBTI Difference Score between Sensing vs. Intuitive Total 46409.66 86
†p < 0.10 *p < 0.05 **p < 0.01 ***p < 0.001
Tables 4-18 and 4-19 describe the results of one-way ANOVAs comparing MBTI extrovert-
introvert and sensing-intuition scores, respectively, to potential groups for the type of GPM and type of
UET. These tables showed no statistically significant differences for either cognitive style on the treatment
groups representing GPM type and UET type.
4.2.6 Moderating Variable: General Cognitive Abilities (WPT scores)
General Cognitive Abilities was evaluated in this experiment by the WPT. The WPT scores were
hypothesized to effect the subjective mental workload a participant experiences in this study. Tables 4-20
and 4-21 show descriptive statistics and ANOVAs that break down WPT scores according to both the type
of GPM and the type of UET.

Bret R. Swan Chapter 4 – Experimental Results
Page 150 of 420
Table 4-20. Descriptive statistics for the WPT scores by the type of GPM used by participants (n = 87).
Moderating Variable: WPT Score Type of Graphical Process Model
Type of User Educational Training n Mean
Std. Deviation
UML Diagrams IE: Industrial Engineering 12 29.75 4.81 MGT: Management 18 27.06 7.69 CS: Computer Science 16 31.19 7.23 Total 46 29.20 6.98 Metagraphs IE: Industrial Engineering 12 30.83 4.84 MGT: Management 17 25.94 5.01 CS: Computer Science 12 29.50 6.75 Total 41 28.41 5.81 Total IE: Industrial Engineering 24 30.29 4.75 MGT: Management 35 26.51 6.46 CS: Computer Science 28 30.46 6.95 Total 87 28.83 6.43
Table 4-21. Two-way, between-subjects ANOVA of the WPT scores for the type of GPM and the type of User Educational Training (n = 87).
Moderating Variable: WPT Scores
Source Type III Sum
of Squares df Mean
Square F Sig.
Corrected Model 351.17(a) 5 70.24 1.78 .127
Intercept 71142.36 1 71142.36 1798.97 .000
GPM Type 6.92 1 6.92 .18 .677
UET Type 303.97 2 151.98 3.84 .025*
GPM Type X UET Type 27.27 2 13.63 .35 .709
Error 3203.24 81 39.55
Total 75854.00 87
Corrected Total 3554.41 86 †p < 0.10 *p < 0.05 **p < 0.01 ***p < 0.001 a R Squared = 0.099 (Adjusted R Squared = 0.043)

Bret R. Swan Chapter 4 – Experimental Results
Page 151 of 420
Type of Graphical Process ModelMetagraphsUML Diagrams
Won
derli
c Fi
nal S
core
50
40
30
20
10
29
43
CS: Computer Science
MGT: Management
IE: Industrial Engineering
Type of User Educational Training
Figure 4-13. Distribution of WPT scores by the type of Graphical Process Model and type of User Educational Training.
Table 4-21 displays the results of ANOVAs showing no significant effect of GPM type on WPT
scores. In contrast, it appeared that there was a significant effect of UET type on WPT scores,
F(2,86)=3.84, p = 0.025. Although not statistically significant, Figure 4-13 shows that there was a larger
range of scores of MGT students using UML diagrams than those using metagraphs.
4.2.7 Moderating Variable: Attentional Abilities (DAPI)
Attentional abilities permit people to keep their attention focused, to one extent or another, on the
tasks at hand. In this experiment, these attentional abilities were evaluated by the Differential Attentional
Processes Inventory (DAPI). The DAPI was made up of four separate constructs assessing moderate-focus
attentional abilities, extreme-focus attentional abilities, the ability to focus attention during dual
performance on a cognitive task and a physical task (dual cognitive-physical tasks), and the ability to focus
attention during dual performance on two cognitive tasks (dual cognitive-physical tasks). These attentional

Bret R. Swan Chapter 4 – Experimental Results
Page 152 of 420
abilities were hypothesized to effect the subjective mental workload a participant experiences in the
performance of the experimental task.
Table 4-22 presents the statistical results describing the four DAPI constructs. Table 4-23 shows
there was a significant, positive correlation between those Moderately-Focused attentional abilities and Dual
Cognitive-Cognitive Tasks attentional abilities, r(87)=0.61, p (2-tailed) < 0.01 (see Table 4-23).
Table 4-22. Descriptive statistics of DAPI constructs (n = 87).
Moderating Variable: DAPI Constructs Differential Attentional Processes Inventory (DAPI) n Mean
Std. Deviation Minimum Maximum
Moderately-Focused Attention 87 3.45 1.00 .88 5.50Extremely-Focused Attention 87 2.68 .80 1.17 4.92Dual Cognitive-Physical Tasks 87 4.14 .94 1.60 6.00Dual Cognitive-Cognitive Tasks 87 2.34 1.11 .00 5.00
Table 4-23. Correlations of DAPI constructs (n = 87).
Moderating Variable: DAPI Constructs (2) (3) (4) (1) DAPI - Moderate-Focus -.03 .35** .61** (2) DAPI - Extreme-Focus 1 -.10 .09 (3) DAPI - Dual Cognitive-Physical Tasks Focus 1 .38** (4) DAPI - Dual Cognitive-Cognitive Tasks Focus 1
†p < 0.10 *p < 0.05 **p < 0.01 ***p < 0.001 ** Correlation is significant at the 0.01 level (2-tailed).
Figure 4-14 and Table 4-24 show that, both practically and statistically, there was no significant
difference between the attentional abilities of participants on GPM type.

Bret R. Swan Chapter 4 – Experimental Results
Page 153 of 420
Type of Graphical Process ModelMetagraphsUML Diagrams
6
5
4
3
2
1
0
51
5783
19
51
47
DAPI Mean - Dual Cognitive-Cognitive Tasks Construct
DAPI Mean - Dual Cognitive-Physical Tasks Construct
DAPI Mean - Extreme-Focus Construct
DAPI Mean - Moderate-Focus Construct
High
Low
Figure 4-14. Distribution of DAPI construct scores according to the type of Graphical Process Model.
Table 4-24. One-way ANOVAs showing no statistical difference exist of DAPI attentional abilities between-subjects existed between groups that used different types of GPMs (n = 87).
Moderating Variable: DAPI Constructs
Factor: Type of GPM Sum of Squares Df
Mean Square F Sig.
Between Groups .30 1 .30 .30 .587 Within Groups 86.40 85 1.02
DAPI Moderately-Focused Attention
Total 86.70 86 Between Groups .15 1 .15 .23 .635 Within Groups 55.35 85 .65
DAPI Extremely-Focused Attention
Total 55.50 86 Between Groups 1.18 1 1.18 1.34 .251 Within Groups 75.27 85 .89
DAPI Dual Cognitive-Physical Tasks
Total 76.46 86 Between Groups .52 1 .52 .42 .520 Within Groups 106.38 85 1.25
DAPI Dual Cognitive-Cognitive Tasks
Total 106.91 86 †p < 0.10 *p < 0.05 **p < 0.01 ***p < 0.001
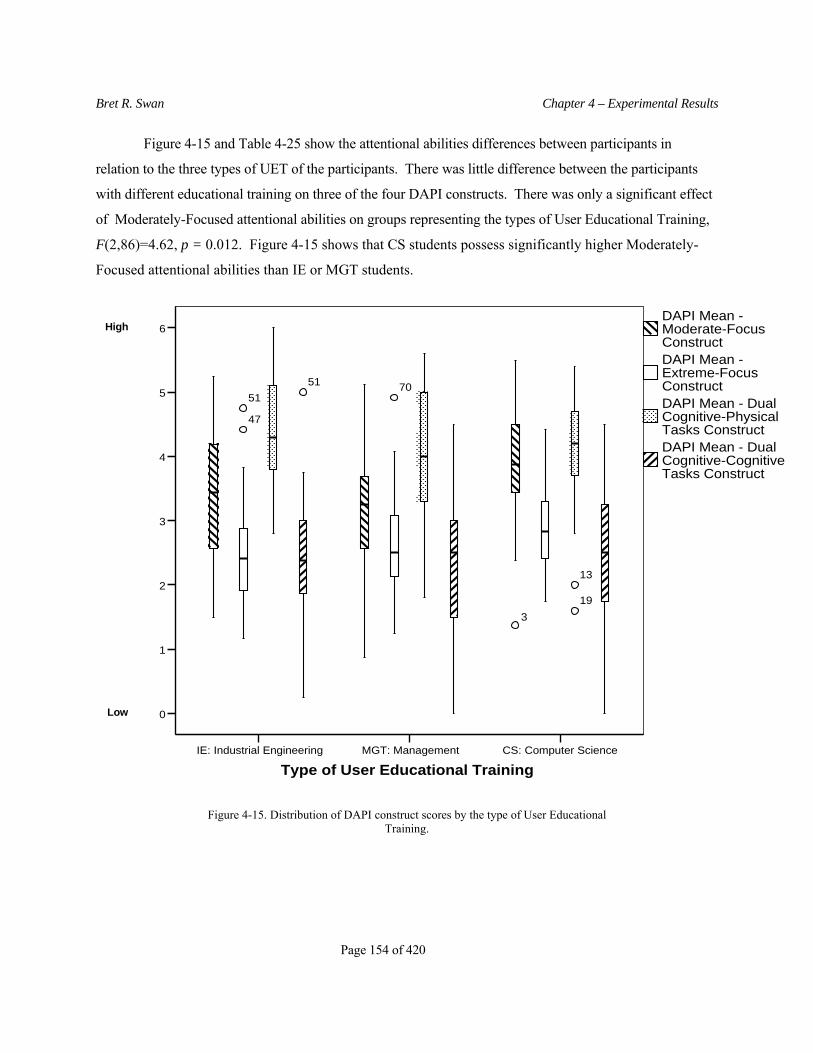
Bret R. Swan Chapter 4 – Experimental Results
Page 154 of 420
Figure 4-15 and Table 4-25 show the attentional abilities differences between participants in
relation to the three types of UET of the participants. There was little difference between the participants
with different educational training on three of the four DAPI constructs. There was only a significant effect
of Moderately-Focused attentional abilities on groups representing the types of User Educational Training,
F(2,86)=4.62, p = 0.012. Figure 4-15 shows that CS students possess significantly higher Moderately-
Focused attentional abilities than IE or MGT students.
Type of User Educational TrainingCS: Computer ScienceMGT: ManagementIE: Industrial Engineering
6
5
4
3
2
1
0
51
13
19
51
47
70
3
DAPI Mean - Dual Cognitive-Cognitive Tasks Construct
DAPI Mean - Dual Cognitive-Physical Tasks Construct
DAPI Mean - Extreme-Focus Construct
DAPI Mean - Moderate-Focus Construct
High
Low
Figure 4-15. Distribution of DAPI construct scores by the type of User Educational Training.

Bret R. Swan Chapter 4 – Experimental Results
Page 155 of 420
Table 4-25. One-way ANOVAs showing only participants with DAPI moderately-focused attentional abilities differed statistically between groups of different types of User Educational
Training (n = 87).
Moderating Variable: DAPI Constructs Factor: Type of User Educational Training
Sum of Squares df
Mean Square F Sig.
Between Groups 8.60 2 4.30 4.62 .012* Within Groups 78.10 84 .93
DAPI Moderately-Focused Attention
Total 86.70 86 Between Groups 1.53 2 .77 1.19 .309 Within Groups 53.97 84 .64
DAPI Extremely-Focused Attention
Total 55.50 86 Between Groups 3.44 2 1.72 1.98 .145 Within Groups 73.01 84 .87
DAPI Dual Cognitive-Physical Tasks
Total 76.46 86 Between Groups 1.82 2 .91 .73 .486 Within Groups 105.08 84 1.25
DAPI Dual Cognitive-Cognitive Tasks
Total 106.91 86 †p < 0.10 *p < 0.05 **p < 0.01 ***p < 0.001
4.3 PRELIMINARY ANALYSES OF THE DATASET
The preliminary analyses of the data are discussed (in Section 4.3 and Appendix N) before reporting
the analysis results that test each of the research hypotheses (in Section 4.4). Preliminary analyses showed
problems with observed power on several dependent variables. Further investigation revealed problems
with the way the a priori power analysis was conducted. Consequently, post hoc power analyses were
performed to identify whether the sample size and multivariate data associated with this experiment was
sufficient to detect meaningful effects. Appendix N.2 describes details of problems in the a priori power
analyses and multivariate post hoc power analyses (D'Amico, Neilands, & Zambarano, 2001; Faul,
Erdfelder, Lang, & Buchner, In Press). Post hoc power analyses revealed that the experiment was powerful
enough to detect large effects (ES ≤ 0.40) (Jacob Cohen, 1988; J. Cohen, 1992), using ANOVAs and
MANOVAs across all dependent variables assessing each independent variable at (1-β) ≥ 0.80 at α= 0.05.
Future research should increase the sample size of the treatment groups to be capable of detecting medium
or smaller effect sizes, but statistically significant results from this experiment show large effects in the data.

Bret R. Swan Chapter 4 – Experimental Results
Page 156 of 420
Appendix N describes results of preliminary analyses of the data set. The preliminary analyses
showed that the four parametric assumptions were upheld for most of the dataset. Also, DAPI constructs
were sufficiently reliable and could be used in future analyses. Where there appeared to be a problem with
accuracy sphericity, a statistical correction was made that allowed statistically justifiable interpretation of
the results. Some questions remain about the normality of timeliness results, yet the difference was
arguable. Thus, it was determined that further analyses testing the experimental hypotheses and conducting
exploratory analyses was reasonable.
4.4 RESULTS TESTING RESEARCH HYPOTHESES
This section describes the results testing the hypotheses of this experiment. Results testing
Hypotheses 1-3, addressing impacts of the type of GPM, the type of BPI, and the type of UET, are presented
in Sections 4.4.1-4.4.3, respectively. Results of hypotheses describing the relationships between subjective
mental workload and outcomes of user comprehension are presented in Sections 4.4.4-4.4.5. Lastly, results
of Hypotheses testing the moderating variables – extroversion-introversion, sensing-intuition, general
cognitive abilities, and attentional abilities – are presented in Sections 4.4.6-4.4.8.
Table 4-26. Repeated measures, between-subject MANOVA results testing Hypotheses 1 and 3 (n = 87).
Source Measure Type III Sum
of Squares df Mean Square F Sig. Intercept Accuracy 1145197.31 1 1145197.31 3086.49 .000 Time 23198976.21 1 23198976.21 1204.61 .000 Mental Workload 1088364.98 1 1088364.98 2043.07 .000 GPM Type Accuracy 15420.83 1 15420.83 41.56 .000*** Time 337171.15 1 337171.15 17.51 .000*** Mental Workload 1837.91 1 1837.91 3.45 .067†
Accuracy 2208.76 2 1104.38 2.98 .057† Time 43710.18 2 21855.09 1.14 .327
UET Type
Mental Workload 3525.18 2 1762.59 3.31 .042* Accuracy 877.04 2 438.52 1.18 .312 Time 65593.62 2 32796.81 1.70 .189
GPM Type X UET Type
Mental Workload 2169.93 2 1084.96 2.04 .137 Error Accuracy 30053.89 81 371.04 Time 1559935.88 81 19258.47 Mental Workload 43149.67 81 532.71
†p < 0.10 *p < 0.05 **p < 0.01 ***p < 0.001

Bret R. Swan Chapter 4 – Experimental Results
Page 157 of 420
a Computed using alpha = 0.05
4.4.1 Hypothesis 1 Results – Impacts of the Type of Graphical Process Model
Hypothesis 1, and associated sub-hypotheses, state that the type of GPM significantly affects
participants’ task performance (i.e., accuracy and timeliness), self-efficacy and subjective mental workload.
Tables 4-16 and 4-26 show significant effects of the type of GPM on three of the four dependent variables:
accuracy (F(1,81)=41.56, p = 0.000), time (F(1,81)=17.51, p = 0.000), and average self-efficacy
(F(1,81)=6.08, p = 0.016). There was not a significant effect of GPM type on subjective mental workload,
F(1,81)=3.45, p = 0.067. No interactions were significant. The direction of these statistical results are
illustrated in Figures 4-16 through 4-19.
Type of Graphical Process ModelMetagraphsUML Diagrams
Acc
urac
y (P
erce
nt C
orre
ct)
100
80
60
40
20
0
Figure 4-16. Box-plot showing users of metagraphs produced higher accuracy results compared to users of UML diagrams.

Bret R. Swan Chapter 4 – Experimental Results
Page 158 of 420
Type of Graphics Portraying the Process ModelMetagraphsUML Diagrams
Tim
e (S
econ
ds)
1000
800
600
400
200
0
83
107
57
8418030
108
60
210165
Figure 4-17. Box-plot showing users of metagraphs spending lower time on task (i.e., higher timeliness) compared to users of UML diagrams.
As a group, users interpreted metagraphs more accurately than UML diagrams rejecting Hypothesis
1.1 and supporting its opposite (Figure 4-16). Similarly, metagraph users completed their experimental
tasks in less time (i.e., higher timeliness) compared to the users of UML diagrams (Figure 4-17), not
supporting Hypothesis 1.2 and supporting its opposite.

Bret R. Swan Chapter 4 – Experimental Results
Page 159 of 420
Type of Graphics Portraying the Process ModelMetagraphsUML Diagrams
NA
SA T
LX M
enta
l Wor
kloa
d (M
WL)
120.0
100.0
80.0
60.0
40.0
20.0
0.0
19
313332
Figure 4-18. Box-plot showing metagraph users reported similar but slightly lower TLX subjective mental workload than users of UML diagrams.
Type of Graphical Process ModelMetagraphsUML Diagrams
Ave
rage
Sel
f Effi
cacy
Sco
re
10.00
8.00
6.00
4.00
2.00
0.0021
Figure 4-19. Box-plot showing metagraph users reported higher average self-efficacy than users of UML diagrams.
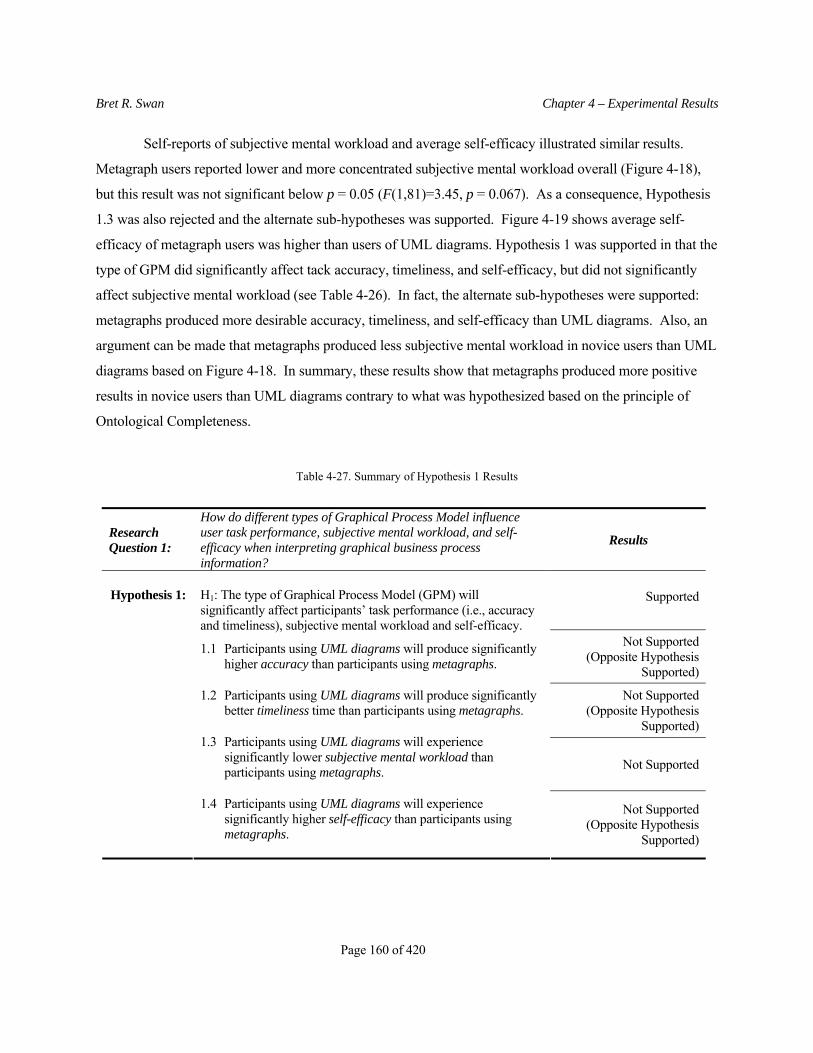
Bret R. Swan Chapter 4 – Experimental Results
Page 160 of 420
Self-reports of subjective mental workload and average self-efficacy illustrated similar results.
Metagraph users reported lower and more concentrated subjective mental workload overall (Figure 4-18),
but this result was not significant below p = 0.05 (F(1,81)=3.45, p = 0.067). As a consequence, Hypothesis
1.3 was also rejected and the alternate sub-hypotheses was supported. Figure 4-19 shows average self-
efficacy of metagraph users was higher than users of UML diagrams. Hypothesis 1 was supported in that the
type of GPM did significantly affect tack accuracy, timeliness, and self-efficacy, but did not significantly
affect subjective mental workload (see Table 4-26). In fact, the alternate sub-hypotheses were supported:
metagraphs produced more desirable accuracy, timeliness, and self-efficacy than UML diagrams. Also, an
argument can be made that metagraphs produced less subjective mental workload in novice users than UML
diagrams based on Figure 4-18. In summary, these results show that metagraphs produced more positive
results in novice users than UML diagrams contrary to what was hypothesized based on the principle of
Ontological Completeness.
Table 4-27. Summary of Hypothesis 1 Results
Research Question 1:
How do different types of Graphical Process Model influence user task performance, subjective mental workload, and self-efficacy when interpreting graphical business process information?
Results
Supported
Not Supported (Opposite Hypothesis
Supported)
Not Supported (Opposite Hypothesis
Supported)
Not Supported
Hypothesis 1: H1: The type of Graphical Process Model (GPM) will significantly affect participants’ task performance (i.e., accuracy and timeliness), subjective mental workload and self-efficacy.
1.1 Participants using UML diagrams will produce significantly higher accuracy than participants using metagraphs.
1.2 Participants using UML diagrams will produce significantly better timeliness time than participants using metagraphs.
1.3 Participants using UML diagrams will experience significantly lower subjective mental workload than participants using metagraphs.
1.4 Participants using UML diagrams will experience significantly higher self-efficacy than participants using metagraphs.
Not Supported (Opposite Hypothesis
Supported)

Bret R. Swan Chapter 4 – Experimental Results
Page 161 of 420
4.4.2 Hypothesis 2 Results – Type of Business Process Information Impacts
Hypothesis 2 and its sub-hypotheses states that the type of BPI significantly affect participants’ task
performance (both accuracy and timeliness) and subjective mental workload. Self-efficacy data was not
included in Hypothesis 3, because it was evaluated between-subjects (i.e., once by each participant at the
end of the entire experiment). Table 4-28 reports repeated measures that MANOVA results related to
Hypotheses 2 in the context of sphericity assumptions and corrections. There were significant effects on
BPI type on time, F(2,162)=17.95, p = 0.000, and subjective mental workload, F(2,162)=5.19, p = 0.007.
There was also a significant effect of the interaction between the type of BPI and the type of UET on
subjective mental workload, F(2,162)=3.26, p = 0.013. There was not a significant effect of BPI type on
accuracy, F(1.93,156.35)=2.29, p = 0.11.
Table 4-28. Repeated measures, within-subjects MANOVA results for Hypothesis 2 testing the type of Business Process Information (n = 87).
Source Measure Sphericity
Type III Sum of Squares df
Mean Square F Sig.
BPI Type Accuracy Huynh-Feldt 1293.52 1.93 670.14 2.29 .107 Time Sphericity Assumed 203676.36 2 101838.18 17.94 .000*** Mental Workload Sphericity Assumed 954.32 2 477.16 5.19 .007**
Accuracy Huynh-Feldt 318.63 1.93 165.07 .56 .564 Time Sphericity Assumed 3750.26 2 1875.13 .33 .719
BPI Type X GPM Type
Mental Workload Sphericity Assumed 303.17 2 151.59 1.65 .196 Accuracy Huynh-Feldt 1175.30 3.86 304.45 1.04 .387 Time Sphericity Assumed 28679.85 4 7169.96 1.26 .287
BPI Type X UET Type
Mental Workload Sphericity Assumed 1198.06 4 299.52 3.26 .013* Accuracy Huynh-Feldt 509.69 3.86 132.03 .45 .765 Time Sphericity Assumed 19068.67 4 4767.17 .84 .502
BPI Type X GPM Type X UET Type Mental Workload Sphericity Assumed 520.37 4 130.10 1.42 .231
Accuracy Huynh-Feldt 45765.93 156.35 292.72 Time Sphericity Assumed 919765.56 162 5677.57
Error (BPI Type)
Mental Workload Sphericity Assumed 14898.61 162 91.97 †p < 0.10 *p < 0.05 **p < 0.01 ***p < 0.001
Table 4-29 reports results of within-subjects contrasts (combined results of first and last simple
contrast methods) for the BPI Type independent variable and an interaction shown to be significant. For the
type of BPI, although overall accuracy was not statistically significant, there was a significant effect of BPI
type on accuracy results for task-centric vs. information-centric BPI, F(1,81)=6.02, p = 0.016 (Figure 4-20

Bret R. Swan Chapter 4 – Experimental Results
Page 162 of 420
illustrates this result). Therefore, Hypothesis 2.1 was, partially supported but Hypotheses 2.4 and 2.7 were
not supported.
Table 4-29. Partial results of tests of within-subjects simple contrasts (combined first and last) between conditions of the types of Business Process Information (n = 87).
Source Measure BPI Type
Type III Sum of Squares df
Mean Square F Sig.
BPI Type Accuracy Resource vs. Task 1517.71 1 1517.71 2.54 .115 Information vs. Task 2284.69 1 2284.69 6.02 .016* Resource vs. Information 78.16 1 78.16 .11 .742 Time Resource vs. Task 104364.85 1 104364.85 11.52 .001*** Information vs. Task 407331.99 1 407331.99 33.59 .000*** Resource vs. Information 99332.23 1 99332.23 7.72 .007** Resource vs. Task 1433.81 1 1433.81 7.84 .006**
Mental Workload Information vs. Task 1429.13 1 1429.13 8.87 .004**
Resource vs. Information .00 1 .00 .00 .997 Accuracy Resource vs. Task 1824.56 2 912.28 1.53 .223 Information vs. Task 523.52 2 261.76 .69 .505
BPI Type X UET Type
Resource vs. Information 1177.82 2 588.91 .82 .444 Time Resource vs. Task 39469.67 2 19734.83 2.18 .120 Information vs. Task 19223.87 2 9611.94 .79 .456 Resource vs. Information 27345.10 2 13672.10 1.06 .351 Resource vs. Task 151.75 2 75.88 .42 .662
Mental Workload Information vs. Task 1224.83 2 612.42 3.80 .026*
Resource vs. Information 2217.61 2 1108.81 5.34 .007** Accuracy Resource vs. Task 48351.93 81 596.94 Information vs. Task 30741.57 81 379.53
Error (BPI Type)
Resource vs. Information 58204.28 81 718.57 Time Resource vs. Task 734161.67 81 9063.72 Information vs. Task 982178.23 81 12125.66 Resource vs. Information 1042956.77 81 12876.01 Resource vs. Task 14809.56 81 182.83
Mental Workload Information vs. Task 13051.64 81 161.13
Resource vs. Information 16834.64 81 207.84 †p < 0.10 *p < 0.05 **p < 0.01 ***p < 0.001

Bret R. Swan Chapter 4 – Experimental Results
Page 163 of 420
Type of Business Process Information
Information-related Process Information
Resource-related Process Information
Task-related Process Information
Acc
urac
y (P
erce
nt C
orre
ct)
100
80
60
40
20
0
18
93
Figure 4-20. Graph showing the accuracy results of participants according to the different types of Business Process Information.
Table 4-29 show a significant effects of comparisons of BPI types on timeliness: between resource-
centric and task-centric BPI, F(2,81)=11.52, p = 0.001, between resource-centric and information-centric
BPI, F(2,81)=7.72, p = 0.007, as well as between the information-centric and task-centric BPI,
F(2,81)=33.59, p = 0.000. Figure 4-21 shows that task-centric BPI took the least amount of time (i.e.,
highest timeliness) to interpret and information-centric BPI took the most amount of time to interpret (i.e.,
lowest timeliness). Therefore, Hypothesis 2.2 was supported. Hypothesis 2.5 was partially supported in
that timeliness of interpretation of resource-centric BPI was significantly lower than for task-centric BPI,
but it was not significantly different from information-centric BPI. Hypothesis 2.8 was not supported. In
fact, the alternate sub-hypothesis was supported because information-centric BPI interpretations were less
timely than resource-centric BPI interpretations.
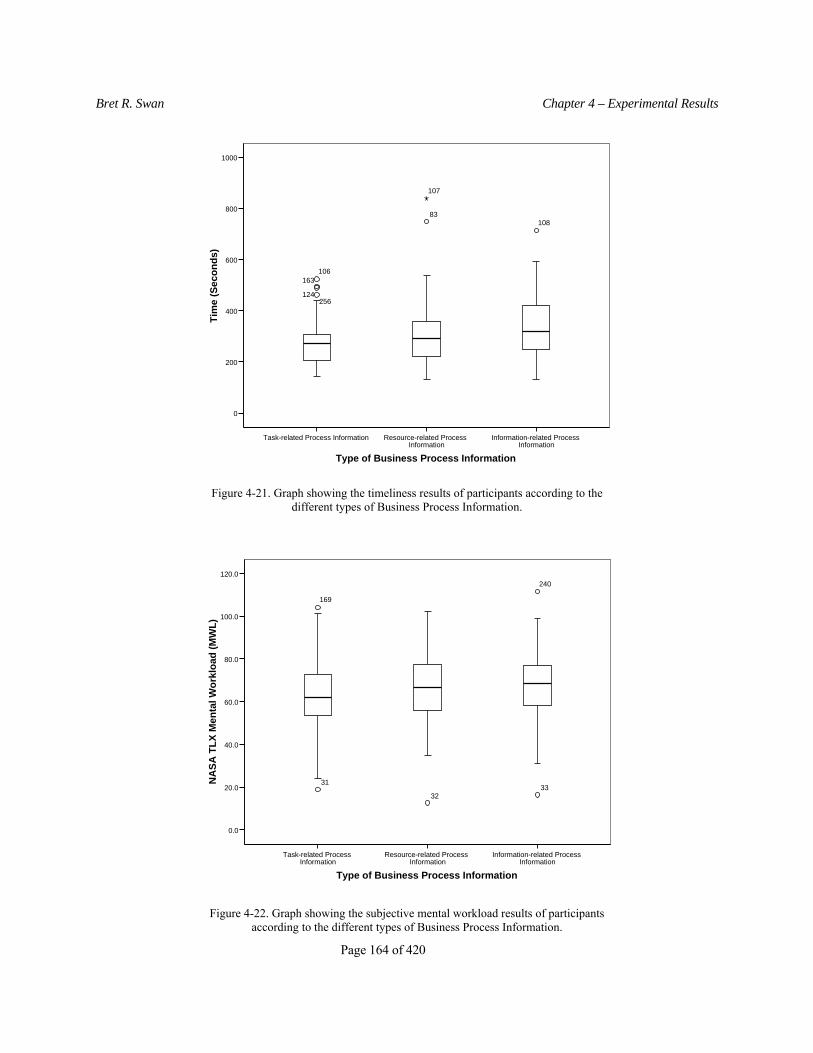
Bret R. Swan Chapter 4 – Experimental Results
Page 164 of 420
Type of Business Process Information
Information-related Process Information
Resource-related Process Information
Task-related Process Information
Tim
e (S
econ
ds)
1000
800
600
400
200
0
107
83
106163
124256
108
Figure 4-21. Graph showing the timeliness results of participants according to the different types of Business Process Information.
Type of Business Process Information
Information-related Process Information
Resource-related Process Information
Task-related Process Information
NA
SA T
LX M
enta
l Wor
kloa
d (M
WL)
120.0
100.0
80.0
60.0
40.0
20.0
0.0
32
169
31
240
33
Figure 4-22. Graph showing the subjective mental workload results of participants according to the different types of Business Process Information.

Bret R. Swan Chapter 4 – Experimental Results
Page 165 of 420
There was no significant effect of BPI type on subjective mental workload by users of resource-
centric and information-centric BPI, F(1,81)=0.00, p = 0.997. However, there were significant effects of
differences between these two BPI types compared to users of task-centric BPI results on subjective mental
workload, F(1,81)=7.84, p = 0.006 and F(1,81)=8.87, p = 0.004 respectively (see Table 4-29). Figure 4-22
shows that users of task-centric BPI reported less subjective mental workload than users of the other two
BPI Types. There was not a significant difference between resource-centric and task-centric BPI on
subjective mental workload, F(2,81)=0.42, p = 0.662. There was a significant effect between information-
centric and task-centric BPI Types, F(2,81)=3.80, p = 0.026, and between resource-centric and information-
centric BPI, F(2,81)=5.34, p = 0.007 on subjective mental workload. Therefore, Hypothesis 2.3 was
supported. Hypothesis 2.6 was partially supported in that resource-centric users reported significantly higher
subjective mental workload than task-centric BPI interpretations, but their results were not significantly
different from information-centric BPI subjective mental workload results. Finally, Hypothesis 2.8 was not
supported. The results for Hypothesis 3 and its sub-hypotheses are summarized in Table 4-30.
Table 4-30. Hypothesis 2 Results
Research Question 2:
How do different types of Business Process Information influence user task performance, subjective mental workload, and self-efficacy when interpreting graphical business process information?
Results
H2: The type of Business Process Information will significantly affect participants’ task performance (i.e., accuracy and timeliness), and subjective mental workload1.
Partially Supported (Timeliness & Mental
Workload only)
Partially Supported (> Information-centric
BPI)
Supported
Hypothesis 2:
2.1 Participants using GPMs portraying task-centric BPI will produce significantly higher accuracy results compared to resource- or information-centric BPI.
2.2 Participants using GPMs portraying task-centric BPI will produce significantly better timeliness results compared to resource- or information-centric BPI.
2.3 Participants using GPMs portraying task-centric BPI will experience significantly lower subjective mental workload compared to resource- or information-centric BPI.
Supported
1 Self-efficacy was not measured within-subjects so it is not included in this hypothesis.
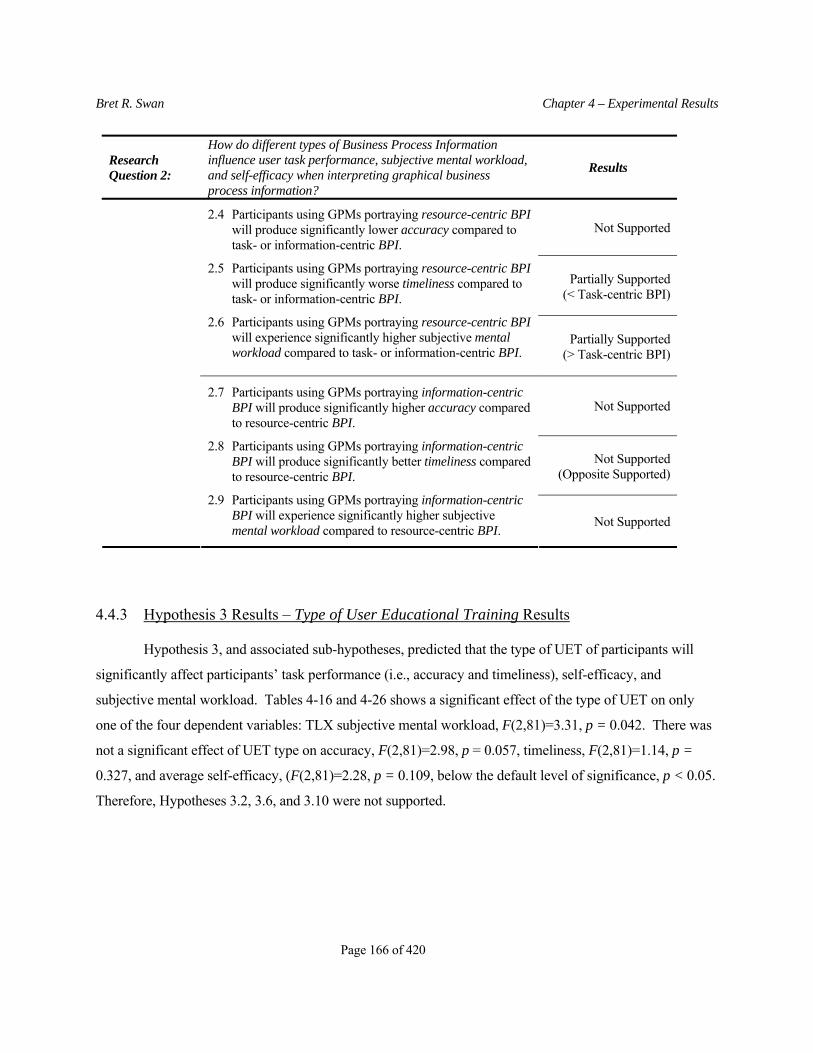
Bret R. Swan Chapter 4 – Experimental Results
Page 166 of 420
Research Question 2:
How do different types of Business Process Information influence user task performance, subjective mental workload, and self-efficacy when interpreting graphical business process information?
Results
Not Supported
Partially Supported (< Task-centric BPI)
2.4 Participants using GPMs portraying resource-centric BPI will produce significantly lower accuracy compared to task- or information-centric BPI.
2.5 Participants using GPMs portraying resource-centric BPI will produce significantly worse timeliness compared to task- or information-centric BPI.
2.6 Participants using GPMs portraying resource-centric BPI will experience significantly higher subjective mental workload compared to task- or information-centric BPI.
Partially Supported (> Task-centric BPI)
Not Supported
Not Supported (Opposite Supported)
2.7 Participants using GPMs portraying information-centric BPI will produce significantly higher accuracy compared to resource-centric BPI.
2.8 Participants using GPMs portraying information-centric BPI will produce significantly better timeliness compared to resource-centric BPI.
2.9 Participants using GPMs portraying information-centric BPI will experience significantly higher subjective mental workload compared to resource-centric BPI.
Not Supported
4.4.3 Hypothesis 3 Results – Type of User Educational Training Results
Hypothesis 3, and associated sub-hypotheses, predicted that the type of UET of participants will
significantly affect participants’ task performance (i.e., accuracy and timeliness), self-efficacy, and
subjective mental workload. Tables 4-16 and 4-26 shows a significant effect of the type of UET on only
one of the four dependent variables: TLX subjective mental workload, F(2,81)=3.31, p = 0.042. There was
not a significant effect of UET type on accuracy, F(2,81)=2.98, p = 0.057, timeliness, F(2,81)=1.14, p =
0.327, and average self-efficacy, (F(2,81)=2.28, p = 0.109, below the default level of significance, p < 0.05.
Therefore, Hypotheses 3.2, 3.6, and 3.10 were not supported.

Bret R. Swan Chapter 4 – Experimental Results
Page 167 of 420
Table 4-31. Results of Planned Comparisons using simple contrast methodologies which indicate direction and significance between the types of User Educational Training (n = 87).
Type of User Educational Training Dependent Variable
Simple Contrasts* Accuracy (Percent)
Time (Seconds)
NASA TLX
Mental Workload
Average Self -
Efficacy Score
IE vs. CS (a) Contrast Estimate 2.61 -27.29 4.19 -.18 Hypothesized Value 0 0 0 0 Difference (Estimate - Hypothesized) 2.61 -27.29 4.19 -.18 Std. Error 3.11 22.40 3.73 .50 Sig. .403 .227 .264 .721MGT vs. IE (b) Contrast Estimate -6.98 30.11 4.52 -.74 Hypothesized Value 0 0 0 0 Difference (Estimate - Hypothesized) -6.98 30.11 4.52 -.74 Std. Error 2.95 21.24 3.53 .48 Sig. .020* .160 .204 .128MGT vs. CS (a) Contrast Estimate -4.36 2.83 8.71 -.92 Hypothesized Value 0 0 0 0 Difference (Estimate - Hypothesized) -4.36 2.83 8.71 -.92 Std. Error 2.84 20.44 3.40 .46 Sig. .128 .890 .012* .050*†p < 0.10 *p < 0.05 **p < 0.01 ***p < 0.001 a Reference category = 3 b Reference category = 1
The results of planned comparisons in Table 4-31 indicated that three significant differences exist
between groups of the four dependent variables:
There was significant effect between MGT and IE students on accuracy, p (one-tailed) = 0.020.
Figure 4-23 shows MGT students produced less accurate results than IE students. Therefore,
Hypothesis 3.9 was supported and Hypothesis 3.5 was only partially supported.
There was a significant difference between MGT and CS students on subjective mental
workload, p (one-tailed) = 0.013. Figure 4-24 shows that MGT students experienced more
subjective mental workload than both CS and IE students (but the latter relationship was not
statistically significant). Therefore, Hypotheses 3.3 and 3.7 were partially supported.
There was a significant difference between MGT and CS students on average self-efficacy, p
(one-tailed) = 0.050. Figure 4-25 showed MGT students experienced lower average self-
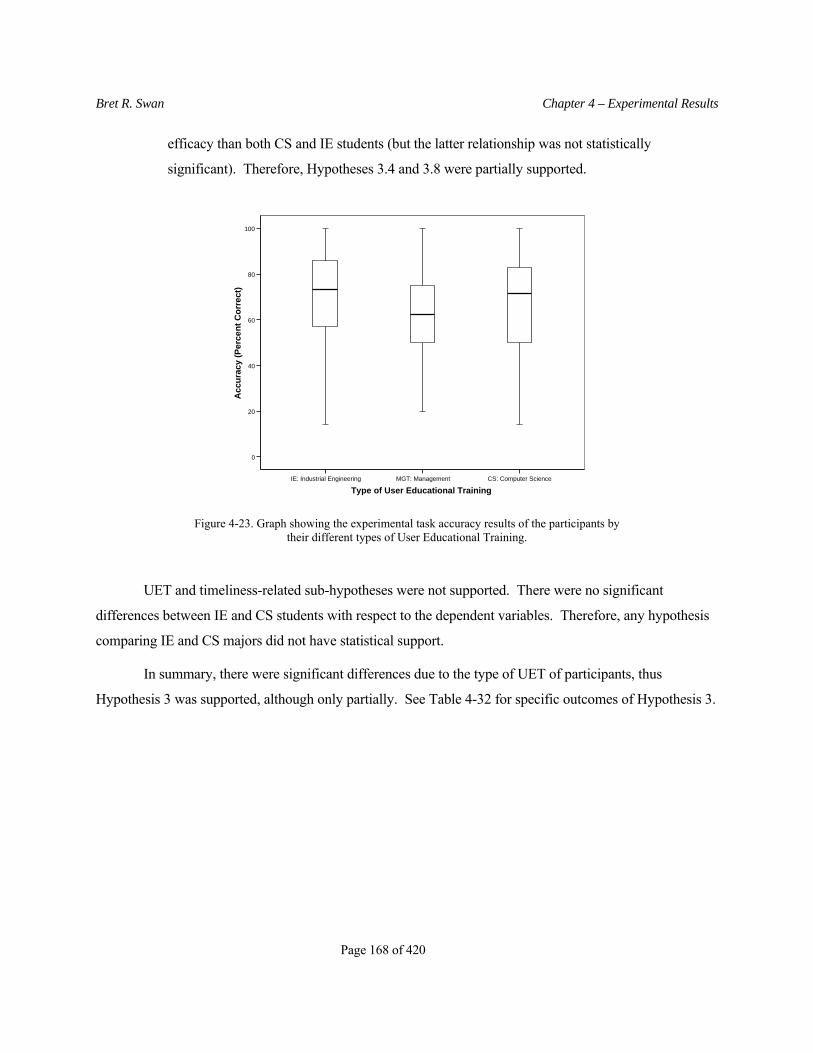
Bret R. Swan Chapter 4 – Experimental Results
Page 168 of 420
efficacy than both CS and IE students (but the latter relationship was not statistically
significant). Therefore, Hypotheses 3.4 and 3.8 were partially supported.
Type of User Educational TrainingCS: Computer ScienceMGT: ManagementIE: Industrial Engineering
Acc
urac
y (P
erce
nt C
orre
ct)
100
80
60
40
20
0
Figure 4-23. Graph showing the experimental task accuracy results of the participants by their different types of User Educational Training.
UET and timeliness-related sub-hypotheses were not supported. There were no significant
differences between IE and CS students with respect to the dependent variables. Therefore, any hypothesis
comparing IE and CS majors did not have statistical support.
In summary, there were significant differences due to the type of UET of participants, thus
Hypothesis 3 was supported, although only partially. See Table 4-32 for specific outcomes of Hypothesis 3.
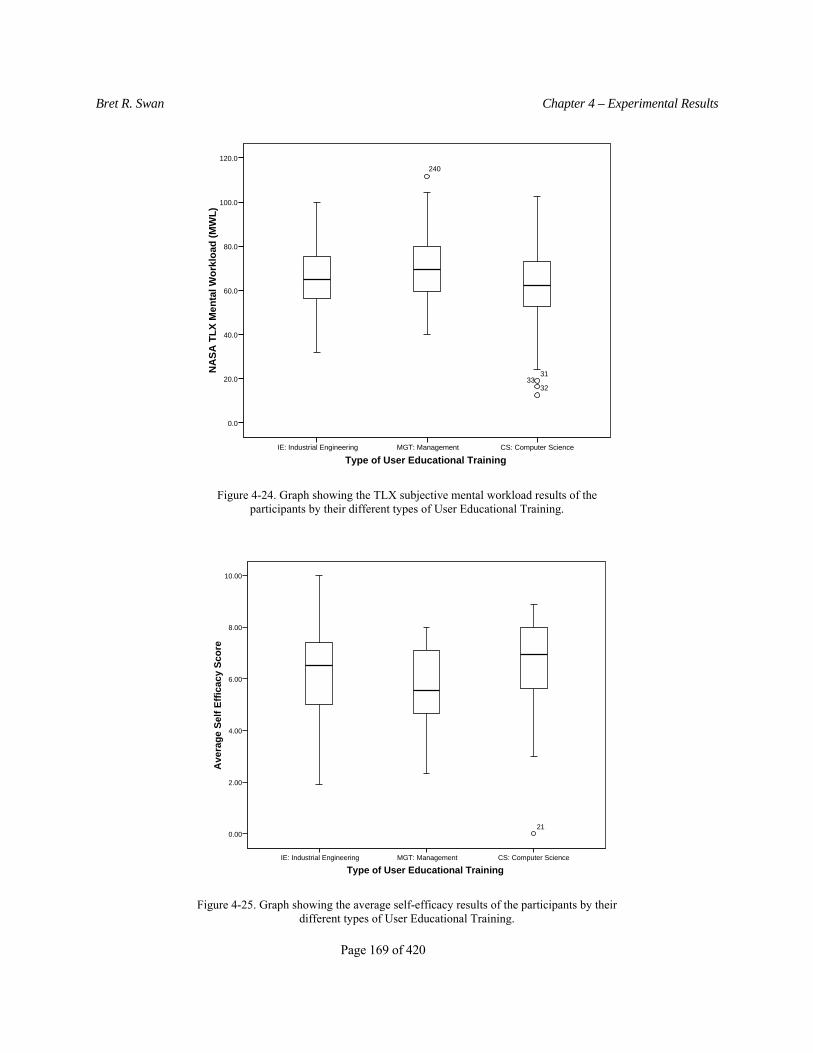
Bret R. Swan Chapter 4 – Experimental Results
Page 169 of 420
Type of User Educational TrainingCS: Computer ScienceMGT: ManagementIE: Industrial Engineering
NA
SA T
LX M
enta
l Wor
kloa
d (M
WL)
120.0
100.0
80.0
60.0
40.0
20.0
0.0
3133
32
240
Figure 4-24. Graph showing the TLX subjective mental workload results of the participants by their different types of User Educational Training.
Type of User Educational TrainingCS: Computer ScienceMGT: ManagementIE: Industrial Engineering
Ave
rage
Sel
f Effi
cacy
Sco
re
10.00
8.00
6.00
4.00
2.00
0.0021
Figure 4-25. Graph showing the average self-efficacy results of the participants by their different types of User Educational Training.
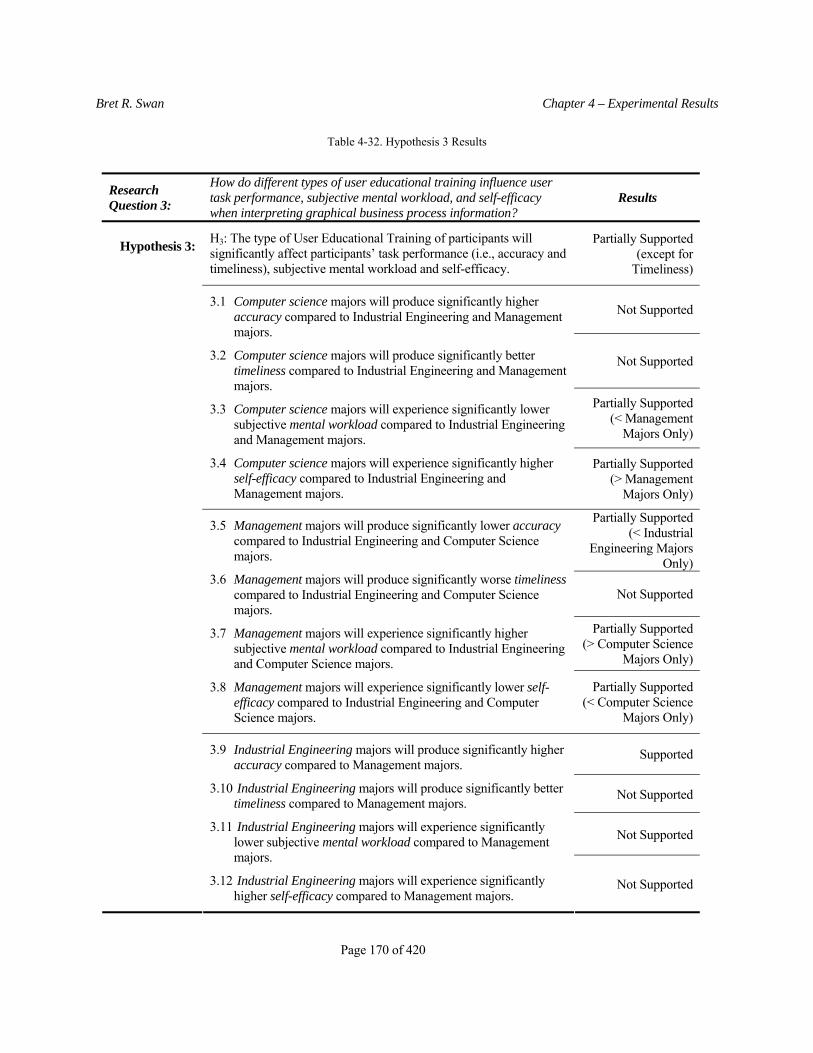
Bret R. Swan Chapter 4 – Experimental Results
Page 170 of 420
Table 4-32. Hypothesis 3 Results
Research Question 3:
How do different types of user educational training influence user task performance, subjective mental workload, and self-efficacy when interpreting graphical business process information?
Results
H3: The type of User Educational Training of participants will significantly affect participants’ task performance (i.e., accuracy and timeliness), subjective mental workload and self-efficacy.
Partially Supported (except for
Timeliness)
Not Supported
Not Supported
Partially Supported (< Management
Majors Only)
3.1 Computer science majors will produce significantly higher accuracy compared to Industrial Engineering and Management majors.
3.2 Computer science majors will produce significantly better timeliness compared to Industrial Engineering and Management majors.
3.3 Computer science majors will experience significantly lower subjective mental workload compared to Industrial Engineering and Management majors.
3.4 Computer science majors will experience significantly higher self-efficacy compared to Industrial Engineering and Management majors.
Partially Supported (> Management
Majors Only)
Partially Supported (< Industrial
Engineering Majors Only)
Not Supported
Partially Supported (> Computer Science
Majors Only)
3.5 Management majors will produce significantly lower accuracy compared to Industrial Engineering and Computer Science majors.
3.6 Management majors will produce significantly worse timeliness compared to Industrial Engineering and Computer Science majors.
3.7 Management majors will experience significantly higher subjective mental workload compared to Industrial Engineering and Computer Science majors.
3.8 Management majors will experience significantly lower self-efficacy compared to Industrial Engineering and Computer Science majors.
Partially Supported (< Computer Science
Majors Only)
Supported
Not Supported
Not Supported
Hypothesis 3:
3.9 Industrial Engineering majors will produce significantly higher accuracy compared to Management majors.
3.10 Industrial Engineering majors will produce significantly better timeliness compared to Management majors.
3.11 Industrial Engineering majors will experience significantly lower subjective mental workload compared to Management majors.
3.12 Industrial Engineering majors will experience significantly higher self-efficacy compared to Management majors.
Not Supported

Bret R. Swan Chapter 4 – Experimental Results
Page 171 of 420
4.4.4 Hypothesis 4 Results – Subjective Mental Workload Correlations with Performance
Hypothesis 4, and associated sub-hypotheses, state that participants’ task performance is correlated
with subjective reports of mental workload according to the Yerkes-Dodson Law. TLX mental workload
was evaluated three times per participant, at the same times as accuracy and timeliness. By applying TLX
weightings, three TLX mental workload scores were calculated for each participant (n = 261). Pearson’s
correlation results testing these hypotheses between accuracy, time, and subjective mental workload are
illustrated in Table 4-33. Although statistically significant, only small correlations exist between TLX
mental workload and these variables: accuracy r (261) = - 0.25, p = 0.01 (2-tailed), and time r (261) = 0.22,
p = 0.01 (2-tailed).
Table 4-33. Correlations between subjective mental workload and performance variables (n = 261).
Accuracy
(% Correct) Time
(Seconds)
NASA TLX Mental
Workload Accuracy (% Correct) 1 -.18** -.25** Time (Seconds) 1 .22** NASA TLX Mental Workload 1 ** Correlation is significant at the p < 0.01 level (2-tailed).
Figures 4-26 and 4-27 show the plots of cubic polynomial equations that evaluate the inverse
relationship specified by the Yerkes-Dodson Law. Visually, there appears to be a slight inverse relationship
between accuracy and TLX mental workload. After a certain point in Figure 4-26, subjective mental
workload increases, accuracy tends to decrease. Figure 4-27 shows a similar relationship between
timeliness and TLX mental workload; as TLX mental workload increases, the time on task increases until a
certain point (i.e., timeliness decreases). Although the curve fit lines were statistically significant for both
accuracy vs. mental workload (Figure 4-26, adjusted R2 = 0.07, p = 0.000) and time vs. mental workload
(Figure 4-27, adjusted R2 = 0.06, p = 0.000), neither curve explained a large amount of variation in the data.
These figures seemed to visually support the sub-hypotheses, but statistically the results were not
significant. Therefore, Hypothesis 4, and its associated sub-hypotheses, were not supported (see Table 4-
34).

Bret R. Swan Chapter 4 – Experimental Results
Page 172 of 420
NASA TLX Mental Workload120.0100.080.060.040.020.00.0
100
80
60
40
20
0
Accuracy (% Correct)
CubicObserved
Figure 4-26. Trend line showing a slight inverse relationship between accuracy and subjective mental workload.
NASA TLX Mental Workload120.0100.080.060.040.020.00.0
1000
800
600
400
200
0
Time (seconds)
CubicObserved
Figure 4-27. Trend line showing a slight inverse relationship between accuracy and subjective mental workload.

Bret R. Swan Chapter 4 – Experimental Results
Page 173 of 420
Table 4-34. Hypothesis 4 Results
Research Question 4:
When interpreting graphical business process information, does the relationship between user subjective Mental Workload and Task Performance follow the Yerkes-Dodson Law (an inverted-U relationship)?
Results
H4: Participants’ subjective mental workload will significantly affect task performance (i.e., task accuracy and timeliness) in inverted-U relationships (in accordance with the Yerkes-Dodson principle).
Not Supported
Not Supported
Not Supported
4.1 Low subjective mental workload will be associated with low accuracy.
4.2 Moderate subjective mental workload will be associated with high accuracy.
4.3 High subjective mental workload will be associated with low accuracy. Not Supported
Not Supported
Not Supported
Hypothesis 4:
4.4 Low subjective mental workload will be associated with low timeliness.
4.5 Moderate subjective mental workload will be associated with high timeliness.
4.6 High subjective mental workload will be associated with low timeliness. Not Supported
4.4.5 Hypothesis 5 Results – Subjective Mental Workload Correlation with Self-Efficacy
Hypothesis 5 states that self-efficacy is negatively correlated with the subjective mental workload
participants experience during task performance. Self-efficacy was assessed at the end of the entire
experiment by participant ratings of nine separate questions. Then, an overall average for self efficacy was
calculated for each participant (n = 87). In addition, an overall TLX mental workload score was calculated
by averaging each participants’ three ratings of the six TLX dimensions (i.e., mental demand, physical
demand, temporal demand, performance, effort, frustration) and then applying participants’ overall TLX
weightings to the average for each TLX dimension. In this way, an overall TLX mental workload score was
calculated for each participant (n = 87).

Bret R. Swan Chapter 4 – Experimental Results
Page 174 of 420
Table 4-35. Correlations between-subjects relating TLX mental workload to average self-efficacy (n = 87).
NASA TLX Mental
Workload - Task-centric
BPI
NASA TLX Mental
Workload - Resource-centric BPI
NASA TLX Mental
Workload - Information-centric BPI
Overall NASA TLX Mental
Workload Self-Efficacy Q1-If Alone & No One
Was Available to Help -.32** -.38** -.34** -.40**
Self-Efficacy Q2-If Never Used MG or UML Diagrams Before -.27* -.30** -.26* -.32**
Self-Efficacy Q3-If Had Only the Training Handouts for Reference -.21 -.21 -.32** -.28**
Self-Efficacy Q4-If Had Seen Others Using MG or UML Diagrams -.32** -.29** -.17 -.30**
Self-Efficacy Q5-If Could Call on Someone for Help -.20 -.09 -.15 -.17
Self-Efficacy Q6-If Someone Helped You Get Started -.32** -.21 -.19 -.28**
Self-Efficacy Q7-If Had A lot of Time -.22* -.14 -.12 -.18
Self-Efficacy Q8-If Had Training Handouts 2 -.35** -.26* -.36** -.37**
Self-Efficacy Q9-If Used MG or UML Diagrams on Similar Tasks -.28** -.19 -.18 -.25*
Average Self Efficacy -.38** -.32** -.32** -.39** †p < 0.10 *p < 0.05 **p < 0.01 ***p < 0.001 (2-tailed)
Table 4-35 shows the correlations between the measures of TLX mental workload and self-efficacy.
In addition, the overall average self-efficacy and TLX mental workload scores, the correlations between the
average scores for each of the nine questions of self-efficacy, and the three TLX mental workload scores per
participant are included in Table 4-35. Although many of these questions were significantly and negatively
correlated, none were correlated above r (87) = - 0.40, p (2-tailed) < 0.01.
Exploratory factor analyses, that included TLX mental workload and the nine self-efficacy
constructs, confirmed TLX mental workload as unrelated to self-efficacy (see Appendix O). The TLX
mental workload constructs loaded on an entirely separate factor than the self-efficacy constructs that
explained the least amount of variation (19.5%). The largest of the three factors, explaining 28.5% of the
variation, loaded with all the positively worded self-efficacy questions. The second largest factor,
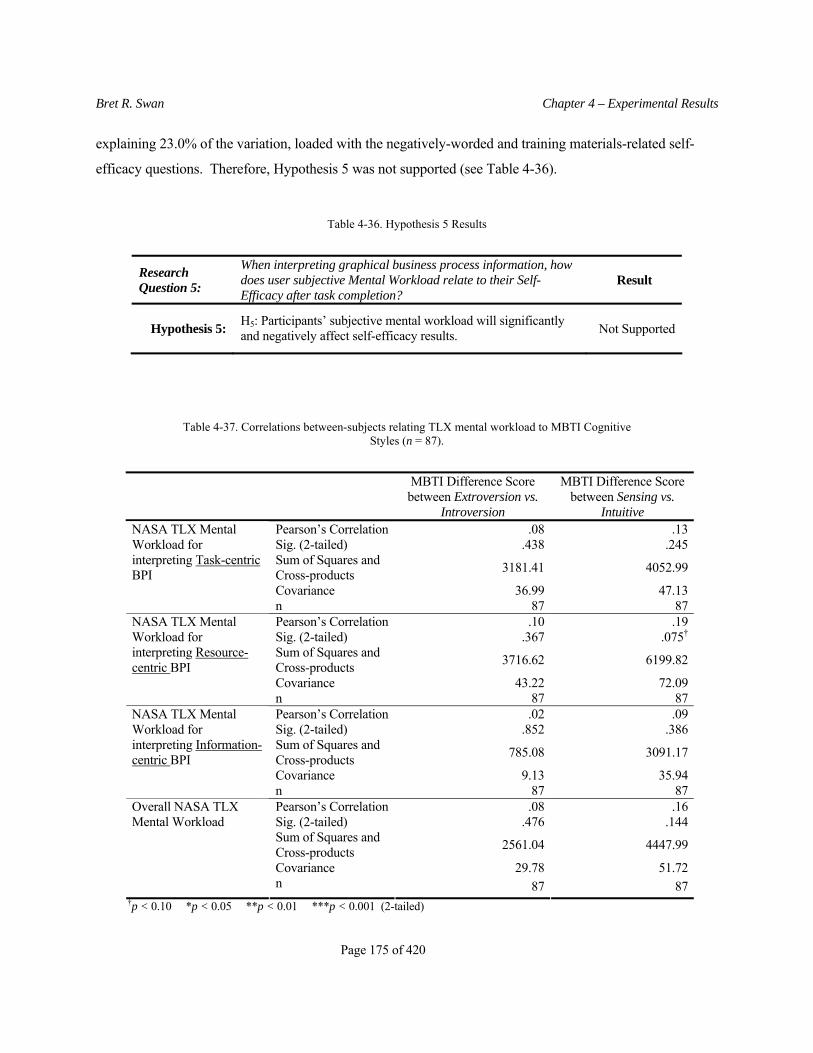
Bret R. Swan Chapter 4 – Experimental Results
Page 175 of 420
explaining 23.0% of the variation, loaded with the negatively-worded and training materials-related self-
efficacy questions. Therefore, Hypothesis 5 was not supported (see Table 4-36).
Table 4-36. Hypothesis 5 Results
Research Question 5:
When interpreting graphical business process information, how does user subjective Mental Workload relate to their Self-Efficacy after task completion?
Result
Hypothesis 5: H5: Participants’ subjective mental workload will significantly and negatively affect self-efficacy results. Not Supported
Table 4-37. Correlations between-subjects relating TLX mental workload to MBTI Cognitive Styles (n = 87).
MBTI Difference Score between Extroversion vs.
Introversion
MBTI Difference Score between Sensing vs.
Intuitive Pearson’s Correlation .08 .13Sig. (2-tailed) .438 .245Sum of Squares and Cross-products 3181.41 4052.99
Covariance 36.99 47.13
NASA TLX Mental Workload for interpreting Task-centric BPI
n 87 87Pearson’s Correlation .10 .19Sig. (2-tailed) .367 .075†
Sum of Squares and Cross-products 3716.62 6199.82
Covariance 43.22 72.09
NASA TLX Mental Workload for interpreting Resource-centric BPI
n 87 87Pearson’s Correlation .02 .09Sig. (2-tailed) .852 .386Sum of Squares and Cross-products 785.08 3091.17
Covariance 9.13 35.94
NASA TLX Mental Workload for interpreting Information-centric BPI
n 87 87Pearson’s Correlation .08 .16Sig. (2-tailed) .476 .144Sum of Squares and Cross-products 2561.04 4447.99
Covariance 29.78 51.72
Overall NASA TLX Mental Workload
n 87 87†p < 0.10 *p < 0.05 **p < 0.01 ***p < 0.001 (2-tailed)

Bret R. Swan Chapter 4 – Experimental Results
Page 176 of 420
4.4.6 Hypothesis 6 Results – Cognitive Style and Subjective Mental Workload
Hypothesis 6 states that participants’ cognitive styles of extroversion vs. introversion and sensing
vs. intuition (as assessed by the Myers-Briggs Type Indicator (MBTI)) significantly impacts the subjective
mental workload participants experience during task performance. Table 4-37 shows that there was no
significant correlation between subjective mental workload scores and extrovert-introvert or sensing-
intuition scores. Tables 4-38 and 4-39 report the between and within-subject sections of the repeated
measures MANCOVA results that portrayed extrovert-introvert and sensing-intuition covariation. These
tables show there was not significant effect of the two MBTI cognitive styles on accuracy, timeliness, or
subjective mental workload. Therefore, Hypothesis 6 and its sub-hypotheses were not supported (see Table
4-40).
Table 4-38. Tests of MBTI Cognitive Styles as covariates of between-subjects, MANCOVA (n = 87).
Source Measure Type III Sum
of Squares df Mean
Square F Sig. Accuracy 55.02 1 55.02 .15 .703Time 51609.19 1 51609.19 2.74 .102
MBTI Difference Score between Extroversion vs. Introversion Mental Workload 344.09 1 344.09 .64 .425
Accuracy 10.93 1 10.93 .03 .865Time 73.46 1 73.46 .00 .951
MBTI Difference Score between Sensing vs. Intuitive
Mental Workload 311.21 1 311.21 .58 .448†p < 0.10 *p < 0.05 **p < 0.01 ***p < 0.001 (2-tailed)
Table 4-39. Tests of MBTI Cognitive Styles as covariates of within-subjects, repeated measures MANCOVA (n = 87).
Source Measure Sphericity Correction
Type III Sum of Squares df
Mean Square F Sig.
Accuracy Huynh-Feldt 613.08 1.95 315.29 1.09 .339Time Sphericity Assumed 4227.85 2 2113.92 .37 .692
BPI Type X MBTI EvsI Score Mental Workload Sphericity Assumed 76.00 2 38.00 .41 .664
Accuracy Huynh-Feldt 103.38 1.95 52.90 .18 .830Time Sphericity Assumed 7911.62 2 3955.81 .69 .501
BPI Type X MBTI SvsN Score Mental Workload Sphericity Assumed 100.91 2 50.45 .55 .581
†p < 0.10 *p < 0.05 **p < 0.01 ***p < 0.001 (2-tailed)

Bret R. Swan Chapter 4 – Experimental Results
Page 177 of 420
Table 4-40. Hypothesis 6 Results
Research Question 6:
How do user Cognitive Styles affect the subjective Mental Workload they experience when interpreting graphical business process information?
Result
Not Supported
Not Supported
Hypothesis 6: H6: Participants’ cognitive styles will significantly affect the subjective mental workload they experience during task performance.
6.1 Participants’ scoring high on the cognitive style of extroversion will experience significantly lower subjective mental workload than participants scoring high on introversion.
6.2 Participants’ scoring high on the cognitive style of sensing will experience significantly lower subjective mental workload than participants scoring high on intuition.
Not Supported
4.4.7 Hypothesis 7 Results – General Cognitive Abilities and Subjective Mental Workload
Hypothesis 7 proposes that a participants’ general cognitive abilities, as assessed by the WPT
significantly affects the subjective mental workload they experience during task performance. Table 4-41
shows no significantly large correlation between WPT scores and participants’ overall subjective mental
workload. For example, even though there was a significant, negative correlation between WPT scores and
the subjective mental workload that participants reported when interpreting information-centric BPI, the
correlation was low, r (87) = - 0.21, p = 0.049 (2-tailed).
Several interesting results were no hypothesized. Tables 4-42 and 4-43 report the between and
within-subject sections of repeated measures MANCOVA results that included WPT scores as covariates.
The between-subjects sections of a MANCOVA in Tables 4-42 show that WPT scores did not have a
covariate effect on the relationships between GPM type and the dependent variables compared to Table 4-
26). However, a significant covariate effect of WPT was observed on the effects of UET type on the
dependent variables. When WPT was included in the analysis as a covariate, the effect of UET type on
accuracy, F(2,80)=1.32, p = 0.274, and subjective mental workload, F(2,80)=2.96, p = 0.057, was no
longer significant. Also, MANCOVA revealed a significant direct effect of WPT on task accuracy,
F(1,80)=10.90, p = 0.001, that was not hypothesized.
Table 4-43 reports the within-subjects portion of this MANCOVA. When WPT scores were
considered as covariates within-subjects, there is no longer a significant effect of the type of BPI on task
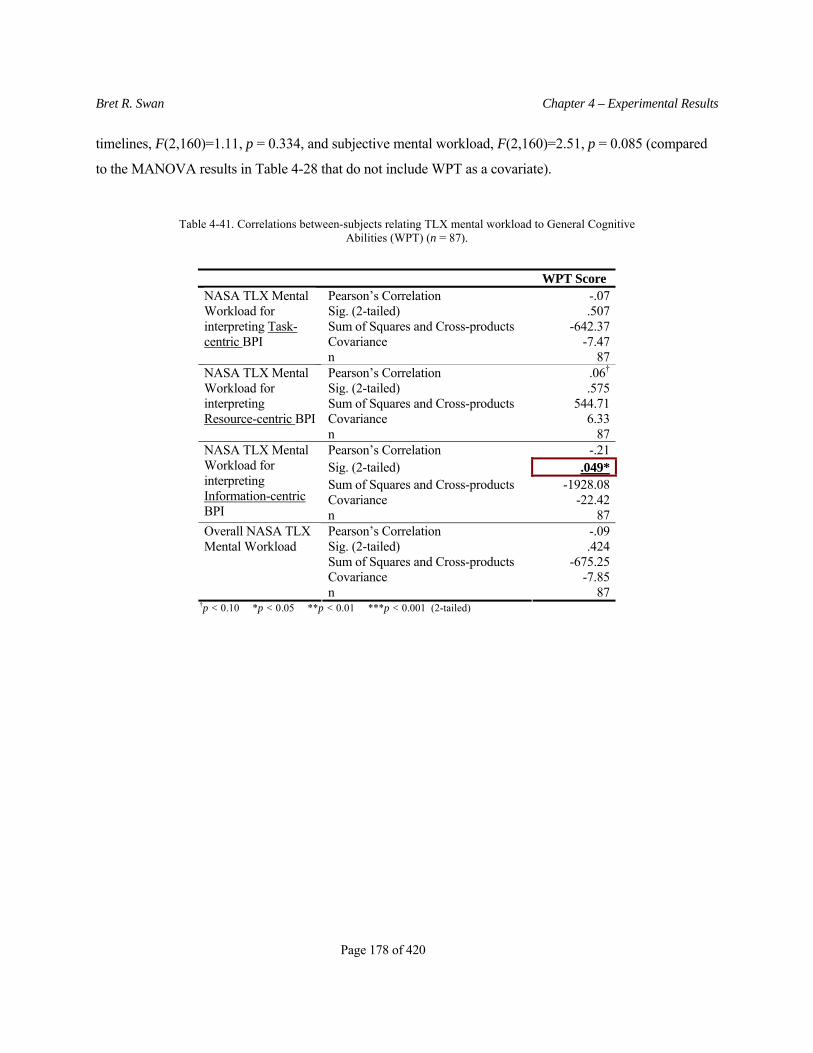
Bret R. Swan Chapter 4 – Experimental Results
Page 178 of 420
timelines, F(2,160)=1.11, p = 0.334, and subjective mental workload, F(2,160)=2.51, p = 0.085 (compared
to the MANOVA results in Table 4-28 that do not include WPT as a covariate).
Table 4-41. Correlations between-subjects relating TLX mental workload to General Cognitive Abilities (WPT) (n = 87).
WPT Score Pearson’s Correlation -.07 Sig. (2-tailed) .507 Sum of Squares and Cross-products -642.37 Covariance -7.47
NASA TLX Mental Workload for interpreting Task-centric BPI
n 87 Pearson’s Correlation .06† Sig. (2-tailed) .575 Sum of Squares and Cross-products 544.71 Covariance 6.33
NASA TLX Mental Workload for interpreting Resource-centric BPI
n 87 Pearson’s Correlation -.21 Sig. (2-tailed) .049* Sum of Squares and Cross-products -1928.08 Covariance -22.42
NASA TLX Mental Workload for interpreting Information-centric BPI n 87
Pearson’s Correlation -.09 Sig. (2-tailed) .424 Sum of Squares and Cross-products -675.25 Covariance -7.85
Overall NASA TLX Mental Workload
n 87 †p < 0.10 *p < 0.05 **p < 0.01 ***p < 0.001 (2-tailed)

Bret R. Swan Chapter 4 – Experimental Results
Page 179 of 420
Table 4-42. MANCOVA between-subjects results that include the covariate General Cognitive Abilities (WPT scores) (n = 87).
Source Measure Type III Sum
of Squares df Mean Square F Sig. Intercept Accuracy 26699.66 1 26699.66 80.76 .000 Time 1442806.07 1 1442806.07 76.06 .000 Mental Workload 48019.89 1 48019.89 89.04 .000 WPT Scores Accuracy 3604.48 1 3604.48 10.90 .001*** Time 42386.35 1 42386.35 2.23 .139 Mental Workload 6.99 1 6.99 .01 .910 GPM Type Accuracy 16086.84 1 16086.84 48.66 .000*** Time 347623.62 1 347623.62 18.33 .000*** Mental Workload 1844.48 1 1844.48 3.42 .068† UET Type Accuracy 869.32 2 434.66 1.32 .274 Time 32075.08 2 16037.54 .85 .433 Mental Workload 3196.39 2 1598.19 2.96 .057† GPM X UET Type Accuracy 574.81 2 287.41 .87 .423 Time 56340.11 2 28170.05 1.49 .233 Mental Workload 2147.18 2 1073.59 1.99 .143 Error Accuracy 26449.41 80 330.62 Time 1517549.53 80 18969.37 Mental Workload 43142.68 80 539.28
†p < 0.10 *p < 0.05 **p < 0.01 ***p < 0.001 (2-tailed)
Table 4-43. MANCOVA tests of General Cognitive Abilities (WPT scores) as covariates (n = 87).
Source Measure Sphericity Correction
Type III Sum of Squares df
Mean Square F Sig.
BPI Type Accuracy Huynh-Feldt 40.44 1.96 20.69 .07 .928 Time Sphericity Assumed 12684.09 2 6342.05 1.11 .334 Mental Workload Sphericity Assumed 452.19 2 226.09 2.51 .085†
Accuracy Huynh-Feldt 1.44 1.96 .74 .00 .997 Time Sphericity Assumed 1719.30 2 859.65 .15 .861
BPI Type X WPT Score Mental Workload Sphericity Assumed 464.15 2 232.08 2.57 .080†
†p < 0.10 *p < 0.05 **p < 0.01 ***p < 0.001 (2-tailed)
These results show that WPT scores had a significant effect, but small, on subjective mental
workload; however, these results did not show a significant negative correlation. As a covariate, WPT did

Bret R. Swan Chapter 4 – Experimental Results
Page 180 of 420
affect subjective mental workload in relation to UET type and BPI type. Therefore, Hypothesis 7 was
partially supported (see Table 4-44). Other direct and covariate effects of WPT were discovered.
Table 4-44. Hypothesis 7 Results
Research Question 7:
How do user General Cognitive Abilities affect the subjective Mental Workload they experience when interpreting graphical business process information?
Result
Hypothesis 7: H7: Participants with high general cognitive abilities will experience significantly lower subjective mental workload.
Partially Supported (indirectly as a
covariate)
4.4.8 Hypothesis 8 Results – Attentional Abilities and Subjective Mental Workload
Hypothesis 8 states that participants’ attentional abilities, as assessed by the DAPI, significantly
affects the subjective mental workload they experience during task performance. Table 4-45 shows the
correlations between individual-level evaluations of DAPI constructs and subjective mental workload.
Several negative and significant correlations existed, but the strength of these correlations was small (below
r (87) < 0.40). The results from four MANCOVAs testing each of the four DAPI constructs are described
below.
Table 4-45. Correlations between-subjects relating TLX mental workload to DAPI assessments of attentional abilities (n = 87).
NASA TLX Mental
Workload -Task-centric
BPI
NASA TLX Mental
Workload - Resource-centric BPI
NASA TLX Mental
Workload - Information-centric BPI
Overall NASA TLX Mental
Workload
DAPI Moderate-Focus -.196 -.218* -.267* -.262*
DAPI Extreme-Focus -.071 -.022 -.135 -.088
DAPI Dual Cognitive-Physical Tasks -.269* -.215* -.235* -.276**
DAPI Dual Cognitive-Cognitive Tasks -.144 -.271* -.214* -.242*
†p < 0.10 *p < 0.05 **p < 0.01 ***p < 0.001

Bret R. Swan Chapter 4 – Experimental Results
Page 181 of 420
DAPI Moderately-Focused Attention: There was no direct significant effect of DAPI Moderately-
Focused Attention on subjective mental workload, F(1,80)=2.30, p = 0.134. However, when taken as a
covariate, there was no longer a significant effect of the type of UET on subjective mental workload,
F(1,80)=2.03, p = 0.139, compared to when this covariate was not taken into account. This result was
interesting because without including this construct covariate, there was a significant effect due to UET type
on subjective mental workload (compare Table 4-26 to Table 4-46). No within-subjects covariate effects
were found to be significant. Thus, Hypotheses 8.1 was partially supported, because DAPI Moderately-
Focused attention indirectly affected subjective mental workload as a covariate. Additional results that were
not hypothesized include a direct significant effect of DAPI Moderately-Focused Attention on the
timeliness, F(1,80)=5.79, p = 0.018 (see Table 4-46).
DAPI Extremely-Focused Attention: There was no direct significant effect of DAPI Extremely-
Focused Attention on subjective mental workload, F(1,80)=0.55, p = 0.460. However, when taken as a
covariate, there was no longer a significant effect of the type of BPI on subjective mental workload,
F(2,80)=0.693, p = 0.502, compared to when this covariate was not taken into account. The between-
subjects MANCOVA remained approximately the same level of statistical significance with this covariate
taken into account as compared to when it was not (compare Table 4-26 to Table 4-46). Thus, Hypotheses
8.2 was partially supported, because DAPI Extremely-Focused attention indirectly affected subjective
mental workload as a covariate. Additional results that were not hypothesized include a direct significant
effect of DAPI Moderately-Focused Attention on the timeliness, F(1,80)=5.79, p = 0.018. There was no
longer a significant effect of the type of BPI on timeliness, F(2,80)=1.466, p = 0.234, compared to when this
covariate was not taken into account (compare Table 4-28 to Table 4-47).
DAPI Dual Cognitive-Physical Tasks Attention: There was a direct significant effect of DAPI
Dual Cognitive-Physical Tasks Attention on subjective mental workload, F(1,80)=5.22, p = 0.025 (Table 4-
47). However, when taken as a covariate, there effect of the type of GPM on subjective mental workload
was lowered significantly, F(2,80)=2.55, p = 0.114, compared to when this covariate was not taken into
account. The effect of the BPI type on subjective mental workload was also no longer significant,
F(2,80)=0.06, p = 0.946 (compare Table 4-28 to Table 4-47). Thus, Hypothesis 8.3 was supported.
Additional results that were not hypothesized include a direct significant effect on timeliness, F(1,80)=4.68,
p = 0.034 (Table 4-47). Also, there was no longer a significant effect of the type of BPI on timeliness,

Bret R. Swan Chapter 4 – Experimental Results
Page 182 of 420
F(2,80)=4.31, p = 0.015, compared to when this covariate was not taken into account (compare Table 4-28
to Table 4-47).
Table 4-46. Between-subject MANCOVA results evaluating the covariate DAPI Dual Cognitive-Physical Tasks (n = 87).
Source Measure
Type III Sum of Squares df Mean Square F Sig.
Intercept Accuracy 47022.43 1 47022.43 125.94 .000 Time 1748175.71 1 1748175.71 94.90 .000 Mental Workload 75343.68 1 75343.68 148.80 .000
Accuracy 183.15 1 183.15 .49 .486 Time 86183.24 1 86183.24 4.68 .034*
DAPI Dual Cognitive-Physical Tasks Mental Workload 2642.77 1 2642.77 5.22 .025* GPM Type Accuracy 14742.99 1 14742.99 39.49 .000*** Time 289696.49 1 289696.49 15.73 .000*** Mental Workload 1290.69 1 1290.69 2.55 .114 UET Type Accuracy 1897.10 2 948.55 2.54 .085† Time 20338.83 2 10169.41 .55 .578 Mental Workload 3236.58 2 1618.29 3.20 .046* GPM Type X UET Type
Accuracy 795.77 2 397.88 1.07 .349
Time 51345.36 2 25672.68 1.39 .254 Mental Workload 1806.34 2 903.17 1.78 .175 Error Accuracy 29870.74 80 373.38 Time 1473752.64 80 18421.91 Mental Workload 40506.90 80 506.34
†p < 0.10 *p < 0.05 **p < 0.01 ***p < 0.001 (2-tailed)

Bret R. Swan Chapter 4 – Experimental Results
Page 183 of 420
Table 4-47. Partial within-subject MANCOVA results evaluating the covariate DAPI Dual Cognitive-Physical Tasks (n = 87).
Source Measure Type III Sum
of Squares df Mean
Square F Sig. BPI Type Accuracy 202.53 1.95 104.02 .36 .694 Time 47849.72 2 23924.86 4.31 .015* Mental Workload 10.30 2 5.15 .06 .946
Accuracy 445.91 1.95 229.02 .79 .454 Time 32461.26 2 16230.63 2.93 .056†
BPI Type X DAPI Dual Cognitive-Physical Tasks Attention Mental Workload 45.73 2 22.87 .25 .782
†p < 0.10 *p < 0.05 **p < 0.01 ***p < 0.001 (2-tailed)
DAPI Dual Cognitive-Cognitive Tasks Attention: There was no direct significant effect of DAPI
Dual Cognitive-Cognitive Tasks Attention on subjective mental workload, F(1,80)=3.06, p = 0.084.
However, when taken as a covariate, there was no longer a significant effect of the type of UET on
subjective mental workload, F(2,80)=2.795, p = 0.067, compared to when this covariate was not taken into
account. Other between-subject results were approximately the same as Table 4-26. Hypothesis 8.4 was
only partially supported (see Table 4-48).
Consequently, Hypothesis 8 was also only partially supported due to no few direct effects of
attentional abilities on subjective mental workload. Yet, there were several covariate effects of attentional
abilities on subjective mental workload.
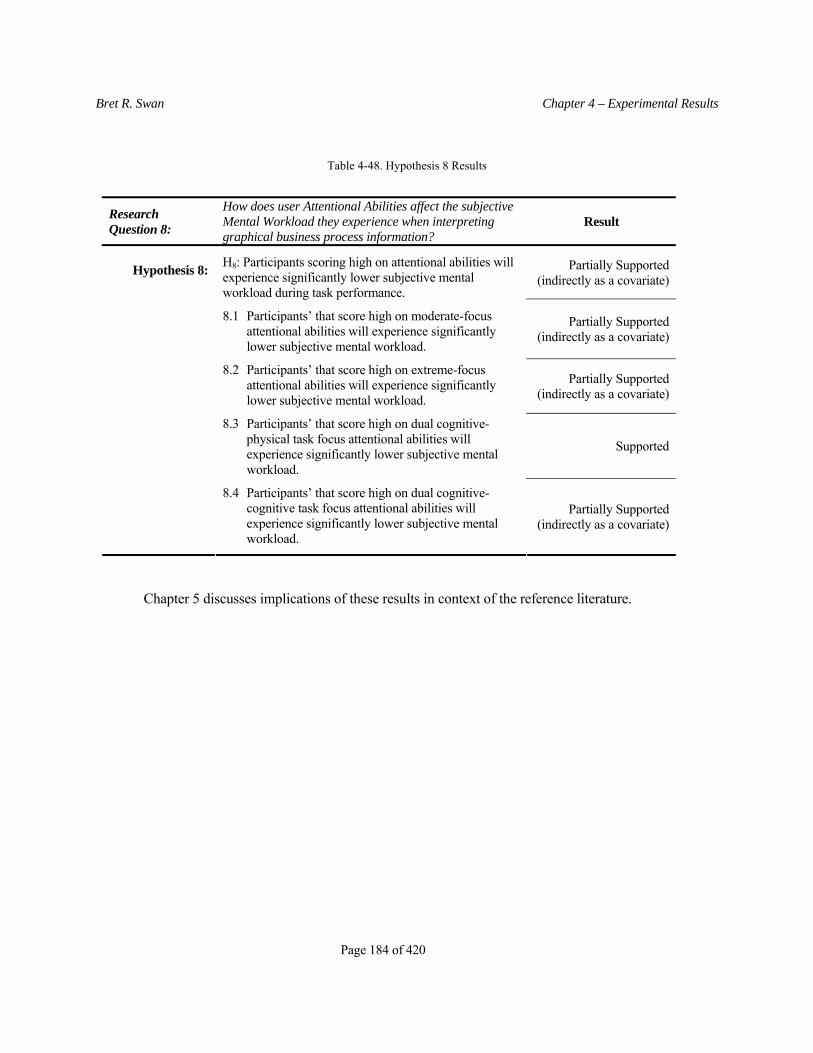
Bret R. Swan Chapter 4 – Experimental Results
Page 184 of 420
Table 4-48. Hypothesis 8 Results
Research Question 8:
How does user Attentional Abilities affect the subjective Mental Workload they experience when interpreting graphical business process information?
Result
Partially Supported (indirectly as a covariate)
Partially Supported (indirectly as a covariate)
Partially Supported (indirectly as a covariate)
Supported
Hypothesis 8: H8: Participants scoring high on attentional abilities will experience significantly lower subjective mental workload during task performance.
8.1 Participants’ that score high on moderate-focus attentional abilities will experience significantly lower subjective mental workload.
8.2 Participants’ that score high on extreme-focus attentional abilities will experience significantly lower subjective mental workload.
8.3 Participants’ that score high on dual cognitive-physical task focus attentional abilities will experience significantly lower subjective mental workload.
8.4 Participants’ that score high on dual cognitive-cognitive task focus attentional abilities will experience significantly lower subjective mental workload.
Partially Supported (indirectly as a covariate)
Chapter 5 discusses implications of these results in context of the reference literature.

Bret R. Swan Chapter 5 – Discussion of Results
Page 185 of 420
C h a p t e r F i v e
CHAPTER 5 – DISCUSSION OF RESULTS
The implications of these results are discussed in this chapter. This chapter interprets the results of
this experiment in the context of the research purpose and related literature, and presents discussion in the
following sections:
Section 5.1: Effect of BPM Cognitive Resources on User Comprehension
Section 5.2: Effect of Individual Cognitive Differences on GPM User Comprehension
Section 5.3: The Relationship between Cognitive Resources and Individual Cognitive Differences
on GPM User Comprehension
Figure 5-1. GPM user comprehension research model in the context of BPM Systems.
Bret R. Swan Chapter 5 – Discussion of Results
Page 186 of 420
The purpose of this research was to study how BPM cognitive resources and individual cognitive
differences affect outcomes of user comprehension in the context of BPM and BPM Systems. Figure 5-1
illustrates the operational research model, developed to answer the following research questions.
This experiment produced some interesting results showing that the type of Graphical Process
Model (GPM) significantly affects the performance of participants – with metagraphs producing
significantly more positive outcomes of GPM user comprehension. Under different conditions, both the
type of User Educational Training (UET) and the type of Business Process Information (BPI) impacted
different types of GPM user comprehension. Many of the hypotheses in this study were supported, but
specific sub-hypotheses were reversed, only partially supported, or not supported. Exploratory analyses also
revealed that the impact of the type of UET and the type of BPI on timeliness and subjective mental
workload were more significantly influenced by the individual cognitive differences of general cognitive
abilities (GCA) and attentional abilities. Also, many of the key demographics assessed in this study did not
significantly affect user comprehension outcomes. This chapter discusses the following research questions
(RQs):
RQ1: How do different types of GPM influence user task performance, subjective mental workload, and self-efficacy when interpreting graphical business process information?
RQ2: How do different types of BPI influence user task performance, subjective mental workload, and self-efficacy when interpreting graphical business process information?
RQ3: How do different types of user educational training influence user task performance, subjective mental workload, and self-efficacy when interpreting graphical business process information?
RQ4: When interpreting graphical business process information, does the relationship between user subjective mental workload and task performance follow the Yerkes-Dodson Law (an inverted-U relationship)?
RQ5: When interpreting graphical business process information, how does user subjective mental workload relate to their self-efficacy after task completion?
RQ6: How do user cognitive styles affect the subjective mental workload they experience when interpreting graphical business process information?
RQ7: How do user general cognitive abilities affect the subjective mental workload they experience when interpreting graphical business process information?
RQ8: How do user attentional abilities affect the subjective mental workload they experience when interpreting graphical business process information?
Bret R. Swan Chapter 5 – Discussion of Results
Page 187 of 420
5.1 EFFECT OF BPM COGNITIVE RESOURCES ON USER COMPREHENSION
This section discusses the research questions and implications of the experiment results related to
the three independent variables that operationalize the three BPM cognitive resources (see Figure 5-1): the
type of BPM information artifact (represented by the variable type of GPM), the type of tacit BPM
knowledge (represented by the type of UET), and the type of explicit BPM knowledge (represented by the
type of BPI).
5.1.1 Type of Graphical Process Model and GPM User Comprehension
Research Question 1: How do different types of GPM influence user task performance, subjective
mental workload, and self-efficacy when interpreting graphical business process information?
A primary goal of this study is to investigate which type of GPM is most easily comprehended by
novice users. Basu and Blanning (2000) suggest that metagraphs can be easier to comprehend because there
are only a few symbols used to model multiple types of business processes and BPI; compared to UML
diagrams which use different sets of graphical symbols and grammars to model each different type of BPI.
Contrary to Basu and Blanning’s proposition, the principle of Ontological Completeness suggests that, once
users are trained on the symbols, UML diagrams are easier to interpret than metagraphs because of the one-
to-one relationship between the UML symbol and its meaning in the real-world. Because metagraphs use
the same small set of symbols to represent multiple real-world BPM meanings, the principle of Ontological
Completeness states that metagraphs should cause construct overload and less desirable user comprehension
outcomes (Wand & Weber, 1993). The results of this experiment provided clear evidence of the effect of
GPM type on user comprehension.
Type of GPM significantly affects every dependent variable studied in this experiment. What is
surprising is the direction of these results. Contrary to what is hypothesized, outcomes for metagraph users
are significantly more positive than for UML users for every dependent variable: accuracy (p = 0.00),
timeliness (p = 0.00), subjective mental workload (p = 0.07), and self-efficacy (p = 0.02). All of the sub-
hypotheses are rejected, and the opposite of each sub-hypothesis is supported. Therefore, the principle of
Ontological Completeness (Wand & Weber, 1993) is not supported, and the supposition put forth by Basu

Bret R. Swan Chapter 5 – Discussion of Results
Page 188 of 420
and Blanning (2000) is supported in this experiment. However, there may be several other issues that
provide a different explanation for these results.
There are several potential explanations for this outcome. First, the principle of Ontological
Completeness is incorrect or valid in only certain circumstances. Second, it is possible that the nature of the
experiment itself did not appropriately reflect or test the true meaning of the principle. Third, the level of
complexity of the business processes being modeled, in combination with the modeling rules of a specific
GPM, impacted user comprehension more than the principle of Ontological Completeness. Finally, there
could be a novice vs. expert learning curve between the two GPM types that mitigate the application of this
principle. The following paragraphs discuss these explanations in more detail.
5.1.1.1 Principle of Ontological Completeness is Potentially Incorrect
The first and most obvious explanation for these results is that the principle of Ontological
Completeness is incorrect. Users were able to interpret the meanings and relationships between the symbols
in a more accurate and timely fashion using metagraphs as opposed to UML diagrams. According to the
principle of Ontological Completeness, this result should not have happened, and therefore, it is possible
that this theoretical principle is incorrect. It is also possible that Ontological Completeness is only valid
under specific task conditions, and this bank loan process is not one of those conditions. Further empirical
research is needed to discover the limitations of this principle. However, there could be several other
explanations for this result that may describe boundary conditions for the application of the principle of
Ontological Completeness.
5.1.1.2 What is Specifically Meant by ’Ontological Completeness’
An alternate explanation for these results may be that the participants were not required by the
experiment to translate the labels on the GPM symbols into their real-world meanings. During the pilot
study and the experiment, participants did not appear to take time to study and understand what the GPM
symbols represented in relation to the real-world loan application process being modeled. Participants were
verbally instructed in the meanings of the GPM labels, given a handout listing the meanings of GPM
symbols and labels, and provided with legends on each GPM diagram explaining the real-world meanings
of the GPM labels.

Bret R. Swan Chapter 5 – Discussion of Results
Page 189 of 420
Due to the training, the participants knew that their performance was based on both the timeliness
and accuracy of their interpretations and not on their understanding the real-world meanings of the GPM
symbols. The questionnaires themselves did not require participants to translate the GPM symbol labels
into their real-world meanings. The answers to the multiple choice questionnaires used the GPM label
references and not what the real-world loan application process terminology (see Appendix L.3 for
examples of the questionnaires). Therefore, participants’ seldom appeared to take the time to look up the
real-world business process meanings of the labels and symbols when considering how to answer the
questions.
There were two important reasons for formatting the GPMs and the questionnaires in this way.
First, space requirements did not permit the use of the real-world terminology of the loan process on or next
to the corresponding symbols on the GPMs. This approach was attempted on prototype GPM diagrams, but
the addition of the terms made the GPMs appear overly cluttered and confusing when participants tried to
identify which label went with which symbol. Consequently, in order to make each GPM as neat and
organized as possible, shorter, more generic reference labels were substituted for the real-world terms on the
GPMs and a legend explaining the real-world meaning of each reference label was added to each GPM (e.g.,
T1 = Task 1 = Calculate clients’ credit rating) (see Appendices C and D for examples of the legends on the
GPMs).
The second reason the GPMs were laid out this way was because the cluttered layout of GPMs
using the real-world terminologies appeared to add an extra level of complexity and comprehension that
seemed to distort the user comprehension outcomes. If participant questionnaires had included answers
containing the real-world terminology of the bank loan application process, user comprehension would
consist of two levels of interpretation: from the GPM symbols to the reference labels (see [1] on Figure 5-2)
and then from the reference labels to their real-world meanings (see [2] on Figure 5-2). It was feared that
asking users to translate from (1) to (2) would add an extra level of user cognition that could distort user
comprehension outcomes. This is because it would be unclear if users’ accuracy and timeliness results were
due to differences between user comprehension during translation between the GPMs symbols and their
reference labels ([1] on Figure 5-2), or during translation between the GPM reference labels and their real-
world bank loan process meanings ([2] on Figure 5-2), or (3) both.

Bret R. Swan Chapter 5 – Discussion of Results
Page 190 of 420
Figure 5-2. This study evaluates user comprehension of Metagraph and UML Diagram constructs only (to the right of the dashed line); not their interpretation back to real-world
constructs (across the dashed line)1.
Since this is apparently the first GPM user comprehension study in the context of BPM Systems,
and it appears to be the first study testing the principle of Ontological Completeness in the context of BPM,
it was determined that this experiment would be best served by assessing participants’ direct interpretations
of the labels on the GPMs. Consequently, the experiment questionnaires were purposely designed to use the
GPM labels in the answers to minimize the effects of extraneous cognitive variables on GPM user
comprehension (see [1] on Figure 5-2). Future experiments can build on these results to study the whether
5-1 Currently seeking permission to user, although this is my own figure, the symbols are from Wand and Weber (1993).

Bret R. Swan Chapter 5 – Discussion of Results
Page 191 of 420
the principle of Ontological Completeness related to interpreting real-world BPM terminology in the user
comprehension of GPMs.
Do these results actually represent “Ontological Completeness”? Does the principle of Ontological
Completeness mean (1) it should only be applied to interpreting GPM symbols to their real-world meanings,
or (2) should it be applied at each intermediate level of interpretation between the GPM symbols, to their
labels, and finally, to their real-world meanings? In describing the justification for the principle of
Ontological Completeness, Wand and Webber are clear in stating that ‘completeness’ means that a graphical
grammar (e.g., a GPM) must contain “constructs that enable it to model any real-world phenomenon in
which a user is interested” (Wand & Weber, 1993, p. 220). On the other hand, they also state that there are
multiple translations that must be made between multiple grammars, scripts, and constructs to achieve a
complete model of the real-world. For example, they discuss how users must interpret and translate
between the real-world data being modeled, the data flow diagrams, and the program scripts that are written
for a database system (Wand & Weber, 1993, p. 223-228).
If the principle of Ontological Completeness is to be interpreted broadly as applying only to the
relationships between the GPM symbols and their real-world meanings, then these results did not reject this
principle, because this experiment did not require users to interpret GPM symbols back to their real-world
meanings. On the other hand, if the principle is to be interpreted more narrowly as applying to each level of
translation, then the principle of Ontological Completeness is clearly not supported by these results, because
participants’ were able to comprehend metagraphs more easily and with more positive outcomes than
participants using UML diagrams. At a minimum, the results of this study suggest the possibility that
boundary conditions exist for when the principle of Ontological Completeness is valid and how it should be
applied. Consequently, further research is required to identify these conditions and define the principle
more explicitly, so that it could be applied properly in empirical research.
5.1.1.3 Principle of Ontological Completeness and Participant Motivation
Building on the previous point, a third reason that these results do not support the principle of
Ontological Completeness could be participant motivation. Students’ performance was motivated by the
potential reward and to finish the experiment as soon as possible in order to move on to other tasks in their
lives. Students knew they would not have to complete any other tasks with the information they interpreted.

Bret R. Swan Chapter 5 – Discussion of Results
Page 192 of 420
Therefore, despite the training and handouts, participants in the experiment generally did not appear to be
interested in learning what the symbols on the GPMs mean.
In the real-world, it is anticipated that users would be just as motivated to finish BPI interpretation
as quickly as possible, but for different reasons. Real-world BPM managers know they will need to use in
the future the BPI they interpret. Consequently, they would be more interested in understanding the real-
world meanings of the diagrams.
If participants were not motivated to comprehend the real-world meanings, has the principle of
Ontological Completeness really been tested, or has it only partially been tested? This issue of participant
motivation might create a problem with external validity of these results. Thus, the principle of Ontological
Completeness should not yet be rejected based on these results. Further research is needed to understand
participant motivations for interpretation before rejecting this principle.
5.1.1.4 Level of Complexity and GPM user Comprehension
Because this was the first empirical GPM user comprehension experiment in this context, the level
of complexity of the business processes used in the experiment was held constant to allow the direct
comparison of the outcomes across different types of GPMs. The level of complexity was controlled in this
study by modeling the same business processes in both metagraph and UML diagram formats. Adjustments
were made to the level of complexity of the experiment based on the pilot study (see Appendices C, D, E,
and F for GPMs illustrating the levels of complexity).
However, the pilot study revealed that the level of complexity of the business process that was
modeled may be more predictive of GPM user comprehension than the principle of Ontological
Completeness. The pilot study used more complex business processes in the experiment portion of the
study. Metagraphs were considerably more difficult to label, lay out, and comprehend compared to UML
diagrams. During the pilot study, participants reported metagraphs became a great deal more difficult to
comprehend as (1) the number of components increased between the training and the experimental GPMs
and (2) as the number of tasks and information components grew large as a small set of resources remained
constant (e.g., Figure 5-3). Additionally, when metagraphs became more complex, they were reported to be
harder to comprehend because they are circular by nature. As a result, following the connecting lines
between components and interpreting the meanings of their labels became hard to interpret (see Figure 5-3).

Bret R. Swan Chapter 5 – Discussion of Results
Page 193 of 420
It is possible that the level of complexity of the business process might determine user
comprehension outcomes, and may have little or nothing to do with the principle of Ontological
Completeness. No empirical literature was found that either supported or rejected these observations about
the complexity of UML diagrams vs. metagraphs. Basu and Blanning (2000) assert only that metagraphs
are easier to comprehend due to the smaller number of symbols needed to model all different BPI compared
to UML diagrams. One reason for this lack of discussion comparing complexity between GPM types is
because modeling and control of these business processes is a complex, organizational task that is often
nonroutine, difficult, dynamic, and context specific (Kirsch, 1996; Weske, van der Aalst, & Verbeek, 2004).
This makes comparisons to other research in information systems, HCI, cognitive ergonomics and BPM
Systems literature difficult. Therefore, level of complexity issues in GPM modeling are important to be
included and controlled for as an independent variable in future GPM user comprehension research.
UML diagrams also became complex, large, and difficult to lay out as the number of components of
the business process increased, particularly the activity diagram (e.g., Figure 5-4). However, observations
and anecdotal evidence from the pilot study suggested that UML diagrams were easier to interpret than
metagraphs as the level of complexity increased, because they were laid out in a more linear fashion
compared to metagraphs. Consequently, pilot study participants preferred to interpret UML diagrams,
despite the empirical results (see Figure 5-4).

Bret R. Swan Chapter 5 – Discussion of Results
Page 194 of 420
Resource Interaction Metagraph(Element Flow Metagraph)
CPOC RAMP Small Biller Payment Processing and Reconciliation (P&R)
A*
R2*
R1*
R20*
R7
R3
R0
IE0(*,T0)IE5(*,T0)
IE6(*,T10)
IE17(*,T10)
IE6(*,T7)
IE18(*,T11)
R22
R21
IE22(T12,T13)
IE20(T8.T10)
IE20(T0,T10)
IE21(T11,T12)
IE19(*,T12)
IE1(T5.T11)IE2(T6,T11)IE3(T7,T11)IE4(T8,T11)
IE1(T10.T11)IE2(T10,T11)IE3(T10,T11)IE4(T10,T11)
IE20(T0,T11)
IE1(T5,T11)IE2(T6,T11)IE3(T7,T11)IE4(T8,T11)
R2*R6
R4
R10
R16
R11
R12
R13
R14
R15
IE10(T13,T1)
IE15(T14,T4)IE16(T14,T4)
IE16(T14,T1)
IE11(T14,T2)
IE12(T13,T2)
IE14(T13,T3)
IE13(T14,T3)
R1*
R7*
R20*
R8
IE19(*,T8)
IE8(*,T
9)
IE7(T1,T5)IE8(T1,T5)IE9(T1,T5)
IE7(T4,T8)IE8(T4,T8)IE9(T4,T8)
IE7(T3,T7)IE8(T3,T7)IE9(T3,T7)
IE7(T2,T6)IE8(T2,T6)IE9(T2,T6)
IE19(*,T9)
IE10(T13,T1)
Information Elements (IE)
IE0 SOX Daily Audit Document - Template
IE1 Control Point 401 StatusIE2 Control Point 402 StatusIE3 Control Point 403 StatusIE4 Control Point 404 Status
IE5 Current Day’s DateIE6 Control Point Status NotesIE7 Issue Tracker Ticket IE8 No - Control Point NOT Reconciled or Status Can’t be DeterminedIE9 Yes – Control Point DOES Reconcile
IE10 Daily Bank Files Received Report YY/MM/DD for Comerica Bank totals (Email) - Current Day IE11 CBIS Biller Report (MOSS) - Current Day IE12 7806 Payment Interface Tape Log (Email) - Current Day IE13 Direct Billed Card Biller Report (MOSS) - Current Day IE14 Direct Biller Report (Email) - Current Day IE15 RAMP Standard MOSS Template (MOSS) - Current Day IE16 ACUS Biller Report (MOSS) - Current Day
IE17 Signature of CPOC SOX ManagerIE18 Signature of CPOC Center ManagerIE19 SOX CPOC Lock Code
IE20 Unlocked-Unsigned SOX Audit Document - Current Day IE21 Signed-Unlocked SOX Audit Document - Current Day IE22 Signed-Locked SOX Audit Document - Current Day
Tasks (T)
T0 Open & Save Unlocked-Unsigned SOX Audit Document - Current Day
T1 Control Point 401 reconciliationT2 Control Point 402 reconciliationT3 Control Point 403 reconciliationT4 Control Point 404 reconciliation
T5 Control Point 401 Status ReportT6 Control Point 402 Status ReportT7 Control Point 403 Status ReportT8 Control Point 404 Status Report
T9 Open Issue Tracker TicketT10 Certify SOX Control PointsT11 Sign SOX Audit Document - Current Day T12 Lock & Distribute Locked SOX Document to Network Drive
T13 Open MOSS ReportsT14 Open Email Reports
Resources (R)
R0 SOX Audit Document – Template
R1 Adobe Acrobat on CPOC PCR2 CPOC SOX ManagerR3 CPOC Center ManagerR4 MOSS Billing Reporting SystemR5 SOX Network DriveR6 Email SystemR7 Issue Tracker TicketR8 Issue Tracker System
R10 Daily Bank Files Received Report YY/MM/DD for Comerica Bank totalsR11 CBIS Biller Report (MOSS)R12 7806 Payment Interface Tape Log (Email)R13 Direct Billed Card Biller Report (MOSS)R14 Direct Biller Report (Email)R15 RAMP Standard MOSS Template R16 ACUS Biller Report (MOSS)
R20 Unlocked-Unsigned SOX Audit Document - Current Day R21 Signed-Unlocked SOX Audit Document - Current Day R22 Signed-Locked SOX Audit Document - Current Day
Figure 5-3. Example of how metagraph complexity increases as the number of components increases or one component is central to multiple components.
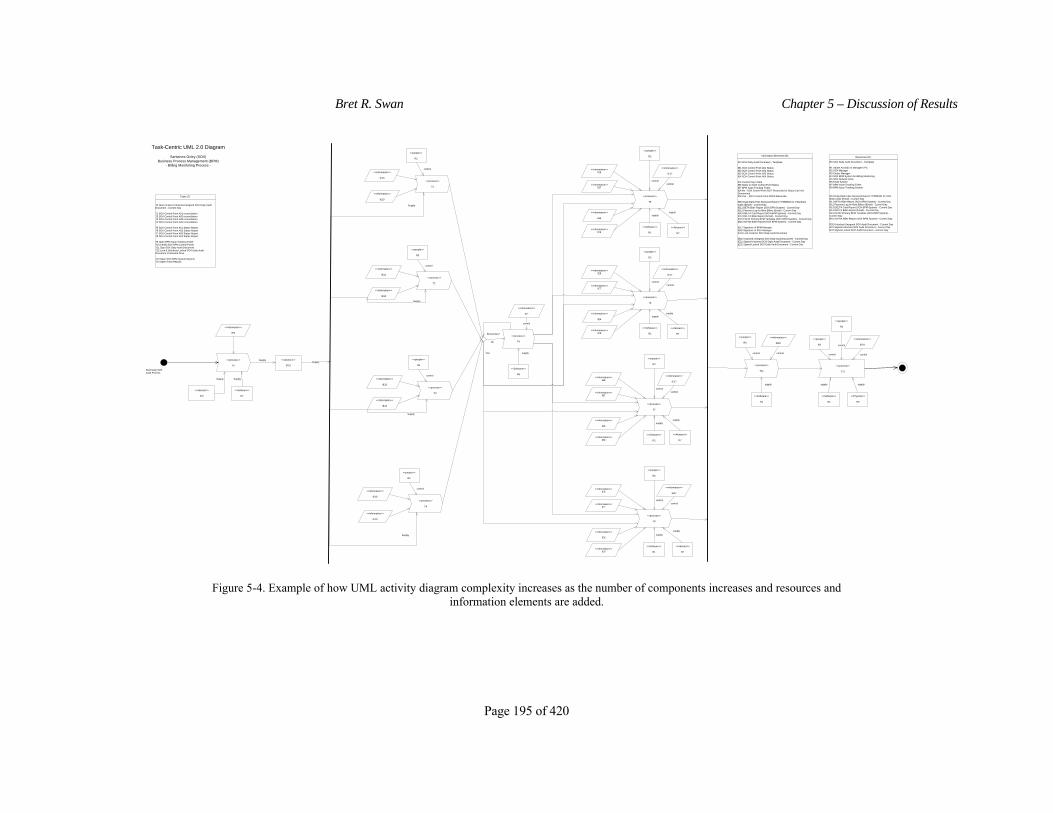
Bret R. Swan Chapter 5 – Discussion of Results
Page 195 of 420
<<process>>
T1
<<information>>
IE16
<<information>>
IE10
<<people>>
R2
control
<<process>>
T2
<<information>>
IE11
<<information>>
IE12
<<people>>
R2
<<process>>
T9
control
Reconciles?
No
<<information>>
IE7
control
<<process>>
T3
<<information>>
IE13
<<information>>
IE14
<<people>>
R2
control
<<process>>
T4
<<information>>
IE15
<<information>>
IE16
<<people>>
R2
control
Yes
Supply
Supply
Supply
Supply
<<abstract>>
IE20Supply
Start Daily SOX Audit Process
<<process>>
T12
<<people>>
R2
<<information>>
IE19
control control
Task-Centric UML 2.0 Diagram
Sarbanes-Oxley (SOX) Business Process Management (BPM)
- Billing Monitoring Process -
<<abstract>>
IE0
Supply
<<information>>
IE5
<<process>>
T0
Supply
<<process>>
T6
<<information>>IE7
<<information>>
IE6
<<people>>
R2
<<information>>
IE17
controlcontrol
<<process>>
T11
<<people>>
R3
<<information>>
IE18
control control
<<Physical>>
R5
supply
<<Software>>
R1
supply
<<Software>>
R1
supply
<<Software>>
R1
supply
<<information>>IE8
<<information>>IE9
<<process>>
T5
<<information>>IE7
<<information>>
IE6
<<people>>
R2
<<information>>
IE17
controlcontrol
<<Software>>
R1
supply
<<information>>IE8
<<information>>IE9
<<process>>
T7
<<information>>IE7
<<information>>
IE6
<<people>>
R2
<<information>>
IE17
controlcontrol
<<Software>>
R1
supply
<<information>>IE8
<<information>>IE9
<<process>>
T8
<<information>>IE7
<<information>>
IE6
<<people>>
R2
<<information>>
IE17
controlcontrol
<<Software>>
R1
supply
<<information>>IE8
<<information>>IE9
<<Software>>
R1
Supply
<<people>>
R3
control
<<Software>>
R8
supply
<<Abstract>>
R7
supply
<<Abstract>>
R7
supply
<<Abstract>>
R7
supply
<<Abstract>>
R7
supply
Information Elements (IE)
IE0 SOX Daily Audit Document - Template
IE1 SOX Control Point A01 StatusIE2 SOX Control Point A02 StatusIE3 SOX Control Point A03 StatusIE4 SOX Control Point A04 Status
IE5 Current Day’s DateIE6 Notes on SOX Control Point Status IE7 BPM Issue Tracking Ticket IE8 No - SOX Control Point NOT Reconciled or Status Can’t be DeterminedIE9 Yes – SOX Control Point DOES Reconcile
IE10 Daily Bank Files Received Report YY/MM/DD for USA Bank totals (Email) - Current Day IE11 BETA Biller Report (SOX BPM System) - Current Day IE12 Payment Log for Beta Billers (Email) - Current Day IE13 DELTA Card Report (SOX BPM System) - Current Day IE14 DELTA Biller Report (Email) - Current Day IE15 ECHO Primary BPM Template (SOX BPM System) - Current Day IE16 ALPHA Biller Report (SOX BPM System) - Current Day
IE17 Signature of BPM ManagerIE18 Signature of SOX ManagerIE19 Lock Code for SOX Daily Audit Document
IE20 Unlocked-Unsigned SOX Daily Audit Document - Current Day IE21 Signed-Unlocked SOX Daily Audit Document - Current Day IE22 Signed-Locked SOX Daily Audit Document - Current Day
Tasks (T)
T0 Open & Save Unlocked-Unsigned SOX Daily Audit Document - Current Day
T1 SOX Control Point A01 reconciliationT2 SOX Control Point A02 reconciliationT3 SOX Control Point A03 reconciliationT4 SOX Control Point A04 reconciliation
T5 SOX Control Point A01 Status ReportT6 SOX Control Point A02 Status ReportT7 SOX Control Point A03 Status ReportT8 SOX Control Point A04 Status Report
T9 Open BPM Issue Tracking TicketT10 Certify SOX BPM Control PointsT11 Sign SOX Daily Audit DocumentT12 Lock & Distribute Locked SOX Daily Audit Document to Network Drive
T13 Open SOX BPM System ReportsT14 Open Email Reports
Resources (R)
R0 SOX Daily Audit Document – Template
R1 Adobe Acrobat on Manager’s PCR2 SOX ManagerR3 Center ManagerR4 SOX BPM System for Billing MonitoringR5 SOX Network DriveR6 Email SystemR7 BPM Issue Tracking TicketR8 BPM Issue Tracking System
R10 Daily Bank Files Received Report YY/MM/DD for USA Bank totals (Email) - Current Day R11 BETA Biller Report (SOX BPM System) - Current Day R12 Payment Log for Beta Billers (Email) - Current Day R13 DELTA Card Report (SOX BPM System) - Current Day R14 DELTA Biller Report (Email) - Current Day R15 ECHO Primary BPM Template (SOX BPM System) -Current Day R16 ALPHA Biller Report (SOX BPM System) - Current Day
R20 Unlocked-Unsigned SOX Audit Document - Current Day R21 Signed-Unlocked SOX Audit Document - Current Day R22 Signed-Locked SOX Audit Document - Current Day
Figure 5-4. Example of how UML activity diagram complexity increases as the number of components increases and resources and information elements are added.
Bret R. Swan Chapter 5 – Discussion of Results
Page 196 of 420
5.1.1.5 Novice vs. Expert Impact on Interpretation of GPMs
A final alternative explanation for these results is that the nature of the experiment itself may not
have provided sufficient training time for participants to become educated in the GPMs to properly test the
principle of Ontological Completeness. This experiment was set up with the intention of testing novice
GPM users that possess little or no experience with interpreting these graph theory formalisms. This was
because most BPM System users likely will possess little or no experience interpreting these GPMs on a
regular basis. Additionally, this study tested whether novice GPM users with a variety of tacit BPM
knowledge could easily comprehend BPI portrayed by these GPMs. If easy user comprehension is possible,
the use of these GPMs could improve collaboration among business process managers, BPM decision-
making, and the effectiveness of information systems supporting BPM.
In agreement with past literature (Basu & Blanning, 2000; Gou, Huang, Liu, & Li, 2003), during the
training phase of the experiment, it was observed that the diversity of UML symbols and their meanings
created a far greater learning curve for novice users than was needed by metagraphs users. The
experimental results revealed that it took more time for users to be able to comfortably interpret UML
diagrams compared to metagraphs.
How ‘novice’ should a BPM manager be to properly test the principle of Ontological Completeness
or to comprehend these GPMs? Literature is nonexistent that describes how much training and experience
users should receive to be considered either ‘novice” or “expert” in interpretation of metagraphs or UML
diagrams. Related literature, such as operations research and the psychology of programming literature, has
explored various ways to determine if someone is an expert or not. For example, Shanteau, Weiss, Thomas,
& Pounds (2002) proposed the use of the Cochran-Weiss-Shanteau survey instrument in the absence of a
“gold standard” for determining expertise in specific domains. In contrast, Winslow (1996) reviewed
research related to determining the characteristics of novice vs. expert programmers. However, no research
is found to provide specific guidance for this study. Research that combines development of specific GPM
expertise characteristics and instruments might be of value in the future, once novice GPM user
comprehension is better understood.
In summary, the type of GPM makes a clear difference in GPM user comprehension. Contrary to
hypotheses based on the principle of Ontological Completeness, metagraph users produced more desirable
results than UML users. However, based on these results, before the principle of Ontological Completeness
needs to be further understood it can be discounted. Several other issues should be taken into account,

Bret R. Swan Chapter 5 – Discussion of Results
Page 197 of 420
including user motivation, the complexity of the business process being modeled, what specifically
determines Ontological Completeness, and what minimal amount of training is valid to still consider
someone a ”novice” GPM user.
5.1.2 Type of Business Process Information and GPM User Comprehension
Research Question 2: How do different types of BPI influence user task performance, subjective
mental workload, and self-efficacy when interpreting graphical business process information?
5.1.2.1 Explicit BPM Knowledge: Impacts of Different Types of Business Process Information
A variety of research suggests that the type of BPI affects participants’ task performance (Basu &
Blanning, 2000; Vessey, 1991; Zhang, 1996b). However, the results related to BPI Type were mixed. The
hypothesis that the type of BPI significantly affects GPM user comprehension outcomes was only partially
supported. Task-centric BPI was more easily interpreted across all types of GPMs and all types of UET.
Contrary to sub-hypotheses, resource-centric BPI was the second most easily comprehended.
5.1.2.2 The Limitations of Literature Attempting to Explain Explicit BPM Knowledge Results
Past research provided little guidance to explain these results. The Cognitive Fit perspective
(Giordano, 2002; Vessey, 1991) suggests different BPI types are better suited for producing different user
comprehension outcomes. For example, user comprehension outcomes for task-centric BPI seemed to
produce a better cognitive “fit” in terms of timeliness and subjective mental workload results. Also, it was
close to being the best cognitive “fit” for producing the most desirable accuracy results. In contrast.
information-centric related BPI is the worst cognitive “fit” in terms of timeliness. However, the cognitive fit
model fell short in helping explain these results, because it does not specify why these different types of BPI
produced the best or worst “fit” or what are the characteristics of a better or worse “fit”.
In similar fashion, Relational Information Display (RID) research suggests that the information
perceived (i.e., comprehended) from the GPM should exactly match the information required for user
comprehension task performance (Zhang, 1996a, 1997). Therefore, the RID perspective suggests that the
reason for the poor information-related BPI results was that there was a poor match between the way the
information- centric BPI was portrayed and what information was required by the information-centric BPI

Bret R. Swan Chapter 5 – Discussion of Results
Page 198 of 420
portion of the user comprehension task. However, RID literature still does not help explain why there was a
good or poor match between the different types of BPI and the user comprehension task nor what are the
characteristics of good or poor RID match.
None of the past literature reviewed for this study helped explain these results. The cognitive fit
and RID perspectives are too general to explain these results. Neither theoretical approach can take into
account other variables that impacted user comprehension, such as past expertise, training, or the cognitive
styles of the participants. The best explanation for BPI results appear to be the principle of Ontological
Completeness, which would suggest that there are problems with the way individual GPM symbols
represent their real-world meanings. However, the principle of Ontological Completeness is not supported
in this study. Therefore, future research is needed to understand why different types of BPI affected user
comprehension, or is there are variables that combine with BPI Type to produce these results.
5.1.3 Type of User Educational Training and GPM user Comprehension
Research Question 3: How do different types of user educational training influence user task
performance, subjective mental workload, and self-efficacy when interpreting graphical business process
information?
5.1.3.1 Tacit BPM Knowledge: Impacts of Different Types of User Educational Training
The results showed the influence of different types of UET to be mixed. The hypothesis that the
type of UET significantly affects GPM user comprehension was only partially supported. No type of UET
was shown to be better or worse than any other type of UET across all four of the dependent variables.
Additionally, the lack of any statistically significant interaction means that neither type of GPM was easier
or more difficult to interpret for any type of UET.
There were differences between two of the types of UET on one or more of the dependent variables,
but not across all of them. IE students were significantly more accurate in their user comprehension than
either CS or MGT students. This was probably due to the fact that IE students have been trained in
modeling and interpreting business processes (using both formal and informal techniques). CS tacit
knowledge did not appear to help them as much as IE tacit knowledge. This was possibly because CS
students, as a group, were not well trained in object-oriented systems development that could have helped

Bret R. Swan Chapter 5 – Discussion of Results
Page 199 of 420
them interpret UML diagrams and possibly even metagraphs (Agarwal, De, & Sinha, 1999; Agarwal, Sinha,
& Tanniru, 1996). Thus, they did not appear to perceive the object-oriented relationships in the GPMs.
Instead, CS students interpreted the diagrams from a process-oriented perspective, but they did not seem to
be as familiar with this perspective as IE students. As anticipated, CS students reported significantly less
subjective mental workload and higher average self-efficacy than MGT majors. In complementary fashion,
MGT students reported significantly higher subjective mental workload and lower average self-efficacy, but
only compared to CS students. Additionally, supplemental exploratory analyses did not contribute to
explaining differences between participants and their user comprehension performance (see Appendix O).
There were no significant differences in outcomes between students from different universities across
different types of UET. There were some minor but statistically insignificant differences between students
who did or did not learn English as their first language in user comprehension accuracy and self-efficacy.
5.1.3.2 Discussion of the Literature Attempting to Explain Tacit BPM Knowledge Results
Tacit BPM knowledge related to GPM user comprehension has not been studied experimentally, so
no direct comparisons could not be made to past literature to help interpret these results. In general, prior
educational training or experience is expected to create mental models or schema that individuals use when
performing a new task (Cannon-Bowers & Salas, 2001; Salas & Cannon-Bowers, 2001). The participants in
this study unconsciously used their cognitive schemas and mental models to interpret GPMs portraying the
different types of BPI. Unfortunately, no single type of UET gave participants the cognitive schemas and
mental models that allowed them to perform better than other participants’ UET across all dependent
variables. There are at least four possibilities:
1. None of the academic disciplines prepared students sufficiently to produce mental models that
affect GPM user comprehension outcomes that were better than another discipline. Or, all three
of the academic disciplines prepared students equally well.
2. Participant motivation in the lab experiment made a significant difference in UET results. In
this study, IE students were required to participate by their course instructor. Instructors of both
MGT and CS students from both universities did not want to require them to participate so
these students volunteered. Even though results identifying specific types of UET were not
clearly significant across all dependent variables, there was no way to distinguish between how
Bret R. Swan Chapter 5 – Discussion of Results
Page 200 of 420
much of their IE, MGT, and CS performance were due to motivation to participate vs. their
educational training and experience.
3. Wand and Weber (1993, p. 372) propose that GPM techniques could mitigate expert-novice
differences in user comprehension. If true, then the GPMs themselves may mitigate UET and
tacit BPM knowledge differences in user comprehension.
4. UET alone did not explain differences in GPM user comprehension. Other variables combined
with UET to affect user comprehension outcomes.
Research is needed that addresses ways to identify and assess expert-novice tacit BPM knowledge
differences in future empirical GPM comprehension research. Also, issues related to participant motivation
in lab and field studies need to be overtly considered in future empirical research. The following sections
discuss the joint impact of variables that may interact with tacit knowledge to affect GPM user
comprehension.
5.1.4 Joint Effects of BPM Cognitive Resources on GPM User Comprehension
Since no one variable was able to explain all user comprehension outcomes, could these results be
explained by jointly considering the impacts of the three BPM cognitive resources? By taking a joint view
of how BPM cognitive resources affect user comprehension, these results seem to validate Wand and
Webers’ (1993, p 372) assertion that GPM techniques may be able to mitigate differences the type of BPI as
well as expert-novice differences (i.e., types of UET). While there were significant differences between
users with regard to different types of UET and types of BPI, these differences were overshadowed by the
fact that metagraph user comprehension was clearly superior to UML user comprehension. Users of
metagraphs performed significantly better across every dependent variable: accuracy, timeliness, subjective
mental workload, and average self-efficacy. There was no type of UET that proved more “expert” across all
types of BPI nor were able to perform better across all dependent variables. Accordingly, it seemed GPM
Type might be able to mitigate explicit BPM knowledge and novice-expert tacit BPM knowledge
differences, supporting the assertion by Wand and Weber (1993, p 372). This study presents sufficient
evidence to justify further research to confirm their proposition and these results.
Bret R. Swan Chapter 5 – Discussion of Results
Page 201 of 420
5.2 EFFECT OF INDIVIDUAL COGNITIVE DIFFERENCES ON GPM USER COMPREHENSION
The following sections briefly discuss the effects of cognitive differences between individuals on
GPM user comprehension in the context of related literature.
5.2.1 Subjective Mental Workload and the Yerkes-Dodson Law
Research Question 4: When interpreting graphical business process information, does the
relationship between user subjective mental workload and task performance follow the Yerkes-Dodson Law
(an inverted-U relationship)?
This research question builds on the Yerkes-Dodson law, which asserts an inverted-U relationship
between performance and mental workload (see Figure 2-12 in Chapter 2). As a consequence, results of
both measures of task performance in this study, accuracy and timeliness, were hypothesized to produce an
inverted-U relationship when graphed against NASA-TLX assessments of subjective mental workload.
Although cubic trend lines resulted in what appears to be inverted-Us and were found to be statistically
significant, they explained only a small amount of variation in both the accuracy or timeliness results.
Consequently, these results did not support the Yerkes-Dodson relationship (see Section 4.4.4).
Additionally, a global finding of this experiment was that there was no significant statistical
relationship between TLX mental workload and task performance measures. The individual NASA-TLX
constructs also did not correlate highly with task performance. This result was in line with Rose et al.’s
(2002) study of vigilance tasks2 and subjective mental workload, which conclude that subjective mental
workload and task performance do not always relate to one another (a finding which is also supported by the
other researchers they cite). However, Fisher and Ford (1998) found TLX mental workload and its
constructs as strong predictors of time on task and learner outcomes (such as accuracy). Rubio et al. (2004)
evaluated the methodological and psychometric properties of three different types of subjective mental
workload instruments and found TLX mental workload to have acceptable correlations (r > 0.65) with their
two measures of task performance: time and accuracy. In fact, they concluded by recommending the
NASA-TLX be used when the goal is to predict performance, as was hypothesized in this experiment.
Therefore, the results of this experiment seem to contradict the majority of research that demonstrated high
correlations between TLX mental workload and task performance.
5-2 A “vigilance task” is a task that requires sustained, concentrated attention over time to complete (Rose et al., 2002).

Bret R. Swan Chapter 5 – Discussion of Results
Page 202 of 420
There are at least three possible explanations for the lack of support for the Yerkes-Dodson law that
are found in related literature:
1. The Yerkes-Dodson law is simplistic and empirically unreliable.
2. Task difficulty is often overlooked in Yerkes-Dodson literature.
3. Task-specific mental workload ‘signatures’ might exist and be a more accurate
conceptualization than an inverted-U relationship.
5.2.1.1 The Yerkes-Dodson Law: Simplistic and Empirically Unreliable
The lack of support for the Yerkes-Dodson law is not entirely unexpected. Research tracing the
history of the Yerkes-Dodson law from its inception in 1908 until the present, summarized the findings in
this way (Teigen, 1994, p. 543):
“These reanalyses underscore the discrepancy between the schematic, idealized textbook presentations of the [Yerkes-Dodson] ‘law’, and its more messy empirical and historical basis.”
Teigen’s (1994) historical analysis of the Yerkes-Dodson law found that Yerkes and Dodson’s original
research had been adapted over the last century to fit the needs of various researchers and often disregard or
ignore the fundamental constructs that Yerkes and Dodson studied. Most alterations and adaptations of
Yerkes-Dodsons’ work has been to both the meanings of the variables they studied and to the exclusion of
task difficulty. As a result, the so-called Yerkes-Dodson, inverted-U relationship has come to be more of a
simplified tool for communicating psychological relationships than an empirically verifiable psychological
“law” (Teigen, 1994).
Therefore, empirical research has not reliably supported the Yerkes-Dodson law. For example, a
study by Hanoch and Vitouch (2004) used the Yerkes-Dodson law to empirically investigate the relationship
between the quantity of information available, emotional arousal (i.e., stress), and task performance. They
concluded that emotional arousal should not be conceptualized as a unidimensional concept, and that the
Yerkes-Dodson law is too simplistic to account for the various cognitive functions and emotional conditions
affecting task performance.
Bret R. Swan Chapter 5 – Discussion of Results
Page 203 of 420
Thus, past literature suggests that the lack of empirical support for the Yerkes-Dodson law found in
this experiment may be due to the fact that relating a single score for TLX mental workload3 and a single
score for task performance is too simplistic to yield empirically reliable results. Consequently, analyzing
the relationship between mental workload and task performance should be broken down into more specific
psychological constructs. Yet, there is little evidence to suggest that this adjustment would create an
inverted-U relationship.
5.2.1.2 Task Difficulty is Inherent in the Original the Yerkes-Dodson Research
Yerkes and Dodsons’ original work included task difficulty in their study of the arousal-
performance relationship (Broadhurst, 1959; Teigen, 1994; Winton, 1987). Task difficulty was controlled in
this experiment by modeling the same BPI from the same business process to compare different types of
GPMs. Because task difficulty was not assessed directly, it is difficult to say if the task was too simple or
too complex for individual participants.
There are at least two ways that task difficulty might account for the lack of support for the Yerkes-
Dodson relationship in these results: the quantity of information and the type of GPM. Hanoch and
Vitouchs’ (2004) study increased the difficulty of the tasks by increasing the availability of information to
perform their task. They found that having more information available to complete a task is preferable to
having less information even if some information is irrelevant to the task.
A second way task difficulty may explain these results is that metagraph characterizations of the
business process might simplify the GPM user comprehension task. Similar to Hanoch and Vitouchs’
(2004) study, the quantity of information available in the metagraphs in this experiment could have made it
easier to interpret metagraphs compared to UML diagrams. UML users experienced more information
overload and higher subjective mental workload than metagraph users. Figure 2-12 in Chapter 2 illustrates
why metagraphs users performed better than UML diagram users based on Klein (1982, p. 126). Even
though they experienced high amounts of subjective mental workload, metagraph users were able to achieve
higher levels of performance because metagraph comprehension tasks were perceived as simpler to interpret
compared to UML diagrams (see the simple task diagram in Figure 2-12). On the other hand, UML
diagrams are only able to achieve lower levels of performance compared to metagraph users because a UML
5-3 A TLX mental workload score is a composite of six different constructs adjusted for pairwise comparisons between these
constructs (Hart & Staveland, 1988a, 1988b).
Bret R. Swan Chapter 5 – Discussion of Results
Page 204 of 420
diagram was perceived as harder for their novice users to interpret (see the difficult task diagram in Figure 2-
12).
Prior literature shows mental workload is expected to be higher at the beginning of a task or when
there is an expectation of short time frame to complete the task (i.e., high temporal demand) because mental
workload wanes during task performance over time (Rose et al., 2002). It is possible that UML diagrams
made user comprehension so difficult that participants’ mental effort waned more quickly than metagraph
users who perceived the task as not as difficult. Concurrently, participants using UML may have felt an
increase in temporal demand and inadvertently excluded relevant information necessary for high GPM user
comprehension task performance. Therefore, the inherent differences between metagraphs and UML
diagrams may have created task difficulty in this experiment.
The difference between the training and experimental GPM user comprehension tasks might have
been a third way task difficulty could have affected these results. The experimental task GPMs were far
more complex than the training task GPMs because they portrayed a larger quantity of information (Hanoch
& Vitouch, 2004). The subsequent increase in mental workload during the experiment task (compared to
the training task) may have caused participants to exclude relevant information (Easterbrook, 1959; Teigen,
1994).
In summary, task complexity might have had an important impact on GPM user comprehension of
BPI, despite attempting to control for it. Future research is needed to explore these issues.
5.2.1.3 GPM user Comprehension Mental “Signatures”
Another explanation for the lack of relationship between subjective mental workload and task
performance in this experiment may be several underlying psychological issues affecting participants.
Exploratory factor analysis revealed three underlying factors explaining variation in the TLX mental
workload scores (see Table 5-1 and Appendix O.1). These three factors can be summarized as related to
participants perceptions of: (1) external and internal stressors, (2) individuals’ perception of their
performance, and (3) the physical workload required by the task. The nature of the experiment imposed
little or no physical workload on participants. Thus, it made sense that participants’ would perceive TLX
physical workload as separate and unrelated to other TLX constructs. The second factor suggested that as
participants’ perception of performance rose or fell, so did their level of frustration. The first factor,
explaining the most variation in subjective mental workload, related internal stressors and emotional arousal

Bret R. Swan Chapter 5 – Discussion of Results
Page 205 of 420
(mental effort and frustration, respectively) with the external stressors felt by participants (mental and
temporal demand). Frustration did not load cleanly on a single factor. Instead, it highly aligned with both
internal-external stressors (factor 1) and with individuals’ perception of their task performance (factor 2).
Table 5-1. Exploratory Factor Analysis showing the loadings of the three factors underlying TLX mental workload results (n = 261).
Factors TLX Mental Workload Construct 1 2 3 Mental Demand .81 Mental Effort .80 Temporal Demand .67 Frustration .61 .59 Perception of Performance .89 Physical Demand .98
Finding these underlying factors does not mean that the overall TLX mental workload or individual
TLX construct scores are invalid. Instead, it is possible that the vigilance tasks in this experiment have a
“mental workload signature” - namely, the three factors. As discussed in Chapter 2, a vigilance task is a
task that requires sustained, concentrated attention over time to complete (Rose et al., 2002). It certainly
appears that there is a GPM user comprehension “mental workload signature” that resembles the vigilance
task mental workload signatures reported in previous literature (Rose et al., 2002; Warm, Dember, &
Hancock, 1996). These findings may mean that this type of GPM user comprehension task generates
specific “mental workload signatures” in participants. Further research with more participants is needed to
confirm this conclusion.
5.2.2 Subjective Mental Workload and Self-Efficacy
Research Question 5: When interpreting graphical business process information, how does user
subjective mental workload relate to their self-efficacy after task completion?
The recent trend towards increased reliance on BPM systems and the GPMs that are critical to their
success highlights the need to understand the factors that increase individual manager’s confidence in their
judgments of interpretations of GPMs. Although there are several statistically significant correlations
between average self-efficacy, self-efficacy constructs, TLX mental workload scores, and TLX mental

Bret R. Swan Chapter 5 – Discussion of Results
Page 206 of 420
workload constructs, all of these correlations were of little consequence (r ≤ - 0.4). Exploratory factor
analyses, that included TLX mental workload and the nine self-efficacy constructs, confirmed TLX mental
workload as unrelated to self-efficacy (see Section 4.4.5 and Appendix O). The TLX mental workload
constructs loaded on an entirely separate factor than the self-efficacy constructs that explained the least
amount of variation (19.5%). The largest of the three factors, explaining 28.5% of the variation, loaded with
all the positively worded self-efficacy questions. The second largest factor, explaining 23.0% of the
variation, loaded with the negatively-worded and training materials-related self-efficacy questions.
The reason for these weak results may be partly due to methodological issues, such as: (a) there is
no previous self-efficacy research related to the contexts of GPM user comprehension or BPM Systems, (b)
there appears to be no GPM self-efficacy assessment instrument that exists, (c) the self-efficacy data
collection methodology used in this experiment may have been flawed, or (d) all of the above.
5.2.2.1 Establishing a Baseline for GPM Self-Efficacy in GPM User Comprehension Tasks
No research was found that had studied self-efficacy in the contexts of GPM user comprehension or
BPM Systems. Self-efficacy is highly task-specific, meaning self-efficacy refers to what a person perceives
their capabilities to be with regard to a specific task (Marakas, Yi, & Johnson, 1998). For example, Wood,
Atkins, & Tabernero (2000) found differences between two types of self-efficacy: information search
efficacy and information processing efficacy on complex tasks. Staples et al.’s (1999) empirical study
concluded there is a difference between remote work self-efficacy and information technology self-efficacy.
Due to the task-specific nature of self-efficacy, the differences between the training and
experimental tasks provided no justifiable basis for hypothesizing a relationship between pre- and post-
experiment self-efficacy. Because there was no pre-experiment baseline for establishing GPM self-efficacy,
this study focused on the antecedents of self-efficacy instead of its effects. In prior research, pre- and post-
task self-efficacy assessments are expected to be related because the tasks are similar (Compeau, Higgins, &
Huff, 1999; Fagan, Neill, & Wooldridge, 2003; Staples et al., 1999). However, after the pilot study, the
training task was changed, and the training tasks and the experimental tasks were fundamentally different.
The training task was quite different from the experimental task in purpose, interpretation, and complexity.
The purpose of the training task was to expose participants to the meaning of the GPM symbols they would
encounter in the experimental task without introducing bias by training them on interpretation of a specific
business process. It was decided that providing training on interpretation of a specific business process

Bret R. Swan Chapter 5 – Discussion of Results
Page 207 of 420
could bias or confound the experimental results because it might be difficult to determine if participants did
not comprehend the GPM symbols or the business process in the experimental task. Finally, the training
task was much simpler and far less complex than the experimental task. This meant that the task-specific
experience gained during training that created pre-experiment self-efficacy was not appropriate to compare
to post-experiment task performance and outcome expectancy.
As a result, past literature does not support creating a link in this study between pre- and post-task
self-efficacy assessments. This is not a problem, because a goal of this research was to establish a baseline
for GPM self-efficacy in these task contexts. However, the literature does provide other antecedents of self-
efficacy that are directly related to TLX mental workload constructs, thus providing a foundation for
establishing a baseline for GPM user self-efficacy in the context of BPM Systems.
More research is necessary to confirm these results. Without a baseline self-efficacy evaluation
prior to this task, it is difficult to determine whether the task itself impacted self-efficacy. What these results
do provide is a baseline for establishing future research and hypothetical relationships regarding self-
efficacy in the contexts of GPM user comprehension and BPM Systems.
5.2.2.2 A Task-Specific GPM or BPM Self-Efficacy Instrument is Needed
Building on the previous point, no instrument found in the literature that assesses self-efficacy in the
task-specific contexts of this study. Consequently, the nine self-efficacy question items used in this
experiment are adapted from a well-established computer self-efficacy instrument (Compeau & Higgins,
1995; Compeau et al., 1999; Johnson & Marakas, 2000). Therefore, the lack of support for this hypothesis
could be due, in part, to the lack of a self-efficacy instrument validated for this GPM user comprehension
task. Lee & Bobko (1994) compares self-efficacy assessment methodologies and could provide valuable
guidance in developing such an instrument. Future research will benefit from the development of a specific
instrument for GPM user comprehension or BPM Systems self-efficacy contexts.
5.2.2.3 The Self-Efficacy Data Gathering Methodology May Be Flawed
Finally, these results can be due to the way the GPM user self-efficacy and TLX mental workload
data were gathered and calculated. The TLX mental workload constructs were evaluated at three points
within-subjects after each BPI Type. In contrast, self-efficacy was assessed between-subjects. This was in

Bret R. Swan Chapter 5 – Discussion of Results
Page 208 of 420
keeping with past research that typically assesses self-efficacy once during an experiment (usually pre-
experiment) or sometimes twice (pre-experiment and post-experiment) (Compeau et al., 1999; Fagan et al.,
2003; Staples et al., 1999). Because self-efficacy was assessed post-task, it was conceptualized in this
research as an outcome of task performance. The GPM user comprehension task was not considered
complete until a participant interpreted all three types of BPI. Therefore, self-efficacy was evaluated as the
last assessment before participants completed the experiment. Although logical, this between-subjects self-
efficacy data gathering strategy may have produced data that was not adequate to compare to each of the
within-subjects TLX mental workload scores. In future research, self-efficacy should be assessed at the
same time as subjective mental workload (i.e., three times within-subjects in this experiment) to address this
issue.
In summary, this study has established specific characteristics for a GPM user comprehension task
and has gathered post-experiment self-efficacy results. Future research could extend this study by:
1. Continuing to extend the self-efficacy literature to the context of BPM and GPM user
comprehension tasks.
2. Hypothesizing a relationship between self-efficacy and GPM user comprehension task
performance based on training using similar tasks.
3. Developing and validating a GPM user self-efficacy assessment instrument and determine
under what task-specific circumstances this instrument is valid.
5.2.3 Cognitive Styles and Subjective Mental Workload during Task Performance
Research Question 6: How do user cognitive styles affect the subjective mental workload they
experience when interpreting graphical business process information?
Correlation analysis did not result in any statistically significant correlations between TLX
subjective mental workload, its constructs, and continuous MBTI scores for either the extroversion-
introversion or sensing-intuitive cognitive styles. MANCOVAs testing these cognitive styles as covariates
did not find them statistically significant in their effect on subjective mental workload.

Bret R. Swan Chapter 5 – Discussion of Results
Page 209 of 420
5.2.3.1 Literature Fails to Explain the Cognitive Style vs. Mental Workload Results
This was a surprising finding because neuroscience, cognitive psychology, and MBTI literature
predict that such a relationship exists (Rose et al., 2002, p. 198). Rose et al. (2002) cite several personality
studies predicting participants scoring high on extroversion will perform worse on vigilance tasks with low
stimulation (i.e., tasks requiring a high degree of concentrated attention for a significant period of time)
which is similar to the experimental conditions of this study. Eysenck’s and Gray’s research on the
biological basis of personality propose that introverts are more cortically aroused than extroverts. As a
result, introverts should perform better on vigilance tasks that typically have low stimulation (Eysenck,
1967; J. A. Gray, 1987; J. R. Gray & Burgess, 2004; Patterson & Newman, 1993). Thus, introverts should
have experienced less mental workload in performance of these experimental tasks, but this did not occur
(cf. Avila, 2001; Chi et al., 2005; Gable, Reis, & Elliot, 2000; J. A. Gray, 1987; J. R. Gray et al., 2005;
Hewig, Hagemann, Seifert, Naumann, & Bartussek, 2006; Jorm et al., 1999; Sutton & Davidson, 1997).
There was a similar lack of explanation for the sensing-intuitive cognitive style in the literature.
According to Gardner and Martinkos’ (1996) review of MBTI literature, sensing vs. intuitive research has
produced mixed results. On the one hand, participants with MBTI scores leaning toward sensing are
expected to expend less subjective mental workload than intuitives in learning tasks. Participants scoring
higher on the sensing dimension should lose details when overwhelmed with information, be less frustrated
with losing information, and only try to comprehend enough information to answer each question (Barkhi,
2002; Gardner & Martinko, 1996; Rubio et al., 2004), and thus, experience less subjective mental workload.
Participants scoring higher on the MBTI intuitive side of the scale should prefer abstract summaries that
stress possibilities, try to holistically gather and understand all of the information presented when answering
the questionnaires, and as a result, experience more subjective mental workload than participants scoring
higher in sensing. On the other hand, Gardner and Martinko (1996) cite several studies that show that
intuitives were expected to prefer graphically-oriented information while sensors prefer raw data.
Therefore, the literature does not help explain these non-significant results.
Obvious explanations for why these results contradicted the cognitive styles literature pointed to
several possibilities: (1) there is not enough data to be significant, (2) student MBTI data in a lab experiment
is not valid when performing tasks that involve interpreting BPI, or (3) using continuous scores based on
MBTI Form F for the extroversion-introversion and sensor-intuitive cognitive styles are not sensitive

Bret R. Swan Chapter 5 – Discussion of Results
Page 210 of 420
enough instruments to produce reliable data. Although each of these alternatives is possible, it is also
possible the GPMs may mitigate the effect of cognitive styles on user comprehension.
5.2.3.2 GPMs May Mitigate the Impacts of Cognitive Styles in GPM user Comprehension
In the same way that Wand and Weber suggest that GPMs may mitigate expert-novice differences
in task performance, it may be the case that GPMs negate, minimize, mitigate, or compensate to some extent
for the effects of MBTI cognitive styles on subjective mental workload. For example, MBTI sensors may
find the graphical portrayals of BPI a logical way to organize and access the raw data. GPMs may also
allow them to easily neglect superfluous information, find the required data relationships quickly, and
comprehend just the relationships needed. As a result, MBTI sensors may not experience an excessive
amount of subjective mental workload.
On the other hand, even though the actual amount of information may be overwhelming and trigger
intuitives’ BIS, the graphical format might help them feel more comfortable, allow them to withdraw inward
to mentally process the information, while at the same time satisfy their need to holistically view the
process. The graphical nature of GPMs may also appeal to MBTI intuitives preference for visualizing the
big picture, and yet still allow them to easily drill down to the details without being overwhelmed by the
information. As a result, their BIS system may not be triggered as quickly or to as great a degree as they
might have otherwise experienced when confronted by another format for portraying the same amount of
information. As a consequence, intuitives might experience significantly less subjective mental workload or
an amount of mental workload comparable to sensors.
GPMs might also appeal to MBTI extroverts. Although GPMs may not stimulate extroverts’ BAS
as much as seeing or experiencing the real-world business process, GPMs do allow extroverts to visualize,
touch the graphic to trace relationships, and give them something external to talk about with associates.
Also, the extrovert cognitive style may be less susceptible to activating their BIS when using GPMs, and
when activated, it may be activated to a lesser degree compared to introverts in the same situation.
Therefore, the combination of the GPM format and the nature of extroverts, introverts, sensors, and
intuitives may actually create a middle ground for GPM users such that the subjective mental workload they
experienced was not significantly different from the mental workload experienced from any of the other
cognitive styles. If this is the case, it would be the most desirable outcome for GPM user comprehension.
GPMs may allow the most efficient and effective user comprehension and possibly facilitate communication

Bret R. Swan Chapter 5 – Discussion of Results
Page 211 of 420
across participants with a variety of cognitive styles. Obviously, more research is required to confirm this
supposition.
5.2.4 General Cognitive Abilities and Subjective Mental Workload during Task Performance
Research Question 7: How do user general cognitive abilities affect the subjective mental workload
they experience when interpreting graphical business process information?
The findings showed GCA to have a significant impact on GPM user comprehension outcomes
second only to GPM Type. Because GCA only affects subjective mental workload (in relation to BPI
Type), the original hypothesis is only partially supported. There are four interesting findings related to
GCA, three of which were not hypothesized but have important implications for GPM user comprehension.
5.2.4.1 GCA Affects Subjective Mental Workload
First, when considered as a covariate, GCA renders non-significant the effect of BPI Type on
subjective mental workload. This suggests that the effect of BPI Type on mental workload are explained by
variations in participants’ GCA. This covariate effect was not manifest in the effects of GPM Type and the
type of UET on subjective mental workload.
5.2.4.2 GCA Negates the Affects of BPI and UET on GPM User Comprehension
Second, GCA acted as a covariate that negated the effect of the type of UET on task accuracy and
effect of BPI Type on task timeliness. Furthermore, variations in WPT scores have a direct, highly
significant effect on task accuracy. Figure 5-5 shows the average WPT score and illustrates participants
with higher than average WPT scores tended to produce higher task accuracy results. Also, GCA
significantly affected three of the four dependent variables and negated the effect of two of the three
independent variables.

Bret R. Swan Chapter 5 – Discussion of Results
Page 212 of 420
Wonderlic Final Score4239383736353433323130292827262524232221201918171514
Acc
urac
y (%
Cor
rect
)
100
80
60
40
20
0
Accuracy Average = 66.47 %
Figure 5-5. The accuracy of task performance is higher above the average accuracy for participants with higher WPT scores.
5.2.4.3 General Cognitive Abilities: A Possible GPM User Comprehension Task ‘Signature’
In the context of GCA literature, these results are similar to Fisher and Fords’ (1998) findings on
the differential effects of WPT on learning outcomes. Their study showed that participants’ accuracy on
knowledge tests are a function of GCA and timeliness. This is important because recent debates about the
validity of GCA compared to individual cognitive aptitude tests have shown that GCA tests, like the WPT,
have much higher validity than narrow cognitive aptitude tests, especially in job performance contexts
(Schmidt, 2002). Therefore, the GCA results in this experiment may be more valid than other narrow
cognitive aptitude tests.
In addition, Woodcock (2002), well-known for research into both the broad and narrow cognitive
aptitudes, states that the purpose of cognitive testing is to tell more about the task than an individual’s IQ.
Thus, these GCA results may reveal important information about GPM user comprehension tasks. These
GCA results may suggest a cognitive abilities profile or “signature” that can be used as a basis for
Bret R. Swan Chapter 5 – Discussion of Results
Page 213 of 420
comparing participants and GPM user comprehension tasks across future studies. This is an interesting and
important topic to explore in future research.
5.2.5 Attentional Abilities and Mental Workload during Task Performance
Research Question 8: How do user attentional abilities affect the subjective mental workload they
experience when interpreting graphical business process information?
In this experiment, attentional abilities were shown to have a significant effect on subjective mental
workload supporting most of the sub-hypotheses. Three out of four constructs had either direct or covariate
effects on subjective mental workload which was in line with cognitive psychology research. Rose et al.
(2002) specifically studied the relationship between the five most studied personality factors, subjective
mental workload, and task performance on vigilance tasks (Rose et al., 2002). They found that only
extroversion and conscientiousness (i.e., attention) had significant effects on subjective mental workload
and cognitive vigilance task performance. Additionally, Rubio et al.’s (2004) study on the validation of
subjective mental workload instruments found that the evaluation of attentional abilities in conjunction with
subjective mental workload was an important predictor of cognitive task performance (i.e., accuracy and
timeliness). Also, these results showing various DAPI constructs were related to the timeliness of task
performance are in line with several studies relating conscientiousness or attention to time on task (Rose et
al., 2002).
Although not hypothesized, it is not surprising that the DAPI construct Dual Cognitive-Physical
Tasks Attention had a strong effect on timeliness and subjective mental workload. There are several studies
that show even small amounts of physical activity have am impact on cognition (Hillman et al., 2006;
Lieberman et al., 2005; Lyons & Crawford, 1997). The experimental task itself was not physically
demanding, although participants did have to stand to interpret the GPMs mounted on the walls. Almost all
of the students wrote their answers to the questionnaires using clipboards while standing.
In summary, it appears that attentional abilities impacted timeliness and subjective mental
workload, but had only a small effect on task accuracy.

Bret R. Swan Chapter 5 – Discussion of Results
Page 214 of 420
5.2.6 Integrating Individual Cognitive Differences and their Impacts on User Comprehension
How should these results testing individual cognitive differences be integrated to understand their
effects on GPM user comprehension? Hypotheses testing the expected moderators of subjective mental
workload (i.e., the cognitive styles and cognitive abilities of the participants) yielded interesting and
somewhat unexpected findings. Despite several non-significant results, two outcomes of individual
cognitive differences are important to consider in future research.
First, these results suggest a way of identifying a task-specific subjective mental workload
“signatures” for GPM user comprehension tasks. The cognitive abilities of participants had the second
highest effect (behind GPM Type) on subjective mental workload, self-efficacy, and task performance.
GCA either moderated (as with UET and BPI) or directly impacted task accuracy. Attention directly
impacted timeliness and mental workload. (Therefore, GPMs may mitigate cognitive styles and cognitive
abilities might have the great impact on performance and mental workload after GPMs.) More research is
needed to confirm these GCA results and identify the narrow cognitive aptitudes associated with GPM user
comprehension tasks. In the future, when combined with the GCA results, these narrow cognitive aptitudes
may be able to be used to create task-specific, cognitive-ability “signatures.”
Second, in exploring reasons for this result, several methodological explanations, the BIS/BAS,
personality, and MBTI literature led to the supposition that these GPMs may mitigate or minimize the
polarizing effects of MBTI cognitive styles on subjective mental workload and task performance. Future
research is needed to confirm this conclusion. If proven correct, this “nonresult” may be the most desirable
result from a GPM user comprehension perspective, because it would mean that the graphical portrayal of
BPI allow a variety of users with different cognitive styles to comprehend the information equally well.
This could lead to improved BPM and BPM Systems development and utilization.
5.3 THE RELATIONSHIP BETWEEN COGNITIVE RESOURCES AND INDIVIDUAL COGNITIVE
DIFFERENCES DURING GPM USER COMPREHENSION
The type of GPM had the most impact of any other factor on the dependent variables in this study.
However, if only BPM cognitive resources were taken into account, the results would suggest that the type
of UET and type of BPI had significant effects on the dependent variables in this experiment. In reality, by
introducing variables representing key individual cognitive differences, it was shown that many of the

Bret R. Swan Chapter 5 – Discussion of Results
Page 215 of 420
effects of BPM cognitive resources were moderated by the GCA and attentional abilities of the participants.
On the other hand, if only individual cognitive differences were studied in this experiment, the effects of
different types of GPMs, for example, would not have been found. Therefore, research involving user
comprehension needs to account for both BPM cognitive resources and individual cognitive differences if
valid results are to be found.
From a joint perspective, these results seems to validate Wand and Weber’s (1993) call for research
that include the effects of conceptual models, differences in user cognitive abilities and cognitive styles, and
how modeling techniques can mitigate expert-novice differences in GPM user comprehension. What
literature there is that compares cognitive resources (e.g., BPM information artifacts, tacit knowledge, and
explicit knowledge) to user comprehension outcomes often disregards the individual cognitive differences
and psychological components of cognition operating within the mind of the GPM user. Future directions
and conclusions are proposed in Chapter 6.

Bret R. Swan Chapter 5 – Discussion of Results
Page 216 of 420

Bret R. Swan Chapter 6 – Conclusions and Recommendations
Page 217 of 420
C h a p t e r S i x
CHAPTER 6 – CONCLUSIONS AND FUTURE DIRECTIONS
This research has empirically studied the extent to which graphical process models (GPMs)
facilitate user comprehension of Business Process Management (BPM) cognitive resources despite
cognitive differences between individuals. These components were incorporated into a theoretical
framework that allowed the testing of the relationships between these components using a laboratory
experiment.
This chapter summarizes and integrates the conclusions of this study. It also discusses the
limitations of this study, proposes future research directions, and discusses the implications of this study for
the reference literature.
6.1 CONCLUSIONS AND FUTURE RESEARCH DIRECTIONS
This section summarizes the key conclusions of this study.
6.1.1 The Impacts of the BPM Information Artifact: the Type of Graphical Process Model
This study found that the type of GPM had the greatest effect on user comprehension of business
process information (BPI). Contrary to the principle of Ontological Completeness, these results clearly
demonstrated that metagraphs were easier for novice users to accurately comprehend in a timely manner
compared to UML diagrams of the same BPI. Furthermore, using metagraphs produced less subjective
mental workload and greater self-efficacy than users of UML diagrams for the participants in this study.
Although the principle of Ontological Completeness was not confirmed under the conditions in this
experiment, it is not disproved. Several issues should be taken into account in future research, such as: (1)
how to specifically and practically determine Ontological Completeness, (2) user motivation, (3) the
complexity of the business process being modeled, and (4) the minimal amount of training to be considered
a “trained” but still “novice” user. For example, this experiment primarily explored an individual's ability to
interpret graph theoretical formalisms and the relationships among their respective symbology not
necessarily the interpretation of GPM symbols to their real-world meanings. These issues should be taken

Bret R. Swan Chapter 6 – Conclusions and Recommendations
Page 218 of 420
into account in future GPM user comprehension research before the principle of Ontological Completeness
can be either understood or discounted. At a minimum, boundary conditions for when, or if, the principle of
Ontological Completeness is valid should be explored.
6.1.2 The Impact of Explicit BPM Knowledge: The Type of Business Process Information
As mentioned earlier, this study focused on user comprehension of GPM symbols representing
different types of BPI, and not necessarily the interpretation of these symbols in relation to their meaning in
the real-world. Given this delimitation, this study showed that task-centric BPI were easiest for all types of
users to comprehend. These results showed that, in general, most people possess some knowledge about
how to interpret task-centric BPI, such as flowcharts, but not the other types of BPI. Resource-centric BPI
portrayed by these GPMs facilitated worse task performance, in terms of timeliness and mental workload,
compared to other types of BPI. However, comprehending resource dependencies and information flows is
critical to successful BPM facilitated by BPM systems.
6.1.3 The Impact of Tacit BPM Knowledge: The Type of User Educational Training
While there appeared to be some differences due to different types of user educational training
(UET), neither industrial engineering (IE), computer science (CS), nor business management (MGT)
students performed significantly better than another across all dependent variables associated with GPM
user comprehension in this study. In agreement with Wand and Weber’s (1993, p. 372) proposition, this
study seems to illustrate that the type of GPM might be able to mitigate expert-novice tacit BPM knowledge
differences in GPM user comprehension of BPI. This study presented sufficient evidence to justify further
research to confirm this conclusion.
Additionally, motivation of the participants in a lab experiment may have been an issue in this
study. Therefore, GPM user motivation, whether in students or BPM managers, needs to be explored and
compared. In this study, participation was both required and voluntary, depending on the student. In the
real-world, the use of BPM Systems is usually not voluntary. Organizations typically require managers to
use these enterprise-level information systems in their daily work. Thus, a combination of lab and field
empirical research is needed to further understand the impact of tacit BPM knowledge on user
comprehension.

Bret R. Swan Chapter 6 – Conclusions and Recommendations
Page 219 of 420
6.1.4 The Impact of Subjective Mental Workload on Task Performance
In this study, there did not appear to be a significant relationship between subjective mental
workload and GPM user comprehension outcomes. There was no Yerkes-Dodson inverted-U relationship
between subjective mental workload, its constructs, and task performance. This is not a surprising finding
based on the empirical research related to the Yerkes-Dodson law. However, most of the research based on
the Yerkes-Dodson relationship does not include the variables and issues Yerkes & Dodson originally
studied when they proposed their relationship. Therefore, it is difficult to know if the Yerkes-Dodson law is
an actual, theoretical law or an over-simplified tool for the communication of general psychological
relationships. Because this study did not support Yerkes-Dodson, this study supports prior research
suggesting the Yerkes-Dodson law is overly simplistic and other issues affect this relationship. This law
contributes an important starting point for creating hypotheses and analyses that relate subjective mental
workload and GPM user comprehension task performance.
Another interesting finding was that the exploratory factor analyses revealed three factors
underlying participant assessments of the six NASA TLX mental workload constructs. Finding these
underlying factors suggests that there may be GPM user “mental workload signatures” (Rose, Murphy,
Byard, & Nikzad, 2002; Warm, Dember, & Hancock, 1996). Further research with more participants is
needed to confirm this conclusion.
Finally, most research citing the Yerkes-Dodson relationship fails to include task complexity as
Yerkes and Dodson did in their original research. Despite controlling for task difficulty in this study by
modeling the same business process with both GPM Types, task complexity did appear to have an important
impact on GPM user comprehension. The inherent differences between metagraphs and UML diagrams
created differing amounts of complexity in this experiment. The experimental task GPMs were far more
complex than the training task GPMs because they portrayed a larger quantity of BPI (Hanoch & Vitouch,
2004). The subsequent increase in emotional arousal due to the increased mental workload (compared to
the training task) may have caused participants to exclude relevant information (Easterbrook, 1959; Teigen,
1994). Future research is needed to study these issues in greater depth than was accomplished in this
research.

Bret R. Swan Chapter 6 – Conclusions and Recommendations
Page 220 of 420
6.1.5 The Impact of Subjective Mental Workload on Self-Efficacy
This study provided a baseline for relating GPM self-efficacy to user comprehension task
performance in the context of BPM Systems. Although, statistically significant relationships were not found
between subjective mental workload and self-efficacy, this study makes a contribution to this literature by
exploring mental workload as an antecedent to self-efficacy. Thus, it serves to provide an initial baseline for
future research and to extend the self-efficacy literature to the contexts of BPM Systems and GPM user
comprehension tasks. Self-efficacy in the context of BPM has not been studied before, and should be a
component in future GPM user comprehension research.
The current research model should be revised based on these results by deleting the hypothesized
relationship between self-efficacy and subjective mental workload. Instead, self-efficacy should be included
as an antecedent of cognition that affects subjective mental workload in order to test a hypothesized link
from task performance to self-efficacy.
Because self-efficacy is task-specific, task-specific BPM System and GPM user comprehension
self-efficacy instruments need to be developed. Also, self-efficacy should be assessed at the same time as
subjective mental workload, either within-subjects or between-subjects. Self-efficacy should be assessed
after training (pre-experiment), as was done in this study, but BPM training tasks should be given to
participants that are as complicated and similar to the experimental tasks. Subsequent analyses can then
study the relationships between both outcome expectancy and self-efficacy in relation to GPM user
comprehension.
6.1.6 Cognitive Styles as Moderating Factors: Extroversion-Introversion and Sensing-Intuition
Using continuous MBTI data allowed extensive analyses of cognitive styles in relation to subjective
mental workload and task performance. Yet, this study concluded that neither the MBTI extroversion-
introversion nor sensing-intuitive dimensions significantly affected subjective mental workload or task
performance of the participants. Although this result was puzzling, BAS, BIS, personality, and MBTI
literature suggests that it was possible that the nature of GPMs portraying BPI may have minimized or
negated the impact of these cognitive styles on subjective mental workload and task performance. This
conclusion needed further investigation, but if substantiated, it could be an important finding that may
facilitate improved GPM user comprehension, collaboration, system development, and BPM System usage.

Bret R. Swan Chapter 6 – Conclusions and Recommendations
Page 221 of 420
6.1.7 Cognitive Abilities as Moderating Factors: General Cognitive Ability
Cognitive abilities played a significant role in affecting subjective mental workload in this research,
as well as other GPM user comprehension outcomes. For example, General Cognitive Abilities (GCA) had
a significant effect on GPM user comprehension, second only to the type of GPM. GCA significantly
affected user comprehension task accuracy. GCA also seemed to negate the effect of UET on task accuracy,
as well as the effect of the type of BPI on both task timeliness and subjective mental workload. This
suggests that GCA is the real underlying factor that covaried with BPI and UET to make them statistically
significant when they were originally analyzed.
6.1.8 Cognitive Abilities as Moderating Factors: Attentional Abilities
This was the first study to include attentional abilities and the first application of the DAPI
(Crawford, Brown, & Moon, 1993; Lyons & Crawford, 1997) in the context of information systems or GPM
user comprehension and BPM literature. Attentional abilities were found to significantly affect task
timeliness and subjective mental workload of participants. Future research is recommended to include
attentional abilities as a separate construct affecting GPM user comprehension.
1. Business Process Complexity2. Modeling Rules of the GPM Type3. Principle of Ontological Completeness4. Expert-Novice Differences5. General Cognitive Abilities 6. Attentional Abilities*User Educational Training and
BPI Type Appear Mitigated by GCA & Attentional Abilities
Impacts of Individual Cognitive
Differences
Cognitive Resource Impacts
Figure 6-1. Integrating individual conclusions: the hierarchy of factors affecting GPM user comprehension.

Bret R. Swan Chapter 6 – Conclusions and Recommendations
Page 222 of 420
6.1.9 Integration of Research Findings
In summary, Figure 6-1 summarizes how the findings of this study are integrated to increase
academic and practitioner understanding of GPM user comprehension in the context of BPM Systems.
Although the type of GPM had the most impact of any other variable on the dependent variables in this
study, the pilot study revealed that the complexity of the process itself had the most influence GPM user
comprehension. The specifics of the business process determine how the GPM modeling rules and syntax
are applied to create the graphical representation of the BPI. The more complex a process is, the more
difficult it is to model and lay out given the GPM syntax. The resulting graphical representation of the
business process is then comprehended by the user. Metagraphs were clearly easier for users to comprehend
than UML diagrams of the simple business process used in this experiment, contrary to the principle of
Ontological Completeness. However, given the process complexity and GPM syntax considerations
affecting the graphical representations, it is uncertain whether this experiment actually tested the principle of
Ontological Completeness. In summary, cognitive resources related to the business process and aspects of
types of GPM were the most important factors affecting GPM user comprehension.
By including individual cognitive differences in this experiment, it was discovered that the impacts
of UET and BPI were mitigated by both the GCA and attentional abilities of the participants. Additionally,
although not hypothesized, it was discovered that the GCA of participants directly affected task accuracy.
Therefore, cognitive differences between individuals were discovered to be secondary to the impacts of
GPM type but critical to understanding GPM user comprehension.
This study illustrates the advantage of a theoretical framework that integrates both the key cognitive
resources and individual cognitive differences to study GPM user comprehension. If only BPM cognitive
resources were included in this experiment, the research would have shown that the type of UET and BPI, in
addition to the type of GPM, significantly affects GPM user comprehension. On the other hand, if GPM
user comprehension were studied from only a cognitive science perspective, this experiment would suggest
that participants’ cognitive abilities were the cause of variation in user comprehension outcomes. Past
studies that have attempted to integrate cognitive resource and individual cognitive differences apparently
have been limited and do not account for all the variables included in this study. The theoretical framework
was developed using concepts from Activity Theory and Distributed Cognition theory, and the research
model extended these theories to empirical and experimental research identified as necessary to advance

Bret R. Swan Chapter 6 – Conclusions and Recommendations
Page 223 of 420
these theories. Therefore, this integrated theoretical framework and experiment provides an important
contribution to be used as a benchmark for comparison of past and future research.
6.2 LIMITATIONS OF THIS RESEARCH
The conclusions of this study were limited due to participants being third and fourth-year university
students. Another limitation of using students is the cognitive complexity issues stemming from the
typically younger age of student participants compared to the ages of typical BPM managers (Hendrick,
1984). However, student subjects provided the most logical means of attempting experimental control given
the diversity of business processes, the tacit knowledge diversity of real-world BPM managers, and the fact
that academic education provided a measure of control of tacit knowledge. Students also provided a
population of novice users with relatively no experience and limited bias toward specific BPM tasks,
business processes, or the GPMs used in BPM Systems.
Several methodological issues were also found to be limitations of this study. For example, GPMs
are typically viewed in BPM Systems using computer screens, but in this study, participants studied the
GPMs printed on paper and posted on a wall. Computer screens were not used to portray these GPMs so
that screen size and scrolling issues would not add time and manipulation effects that would hinder user
comprehension. Another methodological issue is that participants were only required to interpret GPM
symbols and not the real-world business process terminology that the symbols represented.
Lastly, the complexity of the business process might have limited or affected user comprehension.
The GPMs used in the experiment portrayed a relatively simple business process – a bank loan application
process – first published as an illustration of how metagraphs can be applied to BPM and workflow
management systems. This process was chosen to minimize modeling mistakes in the experiment and
because there were limited examples in the literature that illustrate how metagraphs can be applied to model
multiple BPI perspectives. Although GPM complexity was controlled and not explicitly tested in this
experiment, GPM user comprehension could have been biased toward metagraphs and how complexity is
modeled by metagraphs, compared to more complex business processes in the real-world. This gives rise to
an interesting issue for future research: how to package the BPI portrayed in GPMs to minimize the
complexity yet maximizing the effectiveness of GPM user comprehension.

Bret R. Swan Chapter 6 – Conclusions and Recommendations
Page 224 of 420
6.3 IMPLICATIONS FOR THE LITERATURE
There is a great deal of prior research studying cognition and individual cognitive differences
related to user comprehension. There is also a good deal of research relating different cognitive resources
and user comprehension. There are several theories and variable relationships in the literature that are of
interest in this study. However, this research appears to be the first study that developed and utilized an
theoretical framework that integrated the key BPM cognitive resources and individual cognitive differences
affecting GPM user comprehension in the context of BPM and BPM Systems. As a result, this study has
implications for management systems engineering as well as several reference literatures, including BPM,
BPM Systems, workflow management, HCI, and cognitive ergonomics.
6.3.1 Practitioner Implications for Management Systems Engineering and BPM
There are two general areas of implication for practitioners in this literature: implications for BPM
managers who will use the GPMs to make decisions and implications for BPM System developers.
Practitioners who use these GPMs to make BPM decisions can use the conclusions of this study in several
ways. Managers’ GCA and attentional abilities should be evaluated. BPM tasks can then categorized
according to the levels of GCA and attention that are required for the task. Based on these results, BPM
managers can be (1) profiled and selected for specific BPM tasks requiring their specific GCA abilities for
accurate comprehension and (2) design GPM training targeted at different levels of GCA and attention of
participants.
For BPM System developers, this research shows that the complexity of the business process and
the type of GPM, specifically its modeling rules and syntax, most influence user comprehension. GPMs of
business processes should be partitioned into smaller “chunks” that easily comprehensible to users. By
selecting a GPM type whose syntax includes a smaller number of symbols, users will be able to easier
comprehend the BPI in the GPM. The GPM type selected may mitigate individual cognitive differences and
consequently, improve collective user comprehension. Further research is needed to test and verify these
recommendations.

Bret R. Swan Chapter 6 – Conclusions and Recommendations
Page 225 of 420
6.3.2 Implications for Management Systems Engineering and BPM
Management systems engineering studies the relationships between people and technology in the
management of organizations. A host of previous literature describes BPM needs, GPMs, and information
technologies associated with BPM Systems, but has not studied the management system that relates BPM
managers with the formal GPMs used in BPM Systems. Because BPM and BPM Systems are important
topics of study in the near future, this research has significant implications for BPM, BPM Systems, and
enterprise-level information systems literature in relation to management systems engineering.
This study extends the literature on BPM systems, as well as the workflow management and
enterprise-level information systems literature, by adding empirical, theory-driven user comprehension
research to this increasingly important topic area. This study contributes empirical evidence as to the
importance of the type of GPM and differences in user cognitive abilities to the successful comprehension
of the BPI portrayed by BPM Systems. This study is a first step in extending and integrating various related
literatures to study the enterprise-wide management system that is of growing importance to today’s
organizations.
Future empirical research should further compare user comprehension of different formal GPMs
under a variety of task conditions. The limits of how and under what conditions GPMs may mitigate
individual cognitive differences and differences in tacit and explicit BPM knowledge is an important topic
for future research. Also, the theoretical framework proposed in this study may be used as a metamodel to
map more limited past research to highlight new areas of management system research related to BPM and
BPM Systems. Finally, this research model can be used in future field studies to help identify the boundary
conditions for GPM user comprehension. Understanding GPM user comprehension in this context may also
benefit research and industry by contributing to understanding the impact of knowledge transfer,
management practices, and communication that improves the performance of both people and processes.
6.3.3 Implications for GPM User Comprehension Research in the Context of BPM Systems
This study was a first step to extending the GPM literature related to BPM Systems by empirically
testing whether GPMs could be effectively and efficiently comprehended by novice users and under BPM
task-specific conditions. The research and practical implications of this study may help identify the GPMs
and the conditions under which novice users could better comprehend BPI. This research indicates that the

Bret R. Swan Chapter 6 – Conclusions and Recommendations
Page 226 of 420
GPM itself may negate, mitigate, or minimize the impacts of novice-expert and cognitive style differences
in novice GPM users. Also, the combination of the subjective mental workload, GCA, and attentional
abilities may provide user “profiles” that can help assist research and practitioners in delineating GPM user
comprehension in task-specific contexts.
Future research is also needed to further understand why metagraphs facilitated better performance
and why UML diagrams did not. If the boundary conditions for GPM user comprehension can be
identified, criteria can be applied to any type of GPM that may be able to positively impact user
comprehension outcomes. Also, practitioners should consider experimenting with metagraphs as their
primary visual interface in BPM Systems because they apparently facilitate more accurate, timely, and less
mentally demanding user comprehension of BPI.
BPM System developers and future researchers should focus on developing better training and BPI
display methods to facilitate faster user comprehension that is less mentally taxing. The complexity of
GPMs was a problem for novice users, because of the number of task, resource, and information-centric
elements and how they were related. This study suggests that, as business processes became more complex,
GPM user comprehension may be better facilitated by dividing and packaging large GPMs into smaller,
integrated sub-graphs or “chunks.” This design approach may help novice users more easily view the
GPMs on a computer monitor and drill down to comprehend specific BPI, while at the same time, remain
oriented in relation to the overall business process. The optimal size of these GPM sub-packages will need
to be determined by future research.
Future research should also place an emphasis on the interpretation of GPM symbols back to real-
world business processes. Future studies can also focus on why resource allocation information portrayed
by these GPMs facilitated less desirable user comprehension outcomes, primarily timeliness and mental
workload, and why other types of BPI did not. For practitioners, these results suggest that the type of BPI
portrayed by BPM Systems affects user comprehension in BPM managers. Future research and practice
should place an emphasis on increasing GPM user comprehension of these resource-centric and
information-centric BPI. For practitioners, these results suggest that the type of BPI portrayed by BPM
Systems significantly affect user comprehension and training is needed to address the less comprehensible
BPI.
Additionally, future research should develop and validate either a GPM user comprehension task
self-efficacy assessment instrument and determine under what BPM task-specific circumstances this

Bret R. Swan Chapter 6 – Conclusions and Recommendations
Page 227 of 420
instrument is valid. Future research should also control for both the time that participants are allowed to
become familiar with interpreting different GPMs and comparisons between expert vs. novice interpreters of
these GPMs. Finally, this research should be extended to evaluate individual-level vs. group-level cross-
functional and collaborative interpretations of different types of GPMs. For example, suggested future
research questions include:
• What is the minimal amount of training necessary to consider novice users equivalently trained
across different types of GPM, BPI, and user educational training (UET)?
• Is there a difference in user comprehension if the GPMs are labeled using the actual
terminology of the business process instead of reference labels?
• Is information lost when users interpret from GPM symbols to reference label meanings to real-
world meanings, and, if so, what information is lost by users?
• Because modeling involves task, resource, and information-centric BPI element dependencies,
how do user comprehension outcomes vary in relation to the number of task, resource, and
information-centric BPI elements and dependencies required when modeling different business
processes?
• How does the level of complexity of business process affect GPM user comprehension
outcomes?
• How is GPM complexity minimized while, at the same time, GPM user comprehension
outcomes are maximized?
6.3.4 Implications for Future Empirical Cognitive Research in a BPM System Context
There is a great deal of prior research studying cognition and some of the cognitive differences
between individuals, but no BPM-specific user comprehension research was found. This study
demonstrates that future research in BPM Systems can benefit from applying various cognition-related
constructs. It furthered the application of cognitive theory and personality literature to the BPM and IS
domains. This study extends related cognitive science research by supporting the assertion that BPM
Systems need to be developed to address individual cognitive differences if GPM user comprehension is to
be improved. For example, this study applied subjective mental workload and the NASA-TLX to GPM user
comprehension contexts. It also proposes using TLX results and factor analyses as possible mental

Bret R. Swan Chapter 6 – Conclusions and Recommendations
Page 228 of 420
workload “signatures” to help delineate BPM task types and complexities. Several implications of this
study are important for future research:
• Future research is needed to further understand the impact of tacit BPM knowledge. Lab
research should be conducted with more students from differing BPM-related professional
disciplines as well as students from other universities. This would increase the statistical power
of this study and further increase understanding of the effects of different types of UET on
GPM user comprehension.
• Eventually, both expert and novice BPM professionals with different educational and
professional backgrounds should be included in lab experiments before extending this research
to field studies.
• Future research should attempt to use instruments that continuous data so that cognition-related
data and user comprehension outcomes and be more justifiably analyzed and compared.
• Attempts should be made to experimentally control for cognitive styles as independent
variables in an experimental design in order to investigate the possibility of GPMs minimizing
the effect of cognitive styles during BPM user comprehension.
• Besides further GCA research, future research should include instruments assessing users’
narrow cognitive aptitudes to understand their effects on GPM user comprehension outcomes.
These results provide initial information that suggest future, more specific research into the
narrow cognitive aptitudes that may help develop a cognitive profile or “signature” that can be
used to describe GPM user comprehension in BPM and BPM System task contexts.
• GPM user motivation and attentional abilities also need to be an important consideration and
topic of any future BPM Systems research.
This study has started to address a gap in prior literature by theoretically integrating and empirically
testing key individual cognitive differences and cognitive resources that impact GPM user comprehension.
The GPM user comprehension research model used in this study can be further validated and extended in
future research. This theoretical framework, as well as the results of this experiment, can serve as the first
step in a future family of empirical studies that begins to study the large number of context variables that
can affect usability and user comprehension of large-scale enterprise-level information system (as suggested
is needed by Basili & Lanubile (1999)).

Bret R. Swan Chapter 6 – Conclusions and Recommendations
Page 229 of 420
6.3.5 Implications for Related Areas of Industrial Engineering
Besides management systems engineering, this research extends the HCI and cognitive ergonomics
areas of industrial engineering by increasing understanding of GPM user comprehension. For example, this
research model extends both Activity Theory and Distributed Cognition theory to empirical, experimental
research contexts (as proposed to prior research (Hollan, Hutchins, & Kirsh, 2000; Kuutti, 1995)) as well as
to the domains of GPM user comprehension, BPM and BPM Systems.
Future research should focus on why UET and BPI seem to be mitigated by GCA, and attentional
abilities. For practitioners, these findings suggest that, although the type of UET a novice user possesses
produced differences in user comprehension, the GCA and attentional abilities of these users minimized or
moderated these effects. This suggests that training practitioners in how to interpret BPI should involve
evaluation of GCA and attentional abilities as well as tailoring training to the needs of BPM managers with
different educational backgrounds.
By integrating key cognitive differences between individuals and BPM cognitive resources, this
research confirmed or pointed out several limitations in prior research. For example, cognitive fit and RID
approaches are limited in their explanatory capabilities without the accounting for individual cognitive
differences and a theory to explain why a cognitive “fit” or RID “match” is good or poor. Additionally, this
research seemed to confirm prior analyses suggesting that traditional applications of the Yerkes-Dodson law
is overly simplistic to explain the relationships between task performance and mental workload. Further
research is needed to investigate the alternative finding that factor analysis may revel a GPM user
comprehension mental workload “signature” or profile.
The integrated theoretical research framework can serve as a benchmark for future GPM user
comprehension research, specifically related to management systems engineering, but also in the HCI and
cognitive ergonomics areas of industrial engineering. This is because this framework is unique in
integrating the key cognitive resources (tacit knowledge, explicit knowledge and information artifacts) as
well as key individual cognitive differences (cognitive styles, cognitive abilities [GCA and attention] and
subjective mental workload) affecting GPM user comprehension outcomes (such as task performance and
self-efficacy).
With the advent of ever more powerful and complex suites of enterprise-level information systems,
industrial engineering approaches are needed to help understand and better integrate people with these

Bret R. Swan Chapter 6 – Conclusions and Recommendations
Page 230 of 420
technologies to improve decision-making and task performance as well as the development of improved
enterprise-level information systems. It is hoped that this research will provide a foundation on which to
build future research that contributes to the study of GPM user comprehension in the context of BPM and
BPM Systems.

Bret R. Swan References
Page 231 of 420
REFERENCES
Ackerman, M. S., & Halverson, C. A. (2000). Reexamining organizational memory. Association for Computing Machinery. Communications of the ACM, 43(1), 58.
Agarwal, R., De, P., & Sinha, A. P. (1999). Comprehending object and process models: an empirical study. IEEE Transactions on Software Engineering, 25(4), 541-556.
Agarwal, R., Sinha, A. P., & Tanniru, M. (1996). The role of prior experience and task characteristics in object-oriented modeling: An empirical study. International Journal of Human-Computer Studies, 45(6), 639-667.
Aguilar-Saven, R. S. (2004). Business process modelling: review and framework. International Journal of Production Economics, 90(2), 129-149.
Aks, D. J., & Coren, S. (1990). Is susceptibility to distraction related to mental ability? Journal of Educational Psychology, 82(2), 388-390.
Alm, H., & Nilsson, L. (1995). The effects of a mobile telephone task on driver behaviour in a car following situation. Accident Analysis & Prevention, 27(5), 707-715.
Amaravadi, C. S., & Lee, I. (2005). The dimensions of process knowledge. Knowledge and Process Management, 12(1), 65-76.
Annett, J. (2002). Subjective rating scales: science or art? Ergonomics, 45(14), 966-987.
Anonymous. (2007). UML Resource Page. Retrieved January 13, 2007, from http://www.uml.org/
Apostolou, D., & Mentzas, G. (2003). Experiences from knowledge management implementations in companies of the software sector. Business Process Management Journal, 9(3), 354.
Avila, C. (2001). Distinguishing BIS-mediated and BAS-mediated disinhibition mechanisms: A comparison of disinhibition models of Gray (1981,1987) and of Patterson and Newman (1993). Journal of Personality and Social Psychology, 80(2), 311-324.
Baddeley, A. (2003a). Working memory and language: an overview. Journal of Communication Disorders, 36(3), 189-208.
Baddeley, A. (2003b). Working memory: Looking back and looking forward. Nature Reviews Neuroscience, 4(10), 829-839.
Baddeley, A., Chincotta, D., & Adlam, A. (2001). Working memory and the control of action: Evidence from task switching. Journal of Experimental Psychology: General, 130(4), 641-657.
Bandura, A. (1986). Social foundations of thought and action: a social cognitive theory. Englewood Cliffs, N.J.: Prentice-Hall.
Bandura, A., & Locke, E. A. (2003). Negative self-efficacy and goal effects revisited. Journal of Applied Psychology, 88(1), 87.
Barkhi, R. (2002). Cognitive style may mitigate the impact of communication mode. Information & Management, 39(8), 677-688.
Bartlett, F. C. (1932). Remembering: An Experimental and Social Study. London: Cambridge University Press.

Bret R. Swan References
Page 232 of 420
Basili, V. R., & Lanubile, F. (1999). Building knowledge through families of experiments. IEEE Transactions on Software Engineering, 25(4), 456-473.
Basu, A., & Blanning, R. W. (2000). A formal approach to workflow analysis. Information Systems Research, 11(1), 17-36.
Basu, A., & Blanning, R. W. (2003). Synthesis and decomposition of processes in organizations. Information Systems Research, 14(4), 337.
Basu, A., & Kumar, A. (2002). Research commentary: Workflow management issues in e-business. Information Systems Research, 13(1), 1-14.
Bernstein, D. A., Roy, E., Skrull, T. K., & Wickens, C. D. (1991). Psychology. Boston: Houghton Mifflin Company.
Bess, T. L., Harvey, R. J., & Swartz, D. (2003). Hierarchical Confirmatory Factor Analysis of the Myers-Briggs Type Indicator. Paper presented at the Annual Conference of the Society for Industrial and Organizational Psychology, Orlando, FL USA.
Bierwagen, T., Eyferth, K., & Helbing, H. (1996). Radar screen information access: An exploratory investigation. Control Engineering Practice, 4(8), 1177-1182.
Blanchard, B. S., & Fabrycky, W. J. (2006). Systems engineering and analysis (4th ed.). Upper Saddle River, N.J.: Pearson Prentice Hall.
Boff, K. R. (2006). Revolutions and shifting paradigms in human factors & ergonomics. Applied Ergonomics, 37(4), 391-399.
Boland, R. J., Jr., & Tenkasi, R. V. (2001). Communication and collaboration in distributed cognition. In G. M. Olson, T. W. Malone & J. B. Smith (Eds.), Coordination theory and collaboration technology (pp. 51-66). Mahwah, N.J.: Lawrence Erlbaum Associates.
Boland, R. J., Jr., Tenkasi, R. V., & Te'eni, D. (1994). Designing Information Technology to Support Distributed Cognition. Organization Science, 5(3), 456-475.
Bowman, D. B., Markham, P. M., & Roberts, R. D. (2001). Expanding the frontier of human cognitive abilities: so much more than (plain) g! Learning and Individual Differences, 13(2), 127-158.
Braarud, P. O. (2001). Subjective Task Complexity and Subjective Workload: Criterion Validity for Complex Team Tasks. International Journal of Cognitive Ergonomics, 5(3), 261-273.
Broadhurst, P. L. (1959). The interaction of task difficulty and motivation: The Yerkes Dodson law revived. Acta Psychologica, 16, 321-338.
Cabrera, A., & Cabrera, E. F. (2002). Knowledge-sharing dilemmas. Organization Studies, 23(5), 687-710.
Campbell, J. P., Dunnette, M. D., Lawler, E. E. I., & Weick, K. E. J. (1970). Expectancy Theory. In D. A. Mankin, R. Ames & M. A. Grodsky (Eds.), Managerial Behavior, Performance, and Effectiveness (pp. 343-348): McGraw-Hill, Inc. McGraw-Hill Book Company.
Cannon-Bowers, J. A., & Salas, E. (2001). Reflections on shared cognition. Journal of Organizational Behavior, 22(2), 195.
Capraro, R. M., & Capraro, M. M. (2002). Myers-Briggs type indicator score reliability across studies: A meta-analytic reliability generalization study. Educational and Psychological Measurement, 62(4), 590-602.

Bret R. Swan References
Page 233 of 420
Carlson, J. G. (1985). Recent assessments of the Myers-Briggs Type Indicator. Journal of Personality Assessment, 49, 356-365.
Carlyn, M. (1977). An assessment of the Myers-Briggs Type Indicator. Journal of Personality Assessment, 41, 461-473.
Carpenter, P. A., Miyake, A., & Just, M. A. (1995). Language Comprehension - Sentence and Discourse Processing. Annual Review of Psychology, 46, 91-120.
Carroll, J. M. (Ed.). (2003). HCI models, theories, and frameworks: toward a multidisciplinary science. Amsterdam ; Boston: Morgan Kaufmann.
Carroll, J. M., & Olson, J. R. (Eds.). (1987). Mental Models in Human-Computer Interaction: Research Issues about what the User of Software Knows. Washington, DC: National Academy Press.
Carskadon, T. G. (1979). Clinical and counseling aspects of the Myers-Briggs Type Indicator: a research review. Research on Psychological Types, 1, 2-31.
Chalmers, P. A. (2003). The role of cognitive theory in human-computer interface. Computers in Human Behavior, 19(5), 593-607.
Chen, I. J., & Popvich, K. (2003). Understanding customer relationship management (CRM): People, process and technology. Business Process Management Journal, 9(5), 672.
Chi, S. E., Park, C. B., Lim, S. L., Park, E. H., Lee, Y. H., Lee, K. H., et al. (2005). EEG and personality dimensions: A consideration based on the brain oscillatory systems. Personality and Individual Differences, 39(3), 669-681.
Cimino, J. J. (1998). Distributed cognition and knowledge-based controlled medical terminologies. Artificial Intelligence in Medicine, 12(2), 153-168.
Cohen, J. (1988). Statistical power analysis for the behavioral sciences (2nd ed.). Hillsdale, N.J.: L. Erlbaum Associates.
Cohen, J. (1992). A Power Primer. Psychological Bulletin, 112(1), 155-159.
Collet, C., Petit, C., Champely, S., & Dittmar, A. (2003). Assessing workload through physiological measurements in bus drivers using an automated system during docking. Human Factors, 45(4), 539-548.
Compeau, D. R., & Higgins, C. A. (1995). Computer self-efficacy - development of a measure and initial test. MIS Quarterly, 19(2), 189-211.
Compeau, D. R., Higgins, C. A., & Huff, S. (1999). Social cognitive theory and individual reactions to computing technology: A longitudinal study. MIS Quarterly, 23(2), 145-158.
Craik, K. (1943). The Nature of Explanation. UK: Cambridge University Press.
Crawford, H. J., Brown, A. M., & Moon, C. E. (1993). Sustained attentional and disattentional abilities: Differences between low and highly hypnotizable persons. Journal of Abnormal Psychology, 102(4), 534-543.
Crosman, P. L. (2004, JUN). Pain Free BPM. Transform, 13, 16-22.
Crowston, K. (1997). A coordination theory approach to organizational process design. Organization Science, 8(2), 157-175.

Bret R. Swan References
Page 234 of 420
Curtis, B. (1984). Fifteen years of psychology in software engineering: Individual differences and cognitive science. Paper presented at the Proceedings of the 7th Institute of Electrical and Electronics Engineers (IEEE) International Conference on Software Engineering, Orlando, Florida, United States.
Curtis, B., Kellner, M. I., & Over, J. (1992). Process modeling. Communications of the ACM (Association for Computing Machinery), 35(9), 75-90.
D'Amico, E. J., Neilands, T. B., & Zambarano, R. (2001). Power analysis for multivariate and repeated measures designs: A flexible approach using the SPSS MANOVA procedure. Behavior Research Methods Instruments & Computers, 33(4), 479-484.
Daradoumis, T., & Marques, J. M. (2002). Distributed Cognition in the Context of Virtual Collaborative Learning. Journal of Interactive Learning Research, 13(1-2), 135-148.
Davenport, E., & Hall, H. (2002). Organizational Knowledge and Communities of Practice. Annual Review of Information Science and Technology (ARIST), 36, 171-227.
Davenport, T. H., & Beers, M. C. (1995). Managing information about processes. Journal of Management Information Systems, 12(1), 57.
Davis, D. L., & Elnicki, R. A. (1984). User Cognitive Types for Decision Support Systems. Omega-International Journal of Management Science, 12(6), 601-614.
de Croock, M. B. M., van Merrienboer, J. J. G., & Paas, F. G. W. C. (1998). High versus low contextual interference in simulation-based training of troubleshooting skills: effects on transfer performance and invested mental effort. Computers in Human Behavior, 14(2), 249-267.
de Haan, M. (2002). Distributed Cognition and the Shared Knowledge Model of the Mazahua: A Cultural Approach. Journal of Interactive Learning Research, 13(1-2), 31-50.
De Vito, A. J. (1985). Review of the Myers-Briggs Type Indicator. In J. V. Mitchell (Ed.), The ninth mental measurement yearbook (Vol. 2, pp. 1000). Lincoln: University of Nebraska Press.
Decortis, F., Noirfalise, S., & Saudelli, B. (2000). Activity theory, cognitive ergonomics and distributed cognition: three views of a transport company. International Journal of Human-Computer Studies, 53(1), 5-33.
Dehler, C. (1998). Computer-mediated distributed cognitions: cultivating collective knowledge and personal competencies. ACM Special Interest Group on Computer Uses in Education (SIGCUE) Outlook, 26(1), 15-19.
Dodrill, C. B. (1981). An Economical Method for the Evaluation of General Intelligence in Adults. Journal of Consulting and Clinical Psychology, 49(5), 668-673.
Dodrill, C. B. (1983). Long-Term Reliability of the Wonderlic Personnel Test. Journal of Consulting and Clinical Psychology, 51(2), 316-317.
Dodrill, C. B., & Warner, M. H. (1988). Further Studies of the Wonderlic Personnel Test as a Brief Measure of Intelligence. Journal of Consulting and Clinical Psychology, 56(1), 145-147.
Dunn, C., & Grabski, S. (2001). An investigation of localization as an element of cognitive fit in accounting model representations. Decision Sciences, 32(1), 55-94.
Bret R. Swan References
Page 235 of 420
Dussault, C., Jouanin, J. C., Philippe, M., & Guezennec, C. Y. (2005). EEG and ECG changes during simulator operation reflect mental workload and vigilance. Aviation Space and Environmental Medicine, 76(4), 344-351.
Easterbrook, J. A. (1959). The effect of emotion on cue utilization and the organization of behavior. Psychological Review, 66(3), 183-201.
Edinger, J. D., Shipley, R. H., Watkins, C. E., Jr., & Hammett, E. B. (1985). Validity of the Wonderlic Personnel Test as a Brief IQ Measure in Psychiatric Patients. Journal of Consulting & Clinical Psychology, 53(6), 937-939.
Edwards, J. A., Lanning, K., & Hooker, K. (2002). The MBTI and social information processing: An incremental validity study. Journal of Personality Assessment, 78(3), 432-450.
Eppler, M. J., Seifried, P. M., & Ropnack, A. (1999). Improving Knowledge Intensive Processes Through an Enterprise Knowledge Medium. Paper presented at the Proceedings of the Association for Computing Machinery (ACM) Special Interest Group on Computer Personnel Research (SIGCPR) Annual Conference, New Orleans, LA.
Eriksson, H.-E., & Penker, M. (2000). Business modeling with UML: business patterns at work. New York: John Wiley & Sons.
Eyring, J. D., Johnson, D. S., & Francis, D. J. (1993). A Cross-Level Units-of-Analysis Approach to Individual Differences in Skill Acquisition. Journal of Applied Psychology, 78(5), 805-814.
Eysenck, H. J. (1967). The biological basis of personality. Springfield, Ill.,: Thomas.
Eysenck, M. W., & Flanagan, C. (2000). Psychology for AS level. London ; Philadelphia, PA: Psychology Press.
Eysenck, M. W., & Keane, M. T. (1990). Cognitive Psychology: A Student’s Handbook. London, UK: Lawrence Erlbaum Associates.
Fagan, M. H., Neill, S., & Wooldridge, B. R. (2003). An empirical investigation into the relationship between computer self-efficacy, anxiety, experience, support and usage. Journal of Computer Information Systems, 44(2), 95.
Faul, F., Erdfelder, E., Lang, A.-G., & Buchner, A. (In Press). G*Power 3: A flexible statistical power analysis program for the social, behavioral, and biomedical sciences. Behavior Research Methods.
Field, A. P. (2005). Discovering statistics using SPSS (2nd ed.). London; Thousand Oaks, Calif.: Sage Publications.
Fisher, S. L., & Ford, J. K. (1998). Differential effects of learner effort and goal orientation on two learning outcomes. Personnel Psychology, 51(2), 397.
Flor, N. V., & Maglio, P. P. (1997). A Case Study of a Representational Activity at a Customer Centered Business. Paper presented at the Proceedings of the Eighteenth International Conference on Information Systems, Atlanta, GA USA.
Flor, N. V., & Maglio, P. P. (2004). Modeling business representational activity online: A case study of a customer-centered business. Knowledge-Based Systems, 17(1), 39-56.
Fonseca, F. T. (2007). The double role of ontologies in information science research. Journal of the American Society for Information Science and Technology, Accepted for Publication in June 2006.

Bret R. Swan References
Page 236 of 420
Gable, S. L., Reis, H. T., & Elliot, A. J. (2000). Behavioral activation and inhibition in everyday life. Journal of Personality and Social Psychology, 78(6), 1135-1149.
Garbis, C. (2000). Communication and coordination through public and private representations in control rooms. Paper presented at the Conference on Human Factors in Computing Systems (CHI '00), The Hague, The Netherlands.
Gardner, W. L., & Martinko, M. J. (1996). Using the Myers-Briggs Type Indicator to study managers: A literature review and research agenda. Journal of Management, 22(1), 45-83.
Garner, S. (2002). Reducing the Cognitive Load on Novice Programmers (141 Reports--Descriptive; 150 Speeches/Meeting Papers). Australia; Western Australia.
Gentner, D., & Gentner, D. R. (1983). Flowing waters or teemings crowds: mental models of electricity In D. Gentner & A. L. Stevens (Eds.), Mental Models (pp. 99-129). Hillsdale, NJ: Lawrence Erlbaum Associates, Inc.
Gentner, D., & Stevens, A. L. (Eds.). (1983). Mental Models. Hillsdale, NJ: Lawrence Erlbaum Associates, Inc.
George, C. E. (2000). Experiences with Novices: The Importance of Graphical Representations in Supporting Mental Models. Paper presented at the Proceedings of the 12th Annual Workshop of the Psychology of Programming Interest Group (PPIG), Corzena, Italy.
Gershenson, C. (2006). Cognitive paradigms: which one is the best? Cognitive Systems Research 5(2), 135-156.
Giordano, D. (2002). Evolution of interactive graphical representations into a design language: a distributed cognition account. International Journal of Human-Computer Studies, 57(4), 317-345.
Goldstein, H. W., Yusko, K. P., & Nicolopoulos, V. (2001). Exploring Black-White subgroup differences of managerial competencies. Personnel Psychology, 54(4), 783.
Goranson, H. T. (1999). The agile virtual enterprise: cases, metrics, tools. Westport, Conn.: Quorum Books.
Gou, H. M., Huang, B. Q., Liu, W. H., & Li, X. (2003). A framework for virtual enterprise operation management. Computers in Industry, 50(3), 333-352.
Gray, J. A. (1972). The psychophysiological basis of introversion-extraversion: A modification of Eysenck's theory. In V. D. Nebylitsyn & J. A. Gray (Eds.), The biological bases of individual behaviour (pp. 182-205). San Diego: Academic Press.
Gray, J. A. (1981). A critique of Eysenck's theory of personality. In H. J. Eysenck (Ed.), A model for personality (pp. 246-276). Berlin ; New York: Springer-Verlag.
Gray, J. A. (1987). The psychology of fear and stress (2nd ed.). Cambridge ; New York: Cambridge University Press.
Gray, J. R., & Burgess, G. C. (2004). Personality differences in cognitive control? BAS, processing efficiency, and the prefrontal cortex. Journal of Research in Personality, 38(1), 35-36.
Gray, J. R., Burgess, G. C., Schaefer, A., Yarkoni, T., Larsen, R. J., & Braver, T. S. (2005). Affective personality differences in neural processing efficiency confirmed using fMR1. Cognitive Affective & Behavioral Neuroscience, 5(2), 182-190.

Bret R. Swan References
Page 237 of 420
Green, P., & Rosemann, M. (2000). Integrated process modeling: An ontological evaluation. Information Systems: The 11th International Conference on Advanced Information System Engineering, 25(2), 73-87.
Gronau, N., & Weber, E. (2004, June 17-18). Management of knowledge intensive business processes. Paper presented at the Proceedings of the Business Process Management: Second international conference, BPM Potsdam, Germany.
Gruber, H. E., & Gruber, J. J. V. (Eds.). (1977). The Essential Piaget. New York: Basic Books.
Grumbles, D., & Crawford, H. J. (1981, October). Differential attentional skills and hypnotizability. Paper presented at the Annual Meeting of the Society for Clinical and Experimental Hypnosis, Portland, OR.
Ha, C. H., Kim, J. H., Lee, S. J., & Seong, P. H. (2006). Investigation on relationship between information flow rate and mental workload of accident diagnosis tasks in NPPs. IEEE Transactions on Nuclear Science, 53(3), 1450-1459.
Hall, C., & Harmon, P. (2006). The 2006 Enterprise Architecture, Process Modeling & Simulation Tools Report (Report): Business Process Trends.
Halverson, C. (2002). Activity Theory and Distributed Cognition: Or What Does CSCW Need to DO with Theories? Computer Supported Cooperative Work: The Journal of Collaborative Computing, 11(1-2), 243-267.
Hammer, M. (1996). Beyond reengineering: how the process-centered organization is changing our work and our lives (1st ed.). New York: HarperBusiness.
Hammer, M., & Champy, J. (2003). Reengineering the corporation: a manifesto for business revolution (Revised ed. of the 2001 ed. ed.). New York: HarperBusiness Essentials.
Hancock, P. A., & Ganey, H. (2003). From the Inverted-U to the Extended-U: The Evolution of a Law of Psychology. Journal of Human Performance in Extreme Environments, 7(1), 5-14.
Hanoch, Y., & Vitouch, O. (2004). When less is more - Information, emotional arousal and the ecological reframing of the Yerkes-Dodson law. Theory & Psychology, 14(4), 427-452.
Harel, D., & Gery, E. (1997). Executable object modeling with statecharts. Computer, 30(7), 31.
Hart, S. G., & Staveland, L. E. (1988a). Development of a multi-dimensional workload rating scale: Results of empirical and theoretical research. In P. A. Hancock & N. Meshkati (Eds.), Human mental workload (Vol. 52, pp. 139-183). Amsterdam, The Netherlands:: Elsevier.
Hart, S. G., & Staveland, L. E. (1988b). NASA Task Load Index (TLX) V 1.0 Users Manual Unpublished manuscript.
Hart, S. G., & Wickens, C. D. (1990). Workload assessment and prediction. In H. R. Booher (Ed.), An Approach to Systems Integration (pp. 257-296). New York: Van Nostrand Reinhold.
Hartmann, E., Sunde, T., Kristensen, W., & Martinussen, M. (2003). Psychological measures as predictors of military training performance. Journal of Personality Assessment, 80(1), 87-98.
Harvey, R. J. (1996). Reliability and validity. In A. L. Hammer (Ed.), MBTI applications: A decade of research on the Myers-Briggs Type Indicator (pp. 5-29). Palo Alto, CA: Consulting
Psychologists Press.

Bret R. Swan References
Page 238 of 420
Hawkins, K. A., Faraone, S. V., Pepple, J. R., Seidman, L. J., & Tsuang, M. T. (1990). WAIS-R Validation of the Wonderlic Personnel Test as a Brief Intelligence Measure in a Psychiatric Sample. Psychological Assessment, 2(2), 198-201.
Hayes, J., & Allinson, C. W. (1994). Cognitive style and its relevance for managers. British Journal of Management, 5, 53-71.
Hendrick, H. W. (1984). Cognitive complexity, conceptual systems and organizational design and management: Review and ergonomic implications. In H. W. Hendrick & O. Brown, Jr. (Eds.), Human Factors in Organizational Design and Management (pp. 15-25). North-Holland: Elsevier Science Publishers B.V.
Hertzberg, F. (1968). One More Time: How Do You Motivate Employees? Harvard Business Review.
Hewig, J., Hagemann, D., Seifert, J., Naumann, E., & Bartussek, D. (2006). The relation of cortical activity and BIS/BAS on the trait level. Biological Psychology, 71(1), 42-53.
Hill, S. G., Iavecchia, H. P., Byers, J. C., Bittner, A. C., Zaklad, A. L., & Christ, R. E. (1992). Comparison of four subjective workload rating scales. Human Factors, 34(4), 429-439.
Hillman, C. H., Motl, R. W., Pontifex, M. B., Posthuma, D., Stubbe, J. H., Boomsma, D. I., et al. (2006). Physical activity and cognitive function in a cross-section of younger and older community-dwelling individuals. Health Psychology, 25(6), 678-687.
Hislop, D. (2002). Mission impossible? Communicating and sharing knowledge via information technology. Journal of Information Technology, 17(3), 165-177.
Hlupic, V. (2003). Knowledge and business process management. Hershey, PA: Idea Group Pub.
Hlupic, V., Pouloudi, A., & Rzevski, G. (2002). Towards an integrated approach to knowledge management: 'hard', 'soft' and 'abstract' issues. Knowledge and Process Management, 9(2), 90.
Hollan, J., Hutchins, E., & Kirsh, D. (2000). Distributed cognition: toward a new foundation for human-computer interaction research. ACM Transactions on Computer-Human Interaction (TOCHI), 7(2), 174-196.
Hollnagel, E. (1997). Cognitive ergonomics: it's all in the mind. Ergonomics, 40(10), 1170-1182.
Hollnagel, E., & Woods, D. D. (2005). Joint cognitive systems: Foundations of cognitive systems engineering. Boca Raton, FL: Taylor & Francis.
Horsky, J., Kaufman, D. R., Oppenheim, M. I., & Patel, V. L. (2003). A framework for analyzing the cognitive complexity of computer-assisted clinical ordering. Journal of Biomedical Informatics, 36(1-2), 4-22.
Hough, J. R., & Ogilvie, d. (2005). An Empirical Test of Cognitive Style and Strategic Decision Outcomes. Journal of Management Studies, 42(2), 417-448.
Huitt, W. (2003). The information processing approach to cognition. Retrieved March 22, 2005, from http://chiron.valdosta.edu/whuitt/col/cogsys/infoproc.html
Huitt, W. (2004). The cognitive system. Retrieved March 22, 2005, from http://chiron.valdosta.edu/whuitt/col/cogsys/cogsys.html
Hutchins, E. (1995). Cognition in the wild. Cambridge, Mass.: MIT Press.

Bret R. Swan References
Page 239 of 420
Irons, D. M. (1982). Cognitive correlates of programming tasks in novice programmers. Paper presented at the Proceedings of the 1982 conference on Human factors in computing systems, Gaithersburg, Maryland, United States.
Jarvenpaa, S. L., Dickson, G. W., & DeSanctis, G. (1985). Methodological Issues in Experimental IS Research: Experiences and Recommendations. MIS Quarterly, 9(2).
Jensen, A. R., & Weng, L. J. (1994). What Is a Good G. Intelligence, 18(3), 231-258.
Johnson-Laird, P. N. (1983). Mental Models: Towards a Cognitive Science of Language, Inference and
Consciousness. Cambridge, UK: Cambridge University Press.
Johnson, R. D., & Marakas, G. M. (2000). Research report: The role of behavioral modeling in computer skills acquisition - Toward refinement of a model. Information Systems Research, 11(4), 402-417.
Jorm, A. F., Christensen, H., Henderson, A. S., Jacomb, P. A., Korten, A. E., & Rodgers, B. (1999). Using the BIS/BAS scales to measure behavioural inhibition and behavioural activation: Factor structure, validity and norms in a large community sample. Personality and Individual Differences, 26(1), 49-58.
Jung, H. S., & Jung, H. S. (2001). Establishment of overall workload assessment technique for various tasks and workplaces. International Journal of Industrial Ergonomics, 28(6), 341-353.
Just, M. A., & Carpenter, P. A. (1992). A Capacity Theory of Comprehension - Individual-Differences in Working Memory. Psychological Review, 99(1), 122-149.
Kabeli, J., & Shoval, P. (2005a). A Comparison of the FOOM and OPM Methodologies for User Comprehension of Analysis Specifications. In J. Krogstie, T. A. Halpin & K. Siau (Eds.), Information Modeling Methods and Methodologies (pp. 175-194): Idea Group.
Kabeli, J., & Shoval, P. (2005b). Comprehension and quality of analysis specifications--a comparison of FOOM and OPM methodologies. Information and Software Technology, 47(4), 271-290.
Kalyuga, S., Ayres, P., Chandler, P., & Sweller, J. (2003). The Expertise Reversal Effect. Educational Psychologist, 38(1), 23-31.
Kaptelinin, V., Nardi, B. A., Bødker, S., Carroll, J., Hollan, J., Hutchins, E., et al. (2003, April 5-10). Panel: Post-cognitivist HCI: Second-Wave Theories. Paper presented at the Computer-Human Interaction (CHI), Ft. Lauderdale, Florida, USA.
Karagiannis, D., Junginger, S., & Strobl, R. (1996). Introduction to Business Process Management Systems Concepts. In B. Scholz-Reiter & E. Stickel (Eds.), Business Process Modeling (pp. 81-106). Berlin et al.: Springer.
Kellogg, R. T. (2001). Long-term working memory in text production. Memory & Cognition, 29(1), 43-52.
Kieras, D. E., & Bovair, S. (1984). The role of a mental model in learning to operate a device. Cognitive Science, 8(3), 255-273.
Kintsch, W. (1988). The Role of Knowledge in Discourse Comprehension - a Construction Integration Model. Psychological Review, 95(2), 163-182.
Kintsch, W. (2005). An overview of top-down and bottom-up effects in comprehension: The CI perspective. Discourse Processes, 39(2-3), 125-128.

Bret R. Swan References
Page 240 of 420
Kirsch, L. J. (1996). The Management of Complex Tasks in Organizations: Controlling the Systems Development Process. Organization Science, 7(1), 1-21.
Kirschner, P. A. (2002). Cognitive Load Theory: Implications of Cognitive Load Theory on the Design of Learning. Learning and Instruction, 12(1), 1-10.
Klein, S. B. (1982). Motivation: biosocial approaches. New York: McGraw-Hill.
Kroeger, O., Thuesen, J. M., & Rutledge, H. (2002). Type talk at work: how 16 personality types determine your success on the job (Rev. and updated. ed.). New York: Dell Pub.
Kurstedt, H. A. (2000). Management Systems Theory, Applications, and Design Unpublished manuscript, Virginia Tech, Blacksburg, VA.
Kuutti, K. (1995). Activity Theory as a potential framework for human-computer interaction research. In B. A. Nardi (Ed.), Context and consciousness: Activity Theory and human computer interaction (pp. 17-44). Cambridge: MIT Press.
Lee, C., & Bobko, P. (1994). Self-Efficacy Beliefs - Comparison of 5 Measures. Journal of Applied Psychology, 79(3), 364-369.
Lee, Y. H., & Liu, B. S. (2003). Inflight workload assessment: Comparison of subjective and physiological measurements. Aviation Space and Environmental Medicine, 74(10), 1078-1084.
Lens, W., & de Volder, M. (1980). Achievement motivation and intelligence test scores: A test of the Yerkes-Dodson hypothesis. Psychologica Belgica, 20(1), 49-59.
Lenz, K., & Oberweis, A. (2003). Inter-organizational business process management with XML nets. Petri Net Technology for Communication-Based Systems, 2472, 243-263.
Leont'ev, A. N. (1974). The problem of activity in psychology. Soviet Psychology, 13(2), 4-33.
Leont'ev, A. N. (1978). Activity, consciousness, and personality. Englewood Cliffs, N.J.: Prentice-Hall.
Leont'ev, A. N. (1989). The problem of activity in the history of soviet psychology. Soviet Psychology, 27(1), 22-39.
Lichtenberg, P., Bachner-Melman, R., Ebstein, R. P., & Crawford, H. J. (2004). Hypnotic Susceptibility: Multidimensional Relationships With Cloninger's Tridimensional Personality Questionnaire, COMT Polymorphisms, Absorption, and Attentional Characteristics. International Journal of Clinical & Experimental Hypnosis, 52(1), 47-72.
Lieberman, H. R., Bathalon, G. P., Falco, C. M., Kramer, F. M., Morgan, C. A., & Niro, P. (2005). Severe decrements in cognition function and mood induced by sleep loss, heat, dehydration, and undernutrition during simulated combat. Biological Psychiatry, 57(4), 422-429.
Light, A. (2005, Feb 4). Gartner predicts: Nearly Half of IT Jobs will be Lost to Automation by 2015. UsabilityNews.com.
Lipsey, M. W. (1990). Design sensitivity: statistical power for experimental research. Newbury Park, Calif.: Sage Publications.
Lowry, P. B., Cherrington, J. O., & Watson, R. R. (2002). The e-business handbook. Boca Raton, Fla.: St. Lucie Press.

Bret R. Swan References
Page 241 of 420
Luqi, Barnes, P. D., & Zyda, M. (1990). Graphical support for reducing information overload in rapid prototyping. Paper presented at the Proceedings of the Twenty-Third Annual Hawaii International Conference on System Sciences.
Lyons, L. C., & Crawford, H. J. (1997). Sustained attentional and disattentional abilities and arousability: Factor analysis and relationships to hypnotic susceptibility. Personality and Individual Differences, 23(6), 1071-1084.
MacLeod, D. (2004). Cognitive Ergonomics. Industrial Engineer, 36(3), 26-30.
Madhavan, R., & Grover, R. (1998). From embedded knowledge to embodied knowledge: New product development as knowledge management. Journal of Marketing, 62(4), 1.
Malone, T. W., Crowston, K., & Herman, G. A. (2003). Organizing business knowledge: the MIT process handbook. Cambridge, Mass.: MIT Press.
Marakas, G. M., Yi, M. Y., & Johnson, R. D. (1998). The multilevel and multifaceted character of computer self-efficacy: Toward clarification of the construct and an integrative framework for research. Information Systems Research, 9(2), 126-163.
Marc, T. J. (2005). The Transnational Corporation, Corporate Social Responsibility and the 'Outsourcing' Debate. Journal of American Academy of Business, Cambridge, 6(2).
Markus, M. L., Majchrzak, A., & Gasser, L. (2002). A design theory for systems that support emergent knowledge processes. MIS Quarterly, 26(3), 179-212.
Marmaras, N., & Kontogiannis, T. (2001). Cognitive Tasks. In G. Salvendy (Ed.), Handbook of industrial engineering: technology and operations management (3rd ed., pp. 1013-1040). New York: Wiley.
Marshall, C. (2000). Enterprise modeling with UML: designing successful software through business analysis. Reading, Mass.: Addison-Wesley.
Martin-Michiellot, S., & Mendelsohn, P. (2000). Cognitive Load While Learning with a Graphical Computer Interface. Journal of Computer Assisted Learning, 16(4), 284-293.
Mayer, R. E., & Moreno, R. (2003). Nine Ways to Reduce Cognitive Load in Multimedia Learning. Educational Psychologist, 38(1), 43-52.
Mayes, D. K., Sims, V. K., & Koonce, J. M. (2001). Comprehension and workload differences for VDT and paper-based reading. International Journal of Industrial Ergonomics, 28(6), 367-378.
McCutcheon, L. E. (2002). North American Journal of Psychology, 2002 (022 Collected Works--Serials). Florida.
Miers, D., Harmon, P., & Hall, C. (2006). The 2006 BPM Suites Report Release 2.0 (Report): Business Process Trends.
Miller, G. A. (1956). The Magical Number Seven, Plus or Minus Two: Some Limits on Our Capacity for Processing Information. The Psychological Review, 63, 81-97.
Miyake, S. (1997). Factors influencing mental workload indexes. Journal of UOEH (University of Occupational and Environmental Health), 19(4), 313-325.
Miyake, S. (2001). Multivariate workload evaluation combining physiological and subjective measures. International Journal of Psychophysiology, 40(3), 233-238.

Bret R. Swan References
Page 242 of 420
Moody, D. L. (2004). Cognitive load effects on end user understanding of conceptual models: An experimental analysis. In Advances in Databases and Information Systems, Proceedings (Vol. 3255, pp. 129-143).
Moore, J. L., & Rocklin, T. R. (1998). The distribution of distributed cognition: Multiple interpretations and uses. Educational Psychology Review, 10(1), 97-113.
Morabito, J., Sack, I., & Bhate, A. (1999). Organization modeling: innovative architectures for the 21st century. Upper Saddle River, NJ: Prentice Hall PTR.
Moreno, R. (2002, June 24-29). Who Learns Best with Multiple Representations? Cognitive Theory Implications for Individual Differences in Multimedia Learning. Paper presented at the Proceedings of the 14th World Conference on Educational Multimedia, Hypermedia & Telecommunications (ED-MEDIA), Denver, Colorado.
Moroney, W. F., Biers, D. W., & Eggemeier, F. T. (1995). Some measurement and methodological considerations in the application of subjective workload measurement techniques. International Journal of Aviation Psychology, 5(1), 87-106.
Morris, M. G., Speier, C., & Hoffer, J. A. (1999). An examination of procedural and object-oriented systems analysis methods: Does prior experience help or hinder performance? Decision Sciences, 30(1), 107-136.
Morrow, D. G., Menard, W. E., Ridolfo, H. E., Stine-Morrow, E. A. L., Teller, T., & Bryant, D. (2003). Expertise, cognitive ability, and age effects on pilot communication. International Journal of Aviation Psychology, 13(4), 345-371.
Mullane, J., & McKelvie, S. J. (2001). Effects of Removing the Time Limit on First and Second Language Intelligence Test Performance. Practical Assessment, Research & Evaluation, 7(23).
Muller, K. E., LaVange, L. M., Landesman-Ramey, S., & Ramey, C. T. (1992). Power calculations for general linear multivariate models including repeated measures applications. Journal of the American Statistical Association, 87, 1209-1226.
Muller, K. E., & Peterson, B. L. (1984). Practical methods for computing power in testing the multivariate general linear hypothesis. Computational Statistics and Data Analysis, 2, 143-158.
Murray, J. B. (1990). Review of research on the Myers-Briggs Type Indicator. Perceptual and Motor Skills, 70, 1187-1202.
Myers, I. B. (1993). Introduction to type (5th ed.). Palo Alto, CA: Consulting Psychologists.
Myers, I. B., & McCaulley, M. H. (1989). Manual: A guide to the development and use of the Myers-Briggs Type Indicator. Palo Alto, CA: Consulting Psychologists Press.
Myers, I. B., McCaulley, M. H., & Most, R. (1985). Manual: A guide to the development and use of the Myers-Briggs Type Indicator. Palo Alto, Ca.: Consulting Psychologists Press.
Myers, I. B., & Myers, P. B. (1995). Gifts differing: understanding personality type. Palo Alto, Calif.: Davies-Black Pub.
Nardi, B. A. (1998). Concepts of cognition and consciousness: Four voices. Journal of Computer Documentation, 22(1), 31-48.
Neisser, U. (1967). Cognitive psychology New York: Appleton-Century-Crofts.

Bret R. Swan References
Page 243 of 420
Newell, A., & Simon, H. A. (1972). Human problem solving. Englewood Cliffs, N.J.,: Prentice-Hall.
Nordbotten, J. C., & Crosby, M. E. (1999). The effect of graphic style on data model interpretation. Information Systems Journal, 9(2), 139-155.
Norman, D. A. (1983). Some observations on mental models. In D. Gentner & A. L. Stevens (Eds.), Mental Models. Hillsdale, NJ: Lawrence Erlbaum Associates, Inc.
Norman, D. A. (1986). Cognitive Engineering. In D. A. Norman & S. W. Draper (Eds.), User centered system design: new perspectives on human-computer interaction (pp. xiii, 526 p.). Hillsdale, N.J.: L. Erlbaum Associates.
Norman, D. A. (1988). The psychology of everyday things. New York: Basic Books.
Norman, D. A. (1993). Things that make us smart: defending human attributes in the age of the machine. Reading, Mass.: Addison-Wesley Pub. Co.
Norman, D. A. (2002). The design of everyday things (1st Basic paperback. ed.). New York: Basic Books.
Nygren, T. E. (1991). Psychometric properties of subjective workload measurement techniques: Implications for their use in the assessment of perceived mental workload. Human Factors, 33(1), 17-33.
O'Connor, J., & McDermott, I. (1997). The art of systems thinking: essential skills for creativity and problem solving. London: Thorsons.
O'Donnell, A. M. (1998). Special issue: Distributed cognition - Introduction. Educational Psychology Review, 10(1), 1-2.
O'Rourke, C., Fishman, N., & Selkow, W. (2003). Enterprise architecture using the Zachman Framework. Boston: Course Technology a division of Thomson Learning.
Orlikowski, W. J., & Iacono, C. S. (2001). Research commentary: Desperately seeking the "IT" in IT research - A call to theorizing the IT artifact. Information Systems Research, 12(2), 121-134.
Osborn, C. S. (1998). Systems for sustainable organizations: Emergent strategies, interactive controls and semi-formal information. Journal of Management Studies, 35(4), 481-509.
Ould, M. A. (2003). Preconditions for putting processes back in the hands of their actors. Information and Software Technology, Special Issue on Modelling Organisational Processes, 45(15), 1071-1074.
Paas, F. G. W. C., Renkl, A., & Sweller, J. (2003). Cognitive Load Theory and Instructional Design: Recent Developments. Educational Psychologist, 38(1), 1-4.
Paas, F. G. W. C., Tuovinen, J. E., Tabbers, H., & Van Gerven, P. W. M. (2003). Cognitive Load Measurement as a Means to Advance Cognitive Load Theory. Educational Psychologist, 38(1), 63-71.
Paas, F. G. W. C., & Van Merrienboer, J. J. G. (1994). Variability of Worked Examples and Transfer of Geometrical Problem-Solving Skills: A Cognitive-Load Approach. Journal of Educational Psychology, 86(1), 122-133.
Palmer, N. (2003). BPM 2003 Market Milestone Report (No. 20031023-BPM). Boston, MA Delphi Group.
Palmer, N. (2005). BPM 2005 Market Milestone Report. Boston: Delphi Group - A Perot Systems Company.

Bret R. Swan References
Page 244 of 420
Patterson, C. M., & Newman, J. P. (1993). Reflectivity and Learning from Aversive Events - toward a Psychological Mechanism for the Syndromes of Disinhibition. Psychological Review, 100(4), 716-736.
Pearson, D. W., Albert, P., Besombes, B., Boudarel, M. R., Marcon, E., & Mnemoi, G. (2002). Modelling enterprise networks: A master equation approach. European Journal of Operational Research, 138(3), 670.
Pedhazur, E., J., & Schmelkin, L. P. (1991). Measurement, Design, and Analysis: An Integrated Approach. Hillsdale, NJ: Lawrence Erlbaum Associates, Inc.
Perry, M. (2003). Distributed Cognition. In J. M. Carroll (Ed.), HCI models, theories, and frameworks: toward a multidisciplinary science (pp. 193-223). Amsterdam ; Boston: Morgan Kaufmann.
Petri, C. A. (1962). Kommunikation mit Automaten. Bonn (in German): Springer
Piaget, J. (1983). Piaget's theory. In P. Mussen (Ed.), Handbook of Child Psychology (4th ed., Vol. 1). New York: Wiley.
Pittenger, D. J. (1993). The Utility of the Myers-Briggs Type Indicator. Review of Educational Research, 63(4), 467-488.
Postrel, S. (2002). Islands of shared knowledge: Specialization and mutual understanding in problem-solving teams. Organization Science, 13(3), 303.
Ramesh, B., & Tiwana, A. (1999). Supporting collaborative process knowledge management in new product development teams. Decision Support Systems, 27(1-2), 213-235.
Reinig, B. A. (2003). Toward an understanding of satisfaction with the process and outcomes of teamwork. Journal of Management Information Systems, 19(4), 65.
Rencher, A. C. (2001). Methods of Multivariate Analysis (2nd ed.). New York: John Wiley & Sons, Inc.
Rogers, Y. (1997). A brief Introduction to distributed cognition Unpublished manuscript, Brighton, UK.
Rose, C. L., Murphy, L. B., Byard, L., & Nikzad, K. (2002). The role of the big five personality factors in vigilance performance and workload. European Journal of Personality, 16(3), 185-200.
Rosson, M. B. (1996). Human factors in programming and software development. ACM Computing Surveys, 28(1), 193-195.
Rubio, S., Díaz, E., Martín, J., & Puente, J. M. (2004). Evaluation of Subjective Mental Workload: A Comparison of SWAT, NASA-TLX, and Workload Profile Methods. Applied Psychology An International Review, 53(1), 61-86.
Ryan, S. D., Bordoloi, B., & Harrison, D. A. (2000). Acquiring conceptual data modeling skills: the effect of cooperative learning and self-efficacy on learning outcomes. 31(4), 9-24.
Sadler-Smith, E. (2001). The relationship between learning style and cognitive style. Personality and Individual Differences, 30(4), 609-616.
Saggino, A., Cooper, C., & Kline, P. (2001). A confirmatory factor analysis of the Myers-Briggs type indicator. Personality and Individual Differences, 30(1), 3-9.
Salas, E., & Cannon-Bowers, J. A. (2001). Shared cognition - Special issue preface. Journal of Organizational Behavior, 22, 87-88.

Bret R. Swan References
Page 245 of 420
Salgado, J. F., Anderson, N., Moscoso, S., Bertua, C., de Fruyt, F., & Rolland, J. P. (2003). A Meta-Analytic Study of General Mental Ability Validity for Different Occupations in the European Community. Journal of Applied Psychology 88(6), 1068-1081.
Sampler, J. L., & Short, J. E. (1998). Strategy in dynamic information-intensive environments. Journal of Management Studies, 35(4), 429-436.
Satzinger, J. W. (1998). The effects of conceptual consistency on the end user’s mental models of multiple applications. Journal of End User Computing, 10(3), 3-14.
Schael, T. (1998). Workflow management systems for process organizations (2nd ed.). Berlin: Springer.
Schmidt, F. L. (2002). The role of general cognitive ability and job performance: Why there cannot be a debate. Human Performance, 15(1-2), 187-210.
Schmidt, F. L., & Hunter, J. (2004). General Mental Ability in the World of Work: Occupational Attainment and Job Performance. Journal of Personality & Social Psychology, 86(1), 162-173.
Schneiderman, B., Mayer, R., McKay, D., & Heller, P. (1977). Experimental Investigations of the Utility of Detailed Flowcharts in Programming. Communications of the ACM, 20(6), 373-381.
Serve, M., Yen, D. C., Wang, J.-C., & Lin, B. (2002). B2B-enhanced supply chain process: Toward building virtual enterprises. Business Process Management Journal, 8(3), 245.
Shanteau, J., Weiss, D. J., Thomas, R. P., & Pounds, J. C. (2002). Performance-based assessment of expertise: How to decide if someone is an expert or not. European Journal of Operational Research, 136(2), 253-263.
Shayo, C., Olfman, L., & Teitelroit, R. (1999). An exploratory study of the value of pretraining end-user participation. Information Systems Journal, 9(1), 55-79.
Sheil, B. A. (1981). The psychological study of programming. ACM Computing Surveys, 13(1), 101-120.
Sheth, A. P., van der Aalst, W., & Arpinar, I. B. (1999). Processes driving the networked economy. IEEE Concurrency, 7(3), 31.
Shieh, G. (2003). A comparative study of power and sample size calculations for multivariate general linear models. Multivariate Behavioral Research, 38, 285-307.
Shoval, P., Danoch, R., & Balabam, M. (2004). Hierarchical entity-relationship diagrams: the model, method of creation and experimental evaluation. Requirements Engineering, 9(4), 217-228.
Sinha, A. P., & Vessey, I. (1992). Cognitive Fit - an Empirical-Study of Recursion and Iteration. IEEE Transactions on Software Engineering, 18(5), 368-379.
Smith, H., & Fingar, P. (2003). Business process management: the third wave (1st ed.). Tampa, Fla.: Meghan-Kiffer Press.
Soloway, E., Ehrlich, K., & Bonar, J. (1982). Tapping into tacit programming knowledge. Paper presented at the Proceedings of the conference on human factors in computing systems, Gaithersburg, Maryland, United States.
Staples, D. S., Hulland, J. S., & Higgins, C. A. (1999). A self-efficacy theory explanation for the management of remote workers in virtual organizations. Organization Science, 10(6), 758-776.
Bret R. Swan References
Page 246 of 420
Sternberg, R. J., & Grigorenko, E. L. (1997). Are Cognitive Styles Still in Style? American Psychologist, 52(7), 700-712.
Strickland, B. B. (2001a). The Gale encyclopedia of psychology (2nd ed.). Detroit, MI: Gale Group.
Strickland, B. B. (2001b). Information-Processing Theory. In Gale Encyclopedia of Psychology (2nd ed.): Thomson Gale.
Suchman, L. A. (1987). Plans and situated actions: the problem of human-machine communication. Cambridge [Cambridgeshire]; New York: Cambridge University Press.
Susi, T., & Ziemke, T. (2001). Social cognition, artefacts, and stigmergy: A comparative analysis of theoretical frameworks for the understanding of artefact-mediated collaborative activity. Cognitive Systems Research, 2(4), 273-290.
Sutton, S. K., & Davidson, R. J. (1997). Prefrontal brain asymmetry: A biological substrate of the behavioral approach and inhibition systems. Psychological Science, 8(3), 204-210.
Teigen, K. H. (1994). Yerkes-Dodson: A law for all seasons. Theory & Psychology, 4(4), 525-547.
Tischler, L. (1994). The MBTI factor structure. Journal of Psychological Type, 31, 24-31.
Turban, E., King, D., Lee, J., Warkentin, M., & Chung, H. M. (2002). Electronic Commerce: A Managerial Perspective (2nd ed.). Upper Saddle River, NJ 07458: Prentice-Hall.
Tzeng, O. C. S., Outcalt, D., Boyer, S. L., Ware, R., & Landis, D. (1984). Item Validity of the Myers-Briggs Type Indicator. Journal of Personality Assessment, 48(3), 255-256.
Umanath, N. S., & Vessey, I. (1994). Multiattribute Data Presentation and Human Judgment - a Cognitive Fit Perspective. Decision Sciences, 25(5-6), 795-824.
Vacha-Haase, T., & Thompson, B. (2002). Alternative ways of measuring counselees' Jungian psychological-type preferences. Journal of Counseling and Development, 80(2), 173-179.
Valcke, M. M. A., & Dochy, F. J. R. C. (1992). Knowledge Profiles of Students with Low and High Prior Knowledge States (143 Reports--Research No. OTIC-RR-35). Netherlands: Open Univ., Heerlen (Netherlands). Centre for Educational Technological Innovation.
van der Aalst, W. M. P. (1994). Putting high-level Petri nets to work in industry. Computers in Industry, 25(1), 45-54.
van der Aalst, W. M. P. (2000). Loosely coupled interorganizational workflows: modeling and analyzing workflows crossing organizational boundaries. Information & Management, 37(2), 67-75.
van der Aalst, W. M. P. (2004). Business process management demystified: A tutorial on models, systems and standards for workflow management. In J. Desel, W. Reisig & G. Rozenberg (Eds.), Lectures on Concurrency and Petri Nets (Vol. 3098, pp. 1-65). Berlin: Springer-Verlag.
van der Aalst, W. M. P., Desel, J., & Oberweis, A. (2000). Business process management: models, techniques, and empirical studies: Springer.
van der Aalst, W. M. P., ter Hofstede, A. H. M., & Weske, M. (2003, June 26-27). Business process management: A survey. Paper presented at the Proceedings of the International Conference on Business Process Management (BPM 2003), Eindhoven, the Netherlands.

Bret R. Swan References
Page 247 of 420
van Duijn, M., Keijzer, F., & Franken, D. (2006). Principles of minimal cognition: Casting cognition as sensorimotor coordination. Adaptive Behavior, 14(2), 157–170.
van Gerven, P. W. M., Paas, F. G. W. C., van Merrienboer, J. J. G., & Schmidt, H. G. (2002). Cognitive Load Theory and Aging: Effects of Worked Examples on Training Efficiency. Learning and Instruction, 12(1), 87-105.
van Merrienboer, J. J. G., Kirschner, P. A., & Kester, L. (2003). Taking the Load Off a Learner's Mind: Instructional Design for Complex Learning. Educational Psychologist, 38(1), 5-13.
van Merrienboer, J. J. G., Schuurman, J. G., de Croock, M. B. M., & Paas, F. G. W. C. (2002). Redirecting Learners' Attention during Training: Effects on Cognitive Load, Transfer Test Performance and Training Efficiency. Learning and Instruction, 12(1), 11-37.
Van Roon, A. M., Mulder, L. J. M., Althaus, M., & Mulder, G. (2004). Introducing a baroreflex model for studying cardiovascular effects of mental workload. Psychophysiology, 41(6), 961-981.
Varela, F. J., Thompson, E., & Rosh, E. (1999). The embodied mind: Cognitive science and human experience. Cambridge, MA: MIT Press.
Vernadat, F. B. (1996). Enterprise modeling and integration: principles and applications. London ; New York: Chapman & Hall.
Vernadat, F. B. (2002a). Enterprise modeling and integration (EMI): Current status and research perspectives. Annual Reviews in Control, 26(1), 15-25.
Vernadat, F. B. (2002b). UEML: towards a unified enterprise modelling language. International Journal of Production Research, 40(17), 4309-4321.
Vessey, I. (1991). Cognitive Fit - a Theory-Based Analysis of the Graphs Versus Tables Literature. Decision Sciences, 22(2), 219-240.
Vitense, H. S., Jacko, J. A., & Emery, V. K. (2003). Multimodal feedback: an assessment of performance and mental workload. Ergonomics, 46(1-3), 68-87.
Wagter, R. (2005). Dynamic enterprise architecture: how to make it work. Hoboken, N.J.: J. Wiley.
Wand, Y., & Weber, R. (1993). On the ontological expressiveness of information systems analysis and design grammars. Journal of Information Systems, 3(3), 217-237.
Wand, Y., & Weber, R. (2002). Research commentary: Information systems and conceptual modeling - A research agenda. Information Systems Research, 13(4), 363-376.
Warm, J. S., Dember, W. N., & Hancock, P. A. (1996). Vigilance and workload in automated systems. In R. Parasuraman & M. Mouloua (Eds.), Automation and Human Performance: Theory and Applications (pp. 183-200). Mahwah, N.J.: Lawrence Erlbaum Associates.
Wensley, A. (2003). Business process management revisited. Knowledge and Process Management, 10(4), 217.
Weske, M., van der Aalst, W. M. P., & Verbeek, H. M. W. (2004). Advances in business process management. Data & Knowledge Engineering, 50(1), 1-8.
Wheeler, P., Jessup, C., & Martinez, M. (2002). The Keirsey Temperament Sorter: Investigating the impact of personality traits in accounting. Advances in Accounting Behavioral Research, 247-277.

Bret R. Swan References
Page 248 of 420
Wickens, C. D. (1992). Engineering psychology and human performance (2nd ed.). New York, NY: HarperCollins Publishers.
Wickens, C. D., & Carswell, C. M. (1995). The proximity compatibility principle: its psychological foundation and relevance to display design. Human Factors, 37(3), 473-494.
Wilson, G. F., & Russell, C. A. (2003). Real-time assessment of mental workload using psychophysiological measures and artificial neural networks. Human Factors, 45(4), 635-643.
Winer, B. J., Brown, D. R., & Michels, K. M. (1991). Statistical principles in experimental design (3rd ed.). New York: McGraw-Hill.
Winslow, L. E. (1996). Programming Pedagogy -- A Psychological Overview. SIGCSE Bulletin, 28(3), 17-22.
Winsor, D. A. (2001). Learning to do knowledge work in systems of distributed cognition. Journal of Business and Technical Communication, 15(1), 5-28.
Winton, W. M. (1987). Do introductory textbooks present the Yerkes-Dodson Law correctly? American Psychologist, 42(2), 202-203.
Wohed, P., van der Aalst, W. M. P., Dumas, M., ter Hofstede, A. H. M., & Russell, N. (2004). Pattern-based Analysis of UML Activity Diagrams (No. WP 129). Eindhoven: Eindhoven University of Technology.
Wolf, C., & Harmon, P. (2006). The State of Business Process Management (Report): Business Process Trends.
Woltz, D. J. (2003). Implicit cognitive processes as aptitudes for learning. Educational Psychologist, 38(2), 95-104.
Woltz, D. J., Gardner, M. K., & Gyll, S. P. (2001). The role of attention processes in near transfer of cognitive skills. Learning and Individual Differences, 12(3), 209-251.
Wood, R. E., Atkins, P., & Tabernero, C. (2000). Self-efficacy and strategy on complex tasks. Applied Psychology-an International Review-Psychologie Appliquee-Revue Internationale, 49(3), 430-446.
Wood, R. E., & Bandura, A. (1989). Social Cognitive Theory of Organizational Management. Academy of Management Review, 14(3), 361-384.
Woodcock, R. W. (1990). Theoretical Foundations of the Wj-R Measures of Cognitive-Ability. Journal of Psychoeducational Assessment, 8(3), 231-258.
Woodcock, R. W. (2002). New Looks in the Assessment of Cognitive Ability. Peabody Journal of Education, 77(2), 6-22.
Wright, P. C., Fields, R. E., & Harrison, M. D. (2000). Analyzing human-computer interaction as distributed cognition: The resources model. Human-Computer Interaction, 15(1), 1-41.
Yanchar, R. J. (1984). Hypnotic susceptibility and its relation to selective and divided attention. Paper presented at the Meeting of the Society for Clinical and Experimental Hypnosis, San Antonio, TX.
Yerkes, R. M., & Dodson, J. D. (1908). The relation of strength of stimulus to rapidity of habit-formation. Journal of Comparative Neurology and Psychology, 18, 459-482.

Bret R. Swan References
Page 249 of 420
Yeung, A. S., Lee, C. F. K., Pena, I. M., & Ryde, J. (2000, January 4-8). Toward a Subjective Mental Workload Measure. Paper presented at the International Congress for School Effectiveness and Improvement, Hong Kong, China.
Zachman, J. A. (1999). A framework for information systems architecture. IBM Systems Journal, 38(2-3), 454-470.
Zelm, M., Vernadat, F. B., & Kosanke, K. (1995). The CIMOSA business modelling process. Computers in Industry, 27(2), 142.
Zhang, J. (1996a). External representations in complex information processing tasks. In A. Kent, H. Lancour, W. Z. Nasri & J. E. Daily (Eds.), Encyclopedia of Library and Information Science. New York: Marcel Dekker, Inc.
Zhang, J. (1996b). A representational analysis of relational information displays. International Journal of Human-Computer Studies, 45(1), 59-74.
Zhang, J. (1997). The nature of external representations in problem solving. Cognitive Science, 21(2), 179-217.
Zhang, J., & Norman, D. A. (1994). Representations in distributed cognitive tasks. Cognitive Science, 18(1), 87-122.
zur Muehlen, M. (2004a). Organizational Management in Workflow Applications Issues and Perspectives. Information Technology and Management, 5(3-4), 271-291.
zur Muehlen, M. (2004b). What are Workflow and Business Process Management?, from http://www.workflow-research.de/Research/index.html
zur Muehlen, M. (2004c). Workflow-based Process Controlling. Foundation, Design, and Application of workflow-driven Process Information Systems. Berlin: Logos Verlag.

Bret R. Swan References
Page 250 of 420

Bret R. Swan Appendix
APPENDIX
A INSTITUTIONAL REVIEW BOARD (IRB) DOCUMENTS................................................ 254 A.1 INSTITUTIONAL REVIEW BOARD (IRB) APPROVAL DOCUMENTS........................ 254 A.2 INSTITUTIONAL REVIEW BOARD (IRB) PARTICIPANT DOCUMENTS................... 256
B PILOT STUDY: PARTICIPANT SCRIPTS & HANDOUTS................................................ 258 B.1 PILOT TRAINING TASK SCRIPTS...................................................................................... 258 B.2 PILOT TRAINING TASK DESCRIPTION – BANK LOAN APPROVAL PROCESS...... 260 B.3 PILOT EXPERIMENTAL TASK SCRIPTS .......................................................................... 263
C UML GRAPHICAL PROCESS MODELS: USED FOR THE PILOT STUDY TRAINING TASK & USED FOR THE EXPERIMENTAL TASK IN THE ACTUAL STUDY ........................................................................................................................................... 267
C.1 TASK-CENTRIC UML DIAGRAM....................................................................................... 267 C.2 RESOURCE-CENTRIC UML DIAGRAM............................................................................ 268 C.3 INFORMATION-CENTRIC UML DIAGRAM..................................................................... 269
D METAGRAPH GRAPHICAL PROCESS MODELS: USED FOR THE PILOT STUDY TRAINING TASK & USED FOR THE EXPERIMENTAL TASK IN THE ACTUAL STUDY ........................................................................................................................................... 270
D.1 TASK-CENTRIC METAGRAPH DIAGRAM ...................................................................... 270 D.2 RESOURCE-CENTRIC METAGRAPH DIAGRAM ........................................................... 271 D.3 INFORMATION-CENTRIC METAGRAPH DIAGRAM .................................................. 272
E EXPERIMENT UML GRAPHICAL PROCESS MODELS USED IN THE PILOT STUDY ........................................................................................................................................... 273
E.1 PILOT EXPERIMENT TASK-CENTRIC UML DIAGRAM............................................... 273 E.2 PILOT EXPERIMENT RESOURCE-CENTRIC UML DIAGRAM .................................... 274 E.3 PILOT EXPERIMENT INFORMATION-CENTRIC UML DIAGRAM............................. 275
F EXPERIMENT METAGRAPH GRAPHICAL PROCESS MODELS USED IN THE PILOT STUDY.............................................................................................................................. 276
F.1 PILOT EXPERIMENT TASK-CENTRIC METAGRAPH DIAGRAM............................... 276 F.2 PILOT EXPERIMENT RESOURCE-CENTRIC METAGRAPH DIAGRAM.................... 277 F.3 PILOT EXPERIMENT INFORMATION-CENTRIC METAGRAPH DIAGRAM............. 278
G PILOT STUDY PROCEDURES ................................................................................................ 279
H PILOT STUDY FINDINGS......................................................................................................... 281 H.1 GPM SIZE AND LAB WORKSTATIONS ISSUES ............................................................. 281 H.2 COMPUTER VS. PAPER ASSESSMENT ISSUES.............................................................. 282 H.3 TIMELINESS DATA COLLECTION ISSUES ..................................................................... 282 H.4 TRAINING AND EXPERIMENTAL TASK COMPLEXITY ISSUES............................... 282 H.5 SELF-DIRECTED VS. FACILITATOR-LED TRAINING ISSUES.................................... 283 H.6 ASSESSMENT INSTRUMENT ISSUES............................................................................... 284
Page 251 of 420

Bret R. Swan Appendix
I ACTUAL EXPERIMENT PARTICIPANT SCRIPTS & HANDOUTS .............................. 286 I.1 TRAINING OVERVIEW HANDOUT................................................................................... 286 I.2 UML DIAGRAM FREQUENTLY ASKED QUESTIONS (FAQ) HANDOUT.................. 289 I.3 METAGRAPH DIAGRAM FREQUENTLY ASKED QUESTIONS (FAQ) HANDOUT . 293 I.4 TRAINING TASK ASSESSMENT PACKET – UML DIAGRAM USER.......................... 296 I.5 TRAINING TASK ASSESSMENT PACKET – METAGRAPH USER .............................. 307 I.6 EXPERIMENTAL TASK SCRIPTS - INTRODUCTION .................................................... 318 I.7 EXPERIMENTAL TASK DESCRIPTION – BANK LOAN APPLICATION BPM .......... 320 I.8 EXPERIMENT TASK ASSESSMENT PACKET – BOTH UML & METAGRAPH
USER......................................................................................................................................... 323
J TRAINING TASK UML GRAPHICAL PROCESS MODELS USED IN THE EXPERIMENT ............................................................................................................................. 342
J.1 TRAINING TASK: TASK-CENTRIC UML PRACTICE DIAGRAMS.............................. 342 J.2 TRAINING TASK: RESOURCE-CENTRIC UML PRACTICE DIAGRAMS ................... 343 J.3 TRAINING TASK: INFORMATION-CENTRIC UML PRACTICE DIAGRAMS............ 344
K TRAINING TASK METAGRAPH GRAPHICAL PROCESS MODELS USED IN THE EXPERIMENT ............................................................................................................................. 345
K.1 TRAINING TASK: TASK-CENTRIC METAGRAPH PRACTICE DIAGRAMS ............. 345 K.2 TRAINING TASK: RESOURCE-CENTRIC METAGRAPH PRACTICE DIAGRAMS... 346 K.3 TRAINING TASK: INFORMATION-CENTRIC METAGRAPH PRACTICE
DIAGRAMS ............................................................................................................................. 347
L DATA COLLECTION INSTRUMENTS.................................................................................. 348 L.1 UNIVERSITY A: DEMOGRAPHIC & PRIOR EXPERIENCE QUESTIONNAIRE......... 348 L.2 UNIVERSITY B: DEMOGRAPHIC & PRIOR EXPERIENCE QUESTIONNAIRE......... 352 L.3 TASK ACCURACY QUESTIONNAIRE .............................................................................. 358 L.4 TASK TIMELINESS ............................................................................................................... 367 L.5 NASA TASK-LOAD INDEX (TLX)...................................................................................... 368 L.6 WONDERLIC PERSONNEL TEST....................................................................................... 372 L.7 DIFFERENTIAL ATTENTIONAL PROCESSES INVENTORY (DAPI)........................... 374 L.8 MYERS-BRIGGS TYPE INDICATOR.................................................................................. 377 L.9 GPM SELF-EFFICACY INSTRUMENT............................................................................... 377
M PRELIMINARY DATA ANALYSIS METHODS................................................................... 378 M.1 INTERVAL DATA AND RANDOM SAMPLING............................................................... 378 M.2 NORMALITY .......................................................................................................................... 379 M.3 HOMOGENEITY OF VARIANCE ........................................................................................ 379 M.4 TESTS OF INDEPENDENCE ................................................................................................ 380 M.5 SCALE RELIABILITY ANALYSIS OF THE DIFFERENTIAL ATTENTIONAL
PROCESSES INVENTORY.................................................................................................... 384 M.6 EVALUATION OF THE BALANCE OF PARTICIPANT COGNITIVE STYLES IN
TREATMENT GROUPS......................................................................................................... 384
Page 252 of 420

Bret R. Swan Appendix
N PRELIMINARY ANALYSES OF THE DATASET................................................................ 385 N.1 NORMALITY .......................................................................................................................... 385 N.2 POST HOC STATISTICAL POWER ANALYSES............................................................... 387 N.3 HOMOGENEITY OF VARIANCE AND COVARIANCE .................................................. 395 N.4 TESTS OF INDEPENDENCE ................................................................................................ 396 N.5 RELIABILITY ANALYSES OF THE DIFFERENTIAL ATTENTIONAL PROCESSES
INVENTORY ........................................................................................................................... 397 N.6 EVALUATION OF THE BALANCE OF PARTICIPANT COGNITIVE STYLES IN
TREATMENT GROUPS......................................................................................................... 399
O EXPLORATORY DATA ANALYSES...................................................................................... 403 O.1 EXPLORATORY FACTOR ANALYSIS OF SUBJECTIVE MENTAL WORKLOAD.... 403 O.2 COVARIATE EFFECTS OF GENERAL COGNITIVE ABILITIES................................... 407 O.3 ATTENTIONAL ABILITIES COVARIATE EFFECTS....................................................... 408 O.4 COGNITIVE STYLE COVARIATE EFFECTS .................................................................... 409 O.5 CORRELATIONS OF KEY DEMOGRAPHICS................................................................... 409 O.6 ENGLISH AS PARTICIPANTS’ FIRST LANGUAGE........................................................ 411 O.7 UNIVERSITY OF PARTICIPANTS ...................................................................................... 414 O.8 GENDER OF PARTICIPANTS .............................................................................................. 416 O.9 AGE OF PARTICIPANTS ...................................................................................................... 417 O.10 FACTOR ANALYSIS OF GPM SELF-EFFICACY.............................................................. 418
Page 253 of 420

Bret R. Swan Appendix
A INSTITUTIONAL REVIEW BOARD (IRB) DOCUMENTS
A.1 INSTITUTIONAL REVIEW BOARD (IRB) APPROVAL DOCUMENTS
Page 254 of 420

Bret R. Swan Appendix
Page 255 of 420

Bret R. Swan Appendix
A.2 INSTITUTIONAL REVIEW BOARD (IRB) PARTICIPANT DOCUMENTS
Informed Consent for Participants of Investigative Projects Grado Department of Industrial and Systems Engineering
Virginia Tech TITLE: The Effects of Graphical Process Models on Business Process Management
Task Outcomes INVESTIGATORS: Eileen M. Van Aken, Ph.D. and Bret Swan PURPOSE
The objective of this study is to evaluate factors affecting the ease, accuracy, and time it takes participants to interpret different types of graphical process models that portray business process management (BPM) information. PROCEDURE
If you choose to participate in this study, you will be asked to do the following:
Complete pretest assessments of your personal preferences for understanding information, your ability to focus your attention, your general cognitive abilities, and your educational background related to this study.
Complete a short training to give you a basic understanding of one type of graphical process model.
Complete four short questionnaires assessing how well you understanding of BPM information portrayed by a single type of graphical process model.
The estimated amount of time required for each student to participate in the study will total approximately 3 hours: about 1-2 hours to complete the pretest assessments (on their own time before the actual lab experiment) and between 30 and 60 minutes for the training and experimental tasks in the lab itself.
If you choose to participate, you will be given a set of pretest assessments to fill out at your own leisure before a given date. You will then be asked to sign up for a single block of time to complete both the training and experimental tasks. At the end of the experiment, your performance on the experimental tasks will be evaluated in terms of both accuracy and timeliness.
RISKS OF PARTICIPATION The risk involved with this study only includes those associated with normal use of a
computer.
BENEFITS and COMPENSATION After the study is completed, you will receive a personal profile of your scores and what
they mean from your MBTI, Wonderlic, and DAPI assessments. Additionally, you will have the opportunity to win one of two gift certificates. The
participant with the best overall experimental task score (calculated by combining both your task accuracy and task timeliness results into a single score) will receive a $200 gift certificate to the business of your choice. In addition, the participant with the best overall score from each academic
Page 256 of 420

Bret R. Swan Appendix
discipline (industrial engineering courses, computer science courses, and management courses) will receive a $100 gift certificate.
ANONYMITY AND CONFIDENTIALITY The data from this study will be kept strictly confidential. No data will be released to anyone but the principal investigator and graduate students involved in the project without written consent of the subject. Data will be identified by participant ID number.
FREEDOM TO WITHDRAW You are free to withdraw at any time from the study for any reason. Circumstances may come up that the researcher will determine that you should not continue as a subject in the study. For example, an illness, computer failure, or responses on your questionnaire that do not meet the criteria for selection for participation could be reasons to have the researchers stop your participation in the study. APPROVAL OF RESEARCH This research has been approved, as required, by the Institutional Review Board for Research Involving Human Subjects at Virginia Tech, and by the Grado Department of Industrial and Systems Engineering. You will receive a copy of this form to take with you. SUBJECT PERMISSION I have read the informed consent and fully understand the procedures and conditions of the project. I have had all my questions answered, and I hereby give my voluntary consent to be a participant in this research study. I agree to abide by the rules of the project. I understand that I may withdraw from the study at any time. If I have questions, I will contact:
• Principal Investigator: Bret Swan, Ph.D. Candidate, Grado Department of Industrial and Systems Engineering, 230-2789 or [email protected].
• Chairman, Institutional Review Board for Research Involving Human Subjects: David Moore, 231-4991.
Signature of Participant ___________________________________________________________ Date: Signature of Project Director or his Authorized Representative: ___________________________________________________________ Date: Signature of Witness to Oral Presentation: ___________________________________________________________ Date:
Page 257 of 420
Bret R. Swan Appendix
B PILOT STUDY: PARTICIPANT SCRIPTS & HANDOUTS
The following documents and scripts were given to participants that participate in the
experiment.
B.1 PILOT TRAINING TASK SCRIPTS
[NOTE: The following task introduction was given to participants. Brackets indicate wording that
was changed depending on the Type of Graphical Process Modeling technique participants will use
when performing the task.]
This experiment consists of two phases: a training phase and an experimental phase.
During the training phase, you will be given instruction and allowed to practice interpreting
simplified diagrams of a business process. During the experimental phase, you will apply what you
have learned to the interpretation of diagrams that represent a real-world business process.
Training Phase:
In order to train you in how to interpret *[this type] of graphical process model, you will
play the role of a new manager in a bank that is trying to understand your bank’s loan application
process. This business process takes the completed loan application of the customer and performs
several tasks that use different types of resources and information, to determine whether an
application for a loan is to be accepted or rejected. You have been asked to read and interpret three
different graphical process models that depict three different views of the same loan application
process:
(a) A task-centric view of the loan application process
(b) A resource-centric view of the loan application process
(c) An information-centric view of the loan application process
Your training will proceed in this order:
Page 258 of 420

Bret R. Swan Appendix
(1) You will be presented with one of the above diagrams.
(2) You will be read the document that will explain how to read and interpret the symbols
on this diagram.
(3) You will be asked to answer some questions that allow you to practice interpreting this
type of diagram.
(4) When you have completed the short training on this diagram, you will be presented
with the 2nd type of diagram and repeat steps 2 and 3.
(5) When you have completed the practice questions for the 2nd type of diagram, you will
be presented with the 3rd type of diagram and repeat steps 2 and 3.
(6) When you have completed the practice questions for the 3rd type of diagram, you will
be asked to answer practice questions about how the 1st, 2nd, and 3rd diagrams interact.
You will only be allowed to proceed to step 7 when you have answer all the practice
questions correctly.
(7) When you have completed step 6, you will be asked to fill out a survey that assesses the
mental effort you had to apply to this training exercise.
(8) Once step 7 is completed, you will have completed the training and are ready to begin
the experimental phase.
The experimental phase will proceed in a similar way to the training phase, except (a) the
diagrams will be different, (b) you will be asked to answer a few more questions about each
diagram – these will be the same kinds of questions you answered in the training phase, and (c) you
will be asked to complete the mental workload questionnaire after each set of questions – instead of
only at the end as in the training phase.
REMEMBER!
During the experiment, you will win the gift certificates if you have BOTH the highest
number of correct answers AND the lowest time spent answering the questions. In other words,
you are trying to maximize how many questions you answer correctly and minimize the amount of
time you take to answer those questions.
Good Luck!!
Page 259 of 420
Bret R. Swan Appendix
B.2 PILOT TRAINING TASK DESCRIPTION – BANK LOAN APPROVAL PROCESS
Task Description: The training tasks you are based on a loan approval business process1.
You represent a manager in this company that has been asked to read and interpret graphical
process models that describe different types of BPM task information prior to attending an
important meeting to discuss this business process. The loan approval process is modeled as using
[UML, Petri net, or metagraph] diagrams. The following is a key to the abbreviations used in these
maps as follows:
• *A task is an ordered pair of reports, the first of which is an input to the task and the second of
which is its output. A task is executed when the inputs are used to determine the outputs.
*For example,
• *A resource is an entity associated with one or more tasks, and the resource must be available if
the tasks are to be executed. Several resources may be associated with a single task, and
vice versa. Resources may be people, a statement of information, software, an information
system, or a document (called an ‘abstract’) in the context of this experiment. For example,
• *An information element is an atomic data item. For example, an individual or set of numbers,
characters, words, images, or icons (as would be found in a document).
• *A process is a set of tasks that connects one set of information elements, to another set of
information elements. All inputs for any task in the process must be either in the source or
in the output of some other task(s) in the system.
There are eight tasks in the loan approval process, as follows:
T1: Credit Risk Rating - The loan officer uses account data, the applicant’s credit history,
and applicant data to calculate the applicant’s credit rating.
T2: Property Appraisal Task - The property appraiser uses data about the property along
with data about comparable properties to calculate the appraised value of the
property.
T3: Risk Assessment Task - The loan officer uses the applicant’s credit rating, the
appraised value of the property, and the loan amount to calculate the level of risk
associated with the loan. 1 adapted from Basu and Blanning (2000)
Page 260 of 420

Bret R. Swan Appendix
T4: Loan Amount Reduction Task - If the risk of the loan is determined to be a bad risk,
the branch manager uses the appraised value of the property and the level of risk
associated with the loan to calculate a new loan amount.
T5: Risk Exposure Assessment Task - The risk analyst and the property appraiser use the
appraised value of the property, the loan amount, and the current bank portfolio of
loans to calculate the bank’s current risk exposure.
T6: Acceptable Risk Assessment Task - The system examines the risk associated with the
loan and performs the calculations needed to determine whether the risk is
acceptable.
T7: The Loan is Approved - If the level of risk is acceptable, the loan officer uses the risk
associated with the loan and the bank’s risk exposure to decide whether to approve
the loan.
T8: The Loan is Rejected - If the loan application represents a bad risk, the loan officer
rejects the application.
There are six resources used in the loan application process:
• R1: a property appraiser;
• R2: the branch manager;
• R3: a loan officer;
• R4: a risk analyst;
• R10: a completed loan application from a customer;
• R11: an automated bank information system;
Page 261 of 420

Bret R. Swan Appendix
Finally, there are information elements in the loan approval process:
• IE1: account data of the applicant;
• IE2: applicant data from the loan application;
• IE3: credit history of the applicant;
• IE4: data about the property for which the loan is sought;
• IE5: data about comparable properties;
• IE6: applicant’s credit rating;
• IE7: the amount of the loan;
• IE8: the appraised value of the property;
• IE9: the current bank portfolio of loans;
• IE10: the bank’s level of acceptable risk;
• IE11: the level of risk associated with the loan;
• IE12: the bank’s current risk exposure;
• IE13: a statement that the application is approved;
• IE14: a statement that the application is rejected.
Page 262 of 420

Bret R. Swan Appendix
B.3 PILOT EXPERIMENTAL TASK SCRIPTS
Introduction to the Experimental Tasks
Now that training is completed, you will be asked to follow a similar procedure to complete
the experimental tasks.
For this experiment, consider the example of a business process that determines the daily
status of a billing monitoring control points that are required to fulfill Sarbanes-Oxley (SOX)
compliance.
Experimental Task Description – A Sarbanes-Oxley Business Process
Sarbanes-Oxley (SOX) laws are a set of recent federal regulations that mandate the
auditability of business accounting and operational processes, in order to avoid the types of scandals
and company failures that occurred recently in companies such as Enron and WorldCom.
You work for a company that prepares bills and records payments for millions of customers
per month. Currently, your organization complies with Sarbanes-Oxley federal laws using very a
labor intensive process. Your company is beginning the process of preparing to implement a SOX
Business Process Management (BPM) information system. In order to implement this new
information system, the SOX business process must be diagrammed using graphical process models
and then managers with specific functional expertise across the organization must verify that the
models are correct. You represent one of these managers that will participate in the development
and implementation of the new SOX BPM information system.
Your Assignment
Your current assignment is to understand the daily SOX business process as part of your
responsibilities on the BPM system development team. You have been asked to review and
interpret graphical process models that describe the SOX business process your company uses prior
to an important meeting in which you will assist other managers in providing feedback on the
development of the new SOX BPM information system.
Your normal duties do not include performance of this process; therefore, you are not
expected to have any prior knowledge of the SOX business process or its components. What's
more, this is the first time that any manager in the company has seen the process modeled in this
Page 263 of 420
Bret R. Swan Appendix
way, therefore you are not expected to have any previous expertise with reading and interpreting
these graphical models that describe the company’s SOX business process.
Background on the SOX Business Process
The SOX business process is performed and completed daily. A SOX manager begins the
process each day by saving a blank copy of the SOX Billing Process Monitoring (BPM) template
using Adobe Acrobat. The current day’s date is added to the current day’s unsigned, unlocked SOX
BPM document (see Table B-1 below).
There are four control points that this manager must reconcile and report on the status each
day. The manager opens the reports associated with each control point and checks values within
these reports to see if the values match. If the values match, the manager records on the SOX BPM
template that they reconcile and moves on to another control point.
If the values do not match, or if the reports are not available, the manager opens a ticket in
the Issue Tracker system and records the problem. He or she then seeks to resolve the issue. If the
issue is resolved and the values on the reports reconcile, the manager records the resolution in the
Issue Tracking system, closes the issue, records the Issue Tracking identification number on the
SOX BPM document, records the issue as reconciled on the SOX BPM template, and then moves to
reconciling another control point.
If the control point cannot be reconciled within the work day, the manager records this as
an outstanding issue in the Issue Tracking system, records the Issue Tracking identification number
on the SOX BPM document, and records the issue as not being reconciled on the SOX BPM
document. He or she also adds notes that briefly explain the issue and what has been done that day
to resolve it.
Page 264 of 420

Bret R. Swan Appendix
Table B-1. A Blank Sarbanes-Oxley Billing Process Monitoring (BPM) Document
Process Name Daily Sarbanes-Oxley (SOX) Billing Process Monitoring Control Points S01, S02, S03, and S04
Date
Who to Contact
Sarbanes-Oxley (SOX) Reference Number
What to verify daily: S01 Does the ALPHA Biller report [SOX BPM System] match the Daily Bank Files Received Report YY/MM/DD for USA Bank totals [email]?
Yes Go to next step
No Investigate Issue #:
Status
S02
Yes Go to next step
No Investigate Issue #:
Does the BETA Biller Report [SOX BPM System] match the Payment Log for BETA Billers [email]?
Status
S03 Does the DELTA Card Report [SOX BPM System] match the DELTA Biller Report [email entitled: DELTA Card Payment]?
Yes Go to next step
No Investigate Issue #:
Status
S04
End of procedure
Does the expected files column on the ECHO Primary BPM Report [SOX BPM System] match the ALPHA Biller Report [SOX BPM System]?
Yes
No Investigate Issue #:
Status
All control points can either be worked sequentially or in parallel. At the end of the day the
manager places his or her electronic signature on each control point (using Adobe Acrobat) to
certify the reconciliation status of each control point.
Once the SOX manager certifies (i.e. signs off on) all the control points, unlocked,
unsigned SOX BPM template is passed to the Center Manager for her review and signature. The
Page 265 of 420

Bret
R. Swan Appendix
Page 266 of 420
Center Manager (a) reviews the unsigned, unlocked SOX BPM document for errors and to clarify
outstanding issues, (b) makes any notes on the document that she deems necessary, and (c) uses the
Adobe Acrobat to electronically sign the document. The signed, unlocked SOX BPM document is
then locked using Adobe Acrobat security settings so that no changes can be made to the document
by others. (This is a required for SOX compliance.) The signed and locked SOX BPM document is
then placed in the appropriate folder on the SOX network drive for SOX documentation and
archiving purposes. The process starts over the next day.
Your Objective in this Experiment
The purpose of this study is to see how well you are able to interpret these depictions with
the minimal experience and training provided to you. You will be asked to answer four separate
sets of questions about three different views of the billing process:
(a) Interpret process management information using a task-centric [metagraph/UML]*
diagram.
(b) Interpret resource allocation information using a resource-centric [metagraph/ UML]*
diagram.
(c) Interpret information systems analysis information using an information-centric
[metagraph/ UML]* diagram.
Interpret interactions between the tasks, resources, and information elements portrayed on
these three [metagraph/UML]* diagrams.
You will be asked to answer questions for each section of the sections of the experiment
above (A, B, C, and D). After completing each set of questions for A, B, C, and D listed above, you
will please fill-out the questionnaire assessing the mental workload you experienced while
performing that task.
Are there any questions?
You may begin the experiment by opening to your first map and answering the associated
questions.
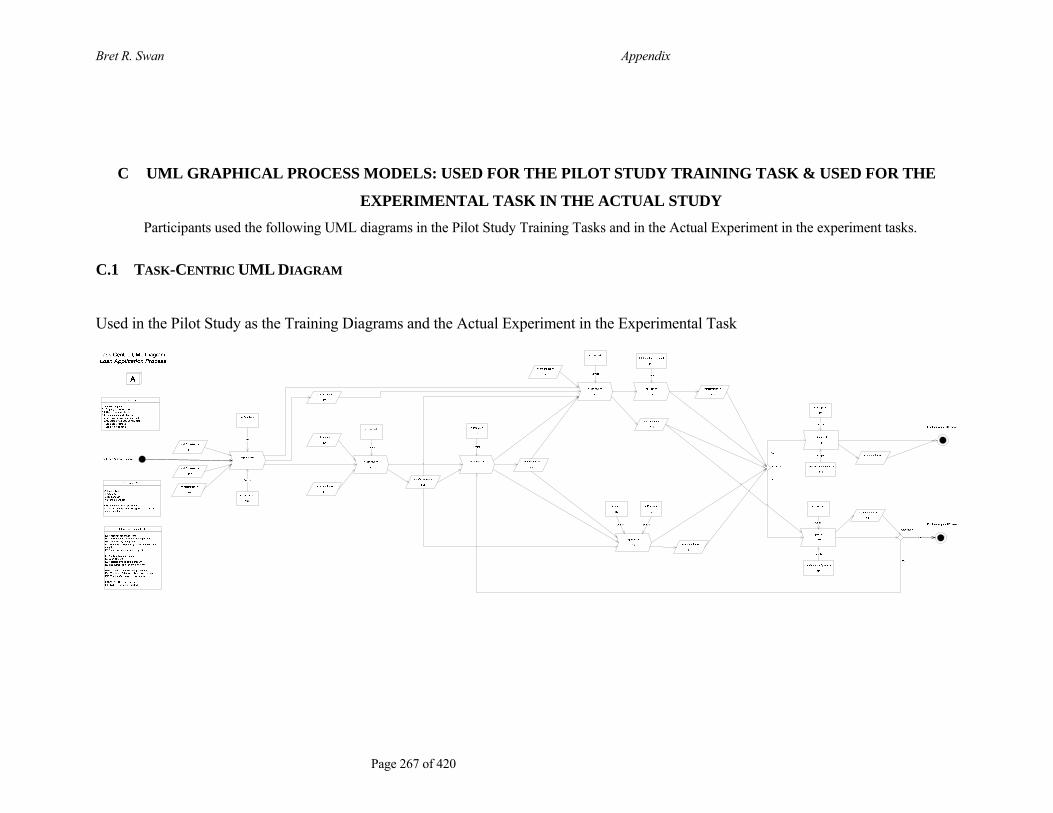
Bret R. Swan Appendix
C UML GRAPHICAL PROCESS MODELS: USED FOR THE PILOT STUDY TRAINING TASK & USED FOR THE
EXPERIMENTAL TASK IN THE ACTUAL STUDY Participants used the following UML diagrams in the Pilot Study Training Tasks and in the Actual Experiment in the experiment tasks.
C.1 TASK-CENTRIC UML DIAGRAM
Used in the Pilot Study as the Training Diagrams and the Actual Experiment in the Experimental Task
Page 267 of 420

Bret R. Swan Appendix
C.2 RESOURCE-CENTRIC UML DIAGRAM
Used in the Pilot Study as the Training Diagrams and the Actual Experiment in the Experimental Task
<<People>>
R1
<<People>>
R4
<<People>>
R2
<<People>>
R3
<<Information System>>
R11
– Resource-Centric UML Diagram –Loan Application Process
Information Elements (IE)
IE1 Account data of applicantIE2 Applicant data from the loan applicationIE3 Credit history of applicantIE4 Data about the property for which the loan is soughtIE5 Data about comparable properties
IE6 Applicant’s credit ratingIE7 Loan amountIE8 Appraised value of the propertyIE9 The current bank portfolio of loans
IE10 The bank’s level of acceptable riskIE11 The level of risk associated with the loanIE12 The bank’s current risk exposure
IE13 YES – The loan is approvedIE14 NO – The loan is rejected
Tasks (T)
T1 Credit rating taskT2 Property appraisal taskT3 Risk assessment taskT4 Loan amount reduction taskT5 Risk exposure assessment taskT6 Acceptable risk assessment taskT7 Loan approval taskT8 Loan rejection task
Resources (R)
R1 Loan officerR2 AppraiserR3 Risk analystR4 Branch manager
R10 Completed loan applicationR11 Information system storing bank account and loan information
<<Abstract>>
R101..1
1..*
Is associated with
1..1
1..*
Is associated with
1..*
1..*
Is associated with
1..*
1..1
Is associated with
B
1..1
1..*
Is associated with
1..1
1..* Is associated with
1..1
1..1
Is associated with
1..1
1..1 Is associated with
1..*
1..*Is associated with
1..1
1..*
Is associated with
1..*
1..*Is associated with
Page 268 of 420

Bret R. Swan Appendix
C.3 INFORMATION-CENTRIC UML DIAGRAM -
Used in the Pilot Study as the Training Diagrams and the Actual Experiment in the Experimental Task
Page 269 of 420

Bret R. Swan Appendix
D METAGRAPH GRAPHICAL PROCESS MODELS: USED FOR THE PILOT STUDY TRAINING TASK & USED FOR
THE EXPERIMENTAL TASK IN THE ACTUAL STUDY
Participants used the following metagraph diagrams in the Pilot Study Training Tasks and in the Actual Experiment in the experiment tasks.
D.1 TASK-CENTRIC METAGRAPH DIAGRAM
Page 270 of 420

Bret R. Swan Appendix
D.2 RESOURCE-CENTRIC METAGRAPH DIAGRAM
Page 271 of 420
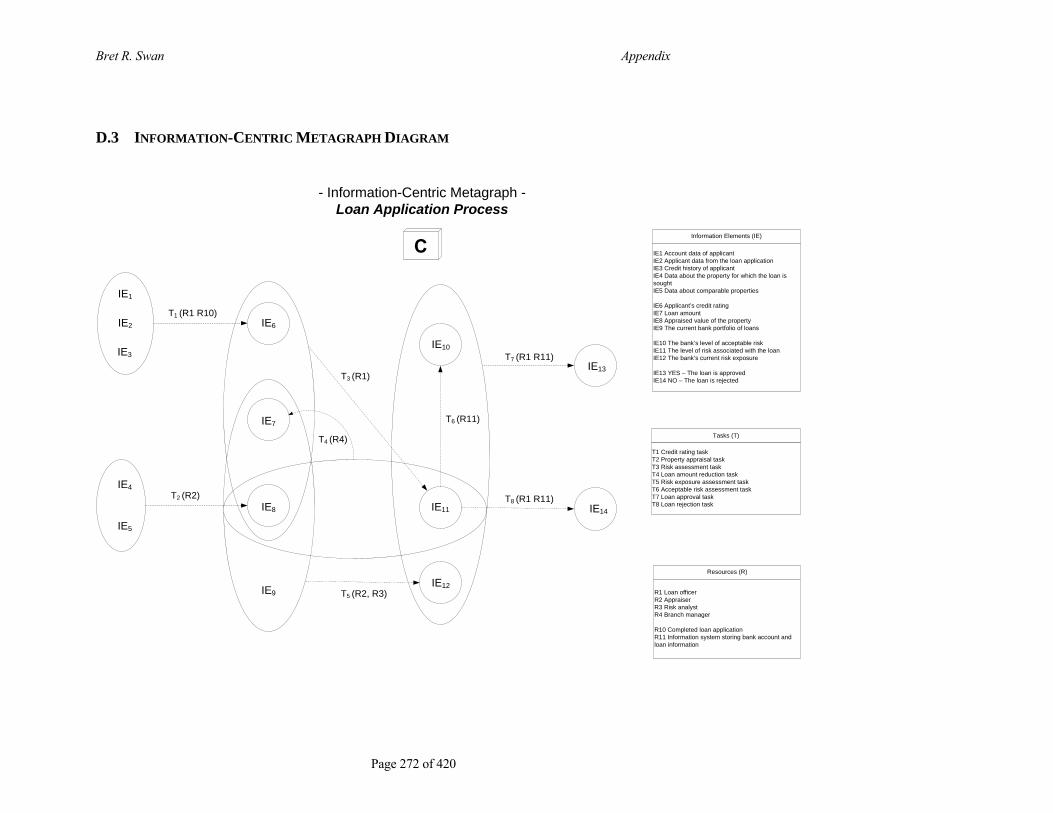
Bret R. Swan Appendix
D.3 INFORMATION-CENTRIC METAGRAPH DIAGRAM
IE12
T3 (R1)
T1 (R1 R10)
T2 (R2)
T4 (R4)
IE14
IE13
- Information-Centric Metagraph -Loan Application Process
Information Elements (IE)
IE1 Account data of applicantIE2 Applicant data from the loan applicationIE3 Credit history of applicantIE4 Data about the property for which the loan is soughtIE5 Data about comparable properties
IE6 Applicant’s credit ratingIE7 Loan amountIE8 Appraised value of the propertyIE9 The current bank portfolio of loans
IE10 The bank’s level of acceptable riskIE11 The level of risk associated with the loanIE12 The bank’s current risk exposure
IE13 YES – The loan is approvedIE14 NO – The loan is rejected
Tasks (T)
T1 Credit rating taskT2 Property appraisal taskT3 Risk assessment taskT4 Loan amount reduction taskT5 Risk exposure assessment taskT6 Acceptable risk assessment taskT7 Loan approval taskT8 Loan rejection task
IE7
IE8
IE6
IE11
IE3
IE2
IE1
IE5
IE4
IE10
T5 (R2, R3)
T6 (R11)
T7 (R1 R11)
T8 (R1 R11)
Resources (R)
R1 Loan officerR2 AppraiserR3 Risk analystR4 Branch manager
R10 Completed loan applicationR11 Information system storing bank account and loan information
IE9
C
Page 272 of 420

Bret R. Swan Appendix
E EXPERIMENT UML GRAPHICAL PROCESS MODELS USED IN THE PILOT STUDY Participants in the pilot study were asked in the experimental tasks to interpret the following UML diagrams.
E.1 PILOT EXPERIMENT TASK-CENTRIC UML DIAGRAM
<<process>>
T1
<<information>>
IE16
<<information>>
IE10
<<people>>
R2
<<process>>
T9
control
Reconciles?
No
<<process>>
T2
<<information>>
IE11
<<information>>
IE12
<<people>>
R2
<<process>>
T9
control
Reconciles?
No
<<information>>
IE7
control
<<information>>
IE7
control
<<process>>
T3
<<information>>
IE13
<<information>>
IE14
<<people>>
R2
<<process>>
T9
control
Reconciles?
No
<<information>>
IE7
control
<<process>>
T4
<<information>>
IE15
<<information>>
IE16
<<people>>
R2
<<process>>
T9
control
Reconciles?
No
<<information>>
IE7
control
Yes
Yes
Yes
Yes
Supply
Supply
Supply
Supply
<<abstract>>
IE20Supply
Start Daily SOX Audit Process
<<process>>
T12
<<people>>
R2
<<information>>
IE19
control control
Task Flows - UML 2.0(Activity Diagram)
CPOC RAMP Small Biller Payment Processing and Reconciliation (P&R)
<<abstract>>
IE0
Supply
<<information>>
IE5
<<process>>
T0
Supply
<<process>>
T6
<<information>>IE7
<<information>>
IE6
<<people>>
R2
<<information>>
IE17
controlcontrol
<<process>>
T11
<<people>>
R3
<<information>>
IE18
control control
<<Physical>>
R5
supply
<<Software>>
R1
supply
<<Software>>
R1
supply
<<Software>>
R1
supply
<<information>>IE8
<<information>>IE9
<<process>>
T5
<<information>>IE7
<<information>>
IE6
<<people>>
R2
<<information>>
IE17
controlcontrol
<<Software>>
R1
supply
<<information>>IE8
<<information>>IE9
<<process>>
T7
<<information>>IE7
<<information>>
IE6
<<people>>
R2
<<information>>
IE17
controlcontrol
<<Software>>
R1
supply
<<information>>IE8
<<information>>IE9
<<process>>
T8
<<information>>IE7
<<information>>
IE6
<<people>>
R2
<<information>>
IE17
controlcontrol
<<Software>>
R1
supply
<<information>>IE8
<<information>>IE9
<<Software>>
R1
Supply
<<people>>
R3
control
Information Elements (IE)
IE0 SOX Daily Audit Document - Template
IE1 Control Point 401 StatusIE2 Control Point 402 StatusIE3 Control Point 403 StatusIE4 Control Point 404 Status
IE5 Current Day’s DateIE6 Control Point Status NotesIE7 Issue Tracker Ticket IE8 No - Control Point NOT Reconciled or Status Can’t be DeterminedIE9 Yes – Control Point DOES Reconcile
IE10 Daily Bank Files Received Report YY/MM/DD for Comerica Bank totals (Email) - Current Day IE11 CBIS Biller Report (MOSS) - Current Day IE12 7806 Payment Interface Tape Log (Email) - Current Day IE13 Direct Billed Card Biller Report (MOSS) - Current Day IE14 Direct Biller Report (Email) - Current Day IE15 RAMP Standard MOSS Template (MOSS) - Current Day IE16 ACUS Biller Report (MOSS) - Current Day
IE17 Signature of CPOC SOX ManagerIE18 Signature of CPOC Center ManagerIE19 SOX CPOC Lock Code
IE20 Unlocked-Unsigned SOX Audit Document - Current Day IE21 Signed-Unlocked SOX Audit Document - Current Day IE22 Signed-Locked SOX Audit Document - Current Day
Tasks (T)
T0 Open & Save Unlocked-Unsigned SOX Audit Document -Current Day
T1 Control Point 401 reconciliationT2 Control Point 402 reconciliationT3 Control Point 403 reconciliationT4 Control Point 404 reconciliation
T5 Control Point 401 Status ReportT6 Control Point 402 Status ReportT7 Control Point 403 Status ReportT8 Control Point 404 Status Report
T9 Open Issue Tracker TicketT10 Certify SOX Control PointsT11 Sign SOX Audit Document - Current Day T12 Lock & Distribute Locked SOX Document to Network Drive
T13 Open MOSS ReportsT14 Open Email Reports
Resources (R)
R0 SOX Audit Document – Template
R1 Adobe Acrobat on CPOC PCR2 CPOC SOX ManagerR3 CPOC Center ManagerR4 MOSS Billing Reporting SystemR5 SOX Network DriveR6 Email SystemR7 Issue Tracker TicketR8 Issue Tracker System
R10 Daily Bank Files Received Report YY/MM/DD for Comerica Bank totalsR11 CBIS Biller Report (MOSS)R12 7806 Payment Interface Tape Log (Email)R13 Direct Billed Card Biller Report (MOSS)R14 Direct Biller Report (Email)R15 RAMP Standard MOSS Template R16 ACUS Biller Report (MOSS)
R20 Unlocked-Unsigned SOX Audit Document - Current Day R21 Signed-Unlocked SOX Audit Document - Current Day R22 Signed-Locked SOX Audit Document - Current Day
<<Software>>
R8
supply
<<Software>>
R8
supply
<<Software>>
R8
supply
<<Software>>
R8
supply
<<Abstract>>
R7
supply
<<Abstract>>
R7
supply
<<Abstract>>
R7
supply
<<Abstract>>
R7
supply
Page 273 of 420

Bret R. Swan Appendix
E.2 PILOT EXPERIMENT RESOURCE-CENTRIC UML DIAGRAM
Page 274 of 420

Bret R. Swan Appendix
E.3 PILOT EXPERIMENT INFORMATION-CENTRIC UML DIAGRAM
R0
SOX
Audi
t Doc
umen
t – T
empl
ate
R1
Adob
e Ac
roba
t on
CPO
C P
CR
2 C
POC
SO
X M
anag
erR
3 C
POC
Cen
ter M
anag
erR
4 M
OSS
Billi
ng R
epor
ting
Syst
emR
5 SO
X N
etw
ork
Driv
eR
6 Em
ail S
yste
mR
7 Is
sue
Trac
ker T
icke
tR
8 Is
sue
Trac
ker S
yste
m
R10
Dai
ly B
ank
File
s R
ecei
ved
Rep
ort Y
Y/M
M/D
D fo
r C
omer
ica
Bank
tota
lsR
11 C
BIS
Bille
r Rep
ort (
MO
SS)
R12
780
6 Pa
ymen
t Int
erfa
ce T
ape
Log
(Em
ail)
R13
Dire
ct B
illed
Car
d Bi
ller R
epor
t (M
OSS
)R
14 D
irect
Bille
r Rep
ort (
Emai
l)R
15 R
AMP
Stan
dard
MO
SS T
empl
ate
R16
AC
US
Bille
r Rep
ort (
MO
SS)
R20
Unl
ocke
d-U
nsig
ned
SOX
Audi
t Doc
umen
t -C
urre
nt D
ay
R21
Sig
ned-
Unl
ocke
d SO
X Au
dit D
ocum
ent -
Cur
rent
Day
R
22 S
igne
d-Lo
cked
SO
X Au
dit D
ocum
ent -
Cur
rent
Day
IE6
1..1
1..1
IE0
IE20
IE21
1..1
1..1
1..1
0..*
1..1
1..1
IE7
IE18
1..1
1..1
IE22
Res
ourc
es (R
)
T0 O
pen
& Sa
ve U
nloc
ked-
Uns
igne
d SO
X Au
dit
Doc
umen
t -C
urre
nt D
ay
T1 C
ontro
l Poi
nt 4
01 re
conc
iliatio
nT2
Con
trol P
oint
402
reco
ncilia
tion
T3 C
ontro
l Poi
nt 4
03 re
conc
iliatio
nT4
Con
trol P
oint
404
reco
ncilia
tion
T5 C
ontro
l Poi
nt 4
01 S
tatu
s R
epor
tT6
Con
trol P
oint
402
Sta
tus
Rep
ort
T7 C
ontro
l Poi
nt 4
03 S
tatu
s R
epor
tT8
Con
trol P
oint
404
Sta
tus
Rep
ort
T9 O
pen
Issu
e Tr
acke
r Tic
ket
T10
Cer
tify
SO
X C
ontro
l Poi
nts
T11
Sign
SO
X Au
dit D
ocum
ent -
Cur
rent
Day
T1
2 Lo
ck &
Dis
tribu
te L
ocke
d SO
X D
ocum
ent t
o N
etw
ork
Driv
e
T13
Ope
n M
OSS
Rep
orts
T14
Ope
n Em
ail R
epor
tsTask
s (T
)
Info
rmat
ion-
Flow
s -U
ML
2.0
(Cla
ss D
iagr
am)
CP
OC
RA
MP
Sm
all B
iller
Pay
men
t P
roce
ssin
g an
d R
econ
cilia
tion
(P&
R)
1..1
0..1
IE17
1..1
1..*
IE9 0.
.*
IE8
1..*
1..*
0..*
IE2
IE6
1..1
0..*
IE7
1..1
0..1
IE9
IE8
1..*
0..*
1..*
0..*
IE3
IE6
1..1
0..*
IE7
1..1
0..1
IE9
IE8
1..*
0..*
1..*
0..*
IE4
IE6
1..1
0..*
IE7
1..1
0..1
IE9
IE8
1..*
0..*
1..*
0..*
IE16
IE15
1..1
1..1
1..1
1..1
IE1
IE6
1..1
0..*
IE7
1..1
0..1
IE9
IE8
1..*
0..*
1..*
0..*
1..1
1..1IE
14
1..1
1..1IE
13
1..1
1..1
IE12
1..1
1..1IE
11
1..1
1..1
IE11
1..1
1..1
1..1
1..1
1..1
1..1
1..1
1..1
1..1
1..1
IE0
SOX
Dai
ly A
udit
Doc
umen
t -Te
mpl
ate
IE1
Con
trol P
oint
401
Sta
tus
IE2
Con
trol P
oint
402
Sta
tus
IE3
Con
trol P
oint
403
Sta
tus
IE4
Con
trol P
oint
404
Sta
tus
IE5
Cur
rent
Day
’s D
ate
IE6
Con
trol P
oint
Sta
tus
Not
esIE
7 Is
sue
Trac
ker T
icke
t IE
8 N
o -C
ontro
l Poi
nt N
OT
Rec
onci
led
or S
tatu
s C
an’t
be
Det
erm
ined
IE9
Yes
– C
ontro
l Poi
nt D
OES
Rec
onci
le
IE10
Dai
ly B
ank
File
s R
ecei
ved
Rep
ort Y
Y/M
M/D
D fo
r C
omer
ica
Bank
tota
ls (E
mai
l) -C
urre
nt D
ay
IE11
CBI
S B
iller R
epor
t (M
OSS
) -C
urre
nt D
ay
IE12
780
6 Pa
ymen
t Int
erfa
ce T
ape
Log
(Em
ail)
-Cur
rent
Day
IE
13 D
irect
Bille
d C
ard
Bille
r Rep
ort (
MO
SS) -
Cur
rent
Day
IE
14 D
irect
Bille
r Rep
ort (
Emai
l) -C
urre
nt D
ay
IE15
RAM
P St
anda
rd M
OSS
Tem
plat
e (M
OSS
) -C
urre
nt D
ay
IE16
AC
US
Bille
r Rep
ort (
MO
SS) -
Cur
rent
Day
IE17
Sig
natu
re o
f CPO
C S
OX
Man
ager
IE18
Sig
natu
re o
f CPO
C C
ente
r Man
ager
IE19
SO
X C
POC
Loc
k C
ode
IE20
Unl
ocke
d-U
nsig
ned
SOX
Audi
t Doc
umen
t -C
urre
nt D
ay
IE21
Sig
ned-
Unl
ocke
d SO
X Au
dit D
ocum
ent -
Cur
rent
Day
IE
22 S
igne
d-Lo
cked
SO
X Au
dit D
ocum
ent -
Cur
rent
Day
Info
rmat
ion
Elem
ents
(IE)
Page 275 of 420

Bret R. Swan Appendix
F EXPERIMENT METAGRAPH GRAPHICAL PROCESS MODELS USED IN THE PILOT STUDY Participants in the pilot study were asked in the experimental tasks to interpret the following metagraph diagrams deemed unsuitable for the
actual experiment.
F.1 PILOT EXPERIMENT TASK-CENTRIC METAGRAPH DIAGRAM
Task-Centric Interaction Metagraph(Inverse Metagraph)
CPOC Sarbanes-Oxley (SOX) RAMP Small Biller Payment Processing and Reconciliation (P&R)
{IE22, T12}
T2
T1
T3
T4
T9
T10
T12
T11
B
A
{IE7, T9}
[{IE5,A}]
[{IE5,T13}, {IE
16,T13}]
[{IE11,T14}, {IE12,T14}]
[{IE13,T14}, {IE14,T14}]
[{IE5
,A}]
T5
T6
T7
T8
[{IE8, T1}, {IE9,T1}, {IE8,T2}, [IE9,T2}, {IE8,T3}, {IE9,T3}, {IE8,T4}, {IE9,T4}]
[{IE8, T1}, {IE8,T2}, {IE8,T3}, {IE8,T4}]
[{IE18, T10}, {IE6, T10}]
T0
{IE20, T0}
T13
T14
[{IE5,T13}, {IE11,T13}]
[{IE5,T13}, {IE13,T13}] [{IE15,T13}, {IE16,T13}]
[{IE5,T14}, {IE10,T14}]
[{IE5,A}]
[{IE5,A}, {IE0,A}]]
[{IE19,A}]
[{IE1, T5}, {IE2, T6}, {IE3, T7}, {IE4, T8}]
{IE21, T11}
{IE20, T0}
Information Elements (IE)
IE0 SOX Daily Audit Document - Template
IE1 Control Point 401 StatusIE2 Control Point 402 StatusIE3 Control Point 403 StatusIE4 Control Point 404 Status
IE5 Current Day’s DateIE6 Control Point Status NotesIE7 Issue Tracker Ticket IE8 No - Control Point NOT Reconciled or Status Can’t be DeterminedIE9 Yes – Control Point DOES Reconcile
IE10 Daily Bank Files Received Report YY/MM/DD for Comerica Bank totals (Email) - Current Day IE11 CBIS Biller Report (MOSS) - Current Day IE12 7806 Payment Interface Tape Log (Email) - Current Day IE13 Direct Billed Card Biller Report (MOSS) - Current Day IE14 Direct Biller Report (Email) - Current Day IE15 RAMP Standard MOSS Template (MOSS) - Current Day IE16 ACUS Biller Report (MOSS) - Current Day
IE17 Signature of CPOC SOX ManagerIE18 Signature of CPOC Center ManagerIE19 SOX CPOC Lock Code
IE20 Unlocked-Unsigned SOX Audit Document - Current Day IE21 Signed-Unlocked SOX Audit Document - Current Day IE22 Signed-Locked SOX Audit Document - Current Day
Tasks (T)
T0 Open & Save Unlocked-Unsigned SOX Audit Document - Current Day
T1 Control Point 401 reconciliationT2 Control Point 402 reconciliationT3 Control Point 403 reconciliationT4 Control Point 404 reconciliation
T5 Control Point 401 Status ReportT6 Control Point 402 Status ReportT7 Control Point 403 Status ReportT8 Control Point 404 Status Report
T9 Open Issue Tracker TicketT10 Certify SOX Control PointsT11 Sign SOX Audit Document - Current Day T12 Lock & Distribute Locked SOX Document to Network Drive
T13 Open MOSS ReportsT14 Open Email Reports
Resources (R)
R0 SOX Audit Document – Template
R1 Adobe Acrobat on CPOC PCR2 CPOC SOX ManagerR3 CPOC Center ManagerR4 MOSS Billing Reporting SystemR5 SOX Network DriveR6 Email SystemR7 Issue Tracker TicketR8 Issue Tracker System
R10 Daily Bank Files Received Report YY/MM/DD for Comerica Bank totalsR11 CBIS Biller Report (MOSS)R12 7806 Payment Interface Tape Log (Email)R13 Direct Billed Card Biller Report (MOSS)R14 Direct Biller Report (Email)R15 RAMP Standard MOSS Template R16 ACUS Biller Report (MOSS)
R20 Unlocked-Unsigned SOX Audit Document - Current Day R21 Signed-Unlocked SOX Audit Document - Current Day R22 Signed-Locked SOX Audit Document - Current Day
Page 276 of 420

Bret R. Swan Appendix
F.2 PILOT EXPERIMENT RESOURCE-CENTRIC METAGRAPH DIAGRAM
Resource Interaction Metagraph(Element Flow Metagraph)
CPOC RAMP Small Biller Payment Processing and Reconciliation (P&R)
A*
R2*
R1*
R20*
R7
R3
R0
IE0(*,T0)IE5(*,T0)
IE6(*,T10)
IE17(*,T10)
IE6(*,T7)
IE18(*,T11)
R22
R21
IE22(T12,T13)
IE20(T8.T10)
IE20(T0,T10)
IE21(T11,T12)
IE19(*,T12)
IE1(T5.T11)IE2(T6,T11)IE3(T7,T11)IE4(T8,T11)
IE1(T10.T11)IE2(T10,T11)IE3(T10,T11)IE4(T10,T11)
IE20(T0,T11)
IE1(T5,T11)IE2(T6,T11)IE3(T7,T11)IE4(T8,T11)
R2*R6
R4
R10
R16
R11
R12
R13
R14
R15
IE10(T13,T1)
IE15(T14,T4)IE16(T14,T4)
IE16(T14,T1)
IE11(T14,T2)
IE12(T13,T2)
IE14(T13,T3)
IE13(T14,T3)
R1*
R7*
R20*
R8
IE19(*,T8)
IE8(*,T
9)
IE7(T1,T5)IE8(T1,T5)IE9(T1,T5)
IE7(T4,T8)IE8(T4,T8)IE9(T4,T8)
IE7(T3,T7)IE8(T3,T7)IE9(T3,T7)
IE7(T2,T6)IE8(T2,T6)IE9(T2,T6)
IE19(*,T9)
IE10(T13,T1)
Information Elements (IE)
IE0 SOX Daily Audit Document - Template
IE1 Control Point 401 StatusIE2 Control Point 402 StatusIE3 Control Point 403 StatusIE4 Control Point 404 Status
IE5 Current Day’s DateIE6 Control Point Status NotesIE7 Issue Tracker Ticket IE8 No - Control Point NOT Reconciled or Status Can’t be DeterminedIE9 Yes – Control Point DOES Reconcile
IE10 Daily Bank Files Received Report YY/MM/DD for Comerica Bank totals (Email) - Current Day IE11 CBIS Biller Report (MOSS) - Current Day IE12 7806 Payment Interface Tape Log (Email) - Current Day IE13 Direct Billed Card Biller Report (MOSS) - Current Day IE14 Direct Biller Report (Email) - Current Day IE15 RAMP Standard MOSS Template (MOSS) - Current Day IE16 ACUS Biller Report (MOSS) - Current Day
IE17 Signature of CPOC SOX ManagerIE18 Signature of CPOC Center ManagerIE19 SOX CPOC Lock Code
IE20 Unlocked-Unsigned SOX Audit Document - Current Day IE21 Signed-Unlocked SOX Audit Document - Current Day IE22 Signed-Locked SOX Audit Document - Current Day
Tasks (T)
T0 Open & Save Unlocked-Unsigned SOX Audit Document - Current Day
T1 Control Point 401 reconciliationT2 Control Point 402 reconciliationT3 Control Point 403 reconciliationT4 Control Point 404 reconciliation
T5 Control Point 401 Status ReportT6 Control Point 402 Status ReportT7 Control Point 403 Status ReportT8 Control Point 404 Status Report
T9 Open Issue Tracker TicketT10 Certify SOX Control PointsT11 Sign SOX Audit Document - Current Day T12 Lock & Distribute Locked SOX Document to Network Drive
T13 Open MOSS ReportsT14 Open Email Reports
Resources (R)
R0 SOX Audit Document – Template
R1 Adobe Acrobat on CPOC PCR2 CPOC SOX ManagerR3 CPOC Center ManagerR4 MOSS Billing Reporting SystemR5 SOX Network DriveR6 Email SystemR7 Issue Tracker TicketR8 Issue Tracker System
R10 Daily Bank Files Received Report YY/MM/DD for Comerica Bank totalsR11 CBIS Biller Report (MOSS)R12 7806 Payment Interface Tape Log (Email)R13 Direct Billed Card Biller Report (MOSS)R14 Direct Biller Report (Email)R15 RAMP Standard MOSS Template R16 ACUS Biller Report (MOSS)
R20 Unlocked-Unsigned SOX Audit Document - Current Day R21 Signed-Unlocked SOX Audit Document - Current Day R22 Signed-Locked SOX Audit Document - Current Day
Page 277 of 420

R. Swan Appendix
Page 278 of 420
F.3 PILOT EXPERIMENT INFORMATION-CENTRIC METAGRAPH DIAGRAM
IE18
T9 (R
2, R
7,
R8)
T5 (R1, R2, R7, R20)
IE20
IE4
IE7
IE0
IE8
Information-Centric Metagraph
Sarbanes-Oxley (SOX) Bill Payment Processing and Reconciliation (P&R)
IE9
IE12
IE11
IE10
IE13
IE14
IE15
IE16
IE17
T4 (R2, R4, R15, R16)
T1 (R2, R4, R10, R16)
T2 (R2, R
4, R11, R
12)
T
3 (R2,
R4, R13
, R14
)
T4 (R2, R4, R15, R16)
T1 (R2, R4, R10, R16)
T2 (R2, R4, R11, R12)
T3 (R2, R4, R13, R14)
T6 (R1, R2, R7, R20)
T7 (R1, R2, R7, R20)
T8 (R1, R2, R7, R20)
T12 (R1, R2, R3, R21)
T10 (R1, R2, R8, R20)
T10 (R1, R2, R8, R20)
IE21A T13 (R2, R3, R5, R22) B
T13 (R2, R6)
T14 (R2, R4)
IE1
IE19
IE2
IE3
IE5
IE22
T11 (R1, R3, R20)
T10 (R1, R2, R8, R20)
T10 (R1, R2, R8, R20)
T0 (R0, R1, R2)
Information Elements (IE)
IE0 SOX Daily Audit Document - Template
IE1 Control Point 401 StatusIE2 Control Point 402 StatusIE3 Control Point 403 StatusIE4 Control Point 404 Status
IE5 Current Day’s DateIE6 Control Point Status NotesIE7 Issue Tracker Ticket IE8 No - Control Point NOT Reconciled or Status Can’t be DeterminedIE9 Yes – Control Point DOES Reconcile
IE10 Daily Bank Files Received Report YY/MM/DD for Comerica Bank totals (Email) - Current Day IE11 CBIS Biller Report (MOSS) - Current Day IE12 7806 Payment Interface Tape Log (Email) - Current Day IE13 Direct Billed Card Biller Report (MOSS) - Current Day IE14 Direct Biller Report (Email) - Current Day IE15 RAMP Standard MOSS Template (MOSS) - Current Day IE16 ACUS Biller Report (MOSS) - Current Day
IE17 Signature of CPOC SOX ManagerIE18 Signature of CPOC Center ManagerIE19 SOX CPOC Lock Code
IE20 Unlocked-Unsigned SOX Audit Document - Current Day IE21 Signed-Unlocked SOX Audit Document - Current Day IE22 Signed-Locked SOX Audit Document - Current Day
Tasks (T)
T0 Open & Save Unlocked-Unsigned SOX Audit Document -Current Day
T1 Control Point 401 reconciliationT2 Control Point 402 reconciliationT3 Control Point 403 reconciliationT4 Control Point 404 reconciliation
T5 Control Point 401 Status ReportT6 Control Point 402 Status ReportT7 Control Point 403 Status ReportT8 Control Point 404 Status Report
T9 Open Issue Tracker TicketT10 Certify SOX Control PointsT11 Sign SOX Audit Document - Current Day T12 Lock & Distribute Locked SOX Document to Network Drive – Current Day
T13 Open MOSS ReportsT14 Open Email Reports
Resources (R)
R0 SOX Audit Document – Template
R1 Adobe Acrobat on CPOC PCR2 CPOC SOX ManagerR3 CPOC Center ManagerR4 MOSS Billing Reporting SystemR5 SOX Network DriveR6 Email SystemR7 Issue Tracker TicketR8 Issue Tracker System
R10 Daily Bank Files Received Report YY/MM/DD for Comerica Bank totalsR11 CBIS Biller Report (MOSS)R12 7806 Payment Interface Tape Log (Email)R13 Direct Billed Card Biller Report (MOSS)R14 Direct Biller Report (Email)R15 RAMP Standard MOSS Template R16 ACUS Biller Report (MOSS)
R20 Unlocked-Unsigned SOX Audit Document - Current Day R21 Signed-Unlocked SOX Audit Document - Current Day R22 Signed-Locked SOX Audit Document - Current Day
IE6
Bret

Bret R. Swan Appendix
G PILOT STUDY PROCEDURES
A pilot study was conducted with nine participants to refine the experimental procedures
and materials prior to performing the actual experiment. Pilot study participants were given pre-
experiment assessments, randomly assigned to treatment groups, and completed the given pilot
study tasks.
1. Approval for the experiment was obtained from the Virginia Tech Institutional Review
Board (IRB).
2. Training and experimental user comprehension task sets, assessment packages, and
timeliness data collection procedures were prepared for the pilot study.
3. Participants were recruited for the pilot study primarily from graduate students with
research experience, in order to provide informed feedback.
4. Participants arrived at the scheduled time, and were randomly assigned to pilot study
training and experimental tasks.
5. Pre-experiment assessments were administered to pilot study participants. Pilot study
participants:
A. Reviewed the research purpose and instructions.
B. Chose whether or not to sign the IRB Informed Consent form.
C. Completed the Demographic and Prior Experience Questionnaire.
D. Completed the MBTI Form F.
E. Completed the Differentional Attentional Processes Inventory (DAPI).
F. Completed the 12-minute the Wonderlic Personnel Test (WPT) Form A.
6. Participants received training handouts and instruction from the facilitator. They were
encouraged to verbalize their observations so that their feedback on the lab experiment
could be recorded.
7. The facilitator was careful to give instruction and answer questions using only the
information available in the handouts.
8. The training task began and the facilitator started the stopwatch. Each participant began the
set of user comprehension tasks and completed task accuracy questionnaires.
9. After a participant completed interpretation of one Type of BPI, the task accuracy
questionnaires, data was collected on:
A. Time on task (in seconds) recorded by facilitator.
Page 279 of 420

Bret R. Swan Appendix
B. The NASA-TLX subjective mental workload dimensions completed by the
participants.
10. When participants finished all three BPI interpretation tasks, they completed:
A. Fifteen NASA-TLX paired comparison ratings of TLX dimensions.
B. The self-efficacy questionnaire.
11. Training task assessments were then collected by the facilitator.
12. The facilitator handed out the instructions and scenario for the experimental tasks. He
verbally read through these documents and answered last minute questions.
13. Participants were then allowed time to collect and prepare to use all the training and
experiment handouts during the experimental tasks.
14. Experimental task questionnaires and assessment packages were then passed out to the
participants.
15. Participants began the experimental user comprehension tasks. Steps 8, 9, and 10 were
repeated.
16. After completion of their experimental task set, the facilitator collected all experimental
assessments.
17. Pilot study participants were then encouraged to provide any final observations and
feedback on the pilot lab experiment.
18. Pilot study participants were thanked and given the promised rewards for participation.
19. The facilitator completed notes on observations related to the pilot study treatment group.
The pilot study was then evaluated and the experimental procedure was adjusted prior to
deployment.
Page 280 of 420
Bret R. Swan Appendix
H PILOT STUDY FINDINGS
The following were the issues were observed in the pilot study, and corresponding
solutions were developed for the experimental study.
H.1 GPM SIZE AND LAB WORKSTATIONS ISSUES
The participant workstation configuration, as originally conceived, was not workable for
the actual lab experiment. In designing the pilot study, the GPM maps were too large to be easily
readable on a computer screen; to see the GPMs, participants had to both zoom in and scroll to see
the necessary details, or, if the whole GPM was put on the screen, the details on the GPM were not
able to be easily read. Therefore:
1. It was determined that having participants interpret the GPMs on a computer screen creates
a level of difficulty that adds an extra random variable that is not of interest in this
experiment. Several studies show that text comprehension outcomes are negatively
impacted when participants interpret information from a computer screen as opposed to a
paper presentation, including lower accuracy, lower timeliness, and higher subjective
mental workload, (Mayes, Sims, & Koonce, 2001; Wastlund, Reinikka, Norlander, &
Archer, 2005). Therefore, the lab experiment was changed to allow participants to interpret
paper printouts of the training and experimental task GPMs large enough to easily see the
details.
2. The experiment GPMs were found to be too complex to be easily readable when printed on
letter or legal size paper. Therefore, GPMs were printed on size D (22” x 35”) paper.
(Training task GPMs worked well on letter sized paper.)
3. During the pilot study, the size D GPMs were too large for easy manipulation on a desk, so
the decision was made to hang the experimental GPMs on the walls of the lab for the
experiment.
4. Another advantage of hanging the GPMs on the wall is that this arrangement permitted two
participants from the same treatment group to be working on the same set of three GPMs.
This was possible because of the assignment of treatment task BPIs were ordered to reduce
learning order bias. Therefore, no more than two participants were permitted on a set of
three GPMs whenever possible.
Page 281 of 420
Bret R. Swan Appendix
5. Participants were encouraged to stand in front of each GPM they were interpreting, fill out
the assessment on the clipboard, and to not look at other GPMs. The small size of the font
of the GPMs and the distance individual GPMs were hung from each other encouraged
participants to focus on the assigned GPM and discouraged participants from trying to look
at other related GPMs.
H.2 COMPUTER VS. PAPER ASSESSMENT ISSUES
Similar to the problems observed with GPMs, completing assessments on the computer was
too awkward and unworkable when participants were asked to interpret wall-mounted GPMs.
Participants’ time on task was not accurate because participants had to travel between the computer
and the wall-mounted GPMs. Therefore:
A. All training and experimental assessments were collected using pencil and paper.
B. Participants were provided a desk and a clipboard to use during the training and
experimental tasks.
H.3 TIMELINESS DATA COLLECTION ISSUES
Since the time on task data were not collected on the computer, data were collected by the
facilitator using a stopwatch. Therefore the procedure was changed to the following:
A. Participants were started on their tasks by the facilitator and the running time was recorded.
B. When participants completed the task accuracy questionnaire related to a particular BPI
type, they call out that they are finished to the facilitator. The facilitator recorded the finish
time.
C. Times on task for each participant are calculated by subtracting the start times from the
finish times to the whole second.
H.4 TRAINING AND EXPERIMENTAL TASK COMPLEXITY ISSUES
Task complexity was the primary cause of problems in the pilot study. Both the training
and experimental tasks were too complex and required too much time for participants to complete.
During the pilot study, the level of complexity was controlled by using two real-world business
processes with different numbers of GPM components: in pilot study training, a bank loan
application process, and in the pilot study experiment, a billing system monitoring process.
Page 282 of 420

Bret R. Swan Appendix
Although novice GPM users were able to interpret both processes, the pilot study determined that
the more complex business process (the billing system monitoring process) took far too long to
interpret to be practical for this experiment. Time to complete the training tasks, training
assessments, experimental tasks, and experiment assessments varied between 90 and 150 minutes.
This provided an unworkable time schedule for the experiment.
Furthermore, pilot study participants became mentally fatigued by the time the
experimental tasks were presented. The training business process (the bank loan application
process) was complex enough that it took participants a long enough time to interpret that the
mental fatigue of the participants became a factor that seemed to contaminate the user
comprehension results of billing system monitoring process. If introduced into the actual lab study,
mental fatigue and time pressures would have created significant bias in the results. Therefore, the
following changes were made to the experiment:
A. The billing system monitoring process was dropped from the experiment, and the less
complex business process (i.e., the bank loan process) was selected for the actual
experiment.
B. The training tasks were simplified to focus specifically on how to read and interpret
specific GPM symbols and not to practice reading a real business process.
C. Training tasks were completed using simple diagrams that demonstrated basic symbols and
relationships of the GPMs.
D. The training task questionnaire were changed to reflect new training GPMs, but the exact
type of questions participants would see in the experiment was preserved. Also, the correct
answers to the questions were included on the back of the paper so they could study and
understand why training task answers were correct.
These changes in task difficulty reduced the total time of the training and experiment by
approximately 50% and substantially reduced mental fatigue in participants compared to the early
pilot study results.
H.5 SELF-DIRECTED VS. FACILITATOR-LED TRAINING ISSUES
The original training plan was to have participants complete three simple training tasks
until they scored 100% using a self-directed training approach. The training plan was designed to
assure a relatively equal level of GPM experience in all participants prior to the experiment, as well
as to reduce the impact of a facilitator on experimental results. However, this self-directed training
Page 283 of 420

Bret R. Swan Appendix
approach was quickly observed to be too time-consuming, confusing, and complex. Verbal training
and feedback by the facilitator was required. Therefore training changes included:
A. The training procedure was led by the facilitator.
B. The facilitator read through the training materials with the participants; essentially
providing a verbal version of the training documents. He was careful not to add to or
eliminate sections of the training documents for any treatment group.
C. A Frequently Asked Questions (FAQ) training document was prepared for participants
based on the questioned asked during the pilot study.
D. Questions to the facilitator were allowed. However, the facilitator answered questions
using the training documents, and did not provide more detailed information than the
training materials contained.
E. With the elimination of self-directed training in favor of a facilitator-moderated training
approach, providing training to separate sets of participants at the same time on two
different GPM treatment groups was unworkable. Therefore, all participants at a scheduled
time were assigned to the same treatment group.
F. Correct answers were included on the back of the training questionnaires. Participants were
to study these questions until they felt comfortable understanding the correct answers.
After the above changes were made, the total time to complete the training and the experimental
tasks and assessments was reduced to between 45 and 90 minutes. In addition, bias due to other
mental fatigue-related issues (described above) was reduced.
H.6 ASSESSMENT INSTRUMENT ISSUES
The assessment instruments performed as intended with only a few minor adjustments.
Changes were made to the demographics questionnaire to add questions assessing whether English
was participants native language, more courses were added, and confusing wording was revised.
The task accuracy questionnaires were edited for wording and for discrepancies found in answers
by pilot study participants.
However, during the first treatment group of the actual experiment, participants’ responses
to three resource-centric GPM questions and one information-centric GPM question had to be
eliminated due to discrepancies in interpretation and imprecision of the wording in these questions
that were not discovered in the pilot study. The final task accuracy dataset included the percentage
of correct answers from eight task-centric GPM questions, five resource-related GPM questions,
Page 284 of 420

Bret R. Swan Appendix
and seven information-centric GPMs. One reason these question problems may not have been
discovered during the pilot study was that the actual experimental task was used as the training task
during the pilot study. During the pilot study, participants were not motivated in the same way and
may have not taken the training task questions as seriously as they did experimental task questions.
Consequently, these questionnaire wording issues went undiscovered during the pilot study.
Page 285 of 420

Bret R. Swan Appendix
I ACTUAL EXPERIMENT PARTICIPANT SCRIPTS & HANDOUTS The following documents and scripts were given to participants in the actual experiment.
I.1 TRAINING OVERVIEW HANDOUT
[NOTE: The following Training Overview was given to participants at the beginning of the Training Phase. Participants were allowed to use this document through both the training and experiment phases.]
TRAINING OVERVIEW
This lab experiment consists of two phases: a training phase and an experimental phase.
During the training phase, you will be given instruction and allowed to practice interpreting
simplified diagrams of a business process. During the experimental phase, you will apply what you
have learned during training to the interpretation of diagrams that represent another real-world
business process.
The following are definitions of important terms you will see in the training and
experiment:
• A process is a set of tasks that connects one set of information elements to another set of
information elements. All inputs for any task in the process must be either in the form of
information elements or from the output of some other task(s) in the system. For example,
all three diagrams [A], [B], and [C] are used to describe different views of the same
business process.
• A task is executed when inputs are used to determine outputs. For example see T1 on the task-
centric diagram [A].
• A resource is an entity associated with one or more tasks, and the resource must be available if
the tasks are to be executed. Several resources may be associated with a single task, and
vice versa. Resources may be a person, a statement of information, piece of software, an
information system, or a document in the context of this experiment. For example, see R2
on the resource-centric diagram [B].
• An information element is a single data item. An information element can be a single or a set
of numbers, characters, words, images, or icons (as would be found in a document). For
example, see IE21 on the information-centric diagram [C].
Page 286 of 420

Bret R. Swan Appendix
This business process begins with a completed customer loan application and then performs
several tasks to determine whether the application is accepted or rejected. You will be asked to read
and interpret three different graphical process models:
(a) A task-centric view of the loan application process (Diagram A)
(b) A resource-centric view of the loan application process (Diagram B)
(c) An information-centric view of the loan application process (Diagram C)
In order to assess your understanding of the business process, you will be asked to answer
four sets of questions: (A) questions about task relationships, (B) questions about resource
relationships, (C) questions about relationships among information elements, and (D) questions
about how that tasks, resources, and information elements interact in the process.
Training Phase:
Training is designed to allow you the chance to familiarize yourself with different aspects
of the diagrams and what questions will be asked. Although the facilitator will keep track of your
time spent in training, this time does not count toward your winning the prizes. Feel free to take as
long as you need to feel confident. Your training on the diagrams used in this experiment will
proceed in this order:
(1) You will be presented with four sets of documents that explain and illustrate the diagrams and questions used in this experiment.
a. Training Overview (this document)
b. Frequently Asked Questions (FAQ) Reference Document
c. Samples of Questions asked in the experiment
d. A short questionnaire evaluating the mental workload you experienced and the confidence you feel after your training
(2) The facilitator will read the Training Overview and Diagram Training documents to will explain how to read and interpret the symbols on this diagram.
(3) The facilitator will overview the FAQ reference to familiarize you with how to look up answers to questions you may have.
(4) You will be asked to complete a set of sample questions about the training process models.
e. These questions will be similar to those you will see in the experiment. The correct answers to these questions are provided on the back of the questionnaires.
f. Please try to figure out the answer to the question and then try to understand why your answer is correct or incorrect.
Page 287 of 420

Bret R. Swan Appendix
g. During training, the facilitator cannot answer questions directly, but if the answer to your question is listed in the training materials, he can suggest where you can look to find the answer.
(5) When you finish with the training questions:
h. Raise your hand and inform the facilitator (this is important to make sure your time on task is recorded accurately).
i. Complete the short assessment of mental workload
j. Complete the sheet evaluating the importance to you of the different aspects of the mental workload you just experienced in the training task.
k. Answer the few questions on Self-Efficacy.
(6) When you have completed step 5, place your documents in your folder and wait for the facilitator to hand you the experiment materials. Do not begin the experiment until told to do so by the facilitator so that you time performing the task can be accurately recorded.
The experimental phase will proceed in a way similar to the training phase. You will
answer similar questions except the diagrams will be different and you will be asked to complete
the mental workload questionnaire after each set of questions. The facilitator will keep track of
your time, but will not be able to provide any answers to help during the experiment.
You may refer to your training materials at any time during the experiment.
Please wait for the facilitator to tell you to begin before proceeding with the training.
Page 288 of 420

Bret R. Swan Appendix
I.2 UML DIAGRAM FREQUENTLY ASKED QUESTIONS (FAQ) HANDOUT
UML Diagrams Frequently Asked Questions (FAQ)
1. What do the words directly, indirectly, immediately, and “in the entire process” mean on the questionnaire?
• The words directly and immediately refer to tasks, resources, or information
elements that are related to the object in the question by a line or arrow (pointing into or out of the object in the question). They DO NOT refer to tasks, resources, or information elements that are not directly connected to the object referred to in the question. For example, see question T1.1 in the Training Questionnaire.
• The words indirectly and “across the entire process” asks you to identify all objects even if they are not directly connected to the object in question. For example, see question CI4.1.
2. What do the words precede, before, and follows mean on the questionnaire?
• The words precede or before mean that questions asks you to look for tasks, resources, or information elements that come before the object referred to in the question. For example, see question R2.1.
• The word follows refers to tasks, resources, or information elements that come after the object referred to in the question. For example, see question T2.1
• Any of these words can be combined to with the words directly, indirectly, immediately, and “in the entire process.” For example, see question T2.1.
3. What do the words most utilized, least utilized, “performed the most”, most
critical, and least critical mean on the questionnaire?
• The words most utilized, most critical, or “performed the most” refer to tasks, resources, or information elements that are used by or associated with the most other tasks, resources, or information elements. This is usually indicated by the number of lines connected to the object. For example, see question T3.1.
• The words least utilized, least critical, or “performed the least” refer to tasks, resources, or information elements that are used by or associated with the fewest other tasks, resources, or information elements. This is usually indicated by the number of lines connected to the object. For example, see question T3.2.
Page 289 of 420

Bret R. Swan Appendix
4. Should these maps be read like a flowchart? Should we assume the process “flows” left to right on the maps?
• Only 1 map should be read as a flow (left to right) - the task-centric [A]
map. • The resource-centric [B] and information-centric [C] maps should be seen
as a “snapshot” or picture of the associations between either resources or information elements. They are not to be read as flowcharts (left to right).
5. What maps can I use for the CI questions?
• You may use all three diagrams to answer the questions label CI.
6. Can I use all three maps to answer Task (T), Resource (R), and Information Element (IE) questionnaires?
• No. You may only use the diagram that the questionnaire is associated
with. Please do not look at other diagrams to answer the questions. On the Task-Centric [A] Diagram:
7. What do the box with arrow ends mean? • It refers to a Task.
8. What does a rectangle mean? • It refers to a Resource.
9. What does parallelogram mean? • It refers to an Information Element.
10. What do the tasks with objects above them mean? • This refers to resources or information elements that control the
performance of the task.
11. What do tasks with objects below them mean? • This refers to resources or information elements that act as suppliers of the
resources or information elements necessary to perform the task.
12. What do solid lines with between tasks mean? • This refers to resources or information elements that control the
performance of the task.
Page 290 of 420

Bret R. Swan Appendix
13. What do the arrows coming in from the left of a task mean? • This refers to other tasks or information elements that are inputs required to
perform the given task.
14. What do the arrows coming out on the right of a task mean? • This refers to either (a) other tasks that must be performed after the given
task, or (b) to information elements that act as outputs from the performance of the given task.
15. What does an information element as an input to a task mean versus an information
element as a supplier (below) or a control (above) a given task mean? • An information element with an arrow on the left of a task means the
information element is required as an input to perform the task. • An information element with an arrow on the right of a task means the
information element is produced by the task and is an output of the task. • An information element below a task means the information element is
required as a resource in order to perform the task. • An information element above a task means the information element is
required to control the performance of a task.
16. What do the symbols on T7 and T8 mean? • They are tasks. On these diagrams, their flat right side means they are the
last task in the process.
17. What does a triangle mean? • A decision point in the process. Depending on the decision, the flow of the
process going in one direction or another. For example, see the feedback loop from the decision point to T4 on the Task-Centric UML diagram [A].
On the Resource-Centric [B] Diagram:
18. What does a solid line mean between resources? 1..1 1..* • The solid line means that one resource is directly associated with another
resource because of the information elements one provides to another.
19. What do the following numbers on the lines associating the resources mean: • (0..1) = is associated with zero or 1 instance of this resource. • (1..1) = is associated with 1 and only 1 instance of this resource. • (1..*) = is associated with 1 or many instances of this resource.
Page 291 of 420

Bret R. Swan Appendix
20. What does the line that starts and ends at the same resource mean?
• This means that the same resource performs a task that provides some information that is then used in subsequent tasks performed by the same resource.
On the Information-Centric [C] Diagram:
21. What does parallelogram mean? • It refers to a specific information element.
22. What does the dotted line without the arrow mean?
• It is an association called a constraint. It means that one element acts as a constraint in the calculation or production of another information element. For example, an information element that represents a spending limit of $100 constrains the total amount that can be spent by an individual (another information element).
23. What does the dotted line with an arrow mean?
• It is called a dependency. The arrow points FROM the information element that needs the information TO the information element that is provides the information needed. A dependency does not indicate a process flow, only a relationship between elements. For example, calculation of miles traveled (an information element) depends on the speed at a car traveled.
24. What does a solid line mean between resources? 1..1 1..*
• The solid line means that one resource is directly associated with another resource because of the information elements one provides to another.
25. What do the following numbers on the lines associating the resources mean:
• (0..1) = is associated with zero or 1 instance of this resource. • (1..1) = is associated with 1 and only 1 instance of this resource. • (1..*) = is associated with 1 or many instances of this resource.
Page 292 of 420

Bret R. Swan Appendix
I.3 METAGRAPH DIAGRAM FREQUENTLY ASKED QUESTIONS (FAQ) HANDOUT
Metagraph Diagram Frequently Asked Questions (FAQ)
1. What do the words directly, indirectly, immediately, and “in the entire process” mean on the questionnaire?
• The words directly and immediately refer to tasks, resources, or information
elements that are related to the object in the question by a line or arrow (pointing into or out of the object in the question). They DO NOT refer to tasks, resources, or information elements that are not directly connected to the object referred to in the question. For example, see question T1.1 in the Training Questionnaire.
• The words indirectly and “across the entire process” asks you to identify all objects even if they are not directly connected to the object in question. For example, see question CI4.1.
2. What do the words precede, before, and follows mean on the questionnaire?
• The words precede or before mean that questions asks you to look for tasks, resources, or information elements that come before the object referred to in the question. For example, see question R2.1.
• The word follows refers to tasks, resources, or information elements that come after the object referred to in the question. For example, see question T2.1
• Any of these words can be combined to with the words directly, indirectly, immediately, and “in the entire process.” For example, see question T2.1.
3. What do the words most utilized, least utilized, “performed the most”, most
critical, and least critical mean on the questionnaire?
• The words most utilized, most critical, or “performed the most” refer to tasks, resources, or information elements that are used by or associated with the most other tasks, resources, or information elements. This is usually indicated by the number of lines connected to the object. For example, see question T3.1.
• The words least utilized, least critical, or “performed the least” refer to tasks, resources, or information elements that are used by or associated with the fewest other tasks, resources, or information elements. This is usually indicated by the number of lines connected to the object. For example, see question T3.2.
Page 293 of 420

Bret R. Swan Appendix
4. Should these maps be read like a flowchart? Should I assume the process “flows” left to right on the maps?
• Only 1 map should be read as a flow (left to right) - the task-centric [A]
map. • The resource-centric [B] and information-centric [C] maps should be seen
as a “snapshot” or picture of the associations between either resources or information elements. They are not to be read as flowcharts (left to right).
5. What maps can I use for the CI questions?
• You may use all three diagrams to answer the questions label CI.
6. Can I use all three maps to answer Task (T), Resource (R), and Information Element (IE) questionnaires?
• No. You may only use the diagram that the questionnaire is associated with. Please do not look at other diagrams to answer the questions.
7. Should these maps be read like a flowchart? Should we assume the process “flows”
left to right on the maps? • Only 1 map should be read as a flow (left to right) - the task-centric [A]
map. • The resource-centric [B] and information-centric [C] maps should be seen
as a depiction of “snapshot” or picture of the associations between either resources or information elements. They are not to be read as flows (left to right).
8. What do the letters and numbers mean on a diagram?
• T# = a specific Task identifier • R# = a specific Resource identifier • IE# = a specific Information Element identifier
9. Where do I look to find out what a specific task, resource or information element
means? • There is a key on each diagram. There is also a more detailed key in the
experiment instructions. 10. What do circles mean that contain task, resource, or information element identifier?
• A circle identifies the component or associated components that are either (a) affected by other elements (indicated by an arrowhead that come into or touches the circle), or (b) that are required to work together to produce or affect other components (indicated by an arrow that starts at the circle and ends pointing to another component(s). For example see the R2-R4 circle on the Training Resource diagram [B]
T1
T2
11. What do arrows mean?
Page 294 of 420

Bret R. Swan Appendix
• The show that an individual or set of components (tasks, resources, or information elements) affect or are required in order to produce another component or set of components. For example, see question T1.1
12. What does A mean?
• It refers to the start of the process represented in the diagram.
13. What does B mean” • It refers to the end of the process represented in the diagram.
On the Task-Centric [A] Diagram:
14. What does IE#(T#) mean next to the arrows? • It means that a specific information element (IE#) is produced by
association with a specific task or tasks (T#). On the Resource-Centric [B] Diagram:
15. What does IE#(T1*,T2) mean? • It means that a specific information element (IE#) is produced by task T1*
using the resource or resources from which the arrow started. • IE# is used in the task (T2*) by the resource or resources where the arrow
ends. On the Information-Centric [C] Diagram:
16. What does T#(R1*, R2*) mean? • It means that a specific task (T#) is performed or executed using the
information element or information elements from where the arrow started using resources R1* and R2*).
• Using the beginning information element(s), Task (T#) produces or helps to produce the information element(s) where the arrow ends.
You may refer to this Training FAQ at any time during the experiment.
Page 295 of 420

Bret R. Swan Appendix
I.4 TRAINING TASK ASSESSMENT PACKET – UML DIAGRAM USER
Training Questionnaire Assessing Task-Centric UML Diagrams
BPM User
Comprehension Components
User Comprehension Training Questions
Task-Centric Questions (T) [Diagram A]
T1.1 Given a task, T4, to execute, what other tasks must be executed immediately before T4 to provide the information needed to execute task T4?
(a) T1 (b) T4 (c) T5, T6, T7, T8 (d) T12 only (e) None of the above
T2.1 If task T1 is disabled, what other tasks will be affected that immediately follow
T1 – in other words, what other tasks cannot be executed because T1 is disabled?
(a) T12 (b) T5, T7, T7, T8 (c) T4 (d) All of the tasks (e) None of the above
T3.1 What task is performed the most in the list below? (a) T1 (b) T5 (c) T11 (d) T4 (e) None of the above
T3.2 What task is performed the least in the list below? (a) T1 (b) T7 (c) T2 (d) T3 (e) None of the above
*Assume that the answers listed are complete – in other words, if an item is not listed, it is not part of the listed answer.
Page 296 of 420

Bret R. Swan Appendix
BPM User
Comprehension Components
ANSWERS
Task-Centric Questions (T) [Diagram A]
T1.1 Given a task, T4, to execute, what other tasks must be executed immediately before T4 to provide the information needed to execute task T4?
(a) T1 is the Correct Answer Why?: • The arrow leading from T1 to T4 indicates that task T1 must be
executed immediately before T4 can be executed.
T2.1 If task T1 is disabled, what other tasks will be affected that immediately follow T1 – in other words, what other tasks cannot be executed because T1 is disabled?
(c) T4 is the Correct Answer Why?: • The arrow leading from T1 to T4 indicates that task T4 cannot be
executed if T1 is disabled.
T3.1 What task is performed the most in the list below? (d) T4 is the Correct Answer Why?: • Although T1 and T4 are listed once in the process, the feedback loop
from the decision point at the end indicates that T4 may be executed more than once. Therefore, T4 may be performed more than T1.
T3.2 What task is performed the least in the list below?
(a) T1 is the Correct Answer Why?: • Although T1 and T4 are listed once in the process, the feedback loop
from the decision point at the end indicates that T4 may be executed more than once. Therefore, T1 is the least performed task in the process.
*Assume that the answers listed are complete – in other words, if an item is not listed, it is not part of the listed answer.
Page 297 of 420

Bret R. Swan Appendix
Questionnaire Assessing Resource-Centric UML Diagrams
BPM User Comprehension
Components ANSWERS
Resource-Centric Questions (R) [Diagram B]
R1.1 If a resource R1 is unavailable, what other resources that directly follow or are associated with R1 will be affected?
(a) All resources (b) R2 only (c) R2, R3 (d) R5, R22 (e) None of the above
R2.1 What specific resources directly precede or are associated with R5 that provides
information for R5 to perform its tasks? (a) R1 (b) R3 (c) R2 (d) R22 (e) None of the above
R3.1 What is the most utilized resource in the list below?
(a) R1 (b) R2 (c) R5 (d) R22 (e) None of the above
R3.2 What is the least utilized resource(s) in the list below? (a) R1 (b) R2 (c) R5 (d) R22 (e) None of the above
*Assume that the answers listed are complete – in other words, if an item is not listed, it is not part of the listed answer.
Page 298 of 420

Bret R. Swan Appendix
BPM User Comprehension
Components User Comprehension Training Questions
Resource-Centric Questions (R) [Diagram B]
R1.1 If a resource R1 is unavailable, what other resources that directly follow or are associated with R1 will be affected?
(c) R2, R3 is the Correct Answer Why?: • R2 and R3 are both directly associated with R1.
R2.1 What specific resources directly precede or are associated with R5 that provides
information for R5 to perform its tasks? (d) R22 is the Correct Answer Why?: • R22 is the only resource associated with R5.
R3.1 What is the most utilized resource in the list below?
(d) R22 is the Correct Answer Why?: • R22 is utilized by three other resources as indicated by the three lines
associating R22 with R2, R3, and R5.
R3.2 What is the least utilized resource(s) in the list below? (c) R5 is the Correct Answer Why?: • R5 is utilized by only R22. • Also, R5 may or may not be utilizes as indicated by the (0..1) on the
association with R22. Therefore, R5 is the least utilized resource.
*Assume that the answers listed are complete – in other words, if an item is not listed, it is not part of the listed answer.
Page 299 of 420

Bret R. Swan Appendix
Questionnaire Assessing Information-Centric UML Diagrams
BPM User Comprehension
Components User Comprehension Training Questions
Information-Centric Questions (IE) [Diagram C]
IE1.1 Given three information elements, IE10, IE17, IE20, which of them is needed to determine the value of the other(s)?
(a) IE10 determine IE17 and IE20 (b) IE10 and IE17 determine IE20 (c) IE22 determine IE10 and IE17 (d) IE10 and IE20 determine IE17 (e) None of the above
IE2.1 Given two sets of information elements {IE10, IE17} and {IE20, IE21}, is it
possible to determine the values of the second set from the elements in the first set, and if not, are there any additional information elements that would make it possible to do so?
(a) Yes – No other information elements are needed (b) No – unless {IE18} is also included (c) No – unless {IE22} is also dropped from the list (d) No – unless {IE7, IE9} is also included (e) No – the first set does not determine the values of the second set, and
the addition of information elements will not change this fact.
IE3.1 What was the most utilized information element in the process that is listed below?
(a) IE10 (b) IE20 (c) IE21 (d) IE22 (e) None of the above
IE3.2 What was the least utilized information element in the process that is listed
below? (a) IE7 or IE9 (b) IE19 (c) IE21 (d) IE22 (e) None of the above
*Assume that the answers listed are complete – in other words, if an item is not listed, it is not part of the listed answer.
Page 300 of 420

Bret R. Swan Appendix
BPM User Comprehension
Components ANSWERS
Information-Centric Questions (IE) [Diagram C]
IE1.1 Given three information elements, IE10, IE17, IE20, which of them is needed to determine the value of the other(s)?
(b) IE10 and IE17 determine IE20 – is the Correct Answer Why?: • IE20 is dependent on both IE10 and IE17. Therefore, of the elements
listed, IE10 and IE17 are needed to determine the value of IE20.
IE2.1 Given two sets of information elements {IE10, IE17} and {IE20, IE21}, is it possible to determine the values of the second set from the elements in the first set, and if not, are there any additional information elements that would make it possible to do so?
(d) No – unless {IE7, IE9} is also included – is the Correct Answer Why?: • IE20 is dependent on both IE10 and IE17. Therefore, of the elements
listed, IE10 and IE17 are needed to determine the value of IE20.
IE3.1 What was the most utilized information element in the process that is listed below?
(b) IE20 is the Correct Answer Why?: • IE20 is associated with three other information elements IE7, IE9, and
IE21 (not including the two elements that that IE20 is dependent on). Therefore, IE20 is the most utilized information element.
IE3.2 What was the least utilized information element in the process that is listed
below? (a) IE7 or IE9 is the Correct Answer Why?: • IE7, IE8, and IE18 are all associated with or constrain only one other
information element.. However, IE 7 and IE9 are listed as only occasionally being associated with IE20 – as indicated with by the (0..1) on the association.
• IE18 always constrain IE21. Therefore, IE7 and IE9 are equally the least associated information element.
*Assume that the answers listed are complete – in other words, if an item is not listed, it is not part of the listed answer.
Page 301 of 420
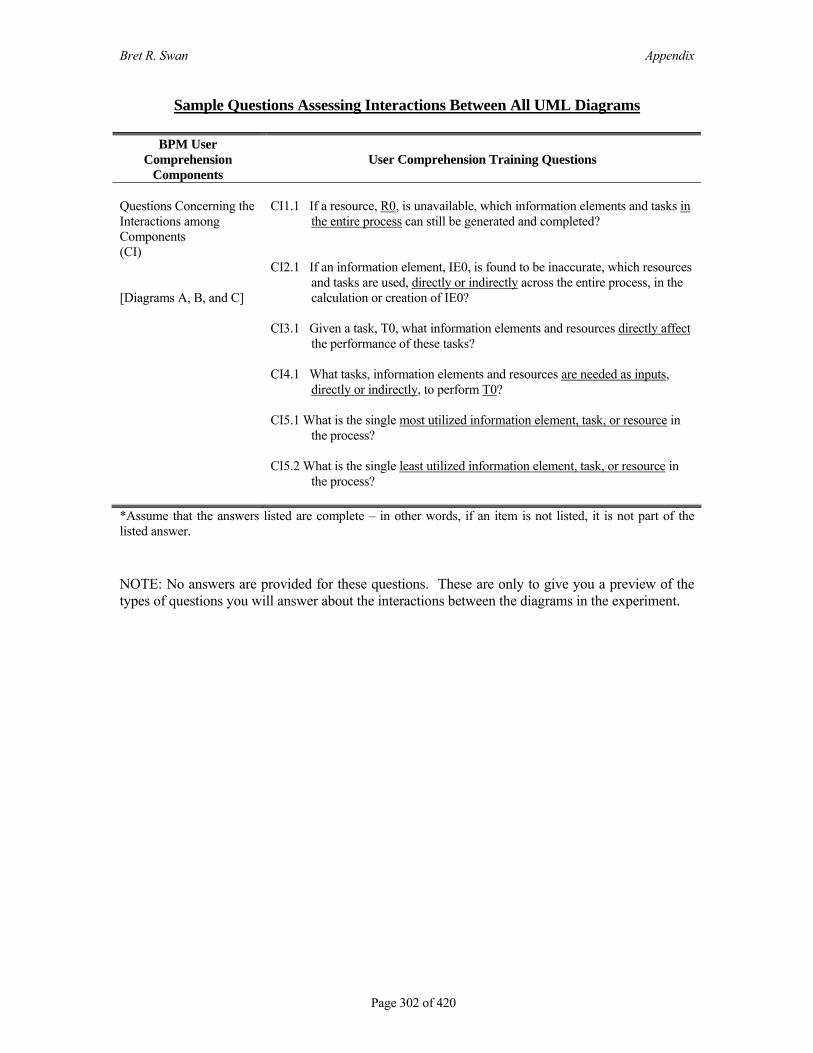
Bret R. Swan Appendix
Sample Questions Assessing Interactions Between All UML Diagrams
BPM User Comprehension
Components User Comprehension Training Questions
Questions Concerning the Interactions among Components (CI)
CI1.1 If a resource, R0, is unavailable, which information elements and tasks in the entire process can still be generated and completed?
[Diagrams A, B, and C]
CI2.1 If an information element, IE0, is found to be inaccurate, which resources and tasks are used, directly or indirectly across the entire process, in the calculation or creation of IE0?
CI3.1 Given a task, T0, what information elements and resources directly affect
the performance of these tasks?
CI4.1 What tasks, information elements and resources are needed as inputs, directly or indirectly, to perform T0?
CI5.1 What is the single most utilized information element, task, or resource in
the process? CI5.2 What is the single least utilized information element, task, or resource in
the process?
*Assume that the answers listed are complete – in other words, if an item is not listed, it is not part of the listed answer. NOTE: No answers are provided for these questions. These are only to give you a preview of the types of questions you will answer about the interactions between the diagrams in the experiment.
Page 302 of 420

Bret R. Swan Appendix
Assessment of the Mental Workload You Just Experienced
Please consider your choices carefully and make them consistent with how you used the
rating scales during the particular task you just completed and are now asked to evaluate. Don’t
think that there is any correct pattern. I am only interested in your opinions. If you have any
questions, please ask them now. Otherwise, you may begin.
SCALE TITLES FOR ASSESSMENT OF MENTAL WORKLOAD
TITLE ENDPOINTS DESCRIPTIONS Mental Demand Low/High How much mental and perceptual activity is
required (e.g. thinking, deciding, calculating, remembering, looking, searching, etc.)? Was the task easy or demanding, simple or complex, exacting or forgiving?
Physical Demand Low/High How much physical activity was required(e.g. pushing, pulling, turning, controlling, activating, etc.)? Was the task easy or demanding, slow or brisk, slack or strenuous, restful or laborious?
Temporal Demand
Low/High How much time pressure did you feel due to the rate or pace at which tasks or task elements occurred? Was the pace slow and leisurely or rapid and frantic?
Performance Bad/Good How successful do you think you were in accomplishing the goals of the task set by the experimenter (or yourself)? How satisfied were you with your performance in accomplishing these goals?
Effort Low/High How hard did you have to work (mentally and physically) to accomplish your level of performance?
Frustration Level Low/High How insecure, discouraged, irritated, stressed, and annoyed versus secure, gratified, content, relaxed, and complacent did you feel during the task?
Page 303 of 420

Bret R. Swan Appendix
MENTAL WORKLOAD RATING SHEET Participant Name _____________________ Diagram ID (A, B, or C) ________
Diagram Type: UML or Metagraph (circle one)
MENTAL DEMAND
Low High PHYSICAL DEMAND
Low
High TEMPORAL DEMAND
Low High PERFORMANCE Bad Good EFFORT
Low High FRUSTRATION
Low High
Page 304 of 420

Bret R. Swan Appendix
SOURCES OF WORKLOAD CARDS: INSTRUCTIONS
The evaluation you are about to perform is a technique that has been developed by NASA to assess the relative importance of six factors in determining how much workload you experienced as a result of performing the task you have just completed. You will be given a series of pairs of rating scale titles (for example, Effort vs. Mental Demands).
1. Please choose between one of the two items within each pair that was more important to your experience of mental workload in the task that you just performed. Each pair of scale titles will appear on a separate box in the matrix below. Please circle your choice.
2. On a scale of 1 to 10, write your rating of the how important the item your selected was to your experience of mental workload compared to the item you didn’t select, on a scale of 1 to 10.
• 1 = Difficult to decide which one was more important because both were almost equally important to my experience of mental workload.
• 10 = My selection was a great deal more important to my experience of mental workload compared to the other item. It was extremely easy to identify my choice as more important.
Please consider your choices carefully and make them consistent with how you used the rating scales during the particular task you were asked to evaluate. Don’t think that there is any correct pattern. We are only interested in opinions. If you have any questions, please ask them now. Otherwise, you may begin.
NASA TLX SCORING CARDS
Frustration or
Effort
Performance or
Mental Demand
Physical Demand or
Frustration
Performance or
Temporal Demand
Mental Demand or
Effort
Physical Demand or
Temporal Demand
Mental Demand or
Physical Demand
Effort or
Physical Demand
Temporal Demand or
Mental Demand
Frustration or
Mental Demand
Effort or
Performance
Temporal Demand or
Effort
Physical Demand or
Performance
Performance or
Frustration
Temporal Demand or
Frustration
Page 305 of 420

Bret R. Swan Appendix
Self-Efficacy Questionnaire I COULD COMPLETE THE TASK QUESTIONNAIRES USING THE DIAGRAMS PROVIDED …
NOT AT ALL CONFIDENT
┌─┐
MODERATELY CONFIDENT
┌─┐
TOTALLY CONFIDENT
┌─┐
1. …if there was no one around to tell me what to do.
YES……..1 2 3 4 5 6 7 8 9 10
NO
2. …if I had never used these types of diagrams before.
YES……..1 2 3 4 5 6 7 8 9 10
NO
3. …if I had only the training handouts for reference.
YES……..1 2 3 4 5 6 7 8 9 10
NO
4. …if I had seen someone else using the diagrams before trying them myself.
YES……..1 2 3 4 5 6 7 8 9 10
NO
5. …if I could call on someone for help if I got stuck.
YES……..1 2 3 4 5 6 7 8 9 10
NO
6. …if someone else had helped me get started.
YES……..1 2 3 4 5 6 7 8 9 10
NO
7. …if I had a lot of time to complete the task for which the training was provided.
YES……..1 2 3 4 5 6 7 8 9 10
NO
8. …if I had just the materials provided during training for assistance.
YES……..1 2 3 4 5 6 7 8 9 10
NO
10. …if I had used similar diagrams to do the other tasks before completing this task.
YES……..1 2 3 4 5 6 7 8 9 10
NO
Page 306 of 420

Bret R. Swan Appendix
I.5 TRAINING TASK ASSESSMENT PACKET – METAGRAPH USER
Training Questionnaire Assessing Task-Centric Metagraph Diagrams
BPM User
Comprehension Components
User Comprehension Training Questions
Task-Centric Questions (T) [Diagram A]
T1.1 Given a task, T11, to execute, what other tasks must be executed immediately before T11 to provide the information needed to execute task T11?
(a) T1, T12 (b) T5, T6 only (c) T5, T6, T7, T8 (d) T12 only (e) None of the above
T2.1 If task T11 is disabled, what other tasks will be affected that immediately
follow T11 – in other words, what other tasks cannot be executed because T11 is disabled?
(a) T12 (b) T5, T7, T7, T8 (c) T1 (d) All of the tasks (e) None of the above
T3.1 What task is performed the most in the list below? (a) T1 (b) T5 (c) T11 (d) T12 (e) None of the above
T3.2 What task is performed the least in the list below? (a) T1 (b) T7 (c) T2 (d) T3 (e) None of the above
*Assume that the answers listed are complete – in other words, if an item is not listed, it is not part of the listed answer.
Page 307 of 420

Bret R. Swan Appendix
BPM User
Comprehension Components
ANSWERS
Task-Centric Questions (T) [Diagram A]
T1.1 Given a task, T11, to execute, what other tasks must be executed immediately before T11 to provide the information needed to execute task T11?
(d) T5, T6, T7, T8 is the Correct Answer Why?: • Because the arrows come IN to T11 designate tasks that must be
executed immediately before you can execute T11. • Since T5, T6, T7, T8 are included in the circle, and the arrow come
OUT from the edge of the circle, all the tasks within the circle must precede T11.
• T1 is not correct because it is not executed immediately before T11. T1 would have been part of the answer IF the question had included such a phase as “directly AND indirectly”.
T2.1 If task T11 is disabled, what other tasks will be affected that immediately
follow T11 – in other words, what other tasks cannot be executed because T11 is disabled?
(a) T12 is the Correct Answer Why?: • Because the arrows OUT of T11 designate tasks that follow
immediately after T11. T12 is the only task that is attached to arrows from T11.
T3.1 What task is utilized the most from the list below?
(a) T1 is the Correct Answer Why?: • Because there are two arrows OUT of T1 to other tasks and one arrow
coming into T1. This means that T1 must be executed before Both T11 and T12 can be executed. Therefore, both T11 and T12 must utilize T1.
T3.2 What task is utilized the least from the list below?
(e) None of the above Why?: • Because all tasks have one arrow coming and one arrow coming in,
except T1. Therefore, all tasks but T1 appear to be executed or utilized the same number of times. So we cannot determine which task is the least utilized.
*Assume that the answers listed are complete – in other words, if an item is not listed, it is not part of the listed answer.
Page 308 of 420

Bret R. Swan Appendix
Questionnaire Assessing Resource-Centric Metagraph Diagrams
BPM User
Comprehension Components
User Comprehension Training Questions
Resource-Centric Questions (R) [Diagram B]
R1.1 If a resource R4 is unavailable, what other resources that directly follow or are associated with R4 will be affected?
(a) All resources (b) R2 only (c) R2, R6 (d) R2, R10, R16 (e) None of the above
R2.1 What specific resources directly precede or are associated with R16 that
provides information for R16 to perform its tasks? (a) R10 (b) R2 only (c) R2, R6 (d) R2, R4, R6 (e) None of the above
R3.1 What is the most utilized resource in the list below?
(a) R2 (b) R10 (c) R6 (d) R4 (e) None of the above
R3.2 What is the least utilized resource(s) in the list below? (a) R2 (b) R10 (c) R16 (d) R10 and R16 (e) None of the above
*Assume that the answers listed are complete – in other words, if an item is not listed, it is not part of the listed answer.
Page 309 of 420

Bret R. Swan Appendix
BPM User Comprehension
Components ANSWERS
Resource-Centric Questions (R) [Diagram B]
R1.1 If a resource R4 is unavailable, what other resources that directly follow or are associated with R4 will be affected?
(d) R2, R10, R16 is the Correct Answer
Why?: • R2 and R4 are grouped in a circle with one arrow going out to another
circle that contains R10 and R16. This means that BOTH R2 and R4 are required to produce an information element (IE16) that is required by R10 and R16.
• The arrow from the R2-R4 circle indicates that IE16 (listed on the arrow) is produced by the combination of R2 and R4.
• Therefore, when R4 is unavailable, R2, R10 and R16 are affected because IE16 can’t be produced.
R2.1 What specific resources directly precede or are associated with R16 that
provides information for R16 to perform its tasks? (c) R2, R4, R6 is the Correct Answer Why?: • R2 and R6 are grouped in a circle with one arrow going out to R16. • R2 and R4 are grouped in a circle with one arrow going out to a circle
that includes R16. • Therefore, R2, R4 and R6 precede R16.
R3.1 What is the most utilized resource in the list below? (a) R2 is the Correct Answer Why?: • R2 is used in conjunction with both R4 and R6 making it the most
utilized resource.
R3.2 What is the least utilized resource(s) in the list below? (d) R10 and R16 is the Correct Answer Why?: • R10 and R16 are the only resources that are not used to produce
information for another resource. Therefore, they are equally the least used resources.
*Assume that the answers listed are complete – in other words, if an item is not listed, it is not part of the listed answer.
Page 310 of 420

Bret R. Swan Appendix
Questionnaire Assessing Information-Centric Metagraph Diagrams
BPM User Comprehension
Components User Comprehension Training Questions
Information-Centric Questions (IE) [Diagram C]
IE1.1 Given three information elements, IE19, IE21, IE22, which of them is needed to determine the value of the other(s)?
(a) IE19 determine IE21 and IE22 (b) IE19 and IE21 determine IE22 (c) IE22 determine IE19 and IE21 (d) IE19 and IE22 determine IE21 (e) None of the above
IE2.1 Given two sets of information elements {IE6, IE17} and {IE19, IE21}, is it
possible to determine the values of the second set from the elements in the first set, and if not, are there any additional information elements that would make it possible to do so?
(a) Yes – No other information elements are needed (b) No – unless {IE22} is also included (c) No – unless {IE17} is also dropped from the list (d) No – unless {IE20} is also included (e) No – the first set does not determine the values of the second set, and
the addition of information elements will not change this fact.
IE3.1 What was the most utilized information element in the process that is listed below?
(a) IE6 (b) IE19 (c) IE21 (d) IE22 (e) None of the above
IE3.2 What was the least utilized information element in the process that is listed
below? (a) IE6 (b) IE19 (c) IE21 (d) IE22 (e) None of the above
*Assume that the answers listed are complete – in other words, if an item is not listed, it is not part of the listed answer.
Page 311 of 420

Bret R. Swan Appendix
BPM User
Comprehension Components
ANSWERS
Information-Centric Questions (IE) [Diagram C]
IE1.1 Given three information elements, IE19, IE21, IE22, which of them is needed to determine the value of the other(s)?
(b) IE19 and IE21 determine IE22 is the Correct Answer Why?: • IE19 and IE21 are grouped in a circle with one arrow going out to
IE22. Therefore, IE19 and IE21 determine the value of IE22.
IE2.1 Given two sets of information elements {IE6, IE17} and {IE19, IE21}, is it possible to determine the values of the second set from the elements in the first set, and if not, are there any additional information elements that would make it possible to do so?
(d) No – unless {IE20} is also included - is the Correct Answer Why?: • IE6, IE17, and IE20 are grouped in a circle with one arrow going out to
point at a circle that includes IE19 and IE21. Therefore, if IE 20 is included in the list, IE6 and IE17 are able to determine the values of IE19 and IE21.
IE3.1 What was the most utilized information element in the process that is listed
below? (e) None of the above – is the Correct Answer Why?: • All information elements are used just once to produce other
information elements. Therefore, it can’t be determined if one element is more utilized than another.
IE3.2 What was the least used or least critical information element in the process that
is listed below? (e) None of the above – is the Correct Answer Why?: • All information elements are used just once to produce other
information elements. Therefore, it can’t be determined if one element is the least utilized.
*Assume that the answers listed are complete – in other words, if an item is not listed, it is not part of the listed answer.
Page 312 of 420

Bret R. Swan Appendix
Sample Questions Assessing Interactions Between All Diagrams
BPM User Comprehension
Components User Comprehension Training Questions
Questions Concerning the Interactions among Components (CI)
CI1.1 If a resource, R0, is unavailable, which information elements and tasks in the entire process can still be generated and completed?
[Diagrams A, B, and C]
CI2.1 If an information element, IE0, is found to be inaccurate, which resources and tasks are used, directly or indirectly across the entire process, in the calculation or creation of IE0?
CI3.1 Given a task, T0, what information elements and resources directly affect
the performance of these tasks?
CI4.1 What tasks, information elements and resources are needed as inputs, directly or indirectly, to perform T0?
CI5.1 What is the single most utilized information element, task, or resource in
the process? CI5.2 What is the single least utilized information element, task, or resource in
the process?
*Assume that the answers listed are complete – in other words, if an item is not listed, it is not part of the listed answer.
NOTE: No answers are provided for these questions. These are only to give you a preview of the types of questions you will answer about the interactions between the diagrams in the experiment.
Page 313 of 420

Bret R. Swan Appendix
Assessment of the Mental Workload You Just Experienced
Please consider your choices carefully and make them consistent with how you used the
rating scales during the particular task you just completed and are now asked to evaluate. Don’t
think that there is any correct pattern. I am only interested in your opinions. If you have any
questions, please ask them now. Otherwise, you may begin.
SCALE TITLES FOR ASSESSMENT OF MENTAL WORKLOAD
TITLE ENDPOINTS DESCRIPTIONS Mental Demand Low/High How much mental and perceptual activity is
required (e.g. thinking, deciding, calculating, remembering, looking, searching, etc.)? Was the task easy or demanding, simple or complex, exacting or forgiving?
Physical Demand Low/High How much physical activity was required(e.g. pushing, pulling, turning, controlling, activating, etc.)? Was the task easy or demanding, slow or brisk, slack or strenuous, restful or laborious?
Temporal Demand
Low/High How much time pressure did you feel due to the rate or pace at which tasks or task elements occurred? Was the pace slow and leisurely or rapid and frantic?
Performance Bad/Good How successful do you think you were in accomplishing the goals of the task set by the experimenter (or yourself)? How satisfied were you with your performance in accomplishing these goals?
Effort Low/High How hard did you have to work (mentally and physically) to accomplish your level of performance?
Frustration Level Low/High How insecure, discouraged, irritated, stressed, and annoyed versus secure, gratified, content, relaxed, and complacent did you feel during the task?
Page 314 of 420
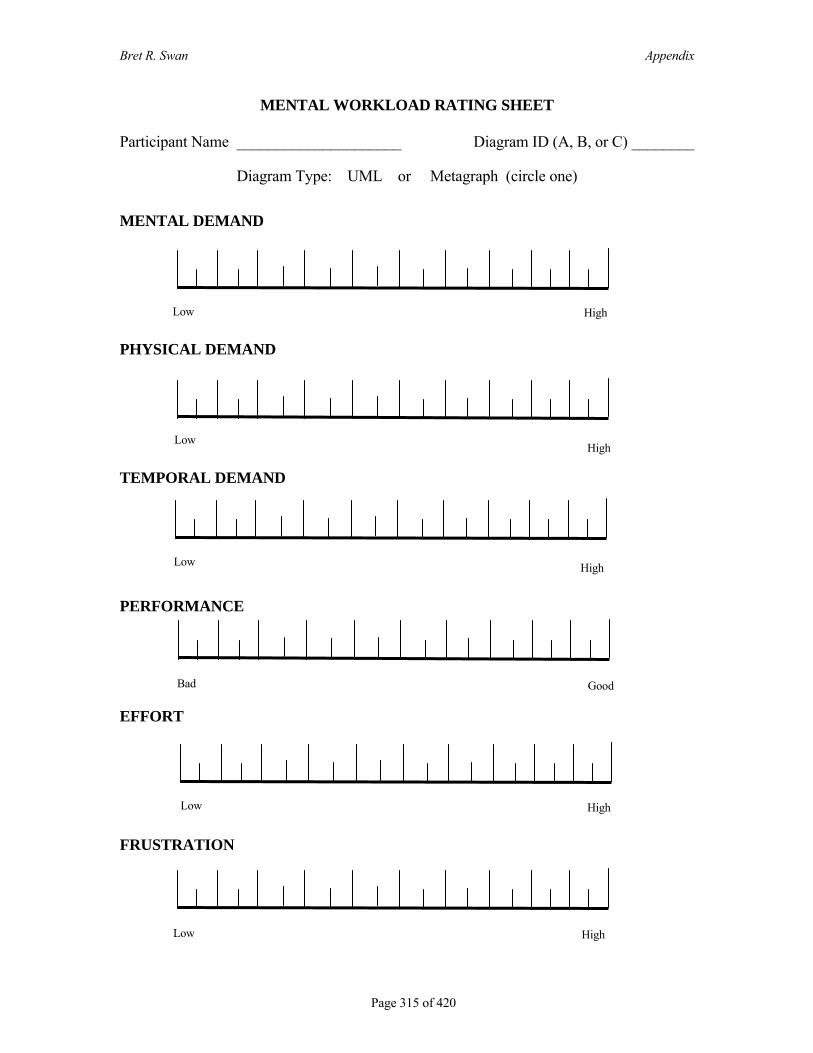
Bret R. Swan Appendix
MENTAL WORKLOAD RATING SHEET Participant Name _____________________ Diagram ID (A, B, or C) ________
Diagram Type: UML or Metagraph (circle one)
MENTAL DEMAND
Low High PHYSICAL DEMAND
Low
High TEMPORAL DEMAND
Low High PERFORMANCE Bad Good EFFORT
Low High FRUSTRATION
Low High
Page 315 of 420

Bret R. Swan Appendix
SOURCES OF WORKLOAD CARDS: INSTRUCTIONS
The evaluation you are about to perform is a technique that has been developed by NASA to assess the relative importance of six factors in determining how much workload you experienced as a result of performing the task you have just completed. You will be given a series of pairs of rating scale titles (for example, Effort vs. Mental Demands).
3. Please choose between one of the two items within each pair that was more important to your experience of mental workload in the task that you just performed. Each pair of scale titles will appear on a separate box in the matrix below. Please circle your choice.
4. On a scale of 1 to 10, write your rating of the how important the item your selected was to your experience of mental workload compared to the item you didn’t select, on a scale of 1 to 10.
• 1 = Difficult to decide which one was more important because both were almost equally important to my experience of mental workload.
• 10 = My selection was a great deal more important to my experience of mental workload compared to the other item. It was extremely easy to identify my choice as more important.
Please consider your choices carefully and make them consistent with how you used the rating scales during the particular task you were asked to evaluate. Don’t think that there is any correct pattern. We are only interested in opinions. If you have any questions, please ask them now. Otherwise, you may begin.
NASA TLX SCORING CARDS
Frustration or
Effort
Performance or
Mental Demand
Physical Demand or
Frustration
Performance or
Temporal Demand
Mental Demand or
Effort
Physical Demand or
Temporal Demand
Mental Demand or
Physical Demand
Effort or
Physical Demand
Temporal Demand or
Mental Demand
Frustration or
Mental Demand
Effort or
Performance
Temporal Demand or
Effort
Physical Demand or
Performance
Performance or
Frustration
Temporal Demand or
Frustration
Page 316 of 420

Bret R. Swan Appendix
Self-Efficacy Questionnaire I COULD COMPLETE THE TASK QUESTIONNAIRES USING THE DIAGRAMS PROVIDED …
NOT AT ALL CONFIDENT
┌─┐
MODERATELY CONFIDENT
┌─┐
TOTALLY CONFIDENT
┌─┐
1. …if there was no one around to tell me what to do.
YES……..1 2 3 4 5 6 7 8 9 10
NO
2. …if I had never used these types of diagrams before.
YES……..1 2 3 4 5 6 7 8 9 10
NO
3. …if I had only the training handouts for reference.
YES……..1 2 3 4 5 6 7 8 9 10
NO
4. …if I had seen someone else using the diagrams before trying them myself.
YES……..1 2 3 4 5 6 7 8 9 10
NO
5. …if I could call on someone for help if I got stuck.
YES……..1 2 3 4 5 6 7 8 9 10
NO
6. …if someone else had helped me get started.
YES……..1 2 3 4 5 6 7 8 9 10
NO
7. …if I had a lot of time to complete the task for which the training was provided.
YES……..1 2 3 4 5 6 7 8 9 10
NO
8. …if I had just the materials provided during training for assistance.
YES……..1 2 3 4 5 6 7 8 9 10
NO
10. …if I had used similar diagrams to do the other tasks before completing this task.
YES……..1 2 3 4 5 6 7 8 9 10
NO
Page 317 of 420

Bret R. Swan Appendix
I.6 EXPERIMENTAL TASK SCRIPTS - INTRODUCTION
This experiment consists of two phases: a training phase and an experimental phase.
During the training phase, you will be given instruction and allows to practice interpreting
simplified diagrams of a business process. During the experimental phase, you will apply what you
have learned to the interpretation of diagrams that represent a real-world business process.
Training Phase:
Your training on the metagraph Diagrams used in this experiment will proceed in this
order:
(1) You will be presented with a training document that explains and illustrates the
metagraph diagrams used in this experiment.
(2) We will read the document that will explain how to read and interpret the symbols on
this diagram.
(3) You will be asked to answer some questions that allow you to practice interpreting this
type of diagram.
(4) When you have completed the practice questions, you will be asked to fill out a brief
survey that assesses the mental workload you experienced during the training exercise.
(5) Once have completed the training and are ready to begin the experimental phase. Make
sure the facilitator is aware you are ready to begin so you time performing the task can
be accurately recorded.
The experimental phase will proceed in a similar way to the training phase, except (a) the
diagrams will be different, (b) you answer the same kinds of questions you answered during the
training phase, and (c) you will be asked to complete the mental workload questionnaire after each
set of the four sets of questions (instead of only at the end - as in the training phase).
REMEMBER!
During the experiment, you will win the gift certificates if you have BOTH the highest
number of correct answers AND the lowest time spent answering the questions. In other words,
Page 318 of 420

Bret R. Swan Appendix
you are trying to maximize how many questions you answer correctly and minimize the amount of
time you take to answer those questions.
Good Luck!!
Experimental Phase:
In order to train you in how to interpret a type of graphical process model (called
metagraph diagrams), you will play the role of a new manager in a bank that is trying to understand
your bank’s loan application process. This business process takes the completed loan application
of the customer and performs several tasks that use different types of resources and information, to
determine whether an application for a loan is to be accepted or rejected. You have been asked to
read and interpret three different graphical process models that depict three different views of the
same loan application process:
(a) A task-centric view of the loan application process
(b) A resource-centric view of the loan application process
(c) An information-centric view of the loan application process
Page 319 of 420

Bret R. Swan Appendix
I.7 EXPERIMENTAL TASK DESCRIPTION – BANK LOAN APPLICATION BPM
Task Description: The training tasks you are based on a loan approval business process2.
You represent a manager in this company that has been asked to read and interpret graphical
process models that describe different types of BPM task information prior to attending an
important meeting to discuss this business process. The loan approval process is modeled as using
metagraph diagrams. The following is a key to the abbreviations used in these maps as follows:
• A task is executed when the inputs are used to determine outputs. For example, several types of
documents are used in the Credit Rating task (T1) to determine the credit rating (output) of
a customer.
• A resource is an entity associated with one or more tasks, and the resource must be available if
the tasks are to be executed. Several resources may be associated with a single task, and
vice versa. Resources may be a person, a statement of information, piece of software, an
information system, or a document (called an ‘abstract’) in the context of this experiment.
For example, to determine the credit rating of the client, a loan officer (R1 – a person
resource) and the customer loan application (R10 - an abstract document resource) are
required.
• An information element is a single data item. An information element can be a single or a set
of numbers, characters, words, images, or icons (as would be found in a document). For
example, the information elements needed as inputs to the Credit Rating Task are the
applicant’s account data (IE1), loan application data (IE2), and credit history (IE3).
• A process is a set of tasks that connects one set of information elements to another set of
information elements. All inputs for any task in the process must be either in the form of
information elements or from the output of some other task(s) in the system. For example,
the loan approval process begins with three information elements serving as inputs to task
T1. Task T1’s outputs serve as inputs to task T2, as well as produce another information
element (IE6).
There are eight tasks in the loan approval process, as follows:
2 Adapted from Basu and Blanning (2000).
Page 320 of 420

Bret R. Swan Appendix
T1: Credit Risk Rating - The loan officer uses account data, the applicant’s credit history,
and applicant data to calculate the applicant’s credit rating.
T2: Property Appraisal Task - The property appraiser uses data about the property along
with data about comparable properties to calculate the appraised value of the
property.
T3: Risk Assessment Task - The loan officer uses the applicant’s credit rating, the
appraised value of the property, and the loan amount to calculate the level of risk
associated with the loan.
T4: Loan Amount Reduction Task - If the risk of the loan is determined to be a bad risk,
the branch manager uses the appraised value of the property and the level of risk
associated with the loan to calculate a new loan amount.
T5: Risk Exposure Assessment Task - The risk analyst and the property appraiser use the
appraised value of the property, the loan amount, and the current bank portfolio of
loans to calculate the bank’s current risk exposure.
T6: Acceptable Risk Assessment Task - The system examines the risk associated with the
loan and performs the calculations needed to determine whether the risk is
acceptable.
T7: The Loan is Approved - If the level of risk is acceptable, the loan officer uses the risk
associated with the loan and the bank’s risk exposure to decide whether to approve
the loan.
T8: The Loan is Rejected - If the loan application represents a bad risk, the loan officer
rejects the application.
Page 321 of 420

Bret R. Swan Appendix
There are six resources used in the loan application process:
• R1: a property appraiser;
• R2: the branch manager;
• R3: a loan officer;
• R4: a risk analyst;
• R10: a completed loan application from a customer;
• R11: an automated bank information system;
Finally, there are information elements in the loan approval process:
• IE1: account data of the applicant;
• IE2: applicant data from the loan application;
• IE3: credit history of the applicant;
• IE4: data about the property for which the loan is sought;
• IE5: data about comparable properties;
• IE6: applicant’s credit rating;
• IE7: the amount of the loan;
• IE8: the appraised value of the property;
• IE9: the current bank portfolio of loans;
• IE10: the bank’s level of acceptable risk;
• IE11: the level of risk associated with the loan;
• IE12: the bank’s current risk exposure;
• IE13: a statement that the application is approved;
• IE14: a statement that the application is rejected.
You may refer to these descriptions at any time during the experiment.
Page 322 of 420
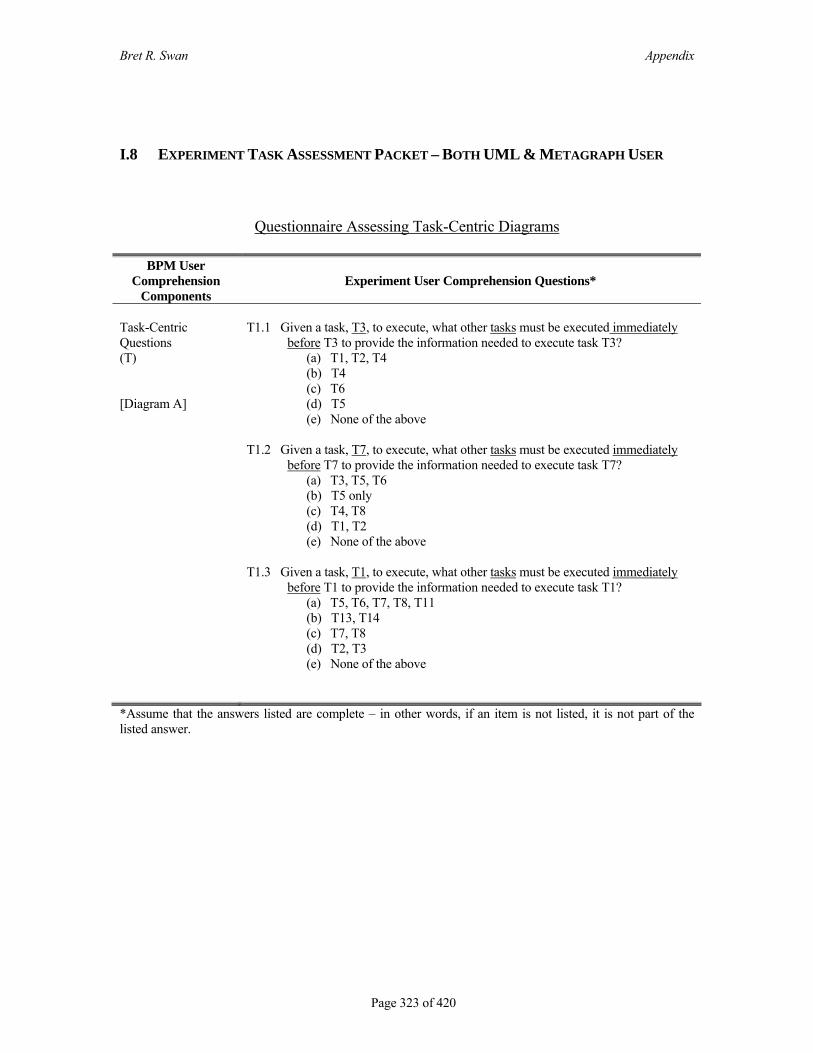
Bret R. Swan Appendix
I.8 EXPERIMENT TASK ASSESSMENT PACKET – BOTH UML & METAGRAPH USER
Questionnaire Assessing Task-Centric Diagrams
BPM User Comprehension
Components Experiment User Comprehension Questions*
Task-Centric Questions (T) [Diagram A]
T1.1 Given a task, T3, to execute, what other tasks must be executed immediately before T3 to provide the information needed to execute task T3?
(a) T1, T2, T4 (b) T4 (c) T6 (d) T5 (e) None of the above
T1.2 Given a task, T7, to execute, what other tasks must be executed immediately before T7 to provide the information needed to execute task T7?
(a) T3, T5, T6 (b) T5 only (c) T4, T8 (d) T1, T2 (e) None of the above
T1.3 Given a task, T1, to execute, what other tasks must be executed immediately
before T1 to provide the information needed to execute task T1? (a) T5, T6, T7, T8, T11 (b) T13, T14 (c) T7, T8 (d) T2, T3 (e) None of the above
*Assume that the answers listed are complete – in other words, if an item is not listed, it is not part of the listed answer.
Page 323 of 420

Bret R. Swan Appendix
BPM User
Comprehension Components
Experiment User Comprehension Questions
Task-Centric Questions (T) (Continued) [Diagram A]
T2.1 If task T7 is disabled, what other tasks will be affected that immediately follow T7 – in other words, what other tasks cannot be executed because T7 is disabled?
(a) T11. T12 (b) T5, T6, T8 (c) T3, T9 (d) T0, T10 (e) None of the above
T2.2 If task T1 is disabled, what other tasks will be affected that immediately follow T1 – in other words, what other tasks cannot be executed because T1 is disabled?
(a) T4 (b) T5 (c) T2, T3 (d) T2 only (e) None of the above
T2.3 If task T2 is disabled, what other tasks will be affected that immediately follow
T2 – in other words, what other tasks cannot be executed because T2 is disabled?
(a) T3, T4, T5 (b) T1 (c) T5, T6, T7, T8 (d) T1, T2, T3, T4 (e) None of the above
T3.1 What task is utilized the most from the list below? (a) T4 (b) T9 (c) T10 (d) T6 (e) None of the above
T3.2 What task is utilized the least from the list below? (a) T1 (b) T7 (c) T2 (d) T3 (e) None of the above
*Assume that the answers listed are complete – in other words, if an item is not listed, it is not part of the
listed answer.
Page 324 of 420

Bret R. Swan Appendix
Assessment of the Mental Workload You Just Experienced
Please consider your choices carefully and make them consistent with how you used the
rating scales during the particular task you just completed and are now asked to evaluate. Don’t
think that there is any correct pattern. I am only interested in your opinions. If you have any
questions, please ask them now. Otherwise, you may begin.
SCALE TITLES FOR ASSESSMENT OF MENTAL WORKLOAD
TITLE ENDPOINTS DESCRIPTIONS Mental Demand Low/High How much mental and perceptual activity is
required (e.g. thinking, deciding, calculating, remembering, looking, searching, etc.)? Was the task easy or demanding, simple or complex, exacting or forgiving?
Physical Demand Low/High How much physical activity was required(e.g. pushing, pulling, turning, controlling, activating, etc.)? Was the task easy or demanding, slow or brisk, slack or strenuous, restful or laborious?
Temporal Demand
Low/High How much time pressure did you feel due to the rate or pace at which tasks or task elements occurred? Was the pace slow and leisurely or rapid and frantic?
Performance Bad/Good How successful do you think you were in accomplishing the goals of the task set by the experimenter (or yourself)? How satisfied were you with your performance in accomplishing these goals?
Effort Low/High How hard did you have to work (mentally and physically) to accomplish your level of performance?
Frustration Level Low/High How insecure, discouraged, irritated, stressed, and annoyed versus secure, gratified, content, relaxed, and complacent did you feel during the task?
Page 325 of 420

Bret R. Swan Appendix
MENTAL WORKLOAD RATING SHEET Participant Name _____________________ Diagram ID (A, B, or C) ________
Diagram Type: UML or Metagraph (circle one) MENTAL DEMAND
Low High PHYSICAL DEMAND
Low
High TEMPORAL DEMAND
Low High PERFORMANCE Bad Good EFFORT
Low High FRUSTRATION
Low High
Page 326 of 420

Bret R. Swan Appendix
Questionnaire Assessing Resource-Centric Diagrams
BPM User Comprehension
Components Experiment User Comprehension Questions
Resource-Centric Questions (R) [Diagram B]
R1.1 If a resource R1 is unavailable, what other resources that directly follow or are associated with R1 will be affected?
(a) All resources (b) R4, R10, R11 (c) R2, R3 (d) R4 only (e) None of the above
R1.2 If a resource R2 is unavailable, what other resources that directly follow or are associated with R2 will be affected?
(a) All resources (b) R1, R3, R4, R11 (c) R3 only (d) R10, R11 (e) None of the above
R1.3 If a resource R4 is unavailable, what other resources that directly follow or are associated with R4 will be affected?
(a) All resources (b) R1, R2, R3 (c) R10, R11 (d) R1 (e) None of the above
*Assume that the answers listed are complete – in other words, if an item is not listed, it is not part of the listed answer.
Page 327 of 420

Bret R. Swan Appendix
BPM User Comprehension
Components Experiment User Comprehension Questions
Resource-Centric Questions (R) (Continued) [Diagram B]
R2.1 What specific resources directly precede or are associated with R4 that provides information for R4 to perform its tasks?
(a) R1, R11 (b) R2, R3 (c) R1, R2 (d) R10, R11 (e) None of the above
R2.2 What specific resources directly precede or are associated with R11 that
provides information for R11 to perform its tasks? (a) R1, R2, R3 (b) R10 (c) R4 (d) R2, R3 only (e) None of the above
R2.3 What specific resources directly precede or are associated with R2 that provides
information for R2 to perform its tasks? (a) R4 (b) R1 (c) R10 (d) R11 (e) None of the above
R3.1 What is the most utilized resource in the list below?
(a) R2 (b) R10 (c) R11 (d) R1 (e) None of the above
R3.2 What is the least utilized resource in the list below? (a) R2 (b) R4 (c) R3 (d) R10 (e) None of the above
*Assume that the answers listed are complete – in other words, if an item is not listed, it is not part of the
listed answer.
Page 328 of 420

Bret R. Swan Appendix
Assessment of the Mental Workload You Just Experienced
Please consider your choices carefully and make them consistent with how you used the
rating scales during the particular task you just completed and are now asked to evaluate. Don’t
think that there is any correct pattern. I am only interested in your opinions. If you have any
questions, please ask them now. Otherwise, you may begin.
SCALE TITLES FOR ASSESSMENT OF MENTAL WORKLOAD
TITLE ENDPOINTS DESCRIPTIONS Mental Demand Low/High How much mental and perceptual activity is
required (e.g. thinking, deciding, calculating, remembering, looking, searching, etc.)? Was the task easy or demanding, simple or complex, exacting or forgiving?
Physical Demand Low/High How much physical activity was required(e.g. pushing, pulling, turning, controlling, activating, etc.)? Was the task easy or demanding, slow or brisk, slack or strenuous, restful or laborious?
Temporal Demand
Low/High How much time pressure did you feel due to the rate or pace at which tasks or task elements occurred? Was the pace slow and leisurely or rapid and frantic?
Performance Bad/Good How successful do you think you were in accomplishing the goals of the task set by the experimenter (or yourself)? How satisfied were you with your performance in accomplishing these goals?
Effort Low/High How hard did you have to work (mentally and physically) to accomplish your level of performance?
Frustration Level Low/High How insecure, discouraged, irritated, stressed, and annoyed versus secure, gratified, content, relaxed, and complacent did you feel during the task?
Page 329 of 420

Bret R. Swan Appendix
MENTAL WORKLOAD RATING SHEET Participant Name _____________________ Diagram ID (A, B, or C) ________
Diagram Type: UML or Metagraph (circle one) MENTAL DEMAND
Low High PHYSICAL DEMAND
Low
High TEMPORAL DEMAND
Low High PERFORMANCE Bad Good EFFORT
Low High FRUSTRATION
Low High
Page 330 of 420

Bret R. Swan Appendix
Questionnaire Assessing Information-Centric Diagrams
BPM User Comprehension
Components Experiment User Comprehension Questions
Information-Centric Questions (IE) [Diagram C]
IE1.1 Given three information elements, IE1, IE2, IE6, which of them is needed to determine the value of the other(s)?
(a) IE1 determine IE2 and IE6 (b) IE1 and IE2 determine IE6 (c) IE2 determine IE1 and IE6 (d) IE6 and IE2 determine IE1 (e) None of the above
IE1.2 Given two information elements, IE11, IE14, which of them is needed to
determine the value of the other(s)? (a) IE11 determine IE14 and IE2 (b) IE14 determine IE11 (c) IE2 determine IE11 and IE14 (d) IE11 determine IE14 (e) None of the above
IE1.3 Given six information elements, IE1, IE2, IE3, IE4, IE10, IE11, which of them
is needed to determine the value of the other(s)? (a) IE1, IE2, IE3, IE4, IE10 determine IE11 (b) IE11 determine IE1, IE2, IE3, IE4, IE10 (c) IE1, IE3, IE10, determine IE2, IE4, IE11 (d) IE2, IE3, IE11 determine IE1, IE4, IE10 (e) None of the above
*Assume that the answers listed are complete – in other words, if an item is not listed, it is not part of the listed answer.
Page 331 of 420

Bret R. Swan Appendix
BPM User
Comprehension Components
Experiment User Comprehension Questions
Information-Centric Questions (IE) (Continued) [Diagram C]
IE2.1 Given two sets of information elements {IE6 IE7, IE8} and {IE10, IE11, IE12}, is it possible to determine the values of the second set from the elements in the first set, and if not, are there any additional information elements that would make it possible to do so?
(a) Yes – No other information elements are needed (b) No – unless {IE9} are also included (c) No – unless {IE1 and IE2} are also included (d) No – unless {IE4 and IE5} are also included (e) No – the first set does not determine the values of the second set, and
the addition of information elements will not change this fact.
IE2.2 Given two sets of information elements, {IE1, IE2, IE3} and {IE11}, is it possible to determine the values of the second set from the elements in the first set, and if not, are there any additional information elements that would make it possible to do so?
(a) Yes – No other information elements are needed (b) No – unless {IE10, IE12} are also included (c) No – unless {IE7, IE8, IE9} are also included (d) No – unless {IE6, IE7, IE8} are also included (e) No – the first set does not determine the values of the second set, and
the addition of information elements will not change this fact. IE2.3 Given two sets of information elements, {IE6, IE7, IE8, IE9, IE10, IE11} and
{IE13, IE14}, is it possible to determine the values of the second set from the elements in the first set, and if not, are there any additional information elements that would make it possible to do so?
(a) Yes – No other information elements are needed (b) No – unless {IE1} is also included (c) No – unless {IE12} is also included (d) No – unless {IE4, IE5} are also included (e) No – the first set does not determine the values of the second set, and
the addition of information elements will not change this fact.
*Assume that the answers listed are complete – in other words, if an item is not listed, it is not part of the listed answer.
Page 332 of 420

Bret R. Swan Appendix
BPM User
Comprehension Components
Experiment User Comprehension Questions
Information-Centric Questions (IE) (Continued) [Diagram C]
IE3.1 What was the most used or most critical information element in the process that is listed below?
(a) IE8 or IE11 (b) IE1 (c) IE5 (d) IE13 (e) None of the above
IE3.2 What was the least used or least critical information element in the process
that is listed below? (a) IE7 (b) IE13 or IE 14 (c) IE2 (d) IE5 (e) None of the above
*Assume that the answers listed are complete – in other words, if an item is not listed, it is not part of the listed answer.
Page 333 of 420

Bret R. Swan Appendix
Assessment of the Mental Workload You Just Experienced
Please consider your choices carefully and make them consistent with how you used the
rating scales during the particular task you just completed and are now asked to evaluate. Don’t
think that there is any correct pattern. I am only interested in your opinions. If you have any
questions, please ask them now. Otherwise, you may begin.
SCALE TITLES FOR ASSESSMENT OF MENTAL WORKLOAD
TITLE ENDPOINTS DESCRIPTIONS Mental Demand Low/High How much mental and perceptual activity is
required (e.g. thinking, deciding, calculating, remembering, looking, searching, etc.)? Was the task easy or demanding, simple or complex, exacting or forgiving?
Physical Demand Low/High How much physical activity was required(e.g. pushing, pulling, turning, controlling, activating, etc.)? Was the task easy or demanding, slow or brisk, slack or strenuous, restful or laborious?
Temporal Demand
Low/High How much time pressure did you feel due to the rate or pace at which tasks or task elements occurred? Was the pace slow and leisurely or rapid and frantic?
Performance Bad/Good How successful do you think you were in accomplishing the goals of the task set by the experimenter (or yourself)? How satisfied were you with your performance in accomplishing these goals?
Effort Low/High How hard did you have to work (mentally and physically) to accomplish your level of performance?
Frustration Level Low/High How insecure, discouraged, irritated, stressed, and annoyed versus secure, gratified, content, relaxed, and complacent did you feel during the task?
Page 334 of 420
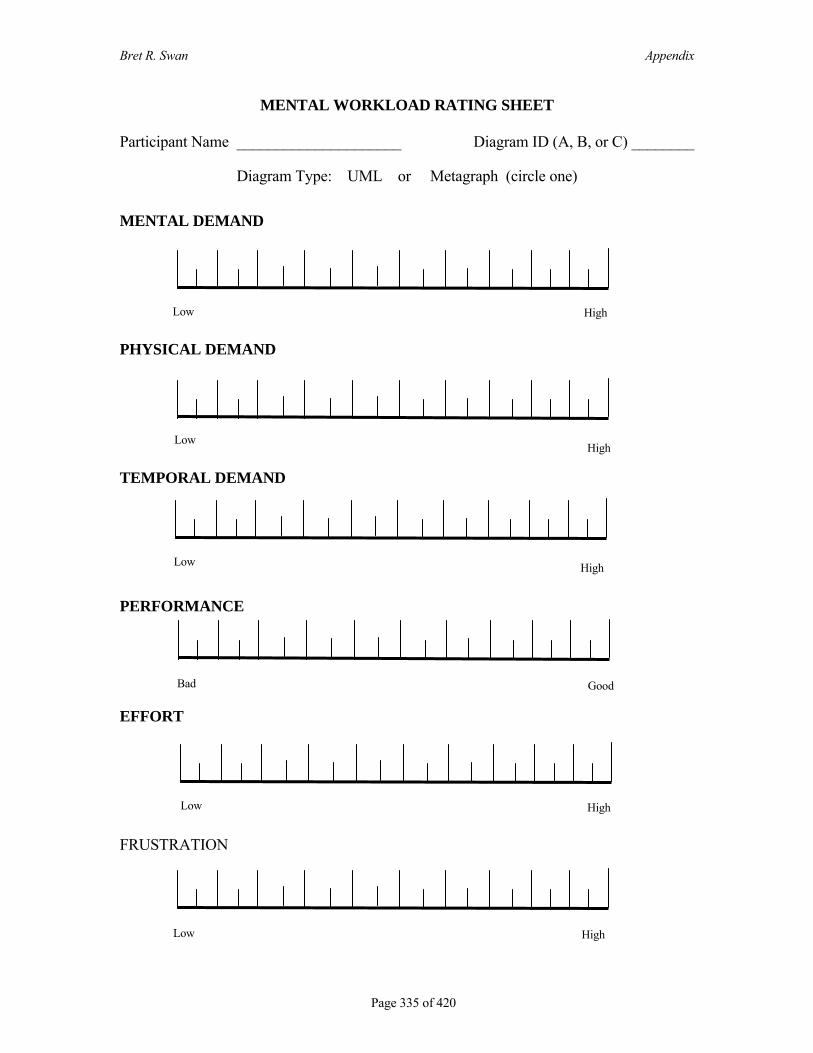
Bret R. Swan Appendix
MENTAL WORKLOAD RATING SHEET Participant Name _____________________ Diagram ID (A, B, or C) ________
Diagram Type: UML or Metagraph (circle one)
MENTAL DEMAND
Low High PHYSICAL DEMAND
Low
High TEMPORAL DEMAND
Low High PERFORMANCE Bad Good EFFORT
Low High FRUSTRATION
Low High
Page 335 of 420
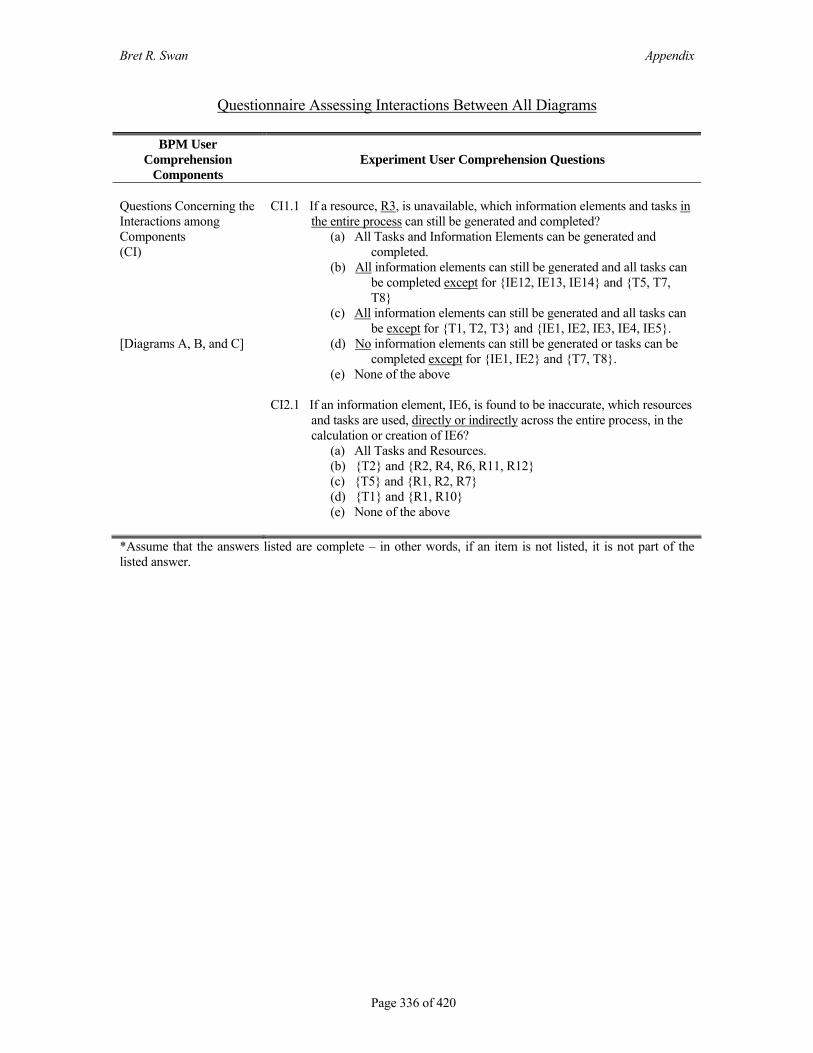
Bret R. Swan Appendix
Questionnaire Assessing Interactions Between All Diagrams
BPM User Comprehension
Components Experiment User Comprehension Questions
Questions Concerning the Interactions among Components (CI) [Diagrams A, B, and C]
CI1.1 If a resource, R3, is unavailable, which information elements and tasks in the entire process can still be generated and completed?
(a) All Tasks and Information Elements can be generated and completed.
(b) All information elements can still be generated and all tasks can be completed except for {IE12, IE13, IE14} and {T5, T7, T8}
(c) All information elements can still be generated and all tasks can be except for {T1, T2, T3} and {IE1, IE2, IE3, IE4, IE5}.
(d) No information elements can still be generated or tasks can be completed except for {IE1, IE2} and {T7, T8}.
(e) None of the above
CI2.1 If an information element, IE6, is found to be inaccurate, which resources and tasks are used, directly or indirectly across the entire process, in the calculation or creation of IE6?
(a) All Tasks and Resources. (b) {T2} and {R2, R4, R6, R11, R12} (c) {T5} and {R1, R2, R7} (d) {T1} and {R1, R10} (e) None of the above
*Assume that the answers listed are complete – in other words, if an item is not listed, it is not part of the listed answer.
Page 336 of 420

Bret R. Swan Appendix
BPM User
Comprehension Components
Experiment User Comprehension Questions
Questions Concerning the Interactions among Components (CI) (Continued) [Diagrams A, B, and C]
CI3.1 Given a set of tasks, {T1, T2}, what information elements and resources directly affect the performance of these tasks?
(a) All Information Elements and Resources. (b) {R1, R2, R10} and {IE1, IE2, IE3, IE4, IE5} (c) {R1, R3, R10, R12, R14, R21} and {IE5, IE7, IE9, IE11, IE13,
IE15, IE17, IE21} (d) {R2, R4, R6, R10, R11, R12, R13, R14, R15, R16} and {IE10,
IE11, IE12, IE13, IE14, IE15, IE16} (e) None of the above
CI4.1 What tasks, information elements and resources are needed as inputs,
directly or indirectly, to perform T5? (a) All Tasks, Information Elements, and Resources. (b) {R1, R2, R3, R4, R10} and {IE1, IE2, IE3, IE4, IE5, IE7, IE8}
and {T1, T2, T4} (c) {R1, R2, R3, R10, R11} and { IE1, IE2} and {T1, T4, T6}. (d) {R1, R2, R11} and {IE4, IE5, IE6, IE7} and {T2, T3, T4}. (e) None of the above
CI5.1 What is the single most utilized information element, task, or resource in
the process - that is included in the list below? (a) R1 (b) IE1 or IE2 (c) T10 (d) All of the above (e) Cannot be determined from these diagrams
CI5.2 What is the single least utilized information element, task, or resource in
the process - that is included in the list below? (a) IE7 (b) R4 (c) T7 or T8 (d) All of the above (e) Cannot be determined from these diagrams
*Assume that the answers listed are complete – in other words, if an item is not listed, it is not part of the listed answer.
Page 337 of 420

Bret R. Swan Appendix
Assessment of the Mental Workload You Just Experienced
Please consider your choices carefully and make them consistent with how you used the
rating scales during the particular task you just completed and are now asked to evaluate. Don’t
think that there is any correct pattern. I am only interested in your opinions. If you have any
questions, please ask them now. Otherwise, you may begin.
SCALE TITLES FOR ASSESSMENT OF MENTAL WORKLOAD
TITLE ENDPOINTS DESCRIPTIONS Mental Demand Low/High How much mental and perceptual activity is
required (e.g. thinking, deciding, calculating, remembering, looking, searching, etc.)? Was the task easy or demanding, simple or complex, exacting or forgiving?
Physical Demand Low/High How much physical activity was required(e.g. pushing, pulling, turning, controlling, activating, etc.)? Was the task easy or demanding, slow or brisk, slack or strenuous, restful or laborious?
Temporal Demand
Low/High How much time pressure did you feel due to the rate or pace at which tasks or task elements occurred? Was the pace slow and leisurely or rapid and frantic?
Performance Bad/Good How successful do you think you were in accomplishing the goals of the task set by the experimenter (or yourself)? How satisfied were you with your performance in accomplishing these goals?
Effort Low/High How hard did you have to work (mentally and physically) to accomplish your level of performance?
Frustration Level Low/High How insecure, discouraged, irritated, stressed, and annoyed versus secure, gratified, content, relaxed, and complacent did you feel during the task?
Page 338 of 420
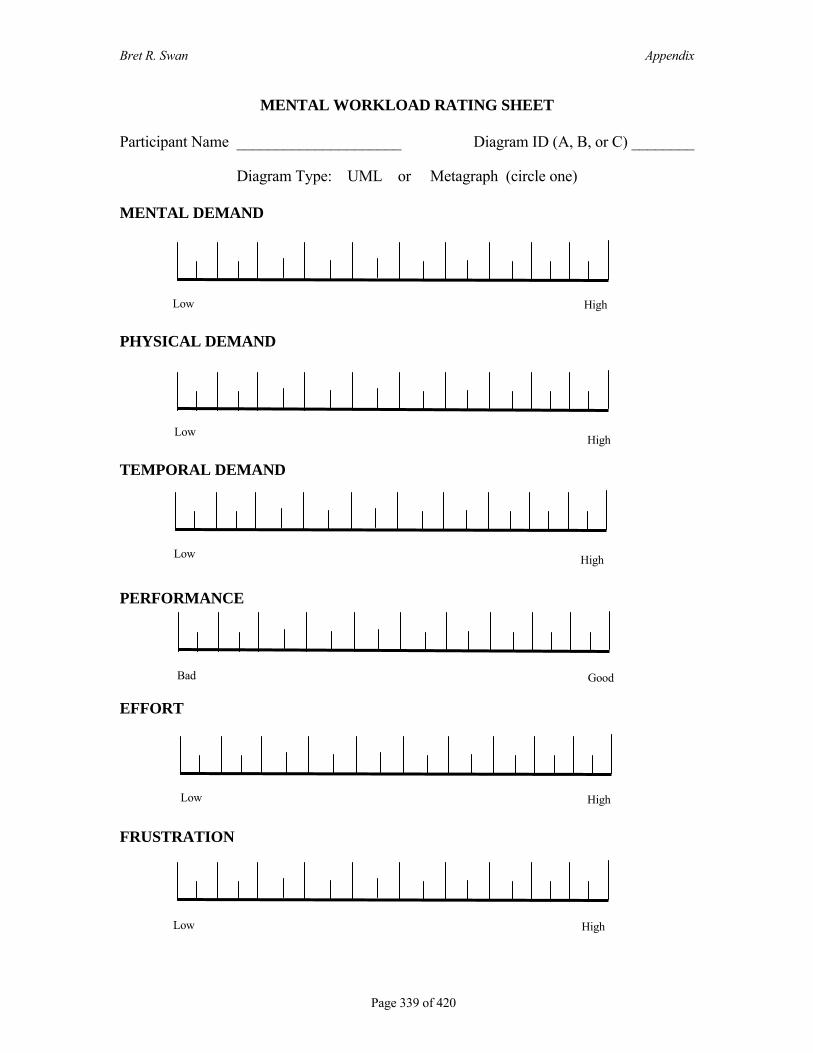
Bret R. Swan Appendix
MENTAL WORKLOAD RATING SHEET Participant Name _____________________ Diagram ID (A, B, or C) ________
Diagram Type: UML or Metagraph (circle one) MENTAL DEMAND PHYSICAL DEMAND TEMPORAL DEMAND
Low High
Low High
Low High
PERFORMANCE Bad Good EFFORT
Low High FRUSTRATION
Low High
Page 339 of 420

Bret R. Swan Appendix
SOURCES OF WORKLOAD CARDS: INSTRUCTIONS
The evaluation you are about to perform is a technique that has been developed by NASA to assess the relative importance of six factors in determining how much workload you experienced as a result of performing the task you have just completed. You will be given a series of pairs of rating scale titles (for example, Effort vs. Mental Demands).
5. Please choose between one of the two items within each pair that was more important to your experience of mental workload in the task that you just performed. Each pair of scale titles will appear on a separate box in the matrix below. Please circle your choice.
6. On a scale of 1 to 10, write your rating of the how important the item your selected was to your experience of mental workload compared to the item you didn’t select, on a scale of 1 to 10.
• 1 = Difficult to decide which one was more important because both were almost equally important to my experience of mental workload.
• 10 = My selection was a great deal more important to my experience of mental workload compared to the other item. It was extremely easy to identify my choice as more important.
Please consider your choices carefully and make them consistent with how you used the rating scales during the particular task you were asked to evaluate. Don’t think that there is any correct pattern. We are only interested in opinions. If you have any questions, please ask them now. Otherwise, you may begin.
NASA TLX SCORING CARDS
Frustration or
Effort
Performance or
Mental Demand
Physical Demand or
Frustration
Performance or
Temporal Demand
Mental Demand or
Effort
Physical Demand or
Temporal Demand
Mental Demand or
Physical Demand
Effort or
Physical Demand
Temporal Demand or
Mental Demand
Frustration or
Mental Demand
Effort or
Performance
Temporal Demand or
Effort
Physical Demand or
Performance
Performance or
Frustration
Temporal Demand or
Frustration
Page 340 of 420

Bret
R. Swan Appendix
Page 341 of 420
Self-Efficacy Questionnaire I COULD COMPLETE THE TASK QUESTIONNAIRES USING THE DIAGRAMS PROVIDED …
NOT AT ALL CONFIDENT
┌─┐
MODERATELY CONFIDENT
┌─┐
TOTALLY CONFIDENT
┌─┐
1. …if there was no one around to tell me what to do.
YES……..1 2 3 4 5 6 7 8 9 10
NO
2. …if I had never used these types of diagrams before.
YES……..1 2 3 4 5 6 7 8 9 10
NO
3. …if I had only the training handouts for reference.
YES……..1 2 3 4 5 6 7 8 9 10
NO
4. …if I had seen someone else using the diagrams before trying them myself.
YES……..1 2 3 4 5 6 7 8 9 10
NO
5. …if I could call on someone for help if I got stuck.
YES……..1 2 3 4 5 6 7 8 9 10
NO
6. …if someone else had helped me get started.
YES……..1 2 3 4 5 6 7 8 9 10
NO
7. …if I had a lot of time to complete the task for which the training was provided.
YES……..1 2 3 4 5 6 7 8 9 10
NO
8. …if I had just the materials provided during training for assistance.
YES……..1 2 3 4 5 6 7 8 9 10
NO
10. …if I had used similar diagrams to do the other tasks before completing this task.
YES……..1 2 3 4 5 6 7 8 9 10
NO

Bret R. Swan Appendix
J TRAINING TASK UML GRAPHICAL PROCESS MODELS USED IN THE EXPERIMENT
J.1 TRAINING TASK: TASK-CENTRIC UML PRACTICE DIAGRAMS
Page 342 of 420

Bret R. Swan Appendix
J.2 TRAINING TASK: RESOURCE-CENTRIC UML PRACTICE DIAGRAMS
<<Pe
ople
>>
R2
<<Pe
ople
>>
R3
Res
ourc
e-C
entri
c U
ML
Dia
gram
<<So
ftwar
e>>
R1
<<D
ocum
ent>
>
R22
0..1
1..*
Is a
ssoc
iate
d w
ith
<<Ph
ysic
al>>
R5
0..1
1..*
Is a
ssoc
iate
d w
ith
1..*
1..*
Is a
ssoc
iate
d w
ith
0..1
1..*
Is a
ssoc
iate
d w
ith
1..*
1..*
Is a
ssoc
iate
d w
ith
Page 343 of 420

Bret R. Swan Appendix
J.3 TRAINING TASK: INFORMATION-CENTRIC UML PRACTICE DIAGRAMS
1..11..1
1..1
1..1
1..1 1..1
Information-Centric UML Diagram
1..1
0..1
1..1
1..*
1..*
0..*
IE10
IE9
IE20 IE21 IE22
IE7 IE18
IE17
Page 344 of 420
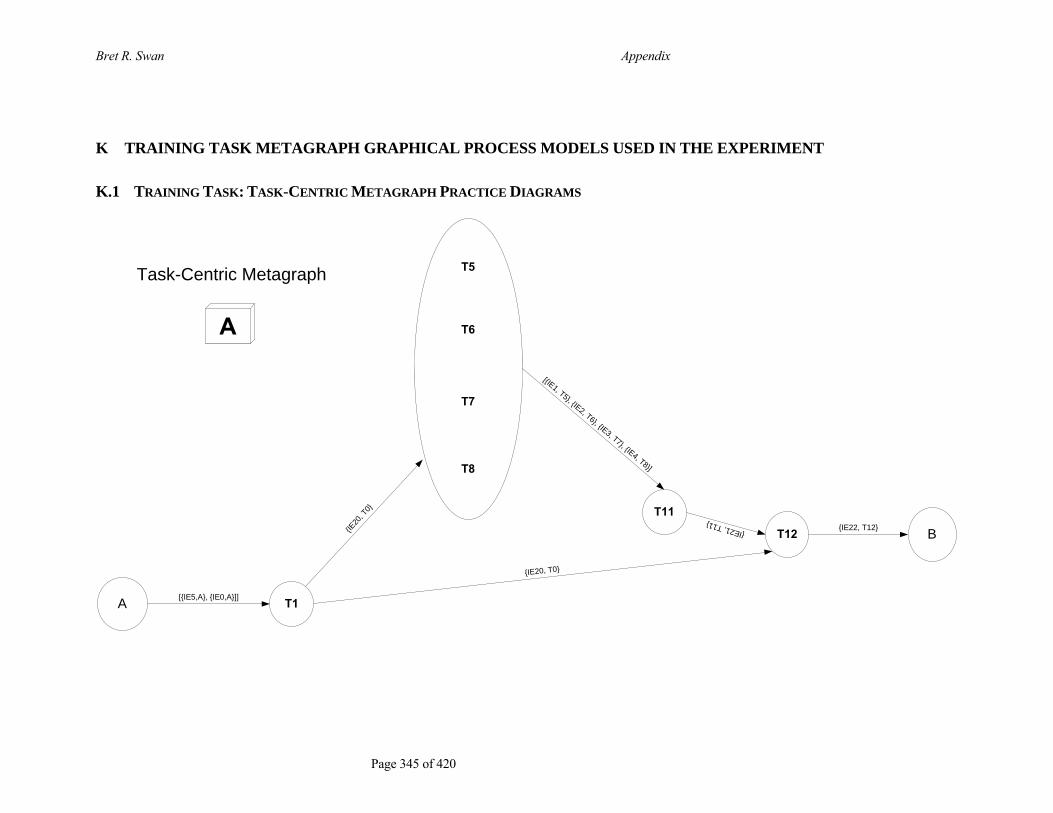
Bret R. Swan Appendix
K TRAINING TASK METAGRAPH GRAPHICAL PROCESS MODELS USED IN THE EXPERIMENT
K.1 TRAINING TASK: TASK-CENTRIC METAGRAPH PRACTICE DIAGRAMS
Task-Centric Metagraph
{IE22, T12}T12
T11
B
A T1
{IE20
, T0}
[{IE5,A}, {IE0,A}]]
[{IE1, T5}, {IE2, T6}, {IE3, T7}, {IE4, T8}]
{IE21, T11}
A
T5
T6
T7
T8
{IE20, T0}
Page 345 of 420
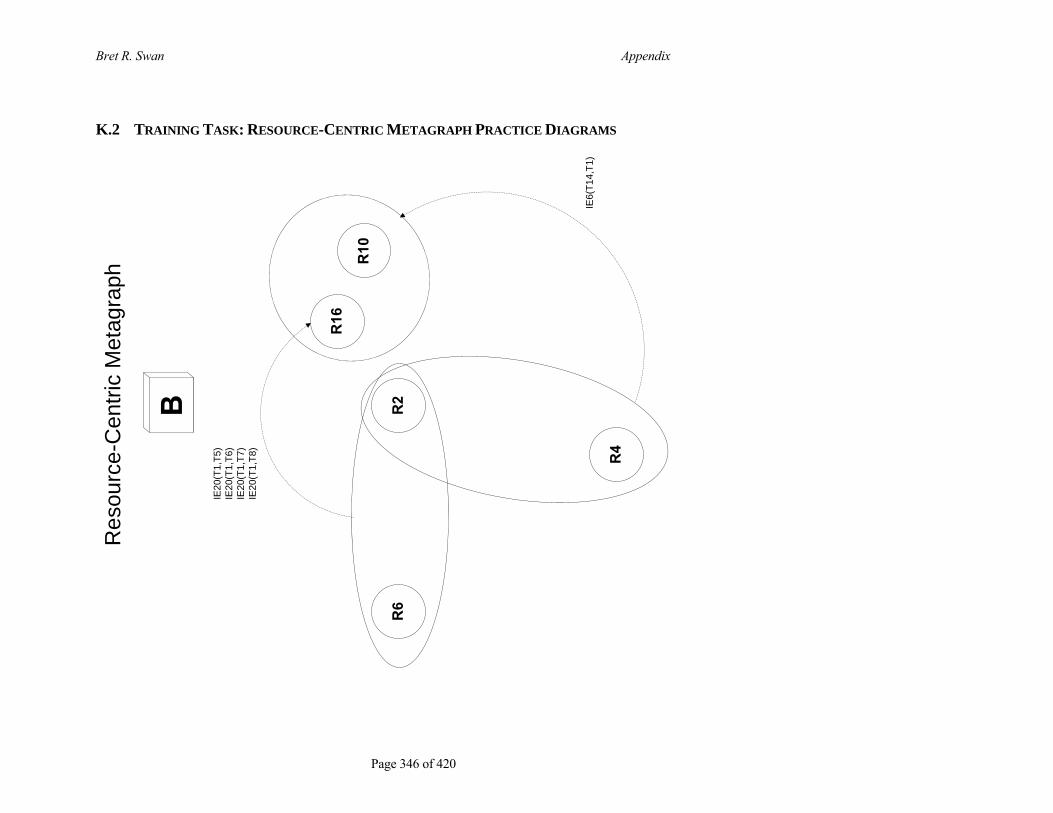
Bret R. Swan Appendix
K.2 TRAINING TASK: RESOURCE-CENTRIC METAGRAPH PRACTICE DIAGRAMS
Res
ourc
e-C
entri
c M
etag
raph
R2
R6
R4
R10
R16
IE6(
T14,
T1)
IE20
(T1,
T5)
IE20
(T1,
T6)
IE20
(T1,
T7)
IE20
(T1,
T8)
Page 346 of 420

Bret
R. Swan Appendix
Page 347 of 420
IE20
IE17
T11 (R2, R6)
IE21
T12 (R10, 16) B
IE19
IE22
T1 (R2, R4)
IE6
K.3 TRAINING TASK: INFORMATION-CENTRIC METAGRAPH PRACTICE DIAGRAMS

Bret R. Swan Appendix
L DATA COLLECTION INSTRUMENTS
L.1 UNIVERSITY A: DEMOGRAPHIC & PRIOR EXPERIENCE QUESTIONNAIRE
Demographic & Prior Experience Questionnaire
• Age: ____
• Gender: M F
• Major:
o Industrial and Systems Engineering (ISE)
o Business Management (MGT)
o Computer Science (CS)
• Have you had any experience in modeling business processes in industry? .Please
describe the types of project, the type of information modeled, and software used (if
any).
Page 348 of 420
Bret R. Swan Appendix
For students majoring in Industrial and Systems Engineering (ISE), which of the following courses
have you taken?
• As an Undergraduate:
o MATH 1114 Linear Algebra
o MATH 1224 Vector Geometry
o MATH 2224 Multivariable Calculus
o ISE 2014 Engineering Economy
o ISE 2204 Manufacturing Processes
o ISE 2214 Manufacturing Processes Laboratory
o ISE 2404 Deterministic Operations Research
o ENGE 2314 Engineering Problem Solving w/ C++
o ENGE 2344 Computer-Aided Drafting
o ESM 2104 Statics
o ESM 2304 Dynamics
o ISE 3004 Industrial Cost Control
o ISE 3014 Work Measurement and Methods Engineering
o ISE 3214 Facility Planning and Material Handling
o ISE 3414 Probabilistic Operations Research
o ISE 3424 Discrete-Event Computer Simulation
o ISE 3614 Introduction to Human Factors Engineering
o ISE 3624 Work Design / Industrial Ergonomics
o ECE 3054 Electrical Theory
o ISE 4004 Theory of Organization
o ISE 4005-4006 Project Management and Systems Design
o ISE 4015 and/or 4016 Management Systems Theory, Application, and Design
o ISE 4204 Production Planning & Inventory Control
o ISE 4244 Fundamentals of Computer Integrated Manufacturing
o ISE 4264 Industrial Automation
o ISE 4304 Global Issues in Industrial Management
o ISE 4404 Statistical Quality Control
o ISE 4414 Industrial Quality Control
o ISE 4624 Work Physiology
o ISE 4644 Occupational Safety and Hazard Control
o STAT 4705 and/or 4706 Statistics for Engineers
Page 349 of 420

Bret R. Swan Appendix
For students majoring in Management (MGT), which of the following courses have you taken?
• As an Undergraduate:
o ACIS 2504: Personal Computers in Business
o MGT 3324: Organization Behavior
o MGT 3334: Introduction to Human Resource Management
o MGT 4344: Productivity and Quality Leadership
o MGT 3604: E-Management
o MGT 4064: Innovation, Technology and Entrepreneurial Leadership
o MGT 4074: Applied Small Business Consulting
o MGT 3344: Labor-Management and Employee Relations
o MGT 3424: Human Resource Staffing and Development
o MGT 4414: Compensation and Performance Management
For students majoring in Computer Science (CS), which of the following courses have you taken?
(Check all that apply)
• As an Undergraduate:
o CS 1 Object 1st Introductory Course I
o CS 2 Object 1st Introductory Course II
Page 350 of 420

Bret R. Swan Appendix
Undergraduate/Graduate College Credits Completed (complete only one of the following two)
• As an undergraduate student, what is the approximate number of Total Credits
Completed here at the university?
o Not Applicable
o 0 to 30
o 30 to 60
o 60 to 90
o 90 to 120
o 120 to 150
o 150 +
• As a graduate student, what is the approximate number of Total Credits Completed
here at the university?
o Not Applicable
o 0 to 30
o 30 to 60
o 60 to 90
o 90 to 120
o 120 to 150
o 150 +
Page 351 of 420

Bret R. Swan Appendix
Prior Experience with Graphical Process Models
• Have you been trained in graphical process modeling techniques:
o Flowcharts
o Petri nets
o Metagraphs
o UML Class Diagrams
o UML Activity Diagrams
o Other? ____________________
• What software have you used to model processes? (Please list the names of as many
software packages as you can remember.)
o __________________________________
o __________________________________
o __________________________________
o __________________________________
o __________________________________
• From the experience you have gained in your education and on industry projects,
would you consider yourself a __________ in modeling business processes:
o Novice
o Intermediate
o Advanced
Page 352 of 420

Bret R. Swan Appendix
L.2 UNIVERSITY B: DEMOGRAPHIC & PRIOR EXPERIENCE QUESTIONNAIRE
Demographic & Prior Experience Questionnaire
• Name:
• Email:
• Phone:
• Age: ____
• Gender: M F
• Home Country:
• Is English your native language?
Yes No, My primary language is ________________
• Check the Department and Course Number(s) you are currently enrolled in:
o Computer Science (CS) _____ _____ _____
o Business Management (BUSM) _____ _____ _____
• As an undergraduate student, what is the approximate number of Total Credits
Completed here at the university?
o Not Applicable
o 0 to 30
o 30 to 60
o 60 to 90
o 90 to 120
o 120 to 150
o 150 +
• Have you had any prior experience in modeling business processes in industry?
[Please briefly describe the projects, the type of business process modeled, the type of information modeled, and the software package used (if any). If needed, please use the back of this paper.]
Page 353 of 420

Bret R. Swan Appendix
For students taking Business Management (BUSM) courses, which of the following BUSM
courses have you completed as an undergraduate? Do not indicate courses you are currently
enrolled in. (Check all that apply)
o MATH 221: Principles of Statistics I
o IS 290L: Business Problem Solving with Applications II
o BUSM 242: Ethics and the Legal Environment of Business
o HTM 450: Hospitality and Tourism Law and Ethics (for HTM majors)
o BUSM 300: Leadership Principles
o BUSM 302: Business Finance/Entrepreneurship
o BUSM 304: Marketing/Entrepreneurship
o BUSM 306: Business Communication/Entrepreneurship
o BUSM 499: Strategic Management
Page 354 of 420
Bret R. Swan Appendix
For students taking Computer Science (CS) courses, which of the following CS courses have you
completed as an undergraduate? Do not indicate courses you are currently enrolled in. (Check all
that apply)
o CS 101: Beginning Programming
o CS 201: Web Programming
o CS 202: Object-Oriented Programming
o CS 210: Computer Organization
o CS 301: Algorithms and Complexity
o CS 320: Computational Theory
o CS 333: Software Engineering I
o CS 410: Computer Architecture
o CS 415: Operating Systems Design
o CS 420: Programming Languages
o CS 433: Software Engineering II
o CS 440: Intelligent Systems
o CS 421: Algorithmic Lang. and Compilers
o CS 441: Automatic Speech Recognition
o CS 442: Image Proc. and Computer Vision
o CS 451: Advanced Database Topics
o CS 456: Mobile Computing
o CS 461: Computer Graphics
o CS 491-492-493: Seminar I,II,III
Page 355 of 420

Bret R. Swan Appendix
Have you completed or are enrolled in any of the following courses? (Check all that apply)
o IS 100: Personal Productivity with IS technology
o IS 110: Introduction to Information Systems
o IS 220: Introduction to Unix or Linux (circle one)
o IS 240: Principles of HTML and Web Development
o IS 250: IT Hardware and Software
o IS 280: Networks and Telecommunications
o IS 300: MOUS certification preparation
o IS 307: Information Systems Analysis and Design
o IS 330: Management Information Systems
o IS 350: Physical Design and Implementation with DBMS Outcomes
o IS 351: Advanced Data Files and Database
o IS 320: Linux Administration (RHCT certification prerequisite)
o IS 409:
o IS 410:
o IS 420: Advanced Linux Administration (RHCE certification prerequisite)
o IS 431: E-Commerce Web Development
Page 356 of 420

Bret R. Swan Appendix
Have you completed or are enrolled in any of the following courses? (Check all that apply)
o Math 112: Calculus I (5)
o Math 113: Calculus II (5)
o Math 201: Discrete Mathematics I/Lab
o Math 202: Discrete Mathematics II/Lab
o Math 221 or 321
o Math 343: Elementary Linear Algebra
o ECON 200: Principles of Microeconomics
o ECON 201: Principles of Macroeconomics
o ACCT 201: Introduction to Financial Accounting
o ACCT 203: Introduction to Managerial Accounting
o ACCT 301: Intermediate Accounting I
o ACCT 302: Intermediate Accounting II
o ACCT 312: Managerial Accounting
o ACCT 321: Federal Tax-Individuals**
o ACCT 356: Accounting Information Systems
o ACCT 365: Auditing
o ACCT 386: Advanced Financial Accounting
o ACCT 440: International Acct. and Acct. Research
o ACCT 400: Intermediate Accounting II
o ACCT 401: Advanced Accounting
Page 357 of 420

Bret R. Swan Appendix
Prior Experience with Graphical Process Models
• Have you been trained in graphical process modeling techniques (Check all that apply):
o Flowcharts
o Petri nets
o Metagraphs
o UML Class Diagrams
o UML Activity Diagrams
o Other? ____________________
• What software packages have you used to model business processes? (Please list the
names of as many software packages as you can remember.)
o __________________________________
o __________________________________
o __________________________________
o __________________________________
o __________________________________
• From the experience you have gained in your education and on industry projects,
would you consider yourself __________ in modeling business processes:
o A Beginner
o Adequate
o Advanced
Page 358 of 420

Bret R. Swan Appendix
L.3 TASK ACCURACY QUESTIONNAIRE
L.3.1 QUESTIONNAIRE ASSESSING PROCESS MANAGEMENT TASK-CENTRIC GPMS
Questionnaire Assessing Task-Centric Diagrams
BPM User
Comprehension Components
Experiment User Comprehension Questions*
Task-Centric Questions (T) [Diagram A]
T1.1 Given a task, T3, to execute, what other tasks must be executed immediately before T3 to provide the information needed to execute task T3?
(a) T1, T2, T4 (b) T4 (c) T6 (d) T5 (e) None of the above
T1.2 Given a task, T7, to execute, what other tasks must be executed immediately before T7 to provide the information needed to execute task T7?
(a) T3, T5, T6 (b) T5 only (c) T4, T8 (d) T1, T2 (e) None of the above
T1.3 Given a task, T1, to execute, what other tasks must be executed immediately
before T1 to provide the information needed to execute task T1? (a) T5, T6, T7, T8, T11 (b) T13, T14 (c) T7, T8 (d) T2, T3 (e) None of the above
*Assume that the answers listed are complete – in other words, if an item is not listed, it is not part of the listed answer.
Page 359 of 420

Bret R. Swan Appendix
BPM User
Comprehension Components
Experiment User Comprehension Questions
Task-Centric Questions (T) (Continued) [Diagram A]
T2.1 If task T7 is disabled, what other tasks will be affected that immediately follow T7 – in other words, what other tasks cannot be executed because T7 is disabled?
(a) T11. T12 (b) T5, T6, T8 (c) T3, T9 (d) T0, T10 (e) None of the above
T2.2 If task T1 is disabled, what other tasks will be affected that immediately follow T1 – in other words, what other tasks cannot be executed because T1 is disabled?
(a) T4 (b) T5 (c) T2, T3 (d) T2 only (e) None of the above
T2.3 If task T2 is disabled, what other tasks will be affected that immediately follow
T2 – in other words, what other tasks cannot be executed because T2 is disabled?
(a) T3, T4, T5 (b) T1 (c) T5, T6, T7, T8 (d) T1, T2, T3, T4 (e) None of the above
T3.1 What task is utilized the most from the list below? (a) T4 (b) T9 (c) T10 (d) T6 (e) None of the above
T3.2 What task is utilized the least from the list below? (a) T1 (b) T7 (c) T2 (d) T3 (e) None of the above
*Assume that the answers listed are complete – in other words, if an item is not listed, it is not part of the
listed answer.
Page 360 of 420
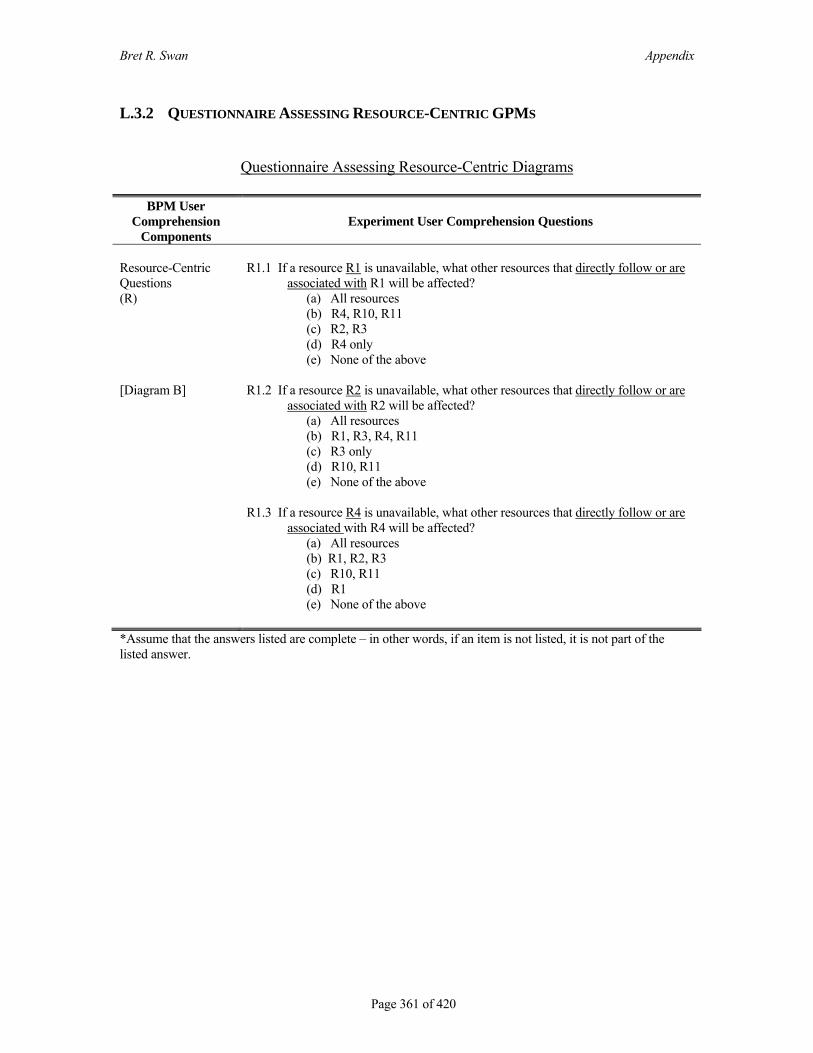
Bret R. Swan Appendix
L.3.2 QUESTIONNAIRE ASSESSING RESOURCE-CENTRIC GPMS
Questionnaire Assessing Resource-Centric Diagrams
BPM User
Comprehension Components
Experiment User Comprehension Questions
Resource-Centric Questions (R) [Diagram B]
R1.1 If a resource R1 is unavailable, what other resources that directly follow or are associated with R1 will be affected?
(a) All resources (b) R4, R10, R11 (c) R2, R3 (d) R4 only (e) None of the above
R1.2 If a resource R2 is unavailable, what other resources that directly follow or are associated with R2 will be affected?
(a) All resources (b) R1, R3, R4, R11 (c) R3 only (d) R10, R11 (e) None of the above
R1.3 If a resource R4 is unavailable, what other resources that directly follow or are associated with R4 will be affected?
(a) All resources (b) R1, R2, R3 (c) R10, R11 (d) R1 (e) None of the above
*Assume that the answers listed are complete – in other words, if an item is not listed, it is not part of the listed answer.
Page 361 of 420

Bret R. Swan Appendix
BPM User Comprehension
Components Experiment User Comprehension Questions
Resource-Centric Questions (R) (Continued) [Diagram B]
R2.1 What specific resources directly precede or are associated with R4 that provides information for R4 to perform its tasks?
(a) R1, R11 (b) R2, R3 (c) R1, R2 (d) R10, R11 (e) None of the above
R2.2 What specific resources directly precede or are associated with R11 that
provides information for R11 to perform its tasks? (a) R1, R2, R3 (b) R10 (c) R4 (d) R2, R3 only (e) None of the above
R2.3 What specific resources directly precede or are associated with R2 that provides
information for R2 to perform its tasks? (a) R4 (b) R1 (c) R10 (d) R11 (e) None of the above
R3.1 What is the most utilized resource in the list below?
(a) R2 (b) R10 (c) R11 (d) R1 (e) None of the above
R3.2 What is the least utilized resource in the list below? (a) R2 (b) R4 (c) R3 (d) R10 (e) None of the above
*Assume that the answers listed are complete – in other words, if an item is not listed, it is not part of the listed answer.
Page 362 of 420

Bret R. Swan Appendix
L.3.3 QUESTIONNAIRE ASSESSING INFORMATION-CENTRIC GPMS
Questionnaire Assessing Information-Centric Diagrams
BPM User
Comprehension Components
Experiment User Comprehension Questions
Information-Centric Questions (IE) [Diagram C]
IE1.1 Given three information elements, IE1, IE2, IE6, which of them is needed to determine the value of the other(s)?
(a) IE1 determine IE2 and IE6 (b) IE1 and IE2 determine IE6 (c) IE2 determine IE1 and IE6 (d) IE6 and IE2 determine IE1 (e) None of the above
IE1.2 Given two information elements, IE11, IE14, which of them is needed to
determine the value of the other(s)? (a) IE11 determine IE14 and IE2 (b) IE14 determine IE11 (c) IE2 determine IE11 and IE14 (d) IE11 determine IE14 (e) None of the above
IE1.3 Given six information elements, IE1, IE2, IE3, IE4, IE10, IE11, which of them
is needed to determine the value of the other(s)? (a) IE1, IE2, IE3, IE4, IE10 determine IE11 (b) IE11 determine IE1, IE2, IE3, IE4, IE10 (c) IE1, IE3, IE10, determine IE2, IE4, IE11 (d) IE2, IE3, IE11 determine IE1, IE4, IE10 (e) None of the above
*Assume that the answers listed are complete – in other words, if an item is not listed, it is not part of the listed answer.
Page 363 of 420

Bret R. Swan Appendix
BPM User
Comprehension Components
Experiment User Comprehension Questions
Information-Centric Questions (IE) (Continued) [Diagram C]
IE2.1 Given two sets of information elements {IE6 IE7, IE8} and {IE10, IE11, IE12}, is it possible to determine the values of the second set from the elements in the first set, and if not, are there any additional information elements that would make it possible to do so?
(a) Yes – No other information elements are needed (b) No – unless {IE9} are also included (c) No – unless {IE1 and IE2} are also included (d) No – unless {IE4 and IE5} are also included (e) No – the first set does not determine the values of the second set, and
the addition of information elements will not change this fact.
IE2.2 Given two sets of information elements, {IE1, IE2, IE3} and {IE11}, is it possible to determine the values of the second set from the elements in the first set, and if not, are there any additional information elements that would make it possible to do so?
(a) Yes – No other information elements are needed (b) No – unless {IE10, IE12} are also included (c) No – unless {IE7, IE8, IE9} are also included (d) No – unless {IE6, IE7, IE8} are also included (e) No – the first set does not determine the values of the second set, and
the addition of information elements will not change this fact. IE2.3 Given two sets of information elements, {IE6, IE7, IE8, IE9, IE10, IE11} and
{IE13, IE14}, is it possible to determine the values of the second set from the elements in the first set, and if not, are there any additional information elements that would make it possible to do so?
(a) Yes – No other information elements are needed (b) No – unless {IE1} is also included (c) No – unless {IE12} is also included (d) No – unless {IE4, IE5} are also included (e) No – the first set does not determine the values of the second set, and
the addition of information elements will not change this fact.
*Assume that the answers listed are complete – in other words, if an item is not listed, it is not part of the listed answer.
Page 364 of 420

Bret R. Swan Appendix
BPM User
Comprehension Components
Experiment User Comprehension Questions
Information-Centric Questions (IE) (Continued) [Diagram C]
IE3.1 What was the most used or most critical information element in the process that is listed below?
(a) IE8 or IE11 (b) IE1 (c) IE5 (d) IE13 (e) None of the above
IE3.2 What was the least used or least critical information element in the process
that is listed below? (a) IE7 (b) IE13 or IE 14 (c) IE2 (d) IE5 (e) None of the above
*Assume that the answers listed are complete – in other words, if an item is not listed, it is not part of the listed answer.
Page 365 of 420

Bret R. Swan Appendix
L.3.4 QUESTIONNAIRE ASSESSING INTERACTIONS BETWEEN THREE BPIS AT ONCE
Questionnaire Assessing Interactions Between All Diagrams
BPM User
Comprehension Components
Experiment User Comprehension Questions
Questions Concerning the Interactions among Components (CI) [Diagrams A, B, and C]
CI1.1 If a resource, R3, is unavailable, which information elements and tasks in the entire process can still be generated and completed?
(a) All Tasks and Information Elements can be generated and completed.
(b) All information elements can still be generated and all tasks can be completed except for {IE12, IE13, IE14} and {T5, T7, T8}
(c) All information elements can still be generated and all tasks can be except for {T1, T2, T3} and {IE1, IE2, IE3, IE4, IE5}.
(d) No information elements can still be generated or tasks can be completed except for {IE1, IE2} and {T7, T8}.
(e) None of the above
CI2.1 If an information element, IE6, is found to be inaccurate, which resources and tasks are used, directly or indirectly across the entire process, in the calculation or creation of IE6?
(a) All Tasks and Resources. (b) {T2} and {R2, R4, R6, R11, R12} (c) {T5} and {R1, R2, R7} (d) {T1} and {R1, R10} (e) None of the above
*Assume that the answers listed are complete – in other words, if an item is not listed, it is not part of the listed answer.
Page 366 of 420

Bret R. Swan Appendix
BPM User
Comprehension Components
Experiment User Comprehension Questions
Questions Concerning the Interactions among Components (CI) (Continued) [Diagrams A, B, and C]
CI3.1 Given a set of tasks, {T1, T2}, what information elements and resources directly affect the performance of these tasks?
(a) All Information Elements and Resources. (b) {R1, R2, R10} and {IE1, IE2, IE3, IE4, IE5} (c) {R1, R3, R10, R12, R14, R21} and {IE5, IE7, IE9, IE11, IE13,
IE15, IE17, IE21} (d) {R2, R4, R6, R10, R11, R12, R13, R14, R15, R16} and {IE10,
IE11, IE12, IE13, IE14, IE15, IE16} (e) None of the above
CI4.1 What tasks, information elements and resources are needed as inputs,
directly or indirectly, to perform T5? (a) All Tasks, Information Elements, and Resources. (b) {R1, R2, R3, R4, R10} and {IE1, IE2, IE3, IE4, IE5, IE7, IE8}
and {T1, T2, T4} (c) {R1, R2, R3, R10, R11} and { IE1, IE2} and {T1, T4, T6}. (d) {R1, R2, R11} and {IE4, IE5, IE6, IE7} and {T2, T3, T4}. (e) None of the above
CI5.1 What is the single most utilized information element, task, or resource in
the process - that is included in the list below? (a) R1 (b) IE1 or IE2 (c) T10 (d) All of the above (e) Cannot be determined from these diagrams
CI5.2 What is the single least utilized information element, task, or resource in
the process - that is included in the list below? (a) IE7 (b) R4 (c) T7 or T8 (d) All of the above (e) Cannot be determined from these diagrams
*Assume that the answers listed are complete – in other words, if an item is not listed, it is not part of the listed answer.
L.4 TASK TIMELINESS
Stopwatch
Page 367 of 420

Bret R. Swan Appendix
L.5 NASA TASK-LOAD INDEX (TLX)
Assessment of the Mental Workload You Just Experienced
Please consider your choices carefully and make them consistent with how you used the rating scales during the particular task you just completed and are now asked to evaluate. Don’t think that there is any correct pattern. I am only interested in your opinions. If you have any questions, please ask them now. Otherwise, you may begin.
SCALE TITLES FOR ASSESSMENT OF MENTAL WORKLOAD
TITLE ENDPOINTS DESCRIPTIONS Mental Demand Low/High How much mental and perceptual activity is
required (e.g. thinking, deciding, calculating, remembering, looking, searching, etc.)? Was the task easy or demanding, simple or complex, exacting or forgiving?
Physical Demand Low/High How much physical activity was required(e.g. pushing, pulling, turning, controlling, activating, etc.)? Was the task easy or demanding, slow or brisk, slack or strenuous, restful or laborious?
Temporal Demand
Low/High How much time pressure did you feel due to the rate or pace at which tasks or task elements occurred? Was the pace slow and leisurely or rapid and frantic?
Performance Bad/Good How successful do you think you were in accomplishing the goals of the task set by the experimenter (or yourself)? How satisfied were you with your performance in accomplishing these goals?
Effort Low/High How hard did you have to work (mentally and physically) to accomplish your level of performance?
Frustration Level Low/High How insecure, discouraged, irritated, stressed, and annoyed versus secure, gratified, content, relaxed, and complacent did you feel during the task?
Page 368 of 420

Bret R. Swan Appendix
MENTAL WORKLOAD RATING SHEET Participant Name _____________________ Diagram ID (A, B, or C) ________
Diagram Type: UML or Metagraph (circle one) MENTAL DEMAND
Low High PHYSICAL DEMAND
Low
High TEMPORAL DEMAND
Low High PERFORMANCE Bad Good EFFORT
Low High FRUSTRATION
Low High
Page 369 of 420
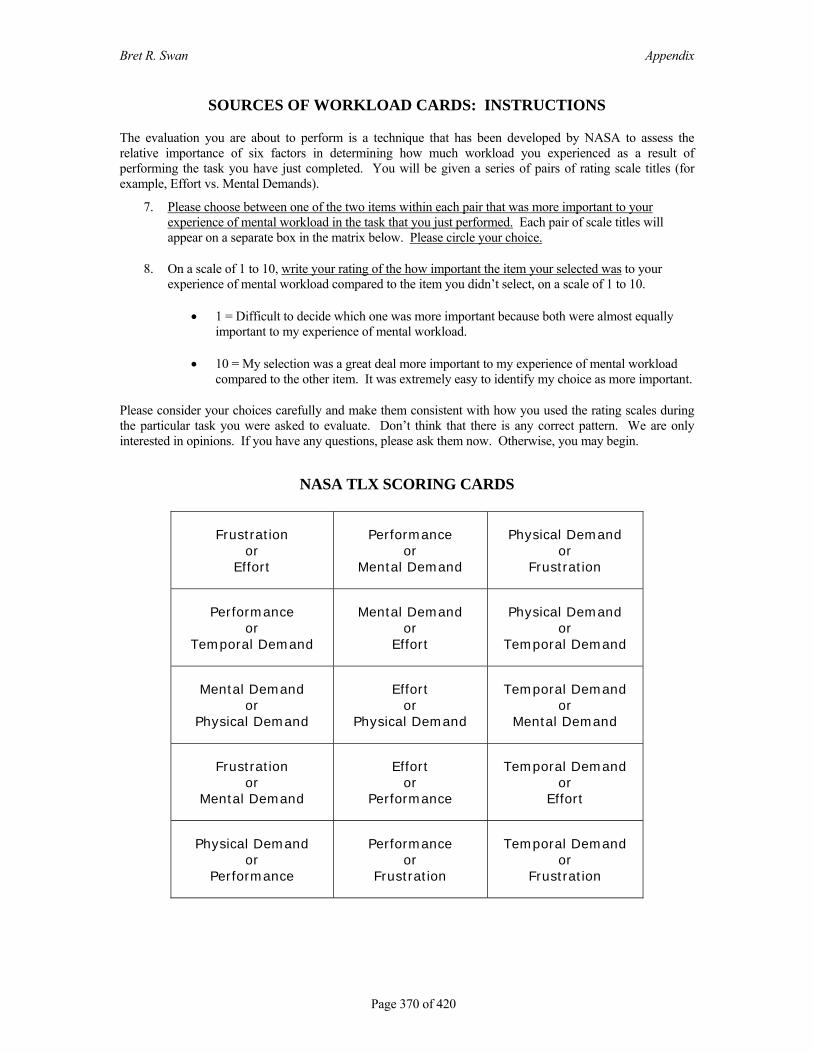
Bret R. Swan Appendix
SOURCES OF WORKLOAD CARDS: INSTRUCTIONS
The evaluation you are about to perform is a technique that has been developed by NASA to assess the relative importance of six factors in determining how much workload you experienced as a result of performing the task you have just completed. You will be given a series of pairs of rating scale titles (for example, Effort vs. Mental Demands).
7. Please choose between one of the two items within each pair that was more important to your experience of mental workload in the task that you just performed. Each pair of scale titles will appear on a separate box in the matrix below. Please circle your choice.
8. On a scale of 1 to 10, write your rating of the how important the item your selected was to your experience of mental workload compared to the item you didn’t select, on a scale of 1 to 10.
• 1 = Difficult to decide which one was more important because both were almost equally important to my experience of mental workload.
• 10 = My selection was a great deal more important to my experience of mental workload compared to the other item. It was extremely easy to identify my choice as more important.
Please consider your choices carefully and make them consistent with how you used the rating scales during the particular task you were asked to evaluate. Don’t think that there is any correct pattern. We are only interested in opinions. If you have any questions, please ask them now. Otherwise, you may begin.
NASA TLX SCORING CARDS
Frustration or
Effort
Performance or
Mental Demand
Physical Demand or
Frustration
Performance or
Temporal Demand
Mental Demand or
Effort
Physical Demand or
Temporal Demand
Mental Demand or
Physical Demand
Effort or
Physical Demand
Temporal Demand or
Mental Demand
Frustration or
Mental Demand
Effort or
Performance
Temporal Demand or
Effort
Physical Demand or
Performance
Performance or
Frustration
Temporal Demand or
Frustration
Page 370 of 420

Bret R. Swan Appendix
Subject #: _______________ NASA TLX Scoring - Sources of Workload Task #: ______ Document: ______ Condition: _______ Scale title Tally Weight Raw rating Adjusted
Rating (Weight X Raw) Mental Demand Physical Demand Temporal Demand Performance Effort Frustration Total Count = ____ (no weight can be greater than 5; total count can’t be > 15). Write the sum of the adjusted rating column _______. Weighted rating = Sum of adjusted ratings/15
Page 371 of 420

Bret R. Swan Appendix
L.6 WONDERLIC PERSONNEL TEST
The Wonderlic Personnel Test (WPT) Form A was used to assess participants’ General
Cognitive Abilities (GCA). Form A is administered with a 12 minute time limit. A copy of the
WPT Form A is available upon request. The following are samples of WPT test questions from the
Wonderlic, Inc. website: http://www.wonderlic.com/products/selection/wpt/sampleQuestions.asp
Sample Wonderlic Personnel Test (WPT)
Directions: In only 2 minutes, correctly answer as many questions as you can.
1. Look at the row of numbers below. What number comes next? 8, 4, 2, 1, 1/2, 1/4 ? o 4 o 1/2 o 1/8 o 1/4 o 1
2. Assume the first two statements are true. The boy plays football. All football players wear helmets. The boy wears a helmet. Is the final statement: o True? o False? o Not Certain
3. How many of the five pairs of items below are exact duplicates? Nieman, K.M. Neiman, K.M. Thomas, G.K. Thomas, C.K. Hoff, J.P. Hoff, J.P. Pino, L.R. Pina, L.R. Warner, T.S. Wanner, T.S. o 1 o 2 o 3 o 4 o 5
Page 372 of 420
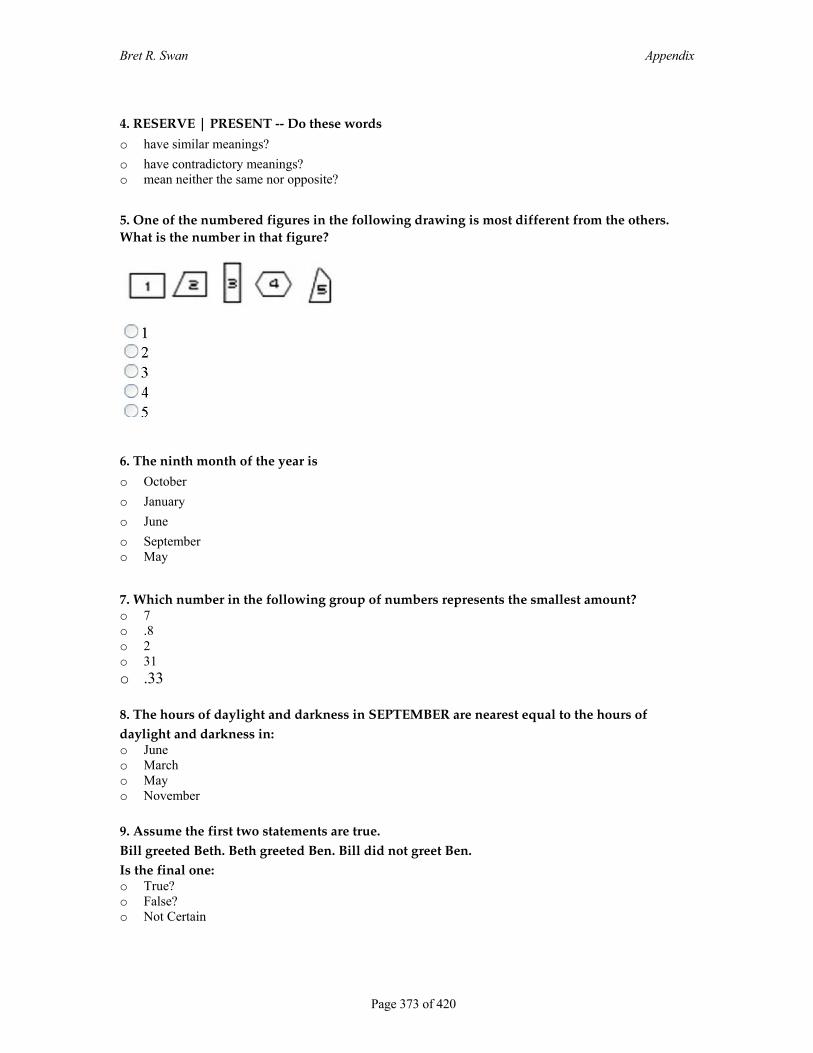
Bret R. Swan Appendix
4. RESERVE | PRESENT -- Do these words
o have similar meanings? o have contradictory meanings? o mean neither the same nor opposite?
5. One of the numbered figures in the following drawing is most different from the others. What is the number in that figure?
6. The ninth month of the year is
o October o January o June o September o May
7. Which number in the following group of numbers represents the smallest amount? o 7 o .8 o 2 o 31 o .33
8. The hours of daylight and darkness in SEPTEMBER are nearest equal to the hours of daylight and darkness in: o June o March o May o November 9. Assume the first two statements are true. Bill greeted Beth. Beth greeted Ben. Bill did not greet Ben. Is the final one: o True? o False? o Not Certain
Page 373 of 420
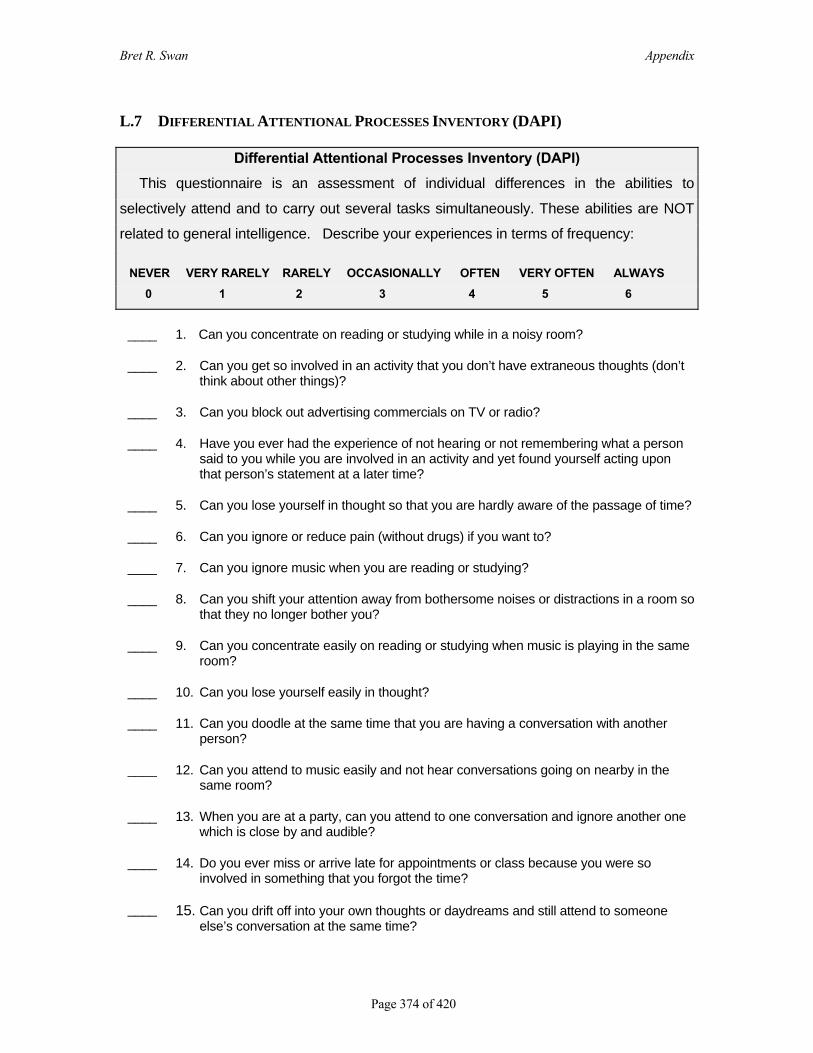
Bret R. Swan Appendix
L.7 DIFFERENTIAL ATTENTIONAL PROCESSES INVENTORY (DAPI)
Differential Attentional Processes Inventory (DAPI) This questionnaire is an assessment of individual differences in the abilities to
selectively attend and to carry out several tasks simultaneously. These abilities are NOT
related to general intelligence. Describe your experiences in terms of frequency:
NEVER VERY RARELY RARELY OCCASIONALLY OFTEN VERY OFTEN ALWAYS
0 1 2 3 4 5 6
____ 1. Can you concentrate on reading or studying while in a noisy room?
____ 2. Can you get so involved in an activity that you don’t have extraneous thoughts (don’t think about other things)?
____ 3. Can you block out advertising commercials on TV or radio?
____ 4. Have you ever had the experience of not hearing or not remembering what a person said to you while you are involved in an activity and yet found yourself acting upon that person’s statement at a later time?
____ 5. Can you lose yourself in thought so that you are hardly aware of the passage of time?
____ 6. Can you ignore or reduce pain (without drugs) if you want to?
____ 7. Can you ignore music when you are reading or studying?
____ 8. Can you shift your attention away from bothersome noises or distractions in a room so that they no longer bother you?
____ 9. Can you concentrate easily on reading or studying when music is playing in the same room?
____ 10. Can you lose yourself easily in thought?
____ 11. Can you doodle at the same time that you are having a conversation with another person?
____ 12. Can you attend to music easily and not hear conversations going on nearby in the same room?
____ 13. When you are at a party, can you attend to one conversation and ignore another one which is close by and audible?
____ 14. Do you ever miss or arrive late for appointments or class because you were so involved in something that you forgot the time?
____ 15. Can you drift off into your own thoughts or daydreams and still attend to someone else’s conversation at the same time?
Page 374 of 420

Bret R. Swan Appendix
NEVER VERY RARELY RARELY OCCASIONALLY OFTEN VERY OFTEN ALWAYS
0 1 2 3 4 5 6
____
16. While walking can you become so engrossed in thought that you do not recall the people or places you have passed?
____ 17. Can you forget that someone else is in the room with you?
____ 18. Can you ignore the discomfort of being in an environment that is too hot or too cold (within reasonable limits)?
____ 19. Can you “loose” a period of time where you cannot remember what you did?
____ 20. When you are at a play or movie, can you ignore or be unaware of disruptive movements or noises made by others around you?
____ 21. Can you write easily while at the same time listen to a conversation?
____ 22. Can you wander off into your own thoughts while doing an activity so that you actually forget what you were doing, and then find a few minutes later that you have finished the job without even being aware of having finished it?
____ 23. Can you daydream so deeply that you do not hear someone talking to you?
____ 24. Can you be so involved in reading or studying that when someone talks to you, you do not hear them?
____ 25. If you want to take a nap, can you easily ignore others conversing in the same room?
____ 26. Can you write easily while at the same time listen to the radio or TV?
____ 27. Can you be so involved in reading or studying that when someone talks to you, you do not hear them at the time yet later realize that they have spoken to you?
____ 28. Can you be so involved in dancing that you are almost not aware of your surroundings?
____ 29. Can you carry out a moderately complex activity at the same time that you are having a conversation with another person?
____ 30. Can you talk on the telephone while doing some other physical activity?
____ 31. Can you read or study easily while at the same time listen easily to a conversation?
____ 32. Can you read or study easily while at the same time listen to the talking of the radio or TV?
____ 33. Can you read or study easily while at the same time listen to music?
____ 34. Can you write easily while at the same time listen to music?
Page 375 of 420

Bret R. Swan Appendix
NEVER VERY RARELY RARELY OCCASIONALLY OFTEN VERY OFTEN ALWAYS
0 1 2 3 4 5 6
____ 35. Can you carry out a physical activity easily while listening to a conversation?
____ 36. Can you carry out a physical activity easily while listening to someone talking on radio or TV?
____ 37. Can you carry out a physical activity easily while listening to music?
____ 38. Can you wake up at night at some predetermined time during the night? (e.g., know you have to wake up at 4 AM and do so without any external help, such as an alarm clock)
____ 39. Can you read or study easily while actively involve in conversation?
____ 40. Can you listen to a conversation, be writing or studying at the same time, and also carry on some other internal thoughts unrelated to the first two at the same time?
L.7.1 DAPI SCORING
DAPI Construct: Moderately Focused Attention Scale
Items = ATT1 + ATT3 + ATT7 + ATT8 + ATT9 + ATT26 + ATT33 + ATT34 DAPI Construct: Extremely Focused Attention Scale
Items = ATT4 + ATT5 + ATT10 + ATT14 + ATT16 + ATT17 + ATT19 + ATT22 + ATT23 + ATT24 + ATT27 + ATT28
DAPI Construct: Dual Cognitive-Physical Attention Scale
Items = ATT11 + ATT30 + ATT35 + ATT36 + ATT37 DAPI Construct: Dual Cognitive-Cognitive Attention Scale
Items = ATT31 + ATT32 + ATT39 + ATT40
Page 376 of 420

Bret R. Swan Appendix
L.8 MYERS-BRIGGS TYPE INDICATOR
The Myers-Briggs Type Indicator (MBTI) Form F was used in this study.
L.9 GPM SELF-EFFICACY INSTRUMENT
Self-Efficacy Questionnaire
I COULD COMPLETE THE TASK QUESTIONNAIRES USING THE DIAGRAMS PROVIDED …
NOT AT ALL CONFIDENT
┌─┐
MODERATELY CONFIDENT
┌─┐
TOTALLY CONFIDENT
┌─┐
1. …if there was no one around to tell me what to do.
YES……..1 2 3 4 5 6 7 8 9 10
NO
2. …if I had never used these types of diagrams before.
YES……..1 2 3 4 5 6 7 8 9 10
NO
3. …if I had only the training handouts for reference.
YES……..1 2 3 4 5 6 7 8 9 10
NO
4. …if I had seen someone else using the diagrams before trying them myself.
YES……..1 2 3 4 5 6 7 8 9 10
NO
5. …if I could call on someone for help if I got stuck.
YES……..1 2 3 4 5 6 7 8 9 10
NO
6. …if someone else had helped me get started.
YES……..1 2 3 4 5 6 7 8 9 10
NO
7. …if I had a lot of time to complete the task for which the training was provided.
YES……..1 2 3 4 5 6 7 8 9 10
NO
8. …if I had just the materials provided during training for assistance.
YES……..1 2 3 4 5 6 7 8 9 10
NO
10. …if I had used similar diagrams to do the other tasks before completing this task.
YES……..1 2 3 4 5 6 7 8 9 10
NO
Page 377 of 420

Bret R. Swan Appendix
M PRELIMINARY DATA ANALYSIS METHODS
Several preliminary analyses are required to test the underlying assumptions that permit
parametric statistical analyses of this dataset. Parametric assumptions and analyses discussed in this
section include:
1. Random Sampling and Interval Data: Random sampling of the population is required and
measured at least at the interval level (see Appendix M.1).
2. Normality: for ANOVAs, the dependent variables are normally distributed within each
group. For MANOVAs, the assumption is that the dependent variables (collectively) have
multivariate normality within groups (see Appendix M.2).
3. Homogeneity of Variance/Covariance. Because this multivariate dataset has unequal cell
sizes across groups, the data is not robust to violations of homogeneity of variance.
Consequently, homogeneity of variance assumptions are used to test for sphericity in the
repeated measures of accuracy, timeliness, and TLX mental workload (see Appendix M.3).
4. Tests of Independence: Since this is a multivariate dataset, it is likely there is a high
correlation between these dependent variables. Therefore, these data require multivariate
hypothesis testing procedures be conducted to test for independence of the dependent
variables prior to conducting univariate statistical analyses in order to protect the validity of
the results (see Appendix M.4).
5. Scale Reliability Analyses of the Differential Attentional Processes Inventory (DAPI):
Reliability analyses were also used to evaluate the scale reliability of DAPI constructs for
further analysis (see Appendix M.5).
6. Evaluation of the Balance of Participant Cognitive Styles within Treatment Groups (see
Appendix M.6).
M.1 INTERVAL DATA AND RANDOM SAMPLING
The selection of participants was by primarily by volunteering and not completely random.
Students were chosen based on their class standing (at least a rising junior-standing in their major)
and the current classes from which they were recruited. All IE students were from one university,
were all members of a single summer term course, and were required by their professor to
Page 378 of 420

Bret R. Swan Appendix
participate in the experiment for course credit. MGT and CS student participants were volunteers,
were from various courses, and were from two different universities. Lastly, the order all
participants were exposed to different types of BPI could not be completely randomized, but the
order was balanced by design so that approximately equivalent groups of students were exposed to
different types of BPI. The design of this experiment sampled participants and randomized the
order of the different types of BPI as much as possible.
Both interval and continuous data were collected according to the measures described
earlier in the chapter. Interval data were collected for measures of self-efficacy. Continuous data
were collected for timeliness and TLX subjective mental workload. Task accuracy data were
evaluated as count data for each participant and then converted to a percent correct. Percent correct
data are treated as continuous data in this experiment.
M.2 NORMALITY
Multivariate normality is a prerequisite for most of the univariate and multivariate
statistical analyses used in this study. Normality is evaluated most effectively by plotting
histograms of the data and visually evaluating it. Skewness and Kurtosis results also help determine
normality (cf. Field, 2005; Rencher, 2001).
M.3 HOMOGENEITY OF VARIANCE
For ANOVAs, the required assumption is that variances are equal across groups. For
MANOVAs, the requirement is that there is homogeneity across covariance matrices. This means
that the homogeneity of variance assumption holds for each dependent variable and that the
correlation between any two dependent variables is the same in all groups. Levene’s and Box’s
tests are used to evaluate this assumption. Box’s test evaluates the null hypothesis that the observed
covariance matrices of the dependent variables are equal across groups, and has added robustness
compared to Levene’s test. Lastly, sphericity is used to test that variances are equal across repeated
measures data taken from the same participant. Barlett’s and Mauchly’s tests are used to test the
sphericity. Significant results for any of these results indicate a violation of this assumption. If
these assumptions are violated, there are corrections that can sometimes be made to the analyses to
give more reliable results (cf. Field, 2005; Rencher, 2001). See Appendix A.2 for results.
Page 379 of 420

Bret R. Swan Appendix
M.4 TESTS OF INDEPENDENCE
Observations in the dataset should be statistically independent. Since this is a multivariate
dataset, it is likely there is a high correlation between these dependent variables. Therefore, these
data require multivariate hypothesis testing procedures be conducted to test for independence of the
dependent variables prior to conducting univariate statistical analyses in order to protect the validity
of the results. These multivariate hypothesis tests protect against inflation in the overall
experimentwise error rate and subsequent misinterpretations of univariate analyses when results for
a variable are significant at the p < 0.05 level of significance. When a multivariate hypothesis test is
non-significant (i.e., the null hypothesis is true, H0: Accuracy Time MentalWorkload Self Efficacyμ μ μ μ −= = = )
any subsequent analytic results are highly suspicious because any significance must be a Type I
error.
M.4.1 THE NEED FOR MULTIVARIATE VS. UNIVARIATE HYPOTHESIS TESTS
Rencher (2001, pp. 112-113) discusses four arguments for a multivariate approach to
hypothesis testing as opposed to a univariate approach:
1. The use of p univariate tests inflate the Type I error rate,α , whereas the multivariate tests
preserves the exact α -level. If an f-test is made on each of the p variables regardless of
whether the overall multivariate analysis of variance (MANOVA) test of H0:
1 2 3 ... Xμ μ μ= = = μ rejects H0, then the overall α -level will increase beyond the
nominal value because we are making p tests. For example, if we do p = 10 separate
univariate tests at the α = 0.05 level, the probability of at least one false rejection is greater
than α = 0.05. If the variables are independent, we will have under H0.
P (at least one rejection) = 1- P (all 10 tests accept H0)
= 1 – (0.95)10 = 0.40
The resulting overall α is not an acceptable error rate. Typically, the 10 variables are
correlated, and the overall α lies somewhere between 0.05 and 0.40.
2. Univariate tests completely ignore the correlations among the variables, whereas the
multivariate tests make direct use of the correlations.
3. Multivariate test is more powerful in many cases. The power of a test is the probability of
rejecting H0 when it is false. In some cases, all p of the univariate tests fail to reach
Page 380 of 420

Bret R. Swan Appendix
significance, but the multivariate test is significant because small effects on some of the
variables combine to jointly indicate significance. However, for a given sample size, there
is a limit to the number of variables a multivariate test can handle without losing power.
4. Many multivariate tests that involve comparing group means have, as a byproduct, the
construction of linear combinations of variables revealing more about how the variables
combine to reject the hypothesis.
The probability of rejecting one or more of univariate tests on p variables when H0:
1 2 3 ... Xμ μ μ μ= = = is true is called the overall α or experimentwise error rate. If only
univariate tests are performed on individual variables, without using multivariate hypothesis tests,
then the overall error rate is overinflated. Yet, when the same testing is performed only after the
multivariate tests reject H0, the error rates of individual variable tests are close to the nominal rate.
Rencher (2001, pp. 126-128, 183-185) cites several examples of research studying the
experimentwise error rate for univariate tests following rejection of H0 by the multivariate tests.
Using α = 0.05 in calculation of the multivariate T2 statistic, univariate t-tests are performed only if
the T2-test rejected H0. The result yielded an overall α between 0.017 and 0.050, which is
acceptably close to the nominal 0.05. When compared to the same procedure performed without a
prior T2-test, the resulting overall α was found to be too high (between 0.077 to 0.348). In another
study, univariate F-tests are conducted following a Wilk’s Lambda multivariate test. The resulting
values ranged from 0.022 to 0.057, which is close to the target value of 0.05. Without first
performing the Wilk’s Lambda test, the probability for rejecting one or more univariate tests when
H0 is true varied from 0.09 to 0.31, far above the target value of 0.05. If a univariate F-test or t-test
is made on each of the p variables regardless of whether the overall MANOVA test rejects H0:
1 2 3 X...μ μ μ μ= = = , then the overall α -level will increase beyond the nominal value because we
are making p tests.
Thus, when testing multivariate data, multivariate hypothesis tests should be conducted
before any univariate tests. When univariate tests are conducted only after rejection of the overall
multivariate tests, the experimentwise error rate is close to the desired α -level. When the
probability of rejection for the tests on individual variables is reduced, these tests become more
conservative. If H0 is rejected, further univariate tests on individual variables and variable
interactions can go on. If H0 does not reject, then further univariate tests are not advised because
they will not yield valid and reliable results. In this way, the results will “protect” against the
inflation of the experimentwise error rate by performing tests on individual variables only if the
Page 381 of 420

Bret R. Swan Appendix
overall MANOVA test rejects H0: 1 2 3 X...μ = μ μ μ= = (cf. Rencher, 2001, pp. 112-117, 126-128,
168-170, 183-185).
M.4.2 THE FOUR MULTIVARIATE HYPOTHESIS TESTS USED IN A MANOVA
A MANOVA is recommended for data analysis from this experiment because the
independent variables are both fixed and categorical (Rencher, 2001). However, prior to
proceeding with the MANOVA, it is important to perform four multivariate hypothesis tests prior to
performing univariate statistical analyses. The four multivariate test statistics include:
the Wilk’s Lambda ( ), Λ
1 1
11
s
i λ=
Λ =+∏ (3.1)
Roy’s Largest Root (θ ),
1
11λθλ
=+
(3.2)
Pillai Statistic ( ( )sV ),
( ) 1
1 11
ss
iV λ
λ=
=+∑ (3.3)
and the Lawley-Hotelling test statistic ( ( )sU ).
( )
1
ss
ii
U λ=
=∑ (3.4)
However, as can be seen from the equations above, the four tests are not equivalent. In a given
sample, they may lead to different conclusions, even when H0 is true and some tests reject H0 while
other tests accept H0.
There are several reasons why four different multivariate hypothesis tests are needed. All
four are exact tests. This means when H0: 1 2 3 ... Xμ μ μ μ= = = is true, all the mean vectors are at
the same point. Consequently, all four MANOVA test statistics have the same Type I error rate α ;
Page 382 of 420

Bret R. Swan Appendix
meaning all tests have the same probability of rejection when H0 is true. Using all four tests
contribute to assuring the researcher that further tests on multivariate data will maintain an
acceptable error rate.
Four different multivariate test statistics are used because different situations make one test
statistic more powerful than another. As a result, there is a considerable amount of disagreement in
the statistics community as to which statistic is best. According to Rencher (2001), this
disagreement is primarily a result of many statisticians not understanding the increased complexities
of multivariate statistics. Because of this debate, the most reliable conclusion is obtained when all
four tests agree on the independent variable being tested. When all four tests agree, the multivariate
dataset clearly meets the requirements of multivariate independence, and, therefore, significant
statistical results in further analyses can be trusted because the overall experimentwise error rates
are preserved. The following sections detail these four multivariate test statistics.
The differences between the four MANOVA test statistics are due to the multidimensional
nature of the space in which the multivariate mean vectors lie. The argument supporting the use of
multiple test statistics is that each test is more sensitive to different types of variation in multivariate
s-dimensional space. Consequently, the mean vectors lie in s-dimensional subspace of the p-
dimensional space of the observations - meaning they may occupy a subspace of s-dimensions. For
example, the points may be confined to a line (one dimension) or a plane (three dimensions).
The pattern of the mean vectors is indicated by the eigenvalues ( iλ ) of the E-1H matrix. If
there is one large eigenvalue, then the vectors lie close to a line. If there are two or more large
eigenvalues and the others are small, then the mean vectors lie mostly in a plane. Since the power
of a test is the probability of rejecting H0 when it is false, in terms of power, the tests are ordered, θ
≥ U(s) ≥ ≥ V(s) for collinear mean vectors, and V(s) ≥ Λ Λ ≥ U(s) ≥ θ for diffuse mean vectors. This
means that for multivariate data with multivariate mean vectors, Roy’s Largest Root is the most
powerful test but is the least powerful test for multidimensional data, where the Pillai statistic is the
most powerful test. Wilk’s Lambda and Lawley-Hotelling statistics provide good overall power in
both cases. Therefore, using all four tests helps identify potential problems and lends reliability and
validity to further statistical analyses on the data (see Rencher (2001, pp. 176-179) for further
discussion).
Page 383 of 420

Bret R. Swan Appendix
M.5 SCALE RELIABILITY ANALYSIS OF THE DIFFERENTIAL ATTENTIONAL PROCESSES
INVENTORY
Preliminary analysis of the DAPI items evaluated the scale reliability of its constructs.
Cronbach’s α was calculated for each of the four DAPI construct subscales:
Moderate Focus Subscale: 8 items (DAPI items 1, 3, 7, 8, 9, 26, 33, 34)
Extreme Focus Subscale: 12 items (DAPI items 4, 5, 10, 14, 16, 17, 19, 22, 23, 24, 27, 28)
Dual Cognitive-Physical Task Focus Subscale: 5 items (DAPI items 11, 30, 35, 36, 37)
Dual Cognitive-Cognitive Task Focus Subscale: 4 items (DAPI items 31, 32, 39, 40)
If DAPI constructs are reliable, the Cronbach α ≥ 0.8.
M.6 EVALUATION OF THE BALANCE OF PARTICIPANT COGNITIVE STYLES IN
TREATMENT GROUPS
Participants’ cognitive styles (i.e., extraversion-introversion and sensing-intuition abilities)
were evaluated to understand their distributions within treatment groups. Counts of participants
MBTI extroversion, introversion, sensors, and intuitive styles are arranged and analyzed by the type
of between-subject independent variables used in this study: the type of graphical process model
(GPM) and the type of User Educational Training (UET).
Page 384 of 420

Bret R. Swan Appendix
N PRELIMINARY ANALYSES OF THE DATASET Several preliminary analyses were performed to test the underlying statistical assumptions
prior to performing analyses testing the hypotheses. Results of parametric statistical assumptions
that were tested are included in this section: multivariate normality, homogeneity of
variance/covariance, multivariate hypothesis tests of independence, scale reliability analyses of the
DAPI, and evaluation of the balance of participant cognitive styles in the treatment groups.
N.1 NORMALITY
Normality is evaluated most effectively by plotting histograms of the data and visually
evaluating it. Skewness and Kurtosis results also help determine normality. The data in this
experiment was plotted and analyzed in these ways.
800700600500400300200100
InformationTime_Sec
20
15
10
5
0
Freq
uenc
y
Mean =342.31�Std. Dev. =119.385�
N =87
Figure N-1. Histogram of the time participants took to interpret information-related BPI.
Page 385 of 420

Bret R. Swan Appendix
10.008.006.004.002.000.00
SelfEfficacy_OverallMean
14
12
10
8
6
4
2
0
Freq
uenc
y
Mean =6.1149�Std. Dev. =1.87802�
N =87
Figure N-2. Histogram of participants’ self-efficacy results.
Table N-1. Skewness and Kurtosis results for the dependent variables.
N Range Skewness Kurtosis Statistic Statistic Statistic Std. Error Statistic Std. Error
Accuracy - Task Knowledge (% Correct) 87 63 -.260 .258 -.915 .511
Accuracy - Resource Knowledge (% Correct) 87 80 .102 .258 -1.066 .511
Accuracy - Information Knowledge (% Correct) 87 86 -.341 .258 -.145 .511
Time - Task-related Process Knowledge (Seconds) 87 383 .814 .258 .668 .511
Time - Resource-related Process Knowledge (Seconds) 87 708 1.883 .258 6.420 .511
Time - Information-related Process Knowledge (Seconds) 87 582 .623 .258 -.090 .511
NASA TLX Mental Workload for interpreting Task-related BPI 87 85.20 .024 .258 .383 .511
NASA TLX Mental Workload for interpreting Resource-related BPI
87 89.73 -.090 .258 .521 .511
NASA TLX Mental Workload for interpreting Information-related BPI
87 95.07 -.396 .258 .718 .511
Average Self Efficacy Score 87 10.00 -.558 .258 .364 .511
Page 386 of 420

Bret R. Swan Appendix
Of all the histograms, Figures N-1 and N-2 are the only two that are suspicious as to their
normality. They show skewness to one tail or another and some evidence of being bimodal.
Skewness and Kurtosis results are shown in Table N-1. In Table N-1, the three timeliness scores
show which deviations from normality.
N.2 POST HOC STATISTICAL POWER ANALYSES
Post hoc analyses of the multivariate data revealed the statistical power (1-β) of the
experiment was sufficient to detect large effects on all dependent variables across all independent
variables. SPSS statistical analysis reveal possible problems in the observed power in:
• All multivariate hypothesis tests associated with the type of UET (see the observed
power column in Table N-2).
• The subjective mental workload results associated with the type of GPM (see the
observed power column in Table N-4).
• All dependent variables associated with the type of UET (see the observed power
column in Table N-4).
• All dependent variables associated with the type of BPI (see the observed power
column in Table N-5).
Further investigation revealed problems with the way the a priori power analysis was
conducted. Post hoc power analyses also was able to provide evidence and justification for the
statistical power of these analyses.
N.2.1 PROBLEMS WITH A PRIORI POWER ANALYSIS
As discussed in Section 3.6.1, the sample size and power level was determined using Figure
2.1 in Lipsey (1990, p. 44). This figure assists in the determination of power levels and sample
sizes for one-way ANOVAs, and was recommended as appropriate to use, at the time, because
individual ANOVAs are the basis of MANOVAs and because of inconsistent recommendations for
determining power in multivariate data from in prior statistical literature. However, it was
discovered during post hoc analysis of the data that the recommended sample size recommended by
Page 387 of 420
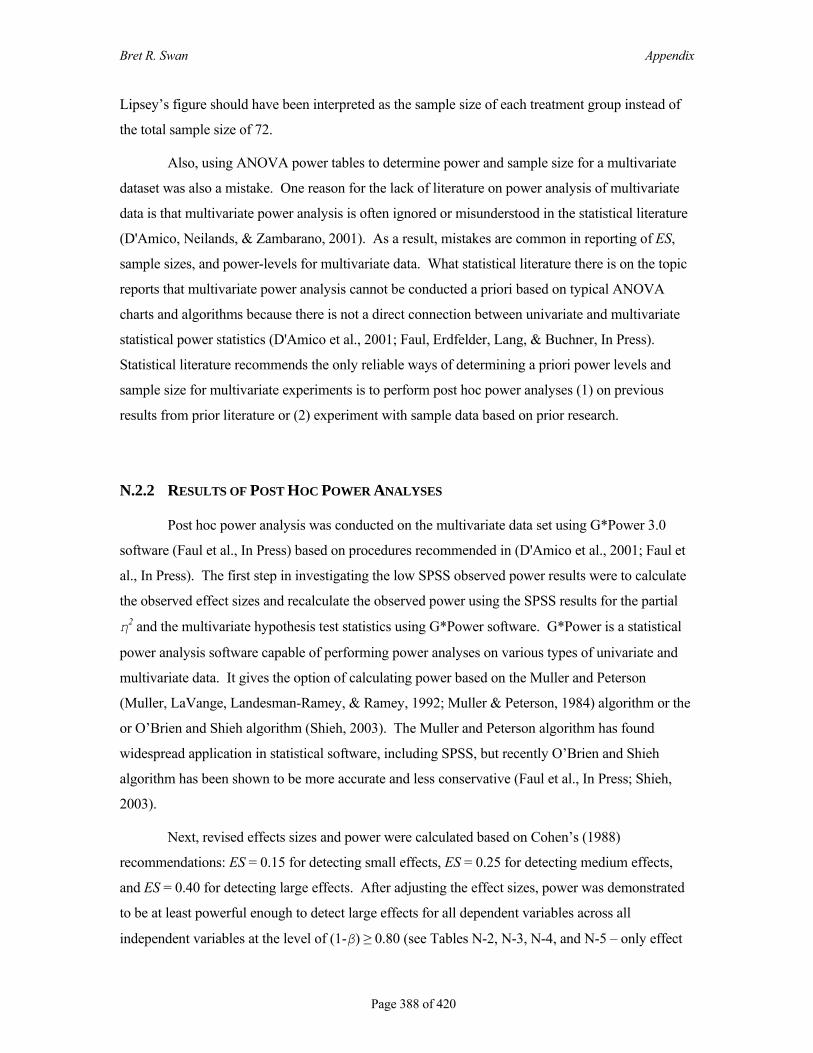
Bret R. Swan Appendix
Lipsey’s figure should have been interpreted as the sample size of each treatment group instead of
the total sample size of 72.
Also, using ANOVA power tables to determine power and sample size for a multivariate
dataset was also a mistake. One reason for the lack of literature on power analysis of multivariate
data is that multivariate power analysis is often ignored or misunderstood in the statistical literature
(D'Amico, Neilands, & Zambarano, 2001). As a result, mistakes are common in reporting of ES,
sample sizes, and power-levels for multivariate data. What statistical literature there is on the topic
reports that multivariate power analysis cannot be conducted a priori based on typical ANOVA
charts and algorithms because there is not a direct connection between univariate and multivariate
statistical power statistics (D'Amico et al., 2001; Faul, Erdfelder, Lang, & Buchner, In Press).
Statistical literature recommends the only reliable ways of determining a priori power levels and
sample size for multivariate experiments is to perform post hoc power analyses (1) on previous
results from prior literature or (2) experiment with sample data based on prior research.
N.2.2 RESULTS OF POST HOC POWER ANALYSES
Post hoc power analysis was conducted on the multivariate data set using G*Power 3.0
software (Faul et al., In Press) based on procedures recommended in (D'Amico et al., 2001; Faul et
al., In Press). The first step in investigating the low SPSS observed power results were to calculate
the observed effect sizes and recalculate the observed power using the SPSS results for the partial
η2 and the multivariate hypothesis test statistics using G*Power software. G*Power is a statistical
power analysis software capable of performing power analyses on various types of univariate and
multivariate data. It gives the option of calculating power based on the Muller and Peterson
(Muller, LaVange, Landesman-Ramey, & Ramey, 1992; Muller & Peterson, 1984) algorithm or the
or O’Brien and Shieh algorithm (Shieh, 2003). The Muller and Peterson algorithm has found
widespread application in statistical software, including SPSS, but recently O’Brien and Shieh
algorithm has been shown to be more accurate and less conservative (Faul et al., In Press; Shieh,
2003).
Next, revised effects sizes and power were calculated based on Cohen’s (1988)
recommendations: ES = 0.15 for detecting small effects, ES = 0.25 for detecting medium effects,
and ES = 0.40 for detecting large effects. After adjusting the effect sizes, power was demonstrated
to be at least powerful enough to detect large effects for all dependent variables across all
independent variables at the level of (1-β) ≥ 0.80 (see Tables N-2, N-3, N-4, and N-5 – only effect
Page 388 of 420

Bret
R. Swan Appendix
Page 389 of 420
sizes or observed power statistics that were suspicious were revised). Subsequent research should
increase the sample size of the treatment groups to be capable of detecting medium or smaller effect
sizes.

Bret R. Swan Appendix
Table N-2. Post hoc power analyses of multivariate hypothesis tests of between-subject effects for both between and within-subjects independent variables and interactions.
Between Subjects Effect
Value F Hypothesis
df Error df Sig.
Partial Eta
Squared
Observed Effect
Size (e) Observed Power (a)
Revised Effect Size(e)
Revised Power(e)
Intercept Pillai's Trace .99 2514.41(b) 3.00 79.00 .00 .99 1.00 Between Subjects Variable
Wilks' Lambda .01 2514.41(b) 3.00 79.00 .00 .99 1.00 Hotelling's Trace 95.48 2514.41(b) 3.00 79.00 .00 .99 1.00 Roy's Largest Root 95.48 2514.41(b) 3.00 79.00 .00 .99 1.00 GPM Type Pillai's Trace .44 20.62(b) 3.00 79.00 .00 .44 .89 1.00 .40 .81 Wilks' Lambda .56 20.62(b) 3.00 79.00 .00 .44 .89 1.00 .40 .81 Hotelling's Trace .78 20.62(b) 3.00 79.00 .00 .44 .89 1.00 .40 .81 Roy's Largest Root .78 20.62(b) 3.00 79.00 .00 .44 1.00 Pillai's Trace .16 2.25 6.00 160.00 .04 .08 .43 .78 or .87(e) .40 .81 Wilks' Lambda .85 2.23(b) 6.00 158.00 .04 .08 .42 .77 or .85(e) .40 .81 Hotelling's Trace .17 2.22 6.00 156.00 .04 .08 .41 .77 or .83(e) .40 .81
User Educational Training Type Roy's Largest Root .12 3.06(c) 3.00 80.00 .03 .10 .70 BPI Type Pillai's Trace .38 7.64(b) 6.00 76.00 .00 .38 1.00 Within
Subjects Variable Wilks' Lambda .62 7.64(b) 6.00 76.00 .00 .38 1.00 Hotelling's Trace .60 7.64(b) 6.00 76.00 .00 .38 1.00 Roy's Largest Root .60 7.64(b) 6.00 76.00 .00 .38 1.00 Pillai's Trace .06 .80(b) 6.00 76.00 .57 .06 .30 Wilks' Lambda .94 .80(b) 6.00 76.00 .57 .06 .30 Hotelling's Trace .06 .80(b) 6.00 76.00 .57 .06 .30
BPI Type X GPM Type
Roy's Largest Root .06 .80(b) 6.00 76.00 .57 .06 .30 BPI Type X Pillai's Trace .22 1.59 12.00 154.00 .10 .11 .82
Page 390 of 420

Bret R. Swan Appendix
Between Subjects Effect
Value F Hypothesis
df Error df Sig.
Partial Eta
Squared
Observed Effect
Size (e) Observed Power (a)
Revised Effect Size(e)
Revised Power(e)
Wilks' Lambda .79 1.61(b) 12.00 152.00 .10 .11 .82 Hotelling's Trace .26 1.61 12.00 150.00 .09 .12 .82
User Educational Training Type Roy's Largest Root .21 2.68(c) 6.00 77.00 .02 .18 .84
Pillai's Trace .13 .88 12.00 154.00 .57 .07 .50 Wilks' Lambda .88 .88(b) 12.00 152.00 .57 .07 .50 Hotelling's Trace .14 .87 12.00 150.00 .58 .07 .49
BPI Type X GPM Type X User Education Type Roy's Largest Root .10 1.17(c) 6.00 77.00 .33 .08 .44
a Computed using Muller and Peterson (Muller et al., 1992; Muller & Peterson, 1984) algorithm and alpha = .05 b Exact statistic c The statistic is an upper bound on F that yields a lower bound on the significance level. d Design: Intercept+GPMType+UserEducationType+GPMType * UserEducationType Within Subjects Design: BPIType e Calculated using the O’Brien & Shieh (Shieh, 2003) algorithm in post hoc power analysis
Page 391 of 420
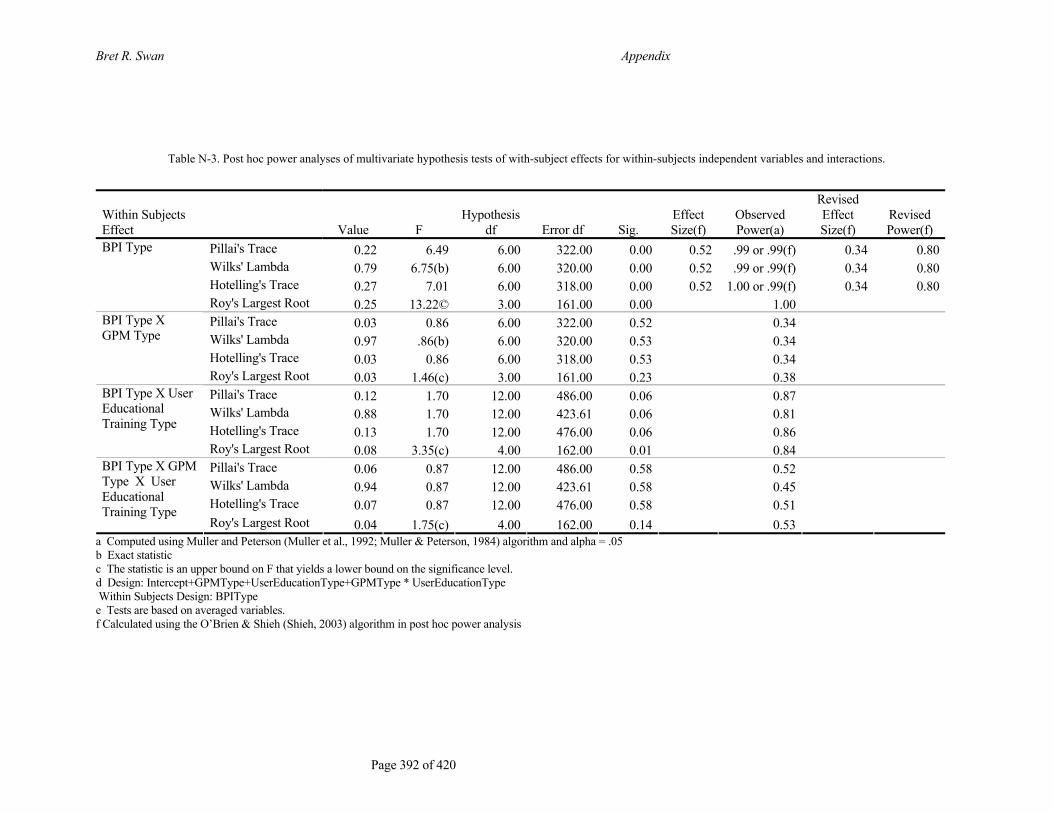
Bret R. Swan Appendix
Table N-3. Post hoc power analyses of multivariate hypothesis tests of with-subject effects for within-subjects independent variables and interactions.
Within Subjects Effect
Value F
Hypothesis df Error df Sig.
Effect Size(f)
Observed Power(a)
Revised Effect Size(f)
Revised Power(f)
BPI Type Pillai's Trace 0.22 6.49 6.00 322.00 0.00 0.52 .99 or .99(f) 0.34 0.80 Wilks' Lambda 0.79 6.75(b) 6.00 320.00 0.00 0.52 .99 or .99(f) 0.34 0.80 Hotelling's Trace 0.27 7.01 6.00 318.00 0.00 0.52 1.00 or .99(f) 0.34 0.80 Roy's Largest Root 0.25 13.22© 3.00 161.00 0.00 1.00
Pillai's Trace 0.03 0.86 6.00 322.00 0.52 0.34 Wilks' Lambda 0.97 .86(b) 6.00 320.00 0.53 0.34 Hotelling's Trace 0.03 0.86 6.00 318.00 0.53 0.34
BPI Type X GPM Type
Roy's Largest Root 0.03 1.46(c) 3.00 161.00 0.23 0.38 Pillai's Trace 0.12 1.70 12.00 486.00 0.06 0.87 Wilks' Lambda 0.88 1.70 12.00 423.61 0.06 0.81 Hotelling's Trace 0.13 1.70 12.00 476.00 0.06 0.86
BPI Type X User Educational Training Type
Roy's Largest Root 0.08 3.35(c) 4.00 162.00 0.01 0.84 Pillai's Trace 0.06 0.87 12.00 486.00 0.58 0.52 Wilks' Lambda 0.94 0.87 12.00 423.61 0.58 0.45 Hotelling's Trace 0.07 0.87 12.00 476.00 0.58 0.51
BPI Type X GPM Type X User Educational Training Type
Roy's Largest Root 0.04 1.75(c) 4.00 162.00 0.14 0.53 a Computed using Muller and Peterson (Muller et al., 1992; Muller & Peterson, 1984) algorithm and alpha = .05 b Exact statistic c The statistic is an upper bound on F that yields a lower bound on the significance level. d Design: Intercept+GPMType+UserEducationType+GPMType * UserEducationType Within Subjects Design: BPIType e Tests are based on averaged variables. f Calculated using the O’Brien & Shieh (Shieh, 2003) algorithm in post hoc power analysis
Page 392 of 420

Bret R. Swan Appendix
Table N-4. Post hoc power analyses of univariate ANOVAs of between-subject independent variables and interactions.
Transformed Variable: Average
Source Measure
Type III Sum of Squares df Mean Square
F Sig.
Partial Eta
Squared
Observed Effect Size(b)
Observed Power(a)
Revised Effect Size(b)
Revised Power(b)
Intercept Accuracy 1145197.31 1.00 1145197.31 3086.49 0.00 0.97 1.00 Time 23198976.21 1.00 23198976.21 1204.61 0.00 0.94 1.00 MWL 1088364.98 1.00 1088364.98 2043.07 0.00 0.96 1.00 GPM Type Accuracy 15420.83 1.00 15420.83 41.56 0.00 0.34 0.72 1.00 0.29 0.80 Time 337171.15 1.00 337171.15 17.51 0.00 0.18 0.47 .99 or .99(b) 0.33 ..802 MWL 1837.91 1.00 1837.91 3.45 0.04 0.21 .45 or .34(b) 0.35 0.81
Accuracy 2208.76 2.00 1104.38 2.98 0.06 0.07 0.27 .56 or .73(b) 0.29 0.80 Time 43710.18 2.00 21855.09 1.14 0.33 0.03 0.17 .24 or .24(b) 0.33 0.80
User Educational Training
MWL 3525.18 2.00 1762.59 3.31 0.04 0.08 0.29 .61 or .68(b) 0.35 0.81 Accuracy 877.04 2.00 438.52 1.18 0.31 0.03 0.25 Time 65593.62 2.00 32796.81 1.70 0.19 0.04 0.35
GPM Type X User Educational Training Type MWL 2169.93 2.00 1084.96 2.04 0.14 0.05 0.41 Error Accuracy 30053.89 81.00 371.04 Time 1559935.88 81.00 19258.47 MWL 43149.67 81.00 532.71
a Computed using alpha = .05 b Calculated using the O’Brien & Shieh (Shieh, 2003) algorithm in post hoc power analysis
Page 393 of 420

R. Swan Appendix
Page 394 of 420
Table N-5. Post hoc power analyses of univariate ANOVA results of within-subject independent variables and interactions.
Bret
Source Measure Sphericity Correction
Type III Sum of Squares df Mean Square F Sig.
Partial Eta
Squared Effect Size(b)
Observed Power(a)
Revised Effect Size(b)
Revised Power(b)
BPI Type Accuracy Huynh-Feldt 1293.518 1.93 670.14 2.29 0.11 0.03 0.17 .45 or.81(b) 0.17 0.80 Time Sphericity Assumed 203676.36 2.00 101838.18 17.94 0.00 0.18 0.47 1.00 0.15 0.89 MWL Sphericity Assumed 954.32 2.00 477.16 5.19 0.01 0.06 0.25 .82 or .99(b) 0.15 0.95
Accuracy Huynh-Feldt 318.63 1.93 165.07 0.56 0.56 0.01 0.14 Time Sphericity Assumed 3750.26 2.00 1875.13 0.33 0.72 0.00 0.10
BPI X GPM Type
MWL Sphericity Assumed 303.17 2.00 151.59 1.65 0.20 0.02 0.34 Accuracy Huynh-Feldt 1175.30 3.86 304.45 1.04 0.39 0.03 0.32 Time Sphericity Assumed 28679.85 4.00 7169.96 1.26 0.29 0.03 0.39
BPI X UET Type
MWL Sphericity Assumed 1198.06 4.00 299.52 3.26 0.01 0.07 0.83 Accuracy Huynh-Feldt 509.69 3.86 132.03 0.45 0.77 0.01 0.15 Time Sphericity Assumed 19068.67 4.00 4767.17 0.84 0.50 0.02 0.26
BPI X GPM X UET Type MWL Sphericity Assumed 520.37 4.00 130.09 1.42 0.23 5.66 0.43
Accuracy Huynh-Feldt 45765.93 156.35 292.72 Time Sphericity Assumed 919765.56 162.00 5677.57
Error(BPIType)
MWL Sphericity Assumed 14898.61 162.00 91.97 a Computed using alpha = .05 b Calculated using the O’Brien & Shieh (Shieh, 2003) algorithm in post hoc power analysis

Bret R. Swan Appendix
N.3 HOMOGENEITY OF VARIANCE AND COVARIANCE
Results for Levene’s test on the dependent variables (Table N-6) and Box’s test show that
the dataset does not violate the assumption of homogeneity of variance and covariance. Levene’s
test results only showed the timeliness results for task-related BPI violated this assumption,
F(5,81)=4.734, p = 0.001. Levene’s test for unequal group sizes is not as consistent and it does not
take into account covariance between groups. Box’s test results take into account this shortcoming.
Box’s test of equality of covariance matrices is non-significant at p < 0.05, but not by much, Box’s
M=370.156, F(225,8114)=1.137, p =0.080.
Table N-6. Levene's Test of Equality of Error Variances (a)
F df1 df2 Sig.
Accuracy - Task Knowledge (% Correct) 1.80 5 81 .12
Accuracy - Resource Knowledge (% Correct) 1.98 5 81 .09 Accuracy - Information Knowledge (% Correct) .27 5 81 .93
Time - Task-related Process Knowledge (Seconds) 4.73 5 81 .001***
Time - Resource-related Process Knowledge (Seconds) 2.02 5 81 .09
Time - Information-related Process Knowledge (Seconds) 2.12 5 81 .07
NASA TLX Mental Workload for interpreting Task-related BPI 1.90 5 81 .10
NASA TLX Mental Workload for interpreting Resource-related BPI 1.25 5 81 .30
NASA TLX Mental Workload for interpreting Information-related BPI 2.20 5 81 .06
Tests the null hypothesis that the error variance of the dependent variable is equal across groups. a Design: + GPM Type + User Educational Training Type + GPM Type*User Educational Training Type Within Subjects Design: BPI Type
Table N-7. Bartlett's Test of Sphericity (a)
Effect Likelihood
Ratio Approx. Chi-
Square df Sig. Between Subjects .000 356.207 5 .000***Within Subjects BPI Type .000 660.609 5 .000***
Tests the null hypothesis that the residual covariance matrix is proportional to an identity matrix. a Design: + GPM Type + User Educational Training Type + GPM Type*User Educational Training Type Within Subjects Design: BPI Type
Page 395 of 420

Bret R. Swan Appendix
Within-subjects sphericity results of Bartlett’s test, which tests the null hypothesis that the
residual covariance matrix is proportional to an identity matrix, are highly significant both within
and between subjects (see Table N-7). Results of Mauchly’s test of sphericity shows that task
accuracy violates this assumption (see Table N-8). Timeliness and TLX mental workload data do
not violate sphericity. Table N-8 also indicates how to correct for this violation in the analyses of
the experimental hypotheses. Since the Greenhouse-Geisser correction is greater than 0.75, ε =
0.89, the Huynh-Feldt correction should be used to correct the degrees of freedom for task accuracy
in subsequent MANOVA and MANCOVA analyses (Field, 2005; Rencher, 2001).
Table N-8. Mauchly's Test of Sphericity (b)
Within Subjects Design: BPI Type
Epsilon (a) Within Subjects Effect Measure
Mauchly's W
Approx. Chi-
Square df
Sig.
Greenhouse-Geisser
Huynh-Feldt
Lower-bound
BPI Type Accuracy .88 10.52 2 .005** .89 .965 .50 Time .96 3.45 2 .18 .96 1.00 .50 Mental Workload .98 1.74 2 .42 .98 1.00 .50
Tests the null hypothesis that the error covariance matrix of the orthonormalized transformed dependent variables is proportional to an identity matrix. a May be used to adjust the degrees of freedom for the averaged tests of significance. Corrected tests are displayed in the
Tests of Within-Subjects Effects Table. b Design: + GPM Type + UET Type + GPM Type X UET Type
N.4 TESTS OF INDEPENDENCE
Multivariate hypothesis tests were conducted using the four multivariate test statistics in
order to test for the independence of the dependent measures. These multivariate tests protect
against inflation of the overall experimentwise error rate and subsequent misinterpretations of
univariate analyses when results for a variable are significant at the p < 0.05 level of significance.
When the test is non-significant (i.e., the null hypothesis is true, H0:
Accuracy Time MentalWorkload Self Efficacyμ μ μ μ −= = = ) then any subsequent analyses are ignored because
any significance must be a Type I error.
Table N-9 and N-10 report the results of multivariate hypothesis tests show that the three
independent variables are clearly significant for all four of the test statistics below the p < 0.05 level
Page 396 of 420

Bret R. Swan Appendix
of significance. Therefore, the assumption of independence is preserved and significance results of
subsequent statistical analyses can be trusted.
N.5 RELIABILITY ANALYSES OF THE DIFFERENTIAL ATTENTIONAL PROCESSES
INVENTORY
Preliminary analysis of the Differential Attentional Processes Inventory (DAPI) items
evaluated the scale reliability of its constructs. Scale reliability analysis of these constructs revealed
the following:
Moderate Focus Subscale: Cronbach’s α = 0.897, 8 items
Extreme Focus Subscale: Cronbach’s α = 0.830, 12 items
Dual Cognitive-Physical Task Focus Subscale: Cronbach’s α = 0.790, 5 items
Dual Cognitive-Cognitive Task Focus Subscale: Cronbach’s α = 0.835, 4 items
All DAPI constructs show Cronbach’s α are ≥ 0.8, and, consequently, subsequent participant means
of DAPI constructs are justified in future analyses (Field, 2005).
Page 397 of 420

Bret R. Swan Appendix
Table N-9. Multivariate hypothesis test results of between- and within-subjects independent variables and interactions.
Effect Variable & Interactions
Multivariate Tests Value F
Hypothesis df
Error df Sig.
Intercept Pillai's Trace 0.99 2514.41(a) 3.00 79.00 .000 Wilks' Lambda 0.01 2514.41(a) 3.00 79.00 .000 Hotelling's Trace 95.48 2514.41(a) 3.00 79.00 .000
Between Subjects
Roy's Largest Root 95.48 2514.41(a) 3.00 79.00 .000 GPM Type Pillai's Trace 0.44 20.62(a) 3.00 79.00 .000*** Wilks' Lambda 0.56 20.62(a) 3.00 79.00 .000*** Hotelling's Trace 0.78 20.62(a) 3.00 79.00 .000*** Roy's Largest Root 0.78 20.62(a) 3.00 79.00 .000*** Pillai's Trace 0.16 2.25 6.00 160.00 .041* Wilks' Lambda 0.85 2.23(a) 6.00 158.00 .043* Hotelling's Trace 0.17 2.22 6.00 156.00 .044*
User Educational Training Type
Roy's Largest Root 0.12 3.06(b) 3.00 80.00 .033* Pillai's Trace 0.11 1.49 6.00 160.00 .185 Wilks' Lambda 0.90 1.49(a) 6.00 158.00 .186 Hotelling's Trace 0.11 1.48 6.00 156.00 .187
GPM Type X User Educational Training Type Roy's Largest Root 0.09 2.51(b) 3.00 80.00 .065
Pillai's Trace 0.38 7.64(a) 6.00 76.00 .000*** Wilks' Lambda 0.62 7.64(a) 6.00 76.00 .000*** Hotelling's Trace 0.60 7.64(a) 6.00 76.00 .000***
Within Subjects
BPI Type
Roy's Largest Root 0.60 7.64(a) 6.00 76.00 .000*** Pillai's Trace 0.06 .80(a) 6.00 76.00 .570 Wilks' Lambda 0.94 .80(a) 6.00 76.00 .570 Hotelling's Trace 0.06 .80(a) 6.00 76.00 .570
BPI Type X GPM Type
Roy's Largest Root 0.06 .80(a) 6.00 76.00 .570 Pillai's Trace 0.22 1.59 12.00 154.00 .099† Wilks' Lambda 0.79 1.61(a) 12.00 152.00 .095† Hotelling's Trace 0.26 1.62 12.00 150.00 .092†
User Educational Training Type X BPI Type
Roy's Largest Root 0.21 2.67(b) 6.00 77.00 .021* Pillai's Trace 0.13 0.88 12.00 154.00 .565 Wilks' Lambda 0.88 .88(a) 12.00 152.00 .574 Hotelling's Trace 0.14 0.87 12.00 150.00 .583
GPM Type X User Education Type X BPI Type Roy's Largest Root 0.09 1.17(b) 6.00 77.00 .329
†p < 0.10 *p < 0.05 **p < 0.01 ***p < 0.001 a Exact statistic b The statistic is an upper bound on F that yields a lower bound on the significance level. c Design: +GPM Type + User Educational Training Type + GPM Type*User Educational Training Type Within Subjects Design: BPI Type
Page 398 of 420

Bret R. Swan Appendix
Table N-10. Multivariate hypothesis tests of within-subjects independent variables and interactions.
Within Subjects Effect Multivariate Hypothesis Tests Value F
Hypothesis df Error df Sig.
BPI Type Pillai's Trace 0.22 6.49 6.00 322.00 .000*** Wilks' Lambda 0.79 6.75(a) 6.00 320.00 .000*** Hotelling's Trace 0.27 7.01 6.00 318.00 .000*** Roy's Largest Root 0.25 13.22(b) 3.00 161.00 .000***
Pillai's Trace 0.03 0.86 6.00 322.00 .523 Wilks' Lambda 0.97 .86(a) 6.00 320.00 .525 Hotelling's Trace 0.03 0.86 6.00 318.00 .527
BPI Type X GPM Type
Roy's Largest Root 0.03 1.46(b) 3.00 161.00 .228 Pillai's Trace 0.12 1.70 12.00 486.00 .063† Wilks' Lambda 0.88 1.70 12.00 423.61 .064† Hotelling's Trace 0.13 1.70 12.00 476.00 .064†
BPI Type X User Educational Training Type
Roy's Largest Root 0.08 3.35(b) 4.00 162.00 .012* Pillai's Trace 0.06 0.87 12.00 486.00 .576 Wilks' Lambda 0.94 0.87 12.00 423.61 .580 Hotelling's Trace 0.07 0.87 12.00 476.00 .584
BPI Type X GPM Type X User Educational Training Type Roy's Largest Root 0.04 1.75(b) 4.00 162.00 .141
†p < 0.10 *p < 0.05 **p < 0.01 ***p < 0.001 a Exact statistic b The statistic is an upper bound on F that yields a lower bound on the significance level. c Design: +GPM Type + User Educational Training Type + GPM Type*User Educational Training Type Within Subjects Design: BPI Type d Tests are based on averaged variables.
N.6 EVALUATION OF THE BALANCE OF PARTICIPANT COGNITIVE STYLES IN
TREATMENT GROUPS
The MBTI was used to assess two dimensions of the cognitive styles of the participants: (1)
extraversion vs. introversion and (2) sensing vs. intuition. Table N-11 show different balances of
participants preferring different cognitive styles across both the type of GPM and the type of UET.
IE students using UML diagrams that were sensors (9) vs. intuitives (3) was quite different from
those using metagraphs (5 sensors vs. 7 intuitives). IE students had a similar numbers of extroverts
vs. introverts using UML vs. metagraphs, but there is a difference between the numbers of sensors
vs. intuitives.
MGT student extroverts and introverts showed differences between those who used UML
diagrams vs. metagraphs. The number of MGT student extroverts using UML diagrams (10) vs.
metagraphs (7) were opposite of MGT student introverts using UML diagrams (8) vs. metagraphs
Page 399 of 420
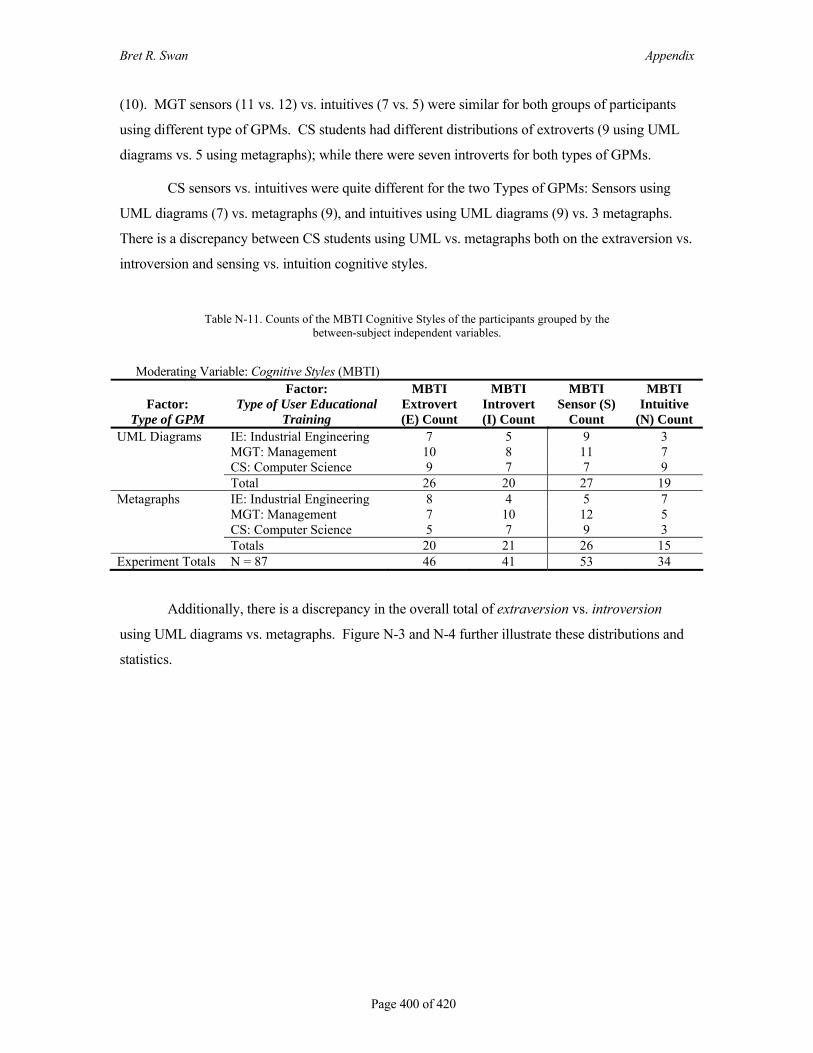
Bret R. Swan Appendix
(10). MGT sensors (11 vs. 12) vs. intuitives (7 vs. 5) were similar for both groups of participants
using different type of GPMs. CS students had different distributions of extroverts (9 using UML
diagrams vs. 5 using metagraphs); while there were seven introverts for both types of GPMs.
CS sensors vs. intuitives were quite different for the two Types of GPMs: Sensors using
UML diagrams (7) vs. metagraphs (9), and intuitives using UML diagrams (9) vs. 3 metagraphs.
There is a discrepancy between CS students using UML vs. metagraphs both on the extraversion vs.
introversion and sensing vs. intuition cognitive styles.
Table N-11. Counts of the MBTI Cognitive Styles of the participants grouped by the between-subject independent variables.
Moderating Variable: Cognitive Styles (MBTI)
Factor: Type of GPM
Factor: Type of User Educational
Training
MBTI Extrovert (E) Count
MBTI Introvert (I) Count
MBTI Sensor (S)
Count
MBTI Intuitive
(N) Count UML Diagrams IE: Industrial Engineering 7 5 9 3 MGT: Management 10 8 11 7 CS: Computer Science 9 7 7 9 Total 26 20 27 19 Metagraphs IE: Industrial Engineering 8 4 5 7 MGT: Management 7 10 12 5 CS: Computer Science 5 7 9 3 Totals 20 21 26 15 Experiment Totals N = 87 46 41 53 34
Additionally, there is a discrepancy in the overall total of extraversion vs. introversion
using UML diagrams vs. metagraphs. Figure N-3 and N-4 further illustrate these distributions and
statistics.
Page 400 of 420
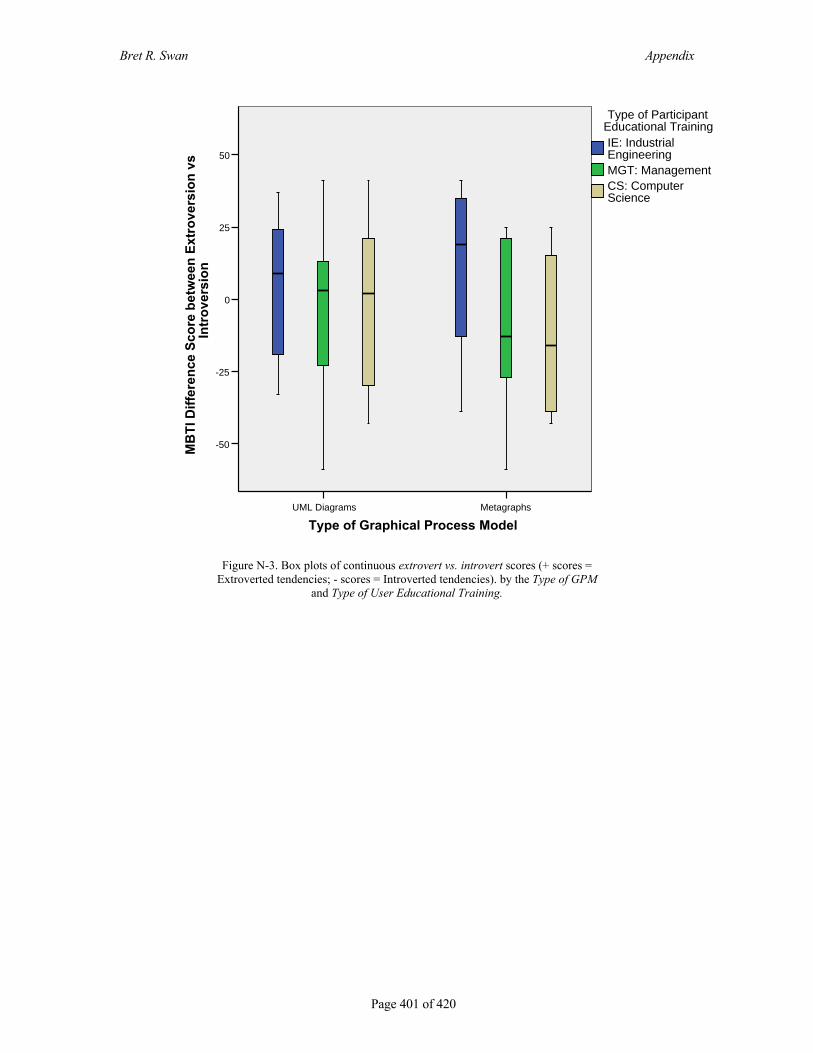
Bret R. Swan Appendix
MetagraphsUML Diagrams
Type of Graphical Process Model
50
25
0
-25
-50MB
TI D
iffer
ence
Sco
re b
etw
een
Extr
over
sion
vs
Intr
over
sion
CS: Computer Science
MGT: Management
IE: Industrial Engineering
Type of Participant Educational Training
Figure N-3. Box plots of continuous extrovert vs. introvert scores (+ scores = Extroverted tendencies; - scores = Introverted tendencies). by the Type of GPM
and Type of User Educational Training.
Page 401 of 420
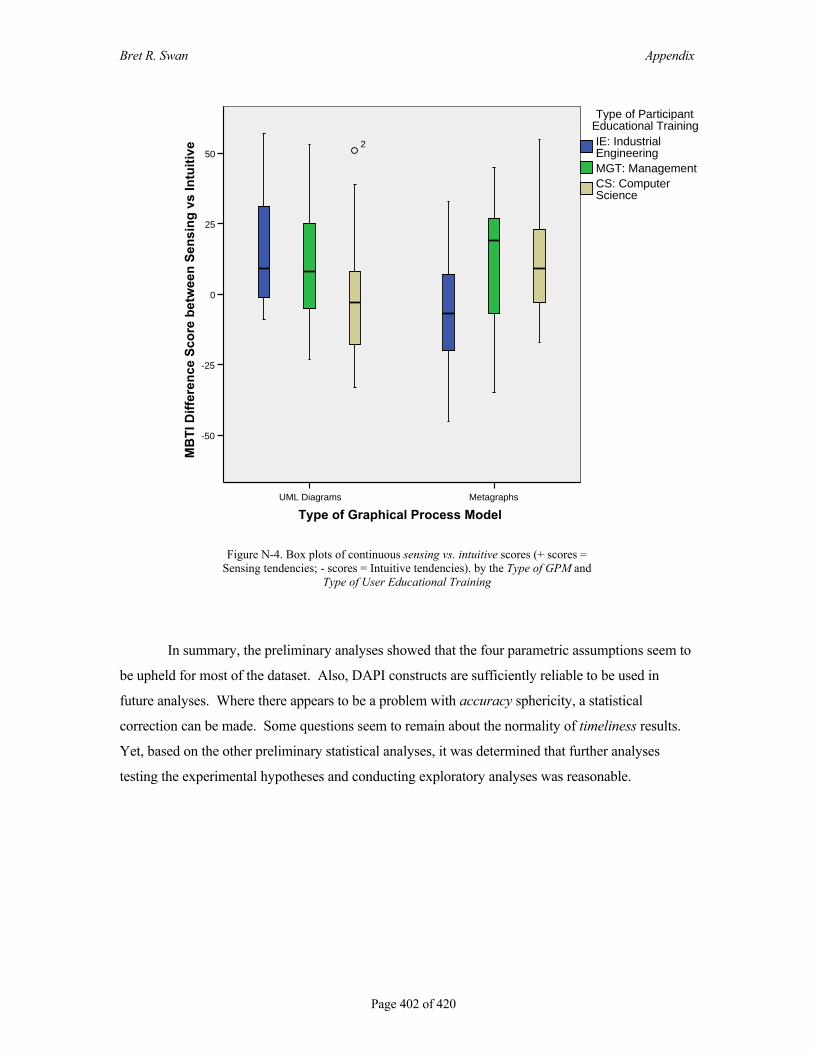
Bret R. Swan Appendix
MetagraphsUML Diagrams
Type of Graphical Process Model
50
25
0
-25
-50
MB
TI D
iffer
ence
Sco
re b
etw
een
Sens
ing
vs In
tuiti
ve 2
CS: Computer Science
MGT: Management
IE: Industrial Engineering
Type of Participant Educational Training
Figure N-4. Box plots of continuous sensing vs. intuitive scores (+ scores = Sensing tendencies; - scores = Intuitive tendencies). by the Type of GPM and
Type of User Educational Training
In summary, the preliminary analyses showed that the four parametric assumptions seem to
be upheld for most of the dataset. Also, DAPI constructs are sufficiently reliable to be used in
future analyses. Where there appears to be a problem with accuracy sphericity, a statistical
correction can be made. Some questions seem to remain about the normality of timeliness results.
Yet, based on the other preliminary statistical analyses, it was determined that further analyses
testing the experimental hypotheses and conducting exploratory analyses was reasonable.
Page 402 of 420

Bret R. Swan Appendix
O EXPLORATORY DATA ANALYSES
In addition to testing the research hypotheses, several additional analyses were conducted
that explored other interesting relationships in the dataset. An exploratory factor analysis was
conducted to reveal underlying components of participants’ evaluations of subjective mental
workload (Appendix O.1). General Cognitive Abilities, Attentional Abilities, and Cognitive Style
covariate effects were also explored in Sections O.2, O.3, and O.4. Finally, sections O.5 through
O.9 explores correlations and effects of key demographics that could or do play an important role in
this experiment.
O.1 EXPLORATORY FACTOR ANALYSIS OF SUBJECTIVE MENTAL WORKLOAD
In processing TLX mental workload subscales, it was apparent that ratings of individual
subscales did not appear to be independent and many were highly correlated. Therefore, an
exploratory factor analysis was conducted to look for underlying factors that are influencing TLX
ratings of subjective mental workload.
The selection of the appropriate number of factors (m) is based on interpretation of
agreement of four criteria (Rencher, 2002, pp. 427-430), since the selection of m cannot be
objectively determined with one criteria:
1. Choose m equal to number of factors necessary for the variance to explain pre-determined
percentage of the total variance explained. In this case, 70-80% is chosen as it represents
approximately ¾ of the total variance.
2. Choose m equal to the number of eigenvalues greater than the average value. Using the
correlation matrix (R) the average value is 1.
3. Use the scree test to plot the eigenvalues of R (or S). If the graph drops sharply, followed
by a near straight line with a much smaller slop, choose m equal to the number of
eigenvalues before the near straight line begins.
4. Test the hypothesis that m is the correct number of factors, H0: 'Σ = ΛΛ +Ψ where is p
x m.
Λ
Method 1 given m = 3 because Table O-1 reveals that three factors explain 74.340 percent
of the total variance (tr(R)). Method 2 gives m = 3 since λ3 = 0.956 (=1.048 rotated) and λ4 = 0.625.
Page 403 of 420

Bret R. Swan Appendix
For Method 3, the scree plot in Figure O-1 reveals a clear break between and leveling off of the
slope after λ3. Method 4 was not determined as necessary because of the clear agreement of the
other three Methods. Therefore, the clear choice of the number of factors was selected as m = 3.
Table O-1. Exploratory Factor Analysis of TLX Mental Workload subscales revealing three underlying factors explaining close to 75% of
the total variance.
Initial Eigenvalues Varimax Rotation
Sums of Squared Loadings Component
(i.e., Underlying
Factors) Total % of
Variance Cumulative
% Total % of
Variance Cumulative
% 1 2.223 37.055 37.055 2.153 35.877 35.877 2 1.282 21.360 58.415 1.260 21.004 56.880 3 .956 15.925 74.340 1.048 17.460 74.340 4 .625 10.420 84.760 5 .512 8.539 93.300 6 .402 6.700 100.000
Extraction Method: Principal Component Analysis.
Page 404 of 420

Bret R. Swan Appendix
654321
Component Number
2.0
1.5
1.0
0.5
Eige
nval
ue
Scree Plot
Figure O-1. Scree plot revealing a clear break on Method 3 between λ3 and λ4.
This exploratory factor analysis revealed that there were three underlying components (i.e.,
factors) that made up slightly less that 75% of the total variation in the TLX mental workload
constructs. Table O-2 shows that five of the six TLX subscales appear to load cleanly and highly
(above 0.6) onto one of these three factors. Frustration appeared to load almost evenly on Factor #1
(0.606) and #2 (0.585). Although frustration is almost equally loading on two factors, usually
confusing the interpretation, it is loading relatively high on both factors so its influence should not
be discounted.
Factor #1, explaining a 35.9% of the variation (Table O-1) is made up of the TLX
subscales: mental demand (0.816), mental effort (0.798), temporal demand (0.670), and frustration
(0.606) (Table O-2). Factor #2, explaining 21% of the total variation, is made up of the TLX
subscales: frustration (0.585) and perception of performance (0.891). And Factor #3, explaining
17.5% of the total variation is made up of the TLX subscale: physical demand (0.976).
Page 405 of 420

Bret R. Swan Appendix
Table O-2. Exploratory Factor Analysis showing the loadings of the
three components (i.e., factors) underlying TLX mental workload results (n = 261).
Component (i.e., Factors) TLX Mental Workload Construct 1 2 3 Mental Demand .816 -.025 -.023 Mental Effort .798 -.332 -.015 Temporal Demand .670 .114 .295
Frustration .606 .585 .081
Perception of Performance -.169 .891 -.009
Physical Demand .072 .004 .976 Extraction Method: Principal Component Analysis. Rotation Method: Varimax with Kaiser Normalization. a Rotation converged in 5 iterations.
Factor #1 reveals that participants saw external demands (temporal and mental) as highly
related to both their internal exertions (mental effort) and emotions (frustration). As they reported
these external demands increasing, they reported their internal efforts and frustrations increasing.
Thus, Factor #1 represents external and internal burdens on participants’ subjective mental
workload.
Factor #2 is an interesting, almost single variable factor. It represents participants’
perception of performance. Frustration was related to performance perception, but, interestingly,
the directionality seems counterintuitive. This factor reveals that as perception of performance
increases, participants’ frustration increases. This suggests that as participants’ tried hard and
perceived that they performed well, they were also more frustrated; possibly because they
experienced such high subjective mental workload in order to achieve what they perceived as high
performance on the task.
Factor #3 reflects the accurate perception of participants that physical demand was
unrelated to the other impacts of subjective mental workload. The experimental task was not
physically demanding, therefore it makes sense that the TLX physical demand subscale is not
related, and has the least impact on subjective mental workload.
It is important to note, as a reminder, that the TLX mental workload scores used the
analyses of the hypotheses are not solely an aggregation of these TLX subscales. TLX scores are
calculations of these six TLX subscales and separate pairwise comparisons weightings of these
Page 406 of 420
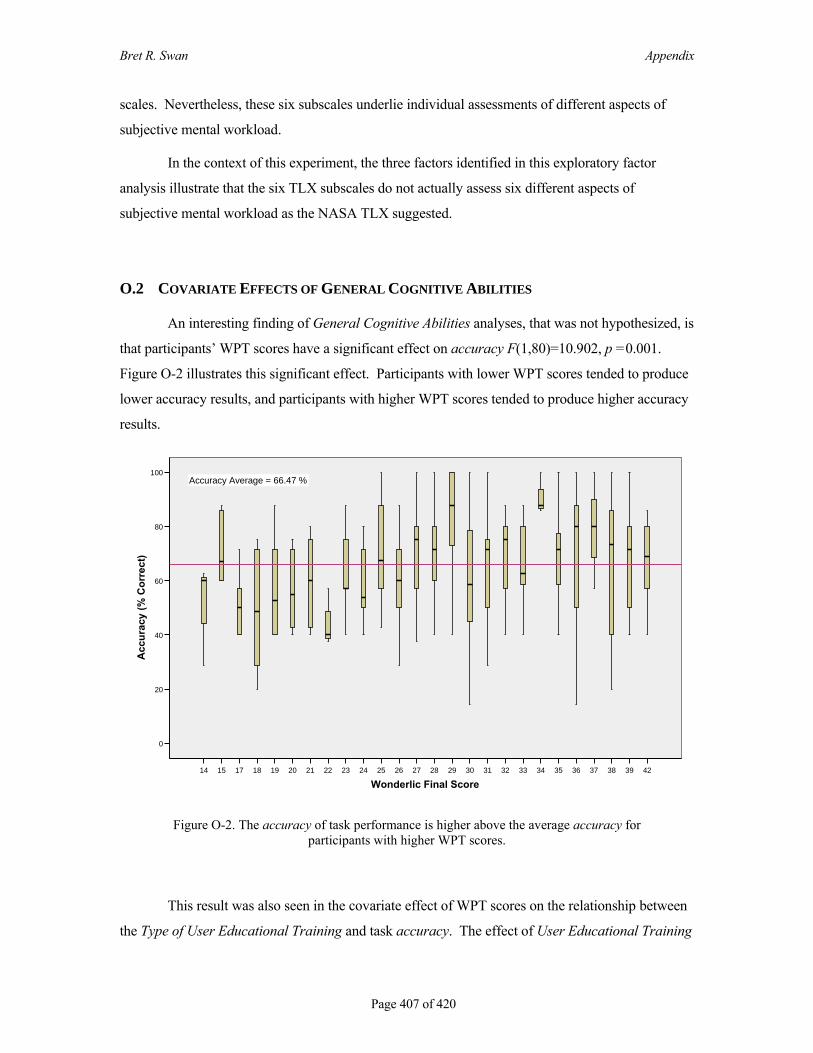
Bret R. Swan Appendix
scales. Nevertheless, these six subscales underlie individual assessments of different aspects of
subjective mental workload.
In the context of this experiment, the three factors identified in this exploratory factor
analysis illustrate that the six TLX subscales do not actually assess six different aspects of
subjective mental workload as the NASA TLX suggested.
O.2 COVARIATE EFFECTS OF GENERAL COGNITIVE ABILITIES
An interesting finding of General Cognitive Abilities analyses, that was not hypothesized, is
that participants’ WPT scores have a significant effect on accuracy F(1,80)=10.902, p =0.001.
Figure O-2 illustrates this significant effect. Participants with lower WPT scores tended to produce
lower accuracy results, and participants with higher WPT scores tended to produce higher accuracy
results.
4239383736353433323130292827262524232221201918171514
Wonderlic Final Score
100
80
60
40
20
0
Acc
urac
y (%
Cor
rect
)
Accuracy Average = 66.47 %
Figure O-2. The accuracy of task performance is higher above the average accuracy for participants with higher WPT scores.
This result was also seen in the covariate effect of WPT scores on the relationship between
the Type of User Educational Training and task accuracy. The effect of User Educational Training
Page 407 of 420

Bret R. Swan Appendix
Type on accuracy changes from being significant when WPT scores are not included as a covariate
(F(2,81)=3.309, p = 0.042) to be non-significant (F(2,80)=1.315, p = 0.247) when WPT scores are
taken into account.
Furthermore, within-subject MANCOVA results show that, when WPT scores are taken
into account, BPI Type no longer has a highly significant effect on timeliness, F(2,160)=1.105, p =
0.334, and the impact of subjective mental workload is reduced, F(2,160)=2.506, p = 0.085;
compared to the significant effect of the Type of BPI on these outcomes (F(2,162)=17.937, p =
0.000, and F(2,160)=5.188, p = 0.007 respectively) when WPT scores were not included as a
covariate. No other results changed for the other dependent and independent variables when WPT
scores are included as a covariate.
These results suggest that the statistically significant effects of the Type of User
Educational Training and the BPI Types on task accuracy, timeliness, and subjective mental
workload appear to be due more to covariation with General Cognitive Abilities than to the
unaccompanied impact of these independent variables.
O.3 ATTENTIONAL ABILITIES COVARIATE EFFECTS
Besides the hypothesized results related to attentional abilities of participants, several
covariate effects were discovered in the course of exploratory analyses (Table O-3). Apparently,
DAPI constructs have no significant effect on task accuracy. In addition, the DAPI Extreme Focus
construct does not have any significant effect on the outcome measures of this experiment. Self-
reports of participants’ attentional abilities show significant effects of the following:
Timeliness: DAPI Moderate Focus, F(2,80)=5.785, p = 0.018, and DAPI Dual
Cognitive-Physical Task Focus, F(2,80)=4.678, p = 0.034
TLX Mental Workload: DAPI Dual Cognitive-Physical Task Focus, F(2,80)=5.219, p
= 0.025, and DAPI Dual Cognitive-Cognitive Task Focus, F(2,80)=8.734, p = 0.003.
Average Self-Efficacy: DAPI Dual Cognitive-Physical Task Focus, F(2,80)=3.314, p =
0.070, and DAPI Dual Cognitive-Cognitive Task Focus, F(2,80)=12.827, p = 0.037.
Page 408 of 420

Bret R. Swan Appendix
Table O-3. Shows between-subject effects of the covariates for Attentional Attributes (DAPI constructs).
Source Dependent Variable Type III Sum
of Squares df Mean
Square F Sig. Accuracy (% Correct) 66.464 1, 80 66.464 .177 .675 Time (Seconds) 105188.900 1, 80 105188.900 5.785 .018*
DAPI Moderate Focus TLX Mental Workload 1201.697 1, 80 1201.697 2.292 .134 Average Self Efficacy .522 1, 80 .522 .159 .691
Accuracy (% Correct) 361.016 1, 80 361.016 .973 .327 Time (Seconds) 13686.754 1, 80 13686.754 .708 .403
DAPI Extreme Focus TLX Mental Workload 294.835 1, 80 294.835 .550 .460 Average Self Efficacy 3.093 1, 80 3.093 .950 .333
Accuracy (% Correct) 183.153 1, 80 183.153 .491 .486 Time (Seconds) 86183.239 1, 80 86183.239 4.678 .034* TLX Mental Workload 2642.769 1, 80 2642.769 5.219 .025*
DAPI Dual Task Focus: Cognitive-Physical
Average Self Efficacy 14.310 1, 80 14.310 4.596 .035* Accuracy (% Correct) 5.564 1, 80 5.564 .015 .903 Time (Seconds) 25713.220 1, 80 25713.220 1.341 .250 TLX Mental Workload 1587.004 1, 80 1587.004 3.055 .084†
DAPI Dual Task Focus: Cognitive-Cognitive
Average Self Efficacy 5.745 1, 80 5.745 1.784 .185 †p < 0.10 *p < 0.05 **p < 0.01 ***p < 0.001
What is interesting is that the statistically significant effects on time, subjective mental
workload, and average self-efficacy have shown that attentional abilities seem to impacts the
outcomes of performance rather than accuracy that measures direct task performance.
O.4 COGNITIVE STYLE COVARIATE EFFECTS
Section 4.2 reports accuracy and timeliness results for the between and within-subject
sections of repeated measures MANCOVAs that include extrovert-introvert and sensor-intuitive as
covariates. These tables show that neither of the two MBTI cognitive styles had any significant
effects on accuracy or timeliness in covariation with the independent variables in this experiment.
O.5 CORRELATIONS OF KEY DEMOGRAPHICS
Key demographics were correlated with between-subject components of the accuracy,
timeliness, subjective mental workload, and self-efficacy assessments (Table O-4). The university,
gender, and English skills show no correlations at a high enough degree, even if statistically
significant, to be important.
Page 409 of 420

Bret R. Swan Appendix
Table O-4. Between-subject correlations of key demographics.
University
of Participant Gender
Is English your native language?
Accuracy - Task Knowledge (% Correct) -0.07 -0.01 -0.15
Accuracy - Resource Knowledge (% Correct) -0.13 -0.01 -0.14
Accuracy - Information Knowledge (% Correct) -0.05 -0.02 -0.10
Time - Task-related Process Knowledge (Seconds) -0.02 -0.03 0.10
Time - Resource-related Process Knowledge (Seconds) 0.05 -0.06 0.10
Time - Information-related Process Knowledge (Seconds) 0.18 -0.01 0.18
Mental Demand on interpreting Task-related Process Information 0.00 0.01 0.03
Physical Demand on interpreting Task-related Process Information 0.11 -0.18 .306**
Temporal Demand on interpreting Task-related Process Information -0.06 -0.05 -0.08
Perception of Performance on interpreting Task-related Process Information -0.16 0.09 -0.10
Mental Effort on interpreting Task-related Process Information 0.06 0.09 -0.05
Frustration on interpreting Task-related Process Information 0.02 -0.03 -0.01
Mental Demand on interpreting Resource-related Process Information -0.06 0.09 -0.08
Physical Demand on interpreting Resource-related Process Information -0.02 0.00 .240*
Temporal Demand on interpreting Resource-related Process Information 0.00 -0.04 -0.09
Perception of Performance on interpreting Resource-related Process Information -0.19 0.19 -0.12
Mental Effort on interpreting Resource-related Process Information 0.08 0.01 -0.04
Frustration on interpreting Resource-related Process Information -0.05 -0.02 -0.05
Mental Demand on interpreting Information-related Process Information 0.09 -0.03 0.09
Physical Demand on interpreting Information-related Process Information 0.07 -0.08 .309**
Temporal Demand on interpreting Information-related Process Information 0.20 -0.07 -0.05
Perception of Performance on interpreting Information-related Process Information -0.15 0.08 -0.08
Mental Effort on interpreting Information-related Process Information 0.11 0.04 0.11
Frustration on interpreting Information-related Process Information 0.13 -0.04 0.11
Page 410 of 420
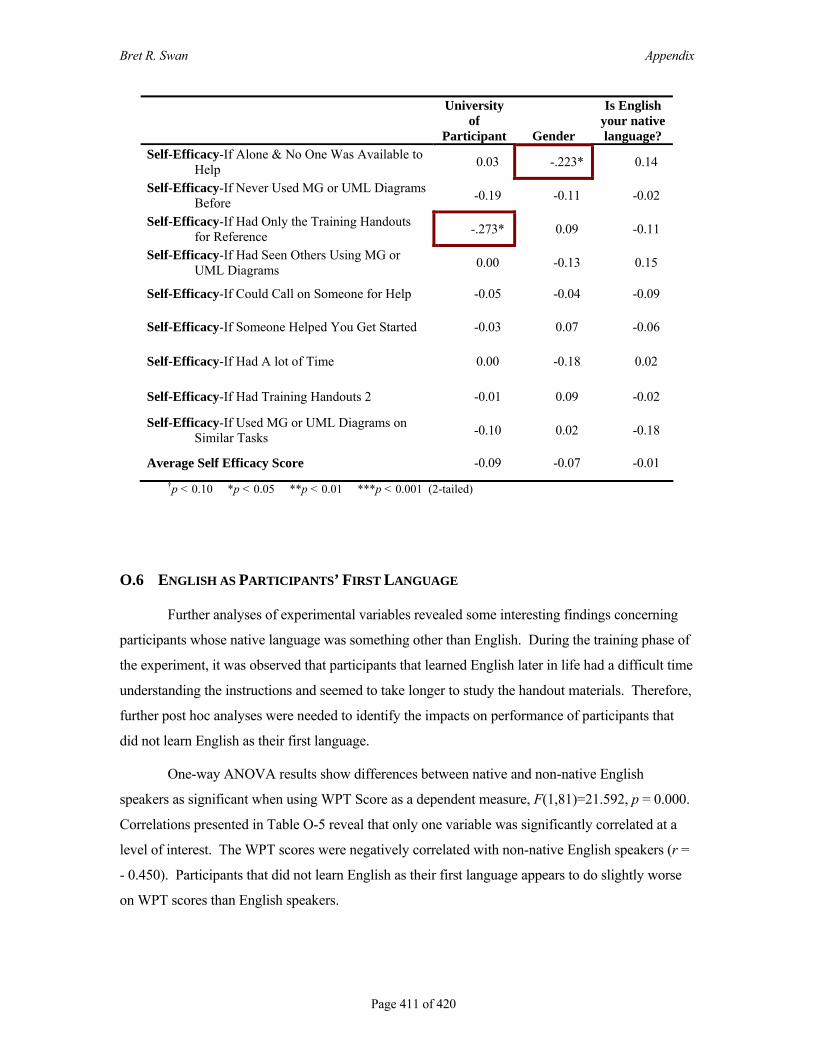
Bret R. Swan Appendix
University
of Participant
Is English your native
Gender language? Self-Efficacy-If Alone & No One Was Available to
Help 0.03 -.223* 0.14
Self-Efficacy-If Never Used MG or UML Diagrams Before -0.19 -0.11 -0.02
Self-Efficacy-If Had Only the Training Handouts for Reference -.273* 0.09 -0.11
Self-Efficacy-If Had Seen Others Using MG or UML Diagrams 0.00 -0.13 0.15
Self-Efficacy-If Could Call on Someone for Help -0.05 -0.04 -0.09
Self-Efficacy-If Someone Helped You Get Started -0.03 0.07 -0.06
Self-Efficacy-If Had A lot of Time 0.00 -0.18 0.02
Self-Efficacy-If Had Training Handouts 2 -0.01 0.09 -0.02
Self-Efficacy-If Used MG or UML Diagrams on Similar Tasks -0.10 0.02 -0.18
Average Self Efficacy Score -0.09 -0.07 -0.01 †p < 0.10 *p < 0.05 **p < 0.01 ***p < 0.001 (2-tailed)
O.6 ENGLISH AS PARTICIPANTS’ FIRST LANGUAGE
Further analyses of experimental variables revealed some interesting findings concerning
participants whose native language was something other than English. During the training phase of
the experiment, it was observed that participants that learned English later in life had a difficult time
understanding the instructions and seemed to take longer to study the handout materials. Therefore,
further post hoc analyses were needed to identify the impacts on performance of participants that
did not learn English as their first language.
One-way ANOVA results show differences between native and non-native English
speakers as significant when using WPT Score as a dependent measure, F(1,81)=21.592, p = 0.000.
Correlations presented in Table O-5 reveal that only one variable was significantly correlated at a
level of interest. The WPT scores were negatively correlated with non-native English speakers (r =
- 0.450). Participants that did not learn English as their first language appears to do slightly worse
on WPT scores than English speakers.
Page 411 of 420

Bret R. Swan Appendix
Table O-5. Correlations.
WPT Score
University currently
enrolled in Gender
Is English your native language?
WPT Score 1 -.341** -.106 -.450**
University currently enrolled in 1 -.116 .329**
Gender 1 -.165
Is English your native language? 1
†p < 0.10 *p < 0.05 **p < 0.01 ***p < 0.001 (2-tailed)
MANCOVA analyses reveal that English abilities do not have a direct effect on accuracy
(F(1,80)=2.028, p=0.158), time (F(1,80)=1.014, p=0.317), nor TLX mental workload
(F(1,80)=0.988, p=0.323). Interestingly, it does have a significant covariate effect on the time it
takes participants’ to interpret different Types of BPI. When English is taken into account as a
covariate, the effect of the Type of BPI on time changes from being significant (F(2,81)=3.309, p =
0.042) to be non-significant (F(2,80)=1.315, p = 0.247). Figure L-32 illustrates the effect of
English as a covariate on the Type of BPI. No other MANCOVA results were impacted when
English is included as a covariate.
Page 412 of 420

Bret R. Swan Appendix
Information-related Process Information
Resource-related Process Information
Task-related Process Information
Type of Business Process Information
800
600
400
200
Tim
e (S
econ
ds)
83
124
107
106
163256
108
60
OtherEnglish
Is English your native language?
Figure O-3. Box plot showing the relationships timeliness to the Type of Business Process Information for native English-speaking
participants vs. participants that did not learn English as their first language.
Figure O-3 illustrates the impacts of BPI Type on timeliness results based on native vs.
non-native English-speaking users. Additionally, one-way ANOVAs testing the English
demographic variable on between-subject variables revealed multiple significant results:
Time on Information-related BPI, F(1,85)=2.767, p = 0.100.
DAPI Dual Cognitive-Physical Task Focus, F(1,85)=7.032, p = 0.010.
TLX Physical Demand on Task-related BPI, F(1,85)=8.811, p = 0.004.
TLX Physical Demand on Resource-related BPI, F(1,85)=5.214, p = 0.025.
TLX Physical Demand on Information-related BPI, F(1,85)=8.941, p = 0.004.
Apparently, there is a significant difference in the time it took native vs. non-native English
speakers to interpret information-related BPI (p < 0.10). It also appears from the above results that
native English vs. non-native English speakers reported differences due to the physical demands of
the tasks. None of these results reported correlations between these or other performance results as
Page 413 of 420

Bret R. Swan Appendix
significant, but there is obviously a perception of mental workload and attentional abilities are
impacted by physical demands explained, at least partially, by the English demographic variables.
O.7 UNIVERSITY OF PARTICIPANTS
The university of the participants appears to have some effects on several moderating
variables. The only highly significant result is that the WPT scores differed between the two
universities that participants were recruited, F(1,85)=11.196, p = 0.001. Figure O-4 shows that
University B has significantly lower WPT scores overall than University A participants. Figure O-4
also reveals the ranges of WPT scores are broader for University B as compared to University A.
Another potential contributor to this statistical significance that can be seen in Figure O-5 is that all
industrial engineering participants came from University A (University B did not have an industrial
engineering program).
University BUniversity A
University Participant is Currently Enrolled
45
40
35
30
25
20
15
10
WPT
Sco
re
12
Figure O-4. Box plot showing the difference between WPT scores and the university from which participants were recruited.
Page 414 of 420

Bret R. Swan Appendix
University BUniversity A
University Participants are Currently Enrolled
45
40
35
30
25
20
15
10
WPT
Sco
re
12
26
28
43
49
CS: Computer Science
MGT: Management
IE: Industrial Engineering
Type of Participant Educational Training
Figure O-5. Box plot further splitting differences between the universities by the Type of User Educational Training.
Although no other significant effects appear related to participant’s performance in this
experiment, the following effects were found from one-way ANOVAs on between-subject effects:
MBTI Extroversion vs. Introversion, F(1,85)=3.887, p = 0.093.
DAPI Dual Cognitive-Physical Task Focus, F(1,85)=3.329, p = 0.072.
TLX Perception of Performance on Resource-related BPI, F(1,85)=3.265, p = 0.074.
TLX Temporal Demand on Information-related BPI, F(1,85)=3.484, p = 0.065.
Additionally, several MBTI, DAPI, and TLX assessments are statistically significant at the
p <0.10 level. While not highly significant, it is an indicator that the university from where students
are recruited can affect experiment results and should be watched in future research.
Page 415 of 420

Bret R. Swan Appendix
O.8 GENDER OF PARTICIPANTS
The gender of participants did not have major effects on this experiment. The only gender
difference that was statistically significant is between male and female participants in terms of their
self-report assessments of their own DAPI Dual Cognitive-Physical Task Focus, F(1,85)=5.605, p
= 0.020. Figure O-6 reveals that males said their have less problem focusing on dual cognitive-
physical tasks, but this figure shows that these results are also so small that the statistical difference
may be insignificant practically.
FemaleMale
Gender
6.00
4.00
2.00
DA
PI M
ean
- Dua
l Cog
nitiv
e-Ph
ysic
al T
asks
Con
stru
ct
8313 57
19
Figure O-6. Box plot of gender differences between DAP Dual Cognitive-Physical Task Focus self-reports.
Two other statistical differences in gender exist at the p < 0.10 level of significance, but
their impact does not appear to affect other aspects of this experiment:
TLX Perception of Performance on Resource-related Process Information,
F(1,85)=3.243, p = 0.075.
TLX Physical Demand on Task-related BPI, F(1,85)=2.816, p = 0.097.
Page 416 of 420

Bret R. Swan Appendix
O.9 AGE OF PARTICIPANTS
The age of participants does not seem to play a significant role in the analyses of this
experiment. The only significant difference due to age is in participants’ MBTI Sensing vs.
Intuitive scores, F(1,85)=2.124, p = 0.028. Figure O-7 shows the distribution of ages of
participants in this experiment. This figure suggests that the statistical significance can mostly be
due to the heavily skewed distribution of participants in their early 20s that participated in this
experiment.
3230282624222018
Age
25
20
15
10
5
0
Freq
uenc
y
Mean =22.63�Std. Dev. =2.606�
N =87
Figure O-7. Distributions of the ages of participants in this experiment.
Table O-6. Exploratory Factor Analysis of GPM Self-Efficacy questions revealing two underlying factors explaining 69% of the total variance (n = 87).
Component Initial Eigenvalues Rotation Sums of Squared Loadings Total % of Variance Cumulative % Total % of Variance Cumulative % 1 4.903 54.476 54.476 3.347 37.184 37.1842 1.312 14.578 69.054 2.868 31.871 69.0543 .645 7.167 76.222 4 .588 6.532 82.754 5 .478 5.310 88.063 6 .379 4.213 92.276 7 .302 3.357 95.633 8 .247 2.742 98.375 9 .146 1.625 100.000
Extraction Method: Principal Component Analysis.
Page 417 of 420
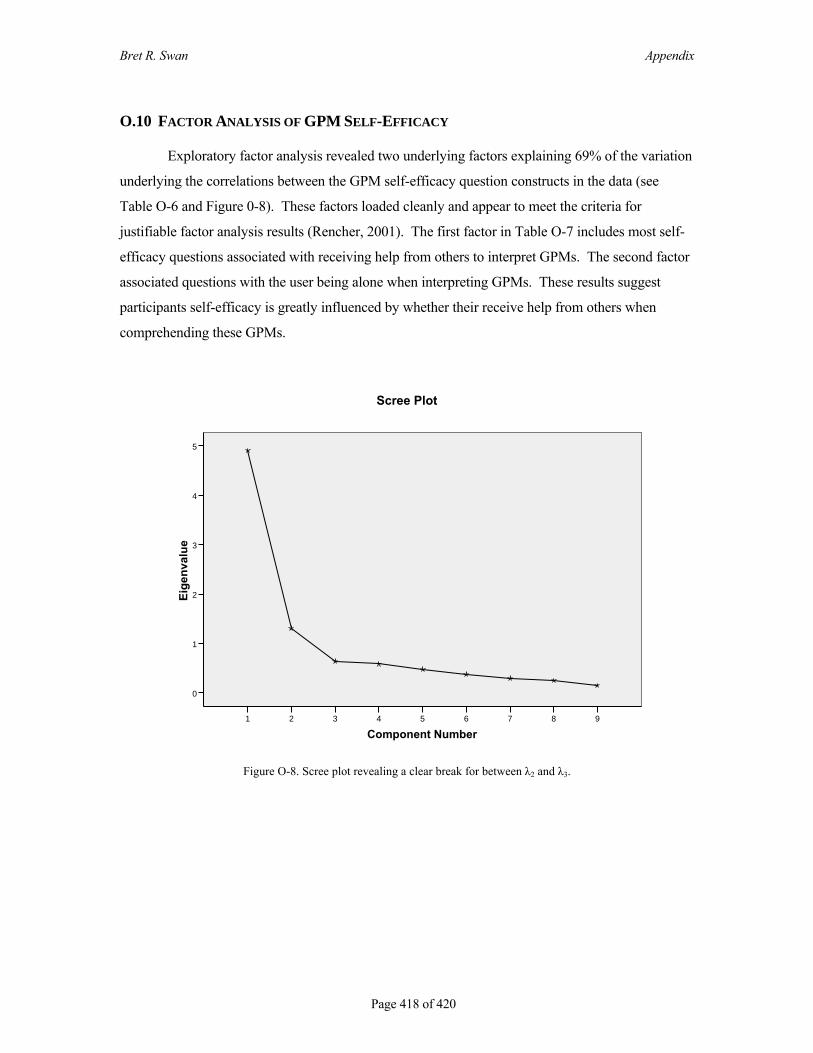
Bret R. Swan Appendix
O.10 FACTOR ANALYSIS OF GPM SELF-EFFICACY
Exploratory factor analysis revealed two underlying factors explaining 69% of the variation
underlying the correlations between the GPM self-efficacy question constructs in the data (see
Table O-6 and Figure 0-8). These factors loaded cleanly and appear to meet the criteria for
justifiable factor analysis results (Rencher, 2001). The first factor in Table O-7 includes most self-
efficacy questions associated with receiving help from others to interpret GPMs. The second factor
associated questions with the user being alone when interpreting GPMs. These results suggest
participants self-efficacy is greatly influenced by whether their receive help from others when
comprehending these GPMs.
Component Number987654321
Eige
nval
ue
5
4
3
2
1
0
Scree Plot
Figure O-8. Scree plot revealing a clear break for between λ2 and λ3.
Page 418 of 420

Bret R. Swan Appendix
Table O-7. Rotated factor loadings for the two factors underlying GPM Self-Efficacy (n = 87).
Component 1 2 Self-Efficacy-If Someone Helped You Get Started .852 .207
Self-Efficacy-If Could Call on Someone for Help .784 .292
Self-Efficacy-If Had A lot of Time .780 .114
Self-Efficacy-If Used MG or UML Diagrams on Similar Tasks
.775 .212
Self-Efficacy-If Had Seen Others Using MG or UML Diagrams
.620 .526
Self-Efficacy-If Never Used MGor UML Diagrams Before
.102 .875
Self-Efficacy-If Alone & No One Was Available to Help
.139 .857
Self-Efficacy-If Had Only the Training Handouts for Reference
.407 .698
Self-Efficacy-If Had Training Handouts 2 .466 .647
a Rotation converged in 3 iterations.
Page 419 of 420
Bret R. Swan Vita
VITA
Bret R. Swan was born in Burley, ID. He graduated from Brigham Young University with a Bachelor of Science degree in Mechanical Engineering and a Masters of Science degree with a minor in Statistics. He was awarded his Ph.D. in Management Systems Engineering from the Grado Department of Industrial and Systems Engineering at Virginia Tech on March 26, 2007. He is a member of both Alpha Pi Mu, the national Industrial Engineering honor society, and Upsilon Pi Epsilon, the international honor society for Computing and Information Sciences. While at Virginia Tech, he worked as a research consultant, research faculty, or graduate research assistant for the Center for Organizational and Technological Advancement, University Leadership Development, the Enterprise Engineering Lab, and the Center for the Scientific Visualization of Organizations. Since 2005, he holds the position of Assistant Professor of Information Systems in the School of Computing at Brigham Young University in Hawaii. He has consulted for over 15 years for several business, professional, government, and university entities in Utah, Virginia, New Jersey, Hawaii, and the South Pacific – such as AT&T Consumer Process Operations Center, AT&T Electronic Bill Presentment & Payment, AT&T Client Care Center, AT&T Charlotte Bill Print Center, StorageTek, Morton-Thiokol, Utah Pharmaceutical Association, BYU-Hawaii Records Management, and the Pacific Islands Private Sector Organization. His research and consulting interests center on the alignment of business processes and information technology and include the scientific visualization of organizations, the management of knowledge-intensive businesses, performance measurement, information visualization, knowledge management, distributed cognition in HCI, training system development, and the cross-cultural impacts of information technology in developing economies and organizations.
Page 420 of 420