Virginia State Chartbook
35
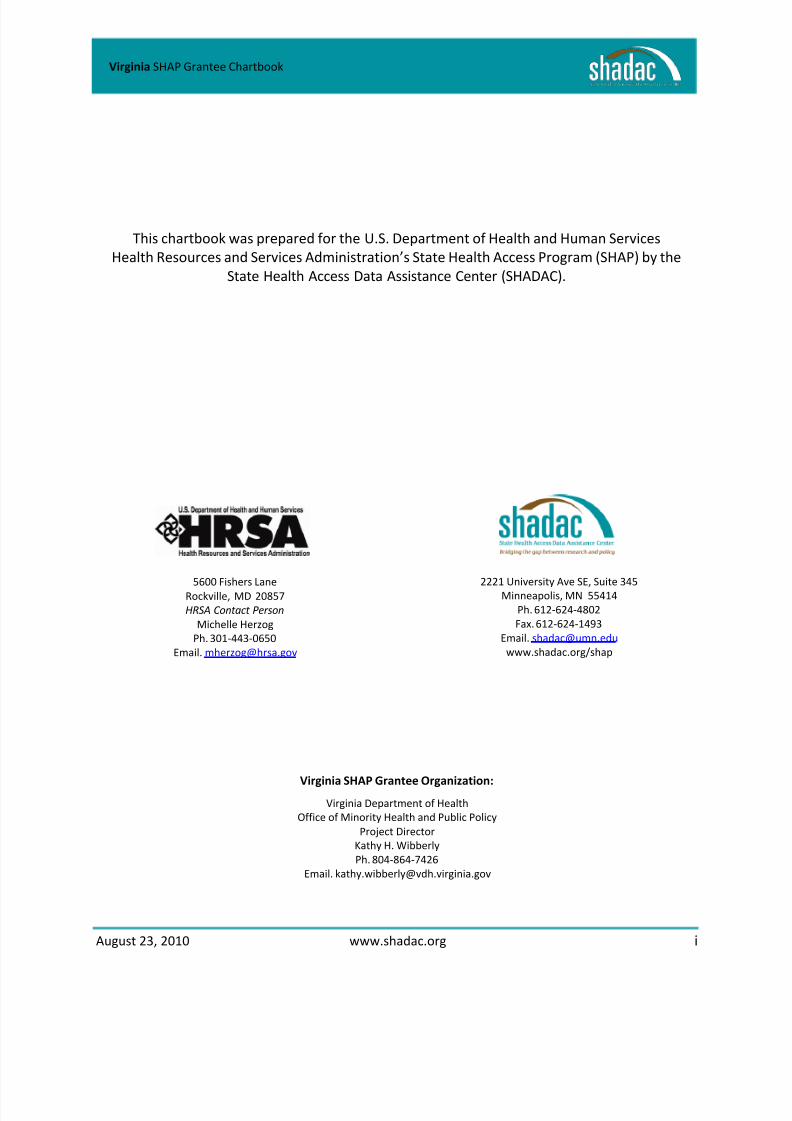
Virginia SHAP Grantee Chartbook Health Insurance Coverage Estimates from the 2008 American Community Survey (ACS) Prepared for: State Health Access Program (SHAP) Last Updated: August 23, 2010
Transcript of Virginia State Chartbook
8/9/2019 Virginia State Chartbook
http://slidepdf.com/reader/full/virginia-state-chartbook 1/35
VirginiaSHAP Grantee Chartbook
Health Insurance Coverage Estimatesfrom the 2008 American Community Survey (ACS)
Prepared for:
State Health Access Program (SHAP)
Last Updated: August 23, 2010
8/9/2019 Virginia State Chartbook
http://slidepdf.com/reader/full/virginia-state-chartbook 2/35
August 23, 2010 www.shadac.org i
Virginia SHAP Grantee Chartbook
This chartbook was prepared for the U.S. Department of Health and Human Services
Health Resources and Services Administration’s State Health Access Program (SHAP) by the
State Health Access Data Assistance Center (SHADAC).
5600 Fishers Lane
Rockville, MD 20857
HRSA Contact Person
Michelle Herzog
Ph. 301-443-0650
Email. [email protected]
2221 University Ave SE, Suite 345
Minneapolis, MN 55414
Ph. 612-624-4802
Fax. 612-624-1493
Email. [email protected]
www.shadac.org/shap
Virginia SHAP Grantee Organization: Virginia Department of Health
Office of Minority Health and Public Policy
Project Director
Kathy H. Wibberly
Ph. 804-864-7426
Email. [email protected]
8/9/2019 Virginia State Chartbook
http://slidepdf.com/reader/full/virginia-state-chartbook 3/35
August 23, 2010 www.shadac.org ii
Virginia SHAP Grantee Chartbook
Table of Contents Page
Introduction .................................................................................................................................................. 1
Summary Statistics ........................................................................................................................................ 1
Exhibit 1: Any Source of Health Insurance Coverage by Poverty Level, Age 0-64, ACS2008 ......................................................................................................................................................... 1
Maps and Data Tables ................................................................................................................................... 2
Exhibit 2.1: Sub-State Uninsurance Estimates, Age 0-64, ACS 2008 ....................................................... 3
Exhibit 2.2: Demographic Profile by Source of Health Insurance Coverage, Age 0-64,
ACS 2008 .................................................................................................................................................. 4
Exhibit 2.3: Sub-State Uninsurance Estimates, Age 0-64, <200% FPL, ACS 2008 .................................... 5
Exhibit 2.4: Demographic Profile by Source of Health Insurance Coverage, Age 0-64,
<200% FPL, ACS 2008 ............................................................................................................................... 6
Exhibit 2.5: Sub-State Uninsurance Estimates, Age 0-64 by Federal Poverty Level(FPL), ACS 2008 ........................................................................................................................................ 7
Exhibit 3.1: Sub-State Uninsurance Estimates, Age 0-18, ACS 2008 ....................................................... 9
Exhibit 3.2: Demographic Profile by Source of Health Insurance Coverage, Age 0-18,
ACS 2008 ................................................................................................................................................ 10
Exhibit 3.3: Sub-State Uninsurance Estimates, Age 0-18, <200% FPL, ACS 2008 .................................. 11
Exhibit 3.4: Demographic Profile by Source of Health Insurance Coverage, Age 0-18,
<200% FPL, ACS ...................................................................................................................................... 12
Exhibit 3.5: Sub-State Uninsurance Estimates, Age 0-18 by Federal Poverty Level
(FPL), ACS 2008 ...................................................................................................................................... 13
Exhibit 4.1: Sub-State Uninsurance Estimates, Age 19-64, ACS 2008 ................................................... 15
Exhibit 4.2: Demographic Profile by Source of Health Insurance Coverage, Age 19-64,
ACS 2008 ................................................................................................................................................ 16
Exhibit 4.3: Sub-State Uninsurance Estimates, Age 19-64, <200% FPL, ACS 2008 ................................ 17
Exhibit 4.4: Demographic Profile by Source of Health Insurance Coverage, Age 19-64,
<200% FPL, ACS ...................................................................................................................................... 18
Exhibit 4.5: Sub-State Uninsurance Estimates, Age 19-64 by Federal Poverty Level
(FPL), ACS 2008 ...................................................................................................................................... 19
Appendix A. Technical Assistance Available from SHADAC ....................................................................... 21
Appendix B. Data Source ............................................................................................................................ 22
Appendix C. County Groupings in Sub-state Areas .................................................................................... 23
Appendix D. Virginia Map of Major Cities .................................................................................................. 31
Appendix E. Virginia Map of County Boundaries ....................................................................................... 32

8/9/2019 Virginia State Chartbook
http://slidepdf.com/reader/full/virginia-state-chartbook 4/35
August 23, 2010 www.shadac.org 1
Virginia SHAP Grantee Chartbook
Introduction
This chartbook of health insurance coverage estimates is designed to be an easily accessed resource for
State Health Access Program (SHAP) grantees. Estimates for key population groups within your state
are provided in summary map format, with detailed tables for reference. Data provided in thischartbook are from the 2008 American Community Survey (ACS).
Your chartbook includes the following information for your state:
Maps of uninsurance estimates for children and adults, as well as children and adults under
200% FPL
Tables of health insurance coverage estimates for the above mentioned population groups, with
variance information
County-level estimates of uninsurance
Demographic profiles of state populations
Summary Statistics
Any source of health insurance coverage for Virginia is shown in Exhibit 1. In 2008, 86.7% of the total
population age 0-64 had health insurance coverage. Over three quarters (78.2%) had private coverage,
while 11.2% reported having government coverage. This is in contrast to individuals under 200% of the
Federal Poverty Level (FPL), of which only 71.1% had insurance, with 44.3% having private coverage, and
30.3% having government coverage.
Exhibit 1: Any Source of Health Insurance Coverage by Poverty Level, Age 0-64, ACS 2008
Source: U.S. Census Bureau, 2008 American Community Survey.
Note: Those who report multiple types of insurance coverage (i.e., private or public) are
included in each category; therefore, totals may add to more than 100 percent.
13.3%
86.7%
78.2%
11.2%
28.9%
71.1%
44.3%
30.3%
0%10%
20%
30%
40%
50%
60%
70%
80%
90%
100%
Uninsured Insured Private Coverage Government
Coverage
Total < 200% FPL
8/9/2019 Virginia State Chartbook
http://slidepdf.com/reader/full/virginia-state-chartbook 5/35
August 23, 2010 www.shadac.org 2
Virginia SHAP Grantee Chartbook
Maps and Data Tables
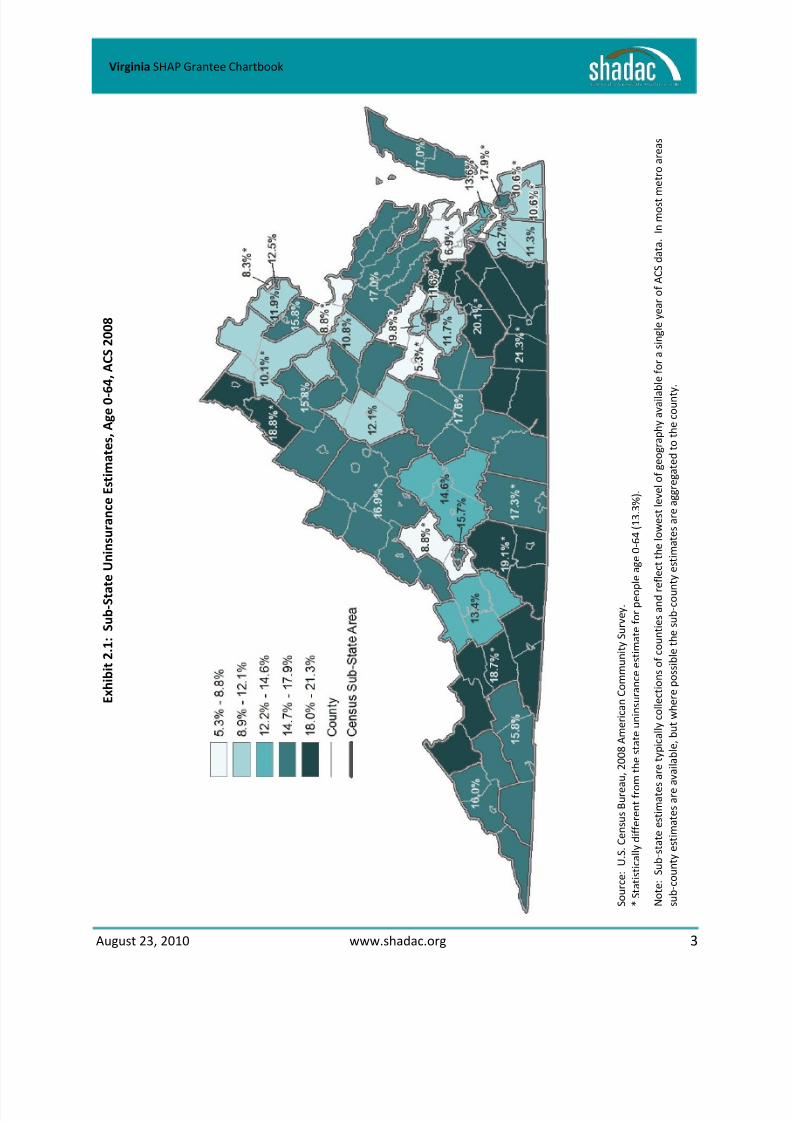
Detailed uninsurance estimates begin with Exhibit 2.1. Each subpopulation is shown as a map, followed
by a detailed table. The estimates in the tables provide percent and standard error (for calculation of
confidence intervals). Additional subgroup estimates are available upon request.
8/9/2019 Virginia State Chartbook
http://slidepdf.com/reader/full/virginia-state-chartbook 6/35
August 23, 2010 www.shadac.org 3
Virginia SHAP Grantee Chartbook
E x h i b i t 2 . 1 : S u b - S t a t e U n i n s u r a n c e E s t i m a t e s , A g e 0 - 6
4 , A C S 2 0 0 8
S o u r c e : U . S . C e n s u s B u r e a
u , 2 0 0 8 A m e r i c a n C o m m u n i t y S u r v e y .
* S t a t i s t i c a l l y d i f f e r e n t f r o m t
h e s t a t e u n i n s u r a n c e e s t i m a t e f o r p e o p
l e a g e 0 - 6 4 ( 1 3 . 3 % ) .
N o t e : S u b - s t a t e e s t i m a t e s
a r e t y p i c a l l y c o l l e c t i o n s o f c o u n t i e s a n d r e f l e c t t h e l o w e s t l e v e l o f g e o g r a p h y a v a i l a b l e f o r a s i n g l e y e a r o f A C S d a t a . I n m o s t m e t r o a r e a s
s u b - c o u n t y e s t i m a t e s a r e a v a i l a b l e ,
b u t w h e r e p o s s i b l e t h e s u b - c o u n
t y e s t i m a t e s a r e a g g r e g a t e d t o t h e c o u n t y .
8/9/2019 Virginia State Chartbook
http://slidepdf.com/reader/full/virginia-state-chartbook 7/35
August 23, 2010 www.shadac.org 4
Virginia SHAP Grantee Chartbook
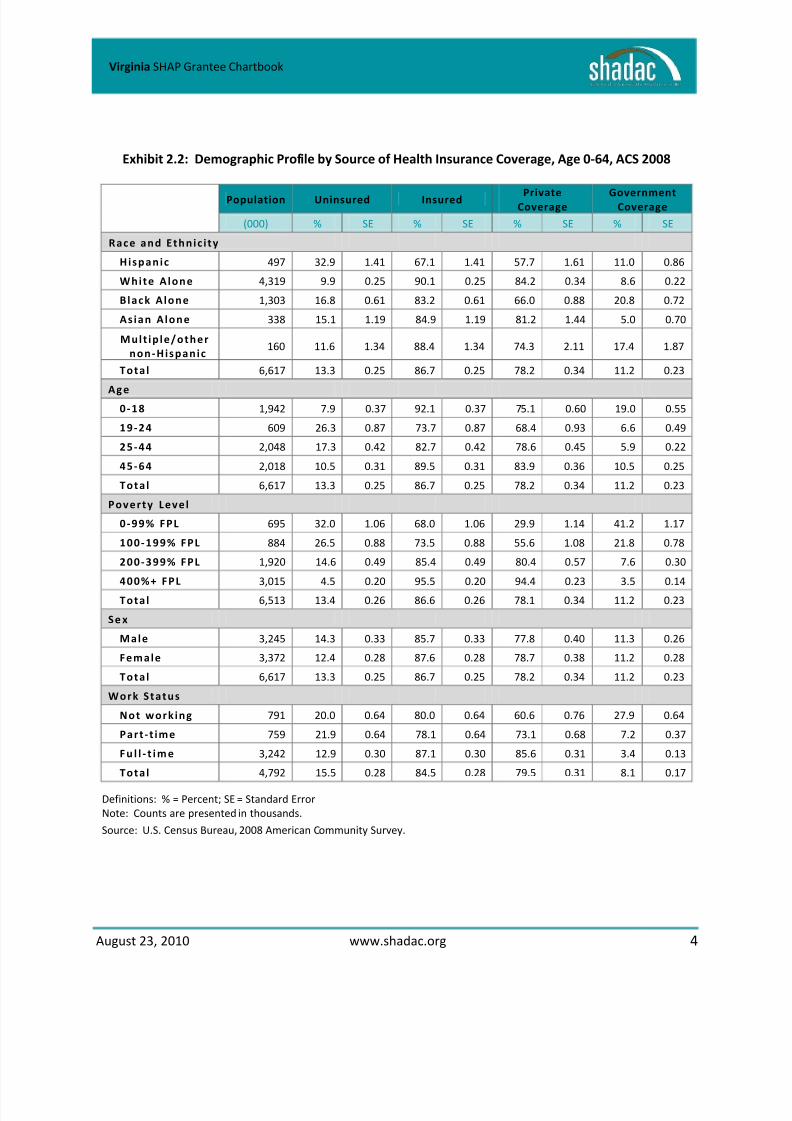
Exhibit 2.2: Demographic Profile by Source of Health Insurance Coverage, Age 0-64, ACS 2008
Definitions: % = Percent; SE = Standard Error
Note: Counts are presented in thousands.
Source: U.S. Census Bureau, 2008 American Community Survey.
Population Uninsured Insured PrivateCoverage
GovernmentCoverage
(000) % SE % SE % SE % SE
Race and Ethnic i ty
Hispanic 497 32.9 1.41 67.1 1.41 57.7 1.61 11.0 0.86
White Alone 4,319 9.9 0.25 90.1 0.25 84.2 0.34 8.6 0.22
Black Alone 1,303 16.8 0.61 83.2 0.61 66.0 0.88 20.8 0.72
Asian Alone 338 15.1 1.19 84.9 1.19 81.2 1.44 5.0 0.70
Mult ip le/other
non-Hispanic160 11.6 1.34 88.4 1.34 74.3 2.11 17.4 1.87
Tota l 6,617 13.3 0.25 86.7 0.25 78.2 0.34 11.2 0.23
Ag e0-18 1,942 7.9 0.37 92.1 0.37 75.1 0.60 19.0 0.55
19-24 609 26.3 0.87 73.7 0.87 68.4 0.93 6.6 0.49
25-44 2,048 17.3 0.42 82.7 0.42 78.6 0.45 5.9 0.22
45-64 2,018 10.5 0.31 89.5 0.31 83.9 0.36 10.5 0.25
Tota l 6,617 13.3 0.25 86.7 0.25 78.2 0.34 11.2 0.23
Poverty Level
0 -99% FPL 695 32.0 1.06 68.0 1.06 29.9 1.14 41.2 1.17
100-199% FPL 884 26.5 0.88 73.5 0.88 55.6 1.08 21.8 0.78
200-399% FPL 1,920 14.6 0.49 85.4 0.49 80.4 0.57 7.6 0.30
400%+ FPL 3,015 4.5 0.20 95.5 0.20 94.4 0.23 3.5 0.14
Tota l 6,513 13.4 0.26 86.6 0.26 78.1 0.34 11.2 0.23
Se x
Male 3,245 14.3 0.33 85.7 0.33 77.8 0.40 11.3 0.26
Female 3,372 12.4 0.28 87.6 0.28 78.7 0.38 11.2 0.28
Tota l 6,617 13.3 0.25 86.7 0.25 78.2 0.34 11.2 0.23
Work Status
Not work ing 791 20.0 0.64 80.0 0.64 60.6 0.76 27.9 0.64
Part -t ime 759 21.9 0.64 78.1 0.64 73.1 0.68 7.2 0.37
F u l l - t i m e 3,242 12.9 0.30 87.1 0.30 85.6 0.31 3.4 0.13
Tota l 4,792 15.5 0.28 84.5 0.28 79.5 0.31 8.1 0.17
8/9/2019 Virginia State Chartbook
http://slidepdf.com/reader/full/virginia-state-chartbook 8/35
August 23, 2010 www.shadac.org 5
Virginia SHAP Grantee Chartbook
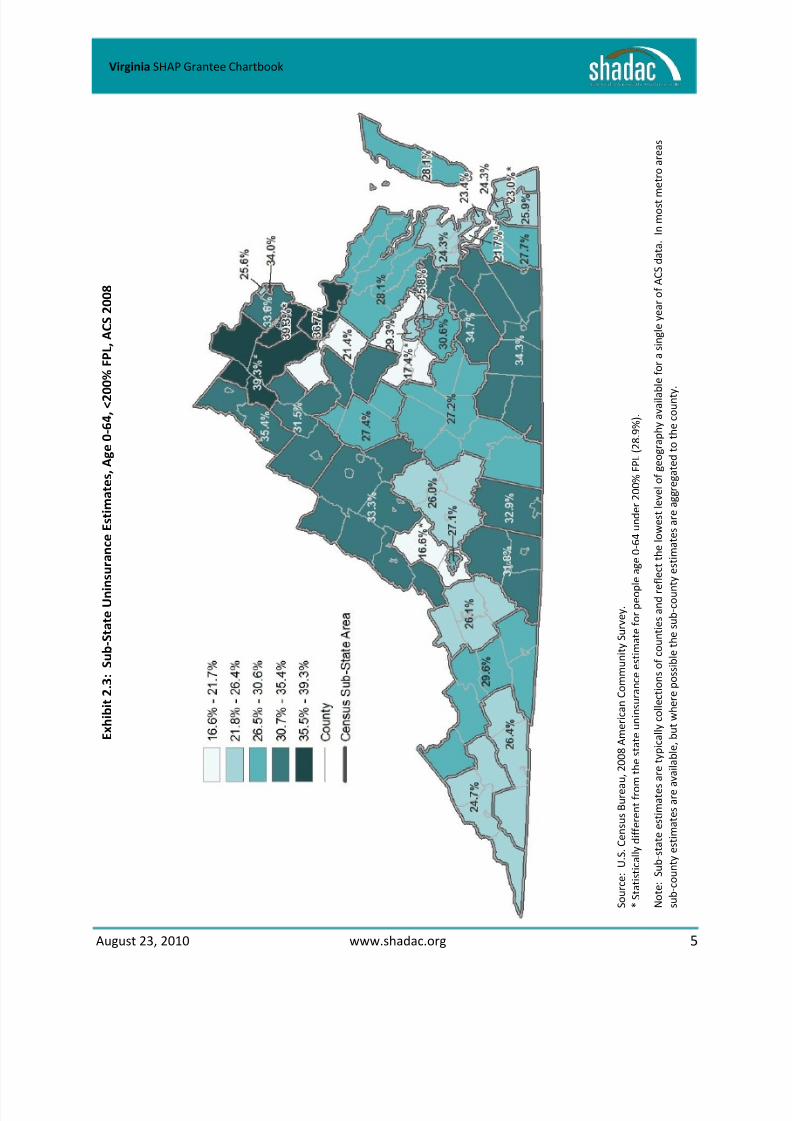
E x h i b i t 2 . 3 : S u b - S t a t e U n i n s u r a n c e E s t i m a t e s , A g e 0 - 6 4 , < 2 0
0 % F P L , A C S 2 0 0 8
S o u r c e : U . S . C e n s u s B u r e a
u , 2 0 0 8 A m e r i c a n C o m m u n i t y S u r v e y .
* S t a t i s t i c a l l y d i f f e r e n t f r o m
t h e s t a t e u n i n s u r a n c e e s t i m a t e f o r p e o p
l e a g e 0 - 6 4 u n d e r 2 0 0 %
F P L ( 2 8 . 9 % ) .
N o t e : S u b - s t a t e e s t i m a t e s
a r e t y p i c a l l y c o l l e c t i o n s o f c o u n t i e s a n d r e
f l e c t t h e l o w e s t l e v e l o f g e o g r a p h y a v a i l a b l e f o r a s i n g l e y e a r o f A C S d a t a . I n m o s t m
e t r o a r e a s
s u b - c o u n t y e s t i m a t e s a r e a
v a i l a b l e ,
b u t w h e r e p o s s i b l e t h e s u b - c o u n
t y e s t i m a t e s a r e a g g r e g a t e d t o t h e c o u n t y
.
8/9/2019 Virginia State Chartbook
http://slidepdf.com/reader/full/virginia-state-chartbook 9/35
August 23, 2010 www.shadac.org 6
Virginia SHAP Grantee Chartbook
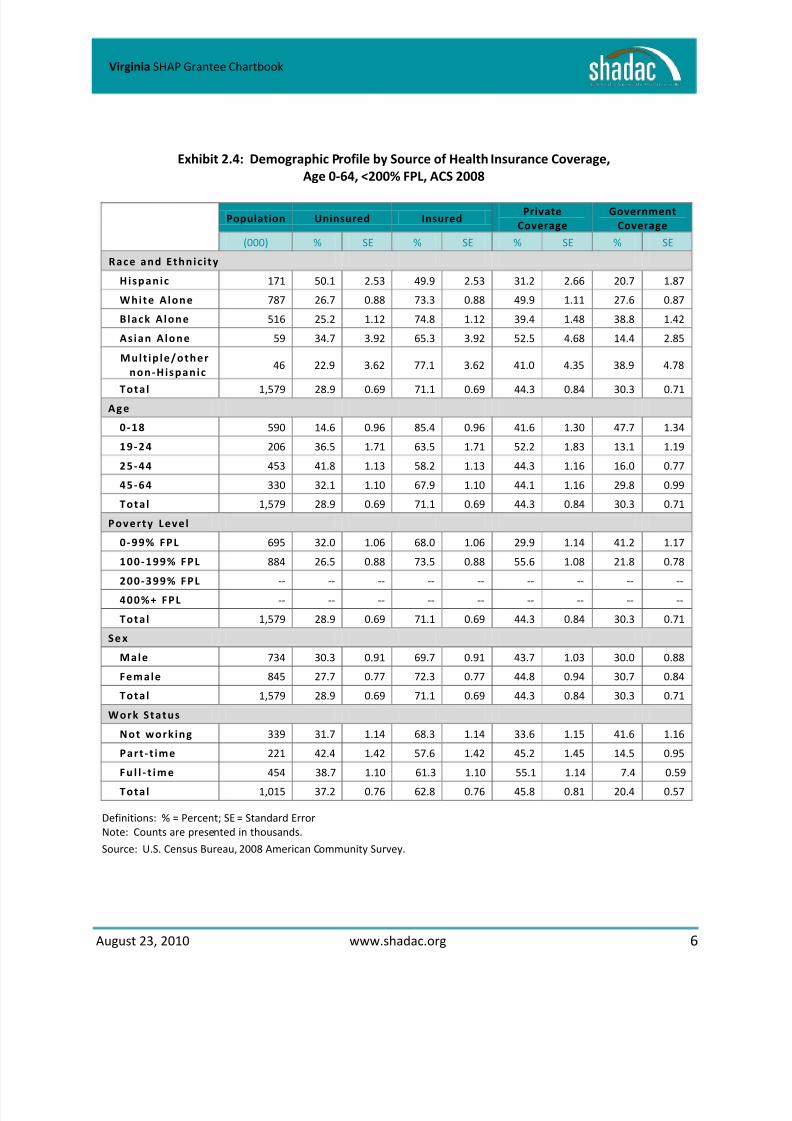
Exhibit 2.4: Demographic Profile by Source of Health Insurance Coverage,
Age 0-64, <200% FPL, ACS 2008
Definitions: % = Percent; SE = Standard Error
Note: Counts are presented in thousands.
Source: U.S. Census Bureau, 2008 American Community Survey.
Population Uninsured Insured
Private
Coverage
Government
Coverage
(000) % SE % SE % SE % SE
Race and Ethnic i ty
Hispanic 171 50.1 2.53 49.9 2.53 31.2 2.66 20.7 1.87
White Alone 787 26.7 0.88 73.3 0.88 49.9 1.11 27.6 0.87
Black Alone 516 25.2 1.12 74.8 1.12 39.4 1.48 38.8 1.42
Asian Alone 59 34.7 3.92 65.3 3.92 52.5 4.68 14.4 2.85
Mult ip le/other
non-Hispanic46 22.9 3.62 77.1 3.62 41.0 4.35 38.9 4.78
Tota l 1,579 28.9 0.69 71.1 0.69 44.3 0.84 30.3 0.71Ag e
0-18 590 14.6 0.96 85.4 0.96 41.6 1.30 47.7 1.34
19-24 206 36.5 1.71 63.5 1.71 52.2 1.83 13.1 1.19
25-44 453 41.8 1.13 58.2 1.13 44.3 1.16 16.0 0.77
45-64 330 32.1 1.10 67.9 1.10 44.1 1.16 29.8 0.99
Tota l 1,579 28.9 0.69 71.1 0.69 44.3 0.84 30.3 0.71
Poverty Level
0 -99% FPL 695 32.0 1.06 68.0 1.06 29.9 1.14 41.2 1.17
100-199% FPL 884 26.5 0.88 73.5 0.88 55.6 1.08 21.8 0.78
200-399% FPL -- -- -- -- -- -- -- -- --
400%+ FPL -- -- -- -- -- -- -- -- --
Tota l 1,579 28.9 0.69 71.1 0.69 44.3 0.84 30.3 0.71
Se x
Male 734 30.3 0.91 69.7 0.91 43.7 1.03 30.0 0.88
Female 845 27.7 0.77 72.3 0.77 44.8 0.94 30.7 0.84
Tota l 1,579 28.9 0.69 71.1 0.69 44.3 0.84 30.3 0.71
Work Status
Not work ing 339 31.7 1.14 68.3 1.14 33.6 1.15 41.6 1.16
Part -t ime 221 42.4 1.42 57.6 1.42 45.2 1.45 14.5 0.95
F u l l - t i m e 454 38.7 1.10 61.3 1.10 55.1 1.14 7.4 0.59
Tota l 1,015 37.2 0.76 62.8 0.76 45.8 0.81 20.4 0.57
8/9/2019 Virginia State Chartbook
http://slidepdf.com/reader/full/virginia-state-chartbook 10/35
August 23, 2010 www.shadac.org 7
Virginia SHAP Grantee Chartbook
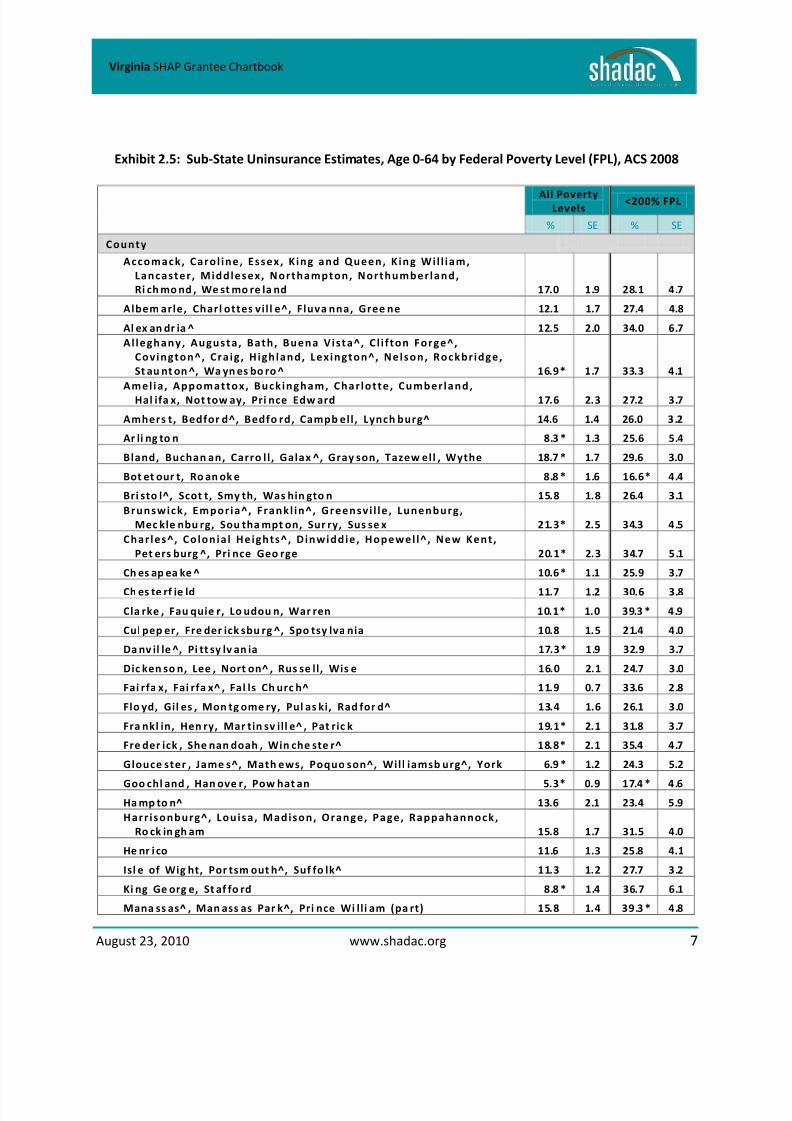
Exhibit 2.5: Sub-State Uninsurance Estimates, Age 0-64 by Federal Poverty Level (FPL), ACS 2008
All PovertyLevels
<200% FPL
% SE % SE
County
Accomack, Caro l ine, Essex, K ing and Queen, K ing Wil l iam,
Lancaster , Middlesex, Northampton, Northumber land,
Ri ch mo nd , We st mo re la nd 17.0 1.9 28.1 4.7
Albem arle, Charl ottes vil l e^, Fluva nna, Gree ne 12.1 1.7 27.4 4.8
Al ex an dr ia ^ 12.5 2.0 34.0 6.7
Al leghany, Augusta , Bath , Buena Vista^, C l i f ton Forge^,
Covington^, Cra ig, H igh land, Lexington^, Nelson, Rockbr idge,
St au nt on ^, Wa yn es bo ro ^ 16.9 * 1.7 33.3 4.1
Amel ia , Appomattox, Buck ingham, Char lotte, Cumber land,
Hal ifa x, Not tow ay, Pri nce Edw ard 17.6 2.3 27.2 3.7
Amhers t, Bedfor d^, Bedfo rd, Campb ell, Lynch burg^ 14.6 1.4 26.0 3.2
Ar li ng to n 8.3 * 1.3 25.6 5.4
Bland, Buchan an, Carro ll , Galax ^, Gray son, Tazew ell , Wythe 18.7 * 1.7 29.6 3.0
Bot et our t, Ro an ok e 8.8 * 1.6 16.6 * 4.4
Bri sto l^, Scot t, Smy th, Was hin gto n 15.8 1.8 26.4 3.1
Brunswick , Empor ia^, Frankl in^, Greensvi l le , Lunenburg,
Mec kle nbu rg, Sou tha mpt on, Sur ry, Sus se x 21.3 * 2.5 34.3 4.5
Char les^, Co lon ia l Heights^, D inwiddie, Hopewel l^ , New Kent ,
Pet ers burg ^, Pri nce Geo rge 20.1 * 2.3 34.7 5.1
Ch es ap ea ke ^ 10.6 * 1.1 25.9 3.7
Ch es te rf ie ld 11.7 1.2 30.6 3.8
Cla rke , Fau quie r, Lo udou n, War ren 10.1 * 1.0 39.3 * 4.9
Cul pep er, Fre der ick sbu rg ^, Spo tsy lva nia 10.8 1.5 21.4 4.0
Da nv il le ^, Pi tt sy lv an ia 17.3 * 1.9 32.9 3.7
Dic ken so n, Lee , Nort on^ , Rus se ll, Wis e 16.0 2.1 24.7 3.0
Fai rfa x, Fai rfa x^ , Fal ls Ch urc h^ 11.9 0.7 33.6 2.8
Flo yd, Gil es , Mon tg ome ry, Pul as ki, Rad for d^ 13.4 1.6 26.1 3.0
Fra nkl in, Hen ry, Mar tin sv ill e^ , Pat ric k 19.1 * 2.1 31.8 3.7
Fre der ick , She nan doah , Win che ste r^ 18.8 * 2.1 35.4 4.7
Glouce ster , Jame s^, Math ews, Poquo son^, Will iamsb urg^, York 6.9 * 1.2 24.3 5.2
Goo chl and , Han ove r, Pow hat an 5.3 * 0.9 17.4 * 4.6Ha mp to n^ 13.6 2.1 23.4 5.9
Harr isonburg^, Lou isa , Madison, Orange, Page, Rappahannock,
Ro ck in gh am 15.8 1.7 31.5 4.0
He nr i co 11.6 1.3 25.8 4.1
Isl e of Wig ht, Por tsm out h^, Suf fo lk^ 11.3 1.2 27.7 3.2
Ki ng Ge org e, St af fo rd 8.8 * 1.4 36.7 6.1
Mana ss as^ , Man ass as Par k^, Pri nce Wi lli am (pa rt) 15.8 1.4 39.3 * 4.8
8/9/2019 Virginia State Chartbook
http://slidepdf.com/reader/full/virginia-state-chartbook 11/35
August 23, 2010 www.shadac.org 8
Virginia SHAP Grantee Chartbook
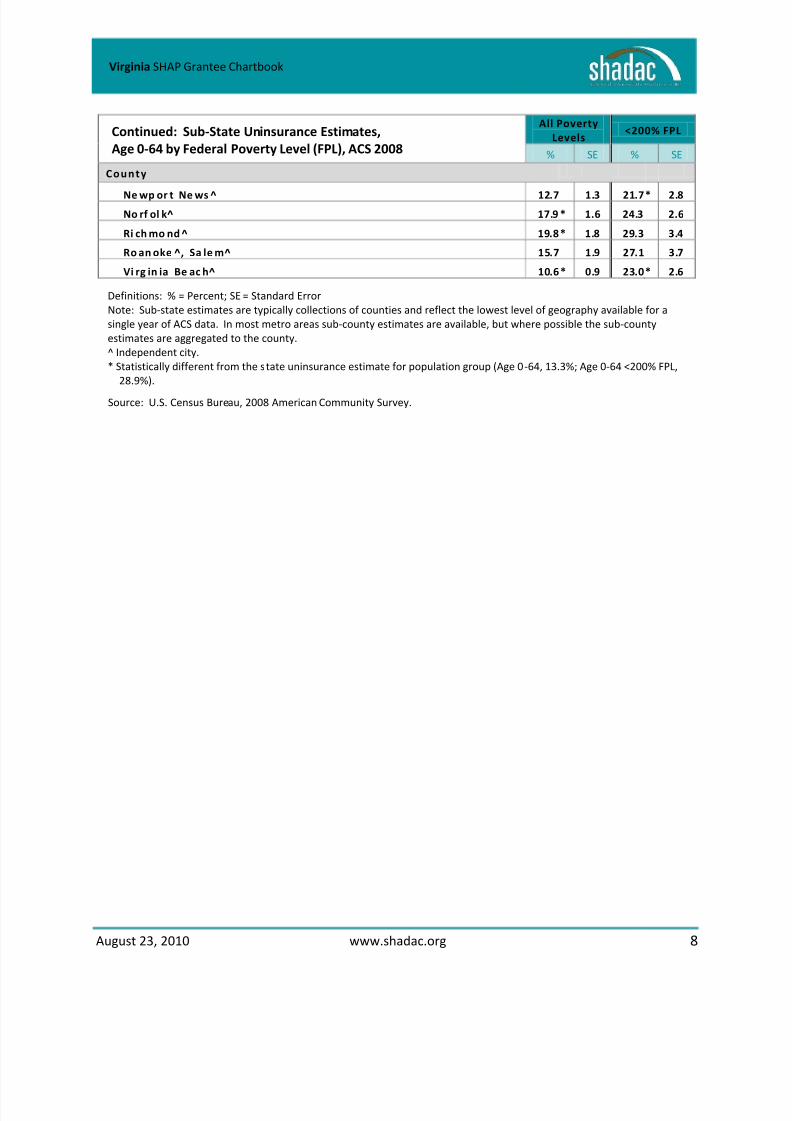
Definitions: % = Percent; SE = Standard Error
Note: Sub-state estimates are typically collections of counties and reflect the lowest level of geography available for a
single year of ACS data. In most metro areas sub-county estimates are available, but where possible the sub-county
estimates are aggregated to the county.
^ Independent city.
* Statistically different from the state uninsurance estimate for population group (Age 0-64, 13.3%; Age 0-64 <200% FPL,
28.9%).
Source: U.S. Census Bureau, 2008 American Community Survey.
Continued: Sub-State Uninsurance Estimates,
Age 0-64 by Federal Poverty Level (FPL), ACS 2008
All Poverty
Levels<200% FPL
% SE % SE
County
Ne wp or t Ne ws ^ 12.7 1.3 21.7 * 2.8
No rf ol k^ 17.9 * 1.6 24.3 2.6
Ri ch mo nd ^ 19.8 * 1.8 29.3 3.4
Ro an oke ^, Sa le m^ 15.7 1.9 27.1 3.7
Vi rg in ia Be ac h^ 10.6 * 0.9 23.0 * 2.6
8/9/2019 Virginia State Chartbook
http://slidepdf.com/reader/full/virginia-state-chartbook 12/35
August 23, 2010 www.shadac.org 9
Virginia SHAP Grantee Chartbook
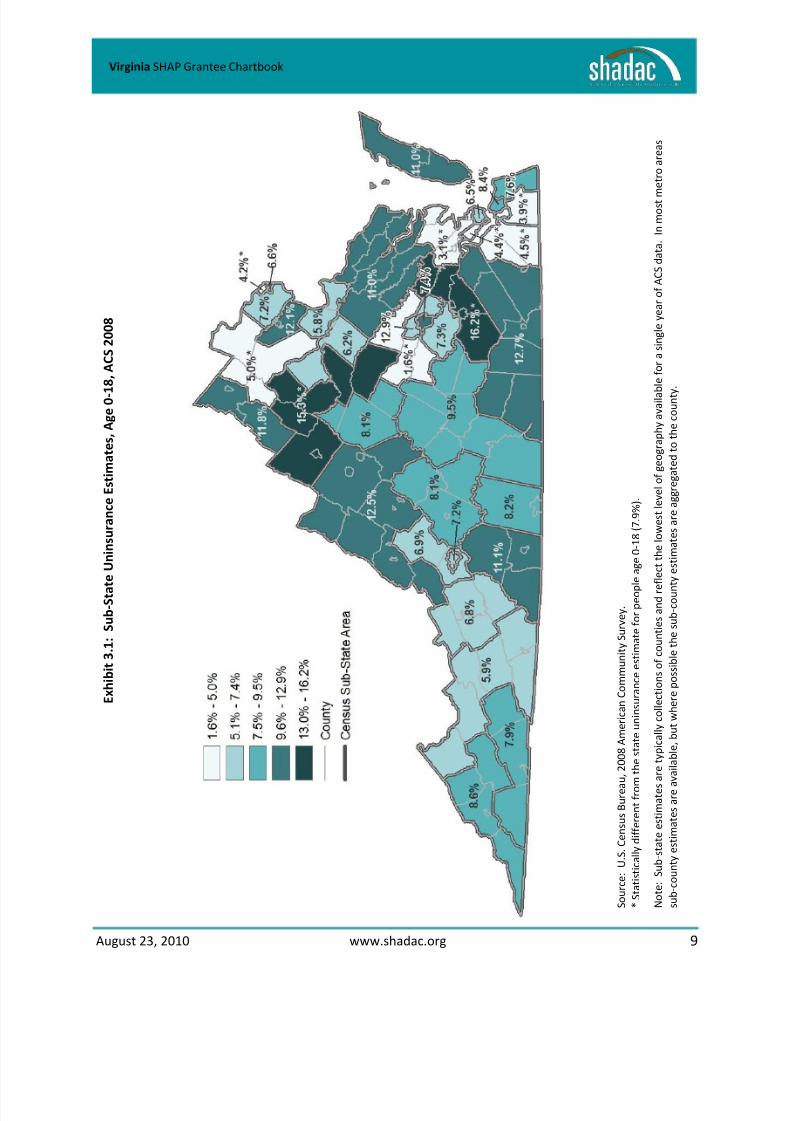
E x h i b i t 3 . 1 : S u b - S t a t e U n i n s u r a n c e E s t i m a t e s , A g e 0 - 1
8 , A C S 2 0 0 8
S o u r c e : U . S . C e n s u s B u r e a
u , 2 0 0 8 A m e r i c a n C o m m u n i t y S u r v e y .
* S t a t i s t i c a l l y d i f f e r e n t f r o m
t h e s t a t e u n i n s u r a n c e e s t i m a t e f o r p e o p
l e a g e 0 - 1 8 ( 7 . 9 % ) .
N o t e : S u b - s t a t e e s t i m a t e s
a r e t y p i c a l l y c o l l e c t i o n s o f c o u n t i e s a n d r e
f l e c t t h e l o w e s t l e v e l o f g e o g r a p h y a v a i l a b l e f o r a s i n g l e y e a r o f A C S d a t a . I n m o s t m
e t r o a r e a s
s u b - c o u n t y e s t i m a t e s a r e a
v a i l a b l e ,
b u t w h e r e p o s s i b l e t h e s u b - c o u n
t y e s t i m a t e s a r e a g g r e g a t e d t o t h e c o u n t y
.

8/9/2019 Virginia State Chartbook
http://slidepdf.com/reader/full/virginia-state-chartbook 13/35
August 23, 2010 www.shadac.org 10
Virginia SHAP Grantee Chartbook
Exhibit 3.2: Demographic Profile by Source of Health Insurance Coverage, Age 0-18, ACS 2008
Definitions: % = Percent; SE = Standard Error
Note: Counts are presented in thousands.
Source: U.S. Census Bureau, 2008 American Community Survey.
Population Uninsured Insured PrivateCoverage
GovernmentCoverage
(000) % SE % SE % SE % SE
Race and Ethnic i ty
Hispanic 186 20.0 1.86 80.0 1.86 57.9 2.32 24.3 2.04
White Alone 1,165 5.7 0.40 94.3 0.40 83.7 0.61 12.6 0.54
Black Alone 418 8.8 0.88 91.2 0.88 57.9 1.55 36.0 1.52
Asian Alone 87 9.6 1.57 90.4 1.57 81.5 2.62 9.2 2.09
Mult ip le/other
non-Hispanic86 6.0 1.50 94.0 1.50 73.2 3.03 22.4 2.98
Tota l 1,942 7.9 0.37 92.1 0.37 75.1 0.60 19.0 0.55
Ag e0-18 1,942 7.9 0.37 92.1 0.37 75.1 0.60 19.0 0.55
19-24 -- -- -- -- -- -- -- -- --
25-44 -- -- -- -- -- -- -- -- --
45-64 -- -- -- -- -- -- -- -- --
Tota l 1,942 7.9 0.37 92.1 0.37 75.1 0.60 19.0 0.55
Poverty Level
0 -99% FPL 268 16.2 1.53 83.8 1.53 24.4 1.66 62.9 1.98
100-199% FPL 322 13.3 1.21 86.7 1.21 56.0 1.72 35.1 1.63
200-399% FPL 600 8.1 0.62 91.9 0.62 83.3 0.86 10.0 0.67
400%+ FPL 701 2.3 0.28 97.7 0.28 96.2 0.37 2.5 0.28
Tota l 1,890 8.0 0.38 92.0 0.38 75.1 0.61 19.0 0.56
Se x
Male 999 7.8 0.46 92.2 0.46 75.3 0.72 18.9 0.65
Female 943 8.0 0.45 92.0 0.45 74.9 0.73 19.1 0.67
Tota l 1,942 7.9 0.37 92.1 0.37 75.1 0.60 19.0 0.55
Work Status
Not work ing 36 13.7 2.88 86.3 2.88 72.1 3.43 19.1 2.93
Part -t ime 64 10.5 1.69 89.5 1.69 83.2 1.93 7.4 1.20
F u l l - t i m e 17 19.5 3.96 80.5 3.96 74.9 4.62 5.6 3.15
Tota l 117 12.8 1.43 87.2 1.43 78.6 1.68 10.7 1.23
8/9/2019 Virginia State Chartbook
http://slidepdf.com/reader/full/virginia-state-chartbook 14/35
August 23, 2010 www.shadac.org 11
Virginia SHAP Grantee Chartbook
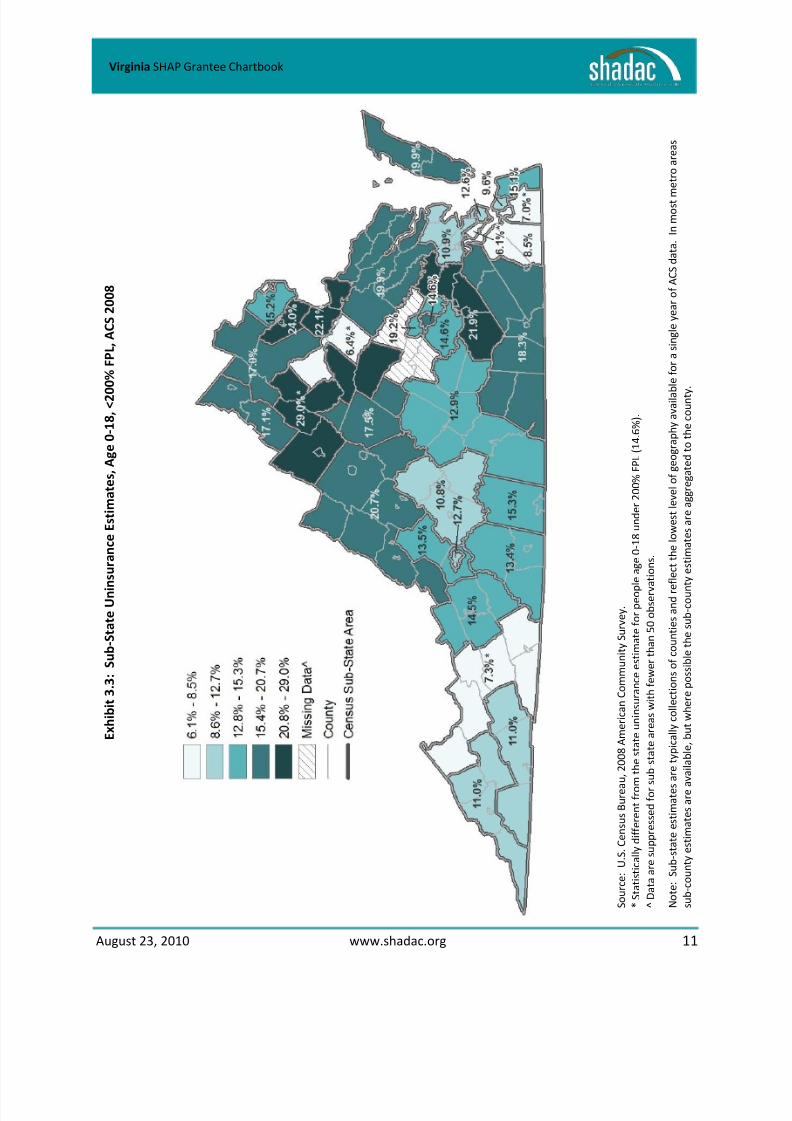
E x h i b i t 3 . 3 : S u b - S t a t e U n i n s u r a n c e E s t i m a t e s , A g e 0 - 1 8 , < 2 0
0 % F P L , A C S 2 0 0 8
S o u r c e : U . S . C e n s u s B u r e a
u , 2 0 0 8 A m e r i c a n C o m m u n i t y S u r v e y .
* S t a t i s t i c a l l y d i f f e r e n t f r o m
t h e s t a t e u n i n s u r a n c e e s t i m a t e f o r p e o p
l e a g e 0 - 1 8 u n d e r 2 0 0 %
F P L ( 1 4 . 6 % ) .
^ D a t a a r e s u p p r e s s e d f o r s u b - s t a t e a r e a s w i t h f e w e r t h a n 5 0 o b s e r v
a t i o n s .
N o t e : S u b - s t a t e e s t i m a t e s
a r e t y p i c a l l y c o l l e c t i o n s o f c o u n t i e s a n d r e
f l e c t t h e l o w e s t l e v e l o f g e o g r a p h y a v a i l a b l e f o r a s i n g l e y e a r o f A C S d a t a . I n m o s t m
e t r o a r e a s
s u b - c o u n t y e s t i m a t e s a r e a
v a i l a b l e ,
b u t w h e r e p o s s i b l e t h e s u b - c o u n
t y e s t i m a t e s a r e a g g r e g a t e d t o t h e c o u n t y
.
8/9/2019 Virginia State Chartbook
http://slidepdf.com/reader/full/virginia-state-chartbook 15/35
August 23, 2010 www.shadac.org 12
Virginia SHAP Grantee Chartbook
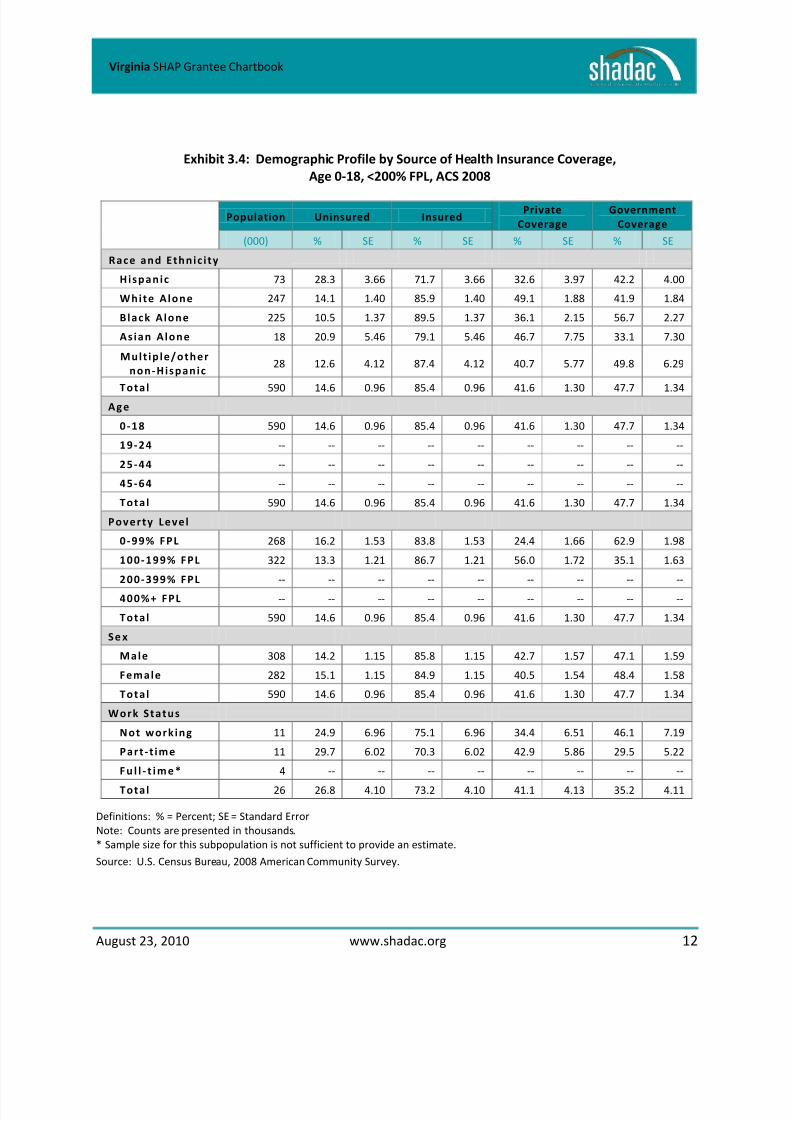
Exhibit 3.4: Demographic Profile by Source of Health Insurance Coverage,
Age 0-18, <200% FPL, ACS 2008
Definitions: % = Percent; SE = Standard Error
Note: Counts are presented in thousands.
* Sample size for this subpopulation is not sufficient to provide an estimate.
Source: U.S. Census Bureau, 2008 American Community Survey.
Population Uninsured InsuredPrivate
Coverage
Government
Coverage
(000) % SE % SE % SE % SE
Race and Ethnic i ty
Hispanic 73 28.3 3.66 71.7 3.66 32.6 3.97 42.2 4.00
White Alone 247 14.1 1.40 85.9 1.40 49.1 1.88 41.9 1.84
Black Alone 225 10.5 1.37 89.5 1.37 36.1 2.15 56.7 2.27
Asian Alone 18 20.9 5.46 79.1 5.46 46.7 7.75 33.1 7.30
Mult ip le/other
non-Hispanic28 12.6 4.12 87.4 4.12 40.7 5.77 49.8 6.29
Tota l 590 14.6 0.96 85.4 0.96 41.6 1.30 47.7 1.34Ag e
0-18 590 14.6 0.96 85.4 0.96 41.6 1.30 47.7 1.34
19-24 -- -- -- -- -- -- -- -- --
25-44 -- -- -- -- -- -- -- -- --
45-64 -- -- -- -- -- -- -- -- --
Tota l 590 14.6 0.96 85.4 0.96 41.6 1.30 47.7 1.34
Poverty Level
0 -99% FPL 268 16.2 1.53 83.8 1.53 24.4 1.66 62.9 1.98
100-199% FPL 322 13.3 1.21 86.7 1.21 56.0 1.72 35.1 1.63
200-399% FPL -- -- -- -- -- -- -- -- --
400%+ FPL -- -- -- -- -- -- -- -- --
Tota l 590 14.6 0.96 85.4 0.96 41.6 1.30 47.7 1.34
Se x
Male 308 14.2 1.15 85.8 1.15 42.7 1.57 47.1 1.59
Female 282 15.1 1.15 84.9 1.15 40.5 1.54 48.4 1.58
Tota l 590 14.6 0.96 85.4 0.96 41.6 1.30 47.7 1.34
Work Status
Not work ing 11 24.9 6.96 75.1 6.96 34.4 6.51 46.1 7.19
Part -t ime 11 29.7 6.02 70.3 6.02 42.9 5.86 29.5 5.22
F u l l - t i m e * 4 -- -- -- -- -- -- -- --
Tota l 26 26.8 4.10 73.2 4.10 41.1 4.13 35.2 4.11

8/9/2019 Virginia State Chartbook
http://slidepdf.com/reader/full/virginia-state-chartbook 16/35
August 23, 2010 www.shadac.org 13
Virginia SHAP Grantee Chartbook
Exhibit 3.5: Sub-State Uninsurance Estimates, Age 0-18 by Federal Poverty Level (FPL), ACS 2008
All PovertyLevels
<200% FPL
% SE % SE
County
Accomack, Caro l ine, Essex, K ing and Queen, K ing Wil l iam,
Lancaster , Middlesex, Northampton, Northumber land,
Ri ch mo nd , We st mo re la nd 11.0 3.0 19.9 6.5
Albem arle, Charl ottes vil l e^, Fluva nna, Gree ne 8.1 2.4 17.5 7.1
Al ex an dr ia ^ 6.6 3.4 -- --
Al leghany, Augusta , Bath , Buena Vista^, C l i f ton Forge^,
Covington^, Cra ig, H igh land, Lexington^, Nelson, Rockbr idge,
St au nt on ^, Wa yn es bo ro ^ 12.5 3.1 20.7 6.8
Amel ia , Appomattox, Buck ingham, Char lotte, Cumber land,
Hal ifa x, Not tow ay, Pri nce Edw ard 9.5 3.0 12.9 4.3
Amhers t, Bedfor d^, Bedfo rd, Campb ell, Lynch burg^ 8.1 2.0 10.8 3.9
Ar li ng to n 4.2 * 1.7 -- --
Bland, Buchan an, Carro ll , Galax ^, Gray son, Tazew ell , Wythe 5.9 1.8 7.3 * 3.0
Bot et ou rt , Ro an ok e 6.9 2.2 13.5 7.1
Bri sto l^, Scot t, Smy th, Was hin gto n 7.9 2.3 11.0 4.0
Brunswick , Empor ia^, Frankl in^, Greensvi l le , Lunenburg,
Mec kle nbu rg, Sou tha mpt on, Sur ry, Sus se x 12.7 3.2 18.3 5.5
Char les^, Co lon ia l Heights^, D inwiddie, Hopewel l^ , New Kent ,
Pet ers burg ^, Pri nce Geo rge 16.2 * 3.9 21.9 7.2
Ch es ap ea ke ^ 3.9 * 1.0 7.0 * 2.9
Ch es te rf ie ld 7.3 1.8 14.6 5.4
Cla rke , Fau qui er, Lo udou n, War ren 5.0 * 1.1 17.0 6.6
Cul pep er, Fre der ick sbu rg ^, Spo tsy lva nia 6.2 1.6 6.4 * 2.7
Danv il le^ , Pi tts yl van ia 8.2 2.6 15.3 5.1
Dic ken so n, Lee , Nort on^ , Rus se ll, Wis e 8.6 2.8 11.0 3.9
Fai rfa x, Fai rfa x^ , Fal ls Ch urc h^ 7.2 0.9 15.2 3.4
Floy d, Gile s, Montg omery , Pulas ki, Radfor d^ 6.8 2.2 14.5 5.2
Fra nkl in, Hen ry, Mar tin sv ill e^ , Pat ric k 11.1 3.2 13.4 4.8
Fre der ick , She nan doah , Win che ste r^ 11.8 3.0 17.1 6.2
Glouce ster , James ^, Math ews, Poquos on^, Will iams burg^, York 3.1 * 1.6 10.9 6.4
Goo chl and , Han ove r, Pow hat an 1.6 * 0.8 -- --Ha mp to n^ 6.5 2.7 12.6 6.3
Harr isonburg^, Lou isa , Madison, Orange, Page, Rappahannock,
Ro ck in gh am 15.3 * 3.2 29.0 * 7.2
He nr i co 7.4 2.0 14.6 5.6
Isl e of Wi ght , Por tsm out h^, Suf fol k^ 4.5 * 1.7 8.5 4.2
Ki ng Ge org e, St af fo rd 5.8 1.7 22.1 8.2
Manass as^, Manas sas Park^ , Pr ince Will iam (part) 12.1 2.2 24.0 6.1
8/9/2019 Virginia State Chartbook
http://slidepdf.com/reader/full/virginia-state-chartbook 17/35
August 23, 2010 www.shadac.org 14
Virginia SHAP Grantee Chartbook
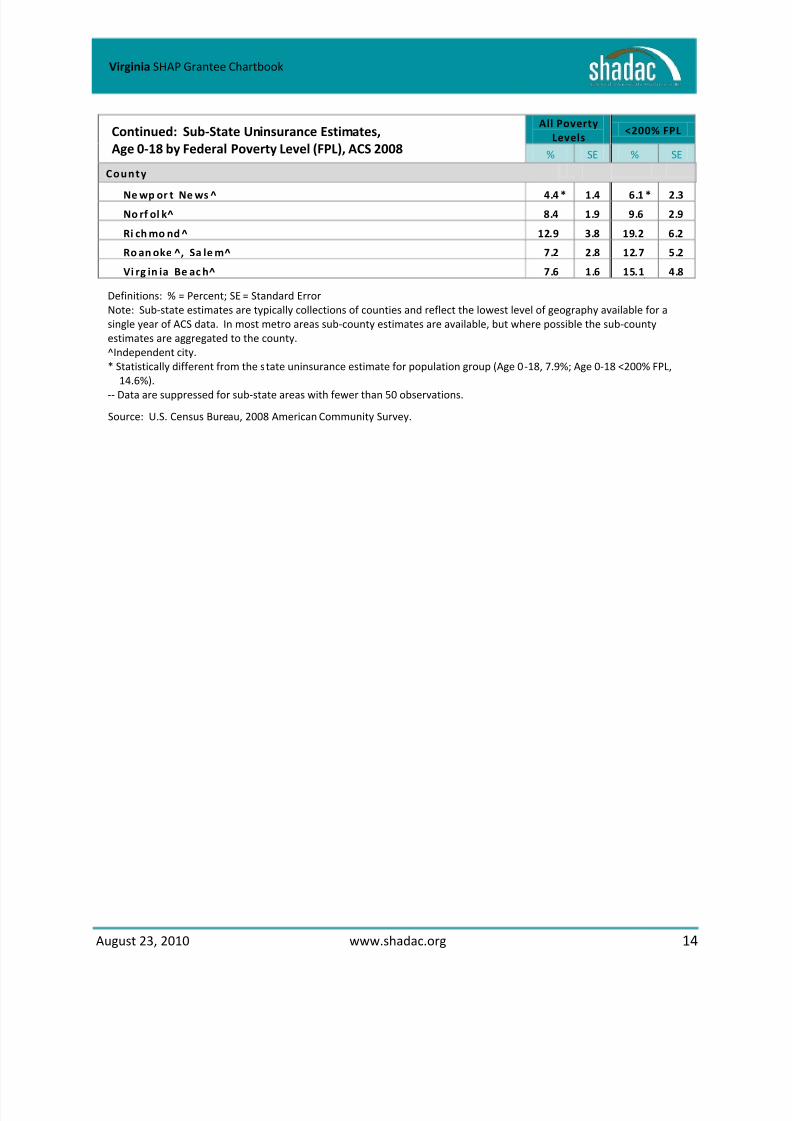
Definitions: % = Percent; SE = Standard Error
Note: Sub-state estimates are typically collections of counties and reflect the lowest level of geography available for a
single year of ACS data. In most metro areas sub-county estimates are available, but where possible the sub-county
estimates are aggregated to the county.
^Independent city.
* Statistically different from the state uninsurance estimate for population group (Age 0-18, 7.9%; Age 0-18 <200% FPL,
14.6%).
-- Data are suppressed for sub-state areas with fewer than 50 observations.
Source: U.S. Census Bureau, 2008 American Community Survey.
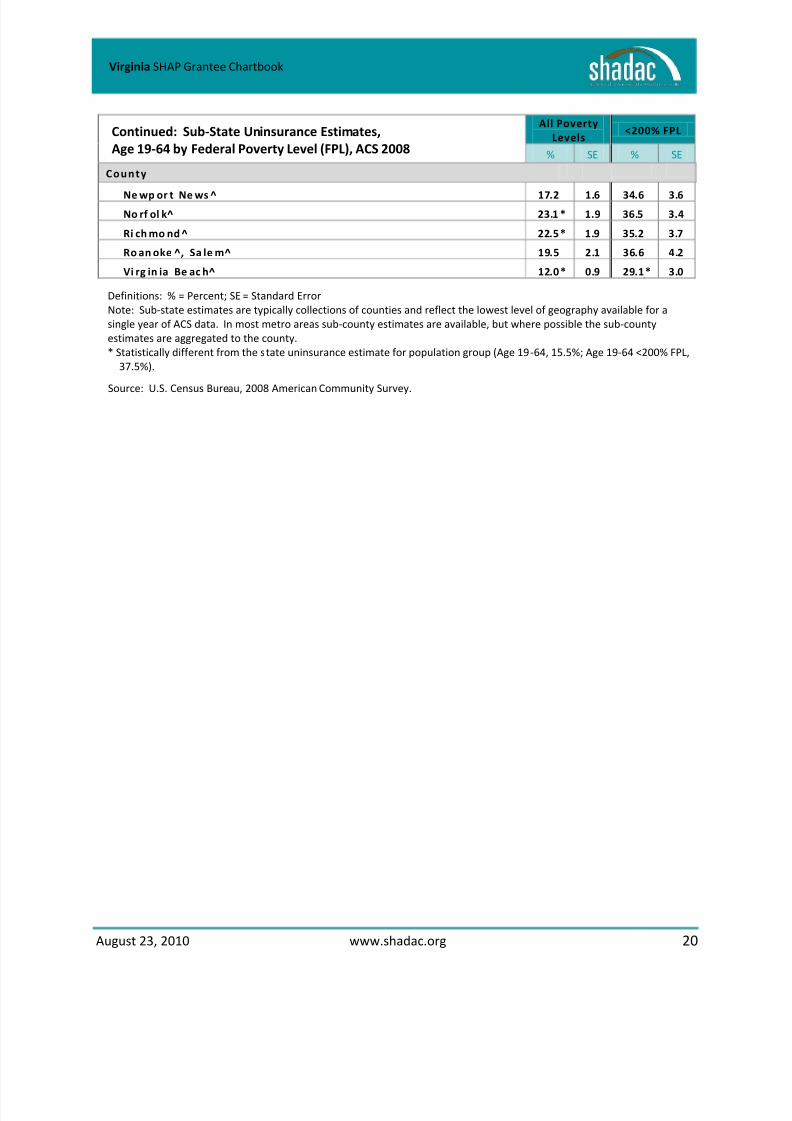
Continued: Sub-State Uninsurance Estimates,
Age 0-18 by Federal Poverty Level (FPL), ACS 2008
All Poverty
Levels<200% FPL
% SE % SE
County
Ne wp or t Ne ws ^ 4.4 * 1.4 6.1 * 2.3
No rf ol k^ 8.4 1.9 9.6 2.9
Ri ch mo nd ^ 12.9 3.8 19.2 6.2
Ro an oke ^, Sa le m^ 7.2 2.8 12.7 5.2
Vi rg in ia Be ac h^ 7.6 1.6 15.1 4.8
8/9/2019 Virginia State Chartbook
http://slidepdf.com/reader/full/virginia-state-chartbook 18/35
August 23, 2010 www.shadac.org 15
Virginia SHAP Grantee Chartbook
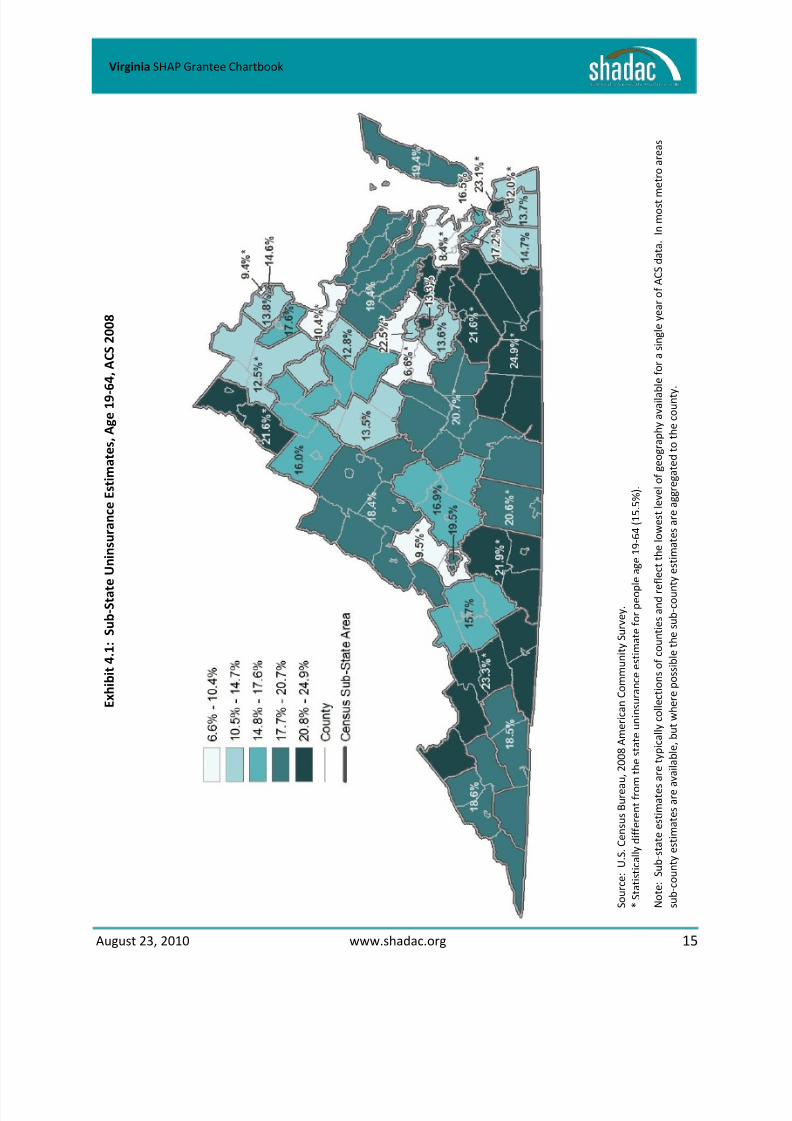
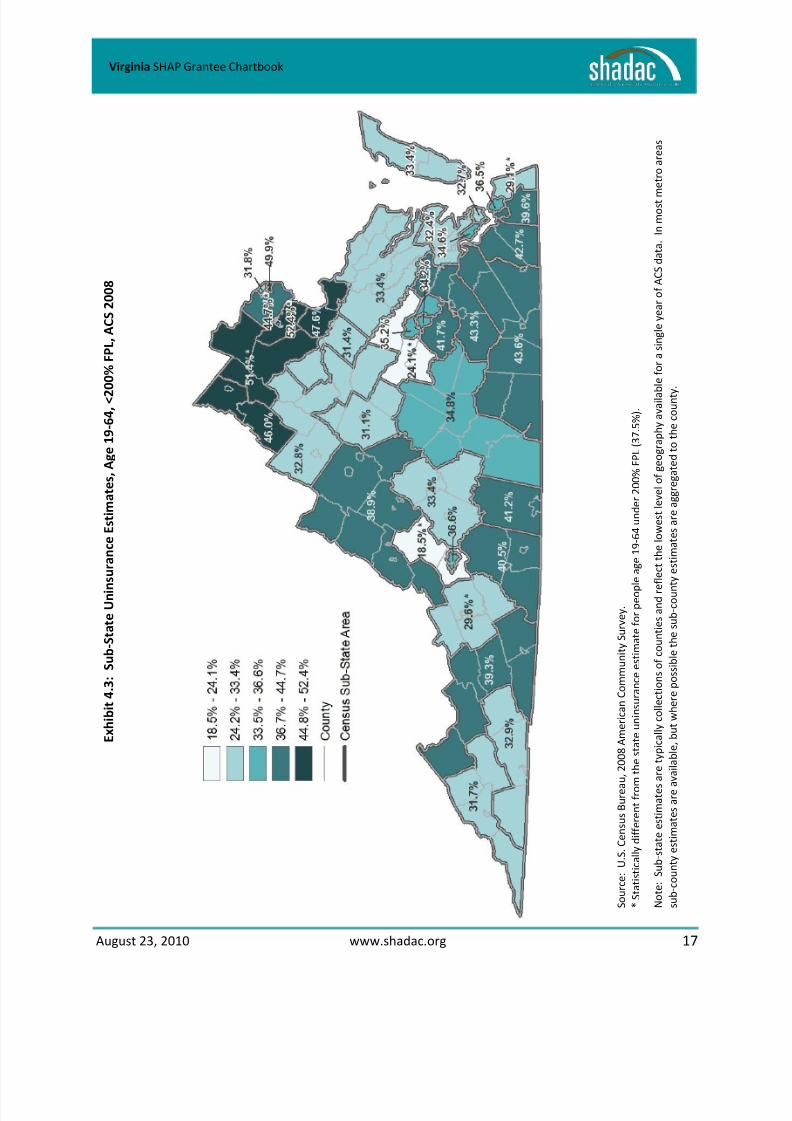
E x h i b i t 4 . 1 : S u b - S t a t
e U n i n s u r a n c e E s t i m a t e s , A g e 1 9 - 6 4 , A C S 2 0 0 8
S o u r c e : U . S . C e n s u s B u r e a
u , 2 0 0 8 A m e r i c a n C o m m u n i t y S u r v e y .
* S t a t i s t i c a l l y d i f f e r e n t f r o m
t h e s t a t e u n i n s u r a n c e e s t i m a t e f o r p e o p
l e a g e 1 9 - 6 4 ( 1 5 . 5 % ) .
N o t e : S u b - s t a t e e s t i m a t e s
a r e t y p i c a l l y c o l l e c t i o n s o f c o u n t i e s a n d r e
f l e c t t h e l o w e s t l e v e l o f g e o g r a p h y a v a i l a b l e f o r a s i n g l e y e a r o f A C S d a t a . I n m o s t m
e t r o a r e a s
s u b - c o u n t y e s t i m a t e s a r e a
v a i l a b l e ,
b u t w h e r e p o s s i b l e t h e s u b - c o u n
t y e s t i m a t e s a r e a g g r e g a t e d t o t h e c o u n t y
.
8/9/2019 Virginia State Chartbook
http://slidepdf.com/reader/full/virginia-state-chartbook 19/35
August 23, 2010 www.shadac.org 16
Virginia SHAP Grantee Chartbook
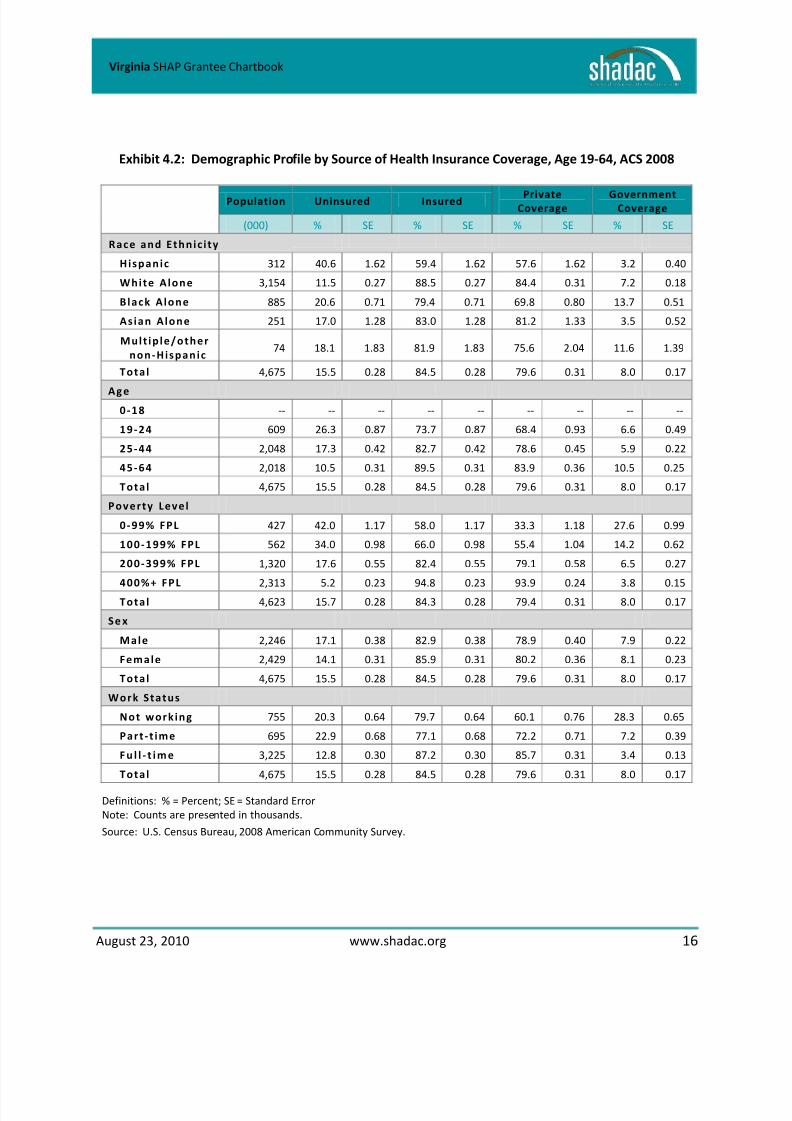
Exhibit 4.2: Demographic Profile by Source of Health Insurance Coverage, Age 19-64, ACS 2008
Definitions: % = Percent; SE = Standard Error
Note: Counts are presented in thousands.
Source: U.S. Census Bureau, 2008 American Community Survey.
Population Uninsured Insured PrivateCoverage
GovernmentCoverage
(000) % SE % SE % SE % SE
Race and Ethnic i ty
Hispanic 312 40.6 1.62 59.4 1.62 57.6 1.62 3.2 0.40
White Alone 3,154 11.5 0.27 88.5 0.27 84.4 0.31 7.2 0.18
Black Alone 885 20.6 0.71 79.4 0.71 69.8 0.80 13.7 0.51
Asian Alone 251 17.0 1.28 83.0 1.28 81.2 1.33 3.5 0.52
Mult ip le/other
non-Hispanic74 18.1 1.83 81.9 1.83 75.6 2.04 11.6 1.39
Tota l 4,675 15.5 0.28 84.5 0.28 79.6 0.31 8.0 0.17
Ag e0-18 -- -- -- -- -- -- -- -- --
19-24 609 26.3 0.87 73.7 0.87 68.4 0.93 6.6 0.49
25-44 2,048 17.3 0.42 82.7 0.42 78.6 0.45 5.9 0.22
45-64 2,018 10.5 0.31 89.5 0.31 83.9 0.36 10.5 0.25
Tota l 4,675 15.5 0.28 84.5 0.28 79.6 0.31 8.0 0.17
Poverty Level
0 -99% FPL 427 42.0 1.17 58.0 1.17 33.3 1.18 27.6 0.99
100-199% FPL 562 34.0 0.98 66.0 0.98 55.4 1.04 14.2 0.62
200-399% FPL 1,320 17.6 0.55 82.4 0.55 79.1 0.58 6.5 0.27
400%+ FPL 2,313 5.2 0.23 94.8 0.23 93.9 0.24 3.8 0.15
Tota l 4,623 15.7 0.28 84.3 0.28 79.4 0.31 8.0 0.17
Se x
Male 2,246 17.1 0.38 82.9 0.38 78.9 0.40 7.9 0.22
Female 2,429 14.1 0.31 85.9 0.31 80.2 0.36 8.1 0.23
Tota l 4,675 15.5 0.28 84.5 0.28 79.6 0.31 8.0 0.17
Work Status
Not work ing 755 20.3 0.64 79.7 0.64 60.1 0.76 28.3 0.65
Part -t ime 695 22.9 0.68 77.1 0.68 72.2 0.71 7.2 0.39
F u l l - t i m e 3,225 12.8 0.30 87.2 0.30 85.7 0.31 3.4 0.13
Tota l 4,675 15.5 0.28 84.5 0.28 79.6 0.31 8.0 0.17
8/9/2019 Virginia State Chartbook
http://slidepdf.com/reader/full/virginia-state-chartbook 20/35
August 23, 2010 www.shadac.org 17
Virginia SHAP Grantee Chartbook
E x h i b i t 4 . 3 : S u b - S t a t e U n i n
s u r a n c e E s t i m a t e s , A g e 1 9 - 6 4 , < 2 0 0 % F P L , A C S 2 0 0 8
S o u r c e : U . S . C e n s u s B u r e a
u , 2 0 0 8 A m e r i c a n C o m m u n i t y S u r v e y .
* S t a t i s t i c a l l y d i f f e r e n t f r o m
t h e s t a t e u n i n s u r a n c e e s t i m a t e f o r p e o p
l e a g e 1 9 - 6 4 u n d e r 2 0 0 %
F P L ( 3 7 . 5 % ) .
N o t e : S u b - s t a t e e s t i m a t e s
a r e t y p i c a l l y c o l l e c t i o n s o f c o u n t i e s a n d r e
f l e c t t h e l o w e s t l e v e l o f g e o g r a p h y a v a i l a b l e f o r a s i n g l e y e a r o f A C S d a t a . I n m o s t m
e t r o a r e a s
s u b - c o u n t y e s t i m a t e s a r e a
v a i l a b l e ,
b u t w h e r e p o s s i b l e t h e s u b - c o u n
t y e s t i m a t e s a r e a g g r e g a t e d t o t h e c o u n t y
.

8/9/2019 Virginia State Chartbook
http://slidepdf.com/reader/full/virginia-state-chartbook 21/35
August 23, 2010 www.shadac.org 18
Virginia SHAP Grantee Chartbook
Exhibit 4.4: Demographic Profile by Source of Health Insurance Coverage,
Age 19-64, <200% FPL, ACS 2008
Definitions: % = Percent; SE = Standard Error
Note: Counts are presented in thousands.
Source: U.S. Census Bureau, 2008 American Community Survey.
Population Uninsured InsuredPrivate
Coverage
Government
Coverage
(000) % SE % SE % SE % SE
Race and Ethnic i ty
Hispanic 99 66.1 2.66 33.9 2.66 30.1 2.61 4.9 0.86
White Alone 540 32.4 0.94 67.6 0.94 50.3 1.07 21.0 0.75
Black Alone 291 36.6 1.37 63.4 1.37 42.0 1.44 25.0 1.16
Asian Alone 41 40.6 4.18 59.4 4.18 55.0 4.18 6.4 1.62
Mult ip le/other
non-Hispanic18 38.5 4.54 61.5 4.54 41.3 4.62 22.3 3.98
Tota l 989 37.5 0.77 62.5 0.77 45.9 0.81 20.0 0.57Ag e
0-18 -- -- -- -- -- -- -- -- --
19-24 206 36.5 1.71 63.5 1.71 52.2 1.83 13.1 1.19
25-44 453 41.8 1.13 58.2 1.13 44.3 1.16 16.0 0.77
45-64 330 32.1 1.10 67.9 1.10 44.1 1.16 29.8 0.99
Tota l 989 37.5 0.77 62.5 0.77 45.9 0.81 20.0 0.57
Poverty Level
0 -99% FPL 427 42.0 1.17 58.0 1.17 33.3 1.18 27.6 0.99
100-199% FPL 562 34.0 0.98 66.0 0.98 55.4 1.04 14.2 0.62
200-399% FPL -- -- -- -- -- -- -- -- --
400%+ FPL -- -- -- -- -- -- -- -- --
Tota l 989 37.5 0.77 62.5 0.77 45.9 0.81 20.0 0.57
Se x
Male 426 42.0 1.12 58.0 1.12 44.4 1.14 17.6 0.77
Female 563 34.0 0.88 66.0 0.88 47.0 0.94 21.8 0.75
Tota l 989 37.5 0.77 62.5 0.77 45.9 0.81 20.0 0.57
Work Status
Not work ing 329 31.9 1.14 68.1 1.14 33.6 1.15 41.5 1.15
Part -t ime 210 43.1 1.47 56.9 1.47 45.3 1.48 13.7 0.95
F u l l - t i m e 450 38.9 1.11 61.1 1.11 55.2 1.14 7.3 0.58
Tota l 989 37.5 0.77 62.5 0.77 45.9 0.81 20.0 0.57
8/9/2019 Virginia State Chartbook
http://slidepdf.com/reader/full/virginia-state-chartbook 22/35
August 23, 2010 www.shadac.org 19
Virginia SHAP Grantee Chartbook
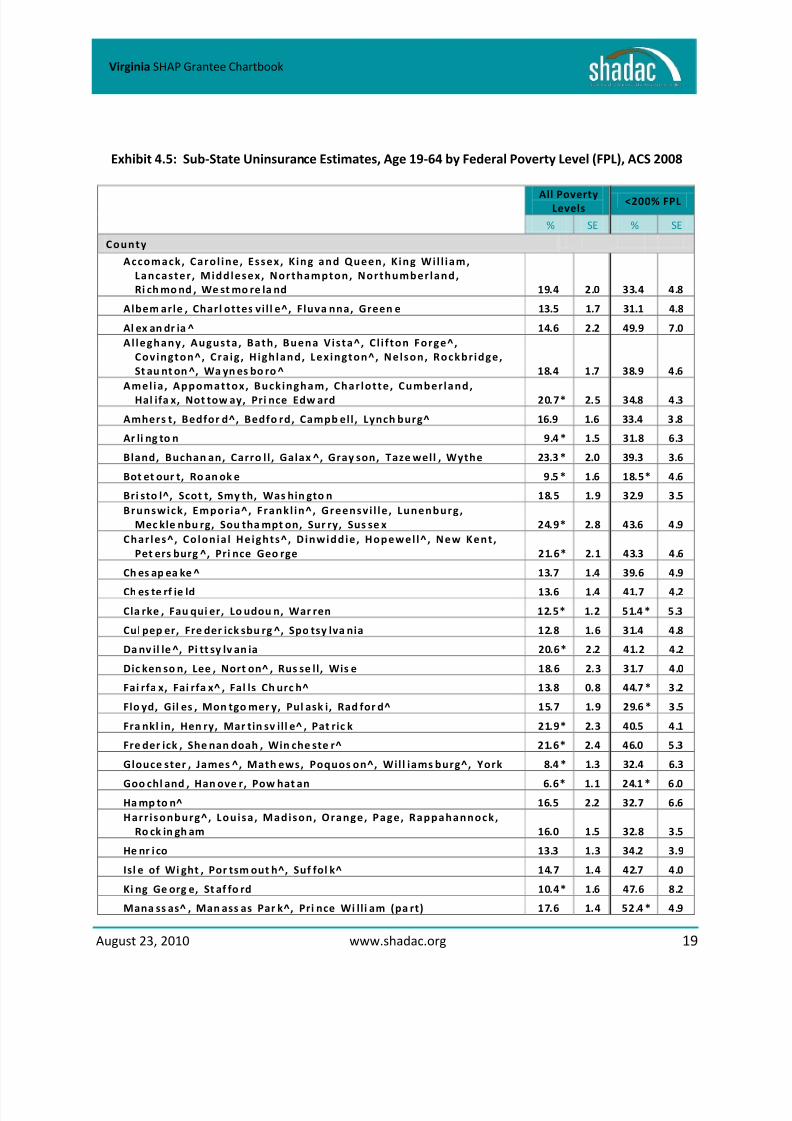
Exhibit 4.5: Sub-State Uninsurance Estimates, Age 19-64 by Federal Poverty Level (FPL), ACS 2008
All PovertyLevels
<200% FPL
% SE % SE
County
Accomack, Caro l ine, Essex, K ing and Queen, K ing Wil l iam,
Lancaster , Middlesex, Northampton, Northumber land,
Ri ch mo nd , We st mo re la nd 19.4 2.0 33.4 4.8
Albem arle , Charl ottes vil l e^, Fluva nna, Green e 13.5 1.7 31.1 4.8
Al ex an dr ia ^ 14.6 2.2 49.9 7.0
Al leghany, Augusta , Bath , Buena Vista^, C l i f ton Forge^,
Covington^, Cra ig, H igh land, Lexington^, Nelson, Rockbr idge,
St au nt on ^, Wa yn es bo ro ^ 18.4 1.7 38.9 4.6
Amel ia , Appomattox, Buck ingham, Char lotte, Cumber land,
Hal ifa x, Not tow ay, Pri nce Edw ard 20.7 * 2.5 34.8 4.3
Amhers t, Bedfor d^, Bedfo rd, Campb ell, Lynch burg^ 16.9 1.6 33.4 3.8
Ar li ng to n 9.4 * 1.5 31.8 6.3
Bland, Buchan an, Carro ll , Galax ^, Gray son, Taze well , Wythe 23.3 * 2.0 39.3 3.6
Bot et our t, Ro an ok e 9.5 * 1.6 18.5 * 4.6
Bri sto l^, Scot t, Smy th, Was hin gto n 18.5 1.9 32.9 3.5
Brunswick , Empor ia^, Frankl in^, Greensvi l le , Lunenburg,
Mec kle nbu rg, Sou tha mpt on, Sur ry, Sus se x 24.9 * 2.8 43.6 4.9
Char les^, Co lon ia l Heights^, D inwiddie, Hopewel l^ , New Kent ,
Pet ers burg ^, Pri nce Geo rge 21.6 * 2.1 43.3 4.6
Ch es ap ea ke ^ 13.7 1.4 39.6 4.9
Ch es te rf ie ld 13.6 1.4 41.7 4.2
Cla rke , Fau qui er, Lo udou n, War ren 12.5 * 1.2 51.4 * 5.3
Cul pep er, Fre der ick sbu rg ^, Spo tsy lva nia 12.8 1.6 31.4 4.8
Da nv il le ^, Pi tt sy lv an ia 20.6 * 2.2 41.2 4.2
Dic ken so n, Lee , Nort on^ , Rus se ll, Wis e 18.6 2.3 31.7 4.0
Fai rfa x, Fai rfa x^ , Fal ls Ch urc h^ 13.8 0.8 44.7 * 3.2
Flo yd, Gil es , Mon tgo mer y, Pul ask i, Rad for d^ 15.7 1.9 29.6 * 3.5
Fra nkl in, Hen ry, Mar tin sv ill e^ , Pat ric k 21.9 * 2.3 40.5 4.1
Fre der ick , She nan doah , Win che ste r^ 21.6 * 2.4 46.0 5.3
Glouce ster , James ^, Math ews, Poquos on^, Will iams burg^, York 8.4 * 1.3 32.4 6.3
Goo chl and , Han ove r, Pow hat an 6.6 * 1.1 24.1 * 6.0Ha mp to n^ 16.5 2.2 32.7 6.6
Harr isonburg^, Lou isa , Madison, Orange, Page, Rappahannock,
Ro ck in gh am 16.0 1.5 32.8 3.5
He nr i co 13.3 1.3 34.2 3.9
Isl e of Wi ght , Por tsm out h^, Suf fol k^ 14.7 1.4 42.7 4.0
Ki ng Ge org e, St af fo rd 10.4 * 1.6 47.6 8.2
Mana ss as^ , Man ass as Par k^, Pri nce Wi lli am (pa rt) 17.6 1.4 52.4 * 4.9
8/9/2019 Virginia State Chartbook
http://slidepdf.com/reader/full/virginia-state-chartbook 23/35
8/9/2019 Virginia State Chartbook
http://slidepdf.com/reader/full/virginia-state-chartbook 24/35
August 23, 2010 www.shadac.org 21
Virginia SHAP Grantee Chartbook
Appendix A. Technical Assistance Available from SHADAC
SHADAC has a contract with Health Resources and Services Administration (HRSA) at Health and Human
Services (HHS) to provide technical assistance to states that have received State Health Access Program
(SHAP) grants. This includes support for data collection, analysis and evaluation related to their SHAP
project work. A summary of assistance is provided below. Questions and requests can be directed to
Elizabeth Lukanen at 612-626-1537 or [email protected].
Data Assistance
Several SHADAC resources are available to help SHAP grantees access and utilize data relating to health
insurance coverage estimates, access to care, and understanding available data-specific technical
assistance resources. Resources include: SHADAC’s Data Center, an online table and chart generator;
issue briefs and technical briefs; and information on how to access microdata.
Web page: http://www.shadac.org/shap/technical-assistance/data
HRSA Benchmarks
SHADAC will also assist states in reporting HSRA benchmark data.
Web page: http://www.shadac.org/shap/technical-assistance/HRSA-Benchmarks
Evaluation
SHADAC staff are available to help SHAP grantees refine and implement evaluation plans, to ensure the
fidelity and success of SHAP-funded programs.
Web page: http://www.shadac.org/shap/technical-assistance/evaluations
Surveys
SHADAC has a variety of resources to help SHAP grantees conduct survey research and apply the results
to relevant audiences. SHADAC’s technical assistance can facilitate the sharing of information and
expertise among grantees, help policy makers understand the unique characteristics of state sub-
populations, and provide assistance in developing survey tools and methods.
Web page: http://www.shadac.org/shap/technical-assistance/surveys
State Reform Research and Strategies
SHADAC has provided evaluative information on health reform initiatives in states participating in the
State Health Access Reform Evaluation (SHARE) program. Many of these evaluations provide descriptive
information that may be useful for SHAP grantees.
Web page: http://www.shadac.org/shap/technical-assistance/ state-reform-research-and-strategies
8/9/2019 Virginia State Chartbook
http://slidepdf.com/reader/full/virginia-state-chartbook 25/35
August 23, 2010 www.shadac.org 22
Virginia SHAP Grantee Chartbook
Appendix B. Data Source
Source: U.S. Census Bureau, 2008 American Community Survey (ACS). Calculations by SHADAC.
Estimates for the ACS exclude military but include non-institutionalized group quarters such as
college/university housing, group homes intended for adults, residential treatment facilities for adults,workers’ group living quarters and Job Corps centers, and religious group quarters.
Population counts are presented in thousands.
Definitions: '%' = Percent; 'SE' = Standard error as a percent. Confidence intervals can be calculated
from the standard errors; for example, the 95% confidence interval is ±(1.96 * SE).
Insurance coverage note: Listed Medicaid rates include SCHIP and state-specific public programs. Those
who report multiple types of insurance coverage (i.e., private or public) are included in each category;
therefore, row totals may add to more than 100 percent. Active duty military coverage (e.g., TRICARE) is
considered employer-sponsored insurance, while VA coverage is considered government coverage.
ACS methodology note: The ACS asks respondents about their health insurance coverage at the time of
the interview.
For technical documentation on the ACS please visit http://www.shadac.org/content/acs-info-and-
resources.
8/9/2019 Virginia State Chartbook
http://slidepdf.com/reader/full/virginia-state-chartbook 26/35
August 23, 2010 www.shadac.org 23
Virginia SHAP Grantee Chartbook
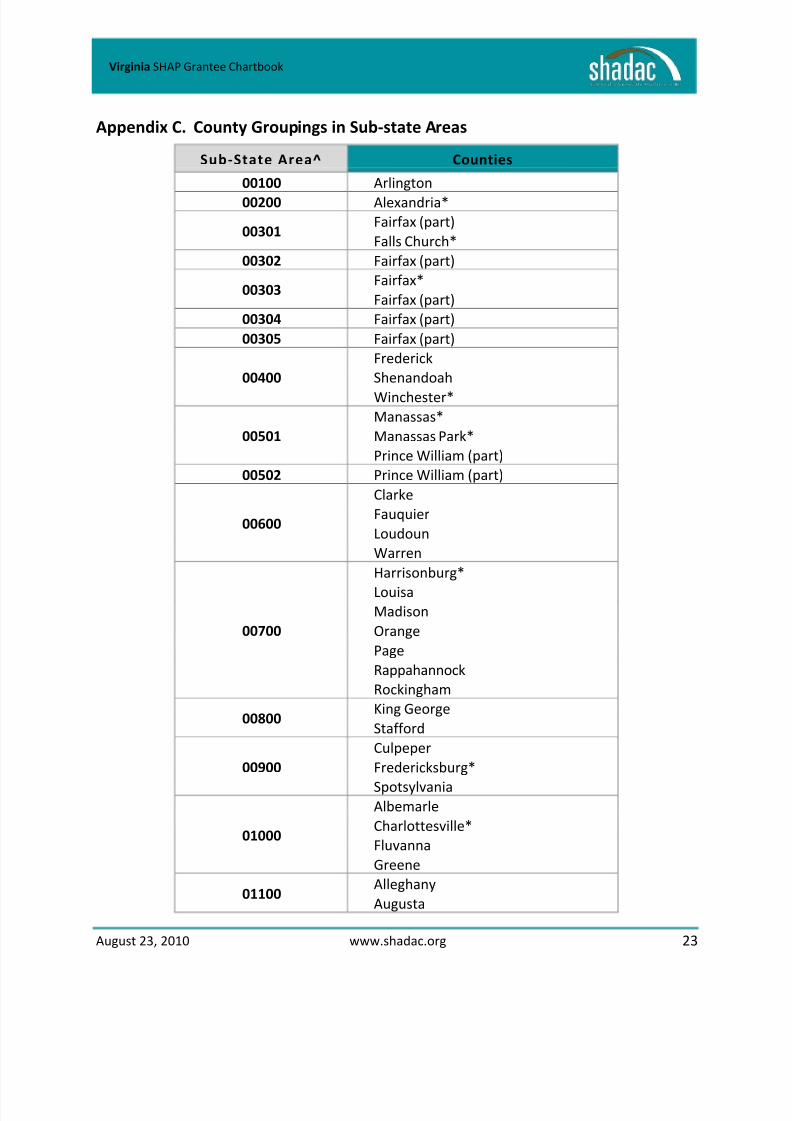
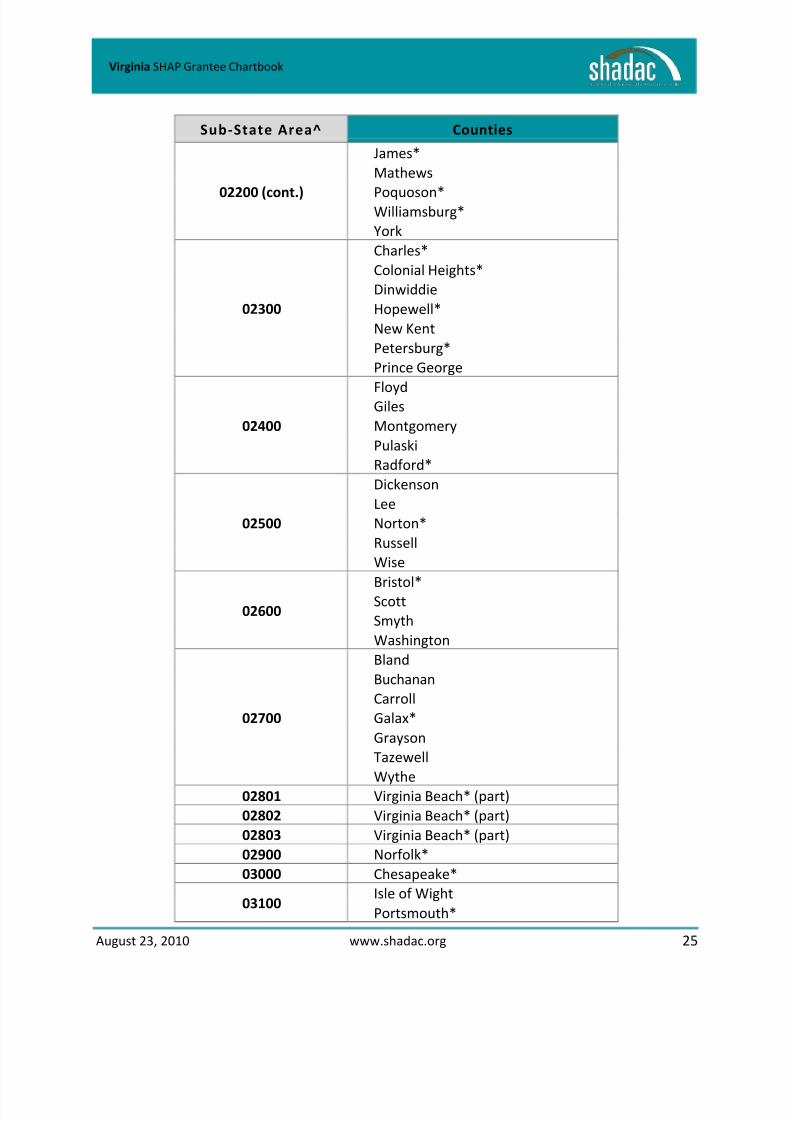
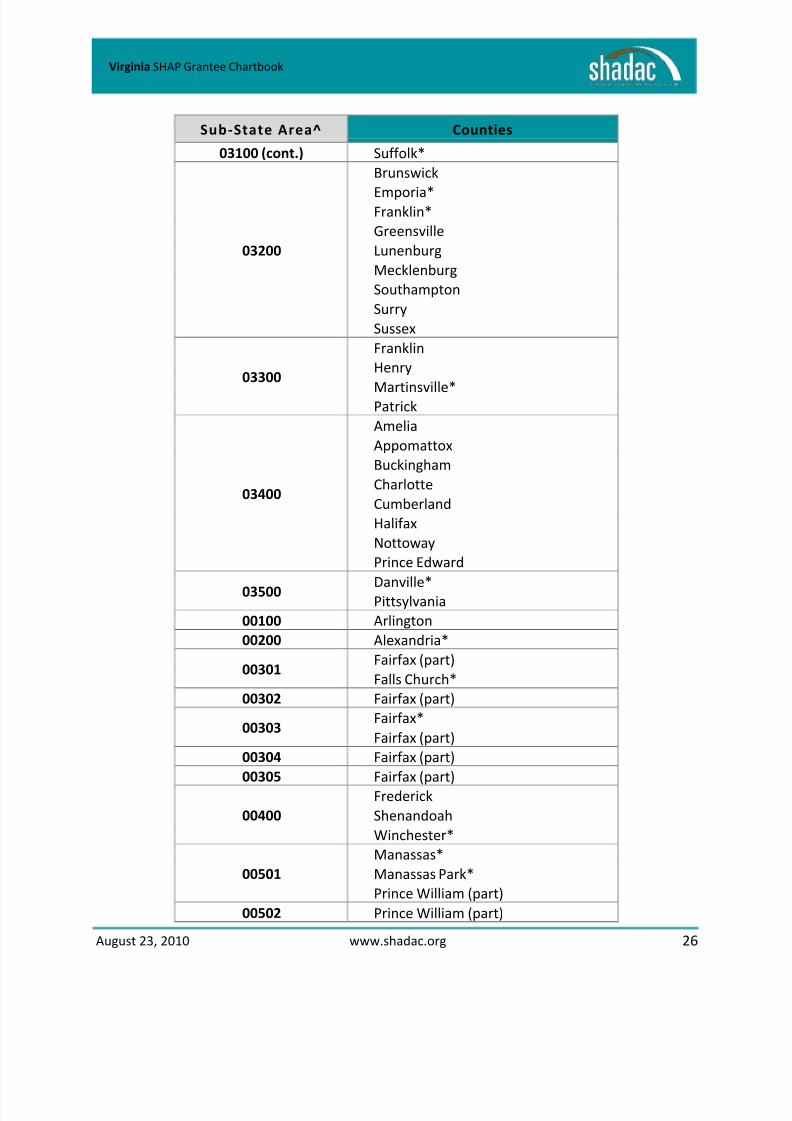
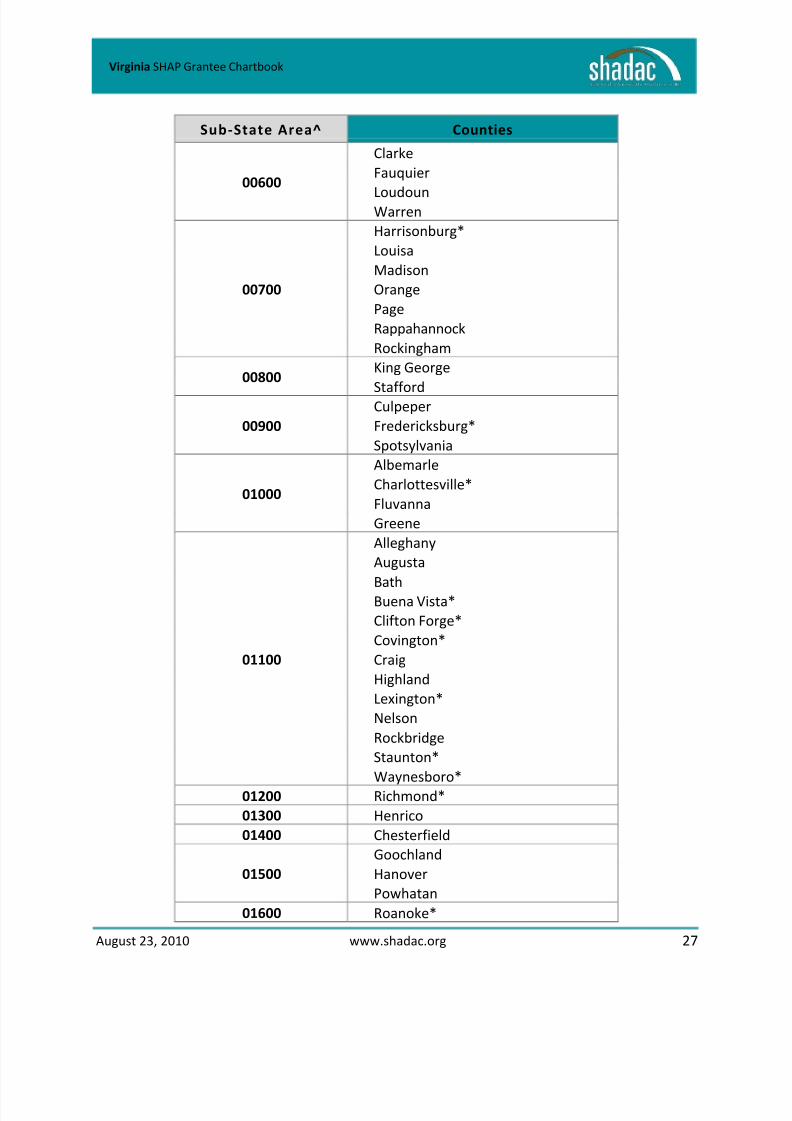
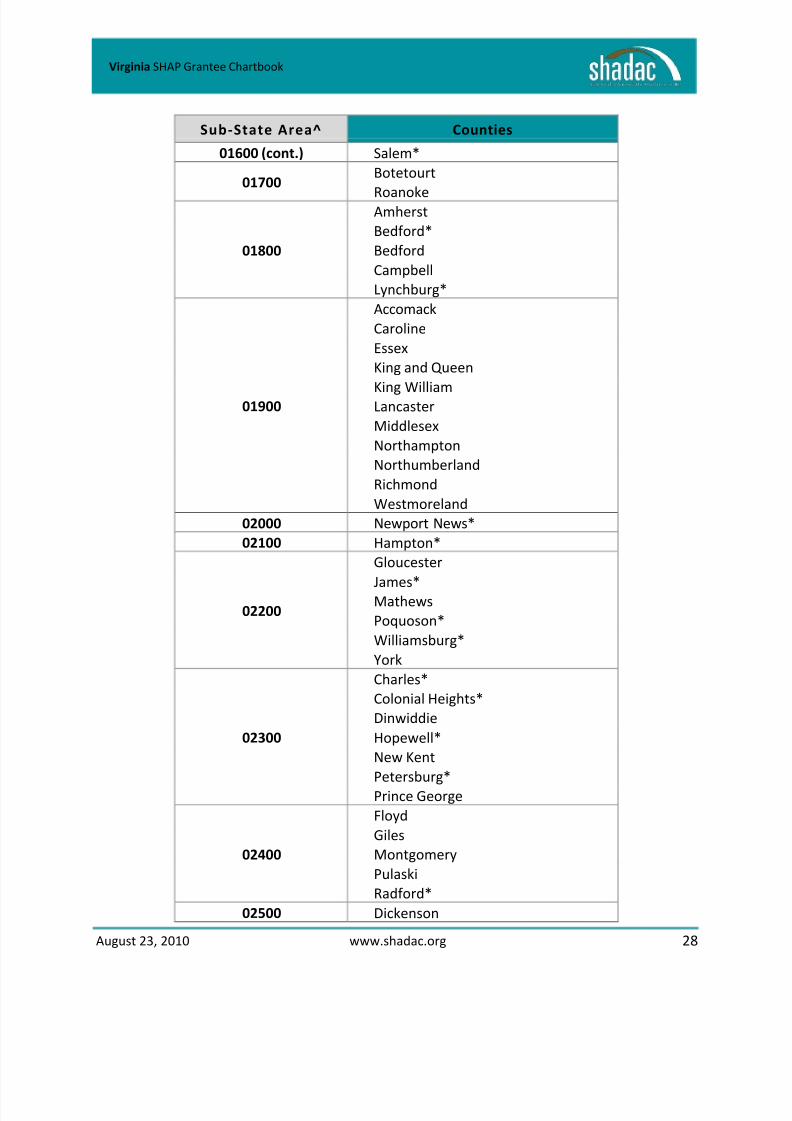
Appendix C. County Groupings in Sub-state Areas
Sub-State Area^ Counties
00100 Arlington
00200 Alexandria*
00301Fairfax (part)
Falls Church*
00302 Fairfax (part)
00303Fairfax*
Fairfax (part)
00304 Fairfax (part)
00305 Fairfax (part)
00400
Frederick
Shenandoah
Winchester*
00501
Manassas*
Manassas Park*
Prince William (part)
00502 Prince William (part)
00600
Clarke
Fauquier
Loudoun
Warren
00700
Harrisonburg*
LouisaMadison
Orange
Page
Rappahannock
Rockingham
00800King George
Stafford
00900
Culpeper
Fredericksburg*
Spotsylvania
01000
Albemarle
Charlottesville*
Fluvanna
Greene
01100Alleghany
Augusta
8/9/2019 Virginia State Chartbook
http://slidepdf.com/reader/full/virginia-state-chartbook 27/35
August 23, 2010 www.shadac.org 24
Virginia SHAP Grantee Chartbook
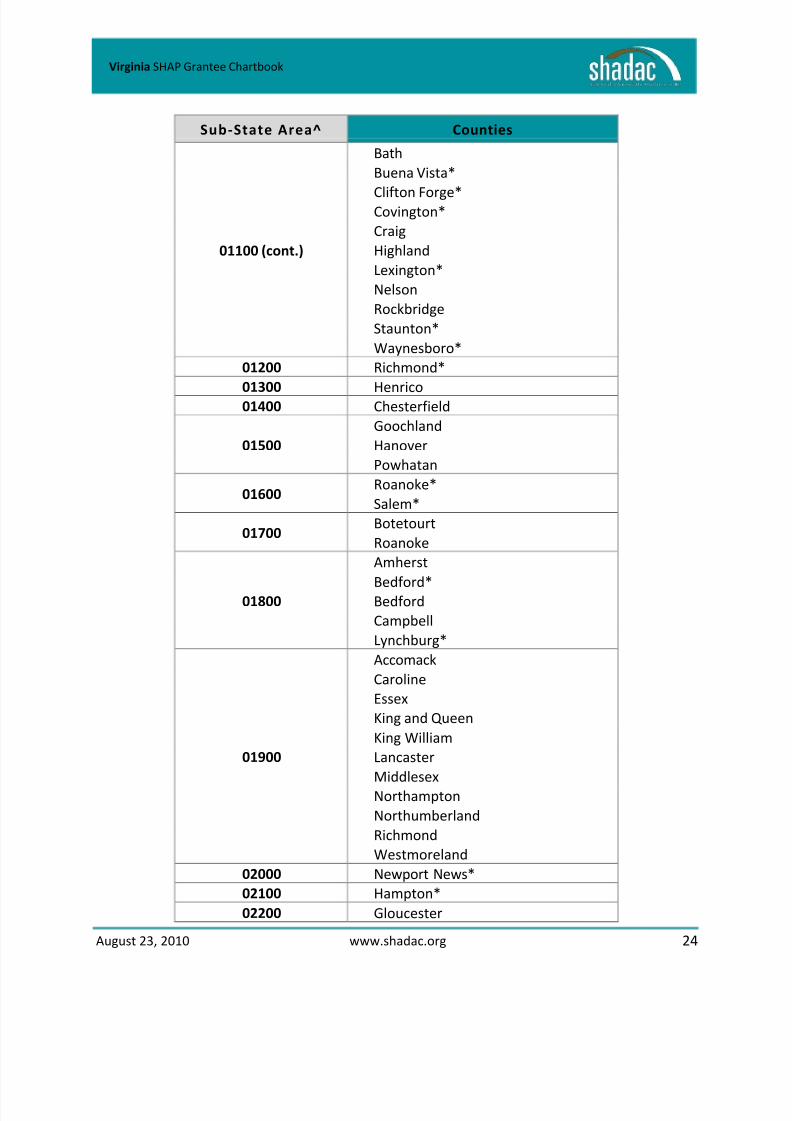
Sub-State Area^ Counties
01100 (cont.)
Bath
Buena Vista*
Clifton Forge*Covington*
Craig
Highland
Lexington*
Nelson
Rockbridge
Staunton*
Waynesboro*
01200 Richmond*
01300 Henrico01400 Chesterfield
01500
Goochland
Hanover
Powhatan
01600Roanoke*
Salem*
01700Botetourt
Roanoke
01800
Amherst
Bedford*Bedford
Campbell
Lynchburg*
01900
Accomack
Caroline
Essex
King and Queen
King William
Lancaster
Middlesex
Northampton
Northumberland
Richmond
Westmoreland
02000 Newport News*
02100 Hampton*
02200 Gloucester
8/9/2019 Virginia State Chartbook
http://slidepdf.com/reader/full/virginia-state-chartbook 28/35
August 23, 2010 www.shadac.org 25
Virginia SHAP Grantee Chartbook
Sub-State Area^ Counties
02200 (cont.)
James*
Mathews
Poquoson*Williamsburg*
York
02300
Charles*
Colonial Heights*
Dinwiddie
Hopewell*
New Kent
Petersburg*
Prince George
02400
FloydGiles
Montgomery
Pulaski
Radford*
02500
Dickenson
Lee
Norton*
Russell
Wise
02600Bristol*Scott
Smyth
Washington
02700
Bland
Buchanan
Carroll
Galax*
Grayson
Tazewell
Wythe
02801 Virginia Beach* (part)
02802 Virginia Beach* (part)
02803 Virginia Beach* (part)
02900 Norfolk*
03000 Chesapeake*
03100Isle of Wight
Portsmouth*
8/9/2019 Virginia State Chartbook
http://slidepdf.com/reader/full/virginia-state-chartbook 29/35
August 23, 2010 www.shadac.org 26
Virginia SHAP Grantee Chartbook
Sub-State Area^ Counties
03100 (cont.) Suffolk*
03200
Brunswick
Emporia*Franklin*
Greensville
Lunenburg
Mecklenburg
Southampton
Surry
Sussex
03300
Franklin
Henry
Martinsville*Patrick
03400
Amelia
Appomattox
Buckingham
Charlotte
Cumberland
Halifax
Nottoway
Prince Edward
03500 Danville*Pittsylvania
00100 Arlington
00200 Alexandria*
00301Fairfax (part)
Falls Church*
00302 Fairfax (part)
00303Fairfax*
Fairfax (part)
00304 Fairfax (part)
00305 Fairfax (part)
00400
Frederick
Shenandoah
Winchester*
00501
Manassas*
Manassas Park*
Prince William (part)
00502 Prince William (part)
8/9/2019 Virginia State Chartbook
http://slidepdf.com/reader/full/virginia-state-chartbook 30/35
August 23, 2010 www.shadac.org 27
Virginia SHAP Grantee Chartbook
Sub-State Area^ Counties
00600
Clarke
Fauquier
LoudounWarren
00700
Harrisonburg*
Louisa
Madison
Orange
Page
Rappahannock
Rockingham
00800King George
Stafford
00900
Culpeper
Fredericksburg*
Spotsylvania
01000
Albemarle
Charlottesville*
Fluvanna
Greene
01100
Alleghany
Augusta
BathBuena Vista*
Clifton Forge*
Covington*
Craig
Highland
Lexington*
Nelson
Rockbridge
Staunton*
Waynesboro*
01200 Richmond*
01300 Henrico
01400 Chesterfield
01500
Goochland
Hanover
Powhatan
01600 Roanoke*
8/9/2019 Virginia State Chartbook
http://slidepdf.com/reader/full/virginia-state-chartbook 31/35
August 23, 2010 www.shadac.org 28
Virginia SHAP Grantee Chartbook
Sub-State Area^ Counties
01600 (cont.) Salem*
01700Botetourt
Roanoke
01800
Amherst
Bedford*
Bedford
Campbell
Lynchburg*
01900
Accomack
Caroline
Essex
King and Queen
King WilliamLancaster
Middlesex
Northampton
Northumberland
Richmond
Westmoreland
02000 Newport News*
02100 Hampton*
02200
Gloucester
James*Mathews
Poquoson*
Williamsburg*
York
02300
Charles*
Colonial Heights*
Dinwiddie
Hopewell*
New Kent
Petersburg*
Prince George
02400
Floyd
Giles
Montgomery
Pulaski
Radford*
02500 Dickenson
8/9/2019 Virginia State Chartbook
http://slidepdf.com/reader/full/virginia-state-chartbook 32/35
August 23, 2010 www.shadac.org 29
Virginia SHAP Grantee Chartbook
Sub-State Area^ Counties
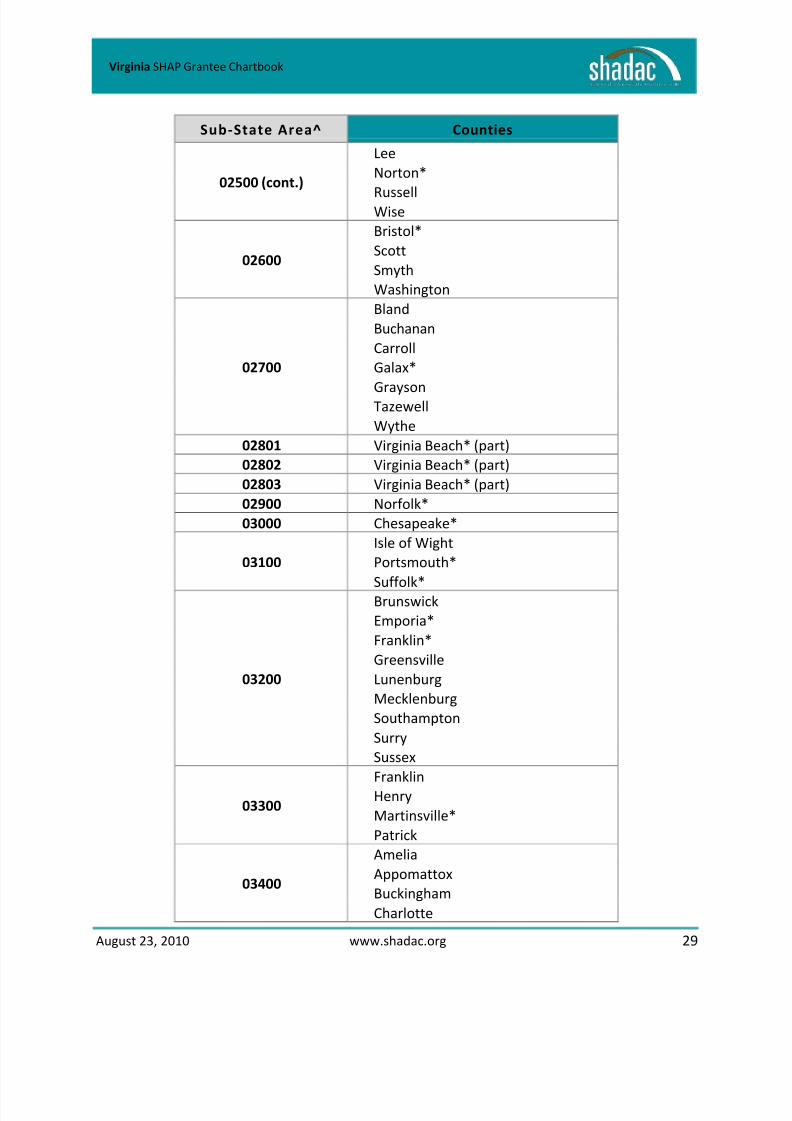
02500 (cont.)
Lee
Norton*
RussellWise
02600
Bristol*
Scott
Smyth
Washington
02700
Bland
Buchanan
Carroll
Galax*
GraysonTazewell
Wythe
02801 Virginia Beach* (part)
02802 Virginia Beach* (part)
02803 Virginia Beach* (part)
02900 Norfolk*
03000 Chesapeake*
03100
Isle of Wight
Portsmouth*
Suffolk*
03200
Brunswick
Emporia*
Franklin*
Greensville
Lunenburg
Mecklenburg
Southampton
Surry
Sussex
03300
Franklin
Henry
Martinsville*
Patrick
03400
Amelia
Appomattox
Buckingham
Charlotte
8/9/2019 Virginia State Chartbook
http://slidepdf.com/reader/full/virginia-state-chartbook 33/35
August 23, 2010 www.shadac.org 30
Virginia SHAP Grantee Chartbook
Sub-State Area^ Counties
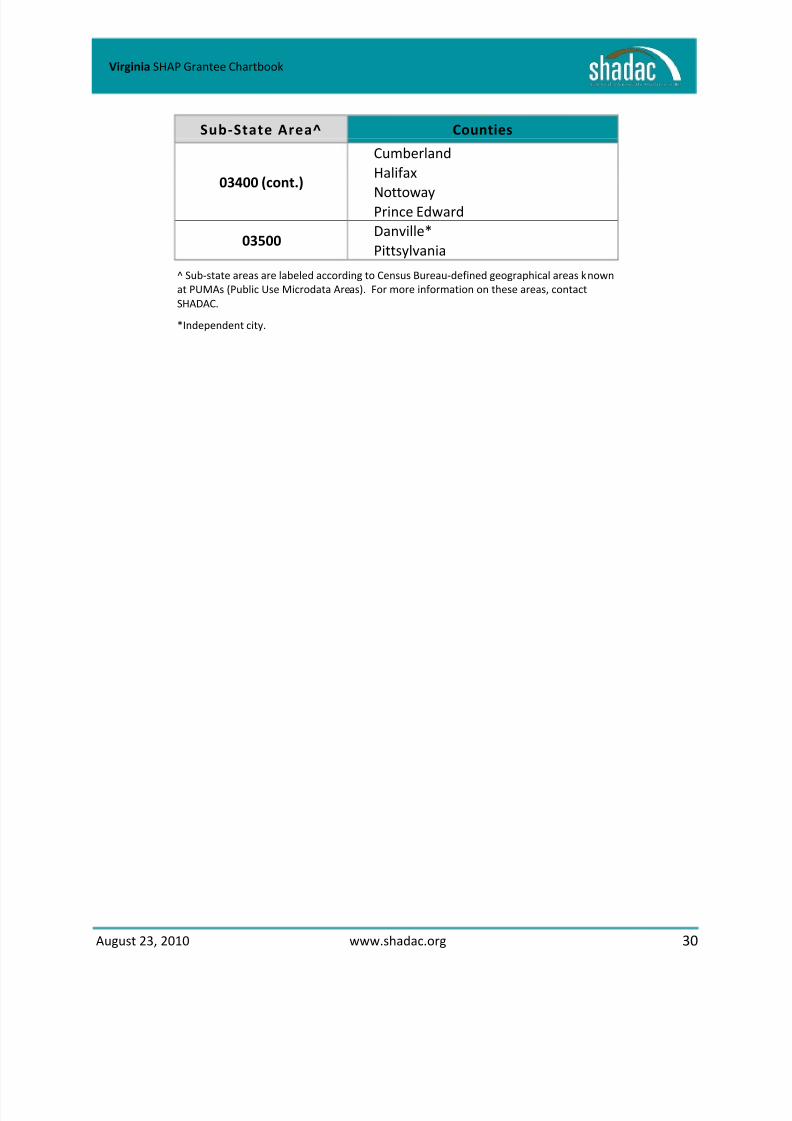
03400 (cont.)
Cumberland
Halifax
NottowayPrince Edward
03500Danville*
Pittsylvania
^ Sub-state areas are labeled according to Census Bureau-defined geographical areas known
at PUMAs (Public Use Microdata Areas). For more information on these areas, contact
SHADAC.
*Independent city.
8/9/2019 Virginia State Chartbook
http://slidepdf.com/reader/full/virginia-state-chartbook 34/35
August 23, 2010 www.shadac.org 31
Virginia SHAP Grantee Chartbook
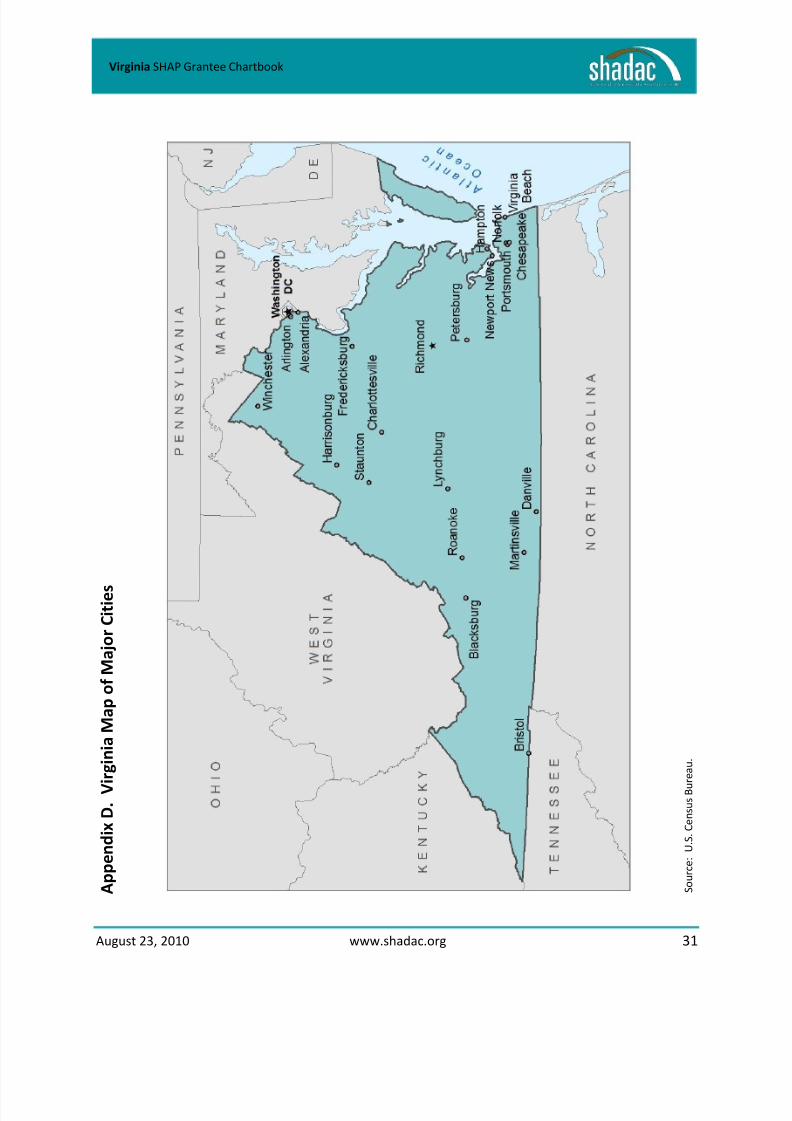
A p p e n d i x D . V i r g i n i a M a p o f M a j o r C i t i e s
S o u r c e : U . S . C e n s u s B u
r e a u .
8/9/2019 Virginia State Chartbook
http://slidepdf.com/reader/full/virginia-state-chartbook 35/35
Virginia SHAP Grantee Chartbook
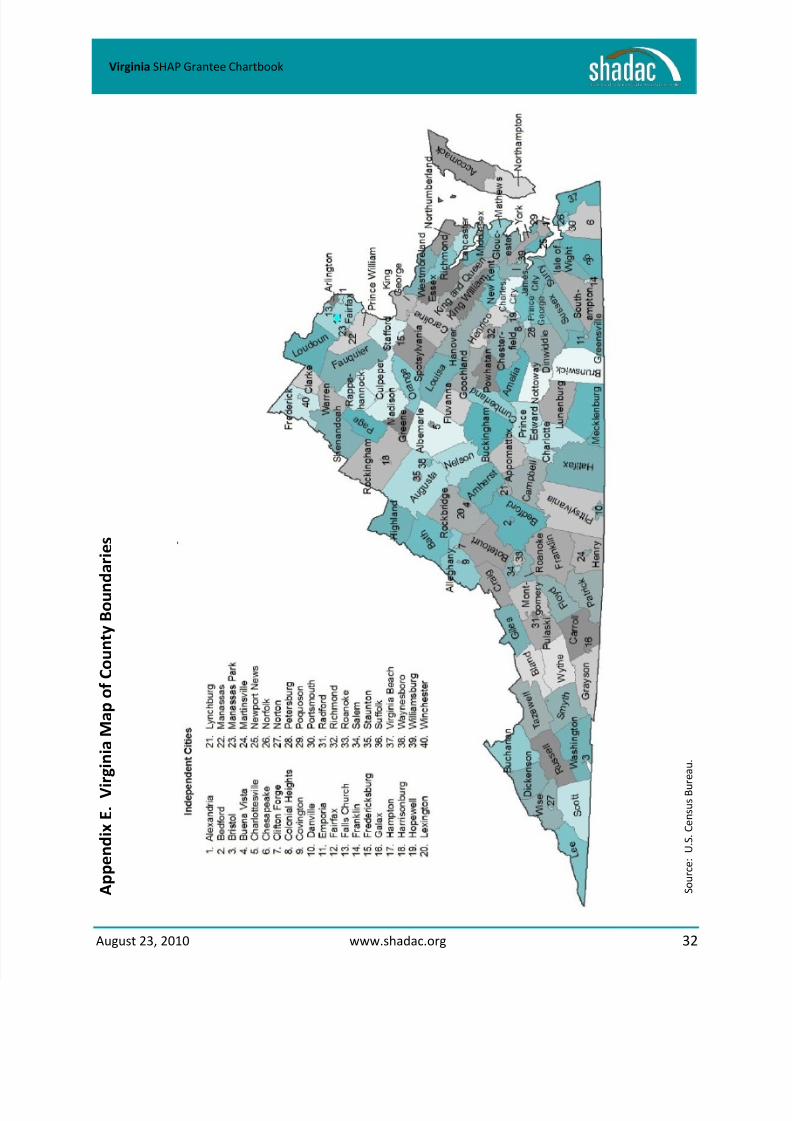
A p p e n d i x E . V i r g i n i a M a p o f C o u n t y B o u n
d a r i e s
S o u r c e : U . S . C e n s u s B u r e a u .