VIRGINIA DEPARTMENT OF HEALTH WELL YIELD … DEPARTMENT OF HEALTH - WELL YIELD AND DRAWDOWN PUMP...
7
Virginia Department of Heath Office of Drinking Water Catalog Number: HTO/007/2015 VIRGINIA DEPARTMENT OF HEALTH - WELL YIELD AND DRAWDOWN PUMP TEST PROCEDURES These procedures are designed specifically for wells located outside of one of the Coastal Plain Groundwater Management Areas and when a DEQ Aquifer Test is not required.
Transcript of VIRGINIA DEPARTMENT OF HEALTH WELL YIELD … DEPARTMENT OF HEALTH - WELL YIELD AND DRAWDOWN PUMP...

Virginia Department of Heath
Office of Drinking Water
Catalog Number: HTO/007/2015
VIRGINIA DEPARTMENT OF HEALTH -
WELL YIELD AND DRAWDOWN PUMP
TEST PROCEDURES
These procedures are designed specifically for wells located outside of
one of the Coastal Plain Groundwater Management Areas and when a
DEQ Aquifer Test is not required.

Page 2
Introduction: There are three types of pumping tests, regulated by the
Virginia Department of Health, that apply to wells located outside the
Coastal Plain Groundwater Management Areas and that are not subject to
the Department of Environmental Quality Aquifer Tests.
The standard yield test lasts for a duration of at least 48 hours. However,
the Office of Drinking Water may approve a reduced test length for Non-
Community water systems.
Community water systems serve 25 or more people, or a total of 15
or more connections, for more than six months of the year.
Non-Transient Non-Community water systems serve 25 or more of
the same people for 60 days or more in a year.
Transient Non-Community water systems serve 25 or more different
people for 60 days or more in a year.
These pumping tests are completed to ensure enough water is available to
provide the system’s needs, while at the same time not negatively im-
pacting the groundwater water supply or other existing wells. This
means that, while providing enough water for the system, the aquifer is
not depleted by pumping more water out of the well than is flowing into
it. There is also a requirement to test other wells at the same time, if they
are within 500 feet of the well being tested. This testing ensures that the
well can provide enough water for the system without depleting the
amount of water in the neighbor’s well. It is a good idea, but not a re-
quirement, to monitor the static water level of other close wells that are
more than 500 feet away from the well being tested. This option may
help provide information regarding the affect of pumping the new well.
Groundwater at a well may have a constant flow rate and achieve a stabi-
lized pumping water level. However, a neighboring well may have a de-
creasing water level. You need to determine a constant flow rate where a
stabilized pumping water level is achieved, and other monitored wells
have a stabilized non-pumping water level.
Step 1: (Initial Estimate) The well driller will usually estimate the well
flow rate after completion of a drilled well. (See Appendix 1 for suggest-
ed methods.)
APPENDIX 4 (Continued)
Virginia Department of Heath Office of Drinking Water Page 13
Date & Time
Test Started
Time of
Reading
(30 minute
interval)
Air Line
Pressure (psi)
Water Above
Pump
(ft.)
Depth to Water
(ft.)
Recovery (ft./30
minutes)
Notes
Preparer's
Signature
Date
(2) Well recovery period shall be 30-minute intervals for 2-hours
(1) Well recovery period shall start as the pump test ends
Notes:
Well Recovery

APPENDIX 4 (Continued)
Page 12
TimeTime of
Reading
Air Line
Pressure (psi)
Water Above
Pump
(ft.)
Depth to Water
(ft.)
Draw Down
Rate (ft./hr.)
Meter Reading
(gal)
Pump
Discharge Rate
(gpm)
1 hr
1 hr
1 hr
1 hr
1 hr
1 hr
1 hr
1 hr
1 hr
1 hr
1 hr
1 hr
1 hr
1 hr
1 hr
1 hr
1 hr
1 hr
1 hr
1 hr
1 hr
1 hr
1 hr
1 hr
1 hr
1 hr
1 hr
1 hr
1 hr
1 hr
1 hr
1 hr
1 hr
1 hr
1 hr
1 hr
1 hr
1 hr
Well Yield (cont.)
Virginia Department of Heath Office of Drinking Water Page 3
The estimated pump rate helps with the selection of a pump large enough
to pump the maximum volume of groundwater without lowering the wa-
ter level below the minimum submergence required for the pump
(exhaustive capacity). Sometimes the estimated well yield is much larger
than a pump can provide because a small diameter well limits the flow
into the pump. In this case, utilize the largest pump (greatest pumping
capacity) that will fit in the well. The size of the piping, wiring, and gen-
erator should also be selected to match the flow rate expected from the
selected pump. Otherwise the flow rate may be limited by the size of
pipe connected to the pump, the wiring may be of insufficient size for the
pump to function at full capacity, or the generator may not produce suffi-
cient electricity to power the pump at full capacity.
The well yield may be far greater than the yield necessary for your needs.
If this is the case, you may choose a pump which can produce your needs
and perhaps a little more as a safety factor. This will also allow the well
to stabilize more quickly since it is not being as stressed. For example, if
your system requires 5 gallons per minute, but the well has the potential
to produce 30 gallons per minute, then there is no need to demonstrate a
yield of more than 8 gallons per minute.
Note: The pump test will have more value if the whole test can be com-
pleted at a constant pump rate. In order to achieve this, it is helpful to
pump the well for an hour or two several days before you begin the actu-
al forty eight hour pump test. This pre-test will function as a step draw-
down test, where the sustained pump rate may be determined prior to the
day of the pump test. That is, the rate at which the well production
matches the pump rate because the water level is no longer falling. Mon-
itoring the water level in a nearby public well or even a private home
owner’s well can also add more value to the information gained from the
pump test. This added data from the nearby well will allow hydrologists,
geologists, or engineers to calculate important features of the aquifer at a
later date. Furthermore, these step drawdown tests also allow trouble-
shooting of proper sizing of pumps, pipes, generators, and wiring. Prob-
lems may arise from where you chose to divert the effluent water from
the test. A pre-test will help evaluate the best alternatives for discharge.
Step 2: (The Well Setup) The pump should be installed with a meter
and throttling gate valve in place so that the gallons per minute of flow
can be determined by timing the meter with a stopwatch, and the flow
can be adjusted by opening and closing the gate valve.

You also need a way to measure the water depth in the well. (See Ap-
pendix 2 for suggested methods.)
Step 3: (Documentation) Enter the data from the pump test into the
Well Yield and Recovery Report. If you obtain a copy of the Excel™
computer spreadsheet from VDH and enter the data it will complete the
calculations for you. (See Appendix 3 for additional calculations and
Appendix 4 for Well Yield and Recovery Report.)
Initially you will be pumping with the gate valve not throttled and will
make observations and record data every five minutes for a total of six
intervals or thirty minutes. Next you will make observations and record
data every 15 minutes for an hour and a half.
You will then be required to record your observations once every hour.
However, you may need to check more often if your water depth is still
falling and not stabilized at a constant pump rate, or if you are not yet
sure that you have throttled flow to the point that your pump will remain
submerged in water.
Note: Make sure you are aware of your pump depth and begin to throttle
your flow down (by partially closing the gate valve a little at a time) to
keep the pump submerged in water.
Continue to throttle the flow back with the gate valve until depth to water
remains unchanged. It is possible to throttle too much and observe a de-
crease in the depth to water as the water level begins to rise. In this case
you would open the throttling valve to increase flow from the pump in
order to find the pump rate at which the depth to water does not change.
Once you have found this pump rate you should not need to make any
more adjustments to the throttling valve. A constant pump rate which
does not cause the depth to the water to change is required for the final
Page 4
APPENDIX 4
System
NameCity/County
Well Number
and NameWell Class
Well Casing
Size
Well Depth
(ft.)
Static Water
Level (ft.)
Depth of
Pump (ft)
Airline
Length (ft.)
Test Pump
Brand/ModelPump HP
Date & Time
Test Started
TimeTime of
Reading
Air Line
Pressure
(psi)
Water Above
Pump
(ft.)
Depth to
Water
(ft.)
Draw Down
Rate (ft./hr.)
Meter
Reading (gal)
Pump
Discharge
Rate
(gpm)
Start
5 min
5 min
5 min
5 min
5 min
5 min
15 min
15 min
15 min
15 min
15 min
15 min
1 hr
1 hr
1 hr
1 hr
1 hr
1 hr
1 hr
1 hr
(1) Water Above Pump = Air Line Pressure x 2.31ft./psi + (Pump Depth - Air Line Length)
Notes: All measurements are from top of casing
Well Yield
(2) Depth to Water = Air Line Length - (Air Line Pressure x 2.31ft./psi)
Name &
Address of
Company
Performing
Test
Well Yield and Recovery Report
(3) Depth to Water = distance from top of casing to w ater level
Virginia Department of Heath Office of Drinking Water Page 11

APPENDIX 3
OTHER CALCULATIONS NEEDED TO COMPLETE THE
VIRGINIA DEPARTMENT OF HEALTH PUMPING TEST FORM
Drawdown Rate (ft./hr.) will be calculated by subtracting the depth to
water reading from the last depth to water reading to get drawdown depth
in feet. Use the following formula:
(Current reading for Depth to Water - Previous recording for
Depth to Water *60 min/hour) ÷ _____minutes since last reading
= __________ Draw Down Rate (ft./hr.)
2) Well Recovery:
(Last Depth to Water Reading - current Depth to Water reading)
=Recovery (ft/30 minutes)
Virginia Department of Heath Office of Drinking Water Page 10 Virginia Department of Heath Office of Drinking Water Page 5
six hours of the pump test. If you do not reach this rate until the last hour
of the pump test (48th, 24th or 8th), you will need to pump for another
six hours. Remember, if you have already exceeded the flow that you
need, you can throttle down and stabilize the well sooner.
Note: Some wells will be muddy or turbid at the highest pump rate that
produces a stabilized water level, but may be clear at a lower pumping
rate. In other words; the well will reach a stabilized water level at a con-
stant pumping rate, but remain muddy. When the pump rate is decreased
the water will be clear. This should be noted on the report. The yield
will be the lower pump rate at which the well is not muddy or turbid. It
is always possible to pump the well longer than the required 48 hours at
the maximum rate to see if it clears up.
Note: In some rock aquifers you may find two or three periods of stabi-
lized flow rates and water levels that persist for a period of time, and then
begin to drop again. This can happen due to interconnected fractures or
caverns acting as reservoirs that can supply water at a higher flow rate
until drained. (See figure below) Once a void is drained you will again
have to find the flow rate of water recharging the well. Several different
fracture series full of water may be encountered when drilling a well, and
may have to be drained before you can find the true stabilized well yield.
This is usually indicated by at least six hours of constant flow rate and a
stabilized pumping water level.
Page 6
Step 4: Collect one bacteriologic water sample per hour for the last
twenty hours of a forty eight hour drawdown test. Twenty samples are
required to be analyzed utilizing the “Most Probable Number (MPN)”
method. They will be collected one per thirty minutes for the last ten
hours if you are conducting a twenty four hour drawdown test. If you are
conducting an eight hour drawdown test for a Transient Non-community
water system with design capacity need of less than 3 gallons per minute,
you will need to collect samples evenly spaced throughout the eight
hours, such as one every twenty-four minutes.
(Eight hour pumping tests are only allowed if the Transient Non-
community water system has capacity needs of three gallons per minute
or less. In these instances the purpose is to prove that you can reliably
pump for eight hours at or above the needed pumping capacity without
depleting the aquifer. If Transient Non-community water systems have
capacity needs of greater than three gallons per minute they must com-
plete a twenty four hour pumping test.)
Step 5: Chemical samples required during these pump tests should be
collected during the last thirty minutes of the test. Contact the Virginia
Department of Health, Office of Drinking Water for a list of samples
required during the pump test.
Step 6: After completing the pump test for the designated time with a
minimum of six hours of constant flow rate and stabilized pumping water
level, you will need to complete the Well Recovery chart. For this proce-
dure you will monitor the well for another six hours without pumping.
Note the change in ‘depth to water‘ every thirty minutes for six hours, or
until the depth to water recovers to the level observed at the start of the
pump test. After six hours, even if the water level has not recovered to
the pre-pump test level, you are done. This information is helpful in de-
termining the effect pumping this well has on the aquifer and therefore
long term sustainability of this well.
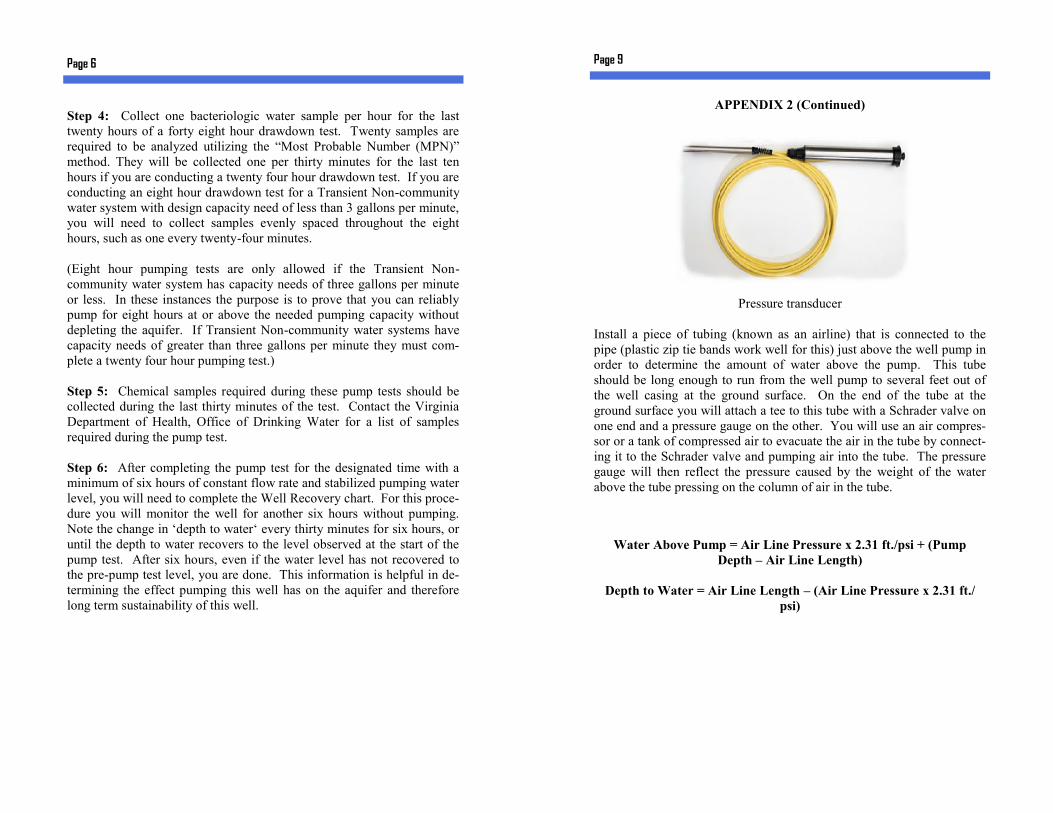
APPENDIX 2 (Continued)
Pressure transducer
Install a piece of tubing (known as an airline) that is connected to the
pipe (plastic zip tie bands work well for this) just above the well pump in
order to determine the amount of water above the pump. This tube
should be long enough to run from the well pump to several feet out of
the well casing at the ground surface. On the end of the tube at the
ground surface you will attach a tee to this tube with a Schrader valve on
one end and a pressure gauge on the other. You will use an air compres-
sor or a tank of compressed air to evacuate the air in the tube by connect-
ing it to the Schrader valve and pumping air into the tube. The pressure
gauge will then reflect the pressure caused by the weight of the water
above the tube pressing on the column of air in the tube.
Page 9
Water Above Pump = Air Line Pressure x 2.31 ft./psi + (Pump
Depth – Air Line Length)
Depth to Water = Air Line Length – (Air Line Pressure x 2.31 ft./
psi)

APPENDIX 2
TECHNIQUES TO MEASURE DEPTH OF WATER IN A WELL
DURING A PUMPING TEST
A sonar or ultra-sonic device can be placed at top of the well casing that
bounces a sound wave off of the water.
Sonar or ultra-sonic device. Electronic water level indicator.
Most water level indicator devices use paired electrodes that complete
the circuit only when water is contacted so they have to be submerged in
the well. It is important to place this type of device inside of a small pipe
that extends almost all the way down to the pump. (See photo on cover)
This will prevent false indications of water level, if water is falling into
the well from a water zone higher than the current water level.
Pressure transducers are very sensitive devices and may be dangled in the
well or attached to the pump at a depth measured with a tape for calibra-
tion purposes. They will measure changes in pressure and can usually be
programmed to record at very short intervals. These pressure transducers
have an advantage over paired electron water level indicators in that wa-
ter falling into the well from above does not affect them and they do not
need to be in their own separate conduit. These are also great for use in
nearby observation wells as they require no manpower during the actual
pump test. You set it and retrieve it and the data after the pump test is
completed. They are sensitive enough that when used in nearby monitor-
ing wells they can help deduce other factors that may be affecting the
water level in the well being pumped, such as, air pressure changes if
atmospheric barometric pressure is also monitored during the test, earth
tides, trains going by, etc.
Virginia Department of Heath Office of Drinking Water Page 8
APPENDIX 1
TECHNIQUES TO ESTIMATE WELL FLOW RATE
One way to estimate well flow rate is by pumping compressed air
through the drill bit into the hole while the drill bit is spinning to create
an air lift pump. This will cause water to flow out of the hole which can
then be diverted by a mud weir or a ditch to flow into a five gallon buck-
et (or larger container of known volume when required, e.g. 55 gallon
barrel or 1,000 gallon tank) and be timed with a stopwatch.
(5 gals in bucket)*(60 seconds/minute) ÷ ___ sec to fill bucket =
____ gallons per minute
Another method employed by some drillers is to use an air lift pump as
mentioned above, but to divert water exiting the borehole into a hori-
zontal pipe. The pipe must be completely full of water with straight cut
ends (not jagged). This will obviously be more useful on wells with
large flows. This also may be tricky as the water level may need to be
above the pipe for it to run full, but not high enough to overflow the
pond dam or ditch diverting it into the pipe. The volume of water exit-
ing this pipe can be determined by the formula:
(Flow in gallons per minute) = 1.05 * (area of end of pipe in square
inches) * (distance in inches from end of pipe to a point where the
falling water is one foot below the top of the pipe)
To determine the area of the end of the pipe in square inches:
(Area of end of pipe in square inches) = 3.14 * (diameter of pipe in
inches ÷ 2) * (diameter of pipe in inches ÷ 2)
Page 7


![[p.T] Well Test Procedures Manual](https://static.fdocuments.in/doc/165x107/5475c8f2b4af9fb40a8b5e0b/pt-well-test-procedures-manual.jpg)