Virginia Commonwealth University VCU Scholars Compass
31
Virginia Commonwealth University Virginia Commonwealth University VCU Scholars Compass VCU Scholars Compass Theses and Dissertations Graduate School 2020 Senescent trees stabilize aboveground wood net primary Senescent trees stabilize aboveground wood net primary production immediately after disturbance production immediately after disturbance Maxim S. Grigri Virginia Commonwealth University Follow this and additional works at: https://scholarscompass.vcu.edu/etd Part of the Forest Biology Commons, Forest Management Commons, and the Other Forestry and Forest Sciences Commons © The Author Downloaded from Downloaded from https://scholarscompass.vcu.edu/etd/6174 This Thesis is brought to you for free and open access by the Graduate School at VCU Scholars Compass. It has been accepted for inclusion in Theses and Dissertations by an authorized administrator of VCU Scholars Compass. For more information, please contact [email protected].
Transcript of Virginia Commonwealth University VCU Scholars Compass

Virginia Commonwealth University Virginia Commonwealth University
VCU Scholars Compass VCU Scholars Compass
Theses and Dissertations Graduate School
2020
Senescent trees stabilize aboveground wood net primary Senescent trees stabilize aboveground wood net primary
production immediately after disturbance production immediately after disturbance
Maxim S. Grigri Virginia Commonwealth University
Follow this and additional works at: https://scholarscompass.vcu.edu/etd
Part of the Forest Biology Commons, Forest Management Commons, and the Other Forestry and
Forest Sciences Commons
© The Author
Downloaded from Downloaded from https://scholarscompass.vcu.edu/etd/6174
This Thesis is brought to you for free and open access by the Graduate School at VCU Scholars Compass. It has been accepted for inclusion in Theses and Dissertations by an authorized administrator of VCU Scholars Compass. For more information, please contact [email protected].

1
© Maxim S. Grigri 2020
All Rights Reserved

2
Senescent trees stabilize aboveground wood net primary
production immediately after disturbance
A thesis submitted in partial fulfillment of the requirements for the degree of
Master of Science, at Virginia Commonwealth University.
By:
Maxim S. Grigri
B.S. Environmental Science
Ithaca College
2013
Director: Dr. James Turbeville
Virginia Commonwealth University
Richmond, Virginia
May - 2020

3
Acknowledgement
The author wishes to thank several people. I’d like to thank my family for their love and
confidence throughout the many years of my university education, and for always pushing me
to try new things. I’d like to thank the constant and ongoing support of my advisor, Dr. Chris
Gough, who has helped guide my learning on this journey we call graduate school. Lastly, I’d
like to thank the Gough lab for the comradery and friendships that are sure to last a lifetime!

4
Contents
Vita .................................................................................................................................................. 5
Abstract ........................................................................................................................................... 6
Introduction ..................................................................................................................................... 6
Methods........................................................................................................................................... 9
Site Description ........................................................................................................................... 9
Aboveground wood net primary production (ANPPw) .............................................................. 10
Statistical Analysis .................................................................................................................... 11
Results ........................................................................................................................................... 11
Daily ANPPw among disturbance types and severities ............................................................. 11
Annual ANPPw and contributions from senescent and healthy trees ........................................ 12
PFT and stem size class contributions to annual ANPPw ......................................................... 12
Discussion ..................................................................................................................................... 13
Conclusion .................................................................................................................................... 13
References ..................................................................................................................................... 15
Appendices .................................................................................................................................... 28

5
Vita
Maxim Simon Grigri was born on August 24th, 1991 in Philadelphia, PA as an American citizen.
He graduated from Gateway Regional High School in Woodbury Heights, NJ in the spring of
2009. He earned his B.S. in Environmental Science at Ithaca College in Ithaca, NY. He worked
in a variety of jobs in the environmental science discipline before returning to graduate school in
the Fall of 2018.

6
Abstract
In the United States, forests sequester 17% of national carbon (C) emissions annually (UGCRP,
2018), however shifting forest disturbances threaten the stability of this essential C sink. Unlike
the high severity, stand-replacing disturbances that were widespread a century ago, today’s
eastern temperate forests experience frequent low-to-moderate severity disturbances from
invasive pests and pathogens with mixed effects on net primary production (NPP). Carbon
cycling stability after disturbance has been reported, however, the mechanisms underlying
immediate NPP stability or decline are not well understood. Through weekly measurements of
production in a landscape scale experiment, we show that the sustained growth of senescent trees
in the first year after disturbance stabilized aboveground wood net primary production (ANPPw)
in an eastern temperate forest. We found no evidence for an immediate compensatory growth
response from healthy trees that we hypothesized, but instead, aboveground accumulation of C
and continued growth by senescent trees. Among disturbance severities (0, 45, 65, 85% gross
leaf area loss) and two disturbance types concentrated in the lower and upper canopy, no
difference in annual ANPPw relative to a control was observed. Further, we found early, but
limited evidence that early successional plant functional types (PFT) contribute more to annual
ANPPw than late successional PFTs at high severity disturbances (>65%). Our high-frequency
ANPPw observations provide novel insights into the immediate response of a large C pool to
disturbance, revealing initial mechanisms of stability useful as benchmarks for ecosystem
models. We conclude that C cycling stability immediately following disturbance is largely
dependent on the continued aboveground growth of senescent trees.
Keywords: Forest disturbance, Aboveground net primary production (ANPP), Ecosystem,
Carbon cycle, Compensatory growth,

7
Introduction
North American temperate forests have sequestered carbon (C) for the last century (Bridsey et
al., 2006; Williams et al., 2012), but the stability of this C sink is in question as disturbance
regimes change (Pregitzer and Euskirchen, 2004; Seidle et al., 2017; Dale et al., 2001; Allen et
al., 2010). While high severity, stand replacing disturbance like fire and the mountain pine beetle
impact vast areas of dry western conifer forests (Hicke et al., 2013), most unmanaged temperate
forests in the eastern half of the continent experience low to moderate severity disturbance
(Sommerfeld et al., 2018; Flower & Gonzalez-Meler, 2015). Compared with stand-replacing
disturbance, more moderate disturbances from host-specific pests and pathogens are
characterized by a gradient of tree mortality and, because many of these invaders are novel, their
effects on the C cycle are less understood (Kautz et al., 2018; Kautz, Meddens, Hall, & Arneth,
2017; Elkinton & Liebhold, 1990; Atkins et al., 2019). In particular, the impact on enduring C
pools such as aboveground wood which accounts for ~ 40% of total stored forest C (Gough et
al., 2008; Gough et al., 2009) make it important to characterize how wood net primary
production (NPP) responds to disturbance.
While annual NPP responses are described for several forest ecosystems, much less is known
about the short-term, highly dynamic changes that occur immediately following disturbance. In
the longer-term, high severity disturbances reduce total ecosystem biomass and may temporarily
transition forests from C sink to source (Hicke et al., 2012). For example, at our site,
disturbances resulting in >60% tree mortality reduced productivity, but wood NPP was stable
prior to this threshold (Stuart-Haentjens et al., 2015, Gough et al., 2013). Also over the longer-
term, different disturbances have variable effects on canopy structure, with lasting effects on C
cycling trajectories (Atkins et al., 2019; Amiro et al., 2010; Hicke et al., 2012). For example,
gypsy moth defoliation reduced aboveground productivity for only a year, while emerald ash
borer mortality resulted in a recovery period of more than five years (Hicke et al., 2012; Amiro
et al., 2010; Cook et al., 2008). In contrast to studies focused on an annual time-step, no studies
have examined high frequency NPP changes that immediately follow disturbance and which may
be critical to shaping long-term trajectories of recovery (Atkins et al., in prep, Reyes &
Neeshaw, 2008; Flower & Gonzalez-Meler, 2015). Identifying the initial processes that

8
determine production stability or decline are essential to our understanding of forest C cycling
response to disturbance.
A suite of complementary mechanisms may stabilize aboveground wood NPP (ANPPw)
immediately following disturbance, before canopy defoliation and associated changes in the light
environment occur. While the sub-canopy responds to increased light availability in the long-
term, observations of stable ANPPw at our site prior to defoliation suggest other mechanisms
underlie initial stability (Stuart-Haentjens et al., 2015; Campbell et al., 2009; Gough et al., 2013).
Prior to changes in light, phloem disruption causes a cascade of changes aboveground that may
increase wood production above the injury. Photosynthesis continues in the canopy (Haber et al.,
in prep), but the flow of photosynthate to the roots is severed (Mei et al., 2014) resulting in an
accumulation of starch and carbohydrates aboveground (Regier et al., 2009). This surplus of C
may sustain or increase aboveground wood growth at the expense of belowground production
(Regier et al., 2009; Mei et al., 2014; Winkler & Oberhuber, 2017).
Following senescence, the redistribution of growth limiting resources such as water and nutrients
(Nave et al., 2011) may lead to the rapid compensatory growth by healthy trees (Flower et al.,
2013). Moreover, the redistribution of resources among plant functional types (PFT) may vary
depending on disturbance severity. Resource availability increases with disturbance severity
(Stuart-Haentjens et al., 2015; Fahey et al., 2015), thus high severity events that liberate a lot of
water and nutrients may favor fast-growing, early successional PFTs that are better adapted for
resource acquisition. The initial timing and contribution of senescent and healthy trees to ANPPw
following a phloem disrupting disturbance have not been described but filling this knowledge
gap is important to identifying the mechanisms that support C cycling stability before
deterioration of the canopy.
Using a landscape scale experiment, we characterized first-year daily and annual ANPPw
responses to increasing disturbance severity and two disturbance types concentrated in different
canopy strata. Our overarching goal was to identify the patterns and mechanisms underlying
immediate, high-frequency aboveground wood production responses to disturbance. We focus on
wood production because aboveground biomass makes up a substantial portion of forest C

9
stocks, and a deterioration of this pool could impact long term forest C cycling. With an
emphasis on first-year responses to disturbance, our objectives were to examine: daily and
annual ANPPw among disturbance severity levels and disturbance types (Obj. 1); the
contribution of healthy and senescent trees to total aboveground wood production (Obj. 2) and;
early and late successional PFT contributions to annual ANPPw as disturbance severity increases
(Obj. 3). We hypothesized that rapid compensatory growth by healthy trees would offset declines
in senescent trees such that total annual ANPPw would remain stable at or below a 60% tree
senescence threshold observed for our site (Stuart-Haentjens et al., 2015), while declining at
higher severity. We predicted that as pioneer species, early successional PFTs would benefit
most from high severity disturbance and contribute more to ANPPw above the 60% tree
senescence threshold.
Methods
Site Description
My research took place at the University of Michigan Biological Station (UMBS) (45°35’N
84°43’W) in northern Michigan. Like many present-day hardwood forests in the upper Midwest,
the 100-yr-old landscape of regrown forest is shifting from early successional aspen (Populus)
and birch (Betula) to middle successional canopy species (Gough et al., 2007). Specifically,
senescent bigtooth aspen (Populus grandiosa), paper birch (Betula papyrifera), and yellow birch
(Betula alleghaniensis) are being replaced by red oak (Quercus rubra), red maple (Acer rubrum),
and to a lesser extent, sugar maple (Acer saccharum), American beech (Fagus grandifolia), and
white pine (Pinus strobus). The subcanopy is dominated by red maple and red oak while
american beech, sugar maple, serviceberry (Amelanchier), white pine, red pine (Pinus resinosa),
striped maple (Acer pensylvanicum), and balsam fir (Abies balsamea) are also present.
In May of 2019, the Forest Resilience Threshold Experiment (FoRTE) experimentally created a
gradient of disturbance severity including 0%, 45%, 65%, or 85% gross leaf area loss induced by
a stem-girdling treatment. Four replicates containing each disturbance severity level (including a
control) were nested within separate forest types varying in species composition and site
productivity (Figure 4). Within each whole-plot (0.5ha) two subplots (0.1ha) were established

10
containing either: (1) a top-down, upper canopy disturbance in which trees were disturbed in
order from largest diameter (D) to smallest D and (2) a bottom up, lower canopy disturbance that
disturbs trees in order from smallest D to largest D.
Aboveground wood net primary production (ANPPw)
We derived daily aboveground wood net primary production (ANPPw) from repeated
measurements of canopy (≥ 8cm DBH) and subcanopy (1-8cm DBH) stem diameters (D), as
well as, seedling/sapling (< 1cm DBH) height (Gough et al., 2009). Beginning in Nov. 2018,
25% of canopy stems (~ 650 stems per severity) were surveyed for D using band dendrometers
placed at breast height. Pre-disturbance D was recorded in April 2019 before Spring growth and
weekly from May 2019 through August 2019, with final measurements in Nov. 2019. The
distribution of dendrometer bands was proportional to the number of girdled and ungirdled trees
within a subplot. To test for swelling above the girdle in senescent stems, a second band
dendrometer was placed approximately 50 cm above the original band on a subsample of stems -
- 5 senescent and 3 healthy per species -- spanning the most common canopy species present in
the experiment. Acer saccharum and Acer rubrum exhibited significant differences of 59 % and
76 %, respectively, in the D of upper and lower bands (P > 0.05). The percent difference between
upper and lower D locations was used to adjust D prior to calculating the species and D specific
relative growth rates (RGR). RGRs were used to estimate D growth of the unsampled population,
and we converted D growth to aboveground wood biomass accumulation with species and site
specific allometries.
For smaller subcanopy stems with D <8cm, I repeatedly sampled D in 2x2 m vegetation plots
from May 2019 to August 2019 using digital calipers. Where no subcanopy stems were present
in the vegetation plot, the two closest subcanopy stems to vegetation plot center were selected.
Subcanopy stem counts were conducted in one quarter (0.025 ha) of each subplot to estimate
stem density. Mean D increment for each subplot was multiplied by the total stem count of a
subplot to estimate growth of unsampled trees, and species and site specific allometries were
used to calculate biomass increments.

11
In June 2019 and again in August 2019, all seedlings and saplings within one quarter of the 2x2
m vegetation plots were sampled for base D, previous growing season height (brown and
woody), and present height (green and fleshy). Assuming conical shaped stems, stem volume
was calculated using geometric calculations and site- and species-specific wood densities were
applied to estimate wood biomass (Chave et al., 2009). Total (canopy + subcanopy +
seedling/sapling) ANPPw is the sum of wood biomass from all canopy strata scaled to the hectare
and converted to C mass by multiplying by a site specific carbon fraction of 0.48 (Gough, Vogel,
Schmid, Su, & Curtis, 2008).
Statistical Analysis
We used a time series blocking split-plot analysis of variance (ANOVA) model to analyze
differences in daily canopy ANPPw among disturbance severity and disturbance type treatments.
In this model, disturbance severity (fully randomized within replicates) was the whole-plot and
disturbance type (randomized within each whole-plot) was the split-plot. Because trees ≥8cm
constituted 95% of ANPPw and measurements of subcanopy and seedlings/saplings were less
frequent, we limited our analysis to canopy measurements. For comparisons of annual ANNPw, a
similar model, without time as a factor, was used to analyze differences among disturbance
severities, disturbance types and plant functional types (PFT). Pairwise comparisons of ANPPw
across time, disturbance severity, disturbance type, and PFT were performed using least squares
differences (LSD) (⍺= 0.05). Standard error was estimated from the variation around mean
ANPPw across replicates. Statistical analyses were performed in RStudio or SAS statistical
software (SAS Institute, Cary NC, USA).
Results
Daily ANPPw among disturbance types and severities
Significant differences in daily ANPPw emerged among disturbance severities during the second
half of the growing season, two months after disturbance occurred. Daily ANPPw reached a
maximum of ~ 40 kg C ha-1 d-1 during mid-July in all disturbance severity levels, after which
daily wood production was greater in the 65% and 85% disturbance severity treatments relative

12
to the control (Figure 1A, P < 0.0001). In contrast, the location of disturbance in the lower
(bottom-up) or upper (top-down) canopy strata had no effect on daily ANPPw (Figure 1B, ⍺ =
0.05).
Annual ANPPw and contributions from senescent and healthy trees
The continued growth of senescent trees sustained annual ANPPw following disturbance (Figure
2A), despite occasional differences in daily aboveground wood production (Figure 1A, P <
0.0001). Mean annual ANPPw was 2246 kg C ha-1 yr-1 and did not differ significantly among
disturbance severities or between disturbance types. The contribution from senescent trees to
annual ANPPw was proportional to targeted experimental disturbance severity levels, accounting
for 44%, 72%, and 82%, respectively (Figure 2A). Similarly, senescent trees in the bottom-up
and top-down disturbances accounted for 53% and 80% of annual ANPPw, respectively (Figure
2B, ⍺ = 0.05).
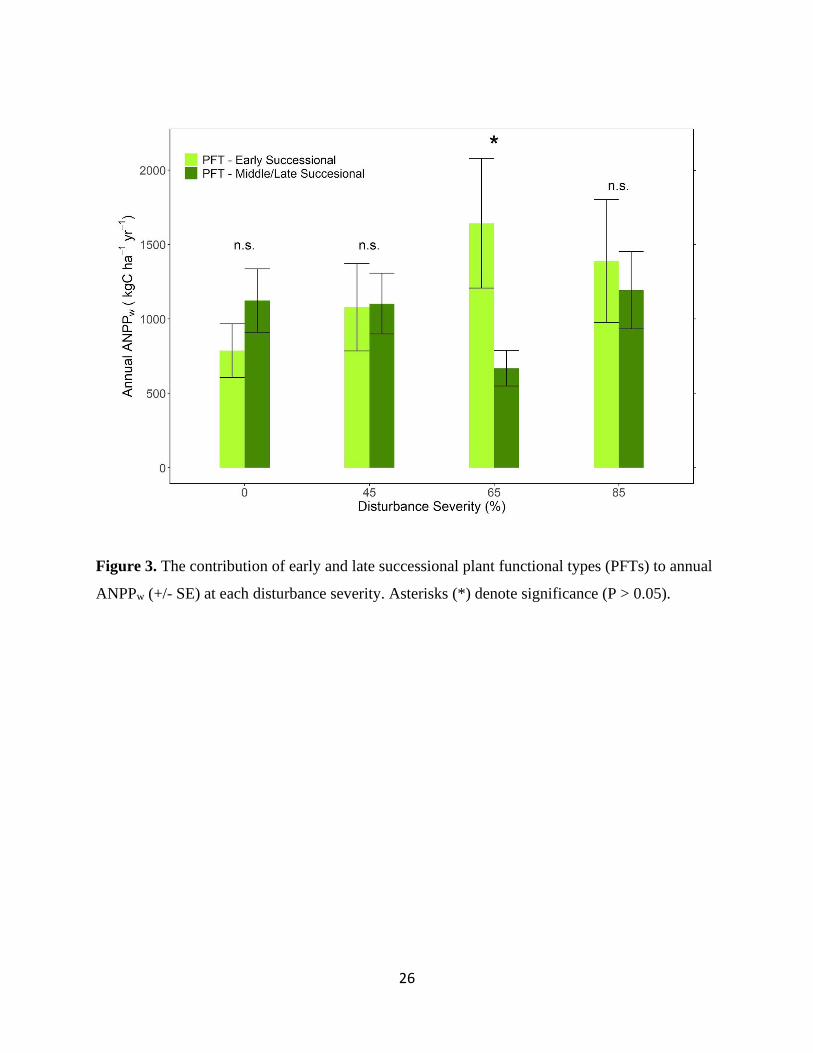
Plant functional type (PFT) and stem size class contributions to annual ANPPw
As disturbance severity increased, the contribution of the early successional plant functional
types (PFT) to annual ANPPw increased. Early and late successional PFTs contributed similarly
to annual ANPPw in the control, 45%, and 85%, but the early successional PFT accounted for
significantly more aboveground wood production at the 65% disturbance severity level
supplying 71% of annual ANPPw (Figure 3, P < 0.012). As with daily and annual ANPPw,
disturbance type did not affect PFT contributions to annual aboveground wood production (data
not shown, ⍺ = 0.05).
Among stem size classes, large (≥8 cm D) canopy trees were overwhelmingly the primary
constituents of annual ANPPw, regardless of disturbance severity and type. Large canopy trees
contributed >95 % of total annual ANPPw, with subcanopy (<8 cm D) and seedlings/saplings
supplying the remainder of aboveground wood production (Supp. Figure A).

13
Discussion
Contrary to our hypothesis, annual ANPPw in the first year after disturbance was sustained by the
growth of senescent rather than healthy trees, regardless of disturbance type or severity (Fig. 2A
& 2B). Anticipating a rapid resource redistribution from senescent to healthy trees, we expected
compensatory growth of healthy trees would offset declines in senescent tree productivity
(Flower et al., 2013; Nave et al., 2011; Veblen et al., 1991; Lewis et al., 2015). For example,
prior observations from our site revealed an increase in available nitrogen in the year after
disturbance (Nave et al. 2011). However, we observed no decline in senescent tree growth along
with parallel stability in leaf physiology and leaf area during the first growing season after
disturbance (Haber et al., in prep, Atkins et al., in prep). A similar trend of continued growth was
observed in an emerald ash borer impacted forest, where infested trees survived for 2-5 years
following initial infestation (Knight et al., 2008; Flower et al., 2013). Moreover, other studies
applying experimental girdling report continued aboveground wood growth and photosynthesis,
along with high survival during the first year of disturbance (Fajstavr et al., 2017; Regier et al.,
2010; Mei et al., 2014).
With stable leaf physiology and leaf area immediately after disturbance, higher late-season daily
ANPPw in the middle and high severity (>65%) disturbance treatments suggests an accumulation
of C above the disrupted phloem. When phloem is severed, the transport of new photosynthate to
the roots is eliminated and, instead, retained aboveground (Winkler and Oberhuber, 2017). Our
results are consistent with girdling experiments that show increased wood production and an
accumulation of carbohydrates above the girdle (Winkler and Oberhuber, 2017; Fajstavr et al.,
2017; Regier et al., 2010; Mei et al., 2014). For example, in girdled Norway spruce (Picea
abies), an accumulation of carbohydrates above the girdle promoted radial stem growth (Winkler
and Oberhuber, 2017). In contrast, cambial cell production below the girdle ceased immediately
following disturbance in Scots pine (Pinus sylvestris) (Fajstavr et al., 2017), and the depletion of
root carbohydrate pools was observed in ash (Fraxinus mandshurica) (Mei et al., 2014). It is
understood that girdling increases aboveground C accumulation at the expense of belowground
growth, but the specifics of C allocation to the stem or shoots is not well understood. Further,
while sustained leaf physiological competency in senescent trees may have supported
14
aboveground wood production immediately following disturbance, we expect a deterioration of
the canopy in subsequent years will lead to declining wood productivity and eventual mortality.
Our findings provide limited support for the hypothesis that early successional plant functional
types (PFT) contribute more to ANPPw than late successional PFTs at higher disturbance
severities. At our site, the early successional PFT primarily consists of mature aspen (Populus
spp.) that thrive following severe disturbance (Caspersen & Pacala, 2001). Stand replacing
disturbances that result in an abrupt increase in available resources -- light, nitrogen (N), water --
favor fast-growing, early successional species that are adapted for opportunistic resource
acquisition (Bormann & Likens, 1979; Curtis et al., 2000; Foster et al., 1997). While stable leaf
area during the first year suggests light distribution was unchanged, disturbance rapidly increases
nutrient availability at our site, particularly at higher disturbance severities (White et al., 2004,
Nave et al. 2011). Apart from resource redistribution, an increase in early successional PFT
contributions to ANPPw within rising disturbance severity may be driven by interactions between
severity, stem size distribution, and growth. Relative to the disturbance in the lower canopy
strata, we found a larger contribution to ANPPw by senescent trees in the upper canopy
disturbance that targeted large D trees (Figure 2B) suggesting contributions to ANPPw increase
with tree D (Flower et al., 2013; Bruhn et al., 2000) which is not independent of PFT at our site.
With little change in upper canopy leaf area, we found the subcanopy (D<8cm) was not
significant to stabilizing aboveground wood production in the first growing season after
disturbance. When defoliation-driven changes in the light environment are substantial, the
subcanopy at our site is nearly half of aboveground production (Fahey et al., 2015; Stuart-
Haentjens et al., 2015); conversely, the subcanopy contributes only ~5% to ANPPw (Fahey et al.,
2015) in closed canopy forests at our site, which is consistent with our findings (Figure A). In the
first year of disturbance, senescent trees retained their leaves, which likely corresponded with
similarly nominal changes in the subcanopy light environment. Consistent with our observations
of growth, subcanopy photosynthetic activity and leaf chemistry did not change in the first
growing season following disturbance (Haber et al., in prep). Although the subcanopy
contributed minimally to ANPPw in the first year of disturbance, we expect the contribution of

15
this canopy strata to increase over time and in the higher disturbance severities as senescent tree
crowns deteriorate (Stuart-Haentjens et al., 2015; Fahey et al., 2015).
Several caveats and limitations emerged when estimating ecosystem NPP from biometric
measures of girdled trees. Despite adjusting our stem increments and ANPPw derivations to
account for swelling above the girdle of senescent trees, the allometries used to estimate wood
biomass were developed from the dimensions of healthy trees and may not apply perfectly to
senescent trees. The disrupted flow of C from the shoots to the roots associated with phloem
damage is apparent, but less is known about the initial aboveground distribution of structural C
or wood growth. A healthy tree allocates most biomass to the stem, followed by branches and
roots (Würth et al., 2005; Zheng et al., 2006; Poorter et al., 2012). As we observed, sustained or
increased radial growth in the stem of girdled trees is common (Winkler and Oberhuber, 2017;
Fajstavr et al., 2017). Similarly, concentrations of carbohydrates in the leaves of girdled trees
have been shown to remain stable or increase slightly (Mei et., al 2014), suggesting aboveground
C is not accumulating only in the stem, and is instead distributed similarly to a healthy tree.
Without empirical evidence for aboveground growth distribution, however, further examination
of allometric relationships of girdled trees is warranted to ensure accurate estimations of
ecosystem productivity from biometric measures.
Conclusion
We conclude from our results that the mechanism supporting initial aboveground wood NPP
following disturbance is continued growth of senescent trees. While stable NPP following
moderate severity disturbance was previously observed at our site (Gough et al., 2013), we
expected declines in ecosystem production to emerge in the first year past a 60% disturbance
severity threshold (Stuart-Haentjens et al., 2015). Shifting within tree C allocation of senescent
trees however, supported aboveground production stability regardless of disturbance type or
severity. Reflected by significantly lower soil C efflux in disturbed forests at our site (Mathes et
al., in prep), continued aboveground growth came at the cost of belowground productivity.
Aboveground wood accounts for less than half of forest C storage (Gough et al., 2008), thus
further investigation of above- and belowground C fluxes is needed to quantify total forest C
uptake immediately after disturbance.

16
Our work is essential to understanding the short-term impacts of disturbance that may have long-
term implications for the C cycling trajectory of northern temperate forests. While this study
provides important insight to the mechanisms behind immediate production stability after
disturbance, ongoing changes among live and eventual mortality among senescent trees of all
canopy strata and PFTs warrant continued monitoring of disturbed forests at our site. Further,
future work could help unravel the PFT and species-specific growth responses and investigate
belowground resource redistribution with implications for ecosystem NPP stability.
References
Allen, C. D., Macalady, A. K., Chenchouni, H., Bachelet, D., McDowell, N., Vennetier, M.,
Kitzberger, T., Rigling, A., Breshears, D. D., Hogg, E. H. (Ted), Gonzalez, P., Fensham,
R., Zhang, Z., Castro, J., Demidova, N., Lim, J.-H., Allard, G., Running, S. W., Semerci,
A., & Cobb, N. (2010). A global overview of drought and heat-induced tree mortality
reveals emerging climate change risks for forests. Forest Ecology and Management,
259(4), 660–684. https://doi.org/10.1016/j.foreco.2009.09.001
Amiro, B. D., Barr, A. G., Barr, J. G., Black, T. A., Bracho, R., Brown, M., Chen, J., Clark, K.
L., Davis, K. J., Desai, A. R., Dore, S., Engel, V., Fuentes, J. D., Goldstein, A. H., Goulden,
M. L., Kolb, T. E., Lavigne, M. B., Law, B. E., Margolis, H. A., … Xiao, J. (2010).
Ecosystem carbon dioxide fluxes after disturbance in forests of North America. Journal of
Geophysical Research: Biogeosciences, 115(G4). https://doi.org/10.1029/2010JG001390
Atkins, J. W., Bond-Lamberty, B., Fahey, R. T., Hardiman, B. S., Haber, L., Stuart-Haëntjens,
E., LaRue, E., McNeil, B., Orwig, D. A., Stovall, A. E. S., Tallant, J., Walter, J. A., &
Gough, C. M. (2019). Multidimensional Structural Characterization is Required to Detect
and Differentiate Among Moderate Disturbance Agents.
https://doi.org/10.20944/preprints201911.0082.v1
Atkins, J. W. (2020). [Canopy Structural Complexity in the First Year After Disturbance].
Unpublished raw data.

17
Birdsey, R., Pregitzer, K., & Lucier, A. (2006). Forest Carbon Management in the United States.
Journal of Environmental Quality, 35(4), 1461–1469. https://doi.org/10.2134/jeq2005.0162
Bormann, F. H., & Likens, G. E. (1979). Catastrophic Disturbance and the Steady State in
Northern Hardwood Forests: A new look at the role of disturbance in the development of
forest ecosystems suggests important implications for land-use policies. American Scientist,
67(6), 660–669. JSTOR.
Bruhn, D., Leverenz, J. W., & Saxe, H. (2000). Effects of tree size and temperature on relative
growth rate and its components of Fagus sylvatica seedlings exposed to two partial
pressures of atmospheric [CO2]. New Phytologist, 146(3), 415–425.
https://doi.org/10.1046/j.1469-8137.2000.00661.x
Campbell, J., Alberti, G., Martin, J., & Law, B. E. (2009). Carbon dynamics of a ponderosa pine
plantation following a thinning treatment in the northern Sierra Nevada. Forest Ecology and
Management, 257(2), 453–463. https://doi.org/10.1016/j.foreco.2008.09.021
Caspersen, J. P., & Pacala, S. W. (2001). Successional diversity and forest ecosystem function.
Ecological Research, 16(5), 895–903. https://doi.org/10.1046/j.1440-1703.2001.00455.x
Chave, J., Coomes, D., Jansen, S., Lewis, S. L., Swenson, N. G., & Zanne, A. E. (2009).
Towards a worldwide wood economics spectrum. Ecology Letters, 12(4), 351–366.
https://doi.org/10.1111/j.1461-0248.2009.01285.x
Curtis, P. S., Vogel, C. S., Wang, X., Pregitzer, K. S., Zak, D. R., Lussenhop, J., Kubiske, M., &
Teeri, J. A. (2000). Gas Exchange, Leaf Nitrogen, and Growth Efficiency of Populus
Tremuloides in a Co2-Enriched Atmosphere. Ecological Applications, 10(1), 3–17.
https://doi.org/10.1890/1051-0761(2000)010[0003:GELNAG]2.0.CO;2
Dale, V. H., Joyce, L. A., McNulty, S., Neilson, R. P., Ayres, M. P., Flannigan, M. D., Hanson,
P. J., Irland, L. C., Lugo, A. E., Peterson, C. J., Simberloff, D., Swanson, F. J., Stocks, B. J.,
& Wotton, B. M. (2001). Climate Change and Forest DisturbancesClimate change can affect
forests by altering the frequency, intensity, duration, and timing of fire, drought, introduced
species, insect and pathogen outbreaks, hurricanes, windstorms, ice storms, or landslides.
BioScience, 51(9), 723–734. https://doi.org/10.1641/0006-
3568(2001)051[0723:CCAFD]2.0.CO;2

18
Dietze, M. C., & Matthes, J. H. (2014). A general ecophysiological framework for modelling the
impact of pests and pathogens on forest ecosystems. Ecology Letters, 17(11), 1418–1426.
https://doi.org/10.1111/ele.12345
Elkinton, J. S., & Liebhold, A. M. (1990). Population Dynamics of Gypsy Moth in North
America. Annual Review of Entomology, 35(1), 571–596.
https://doi.org/10.1146/annurev.en.35.010190.003035
Fahey, R. T., Stuart-Haëntjens, E. J., Gough, C. M., De La Cruz, A., Stockton, E., Vogel, C. S.,
& Curtis, P. S. (2016). Evaluating forest subcanopy response to moderate severity
disturbance and contribution to ecosystem-level productivity and resilience. Forest Ecology
and Management, 376, 135–147. https://doi.org/10.1016/j.foreco.2016.06.001
Fajstavr, M., Giagli, K., Vavrčík, H., Gryc, V., & Urban, J. (2017a). The effect of stem girdling
on xylem and phloem formation in Scots pine. Silva Fennica, 51(4).
https://doi.org/10.14214/sf.1760
Fajstavr, M., Giagli, K., Vavrčík, H., Gryc, V., & Urban, J. (2017b). The effect of stem girdling
on xylem and phloem formation in Scots pine. Silva Fennica, 51(4).
https://doi.org/10.14214/sf.1760
Flower, C. E., & Gonzalez-Meler, M. A. (2015). Responses of Temperate Forest Productivity to
Insect and Pathogen Disturbances. Annual Review of Plant Biology, 66(1), 547–569.
https://doi.org/10.1146/annurev-arplant-043014-115540
Flower, C. E., Knight, K. S., & Gonzalez-Meler, M. A. (2013). Impacts of the emerald ash borer
(Agrilus planipennis Fairmaire) induced ash (Fraxinus spp.) mortality on forest carbon
cycling and successional dynamics in the eastern United States. Biological Invasions, 15(4),
931–944. https://doi.org/10.1007/s10530-012-0341-7
Foster, D. R., Aber, J. D., Melillo, J. M., Bowden, R. D., & Bazzaz, F. A. (1997). Forest
Response to Disturbance and Anthropogenic Stress. BioScience, 47(7), 437–445. JSTOR.
https://doi.org/10.2307/1313059

19
Gough, C. M., Flower, C. E., Vogel, C. S., Dragoni, D., & Curtis, P. S. (2009). Whole-ecosystem
labile carbon production in a north temperate deciduous forest. Agricultural and Forest
Meteorology, 149(9), 1531–1540. https://doi.org/10.1016/j.agrformet.2009.04.006
Gough, C. M., Hardiman, B. S., Nave, L. E., Bohrer, G., Maurer, K. D., Vogel, C. S.,
Nadelhoffer, K. J., & Curtis, P. S. (2013). Sustained carbon uptake and storage following
moderate disturbance in a Great Lakes forest. Ecological Applications, 23(5), 1202–1215.
https://doi.org/10.1890/12-1554.1
Gough, C. M., Vogel, C. S., Hardiman, B., & Curtis, P. S. (2010). Wood net primary production
resilience in an unmanaged forest transitioning from early to middle succession. Forest
Ecology and Management, 260(1), 36–41. https://doi.org/10.1016/j.foreco.2010.03.027
Gough, C. M., Vogel, C. S., Schmid, H. P., & Curtis, P. S. (2008). Controls on Annual Forest
Carbon Storage: Lessons from the Past and Predictions for the Future. BioScience, 58(7),
609–622. https://doi.org/10.1641/B580708
Haber, L. (2020). [Leaf Physiological Response to Disturbance in the First Year After
Disturbance]. Unpublished raw data.
Hicke, J. A., Meddens, A. J. H., Allen, C. D., & Kolden, C. A. (2013). Carbon stocks of trees
killed by bark beetles and wildfire in the western United States. Environmental Research
Letters, 8(3), 035032. https://doi.org/10.1088/1748-9326/8/3/035032
Kautz, M., Anthoni, P., Meddens, A. J. H., Pugh, T. A. M., & Arneth, A. (2018). Simulating the
recent impacts of multiple biotic disturbances on forest carbon cycling across the United
States. Global Change Biology, 24(5), 2079–2092. https://doi.org/10.1111/gcb.13974
Kautz, M., Meddens, A. J. H., Hall, R. J., & Arneth, A. (2017). Biotic disturbances in Northern
Hemisphere forests – a synthesis of recent data, uncertainties and implications for forest
monitoring and modelling. Global Ecology and Biogeography, 26(5), 533–552.
https://doi.org/10.1111/geb.12558
Knight KS, Long RP, Rebbeck J, Smith A, Gandhi K, Herms DA (2008). How fast will trees
die? A transition matrix model of ash decline in forest stands infested by emerald ash borer.
In: Mastro V, Reardon R, Parra G (eds) Proceedings of the emerald ash borer research and
20
technology development meeting; 2007 October 23–4; Pittsburgh. FHTET 2008–2007.
Morgantown, WV: US Forest Service, Forest Health Technology Enterprise Team, pp 29–
30
Lewis, K. J., Thompson, R. D., & Trummer, L. (2005). Growth response of spruce infected by
Inonotus tomentosus in Alaska and interactions with spruce beetle. Canadian Journal of
Forest Research, 35(6), 1455–1463. https://doi.org/10.1139/x05-081
Mathes, K. (2020). Thresholds of soil respiration stability across a disturbance severity gradient.
Unpublished mnuscript.
Mei, L., Xiong, Y., Gu, J., Wang, Z., & Guo, D. (2015). Whole-tree dynamics of non-structural
carbohydrate and nitrogen pools across different seasons and in response to girdling in two
temperate trees. Oecologia, 177(2), 333–344. JSTOR.
Nave, L. E., Gough, C. M., Maurer, K. D., Bohrer, G., Hardiman, B. S., Moine, J. L., Munoz, A.
B., Nadelhoffer, K. J., Sparks, J. P., Strahm, B. D., Vogel, C. S., & Curtis, P. S. (2011).
Disturbance and the resilience of coupled carbon and nitrogen cycling in a north temperate
forest. Journal of Geophysical Research: Biogeosciences, 116(G4).
https://doi.org/10.1029/2011JG001758
Poorter, H., Niklas, K. J., Reich, P. B., Oleksyn, J., Poot, P., & Mommer, L. (2012). Biomass
allocation to leaves, stems and roots: Meta-analyses of interspecific variation and
environmental control. New Phytologist, 193(1), 30–50. https://doi.org/10.1111/j.1469-
8137.2011.03952.x
Pregitzer, K. S., & Euskirchen, E. S. (2004). Carbon cycling and storage in world forests: Biome
patterns related to forest age. Global Change Biology, 10(12), 2052–2077.
https://doi.org/10.1111/j.1365-2486.2004.00866.x
Regier, N., Streb, S., Zeeman, S. C., & Frey, B. (2010). Seasonal changes in starch and sugar
content of poplar (Populus deltoides × nigra cv. Dorskamp) and the impact of stem girdling
on carbohydrate allocation to roots. Tree Physiology, 30(8), 979–987.
https://doi.org/10.1093/treephys/tpq047

21
REYES, G. P., & KNEESHAW, D. (2008). Moderate-severity disturbance dynamics in Abies
balsamea-Betula spp. forests: The relative importance of disturbance type and local stand
and site characteristics on woody vegetation response. Écoscience, 15(2), 241–249. JSTOR.
Rocha, A. V., & Goulden, M. L. (2008). Large interannual CO2 and energy exchange variability
in a freshwater marsh under consistent environmental conditions. Journal of Geophysical
Research: Biogeosciences, 113(G4). https://doi.org/10.1029/2008JG000712
Seidl, R., Thom, D., Kautz, M., Martin-Benito, D., Peltoniemi, M., Vacchiano, G., Wild, J.,
Ascoli, D., Petr, M., Honkaniemi, J., Lexer, M. J., Trotsiuk, V., Mairota, P., Svoboda, M.,
Fabrika, M., Nagel, T. A., & Reyer, C. P. O. (2017). Forest disturbances under climate
change. Nature Climate Change, 7(6), 395–402. https://doi.org/10.1038/nclimate3303
Sommerfeld, A., Senf, C., Buma, B., D’Amato, A. W., Després, T., Díaz-Hormazábal, I., Fraver,
S., Frelich, L. E., Gutiérrez, Á. G., Hart, S. J., Harvey, B. J., He, H. S., Hlásny, T., Holz, A.,
Kitzberger, T., Kulakowski, D., Lindenmayer, D., Mori, A. S., Müller, J., … Seidl, R.
(2018). Patterns and drivers of recent disturbances across the temperate forest biome. Nature
Communications, 9(1), 1–9. https://doi.org/10.1038/s41467-018-06788-9
Stuart-Haëntjens, E. J., Curtis, P. S., Fahey, R. T., Vogel, C. S., & Gough, C. M. (2015). Net
primary production of a temperate deciduous forest exhibits a threshold response to
increasing disturbance severity. Ecology, 96(9), 2478–2487. https://doi.org/10.1890/14-
1810.1
USGCRP, 2018: Second State of the Carbon Cycle Report (SOCCR2): A Sustained Assessment
Report. [Cavallaro, N., G. Shrestha, R. Birdsey, M. A. Mayes, R. G. Najjar, S. C. Reed, P.
Romero-Lankao, and Z. Zhu (eds.)]. U.S. Global Change Research Program, Washington,
DC, USA, 878 pp.
Veblen, T. T., Hadley, K. S., Reid, M. S., & Rebertus, A. J. (1991). The Response of Subalpine
Forests to Spruce Beetle Outbreak in Colorado. Ecology, 72(1), 213–231.
https://doi.org/10.2307/1938916

22
White, L. L., Zak, D. R., & Barnes, B. V. (2004). Biomass accumulation and soil nitrogen
availability in an 87-year-old Populus grandidentata chronosequence. Forest Ecology and
Management, 191(1), 121–127. https://doi.org/10.1016/j.foreco.2003.11.010
Williams, C. A., Collatz, G. J., Masek, J., & Goward, S. N. (2012). Carbon consequences of
forest disturbance and recovery across the conterminous United States: FOREST
DISTURBANCE AND CARBON DYNAMICS. Global Biogeochemical Cycles, 26(1), n/a-
n/a. https://doi.org/10.1029/2010GB003947
Williams, C. A., Gu, H., MacLean, R., Masek, J. G., & Collatz, G. J. (2016). Disturbance and the
carbon balance of US forests: A quantitative review of impacts from harvests, fires, insects,
and droughts. Global and Planetary Change, 143, 66–80.
https://doi.org/10.1016/j.gloplacha.2016.06.002
Winkler, A., & Oberhuber, W. (2017). Cambial response of Norway spruce to modified carbon
availability by phloem girdling. Tree Physiology, 37(11), 1527–1535.
https://doi.org/10.1093/treephys/tpx077
Würth, M. K. R., Peláez-Riedl, S., Wright, S. Joseph., & Körner, C. (2005). Non-Structural
Carbohydrate Pools in a Tropical Forest. Oecologia, 143(1), 11–24. JSTOR.
Zheng, Z., Feng, Z., Cao, M., Li, Z., & Zhang, J. (2006). Forest Structure and Biomass of a
Tropical Seasonal Rain Forest in Xishuangbanna, Southwest China1. Biotropica, 38(3),
318–327. https://doi.org/10.1111/j.1744-7429.2006.00148.x
23
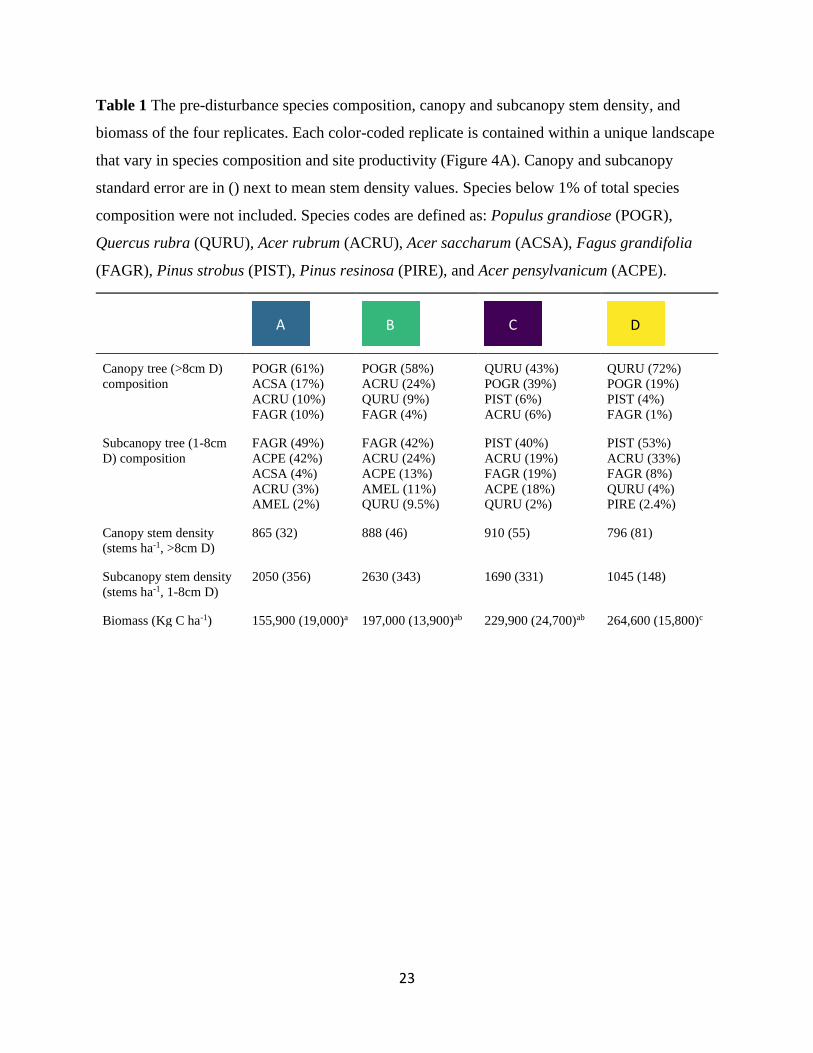
Table 1 The pre-disturbance species composition, canopy and subcanopy stem density, and
biomass of the four replicates. Each color-coded replicate is contained within a unique landscape
that vary in species composition and site productivity (Figure 4A). Canopy and subcanopy
standard error are in () next to mean stem density values. Species below 1% of total species
composition were not included. Species codes are defined as: Populus grandiose (POGR),
Quercus rubra (QURU), Acer rubrum (ACRU), Acer saccharum (ACSA), Fagus grandifolia
(FAGR), Pinus strobus (PIST), Pinus resinosa (PIRE), and Acer pensylvanicum (ACPE).
Canopy tree (>8cm D)
composition
POGR (61%)
ACSA (17%)
ACRU (10%)
FAGR (10%)
POGR (58%)
ACRU (24%)
QURU (9%)
FAGR (4%)
QURU (43%)
POGR (39%)
PIST (6%)
ACRU (6%)
QURU (72%)
POGR (19%)
PIST (4%)
FAGR (1%)
Subcanopy tree (1-8cm
D) composition
FAGR (49%)
ACPE (42%)
ACSA (4%)
ACRU (3%)
AMEL (2%)
FAGR (42%)
ACRU (24%)
ACPE (13%)
AMEL (11%)
QURU (9.5%)
PIST (40%)
ACRU (19%)
FAGR (19%)
ACPE (18%)
QURU (2%)
PIST (53%)
ACRU (33%)
FAGR (8%)
QURU (4%)
PIRE (2.4%)
Canopy stem density
(stems ha-1, >8cm D)
865 (32) 888 (46) 910 (55) 796 (81)
Subcanopy stem density
(stems ha-1, 1-8cm D)
2050 (356) 2630 (343) 1690 (331) 1045 (148)
Biomass (Kg C ha-1) 155,900 (19,000)a 197,000 (13,900)ab 229,900 (24,700)ab 264,600 (15,800)c
A B C D

24
Figure 1. Daily ANPPw (+/- SE) by disturbance severity treatment (A) and disturbance type (B)
in the first year after disturbance. The vertical dashed line represents the time of disturbance.
Asterisks denote dates for which the 85% disturbance severity significantly (P > 0.05) differs
from the control.

25
Figure 2. Contributions of senescent and healthy trees to total annual ANPPw (+/- SE) among
disturbance severities (A) and types (B).
26
Figure 3. The contribution of early and late successional plant functional types (PFTs) to annual
ANPPw (+/- SE) at each disturbance severity. Asterisks (*) denote significance (P > 0.05).

27
Figure 4 Replicate distribution (A) and split-plot experimental design (B) of the Forest
Resilience Threshold Experiment (FoRTE). Replicates are distributed across unique soil and
vegetation types common to the region. Distinct landscape types are distinguished by color (A)
and match the colors designated to the replicates in Table 1. Each replicate contains four whole
plots with the suite of disturbance severities (0, 45, 65, and 85% gross defoliation) (A) all of
which are split by disturbance type (top-down or bottom-up) (B). 2x2 vegetation plots were used
for subcanopy ANPPw sampling.

28
Appendices
Table A Blocking split-plot analysis of variance for the main effects of replicate, disturbance
severity, time (week), and disturbance type on the daily ANPPw. The week and disturbance type
main effects and the interaction terms time(week)*disturbance severity and
time(week)*disturbance type were tested against error terms with restrictions on randomization
resulting from the split-plot experimental design. Restricted error terms are defined in (). The
main effects replicate and disturbance severity were tested against the residual error.
Source DF Type I SS MS F ratio p value
Replicate 3 3018.17262 1006.05754 15.55 <.0001
Disturbance Severity 3 1239.83753 413.27918 6.39 0.0004
Week 15 66281.10295 4418.74020 68.28 <.0001
Error (rep*week) 45 8930.40408 198.45342
Disturbance Type 1 2.92377 2.92377 0.05 0.8319
Error (rep*type) 3 2773.86268 924.62089
Week*Severity 45 8067.68524 179.28189 2.77 <.0001
Error (rep*week*severity) 144 22019.00111 152.90973
Week*Type 15 598.90131 39.92675 0.62 0.8591
Error (rep*week*type) 45 2845.64444 63.23654
Residual Error 192 12425.9053 64.7183

29
Table B Blocking split-plot analysis of variance for the main effects of replicate, disturbance
severity, plant functional type (PFT) and disturbance type on the annual ANPPw. The main
effects of PFT and disturbance type, as well as, the interaction terms of PFT*disturbance severity
and PFT*disturbance type, were tested against error terms with restrictions on randomization
resulting from the split-plot experimental design. Restricted error terms are defined in (). The
main effects replicate and disturbance severity were tested against the residual error.
Source DF Type I SS MS F ratio p value
Replicate 3 1540443.89 513481.30 1.91 0.1547
Disturbance Severity 3 938257.92 312752.64 1.16 0.3440
PFT 1 653425.42 653425.42 2.43 0.1320
Error (replicate*PFT) 3 7670539.30 2556846.43
Disturbance Type 1 0.14 0.14 0.00 0.9994
Error (replicate*type) 3 1845505.78 615168.59
PFT*Disturbance Severity 3 3751594.03 1250531.34 4.65 0.0106
Error (replicate*PFT*severity) 18 17217244.31 956513.57
PFT*Disturbance Type 1 236936.14 236936.14 0.88 0.3571
Error (replicate*PFT*type) 3 1338193.84 446064.61
Residual Error 24 6448355.10 268681.46

30
Figure A. A pairwise comparison of annual ANPPw (+/- SE) in the first year of disturbance.
Letters (a) represent no significant (P > 0.05) difference in annual ANPPw among disturbance
severities. Standard error is the variation around the mean annual ANPPw across subplots.