Watershed-based design of stormwater treatment facilities: model ...

7/8/2018
Virginia Beach Stormwater
Master Plan ModelModel Content and Application Technical Guidance

Meeting Outline
� Introduction
� Overview
� Source data and datum
� Methodology
� Hydrology
� Hydraulics
� Boundary conditions
� Model validation
� Master plan model application
� Master plan model application
� Master plan model limitations
� Examples
2
City
Watersheds
and Model
Status
3

City Watersheds and Model Status
4

Model Software
5
Storm Water Management Model (SWMM)
Computational Hydraulics International

Model Resolution
Primary stormwater management system (PSMS):
� Open channels and pipes 24-inch diameter and larger
� Stormwater Management Facilities (SWMF)
� Overland flow paths
� 2-D modeling where applicable
� Based on Public Works Stormwater Infrastructure GIS
� Models continue downstream to MS4 outfall and/or tidal boundary condition
� North American Vertical Datum of 1988 (NAVD 88)
� Included conversions from NGVD 1929 and NGVD 1929 with 1972 adjustment
6

Methodology

Hydrology
� Subbasin Geometry
� Boundaries (DEM/contour lines/sewer network)
� Flow width (Area weighted)
� Slope
� Area
� Outlet
Outlet
Subcatchment
Boundary
8

Hydrology
Lx: Flow path length
Sx: Flow path slope
Wx: Flow path width
Flow Width (three-path approach)
9

Hydrology
� Subbasin Runoff Parameters (Landuse)
� Impervious area
� Surface runoff roughness (Manning’s
Roughness Coefficient)
� Initial abstraction (Depression storage)
� Subarea routing (Impervious pervious OR
pervious impervious)
� Percent routed between subareas
� Flow routing method (Kinematic/Dynamic
Wave)
10

Hydrology (Rainfall Patterns and Inputs)
� Historical rainfall (Rain gauge data) for model calibration
� Design storm rainfall for master plan simulations
� NOAA Atlas 14 Type C
� One set of rainfall hyetographs for the entire City
� Rainfall depth
� Based on values at the Centroid of the City (Watershed 6)
� Temporal pattern
� Based on shape of 25-year rainfall hyetograph
11

Hydrology (Rainfall Patterns and Inputs)
0.000
0.200
0.400
0.600
0.800
1.000
1.200
1.400
1.600
660 670 680 690 700 710 720 730 740 750 760 770 780
Inte
nsi
ty (
in/h
ou
r)
Time (min)
25 Year
Type C
Averaged
Type II
NOAA Atlas 14 Type C Hyetograph
12

Hydrology (Rainfall Patterns and Inputs)
13

Hydrology
� Infiltration (Soil)
� Modified Green-Ampt infiltration
� Suction Head
� Conductivity
� Initial Deficit
(Rainfall depth)
(Depression storage)
INFILTRATION (MODIFIED GREEN-AMPT)
14
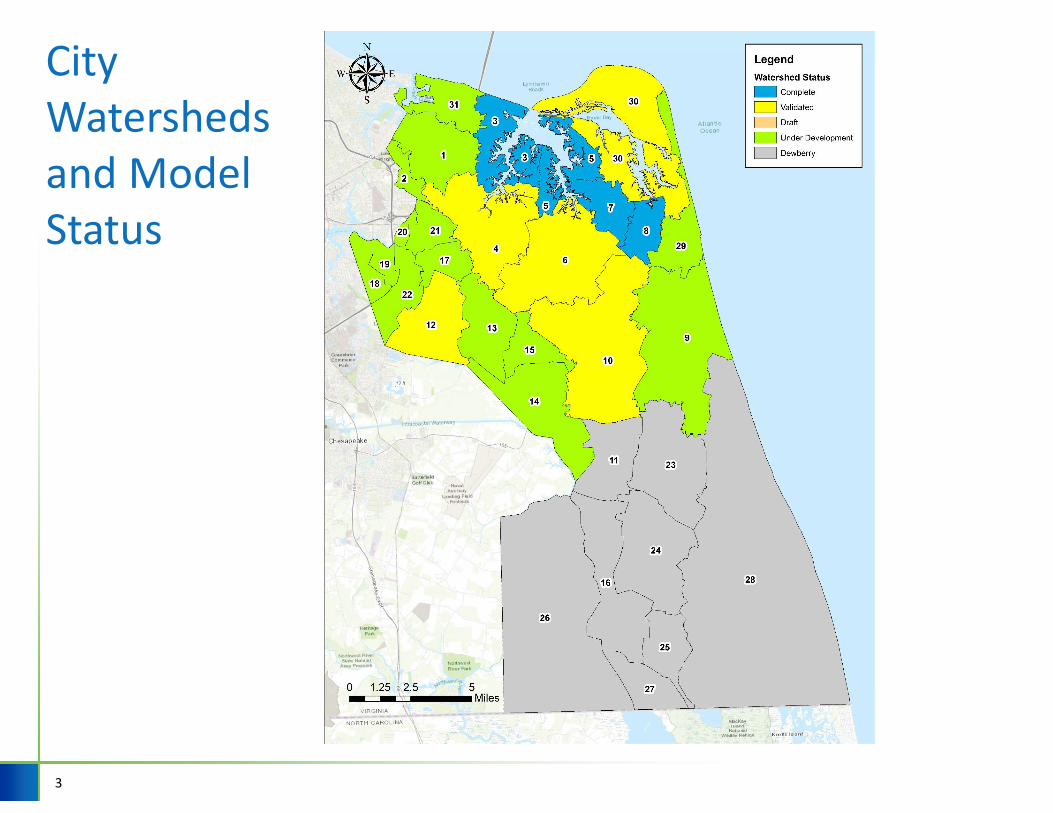
Hydraulics (View in PCSWMM)
15
Outfall
Subbasin load point
(storage node)
Junction node
Overflow conduit
Irregular conduit
(channel)
Conduit (pipe)
Subbasin

Hydraulics (2-D Area)
16
2D Grid

Hydraulics (2-D Area)
17
Dense 2D Grid
along roads

Hydraulics (Lake and SMF Example)
18
Lake Trashmore
(storage)
Pipe Length:
147 ft
Model Schematic
Length: 660 ft
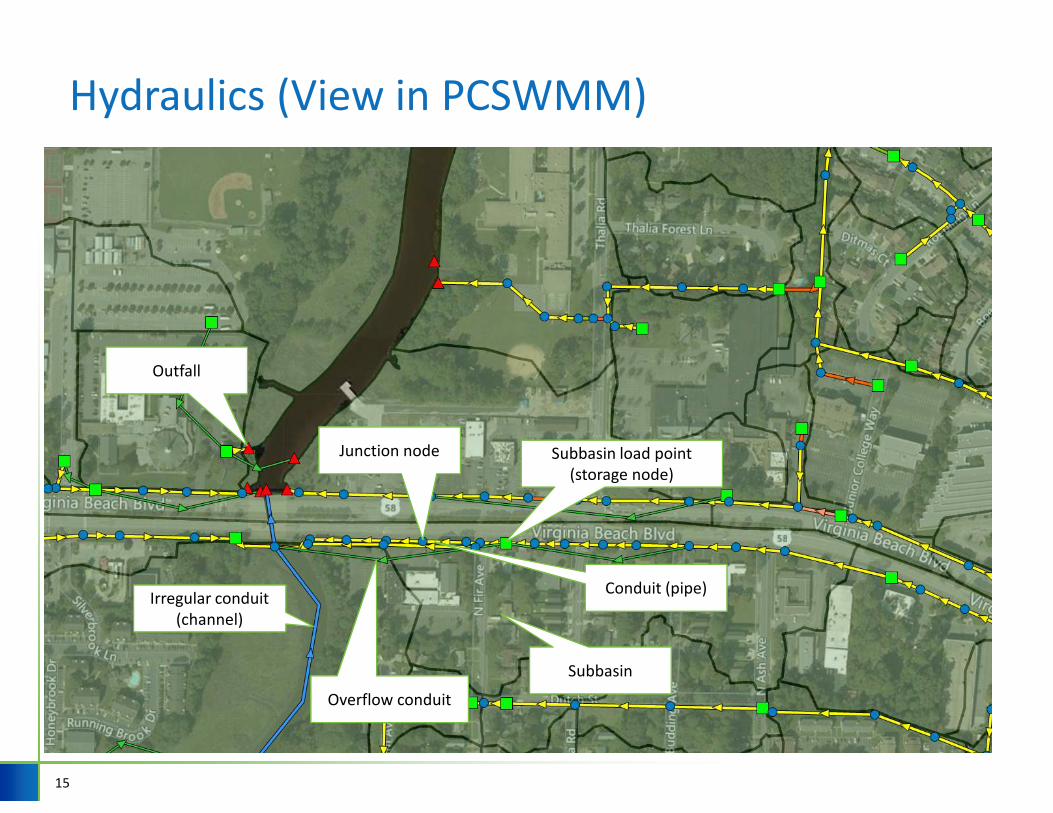
Hydraulics – Stage Area Relationships
� Conveyance system storage: Stage-area-storage in open (irregular) conduits
� Surface storage at storage nodes: stage-storage area relationships computed from topography (LiDAR and GIS)
� Approach foundation: No double-counting surface area and conveyance system storage
19
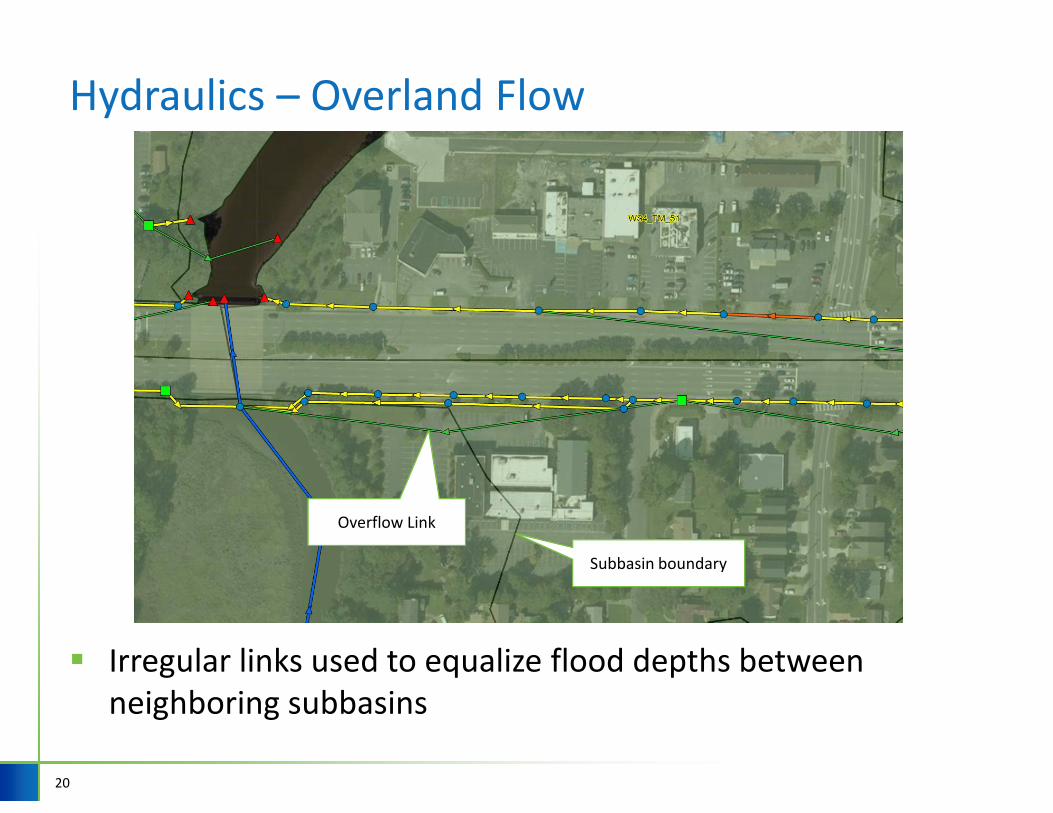
Hydraulics – Overland Flow
20
Overflow Link
Subbasin boundary
� Irregular links used to equalize flood depths between
neighboring subbasins

Hydraulics – Overflow links
21
� Link transect computed from topography (LiDAR and GIS)

Storage Node
04520-460
Storage Node
04520-460
Model Representation of Rim
22
� Ground Elevation at 04520-460 : 7.1 ft NAVD 88
� Model rim: 17.1 ft

Model Validation
� Historical rainfall events
based on flood call history
� Observed and field
surveyed high water
elevations from 2016
� 10-year event profile
compared with VDOT
hydraulic grade line
calculation
23

Coordination and References
Section 2 Model Approach
NEEDED: Pictures to Update the City’s Master Drainage Plans
� https://www.vbgov.com/government/departments/public-
works/storm-water/Pages/storm-pics-master-drain-plan-6-8-
17.aspx
Comprehensive Sea Level Rise
� https://www.vbgov.com/government/departments/public-
works/storm-water/Pages/pw-slr-8-2015.aspx
24

Master Plan Model Application

Master Plan Model Application
� Flows and water surface elevations in the PSMS
� Locations with surcharging in the PSMS
� Performance of storage facilities
� Overland flow between subbasins
� Surface flooding (storage node water surface elevations)
� Influence of downstream tidal conditions
26
Additional Master Plan Model Applications
1. Site specific evaluations
a. Tailwater to support site design
b. System flow-routing understanding, “what-if” scenarios for
downstream impacts and improvements
2. Starting Point for refined site-specific evaluations
a. Site specific topography and critical elevations
b. Site specific drainage features
c. System flow-routing refinements
3. Intent: Provide information and tools to assist with
engineering evaluations and compliance with DPW
Standards
27

Model Application – Tailwater Conditions
28
� Profile view through Thalia Creek
Thalia CreekThalia Creek
Thalia Creek OutfallThalia Creek Outfall
Tailwater during 100YR EventI 264I 264 Bonney RoadBonney Road
Overflow
Conduits
6 barrel
8’ x 7’
RCB
Overflow
Conduit
15”
RCP
Constitution Drive Trib.Constitution Drive Trib. VB BlvdVB Blvd
Overflow
ConduitIrregular
Conduit (Trib.)
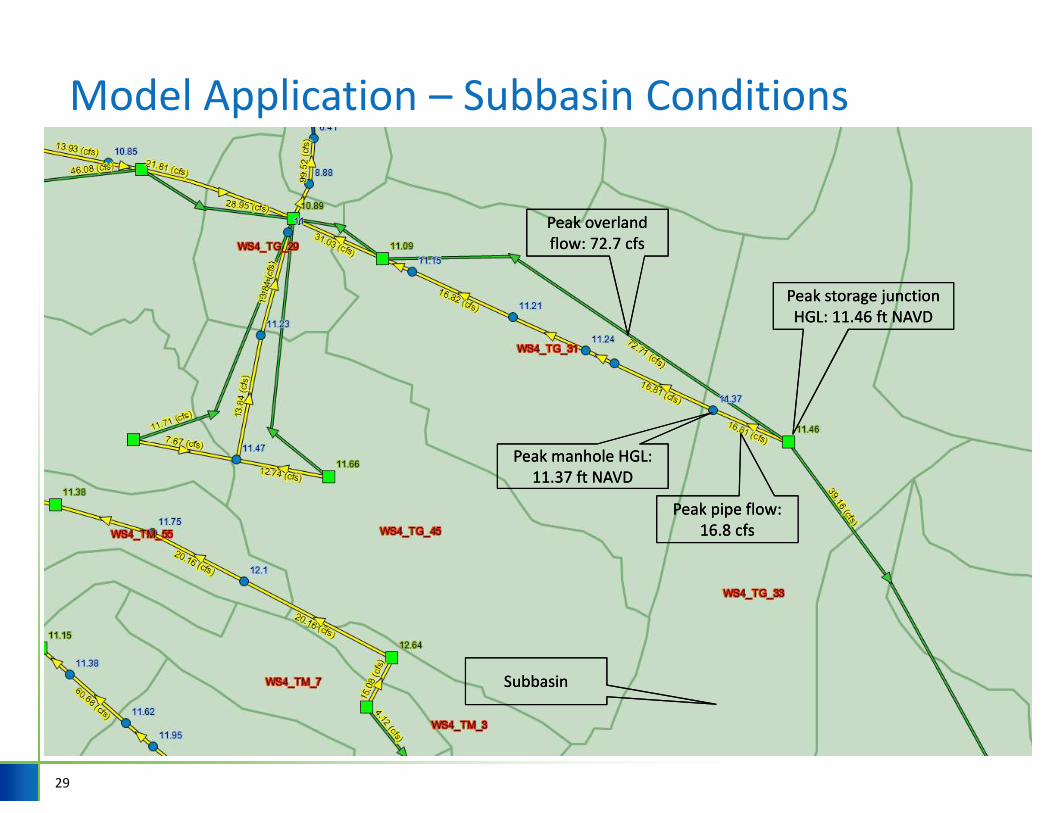
Model Application – Subbasin Conditions
29
SubbasinSubbasin
Peak storage junction
HGL: 11.46 ft NAVD
Peak storage junction
HGL: 11.46 ft NAVD
Peak pipe flow:
16.8 cfs
Peak pipe flow:
16.8 cfs
Peak overland
flow: 72.7 cfs
Peak overland
flow: 72.7 cfs
Peak manhole HGL:
11.37 ft NAVD
Peak manhole HGL:
11.37 ft NAVD

Master Plan Model Limitations
� Results based on available
data:
� GIS stormwater infrastructure
� GIS invert elevations
� LiDAR topography data
� City impervious area
� City land use
� City soils data (from NRCS)
� Areas upstream of the
modeled PSMS
� Overland flow within a single
subbasin located upstream of
the subbasin storage node
30

Example Application for Site of Interest
31

Example Application for Site of Interest
32

Master Plan Model Content
33
Steep gradient from edge of catchment to storage node
� Desired boundary conditions: 10-year and 100-year HGL
� Ground elevation 8 feet
� 10-year HGL = 9.3 feet and 100-year HGL = 10.1 feet

Application for Site of Interest
� Overflow at ground level
added from node of
concern (04520-494) to the
storage node downstream
in subbasin
34
Model 1: Before adding overland flow conduit
Storage
Node
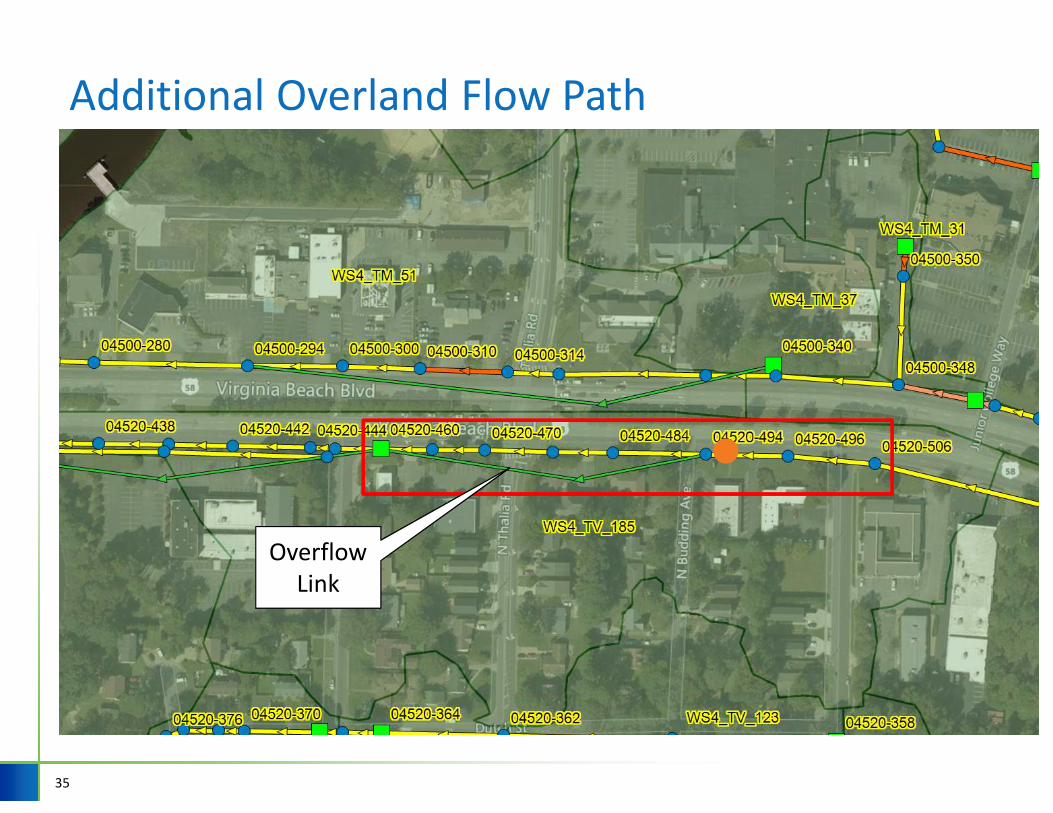
Additional Overland Flow Path
35
Overflow
Link
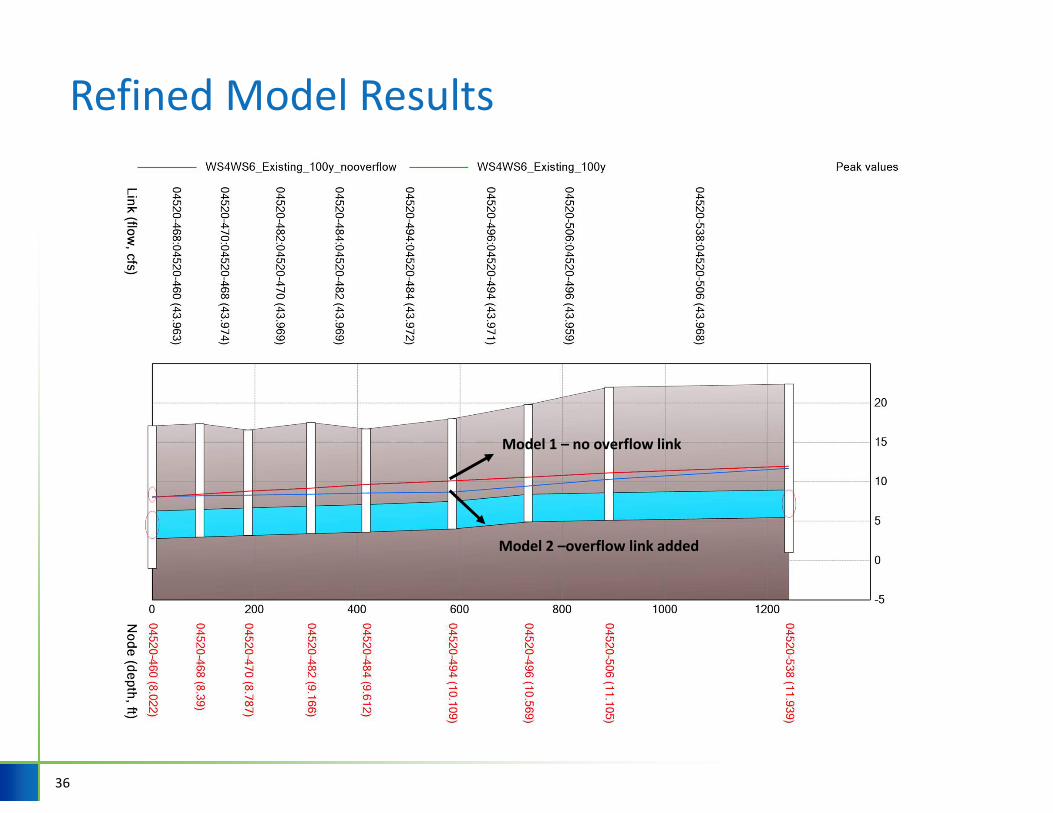
Refined Model Results
36
Model 1 – no overflow link
Model 2 –overflow link added

Refined Model Results
37
� Desired boundary conditions: 10-year and 100-year HGL
� Ground elevation 8 feet
� 10-year HGL = 8.5 feet and 100-year HGL = 8.7 feet

Example Model Refinement
38
Master Plan Model
Watershed 10
Veteran Care Center
Master Plan Model Refinement to
Reflect Existing Conditions
Site Specific Refinement

Example Model Refinement
39
Step 1:
� Delete all the
nodes and links
that will be
updated/replaced
with refined data

Example Model Refinement
40
Step 2:
� Update the
delineation and
runoff parameters
of the subbasins to
represent the new
development.
� In this example, it
involves splitting
two subbasins into
six subbasins

Example Model Refinement
41
Step 3:
� Add storage nodes
to represent surface
storage and
detention facilities.
� Storage nodes for
surface storage are
assigned to the
subbasin “Outlet”
� Add junctions along
the hydraulic system

Example Model Refinement
42
Step 4:
� Add links to
represent the
hydraulic system:
� Open channels
� Stormwater pipes

Example Model Refinement
43
Step 5:
� Add overland flow
paths connecting
adjacent
subbasins and the
hydraulic system

Example Model Refinement
44
Step 6a:
� Build and assign a
stage-storage
curve for each
storage node

Example Model Refinement
45
Step 6b:
� Assign a transect
for each open
channel, ditch and
overland flow
path

Example Model Refinement: Storage Assignment
46
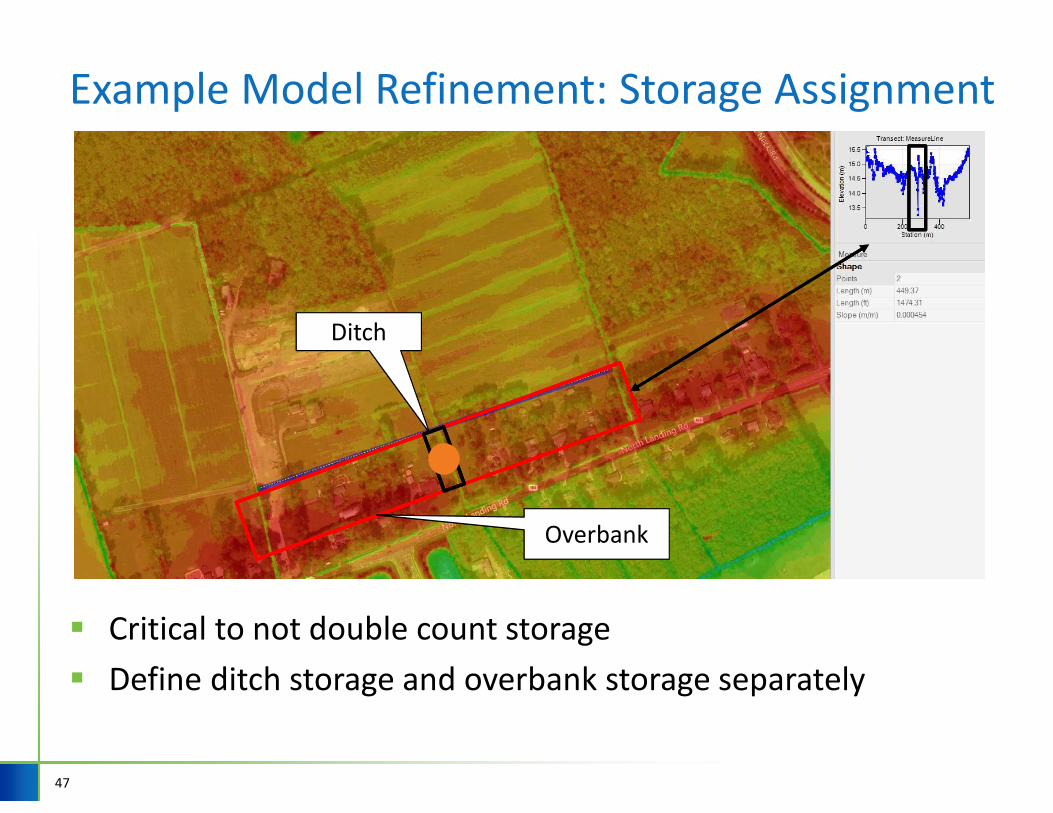
Example Model Refinement: Storage Assignment
47
Ditch
Overbank
� Critical to not double count storage
� Define ditch storage and overbank storage separately

Example Model Refinement: Storage Assignment
48
Ditch Storage: Transect

49
Example Model Refinement: Storage Assignment
Subbasin (Overbank)
Storage Node
Subbasin (Overbank)
Storage Node

Example Model Refinement
Overview of model refinement elements
� Design drawings or “As-Built” drawings
� GIS refinements (additional pipes and nodes)
� Additional control structures (not in GIS)
� Import new GIS
� Refine subbasins and process parameters
� Storage curves
� New open channels
� New overland flow links
� Initial depths
50

51