Violence and Discipline Problems in U.S. Public Schools ...nces.ed.gov/pubs98/98030.pdfincidence of...
147
NATIONAL CENTER FOR EDUCATION STATISTICS Statistical Analysis Report March 1998 Violence and Discipline Problems in U.S. Public Schools: 1996-97 U.S. Department of Education Office of Educational Research and Improvement NCES 98-030
Transcript of Violence and Discipline Problems in U.S. Public Schools ...nces.ed.gov/pubs98/98030.pdfincidence of...

NATIONAL CENTER FOR EDUCATION STATISTICS
Statistical Analysis Report March 1998
Violence and DisciplineProblems in U.S. PublicSchools: 1996-97
U.S. Department of EducationOffice of Educational Research and Improvement NCES 98-030

NATIONAL CENTER FOR EDUCATION STATISTICS
Statistical Analysis Report March 1998
Violence and DisciplineProblems in U.S. PublicSchools: 1996-97
Sheila HeavisideCassandra RowandCatrina WilliamsElizabeth FarrisWestat, Inc.
Shelley BurnsEdith McArthurProject OfficersNational Center for Education Statistics
U.S. Department of EducationOffice of Educational Research and Improvement NCES 98-030

U.S. Department of EducationRichard W. RileySecretary
Office of Educational Research andImprovement
Ricky T. TakaiActing Assistant Secretary
National Center for Education StatisticsPascal D. Forgione, Jr.Commissioner
The National Center for Education Statistics (NCES) is the primary federal entity for collecting, analyzing,and reporting data related to education in the United States and other nations. It fulfills a congressionalmandate to collect, collate, analyze, and report full and complete statistics on the condition of education inthe United States; conduct and publish reports and specialized analyses of the meaning and significanceof such statistics; assist state and local education agencies in improving their statistical systems; andreview and report on education activities in foreign countries.
NCES activities are designed to address high priority education data needs; provide consistent, reliable,complete, and accurate indicators of education status and trends; and report timely, useful, and highquality data to the U.S. Department of Education, the Congress, the states, other education policymakers,practitioners, data users, and the general public.
We strive to make our products available in a variety of formats and in language that is appropriate to avariety of audiences. You, as our customer, are the best judge of our success in communicatinginformation effectively. If you have any comments or suggestions about this or any other NCES product orreport, we would like to hear from you. Please direct your comments to:
National Center for Education StatisticsOffice of Educational Research and ImprovementU.S. Department of Education555 New Jersey Avenue NWWashington, DC 20208-5574
March 1998
The NCES World Wide Web Home Page is:http://nces.ed.gov
Suggested CitationU.S. Department of Education, National Center for Education Statistics. Violence and Discipline Problemsin U.S. Public Schools: 1996-97, NCES 98-030, by Sheila Heaviside, Cassandra Rowand, CatrinaWilliams, and Elizabeth Farris. Project Officers, Shelley Burns and Edith McArthur. Washington, DC:1998.
Contact:Shelley Burns(202) 219-1463
For sale by the U.S. Government Printing Office
Superintendent of Documents, Mail Stop: SSOP, Washington, DC 20402-9328
iii
Executive Summary
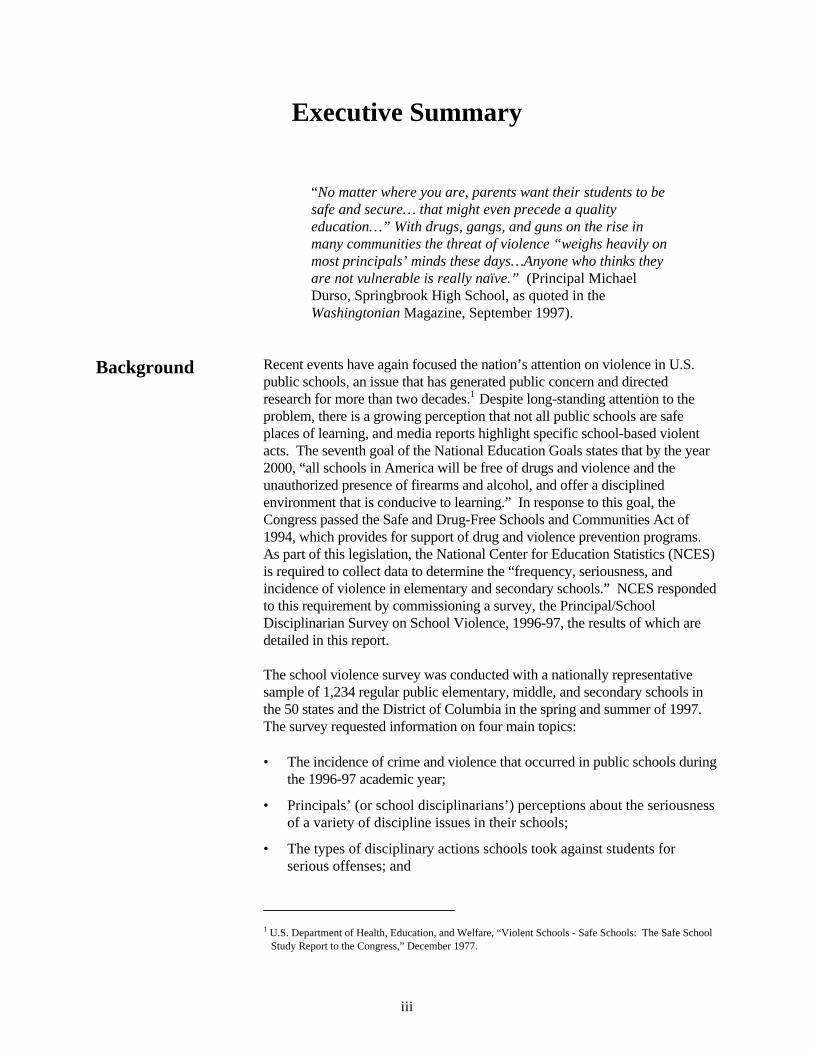
“No matter where you are, parents want their students to besafe and secure… that might even precede a qualityeducation…” With drugs, gangs, and guns on the rise inmany communities the threat of violence “weighs heavily onmost principals’ minds these days…Anyone who thinks theyare not vulnerable is really naïve.” (Principal MichaelDurso, Springbrook High School, as quoted in theWashingtonian Magazine, September 1997).
Background Recent events have again focused the nation’s attention on violence in U.S.public schools, an issue that has generated public concern and directedresearch for more than two decades.1 Despite long-standing attention to theproblem, there is a growing perception that not all public schools are safeplaces of learning, and media reports highlight specific school-based violentacts. The seventh goal of the National Education Goals states that by the year2000, “all schools in America will be free of drugs and violence and theunauthorized presence of firearms and alcohol, and offer a disciplinedenvironment that is conducive to learning.” In response to this goal, theCongress passed the Safe and Drug-Free Schools and Communities Act of1994, which provides for support of drug and violence prevention programs.As part of this legislation, the National Center for Education Statistics (NCES)is required to collect data to determine the “frequency, seriousness, andincidence of violence in elementary and secondary schools.” NCES respondedto this requirement by commissioning a survey, the Principal/SchoolDisciplinarian Survey on School Violence, 1996-97, the results of which aredetailed in this report.
The school violence survey was conducted with a nationally representativesample of 1,234 regular public elementary, middle, and secondary schools inthe 50 states and the District of Columbia in the spring and summer of 1997.The survey requested information on four main topics:
• The incidence of crime and violence that occurred in public schools duringthe 1996-97 academic year;
• Principals’ (or school disciplinarians’) perceptions about the seriousnessof a variety of discipline issues in their schools;
• The types of disciplinary actions schools took against students forserious offenses; and
1 U.S. Department of Health, Education, and Welfare, “Violent Schools - Safe Schools: The Safe School
Study Report to the Congress,” December 1977.

iv
• The kinds of security measures and violence prevention programs thatwere in place in public schools.
The types of criminal incidents that schools were asked to report includedmurder, suicide, rape or other type of sexual battery, assault or fight with aweapon, robbery, assault or fight without a weapon, theft/ larceny, andvandalism. Any effort to quantify the frequency and seriousness of thesecrimes and violent incidents occurring in public schools will be affected bythe way in which the information is collected and reported. Three importantaspects of the process that were used to gather the data reported in thispublication were:
• The survey questions asked, including how the questions were phrased,definitions applied, time span covered, and the context in which theywere asked;
• The choice of survey respondent; and
• The survey sample size.
The reader should keep these aspects of the survey in mind when comparingresults of this particular sample survey with other studies on school crimeand violence. The data reported from this study may vary from data reportedelsewhere because of differences in definitions, coverage, respondents, andsample. For example, the data reported in this survey describe the number ofincidents of crime, not the number of individuals involved in such incidents.It should be noted that an incident could involve more than one individualperpetrator or individual victim. Similarly, an individual perpetrator orvictim could be involved in multiple incidents.
Key Findings HOW SERIOUS A PROBLEM WAS CRIME AND VIOLENCE INU.S. PUBLIC SCHOOLS IN THE 1996-97 SCHOOL YEAR?
More than half of U.S. public schools reported experiencing at least onecrime incident in school year 1996-97, and 1 in 10 schools reported atleast one serious violent crime during that school year (table 7).
• Fifty-seven percent of public elementary and secondary schoolprincipals reported that one or more incidents of crime/violence thatwere reported to the police or other law enforcement officials hadoccurred in their school during the 1996-97 school year.
• Ten percent of all public schools experienced one or more seriousviolent crimes (defined as murder, rape or other type of sexual battery,suicide, physical attack or fight with a weapon, or robbery) that werereported to police or other law enforcement officials during the 1996-97school year.

v
• Physical attacks or fights without a weapon led the list of reportedcrimes in public schools with about 190,000 such incidents reported for1996-97 (figure 1). About 116,000 incidents of theft or larceny werereported along with 98,000 incidents of vandalism. These less seriousor nonviolent crimes were more common than serious violent crimes,with schools reporting about 4,000 incidents of rape or other type ofsexual battery, 7,000 robberies, and 11,000 incidents of physical attacksor fights in which weapons were used.
• While 43 percent of public schools reported no incidents of crime in1996-97, 37 percent reported from one to five crimes and about 20percent reported six crimes or more (figure 3).
WHAT TYPES OF SCHOOLS WERE LIKELY TO HAVE MORESERIOUS PROBLEMS WITH CRIME AND VIOLENCE?
Crime and violence were more of a problem in middle and high schoolsthan in elementary schools. Middle schools and high schools were morelikely to report that they had experienced one or more incidents of anycrime and one or more incidents of serious violent crime thanelementary schools (table 7).
• Forty-five percent of elementary schools reported one or more violentincidents compared with 74 percent of middle and 77 percent of highschools.
• Four percent of elementary schools reported one or more serious violentcrimes compared with 19 percent of middle and 21 percent of highschools.
• Of the less serious or nonviolent crimes, the largest ratios of crimes per100,000 students were found in middle and high schools compared withelementary schools. This was true for physical attacks or fights withouta weapon, theft/larceny, and vandalism (table 10).
• In general, elementary schools reported proportionately fewer incidentsof serious violent crime. They reported lower rates of physical attacksor fights with a weapon and rape or other type of sexual battery whencompared with middle schools and high schools. However, whileelementary schools reported lower ratios of robbery compared with highschools, they were not significantly different from middle schools.

vi
Schools that reported serious discipline problems were more likely to haveexperienced one or more incidents of crime or violence, and were morelikely to experience serious violent crime than those with less seriousdiscipline problems (table 7).
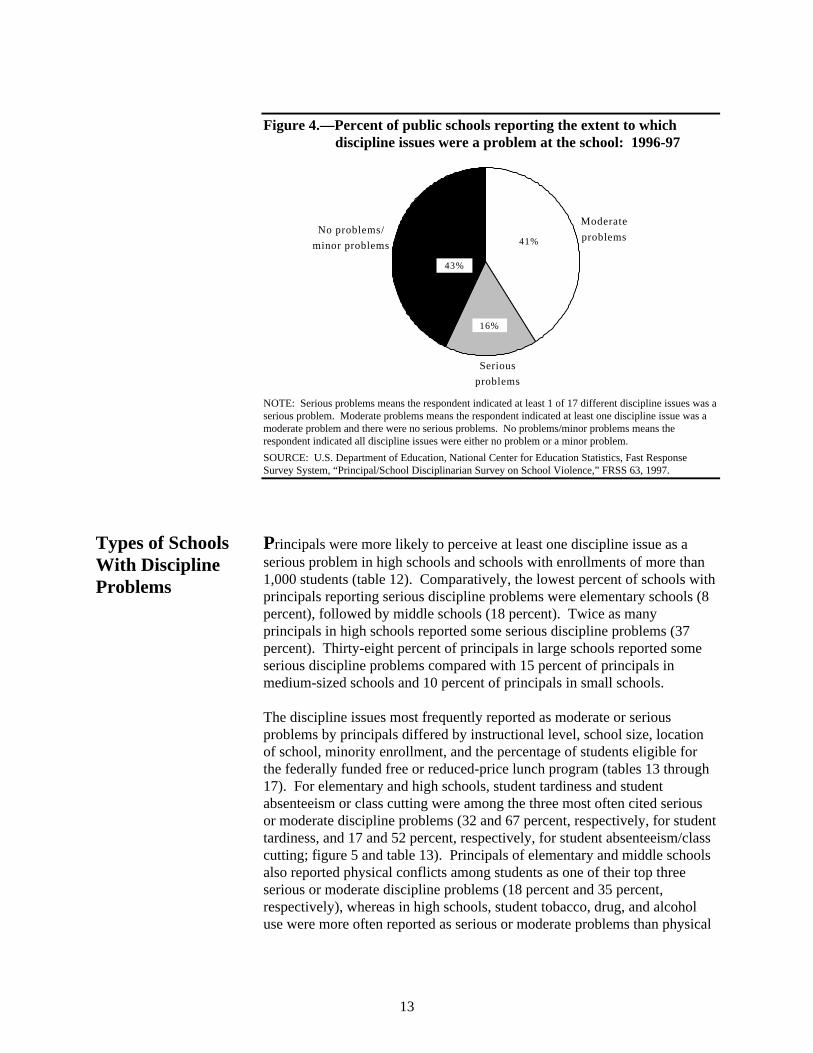
• Sixteen percent of public school principals considered at least one seriousdiscipline problem (out of 17 discipline issues that they were asked about)to be a serious problem in their schools in 1996-97 (table 12). Theremaining schools were about equally divided between those that hadminor or no discipline problems on all 17 issues (43 percent) and thosethat reported a moderate (but no serious) problem on at least 1 of theissues (41 percent).
• Principals in public high schools and middle schools were more likely thanpublic elementary school principals to rate at least one discipline issue as aserious problem in their schools. Thirty-seven percent of high schoolprincipals reported at least one serious discipline problem in their schoolscompared with 18 percent of middle school principals and 8 percent ofelementary school principals (table 12).
• In both 1990-91 and 1996-97, the three discipline issues most frequentlyrated as serious or moderate problems by principals were student tardiness,student absenteeism or class cutting, and physical conflicts among students(table 13).
WHAT MEASURES ARE SCHOOLS TAKING TO DEAL WITHPROBLEMS OF CRIME AND VIOLENCE?
Most public schools reported having zero tolerance policies towardsserious student offenses (table 19).
• Principals were asked about whether the school had “zero-tolerance”policies, defined as school or district policy mandating predeterminedconsequences for various student offenses. The proportion of schoolsthat had such policies ranged from 79 to 94 percent on violence, tobacco,alcohol, drugs, weapons other than firearms, and firearms (figure 8 andtable 19).
Most schools reported that they employed low levels of securitymeasures to prevent violence (figure 11).
• To discover what types of security were employed, schools were askedwhether visitors must sign in, if there was a closed campus policy formost students during lunch, if access to the school building wascontrolled, if access to school grounds was controlled, if there had beenone or more drug sweeps, whether the school used random metaldetector checks on students, or whether students must pass through
vii
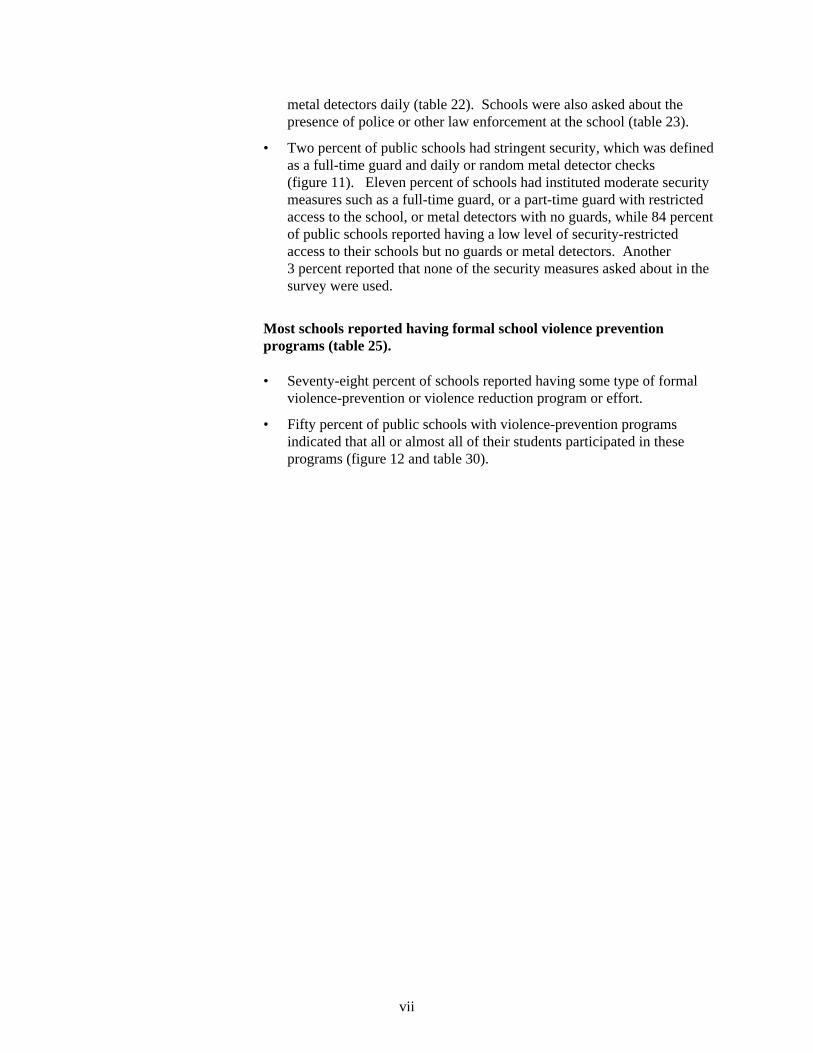
metal detectors daily (table 22). Schools were also asked about thepresence of police or other law enforcement at the school (table 23).
• Two percent of public schools had stringent security, which was definedas a full-time guard and daily or random metal detector checks(figure 11). Eleven percent of schools had instituted moderate securitymeasures such as a full-time guard, or a part-time guard with restrictedaccess to the school, or metal detectors with no guards, while 84 percentof public schools reported having a low level of security-restrictedaccess to their schools but no guards or metal detectors. Another3 percent reported that none of the security measures asked about in thesurvey were used.
Most schools reported having formal school violence preventionprograms (table 25).
• Seventy-eight percent of schools reported having some type of formalviolence-prevention or violence reduction program or effort.
• Fifty percent of public schools with violence-prevention programsindicated that all or almost all of their students participated in theseprograms (figure 12 and table 30).

viii
ix
Table of Contents
Page
Executive Summary .............................................................................................................. iii
Introduction .......................................................................................................................... 1Incidents of Crime and Violence in Public Schools ............................................................. 5Percent of Public Schools Reporting Crime and Violence ................................................... 7Frequency of Crime and Violence ........................................................................................ 9Frequency of Specific Crimes............................................................................................... 11Principals’ Perceptions of Discipline Issues in Their Schools ............................................. 12
Types of Schools With Discipline Problems.................................................................. 13Relationship Between Safety and Principals’ Perceptions of Discipline
Issues....................................................................................................................... 15Comparisons of Principals’ Perceptions in 1991 and 1997............................................ 15
School Actions and Reactions to Discipline Issues .............................................................. 16
Zero Tolerance Policies.................................................................................................. 18Policies to Report Crimes to the Public.......................................................................... 18Requiring School Uniforms............................................................................................ 19
School Efforts to Ensure Safety and Promote Discipline ..................................................... 19
Presence of Police or Other Law Enforcement in Public Schools ................................. 22
Stringency of Security Across School Characteristics.......................................................... 22Violence Prevention Programs.............................................................................................. 23Participation in Violence Prevention Programs.................................................................... 25Summary and Conclusions.................................................................................................... 26Survey Methodology and Data Reliability............................................................................ 27
Sample Selection ............................................................................................................ 27Respondent and Response Rates .................................................................................... 27Sampling and Nonsampling Errors................................................................................. 29Variances ........................................................................................................................ 30Background Information................................................................................................. 30References ...................................................................................................................... 31Glossary of Terms .......................................................................................................... 32
Tables of Estimates and Standard Errors .............................................................................. 37

x
Table of Contents (continued)
List of Appendices
Appendix
A Survey Questionnaire ........................................................................................................ A-1
List of Figures
Figure Page
1 Number of various crimes occurring in public schools: 1996-97 .................................... 6
2 Percent of public schools indicating the seriousness of reported crimes occurring atthe school: 1996-97 ........................................................................................................... 7
3 Percent of public schools with number of reported crime incidents at the school:1996-97.............................................................................................................................. 10
4 Percent of public schools reporting the extent to which discipline issues were aproblem at the school: 1996-97 ........................................................................................ 13
5 Percent of public schools reporting that specific discipline issues were a serious ormoderate problem at the school, by instructional level: 1996-97 .................................... 14
6 Percent of public schools reporting the extent to which discipline issues were aproblem at the school, by reported crime in the school: 1996-97 .................................... 15
7 Percent of specified disciplinary actions taken by public schools for specificoffenses, by type of action taken: 1996-97....................................................................... 17
8 Percent of public schools that have adopted zero tolerance policies for variousstudent offenses: 1996-97................................................................................................. 18
9 Percent of public schools requiring school uniforms, by year requirement initiated........ 19
10 Percent of public schools reporting various types of security measures at the schools:1996-97.............................................................................................................................. 20
11 Percent of public schools, by degree of security: 1996-97............................................... 23
12 Percent of public schools with violence prevention programs, by the proportion oftheir students that participated in these programs: 1996-97............................................. 25

xi
Table of Contents (continued)
List of Text Tables
Table Page
A Number and percent of responding public schools in the study sample and estimatednumber and percent of public schools the sample represents, by schoolcharacteristics: 1996-97.................................................................................................... 28
List of Tables of Estimates and Standard Errors
Table
1 Number and percent of public schools reporting one or more incidents of rape orother type of sexual battery, and total number of incidents of rape or other type ofsexual battery reported in public schools in which police or other law enforcementwere contacted, by school characteristics: 1996-97 ......................................................... 39
1a Standard errors of the number and percent of public schools reporting one or moreincidents of rape or other type of sexual battery and of the total number of incidentsof rape or other type of sexual battery reported in public schools in which police orother law enforcement were contacted, by school characteristics: 1996-97 .................... 41
2 Number and percent of public schools reporting one or more incidents of physicalattacks or fights with weapons, and total number of incidents of physical attacks orfights with weapons reported in public schools in which police or other lawenforcement were contacted, by school characteristics: 1996-97 .................................... 42
2a Standard errors of the number and percent of public schools reporting one or moreincidents of physical attacks or fights with weapons and of the total number ofincidents of physical attacks or fights with weapons reported in public schools inwhich police or other law enforcement were contacted, by school characteristics:1996-97.............................................................................................................................. 44
3 Number and percent of public schools reporting one or more incidents of robbery,and total number of incidents of robbery reported in public schools in which policeor other law enforcement were contacted, by school characteristics: 1996-97................ 45
3a Standard errors of the number and percent of public schools reporting one or moreincidents of robbery and of the total number of incidents of robbery reported inpublic schools in which police or other law enforcement were contacted, by schoolcharacteristics: 1996-97.................................................................................................... 47

xii
Table of Contents (continued)
List of Tables of Estimates and Standard Errors (continued)
Table Page
4 Number and percent of public schools reporting one or more incidents of physicalattacks or fights without weapons, and total number of incidents of physical attacksor fights without weapons reported in public schools in which police or other lawenforcement were contacted, by school characteristics: 1996-97 .................................... 48
4a Standard errors of the number and percent of public schools reporting one or moreincidents of physical attacks or fights without weapons and of the total number ofincidents of physical attacks or fights without weapons reported in public schools inwhich police or other law enforcement were contacted, by school characteristics:1996-97.............................................................................................................................. 50
5 Number and percent of public schools reporting one or more incidents of theft orlarceny, and total number of incidents of theft or larceny reported in public schoolsin which police or other law enforcement were contacted, by school characteristics:1996-97.............................................................................................................................. 51
5a Standard errors of the number and percent of public schools reporting one or moreincidents of theft or larceny and of the total number of incidents of theft or larcenyreported in public schools in which police or other law enforcement were contacted,by school characteristics: 1996-97 ................................................................................... 53
6 Number and percent of public schools reporting one or more incidents ofvandalism, and total number of incidents of vandalism reported in public schools inwhich police or other law enforcement were contacted, by school characteristics:1996-97.............................................................................................................................. 54
6a Standard errors of the number and percent of public schools with one or moreincidents of vandalism and of the total number of incidents of vandalism occurringin public schools in which police or other law enforcement were contacted, byschool characteristics: 1996-97 ........................................................................................ 56
7 Percent of public schools reporting crime incidents and the seriousness of crimeincidents reported, by school characteristics: 1996-97 .................................................... 57
7a Standard errors of the percent of public schools reporting crime incidents and theseriousness of crime incidents reported, by school characteristics: 1996-97................... 59
8 Percent of public schools reporting that various crimes occurred at the school,involved students, and occurred during school hours or at school-sponsored events,by type of crime at the school: 1996-97 ........................................................................... 60
8a Standard errors of the percent of public schools reporting that various crimesoccurred at the school, involved students, and occurred during school hours or atschool-sponsored events, by type of crime at the school: 1996-97.................................. 61

xiii
Table of Contents (continued)
List of Tables of Estimates and Standard Errors (continued)
Table Page
9 Ratio of crimes per 100,000 public school students, by school characteristics:1996-97.............................................................................................................................. 62
9a Standard errors of the ratio of crimes per 100,000 public school students, by schoolcharacteristics: 1996-97.................................................................................................... 64
10 Ratio of reported crimes per 100,000 public school students, by type of crime andinstructional level: 1996-97.............................................................................................. 65
10a Standard errors of the ratio of reported crimes per 100,000 public school students,by type of crime and instructional level: 1996-97............................................................ 66
11 Percent of public school principals indicating the extent of problems in theirschools with certain discipline issues: 1990-91 and 1996-97 .......................................... 67
11a Standard errors of the percent of public school principals indicating the extent ofproblems in their schools with certain discipline issues: 1990-91 and 1996-97.............. 68
12 Percent of public school principals reporting level of discipline problems in theirschools, by school characteristics: 1996-97 ..................................................................... 69
12a Standard errors of the percent of public school principals reporting level ofdiscipline problems in their schools, by school characteristics: 1996-97 ........................ 70
13 Percent of public school principals reporting that certain discipline issues wereserious or moderate problems in their schools, by type of issue and instructionallevel: 1990-91 and 1996-97.............................................................................................. 71
13a Standard errors of the percent of public school principals reporting that certaindiscipline issues were serious or moderate problems in their schools, by type ofissue and instructional level: 1990-91 and 1996-97......................................................... 72
14 Percent of public school principals reporting that certain discipline issues wereserious or moderate problems in their schools, by type of issue and size of school:1990-91 and 1996-97......................................................................................................... 73
14a Standard errors of the percent of public school principals reporting that certaindiscipline issues were serious or moderate problems in their schools, by type ofissue and size of school: 1990-91 and 1996-97................................................................. 74
15 Percent of public school principals reporting that certain discipline issues wereserious or moderate problems in their schools, by type of issue and location ofschool: 1990-91 and 1996-97 ............................................................................................ 75
15a Standard errors of the percent of public school principals reporting that certaindiscipline issues were serious or moderate problems in their schools, by type ofissue and location of school: 1990-91 and 1996-97 .......................................................... 76

xiv
Table of Contents (continued)
List of Tables of Estimates and Standard Errors (continued)
Table Page
16 Percent of public school principals reporting that certain discipline issues wereserious or moderate problems in their schools, by type of issue and minorityenrollment of school: 1990-91 and 1996-97 ..................................................................... 77
16a Standard errors of the percent of public school principals reporting that certaindiscipline issues were serious or moderate problems in their schools, by type ofissue and minority enrollment of school: 1990-91 and 1996-97....................................... 78
17 Percent of public school principals reporting that certain discipline issues wereserious or moderate problems in their schools, by type of issue and poverty level ofschool: 1990-91 and 1996-97 ............................................................................................ 79
17a Standard errors of the percent of public school principals reporting that certaindiscipline issues were serious or moderate problems in their schools, by type ofissue and poverty level of school: 1990-91 and 1996-97 .................................................. 80
18 Number and percent of schools in which specified disciplinary actions were takenagainst students, total number of actions taken, and percent of specific disciplinaryactions taken against students, by type of infraction: 1996-97 ........................................ 81
18a Standard errors of the number and percent of schools in which specifieddisciplinary actions were taken against students, total number of actions taken, andpercent of specific disciplinary actions taken against students, by type of infraction:1996-97.............................................................................................................................. 82
19 Percent of public schools reporting that they have a zero tolerance policy forvarious specified student offenses, by school characteristics: 1996-97........................... 83
19a Standard errors of the percent of public schools reporting that they have a zerotolerance policy for various specified student offenses, by school characteristics:1996-97.............................................................................................................................. 85
20 Percent of public schools with policy to report crimes to the public, by schoolcharacteristics: 1996-97.................................................................................................... 86
20a Standard errors of the percent of public schools with policy to report crimes to thepublic, by school characteristics: 1996-97 ....................................................................... 88
21 Percent of public schools reporting that students were required to wear schooluniforms, by school characteristics: 1996-97................................................................... 89
21a Standard errors of the percent of public schools reporting that students wererequired to wear school uniforms, by school characteristics: 1996-97 ............................ 91

xv
Table of Contents (continued)
List of Tables of Estimates and Standard Errors (continued)
Table Page
22 Percent of public schools reporting various types of security measures at theschools, by school characteristics: 1996-97 ..................................................................... 92
22a Standard errors of the percent of public schools reporting various types of securitymeasures at the schools, by school characteristics: 1996-97 ........................................... 94
23 Percent of public schools reporting various levels of police or other lawenforcement presence during a typical week, by school characteristics: 1996-97........... 95
23a Standard errors of the percent of public schools reporting various levels of police orother law enforcement presence during a typical week, by school characteristics:1996-97.............................................................................................................................. 97
24 Percent of public schools with various degrees of security measures, by schoolcharacteristics: 1996-97.................................................................................................... 98
24a Standard errors of the percent of public schools with various degrees of securitymeasures, by school characteristics: 1996-97 .................................................................. 100
25 Percent of public schools with formal school violence prevention or reductionprograms or efforts, by school characteristics: 1996-97 .................................................. 101
25a Standard errors of the percent of public schools with formal school violenceprevention or reduction programs or efforts, by school characteristics: 1996-97............ 103
26 Number of schools with violence prevention or reduction programs or efforts, andmean number of programs in schools with violence prevention or reductionprograms or efforts, by school characteristics: 1996-97 .................................................. 104
26a Standard errors of the number of schools with violence prevention or reductionprograms or efforts, and of the mean number of programs in schools with violenceprevention or reduction programs or efforts, by school characteristics: 1996-97............ 106
27 Percent of public schools with formal school violence prevention or reductionprograms and the mean number of programs, by type of crime reported at theschool: 1996-97 ................................................................................................................ 107
27a Standard errors of the percent of public schools with formal school violenceprevention or reduction programs and of the mean number of programs, by type ofcrime reported at the school: 1996-97.............................................................................. 108
28 Percent of public schools with violence prevention programs and reporting one ormore crimes to the police in 1996-97 indicating that crimes were used to modify orto introduce new violence prevention programs, by school characteristics: 1996-97 ..... 109

xvi
Table of Contents (continued)
List of Tables of Estimates and Standard Errors (continued)
Table Page
28a Standard errors of the percent of public schools with violence prevention programsand reporting one or more crimes to the police in 1996-97 indicating that crimeswere used to modify or to introduce new violence prevention programs, by schoolcharacteristics: 1996-97.................................................................................................... 111
29 Percent of public schools with formal violence prevention or reduction programsindicating that at least one of these programs included selected components:1996-97.............................................................................................................................. 112
29a Standard errors of the percent of public schools with formal violence prevention orreduction programs indicating that at least one of these programs included selectedcomponents: 1996-97 ....................................................................................................... 113
30 Percent of public schools with violence prevention programs indicating theproportion of their students participating in school violence prevention or reductionprograms that directly serve students, by school characteristics: 1996-97 ...................... 114
30a Standard errors of the percent of public schools with violence prevention programsindicating the proportion of their students participating in school violenceprevention or reduction programs that directly serve students, by schoolcharacteristics: 1996-97.................................................................................................... 116
31 Percent of public schools with violence prevention programs indicating theproportion of teachers and staff in the school who were substantially involved inschool violence efforts or programs, by school characteristics: 1996-97 ........................ 117
31a Standard errors of the percent of public schools with violence prevention programsindicating the proportion of teachers and staff in the school who were substantiallyinvolved in school violence efforts or programs, by school characteristics: 1996-97 ..... 119
32a Table of standard errors for the figures............................................................................. 120

1
Introduction The disruption caused by violence in our nation’s public elementary andsecondary schools is a national concern. Crime in and around schoolsthreatens the well-being of students, school staff, and communities. It alsoimpedes learning and student achievement. The seventh goal of the NationalEducation Goals states that by the year 2000, “all schools in America will befree of drugs and violence and the unauthorized presence of firearms andalcohol, and offer a disciplined environment that is conducive to learning.”To accomplish this goal, the Safe and Drug-Free Schools and CommunitiesAct of 1994 provides for support of drug and violence prevention programs.The Act includes an impact evaluation component, which contains aprovision requiring the National Center for Education Statistics (NCES) tocollect data to determine the frequency, seriousness, and incidence ofviolence in elementary and secondary schools.
Responding to this legislation, NCES commissioned a survey (thePrincipal/School Disciplinarian Survey on School Violence) to obtaincurrent data on school violence and other discipline issues in our nation’spublic elementary and secondary schools. The survey requested informationabout 1) the actual number of specific crimes that had occurred at schoolduring the 1996-97 academic year; 2) principals’ perceptions about theseriousness of a variety of discipline issues at their schools; 3) the types ofdisciplinary actions schools took against students for some seriousviolations; and 4) the kinds of security measures and violence preventionprograms that were in place in public schools. Principals were asked toprovide information about incidents of crime and violence that were seriousenough for the police or other law enforcement representatives to have beencontacted. They were also asked to report only on incidents occurring inschool buildings, on school grounds, on school buses, and at school-sponsored events or activities held in places other than school grounds orschool property. The data collected indicate both the incidence andfrequency of many types of serious crimes that took place in public schoolsand the types of security and other violence-prevention measures in place inschools.
This report presents the findings from the survey, which was conducted forNCES by Westat, a research firm in Rockville, Maryland. The survey wasconducted through the NCES Fast Response Survey System (FRSS) duringthe spring and summer of 1997. FRSS is a survey system designed to collectsmall amounts of issue-oriented data with minimal burden on respondentsand within a relatively short time frame. Questionnaires were mailed toschool principals, who were asked to complete the survey form or to have itcompleted by the person most knowledgeable about discipline issues at theschool.
The survey was conducted with a nationally representative sample of regularpublic elementary, middle, and high schools in the 50 states and the Districtof Columbia. Special education, alternative, and vocational schools, andschools that taught only prekindergarten, kindergarten, or adult education

2
were not represented in the sample. Survey findings are presented separatelyfor all regular public schools, and by the following school characteristics(defined in the glossary of terms on pages 32 through 35):
• Instructional level: elementary, middle, high school.
• Size of enrollment: less than 300 students (small schools), 300 to 999students (medium-sized schools), 1,000 or more students (large schools).
• Locale of school: city, urban fringe, town, rural.
• Geographic region: Northeast, Southeast, Central, West.
• Percent minority enrollment: less than 5 percent, 5 to 19 percent, 20 to49 percent, 50 percent or more.
• Percent of students eligible for the federally funded free or reduced-pricelunch program used as a measure of poverty concentration: less than20 percent, 20 to 34 percent, 35 to 49 percent, 50 to 74 percent,75 percent or more.
Some survey findings are also presented by school characteristics reported inthe survey:
• Principals’ reports on discipline problems in their schools: no problems/minor problems reported by principal, moderate problems, and seriousproblems.
• Types of crime reported: no crime, any crime (including less serious ornonviolent crime only and/or some serious crimes reported), lessercrimes only, some serious crimes reported.
• Zero tolerance policy for violence: schools reporting that they do have azero tolerance policy for violence, schools reporting that they do nothave a zero tolerance policy for violence.
• Police/law enforcement presence: 30 hours or more per week; 10-29hours per week; 1-9 hours per week; stationed as needed; none stationedat the school.
It is important to note that many of the school characteristics used forindependent analyses may also be related to each other. The size ofenrollment and instructional level of schools, for example, are known to berelated with middle schools and high schools typically being larger thanelementary schools. Similarly, locale may be related to poverty level andother relationships between analysis variables may exist. The sample sizewas not large enough to control for these types of relationships. Their

3
existence, however, should be considered in the interpretation of the datapresented in this report.
Among the data collected on school discipline and violence issues in publicschools were incidents of specific crimes and on a variety of specificdiscipline issues. The types of crimes and discipline issues on which thissurvey focused do not represent an exhaustive list of possible school crimeor discipline infractions. Also, the number of incidents of crime reported byschools is not the same as the number of individuals involved in suchincidents and the reader should keep in mind the specifics of this study whencomparing the findings reported here with other studies on school crime andviolence. The data reported in this study may vary from data reportedelsewhere because of differences in definitions, coverage, respondents, andsample. Among the issues to consider in interpreting the data presented inthis report are:
The Choice of Survey Respondent. This survey relied on the responses ofpublic school principals (or school disciplinarians) to report on all data itemsrequested. This includes the reports on the incidence of specific crimes intheir schools. There are other surveys in existence, most notably the annualNational Crime Victimization Survey of the Bureau of Justice Statistics,Department of Justice, that request information from actual crime victims.2
It is likely that the incident reports provided by a third party, in this caseschool principals, may be an undercount of the incidents of crime andviolence that might have occurred during the school year examined. This isparticularly likely for lesser incidents, such as theft, that may not have beenreported to the principal as they occurred. Thus, comparisons with reportsby victims of crimes that occurred in public schools will not necessarilymatch those reports provided by school principals in this study.
The Survey Questions Asked. For reporting on specific incidents ofcrime, principals were asked to provide information only on those seriousenough for the police or other law enforcement representatives to have beencontacted. Additionally, the incidents reported were restricted to those thatoccurred in school buildings, on school grounds, on school buses, and atschool-sponsored events or activities held in places other than schoolgrounds or school property. These restrictions were necessary to improverecall and to ensure that the incidents that were reported were both of aserious nature and comparable across schools. These restrictions couldresult in a lower number of reported incidents when compared with thenumber reported by other studies that do not similarly restrict the questionsasked.
2 For victim-reported student crime data see L. Bastian and B. Taylon, School Crime, U.S. Department of
Justice, Bureau of Justice Statistics, 1991 (NCJ-121645),
4
The Survey Sample Size. The sample size for this survey, 1,234 publicschools, was too small to ensure reliable estimates for very rare events. Inthe case of school-based violence, both murders and suicides are relativelyrare events. In fact, no murders were reported by principals in this survey.Although a small number of suicides were reported and later verified, thenumber was too small to allow the calculation of reliable estimates and istherefore not reported in the results of this survey, except where combinedwith other types of violent events to present general statistics. This does notmean that no murders or suicides occurred in public schools during the 1996-97 school year. Other studies have detailed both incidents of murder andsuicide in public schools and discussed the methodology employed to makesuch estimates.3
Finally, the reader should be cautioned that any sample survey is subject todata collection errors and response bias. Further information on the technicalspecifications, response rates, calculation of standard errors and testing ofcomparisons presented in this text are provided in the section on surveymethodology and sample selection at the end of the report.
Data have been weighted to national estimates of regular public schools andtable A on page 28 provides the weighted and unweighted distribution of thesample by the analysis variables. All comparative statements made in thisreport have been tested for statistical significance through chi-square tests ort-tests adjusted for multiple comparisons using the Bonferroni adjustmentand are significant at the 0.05 level or better. However, not all statisticallysignificant comparisons have been presented. Data are presented in figuresappearing in the text and in reference tables that appear in the Table ofEstimates and Standard Errors on pages 37 to 122. The survey questionnaireis reproduced in appendix A.
3 S. P. Kachur, et al., “School Associated Violent Deaths in the United States, 1992 to 1994, “Journal of
the American Mediical Association, June 12, 1996, 275 (22): 1729-1733.

5
Incidents ofCrime andViolence inPublic Schools
Public school principals were presented with a list of crimes and asked toreport the number of incidents of each type of crime that had occurred attheir schools during the 1996-97 school year. The crimes about whichschools were asked were murder, suicide, rape or other type of sexualbattery, physical attack or fight with a weapon, robbery, physical attack orfight without a weapon, theft or larceny, and vandalism. Respondents wereprovided with definitions for each of these types of crime (those definitionsappear in the glossary of this report on pages 32 through 35). Under theassumption that crimes or offenses reported to police would be moreaccurately recalled, schools were asked to report only those incidents forwhich the police or other law enforcement representatives had beencontacted. It was also assumed that requiring a benchmark of lawenforcement contact would minimize subjective judgment about whichincidents to include. Only crimes occurring at the school, including thosethat took place in school buildings, on school grounds, on school buses, andat school-sponsored events or activities, but not officially on school grounds,were to be reported. While student victimization and teacher-reported dataon crimes occurring at school have been collected and reported elsewhere,school principals were asked to report unduplicated incidents at the schoollevel.4
During 1996-97, about 4,000 incidents of rape or other types of sexualbattery were reported in our nation’s public schools (figure 1 and table 1).There were about 11,000 incidents of physical attacks or fights in whichweapons were used and 7,000 robberies in schools that year. About 190,000fights or physical attacks not involving weapons also occurred at schools in1996-97, along with about 115,000 thefts and 98,000 incidents of vandalism(tables 2-6).
4See W. Mansfield, D. Alexander, and E. Farris, Teacher Survey on Safe, Disciplined, and Drug-Free
Schools, Fast Response Survey System, FRSS 42, U.S. Department of Education, National Center forEducation Statistics, 1991 (NCES 91-091) for teacher-reported data. For student-reported crime datasee L. Bastian and B. Taylor, School Crime, U.S. Department of Justice, Bureau of Justice Statistics,1991 (NCJ-131645), and M.J. Nolan, E. Daily, and K. Chandler, Student Victimization at School, U.S.Department of Education, National Center for Education Statistics, 1995 (NCES 95-204).

6
Figure 1.—Number of various crimes occurring in public schools:1996-97
4,170 7,150 10,950
98,490
115,500
187,890
0
20,000
40,000
60,000
80,000
100,000
120,000
140,000
160,000
180,000
200,000
Rape/sexual battery
Robbery Physical attack or
fight with weapon
Vandalism Theft/larceny
Physicalattack or
fightwithoutweapon
SOURCE: U.S. Department of Education, National Center for Education Statistics, Fast ResponseSurvey System, “Principal/School Disciplinarian Survey on School Violence,” FRSS 63, 1997.
Because the sample size was not large enough to produce reliable estimatesfor very rare events, the survey was not able to estimate either the percentageof schools experiencing one or more incidents of murder or suicide or thetotal number of these crimes that occurred at public schools during 1996-97.For example, in the sample of 1,234 public schools, murder was not reportedby any of the schools and, similarly, only 4 schools in the sample reportedany incidents of suicide. The rarity of the occurrence of these crimes atschool, given the sample size of the study, precluded the generation ofreliable national estimates. In a descriptive case study of violent deaths inschools, Kachur, et al., estimated that there were 105 school-associatedviolent deaths including 85 murders occurring at schools during a 2-yearperiod from 1992 to 1994.5
5 S.P. Kachur, et al., “School Associated Violent Deaths in the United States, 1992 to 1994,” Journal of
the American Medical Association, June 12, 1996, 275(22): 1729-1733.
7
Percent ofPublic SchoolsReportingCrime andViolence
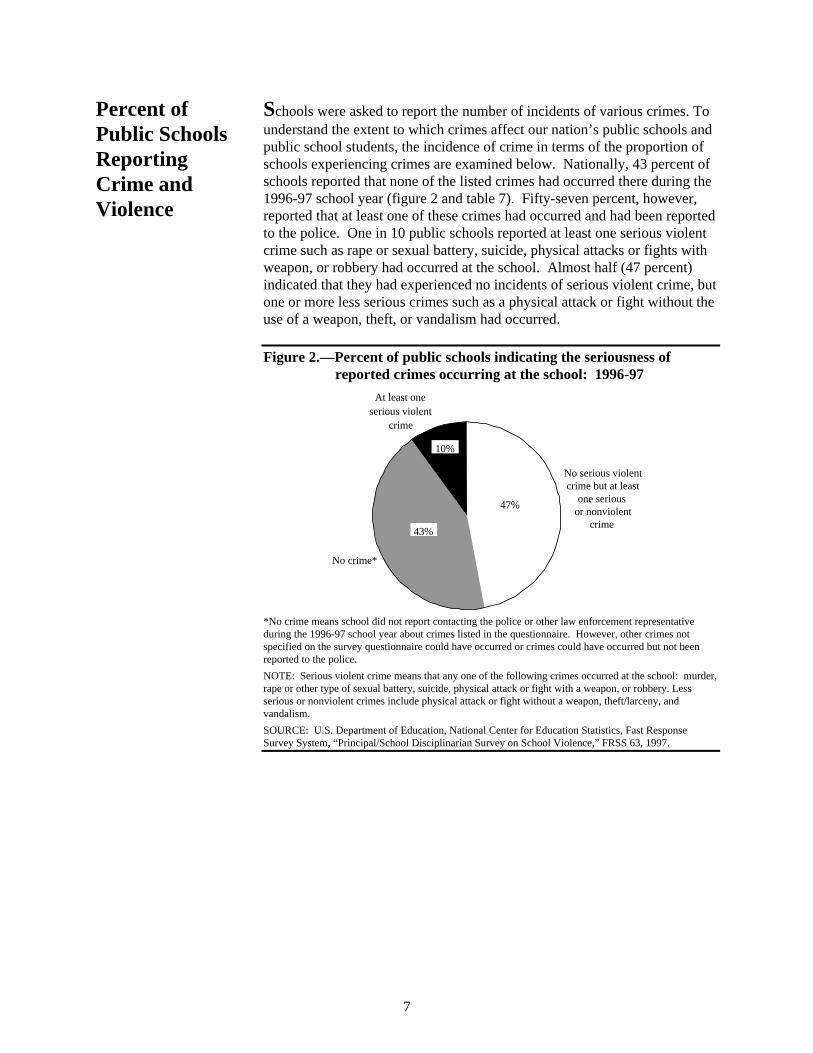
Schools were asked to report the number of incidents of various crimes. Tounderstand the extent to which crimes affect our nation’s public schools andpublic school students, the incidence of crime in terms of the proportion ofschools experiencing crimes are examined below. Nationally, 43 percent ofschools reported that none of the listed crimes had occurred there during the1996-97 school year (figure 2 and table 7). Fifty-seven percent, however,reported that at least one of these crimes had occurred and had been reportedto the police. One in 10 public schools reported at least one serious violentcrime such as rape or sexual battery, suicide, physical attacks or fights withweapon, or robbery had occurred at the school. Almost half (47 percent)indicated that they had experienced no incidents of serious violent crime, butone or more less serious crimes such as a physical attack or fight without theuse of a weapon, theft, or vandalism had occurred.
Figure 2.—Percent of public schools indicating the seriousness ofreported crimes occurring at the school: 1996-97
No crime*
At least one serious violent
crime
47%
43%
10%
No serious violentcrime but at least
one serious or nonviolent
crime
*No crime means school did not report contacting the police or other law enforcement representativeduring the 1996-97 school year about crimes listed in the questionnaire. However, other crimes notspecified on the survey questionnaire could have occurred or crimes could have occurred but not beenreported to the police.
NOTE: Serious violent crime means that any one of the following crimes occurred at the school: murder,rape or other type of sexual battery, suicide, physical attack or fight with a weapon, or robbery. Lessserious or nonviolent crimes include physical attack or fight without a weapon, theft/larceny, andvandalism.
SOURCE: U.S. Department of Education, National Center for Education Statistics, Fast ResponseSurvey System, “Principal/School Disciplinarian Survey on School Violence,” FRSS 63, 1997.

8
Vandalism was reported by 38 percent of public schools, theft/larceny by31 percent of schools, and physical attacks or fights without a weapon by 28percent (table 8). These crimes were the most frequently occurring in termsof the percentages of schools affected. Smaller percentages of schoolsreported more serious crimes: 3 percent of public schools reported theoccurrence of a rape or other type of sexual battery at the school; 3 percent, arobbery; and 6 percent, a physical attack or fight in which a weapon hadbeen used.
With the exception of vandalism, roughly the same percentage of schoolsreporting various types of crime also reported incidents involving students aseither victims or perpetrators and that crime occurred during school hours orat school-sponsored events.
A smaller percentage of elementary schools than middle schools or highschools reported that any crime at all occurred during the 1996-97 schoolyear (table 7). About half of all elementary schools (45 percent) reported atleast one crime. In contrast, 74 percent of middle schools and 77 percent ofhigh schools did so. Higher percentages of middle and high schools alsoreported at least one serious violent crime (i.e., robbery, rape or sexualbattery, or assault or fight with a weapon), with about 20 percent indicating aserious violent crime had occurred at the school compared with 4 percent forelementary schools.
School crime was also more likely in larger schools. While 38 percent ofsmall schools reported any incidents, 60 percent of medium-sized schools,and 89 percent of large schools reported criminal incidents. Serious violentcrime was more likely to be reported by the largest schools. One-third ofschools with enrollments of 1,000 or more reported at least one seriousviolent crime, compared with 4 to 9 percent in schools with fewer than 1,000students.
Schools in cities were at least twice as likely to report serious violent crimeas those in towns and in rural locations, although city schools were notsignificantly different from urban fringe schools. Seventeen percent of cityschools reported at least one serious violent crime, while 8 percent of ruralschools and 5 percent of schools located in towns reported any seriousviolent crime. Eleven percent of schools in urban fringe areas reported aserious violent crime, which was not significantly different from cities.
Schools with the highest proportion of minority students were more likely toreport crimes than schools with the smallest proportion of minorityenrollment. Sixty-eight percent of schools with minority enrollments of 50percent or more reported some crime compared with 47 percent of those withless than 5 percent minority enrollment. Further, schools with 50 percent ormore minority enrollment were more likely to report serious violent crimethan with less than 5 percent minority enrollment (15 percent compared with6 percent).
9
Schools indicating that they have a policy to report crimes to the public wereless likely to report having experienced any crime than those without thispolicy, but both types of schools were about as likely to report at least oneserious crime. Greater police or law enforcement presence, however, wasassociated with the incidence of serious crime. Schools with police or otherlaw enforcement stationed at the school for 30 or more hours per week weremore likely to report having experienced a serious violent crime (38 percent)compared with schools in which police were not stationed or stationed onlyas needed (6 to 14 percent, respectively).
Schools in which principals perceived that general discipline issues were nota serious problem were more likely to report that they had no crimeincidents. Sixty percent of public schools in which principals reported nodiscipline problems or only minor discipline problems reported no crime forthe 1996-97 school year. Thirty-eight percent of those in which schoolprincipals reported some moderate discipline problems reported having nocrime, and 14 percent of schools with at least one discipline problemconsidered serious by their principal had no reported crime. Among schoolswith at least one discipline problem considered serious, 28 percent reportedserious crime compared with 3 percent of schools with no disciplineproblems or minor problems, and 10 percent of those with moderateproblems.
Frequency ofCrime andViolence
Most public schools experienced a relatively small number of crimes in1996-97. While 43 percent reported none of the crimes for which the surveycollected data, 37 percent reported 1 to 5 incidents of crime at the school(figure 3). Seven percent of public schools reported having between 6 and10 separate incidents during the 1996-97 school year, and 12 percentreported more than 10 incidents for that period. The number of incidents is afactor of the size of schools. Therefore, another measure, the ratio ofincidents of crimes, was used to determine the frequency of crime inschools.6
Overall, about 1,000 crimes per 100,000 students were reported in ournation’s public schools (table 9). This included about 950 crimes per100,000 that were not serious or violent crimes (theft, vandalism, fights orassaults without a weapon) and about 50 serious violent crimes per 100,000students (rape or sexual battery, robbery, fight with a weapon, suicide). Theoverall rate of crime differed by school characteristics. Elementary schoolsreported about 350 crimes per 100,000 students, compared with about 1,625in middle schools and about 1,800 in high schools. The ratio of seriousviolent crime was lowest in elementary schools, with 13 violent crimes
6 It should be noted that the ratio of incidents of crimes was calculated from the number of incidents
reported by public schools per 100,000 public school students and does not represent student-reportedvictimization rates.

10
reported per 100,000 students compared with 93 per 100,000 students inmiddle schools and 103 per 100,000 students in high schools.
Figure 3.—Percent of public schools with number of reported crimeincidents at the school: 1996-97
37%
7%12%
43% 1 to 5
reported
incidents
6 to 10
reported
incidentsMore than 10
reported incidents
No
reported
incidents
NOTE: The number of reported incidents of crime at the school are based on the total number of thefollowing crimes for which the school reported that the police were contacted: murder, rape or othersexual battery, suicide, physical attack or fight with and without a weapon, robbery, theft or larceny, andvandalism. Percents may not add to 100 because of rounding.
SOURCE: U.S. Department of Education, National Center for Education Statistics, Fast ResponseSurvey System, “Principal/School Disciplinarian Survey on School Violence,” FRSS 63, 1997.
While a lower percentage of small schools reported any serious violent crimecompared with medium and large schools, the ratio of serious violent crimesper 100,000 students was lower in medium-sized schools than in largeschools. Medium-sized schools reported 38 serious violent crimes per100,000 students, compared with the 90 serious violent crimes per 100,000students reported by large schools. Small schools reported 61 serious violentcrimes per 100,000 students.
City schools reported 95 incidents of serious violence per 100,000 students,compared with 28 serious violent incidents per 100,000 students in towns.City schools, however, were not significantly different from rural or urbanfringe schools in this regard.
The ratio of serious violent crime was associated with percent minorityenrollment. While the ratio of serious violent crime per 100,000 studentswas 19 in schools with less than 5 percent minority enrollment, it was 51 per100,000 students in those schools with 20 to 49 percent minority students,and 96 per 100,000 in schools with 50 percent or more minority enrollment.

11
Frequency ofSpecific Crimes
For every 100,000 public school students, 26 attacks or fights with aweapon, 17 robberies, and 10 rapes occurred at school (table 10). Theserepresented the serious violent crimes for which the survey collected data.More frequently reported were the less serious or nonviolent crimesincluding 444 attacks or fights without a weapon, 274 incidents of theft orlarceny, and 234 incidents of vandalism per 100,000 students in publicschools.
Elementary schools, which reported proportionately fewer incidents ofserious violent crime in general, reported lower rates of both physical attacksor fights in which weapons were used and rape or other type of sexualbattery than middle and high schools. Differences between elementaryschools and high schools were also found in the rate at which robbery wasreported, although no difference was found between elementary and middleschools for this crime. Physical attacks or fights in which weapons wereused were almost 7 times more frequent in middle and high schools than inelementary schools. While there were 7 physical attacks or fights with aweapon per 100,000 students in elementary schools, the rate was 49 per100,00 middle school students and 46 per 100,000 high school students.Rapes or other types of sexual battery were reported in middle and highschools at about the same rate, with 17 per 100,000 students in middleschools and 18 per 100,000 in high schools, as compared to the 3 rapes orother type of sexual battery per 100,000 students reported in elementaryschools.
Of the less serious or nonviolent crimes (vandalism, physical attacks orfights without a weapon, and theft or larceny), the ratio at which all threecrimes occurred was more frequent in middle and high schools than inelementary schools. Physical attacks or fights without a weapon were thenumber one crime in both middle schools and high schools, followed bytheft and vandalism.

12
Principals’Perceptions ofDisciplineIssues in TheirSchools
Principals were asked to report the extent to which specific discipline issueswere a problem in their schools during the 1996-97 school year so that therelationship between discipline and crime could be examined. Additionally,data were available on this topic from a 1991 survey which could be used forcomparisons.
Principals were asked to rate each of the following disciplineissues as a serious problem, moderate problem, minor problem,
or not a problem at the school
• Student tardiness
• Student absenteeism
• Physical conflicts amongstudents
• Robbery or theft of itemsworth over $10
• Vandalism of schoolproperty
• Student alcohol use
• Student drug use
• Sale of drugs on schoolgrounds
• Student tobacco use
• Student possession ofweapons
• Trespassing
• Verbal abuse of teachers
• Physical abuse of teachers
• Teacher absenteeism
• Teacher alcohol or drug use
• Racial tensions and
• Gangs
Overall, principals generally perceived these discipline issues in theirschools as no more than minor problems (43 percent) or moderate problems(41 percent; figure 4). Sixteen percent of public school principals, however,perceived at least one discipline issue as a serious problem.
During the 1996-97 school year, student tardiness (40 percent), studentabsenteeism or class cutting (25 percent), and physical conflicts amongstudents (21 percent) were the three discipline issues most often cited bypublic school principals as serious or moderate problems in their schools(derived from table 11). Public school principals were much less likely (0 to2 percent) to indicate that teacher alcohol or drug use, physical abuse ofteachers, the sale of drugs on school grounds, and student possession ofweapons were serious or moderate problems at their school than the threemost prevalent problems.
13
Figure 4.—Percent of public schools reporting the extent to whichdiscipline issues were a problem at the school: 1996-97
No problems/
minor problems
Moderate
problems
Serious
problems
41%
16%
43%
NOTE: Serious problems means the respondent indicated at least 1 of 17 different discipline issues was aserious problem. Moderate problems means the respondent indicated at least one discipline issue was amoderate problem and there were no serious problems. No problems/minor problems means therespondent indicated all discipline issues were either no problem or a minor problem.
SOURCE: U.S. Department of Education, National Center for Education Statistics, Fast ResponseSurvey System, “Principal/School Disciplinarian Survey on School Violence,” FRSS 63, 1997.
Types of SchoolsWith DisciplineProblems
Principals were more likely to perceive at least one discipline issue as aserious problem in high schools and schools with enrollments of more than1,000 students (table 12). Comparatively, the lowest percent of schools withprincipals reporting serious discipline problems were elementary schools (8percent), followed by middle schools (18 percent). Twice as manyprincipals in high schools reported some serious discipline problems (37percent). Thirty-eight percent of principals in large schools reported someserious discipline problems compared with 15 percent of principals inmedium-sized schools and 10 percent of principals in small schools.
The discipline issues most frequently reported as moderate or seriousproblems by principals differed by instructional level, school size, locationof school, minority enrollment, and the percentage of students eligible forthe federally funded free or reduced-price lunch program (tables 13 through17). For elementary and high schools, student tardiness and studentabsenteeism or class cutting were among the three most often cited seriousor moderate discipline problems (32 and 67 percent, respectively, for studenttardiness, and 17 and 52 percent, respectively, for student absenteeism/classcutting; figure 5 and table 13). Principals of elementary and middle schoolsalso reported physical conflicts among students as one of their top threeserious or moderate discipline problems (18 percent and 35 percent,respectively), whereas in high schools, student tobacco, drug, and alcoholuse were more often reported as serious or moderate problems than physical

14
conflicts among students (48, 36, and 27 percent compared with 17 percent,respectively).
Figure 5.—Percent of public schools reporting that specific disciplineissues were a serious or moderate problem at the school, byinstructional level: 1996-97
40
32
40
67
25
17
24
52
2118
35
1714
2
19
48
0
20
40
60
80
100
All public schools Elementary Middle High
Percent Student tardiness
Student absenteeism/class cutting
Physical conflicts among students
Student tobacco use
SOURCE: U.S. Department of Education, National Center for Education Statistics, Fast ResponseSurvey System, “Principal/School Disciplinarian Survey on School Violence,” FRSS 63, 1997.
Principals in large schools were more likely to report student tardiness was aserious or moderate problem than those in medium-sized and small schools(64 percent compared with 42 percent and 29 percent, respectively; table14). Student absenteeism/class cutting was also more of an issue in largeschools, with 53 percent of these schools compared with 24 percent ofmedium schools and 19 percent of small schools considering it a serious ormoderate problem. Tobacco use was also more frequently regarded as aserious or moderate problem in large schools (40 percent of large schools,compared with 11 percent of medium and 13 percent of small schools).
Physical conflicts among students were more frequently reported to beserious or moderate discipline problems in city schools than in rural schools(25 percent versus 14 percent; table 15). Student tardiness was morefrequently reported as a serious or moderate problem by principals in schoolswith a minority enrollment of more than 50 percent (56 percent) comparedwith 25 to 42 percent in schools with less than 20 percent minorityenrollment (table 16). This pattern was also found in schools with thehighest percentage of students eligible for the federally funded free orreduced-price lunch program compared to the lowest (table 17). Twenty-nine percent of schools with 75 percent or more students eligible for theschool lunch program reported physical conflicts as a serious or moderate

15
problem, compared with 13 percent in schools that have fewer than 20percent of students eligible for the free or reduced-price lunch.
RelationshipBetween Safetyand Principals’Perceptions ofDiscipline Issues
Principals’ perceptions of discipline issues were related to reported crime intheir schools. Among principals in schools with no reported crime,59 percent reported that discipline issues were either not a problem or thatthere were only minor problems compared with 31 percent in schools with atleast one crime (figure 6). Conversely, 24 percent of principals in schoolswith any crime at their schools perceived at least one discipline issue as aserious problem while 5 percent of principals in schools with no crimeperceived that their schools had one or more serious discipline problems.
Figure 6.—Percent of public schools reporting the extent to whichdiscipline issues were a problem at the school, by reportedcrime in the school: 1996-97
1Serious problems means the respondent indicated at least 1 of 17 different discipline issues was a seriousproblem. Moderate problems means the respondent indicated at least one discipline issue was a moderateproblem and there were no serious problems. No problems/minor problems means the respondentindicated all discipline issues were either no problem or a minor problem.2No crime means school did not report contacting the police or other law enforcement representativeduring 1996-97 school year about listed crimes. Any crime means the school reported contacting thepolice or other law enforcement representative at least once about the listed crimes.
SOURCE: U.S. Department of Education, National Center for Education Statistics, Fast ResponseSurvey System, “Principal/School Disciplinarian Survey on School Violence,” FRSS 63, 1997.
Comparisons ofPrincipals’Perceptions in1991 and 1997
Identical information on principals’ perceptions of discipline problems, withthe exception of an item about gangs, was collected in another FRSS surveyconducted in 1991. A few comparisons of the principal-reported data overtime are noteworthy, and tables 13 through 17 provide data for both years.
59
3136
45
5
24
0
20
40
60
80
100
Schools with no crime2 Schools with any crime2
Percent No problems/minor problems1
Moderate problems1
Serious problems1

16
Although student tardiness, student absenteeism/class cutting, and physicalconflicts were the three most often mentioned serious or moderate disciplineproblems in 1991 and 1997, principals in high schools were more likely toreport tardiness, absenteeism/class cutting, and student drug use as serious ormoderate problems in 1997 (67, 52, and 36 percent, respectively) than in1991 (50, 39, and 20 percent, respectively; table 13).
Among those schools with 75 percent or more students eligible for thefederally funded free or reduced-price lunch program, teacher absenteeismwas less likely to be rated as a serious or moderate problems in 1997 byprincipals (table 17). In 1991 teacher absenteeism was reported to be aserious or moderate problem by 33 percent of principals compared to 15percent of principals in 1997.
School Actionsand Reactionsto DisciplineIssues
The survey asked respondents to indicate how many of three specificactions were taken against students for each of the following offenses:
• The possession or use of a firearm;
• The possession or use of a weapon other than a firearm;
• The possession, distribution, or use of alcohol or drugs, includingtobacco; and
• Physical attacks or fights.
The three disciplinary actions about which schools were asked to report wereexpulsions, transfers to alternative schools or programs, and out-of-schoolsuspensions lasting 5 or more days. It is important to note that schools mayhave chosen to invoke any, more than one, or none of these disciplinaryactions during the 1996-97 school year for the above offenses. They mayalso have taken other disciplinary actions. Thus, these three disciplinaryoptions are not an exhaustive list, simply those that were focused upon inthis survey. It is important to note that schools may not have experiencedany of the crimes or infractions and therefore took no actions.
Possession or use of a firearm. For the possession or use of a firearm,5 percent of all schools reported taking one or more of these three actionsagainst students for a total of 16,587 actions (table 18). Half of the actionsreported were out-of-school suspensions lasting 5 or more days (49 percent;figure 7). Twenty percent of school-reported actions were transferringstudents to alternative schools or programs, and 31 percent were expulsionsof students for the possession or use of a firearm (figure 7 and table 18).
Possession or use of a weapon other than a firearm. Weapons other thana firearm were defined as any instrument or object used with the intent to

17
threaten, injure, or kill, including knives, razor blades or other sharp-edgedobjects, ice picks or other pointed objects, baseball bats, sticks, rocks, orbottles. Twenty-two percent of public schools reported having taken one ormore of the specific actions against students for possession or use of aweapon other than a firearm (table 18). About 58,000 actions were reported:23 percent of these actions were expulsions, 22 percent were transfers toalternative programs or schools, and 55 percent were out-of school-suspensions lasting 5 or more days (figure 7 and table 18).
Possession, distribution, or use of alcohol or drugs, including tobacco.For the possession, distribution, or use of alcohol, drugs, and tobacco,27 percent of schools reported taking a total of about 170,000 actions:62 percent of the actions were out-of-school suspensions lasting 5 or moredays, 20 percent were transfers to alternative schools or programs, and 18percent were expulsions (figure 7 and table 18).
Figure 7.—Percent of specified disciplinary actions taken by publicschools for specific offenses, by type of action taken:1996-97
31
2318 15
4955
6266
20 22 20 19
0
20
40
60
80
100
Possession or use of a firearm
Possession or use of a weapon other
than a firearm
Possession,distribution, or use of
alcohol or drugs,including tobacco
Physical attacks orfights
Percent Expulsions
Out-of-school suspensions lasting 5 or more days
Transfers to alternative schools or programs
SOURCE: U.S. Department of Education, National Center for Education Statistics, Fast ResponseSurvey System, “Principal/School Disciplinarian Survey on School Violence,” FRSS 63, 1997.
Physical Attacks or Fights. About 40 percent of all public schools reportedhaving taken at least one of the actions against students for fighting for anestimated total of 331,000 actions (figure 7 and table 18). The mostcommonly reported action was out-of-school suspensions lasting 5 or moredays (66 percent), followed by transfers to an alternative school or programand expulsions (19 and 15 percent, respectively).

18
Zero TolerancePolicies
Three-quarters or more of all schools reported having zero tolerance policiesfor various student offenses (figure 8 and table 19). “Zero tolerance policy”was defined as a school or district policy that mandates predeterminedconsequence/s or punishments for specific offenses. About 90 percent ofschools reported zero tolerance policies for firearms (94 percent) andweapons other than firearms (91 percent). Eighty-seven and 88 percent hadpolicies of zero tolerance for alcohol and drugs, respectively. Seventy-ninepercent had a zero tolerance policy for violence and 79 percent had a zerotolerance policy for tobacco.
Figure 8.—Percent of public schools that have adopted zero tolerancepolicies for various student offenses: 1996-97
79 7987 88 91 94
0
20
40
60
80
100
Violence Tobacco Alcohol Drugs Weapons,
other than
firearms
Firearms
Percent
SOURCE: U.S. Department of Education, National Center for Education Statistics, Fast ResponseSurvey System, “Principal/School Disciplinarian Survey on School Violence,” FRSS 63, 1997.
Schools with no crime reported were less likely to have a zero tolerancepolicy for violence (74 percent) than schools that had reported one or moreserious crimes (85 percent).
Policies to ReportCrimes to thePublic
Thirty-nine percent of public schools had a policy to report serious crimes tothe public (table 20). Schools with no reported crime (46 percent) weremore likely than schools with reported crime (34 percent) to have such apolicy.

19
Requiring SchoolUniforms
Three percent of all public schools require students to wear uniforms (table21). About one-fourth (26 percent) of these schools initiated the requirementprior to the 1994-95 school year, 40 percent initiated it between the 1994-95and 1995-96 school years, and 34 percent initiated it in 1996-97 (figure 9).
Figure 9.—Percent of public schools requiring school uniforms, by yearrequirement initiated
40%
34%26%
Prior to 1994-95 school year
1994-95 or 1995-96 school years
1996-97 school year
NOTE: Based on the 3 percent of all public schools which require uniforms.
SOURCE: U.S. Department of Education, National Center for Education Statistics, Fast ResponseSurvey System, “Principal/School Disciplinarian Survey on School Violence,” FRSS 63, 1997.
Uniforms were more likely to be required in schools with a high percentageof students eligible for free or reduced-price lunch (11 percent in schoolswith 75 percent or more free or reduced-price lunch eligibility) comparedwith schools in which less than 50 percent of students were eligible (2percent or less; table 21). Schools with 50 percent or more minorityenrollment were also more likely to require student uniforms than those withlower minority enrollment (13 percent compared with 2 percent or less).
School Effortsto EnsureSafety andPromoteDiscipline
Schools completing the survey were given a list of seven security measureswidely used to ensure safety in schools and asked if these measures wereused in their institutions.
Schools reported on whether the following actions were taken:
• Visitors were required to sign in;
• Access to school grounds was controlled;
• Access to the school building was controlled;
• School campuses were closed for most students during lunch;

20
• Students had to pass through metal detectors daily;
• Random metal detector checks were performed; and
• Schools conducted drug sweeps (e.g., locker searches, dog searches).
Ninety-six percent of public schools reported that visitors were required tosign in before entering the school buildings (figure 10). This measure wasrequired by almost all schools, with a range of 91-100 percent, regardless ofinstructional level, size, locale, region, minority enrollment, or percentage ofstudents eligible for free or reduced-priced school lunch (table 22).
Figure 10.—Percent of public schools reporting various types of securitymeasures at the schools: 1996-97
96
80
53
2419
4 10
20
40
60
80
100
120
Visitors
sign in
Closed
campus for
most
students
during lunch
Controlled
access to
school
building
Controlled
access to
school
grounds
One or more
drug sweeps
Random
metal
detector
checks
Students
pass through
metal
detectors
daily
Percent
SOURCE: U.S. Department of Education, National Center for Education Statistics, Fast ResponseSurvey System, “Principal/School Disciplinarian Survey on School Violence,” FRSS 63, 1997.
Security included controlled access to school grounds in 24 percent of publicschools and was most prevalent in large schools. Forty-nine percent of largeschools reported controlling access to school grounds, compared with 16percent of small schools and 24 percent of medium-sized schools.
Controlled access to school grounds also varied by locale, region, percentminority enrollment, percent of students eligible for free or reduced-pricelunch, and principals’ reported discipline problems. City schools were morelikely to secure school grounds than rural schools (35 percent, comparedwith 13 percent). Schools in the Central region of the country were abouthalf as likely to report controlling access to school grounds as those in theSoutheast and the West (12 percent compared with 28 to 31 percent,respectively). Controlled access to school grounds was higher in schoolswith the highest percentages of minority students than those with the lowestpercentages (14 percent in schools with less than 5 percent minority

21
enrollment and 38 percent in schools in which at least half the students wereminorities) and in schools with the largest proportions of students in povertythan in those with the lowest (18 percent in schools with less than 20 percenteligibility for the free or reduced-price school lunch program and 37 percentin schools with 75 percent eligibility for the school lunch program).
Fifty-three percent of public schools controlled access to their schoolbuildings. Elementary and middle schools were more likely to secure accessto the school building than high schools (57 and 51 percent compared with40 percent). Differences were also found by school size. Fifty-five percentof large schools and 57 percent of medium-sized schools controlled access totheir school buildings compared with 40 percent for small schools. City andurban fringe schools were also more likely to control building access (62 and68 percent, respectively) compared with those located in towns (49 percent)and rural areas (33 percent). Northeastern schools were more inclined tohave controlled access to their school buildings (70 percent) compared withWestern schools (46 percent), Central schools (48 percent), and Southeasternschools (52 percent).
Eighty percent of schools reported having a closed campus policyprohibiting most students from leaving the campus for lunch. At 93 percent,middle school principals overwhelmingly reported having this policy (table22). A smaller percentage of elementary and high schools had this policy(76 and 78 percent, respectively). Sixty-seven percent of small schools hadinstituted the closed campus policy compared with 82 percent of largeschools.
Daily use of metal detectors as a security measure was reported in 1 percentof public schools. Schools where serious violent crimes were reported weremore likely to employ metal detectors than those with less serious crime onlyor no crime (4 percent compared with 1 percent or less). Random metaldetector checks were more likely to be reported by large schools (15 percent)compared with small schools (less than 1 percent) or medium-sized schools(4 percent). Similarly, a higher percentage of schools where a serious crimewas reported (15 percent) performed these checks compared to schoolswhere no crime was reported (1 percent) or schools where only less seriouscrimes were reported (4 percent).
Middle and high schools where principals reported at least one seriousdiscipline problem were more likely to use drug sweeps (36 and 45 percent,respectively) compared with elementary schools (5 percent).

22
Presence of Policeor Other LawEnforcement inPublic Schools
In addition to the security measures above, 6 percent of public schools hadpolice or other law enforcement representatives stationed 30 hours or moreat the school, 1 percent of schools had law enforcement officials stationed 10to 29 hours, 3 percent had officials stationed from 1 to 9 hours, 12 percent ofschools did not have officials stationed during a typical week (but wereavailable as needed), and 78 percent of schools did not have any officialsstationed at their school during the 1996-1997 school year (table 23). Thefull-time presence of law officials, while rare at elementary schools(1 percent), was found in 10 percent of middle schools and 19 percent ofhigh schools. It was also reported in 39 percent of large schools with 1,000or more students, in 13 percent of city schools and schools with 50 percentor more minority enrollment, in 15 percent of schools in which principalsfelt there were some serious discipline issues, and in 23 percent of schools inwhich at least one serious crime was reported in 1996-97.
Stringency ofSecurity AcrossSchoolCharacteristics
From school-reported information on the types of security measures andpolice presence at the schools, a composite variable was developed todetermine how stringent security was in public schools during 1996-97.Security measures were considered to be stringent if a police or other lawenforcement representative such as a guard was present full-time andstudents passed through metal detectors on a daily basis or were subject torandom checks with metal detectors. Moderate security measures weredefined as either a full-time policeman or guard with no metal detectors andno controlled access to the school building, or a part-time guard with orwithout metal detectors and controlled access to the school building.Schools with no regular guard but with metal detectors were also consideredto have moderate security measures. Schools with low security measureswere those with no guards, no metal detectors, but controlled access to theschool building. Schools were considered to have no security measures ifthere were no guards, no metal detectors, and no controlled access to theschool.
Overall, security was considered stringent in 2 percent of public schools(table 24). Security was moderate in 11 percent of schools, but most, 84percent, had low security, and another 3 percent had no security (figure 11).

23
Figure 11.—Percent of public schools, by degree of security: 1996-97
Low
security
Stringent
security
2%
Moderate
security
No
security
3%
84%
11%
NOTE: Security measures were considered stringent if a full-time guard was present and students mustpass through a metal detector daily or were subject to random checks with metal detectors. Moderatesecurity measures were defined as either a full-time guard with no metal detectors and no restricted accessto school, or a part-time guard with or without metal detectors, but had restricted access. No securitymeasures were schools with no guards, no metal detectors and no restricted access to the school.
SOURCE: U.S. Department of Education, National Center for Education Statistics, Fast ResponseSurvey System, “Principal/School Disciplinarian Survey on School Violence,” FRSS 63, 1997.
ViolencePreventionPrograms
A majority of public school principals (78 percent) reported having sometype of formal school violence prevention or reduction programs (tables 25and 26). The percentage of schools with both 1-day and ongoing programs(43 percent) was almost double the percentage of schools with only ongoingprograms (24 percent) and quadruple the percentage of schools with only 1-day programs (11 percent).
Schools in which a serious crime was reported were more likely to haveviolence prevention programs than those in which no crime or only lessserious crime had occurred (93 percent compared with 74 and 79 percent,respectively; tables 25 and 27). Schools with serious crime also had moreprograms per school. They reported a mean of 6 programs per schoolcompared with 3.4 violence prevention programs in schools with no crime orlesser crimes only (table 27).
In some public schools, incidents during 1996-97 requiring police contactwere used to modify or introduce new violence prevention programs. Ofschools with violence prevention programs that had reported one or morecrimes in 1996-97, 31 percent had used these incidents to introduce ormodify their violence prevention programs (table 28).
School principals were asked if, during the 1996-97 school year, they hadany formal programs or efforts intended to prevent or reduce schoolviolence. Selected components of prevention/reduction programs were

24
listed and principals were asked if any of their programs included each of thefollowing:
Program components
• Prevention curriculum, instruction, or training for students (e.g., socialskills training)
• Behavioral programming or behavior modification for students
• Counseling, social work, psychological, or therapeutic activity forstudents
• Activities involving individual attention for students (e.g., tutoring,mentoring)
• Recreational, enrichment, or leisure activities for students
• Student involvement in resolving student conduct problems (e.g., disputeor conflict resolution or mediation, student court)
• Training, supervision, or technical assistance in classroom managementfor teachers
• Review, revision, or monitoring of schoolwide discipline practices andprocedures
• Community or parent involvement in school violence preventionprograms or efforts
• Reorganization of school, grades, or schedules (e.g., school within aschool, “houses” or “teams” of students)
The prevention curriculum, counseling/social work, and review/revision ofschoolwide discipline practices were components used most often by schoolswith violence prevention or reduction programs (89 percent, 87 percent, and85 percent, respectively), while reorganization of school, grades, orschedules was used least often (28 percent; table 29). With the exception ofcommunity/parental involvement, which 48 percent of schools reportedusing, between 63 percent and 81 percent of the schools with violenceprevention or reduction programs reported using the remaining components.

25
Participation inViolencePreventionPrograms
When asked how many students in their schools participated in violenceprevention programs that directly served students, 50 percent of principals inschools with violence prevention programs reported that all or almost all oftheir students participated (figure 12 and table 30).
Figure 12.—Percent of public schools with violence preventionprograms, by the proportion of their students thatparticipated in these programs: 1996-97
Most
About half
Some
Few
None
All or
almost all
10%
8%
14%
13%
4%
50%
NOTE: Percents may not add to 100 because of rounding.
SOURCE: U.S. Department of Education, National Center for Education Statistics, Fast ResponseSurvey System, “Principal/School Disciplinarian Survey on School Violence,” FRSS 63, 1997.
When asked what proportion of teachers and staff in the schools weresubstantially involved in the programs, 44 percent of principals in schoolswith violence prevention programs reported all or almost all (table 31).Fifty-one percent of elementary school principals reported that all or almostall of their staff were substantially involved in school violence efforts orprograms compared to 40 percent of middle schools and 26 percent of highschools. Forty-six percent of medium-sized schools reported that all oralmost all of their staff were involved in violence prevention programs,compared to 32 percent of large schools.

26
Summary andConclusions
Providing a safe and disciplined learning environment in which our childrencan learn is a national and worthy priority. The FRSS Principal/SchoolDisciplinarian Survey on School Violence was conducted to estimate theincidence and frequency and seriousness of school related crime andviolence during the 1996-97 school year. A nationally representative sampleof 1,234 regular schools participated in the study, and data were weighted tonational totals of all regular public schools in the 50 states and the District ofColumbia.
The sample size was not large enough to yield reliable estimates forincidents with very low incidence such as murder and suicide at school.However, the survey provided estimates for a number of other school-relatedviolent and nonviolent crimes. Data obtained regarding the occurrence ofcrime reflect only incidents that occurred at school, including those that tookplace in school buildings, on school grounds, on school buses, and at school-sponsored events or activities.
Almost half of all public schools reported no incidents of the types of crimesexamined during the 1996-97 school year. However, other schoolsexperienced a variety of crimes ranging from minor to very serious offenses.
Serious violent crime in schools was of particular interest since it speaks tothe safety of our children in their schools. Schools reported incidents ofsuicide, rape or sexual battery, robbery, and physical attacks or fights with aweapon--all of which were considered serious violent crimes. One in 10public schools experienced at least one of these crimes, which occurred at arate of 53 incidents per 100,000 students, during 1996-97. Serious violentcrimes were more likely to occur in large schools. Thirty-three percent ofschools with 1,000 or more students experienced a serious violent crimecompared with 4 to 9 percent in small and medium-sized schools. Largeschools also had a ratio of 90 incidents per 100,000 public school students,compared with the medium-size schools, with 38 serious violent crimes per100,000.
Higher percentages of middle and high schools experienced serious violentcrime than elementary schools. Schools in central cities, while more likelyto experience serious violent crime than those in towns and rural locales, didnot differ significantly from urban fringe schools in terms of the percent ofschools reporting at least one incident. City schools also reported a muchhigher ratio of violence than those in towns, with 95 incidents per 100,000students compared with 28 per 100,000 students attending schools in towns.
Less serious crimes were also examined since they also threaten the orderand safety of schools. Less serious crime for which data were obtainedincluded incidents of physical attacks or fights without a weapon, theft orlarceny, and vandalism. The rate of less serious crime was nearly 20 timesthat of serious violent crime with 949 incidents per 100,000 students.

27
Overall, 38 percent of public schools reported vandalism, 31 percentreported theft, and 28 percent had at least one physical attack or fight inwhich no weapon was used during 1996-97.
Students attending schools with crime experience a learning environment inwhich discipline and safety are jeopardized. The study found that efforts toprevent or reduce violence were being implemented in 78 percent of publicschools. Those in which serious crime was reported were more likely tohave these programs than those with no crime or only less serious crimes(93 percent compared with 74 and 79 percent, respectively).
SurveyMethodologyand DataReliability
Sample Selection
The sample of public schools for the FRSS Principal/School DisciplinarianSurvey on School Violence was selected from the 1993-94 NCES CommonCore of Data (CCD) Public School Universe File. Over 84,000 publicschools are contained in the CCD Universe File, of which almost 79,000—49,000 regular elementary schools, 14,000 regular middle schools, and15,801 regular secondary/combined schools in the 50 states and the Districtof Columbia—meet the eligibility criteria for this study. Excluded from thesampling frame were special education, vocational, and alternative/otherschools, schools in the territories, and schools with a high grade lower thanone or ungraded.
The sample was stratified by instructional level (elementary, middle, andsecondary/combined), locale (city, urban fringe, town, rural), and school size(less than 300, 300 to 999, and 1,000 or more; table A). Within the primarystrata, schools were also sorted by geographic region (Northeast, Southeast,Central, West) and by percent minority enrollment (less than 5 percent ormissing, 5 to 19 percent, 20 to 49 percent, and 50 percent or more). Thesample sizes were then allocated to the primary strata in rough proportion tothe aggregate square root of the size of enrollment of schools in the stratum.The use of the square root of the size of enrollment to determine the sampleallocation is considered efficient for estimating school-level characteristics(e.g., number or percent of schools that reported an incident of robberyoccurred at their school). The sample sizes were large enough to permitlimited analysis of the questionnaire (along one dimension) by the fourregions, four locales, three enrollment size categories, five levels of povertyconcentration, and four categories of minority enrollment, but not theindependent effects of each characteristic.
Respondent andResponse Rates
In April 1997 questionnaires were mailed to 1,415 school principals. Theprincipal was asked either to complete the questionnaire or to have itcompleted by the school disciplinarian who was most knowledgeable aboutdiscipline issues at the school. Telephone followup of nonrespondents wasinitiated in late April, and data collection was completed in July 1997.Eleven schools were found to be out of the scope of the study (no longer in

28
Table A.—Number and percent of responding public schools in the study sample and estimatednumber and percent of public schools the sample represents, by school characteristics:1996-97
Respondent sample National estimateSchool characteristic Number Percent Number Percent
All public schools ............................... 1,234 100 77,752 100
Instructional levelElementary................................................... 354 29 48,100 62Middle ......................................................... 439 36 14,008 18Secondary .................................................... 441 36 15,644 20
Size of enrollmentLess than 300............................................... 169 14 20,280 26300 to 999.................................................... 745 60 50,071 641,000 or more............................................... 320 26 7,402 10
LocaleCity .............................................................. 406 33 17,990 23Urban fringe................................................. 279 23 19,017 25Town ........................................................... 296 24 19,656 25Rural ............................................................ 253 21 21,089 27
Geographic regionNortheast...................................................... 229 19 14,997 19Southeast ..................................................... 296 24 16,949 22Central ......................................................... 323 26 22,500 29West............................................................. 386 31 23,203 30
Percent minority enrollmentLess than 5 percent ...................................... 309 25 24,208 315 to 19 percent ............................................. 297 24 17,555 2320 to 49 percent ........................................... 290 24 17,747 2350 percent or more....................................... 328 27 17,425 23
Percent of students eligible for free orreduced-price school lunch
Less than 20 percent .................................... 332 27 18,473 2420 to 34 percent ........................................... 281 23 17,350 2235 to 49 percent ........................................... 204 17 12,958 1750 to 74 percent ........................................... 233 19 16,038 2175 percent or more....................................... 177 14 12,520 16
Zero tolerance for violenceYes............................................................... 987 80 61,185 79No ................................................................ 246 20 16,538 21
Policy to report crimes to publicYes............................................................... 454 37 30,467 39No ................................................................ 776 63 47,101 61
Principals’ report on problems in schoolNo problems/only minor problems .............. 352 28 33,312 43Only minor or moderate problems ............... 574 47 31,907 41Some problems considered serious.............. 307 25 12,419 16
Types of crimes reportedNo crime ...................................................... 352 28 33,566 43Any crime .................................................... 881 72 43,992 57 Lesser crimes only ..................................... 628 51 36,134 47 Some serious crimes reported .................... 253 21 7,859 10
NOTE: Details may not add to totals because of rounding and because data were not available for some schools.
SOURCE: U.S. Department of Education, National Center for Education Statistics, Fast Response Survey System, “Principal/SchoolDisciplinarian Survey on School Violence,” FRSS 63, 1997.

29
existence), and a total of 1,234 schools completed the survey. Thus, thefinal raw response rate was 88 percent (1,234 schools divided by the 1,404eligible schools in the sample). The weighted overall response rate was 89percent. Weighted item nonresponse rates ranged from 0 percent to 0.9percent. Because the item nonresponse was so low, imputation for itemnonresponse was not implemented.
Comparisons with principals’ perceptions about school discipline in 1991used the results the 1991 FRSS Principal Survey on Safe, Disciplined, andDrug-Free Schools. That survey was mailed to a sample of 890 publicschools in April 1991. Six of the schools were found to be closed, leaving884 schools in the sample. Telephone followup commenced in mid-May;data collection was completed by the end of June, 1991. A response rate of94 percent was achieved (830 responding principals divided by 884principals in the sample) for the 1991 study and item nonresponse rangedfrom 0.0 percent to 3.1 percent.
Because of small sampling differences between the 1991 and 1996-97surveys, it was preferable not to simply make comparisons with dataprovided in the 1991 survey report; consequently, new analyses were run onthe 1991 data file. The 1991 survey design had included regular, vocationaleducation, and alternative schools in the sample, while the 1996-97 surveyincluded only regular schools and excluded vocational and alternativeschools from the sampling frame. Thus, additional analyses were donedropping vocational and alternative schools from the 1991 data set so thatthe samples would be comparable. Thirteen vocational and alternativeschools were dropped from the analyses, and all 1991 data were recalculatedon a sample of 817 regular public schools.
Sampling andNonsamplingErrors
The responses were weighted to produce national estimates. The weightswere designed to adjust for the variable probabilities of selection anddifferential nonresponse. The findings of this survey are estimates basedupon the sample selected and, as a result, are subject to sampling variability.
The survey estimates are also subject to nonsampling errors that can arisebecause of nonobservation (nonresponse or noncoverage) errors, errors ofreporting, and errors made in collection of the data. These errors cansometimes bias data. Nonsampling errors may include such problems as thedifferences in the respondents’ interpretation of the meaning of thequestions; memory effects; misrecording of responses; incorrect editing,coding, and data entry; differences related to the particular time the surveywas conducted; or errors in data preparation. While general sampling theorycan be used in part to determine how to estimate the sampling variability of astatistic, nonsampling errors are not easy to measure and, for measurementpurposes, usually require that an experiment be conducted as part of the datacollection procedures or that data external to the study be used. To

30
minimize the potential for nonsampling errors, the questionnaire waspretested with public school principals like those who completed the survey.During the design of the survey and the survey pretest, an effort was made tocheck for consistency of interpretation of questions and to eliminateambiguous items. The questionnaire and instructions were extensivelyreviewed by the National Center for Education Statistics. Manual andmachine editing of the questionnaire responses were conducted to check thedata for accuracy and consistency. Cases with missing or inconsistent itemswere recontacted by telephone. Data were keyed with 100 percentverification.
Variances The standard error is a measure of the variability of estimates due tosampling. It indicates the variability of a sample estimate that would beobtained from all possible samples of a given design and size. Standarderrors are used as a measure of the precision expected from a particularsample. If all possible samples were surveyed under similar conditions,intervals of 1.96 standard errors below to 1.96 standard errors above aparticular statistic would include the true population parameter beingestimated in about 95 percent of the samples. This is a 95 percentconfidence interval. For example, the estimated percentage of publicschools reporting any incidence of crime is 57 percent, and the estimatedstandard error is 2.1 percent. The 95 percent confidence interval for thestatistic extends from [57-(2.1 times 1.96)] to [57+ (2.1 times 1.96)] or from52.8 to 61.1 percent.
Estimates of standard errors for this report were computed using a techniqueknown as a jackknife replication method. Standard errors for all of theestimates are presented in the tables. All specific statements of comparisonmade in this report have been tested for statistical significance through t-tests adjusted for multiple comparisons using the Bonferroni adjustment, andthey are significant at the 95 percent confidence level or better.
BackgroundInformation
The survey was performed under contract with Westat, using the NCES FastResponse Survey System (FRSS). Westat’s Project Director was ElizabethFarris, and the Associate Project Director and Survey Manager was SheilaHeaviside. Shelley Burns and Edith McArthur were the NCES ProjectOfficers. The data were requested by Kathryn Chandler of the NationalCenter for Education Statistics, Office of Educational Research andImprovement, U.S. Department of Education, and Joanne Wiggins ofPlanning and Evaluation Services in the U.S. Department of Education.
31
This report was reviewed by the following individuals:
Outside NCES
• Lois Fingerhut, Centers for Disease Control and Prevention,Washington, National Center for Health Statistics, Office of Analysis,Epidemiology and Health Promotion
• Oliver Moles, U.S. Department of Education, Office of EducationalResearch and Improvement, National Institute on the Education of At-Risk Students
• Lloyd Potter, Centers for Disease Control and Prevention, Atlanta,National Center for Injury Prevention and Control, Violence PreventionDivision
• Ronald Stephens, National School Safety Center
Inside NCES
• Mary Frase, Data Development and Longitudinal Surveys Group
• Kerry Gruber, Survey and Cooperative Systems Group
• Marilyn McMillen, Survey and Cooperative Systems Group
• Dawn Nelson, Data Development and Longitudinal Surveys Group
• Jeffrey Williams, Survey and Cooperative Systems Group
For more information about the Fast Response Survey System or thePrincipal/School Disciplinarian Survey on School Violence, contact ShelleyBurns, Data Development and Longitudinal Studies Group, National Centerfor Education Statistics, Office of Educational Research and Improvement,555 New Jersey Avenue, NW, Washington, DC 20208-5651, telephone(202) 219-1463. This and other NCES reports are available on the Internetat http://nces.ed.gov/pubsearch/index.html.
References Kachur, S.P., Stennies, G.M., Powell, K.E., Modzeleski, W., Stephens, R.,Murphy, R., Kresnow, M., Sleet, D., and Lowry, R. (1996). “SchoolAssociated Violent Deaths in the United States, 1992 to 1994,”Journal of the American Medical Association, 275(22):1729-1733.
32
U.S. Department of Education, National Center for Education Statistics(1991). Teacher Survey on Safe, Disciplined, and Drug-Free Schools,FRSS 42, NCES 91-091. Washington, DC: U.S. Government PrintingOffice.
U.S. Department of Education, National Center for Education Statistics(1995). Student Victimization at School, NCES 95-204. Washington,DC: U.S. Government Printing Office.
U.S. Department of Justice, Bureau of Justice Statistics (1991). SchoolCrime, NCJ-131645. Washington, DC: U.S. Government PrintingOffice.
Glossary ofTerms
Terms Defined on the Survey Questionnaire
Firearm - any weapon that is designed to (or may readily be converted to)expel a projectile by the action of an explosive. This includes guns, bombs,grenades, mines, rockets, missiles, pipebombs, or similar devices designed toexplode and capable of causing bodily harm or property damage.
Incident - a specific criminal act or offense involving one or more victimsand one or more offenders.
Physical attack or fight without a weapon - an actual and intentionaltouching or striking of another person against his or her will, or theintentional causing of bodily harm to an individual without using a weapon.This category should be used only when the attack is serious enough towarrant calling the police or other law enforcement representative.
Police or other law enforcement representatives - any regular state orlocal law enforcement officers, school resource officers, campus police,security personnel employed by school or district, or other security personnelwith power to arrest or hold for arrest.
Robbery - the taking or attempting to take anything of value that is ownedby another person or organization, under confrontational circumstances byforce or threat of force or violence and/or by putting the victim in fear. Akey difference between robbery and theft/larceny is that a threat or battery isinvolved in robbery.

33
Sexual battery - an incident that includes rape, fondling, indecent liberties,child molestation, or sodomy. These incidents should take intoconsideration the age and developmentally appropriate behavior of theoffenders and are severe enough to warrant calling the police or other lawenforcement representative.
Theft/larceny - the unlawful taking of another person’s property withoutpersonal confrontation, threat, violence, or bodily harm. Included are pocketpicking, stealing purse or backpack (if left unattended or no force was usedto take it from the owner), theft from a building, theft from a motor vehicleor motor vehicle parts or accessories, theft of bicycles, theft from vendingmachines, and other types of thefts.
Typical week - a typical full week of school. Avoid weeks with holidays,vacation periods, or weeks when unusual events took place at the school.
Vandalism - the damage or destruction of school property includingbombing, arson, graffiti, and other acts that cause property damage.
Weapon - any instrument or object used with the intent to threaten, injure, orkill. Examples include guns, knives, razor blades or other sharp-edgedobjects, ice picks, other pointed objects (including pens, pencils), baseballbats, frying pans, sticks, rocks, and bottles.
Zero tolerance policy - a school or district policy that mandatespredetermined consequences or punishment for specific offenses.
Sample Universe and Analysis Variables
Instructional level – Schools were classified according to their grade spanin the Common Core of Data (CCD).
Elementary school – low grade of 3 or less and high grade of 1 through8.
Middle school – low grade of 4 through 9 and high grade of 4 through 9.
High school – low grade of 9 through 12 and a high grade of 10 through12.
Schools that did not precisely meet these qualifications were classifiedas “combined” and included in the analyses with high schools.

34
Size of enrollment - total number of students enrolled as defined byCommon Core of Data (CCD).
Small – less than 300 students.
Medium – 300 to 999 students.
Large – 1,000 or more students.
Locale - as defined in the Common Core of Data (CCD).
City - a central city of a Metropolitan Statistical Area (MSA).
Urban fringe - a place within an MSA of a central city, but notprimarily its central city.
Town - a place not within an MSA, but with a population greater than orequal to 2,500 and defined as urban by the U.S. Bureau of the Census.
Rural - a place with a population less than 2,500 and defined as rural bythe U.S. Bureau of the Census.
Geographic region:
Northeast - Connecticut, Delaware, District of Columbia, Maine,Maryland, Massachusetts, New Hampshire, New Jersey, New York,Pennsylvania, Rhode Island, and Vermont.
Southeast - Alabama, Arkansas, Florida, Georgia, Kentucky, Louisiana,Mississippi, North Carolina, South Carolina, Tennessee, Virginia, andWest Virginia.
Central - Illinois, Indiana, Iowa, Kansas, Michigan, Minnesota,Missouri, Nebraska, North Dakota, Ohio, South Dakota, and Wisconsin.
West - Alaska, Arizona, California, Colorado, Hawaii, Idaho, Montana,Nevada, New Mexico, Oklahoma, Oregon, Texas, Utah, Washington,and Wyoming.
Percent minority enrollment - The percent of students enrolled in theschool whose race or ethnicity is classified as one of the following:American Indian or Alaskan Native, Asian or Pacific Islander, black, orHispanic, based on data in the 1993-94 CCD file.
Percent of students at the school eligible for free or reduced-pricelunch - Based on responses to question 9 on the survey questionnaire (seeappendix A). This item served as the measurement of the concentration ofpoverty at the school.

35
Principals’ report on discipline problems in school - based on acomposite of principal responses to question 1, items a-q on thequestionnaire (see appendix C).
No problems/minor problems - principals selected the responses “not aproblem” or “minor” for all of the discipline problems listed in itemsa-q.
Moderate problems - principals selected “moderate” for one or moreitems a-q, but did not select “serious” for any of the items a-q.
Serious problems - principals selected “serious” for one or more itemsa-q.
Types of crime reported - based on a composite of principal responses toquestion 2, items a-h on the questionnaire providing the number of each ofthe following listed crimes: murder, suicide, rape or sexual battery, physicalattack or fight with a weapon, robbery, physical attack or fight without aweapon, theft or larceny, and vandalism.
No crime - principals reported none of the crimes specified in question2, a-h.
Any crime - principals reported at least one of any of the crimesspecified in question 2, a-h.
Less serious or nonviolent crime - principals reported atleast one incident of any of the specified less serious crimes(physical attack or fight without a weapon, theft or larceny,or vandalism) and no incidents of the more serious crimes(murder, suicide, rape or sexual battery, physical attack orfight with a weapon, or robbery).
Serious violent crime - principals reported at least oneincident of any of the specified more serious or violentcrimes (murder, suicide, rape or sexual battery, physicalattack or fight with a weapon, or robbery).

36
37
Tables of
Estimates and Standard Errors

38

39
Table 1.—Number and percent of public schools reporting one or more incidents of rape or othertype of sexual battery, and total number of incidents of rape or other type of sexualbattery reported in public schools in which police or other law enforcement werecontacted, by school characteristics: 1996-97
Rape or other types of sexual battery
School characteristicNumber of schoolswith one or more
incidents
Percent of schoolswith one or more
incidents
Total number ofincidents
All public schools .................................................. 2,326 3 4,170
Instructional levelElementary school ...................................................... 404 1 690Middle school............................................................. 731 5 1,400High school ................................................................ 1,191 8 2,070
Size of enrollmentLess than 300 ............................................................. 255 1 320300-999...................................................................... 1,232 2 2,0101,000 or more ............................................................. 840 11 1,830
LocaleCity............................................................................. 912 5 1,930Urban fringe ............................................................... 708 4 1,130Town .......................................................................... 256 1 290Rural .......................................................................... 451 2 820
RegionNortheast .................................................................... 333 2 510Southeast .................................................................... 595 4 1,210Central........................................................................ 661 3 1,180West ........................................................................... 738 3 1,270
Percent minority enrollmentLess than 5 percent..................................................... 430 2 6805 to 19 percent............................................................ 557 3 76020 to 49 percent.......................................................... 636 4 1,48050 percent or more ..................................................... 704 4 1,250
Percent of students eligible for free orreduced-price school lunch
Less than 20 percent................................................... 531 3 82020 to 34 percent.......................................................... 589 3 1,14035 to 49 percent.......................................................... 566 4 97050 to 74 percent.......................................................... 250 2 63075 percent or more ..................................................... 373 3 590
Zero tolerance policy for violenceYes ............................................................................. 2,017 3 3,670No .............................................................................. 309 2 500

40
Table 1.—Number and percent of public schools reporting one or more incidents of rape or othertype of sexual battery, and total number of incidents of rape or other type of sexualbattery reported in public schools in which police or other law enforcement werecontacted, by school characteristics: 1996-97--continued
Rape or other types of sexual battery
School characteristicNumber of schoolswith one or more
incidents
Percent of schoolswith one or more
incidents
Total number ofincidents
Principals’ report on discipline problems in school*No problems/minor problems..................................... 129 (+) 180Moderate problems..................................................... 1,028 3 1,930Serious problems........................................................ 1,169 9 2,060
(+) Less than 0.5 percent.
*Discipline problems included student tardiness, student absenteeism, physical conflicts among students, robbery or theft of items over$10, vandalism of school property, student alcohol use, student drug use, sale of drugs on school grounds, student tobacco use, studentpossession of weapons, trespassing, verbal abuse of teachers, physical abuse of teachers, teacher absenteeism, teacher alcohol or druguse, racial tensions, and gangs. Serious problems means the respondent indicated at least 1 of 17 different discipline issues was a seriousproblem. Moderate problems means the respondent indicated at least one discipline issue was a moderate problem and there were noserious problems. No problems/minor problems means the respondent indicated all discipline issues were either no problem or a minorproblem.
NOTE: Details may not add to totals because of rounding and because some classification variables were missing for some schools.The total number of incidents are rounded to the nearest 10.
SOURCE: U.S. Department of Education, National Center for Education Statistics, Fast Response Survey System, “Principal/SchoolDisciplinarian Survey on School Violence,” FRSS 63, 1997.

41
Table 1a.—Standard errors of the number and percent of public schools reporting one or moreincidents of rape or other type of sexual battery and of the total number of incidents ofrape or other type of sexual battery reported in public schools in which police or otherlaw enforcement were contacted, by school characteristics: 1996-97
Rape or other types of sexual battery
School characteristicNumber of schoolswith one or more
incidents
Percent of schoolswith one or more
incidents
Total number ofincidents
All public schools .................................................. 371.4 0.5 676.1
Instructional levelElementary school ...................................................... 229.4 0.5 417.6Middle school............................................................. 169.1 1.2 364.5High school ................................................................ 197.4 1.3 334.8
Size of enrollmentLess than 300 ............................................................. 129.2 0.6 173.0300-999...................................................................... 317.8 0.6 573.51,000 or more ............................................................. 119.6 1.7 312.7
LocaleCity............................................................................. 174.9 1.0 439.4Urban fringe ............................................................... 186.3 1.0 294.2Town .......................................................................... 106.3 0.5 117.2Rural .......................................................................... 187.1 0.9 364.6
RegionNortheast .................................................................... 88.2 0.6 136.0Southeast .................................................................... 155.3 0.9 329.9Central........................................................................ 231.3 1.0 475.4West ........................................................................... 176.7 0.8 337.0
Percent minority enrollmentLess than 5 percent..................................................... 188.2 0.8 341.15 to 19 percent............................................................ 215.8 1.2 332.920 to 49 percent.......................................................... 125.7 0.7 317.650 percent or more ..................................................... 169.4 1.0 258.6
Percent of students eligible for free orreduced-price school lunch
Less than 20 percent................................................... 147.7 0.8 238.820 to 34 percent.......................................................... 176.4 1.0 364.635 to 49 percent.......................................................... 214.7 1.7 411.250 to 74 percent.......................................................... 64.7 0.4 218.075 percent or more ..................................................... 104.3 0.9 151.1
Zero tolerance policy for violenceYes ............................................................................. 367.7 0.6 674.0No .............................................................................. 113.0 0.7 201.4
Principals’ report on discipline problems in schoolNo problems/minor problems..................................... 56.4 -- 90.1Moderate problems..................................................... 265.2 0.8 494.3Serious problems........................................................ 246.0 2.0 432.7
-- Estimate of standard error is not derived because it is based on a statistic estimated at less than 0.5 percent or at 100 percent.
SOURCE: U.S. Department of Education, National Center for Education Statistics, Fast Response Survey System, “Principal/School
Disciplinarian Survey on School Violence,” FRSS 63, 1997.
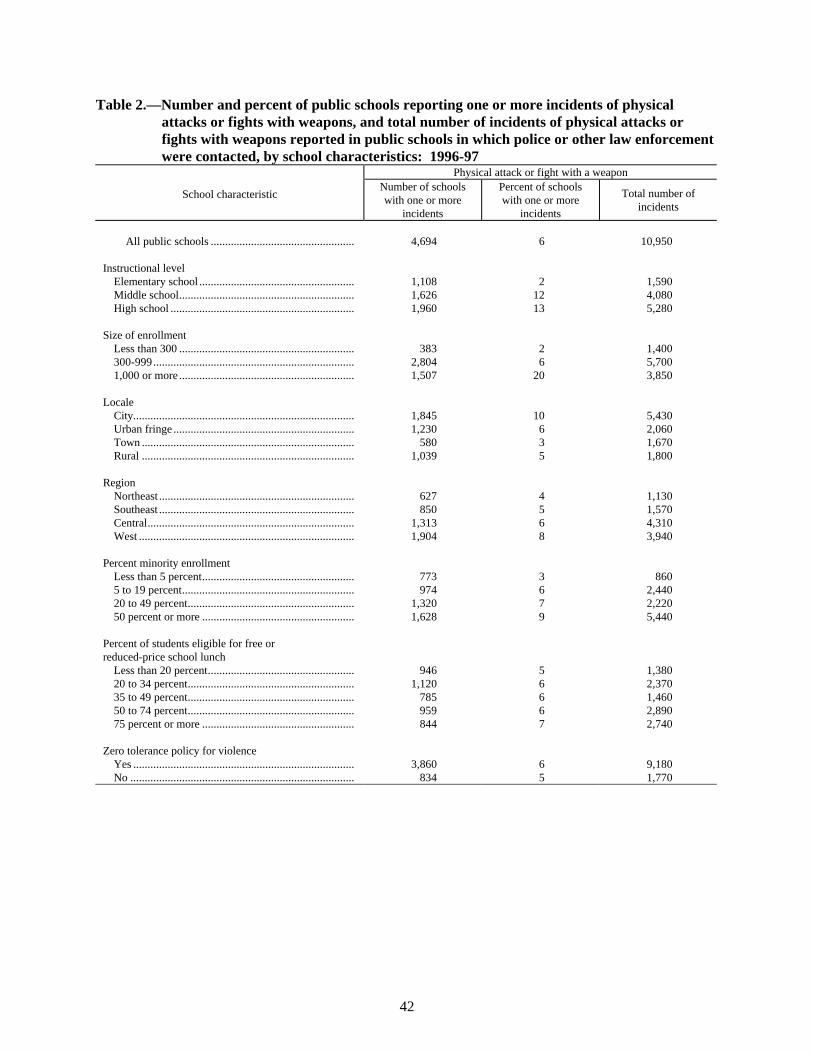
42
Table 2.—Number and percent of public schools reporting one or more incidents of physicalattacks or fights with weapons, and total number of incidents of physical attacks orfights with weapons reported in public schools in which police or other law enforcementwere contacted, by school characteristics: 1996-97
Physical attack or fight with a weapon
School characteristicNumber of schoolswith one or more
incidents
Percent of schoolswith one or more
incidents
Total number ofincidents
All public schools .................................................. 4,694 6 10,950
Instructional levelElementary school ...................................................... 1,108 2 1,590Middle school............................................................. 1,626 12 4,080High school ................................................................ 1,960 13 5,280
Size of enrollmentLess than 300 ............................................................. 383 2 1,400300-999...................................................................... 2,804 6 5,7001,000 or more ............................................................. 1,507 20 3,850
LocaleCity............................................................................. 1,845 10 5,430Urban fringe ............................................................... 1,230 6 2,060Town .......................................................................... 580 3 1,670Rural .......................................................................... 1,039 5 1,800
RegionNortheast .................................................................... 627 4 1,130Southeast .................................................................... 850 5 1,570Central........................................................................ 1,313 6 4,310West ........................................................................... 1,904 8 3,940
Percent minority enrollmentLess than 5 percent..................................................... 773 3 8605 to 19 percent............................................................ 974 6 2,44020 to 49 percent.......................................................... 1,320 7 2,22050 percent or more ..................................................... 1,628 9 5,440
Percent of students eligible for free orreduced-price school lunch
Less than 20 percent................................................... 946 5 1,38020 to 34 percent.......................................................... 1,120 6 2,37035 to 49 percent.......................................................... 785 6 1,46050 to 74 percent.......................................................... 959 6 2,89075 percent or more ..................................................... 844 7 2,740
Zero tolerance policy for violenceYes ............................................................................. 3,860 6 9,180No .............................................................................. 834 5 1,770

43
Table 2.—Number and percent of public schools reporting one or more incidents of physicalattacks or fights with weapons, and total number of incidents of physical attacks orfights with weapons reported in public schools in which police or other law enforcementwere contacted, by school characteristics: 1996-97--continued
Physical attack or fight with a weapon
School characteristicNumber of schoolswith one or more
incidents
Percent of schoolswith one or more
incidents
Total number ofincidents
Principals’ report on discipline problems in school*No problems/minor problems..................................... 479 1 530Moderate problems..................................................... 1,998 6 4,910Serious problems........................................................ 2,217 18 5,510
*Discipline problems included student tardiness, student absenteeism, physical conflicts among students, robbery or theft of items over$10, vandalism of school property, student alcohol use, student drug use, sale of drugs on school grounds, student tobacco use, studentpossession of weapons, trespassing, verbal abuse of teachers, physical abuse of teachers, teacher absenteeism, teacher alcohol or drug/use, racial tensions, and gangs. Serious problems means the respondent indicated at least 1 of 17 different discipline issues was a seriousproblem. Moderate problems means the respondent indicated at least one discipline issue was a moderate problem and there were noserious problems. No problems/minor problems means the respondent indicated all discipline issues were either no problem or a minorproblem.
NOTE: Details may not add to totals because of rounding and because some classification variables were missing for some schools.The total number of incidents are rounded to the nearest 10.
SOURCE: U.S. Department of Education, National Center for Education Statistics, Fast Response Survey System, “Principal/SchoolDisciplinarian Survey on School Violence,” FRSS 63, 1997.
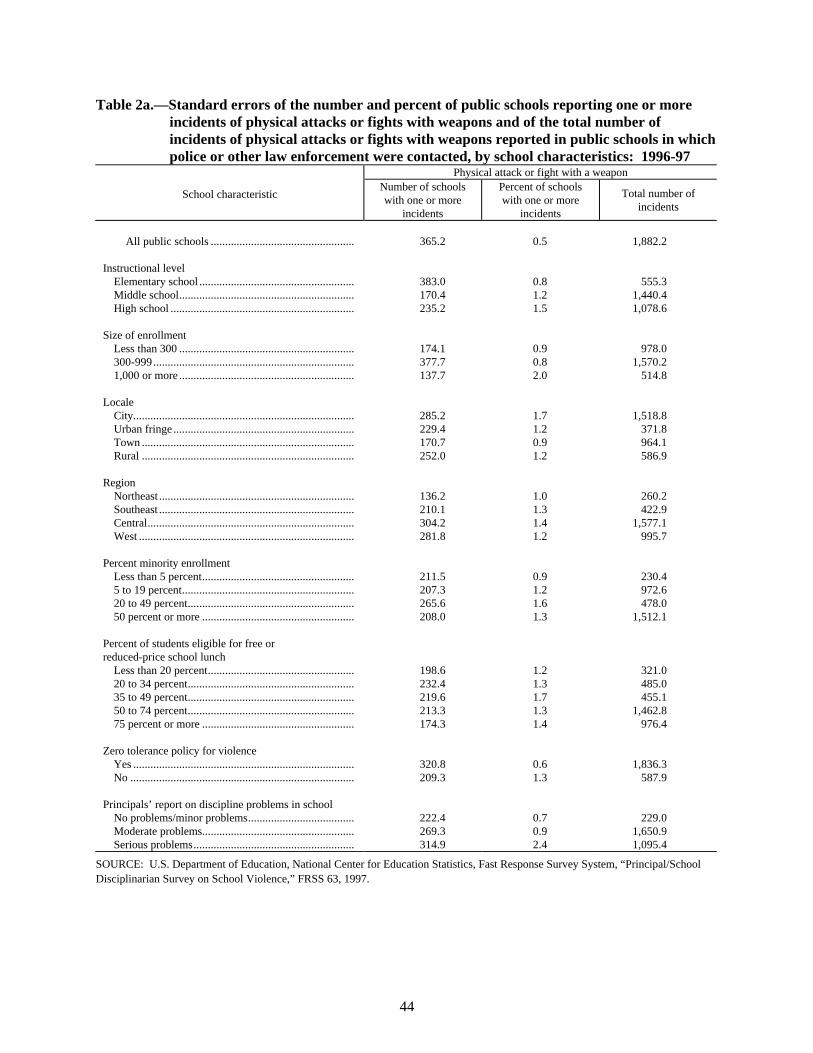
44
Table 2a.—Standard errors of the number and percent of public schools reporting one or moreincidents of physical attacks or fights with weapons and of the total number ofincidents of physical attacks or fights with weapons reported in public schools in whichpolice or other law enforcement were contacted, by school characteristics: 1996-97
Physical attack or fight with a weapon
School characteristicNumber of schoolswith one or more
incidents
Percent of schoolswith one or more
incidents
Total number ofincidents
All public schools .................................................. 365.2 0.5 1,882.2
Instructional levelElementary school ...................................................... 383.0 0.8 555.3Middle school............................................................. 170.4 1.2 1,440.4High school ................................................................ 235.2 1.5 1,078.6
Size of enrollmentLess than 300 ............................................................. 174.1 0.9 978.0300-999...................................................................... 377.7 0.8 1,570.21,000 or more ............................................................. 137.7 2.0 514.8
LocaleCity............................................................................. 285.2 1.7 1,518.8Urban fringe ............................................................... 229.4 1.2 371.8Town .......................................................................... 170.7 0.9 964.1Rural .......................................................................... 252.0 1.2 586.9
RegionNortheast .................................................................... 136.2 1.0 260.2Southeast .................................................................... 210.1 1.3 422.9Central........................................................................ 304.2 1.4 1,577.1West ........................................................................... 281.8 1.2 995.7
Percent minority enrollmentLess than 5 percent..................................................... 211.5 0.9 230.45 to 19 percent............................................................ 207.3 1.2 972.620 to 49 percent.......................................................... 265.6 1.6 478.050 percent or more ..................................................... 208.0 1.3 1,512.1
Percent of students eligible for free orreduced-price school lunch
Less than 20 percent................................................... 198.6 1.2 321.020 to 34 percent.......................................................... 232.4 1.3 485.035 to 49 percent.......................................................... 219.6 1.7 455.150 to 74 percent.......................................................... 213.3 1.3 1,462.875 percent or more ..................................................... 174.3 1.4 976.4
Zero tolerance policy for violenceYes ............................................................................. 320.8 0.6 1,836.3No .............................................................................. 209.3 1.3 587.9
Principals’ report on discipline problems in schoolNo problems/minor problems..................................... 222.4 0.7 229.0Moderate problems..................................................... 269.3 0.9 1,650.9Serious problems........................................................ 314.9 2.4 1,095.4
SOURCE: U.S. Department of Education, National Center for Education Statistics, Fast Response Survey System, “Principal/SchoolDisciplinarian Survey on School Violence,” FRSS 63, 1997.

45
Table 3.—Number and percent of public schools reporting one or more incidents of robbery, andtotal number of incidents of robbery reported in public schools in which police or otherlaw enforcement were contacted, by school characteristics: 1996-97
Robbery
School characteristicNumber of schoolswith one or more
incidents
Percent of schoolswith one or more
incidents
Total number ofincidents
All public schools .................................................. 2,389 3 7,150
Instructional levelElementary school ...................................................... 395 1 390Middle school............................................................. 760 5 2,330High school ................................................................ 1,235 8 4,430
Size of enrollmentLess than 300 ............................................................. 101 (+) 240300-999...................................................................... 1,123 2 3,0401,000 or more ............................................................. 1,166 16 3,870
LocaleCity............................................................................. 1,461 8 4,520Urban fringe ............................................................... 520 3 1,510Town .......................................................................... 171 1 590Rural .......................................................................... 237 1 530
RegionNortheast .................................................................... 468 3 1,570Southeast .................................................................... 394 2 1,310Central........................................................................ 582 3 2,100West ........................................................................... 946 4 2,160
Percent minority enrollmentLess than 5 percent..................................................... 231 1 2605 to 19 percent............................................................ 366 2 64020 to 49 percent.......................................................... 520 3 1,45050 percent or more ..................................................... 1,273 7 4,800
Percent of students eligible for free orreduced-price school lunch
Less than 20 percent................................................... 222 1 67020 to 34 percent.......................................................... 473 3 1,55035 to 49 percent.......................................................... 373 3 88050 to 74 percent.......................................................... 607 4 1,96075 percent or more ..................................................... 698 6 2,020
Zero tolerance policy for violenceYes ............................................................................. 2,003 3 6,260No .............................................................................. 386 2 890

46
Table 3.—Number and percent of public schools reporting one or more incidents of robbery, andtotal number of incidents of robbery reported in public schools in which police or otherlaw enforcement were contacted, by school characteristics: 1996-97--continued
Robbery
School characteristicNumber of schoolswith one or more
incidents
Percent of schoolswith one or more
incidents
Total number ofincidents
Principals’ report on discipline problems in school*No problems/minor problems....................................... 288 1 330Moderate problems....................................................... 820 3 2,590Serious problems.......................................................... 1,282 10 4,230
(+) Less than 0.5 percent.
*Discipline problems included student tardiness, student absenteeism, physical conflicts among students, robbery or theft of items over$10, vandalism of school property, student alcohol use, student drug use, sale of drugs on school grounds, student tobacco use, studentpossession of weapons, trespassing, verbal abuse of teachers, physical abuse of teachers, teacher absenteeism, teacher alcohol or drug/use, racial tensions, and gangs. Serious problems means the respondent indicated at least 1 of 17 different discipline issues was a seriousproblem. Moderate problems means the respondent indicated at least one discipline issue was a moderate problem and there were noserious problems. No problems/minor problems means the respondent indicated all discipline issues were either no problem or a minorproblem.
NOTE: Details may not add to totals because of rounding and because some classification variables were missing for some schools.The total number of incidents are rounded to the nearest 10.
SOURCE: U.S. Department of Education, National Center for Education Statistics, Fast Response Survey System, “Principal/SchoolDisciplinarian Survey on School Violence,” FRSS 63, 1997.

47
Table 3a.—Standard errors of the number and percent of public schools reporting one or moreincidents of robbery and of the total number of incidents of robbery reported in publicschools in which police or other law enforcement were contacted, by schoolcharacteristics: 1996-97
Robbery
School characteristicNumber of schoolswith one or more
incidents
Percent of schoolswith one or more
incidents
Total number ofincidents
All public schools .................................................. 306.4 0.4 1,538.1
Instructional levelElementary school ...................................................... 197.7 0.4 197.7Middle school............................................................. 128.7 0.9 1,021.2High school ................................................................ 151.7 1.0 886.5
Size of enrollmentLess than 300 ............................................................. 74.9 -- 206.3300-999...................................................................... 261.8 0.5 1,249.11,000 or more ............................................................. 122.2 1.8 769.7
LocaleCity............................................................................. 234.3 1.3 1,192.6Urban fringe ............................................................... 127.8 0.7 623.8Town .......................................................................... 87.9 0.4 355.8Rural .......................................................................... 122.6 0.6 291.1
RegionNortheast .................................................................... 80.7 0.6 399.6Southeast .................................................................... 105.1 0.6 660.8Central........................................................................ 185.6 0.8 1,010.5West ........................................................................... 174.4 0.8 471.4
Percent minority enrollmentLess than 5 percent..................................................... 125.7 0.5 135.45 to 19 percent............................................................ 142.7 0.8 247.820 to 49 percent.......................................................... 144.5 0.8 498.450 percent or more ..................................................... 180.7 1.1 1,433.3
Percent of students eligible for free orreduced-price school lunch
Less than 20 percent................................................... 95.7 0.5 339.720 to 34 percent.......................................................... 123.7 0.7 607.535 to 49 percent.......................................................... 135.9 1.1 355.350 to 74 percent.......................................................... 151.2 1.0 1,017.975 percent or more ..................................................... 150.5 1.2 519.8
Zero tolerance policy for violenceYes ............................................................................. 255.1 0.4 1,306.3No .............................................................................. 147.8 0.9 383.6
Principals’ report on discipline problems in schoolNo problems/minor problems..................................... 137.6 0.4 145.0Moderate problems..................................................... 178.6 0.6 996.4Serious problems........................................................ 194.8 1.5 892.0
--Estimate of standard error is not derived because it is based on a statistic estimated at less than 0.5 percent or at 100 percent.
SOURCE: U.S. Department of Education, National Center for Education Statistics, Fast Response Survey System, “Principal/School
Disciplinarian Survey on School Violence,” FRSS 63, 1997.

48
Table 4.—Number and percent of public schools reporting one or more incidents of physicalattacks or fights without weapons, and total number of incidents of physical attacks orfights without weapons reported in public schools in which police or other lawenforcement were contacted, by school characteristics: 1996-97
Physical attack or fight without a weapon
School characteristicNumber of schoolswith one or more
incidents
Percent of schoolswith one or more
incidents
Total number ofincidents
All public schools .................................................. 21,576 28 187,890
Instructional levelElementary school ...................................................... 5,801 12 21,470Middle school............................................................. 7,177 51 73,330High school ................................................................ 8,598 55 93,090
Size of enrollmentLess than 300 ............................................................. 3,372 17 15,590300-999...................................................................... 13,260 26 87,9401,000 or more ............................................................. 4,944 67 84,350
LocaleCity............................................................................. 5,463 30 62,130Urban fringe ............................................................... 5,369 28 54,780Town .......................................................................... 6,242 32 46,290Rural .......................................................................... 4,501 21 24,680
RegionNortheast .................................................................... 3,424 23 29,060Southeast .................................................................... 4,871 29 50,690Central........................................................................ 5,949 26 45,590West ........................................................................... 7,332 32 62,540
Percent minority enrollmentLess than 5 percent..................................................... 5,401 22 24,3405 to 19 percent............................................................ 4,810 27 35,60020 to 49 percent.......................................................... 5,595 32 53,96050 percent or more ..................................................... 5,545 32 72,600
Percent of students eligible for free orreduced-price school lunch
Less than 20 percent................................................... 5,343 29 39,99020 to 34 percent.......................................................... 4,738 27 34,88035 to 49 percent.......................................................... 3,658 28 33,27050 to 74 percent.......................................................... 4,494 28 45,90075 percent or more ..................................................... 3,102 25 28,800
Zero tolerance policy for violenceYes ............................................................................. 17,436 29 157,710No .............................................................................. 4,140 25 30,170

49
Table 4.—Number and percent of public schools reporting one or more incidents of physicalattacks or fights without weapons, and total number of incidents of physical attacks orfights without weapons reported in public schools in which police or other lawenforcement were contacted, by school characteristics: 1996-97--continued
Physical attack or fight without a weapon
School characteristicNumber of schoolswith one or more
incidents
Percent of schoolswith one or more
incidents
Total number ofincidents
Principals’ report on discipline problems in school*No problems/minor problems..................................... 3,828 11 13,680Moderate problems..................................................... 10,204 32 94,610Serious problems........................................................ 7,544 61 79,590
*Discipline problems included student tardiness, student absenteeism, physical conflicts among students, robbery or theft of items over$10, vandalism of school property, student alcohol use, student drug use, sale of drugs on school grounds, student tobacco use, studentpossession of weapons, trespassing, verbal abuse of teachers, physical abuse of teachers, teacher absenteeism, teacher alcohol or drug/use, racial tensions, and gangs. Serious problems means the respondent indicated at least 1 of 17 different discipline issues was a seriousproblem. Moderate problems means the respondent indicated at least one discipline issue was a moderate problem and there were noserious problems. No problems/minor problems means the respondent indicated all discipline issues were either no problem or a minorproblem.
NOTE: Details may not add to totals because of rounding and because some classification variables were missing for some schools.The total number of incidents are rounded to the nearest 10.
SOURCE: U.S. Department of Education, National Center for Education Statistics, Fast Response Survey System, “Principal/SchoolDisciplinarian Survey on School Violence,” FRSS 63, 1997.
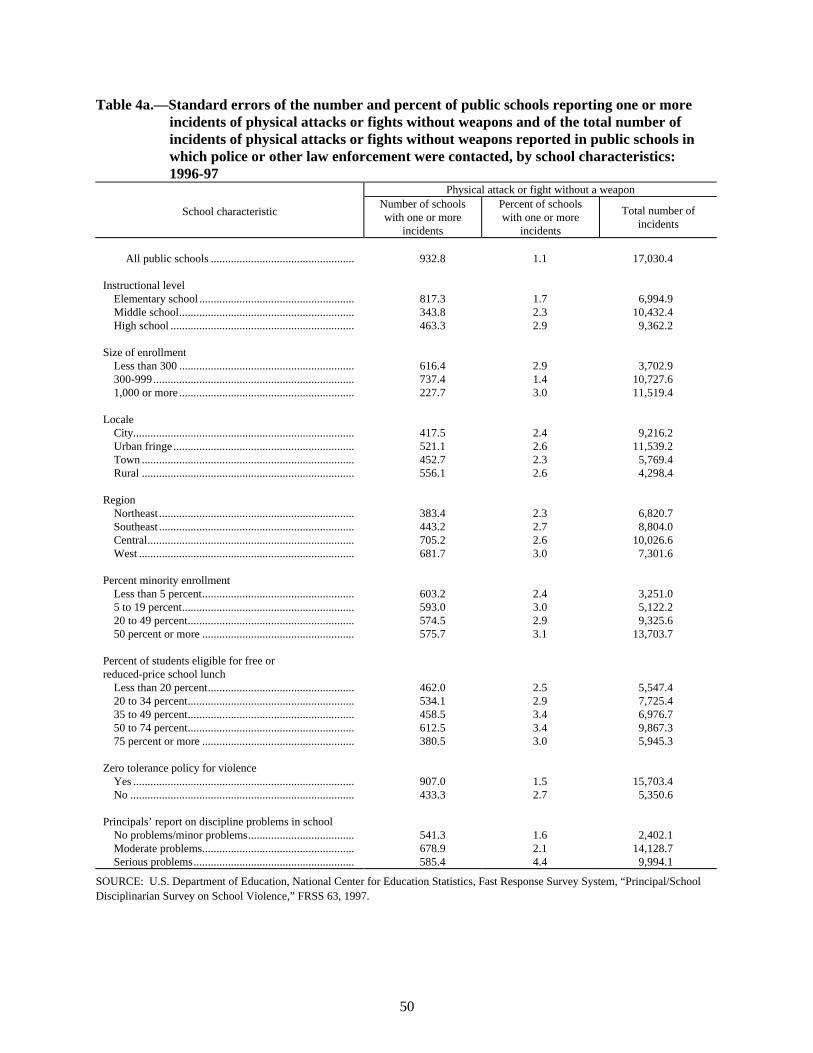
50
Table 4a.—Standard errors of the number and percent of public schools reporting one or moreincidents of physical attacks or fights without weapons and of the total number ofincidents of physical attacks or fights without weapons reported in public schools inwhich police or other law enforcement were contacted, by school characteristics:1996-97
Physical attack or fight without a weapon
School characteristicNumber of schoolswith one or more
incidents
Percent of schoolswith one or more
incidents
Total number ofincidents
All public schools .................................................. 932.8 1.1 17,030.4
Instructional levelElementary school ...................................................... 817.3 1.7 6,994.9Middle school............................................................. 343.8 2.3 10,432.4High school ................................................................ 463.3 2.9 9,362.2
Size of enrollmentLess than 300 ............................................................. 616.4 2.9 3,702.9300-999...................................................................... 737.4 1.4 10,727.61,000 or more ............................................................. 227.7 3.0 11,519.4
LocaleCity............................................................................. 417.5 2.4 9,216.2Urban fringe ............................................................... 521.1 2.6 11,539.2Town .......................................................................... 452.7 2.3 5,769.4Rural .......................................................................... 556.1 2.6 4,298.4
RegionNortheast .................................................................... 383.4 2.3 6,820.7Southeast .................................................................... 443.2 2.7 8,804.0Central........................................................................ 705.2 2.6 10,026.6West ........................................................................... 681.7 3.0 7,301.6
Percent minority enrollmentLess than 5 percent..................................................... 603.2 2.4 3,251.05 to 19 percent............................................................ 593.0 3.0 5,122.220 to 49 percent.......................................................... 574.5 2.9 9,325.650 percent or more ..................................................... 575.7 3.1 13,703.7
Percent of students eligible for free orreduced-price school lunch
Less than 20 percent................................................... 462.0 2.5 5,547.420 to 34 percent.......................................................... 534.1 2.9 7,725.435 to 49 percent.......................................................... 458.5 3.4 6,976.750 to 74 percent.......................................................... 612.5 3.4 9,867.375 percent or more ..................................................... 380.5 3.0 5,945.3
Zero tolerance policy for violenceYes ............................................................................. 907.0 1.5 15,703.4No .............................................................................. 433.3 2.7 5,350.6
Principals’ report on discipline problems in schoolNo problems/minor problems..................................... 541.3 1.6 2,402.1Moderate problems..................................................... 678.9 2.1 14,128.7Serious problems........................................................ 585.4 4.4 9,994.1
SOURCE: U.S. Department of Education, National Center for Education Statistics, Fast Response Survey System, “Principal/SchoolDisciplinarian Survey on School Violence,” FRSS 63, 1997.

51
Table 5.—Number and percent of public schools reporting one or more incidents of theft orlarceny, and total number of incidents of theft or larceny reported in public schools inwhich police or other law enforcement were contacted, by school characteristics:1996-97
Theft or larceny
School characteristicNumber of schoolswith one or more
incidents
Percent of schoolswith one or more
incidents
Total number ofincidents
All public schools .................................................. 23,798 31 115,500
Instructional levelElementary school ...................................................... 9,041 19 19,480Middle school............................................................. 6,166 44 31,470High school ................................................................ 8,591 55 64,550
Size of enrollmentLess than 300 ............................................................. 3,568 18 9,850300-999...................................................................... 15,211 30 51,4301,000 or more ............................................................. 5,019 68 54,220
LocaleCity............................................................................. 6,192 34 39,930Urban fringe ............................................................... 5,446 29 28,270Town .......................................................................... 7,102 36 28,990Rural .......................................................................... 5,057 24 18,320
RegionNortheast .................................................................... 3,964 26 18,070Southeast .................................................................... 5,385 32 23,270Central........................................................................ 5,783 26 22,990West ........................................................................... 8,666 38 51,170
Percent minority enrollmentLess than 5 percent..................................................... 5,865 24 21,4105 to 19 percent............................................................ 4,924 28 29,41020 to 49 percent.......................................................... 5,418 31 25,91050 percent or more ..................................................... 7,188 41 34,830
Percent of students eligible for free orreduced-price school lunch
Less than 20 percent................................................... 5,538 30 29,49020 to 34 percent.......................................................... 4,277 25 26,05035 to 49 percent.......................................................... 4,506 35 21,63050 to 74 percent.......................................................... 4,956 31 22,41075 percent or more ..................................................... 4,439 35 15,800
Zero tolerance policy for violenceYes ............................................................................. 18,971 31 98,410No .............................................................................. 4,798 29 17,060

52
Table 5.—Number and percent of public schools reporting one or more incidents of theft orlarceny, and total number of incidents of theft or larceny reported in public schools inwhich police or other law enforcement were contacted, by school characteristics:1996-97--continued
Theft or larceny
School characteristicNumber of schoolswith one or more
incidents
Percent of schoolswith one or more
incidents
Total number ofincidents
Principals’ report on discipline problems in school*No problems/minor problems..................................... 5,508 17 13,040Moderate problems..................................................... 11,097 35 49,160Serious problems........................................................ 7,078 58 52,960
*Discipline problems included student tardiness, student absenteeism, physical conflicts among students, robbery or theft of items over$10, vandalism of school property, student alcohol use, student drug use, sale of drugs on school grounds, student tobacco use, studentpossession of weapons, trespassing, verbal abuse of teachers, physical abuse of teachers, teacher absenteeism, teacher alcohol or drug/use, racial tensions, and gangs. Serious problems means the respondent indicated at least 1 of 17 different discipline issues was a seriousproblem. Moderate problems means the respondent indicated at least one discipline issue was a moderate problem and there were noserious problems. No problems/minor problems means the respondent indicated all discipline issues were either no problem or a minorproblem.
NOTE: Details may not add to totals because of rounding and because some classification variables were missing for some schools.The total number of incidents are rounded to the nearest 10.
SOURCE: U.S. Department of Education, National Center for Education Statistics, Fast Response Survey System, “Principal/SchoolDisciplinarian Survey on School Violence,” FRSS 63, 1997.
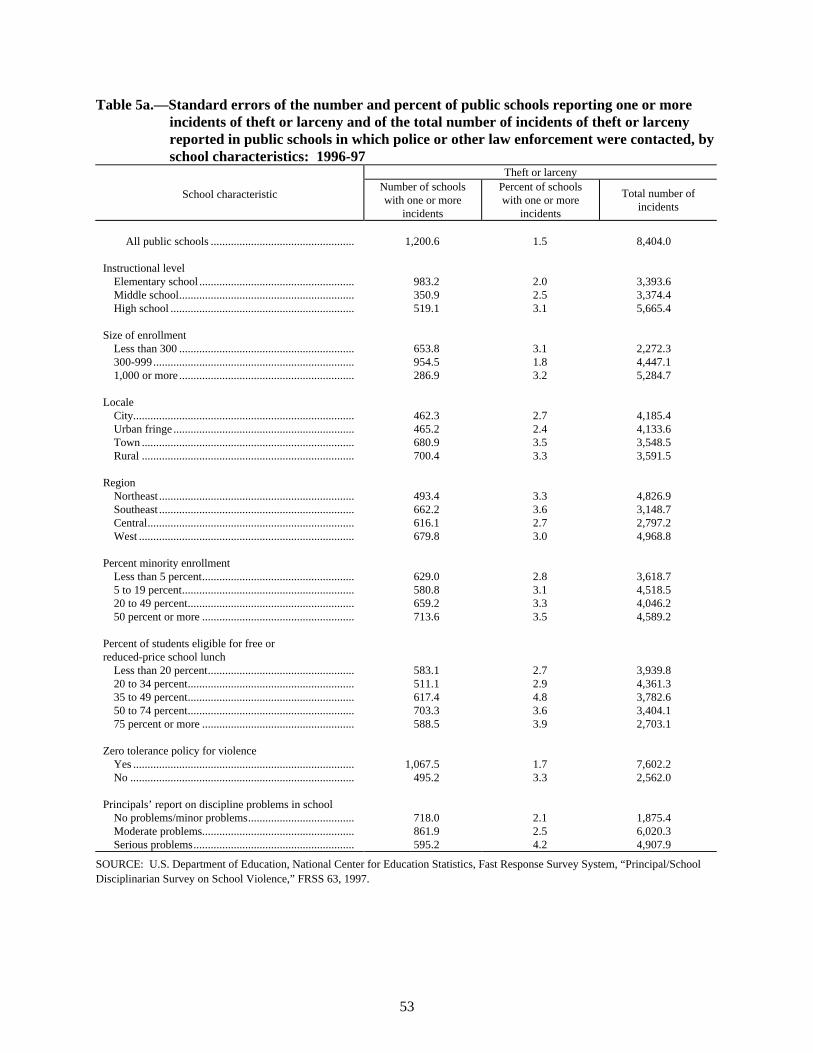
53
Table 5a.—Standard errors of the number and percent of public schools reporting one or moreincidents of theft or larceny and of the total number of incidents of theft or larcenyreported in public schools in which police or other law enforcement were contacted, byschool characteristics: 1996-97
Theft or larceny
School characteristicNumber of schoolswith one or more
incidents
Percent of schoolswith one or more
incidents
Total number ofincidents
All public schools .................................................. 1,200.6 1.5 8,404.0
Instructional levelElementary school ...................................................... 983.2 2.0 3,393.6Middle school............................................................. 350.9 2.5 3,374.4High school ................................................................ 519.1 3.1 5,665.4
Size of enrollmentLess than 300 ............................................................. 653.8 3.1 2,272.3300-999...................................................................... 954.5 1.8 4,447.11,000 or more ............................................................. 286.9 3.2 5,284.7
LocaleCity............................................................................. 462.3 2.7 4,185.4Urban fringe ............................................................... 465.2 2.4 4,133.6Town .......................................................................... 680.9 3.5 3,548.5Rural .......................................................................... 700.4 3.3 3,591.5
RegionNortheast .................................................................... 493.4 3.3 4,826.9Southeast .................................................................... 662.2 3.6 3,148.7Central........................................................................ 616.1 2.7 2,797.2West ........................................................................... 679.8 3.0 4,968.8
Percent minority enrollmentLess than 5 percent..................................................... 629.0 2.8 3,618.75 to 19 percent............................................................ 580.8 3.1 4,518.520 to 49 percent.......................................................... 659.2 3.3 4,046.250 percent or more ..................................................... 713.6 3.5 4,589.2
Percent of students eligible for free orreduced-price school lunch
Less than 20 percent................................................... 583.1 2.7 3,939.820 to 34 percent.......................................................... 511.1 2.9 4,361.335 to 49 percent.......................................................... 617.4 4.8 3,782.650 to 74 percent.......................................................... 703.3 3.6 3,404.175 percent or more ..................................................... 588.5 3.9 2,703.1
Zero tolerance policy for violenceYes ............................................................................. 1,067.5 1.7 7,602.2No .............................................................................. 495.2 3.3 2,562.0
Principals’ report on discipline problems in schoolNo problems/minor problems..................................... 718.0 2.1 1,875.4Moderate problems..................................................... 861.9 2.5 6,020.3Serious problems........................................................ 595.2 4.2 4,907.9
SOURCE: U.S. Department of Education, National Center for Education Statistics, Fast Response Survey System, “Principal/SchoolDisciplinarian Survey on School Violence,” FRSS 63, 1997.

54
Table 6.—Number and percent of public schools reporting one or more incidents of vandalism, andtotal number of incidents of vandalism reported in public schools in which police orother law enforcement were contacted, by school characteristics: 1996-97
Vandalism
School characteristicNumber of schoolswith one or more
incidents
Percent of schoolswith one or more
incidents
Total number ofincidents
All public schools .................................................. 29,269 38 98,490
Instructional levelElementary school ...................................................... 14,596 30 34,850Middle school............................................................. 6,620 47 23,780High school ................................................................ 8,053 52 39,860
Size of enrollmentLess than 300 ............................................................. 4,738 23 12,260300-999...................................................................... 19,986 40 53,9901,000 or more ............................................................. 4,546 62 32,240
LocaleCity............................................................................. 7,352 41 32,750Urban fringe ............................................................... 7,025 37 22,820Town .......................................................................... 8,535 44 25,710Rural .......................................................................... 6,356 30 17,210
RegionNortheast .................................................................... 5,560 37 17,060Southeast .................................................................... 6,174 36 17,310Central........................................................................ 6,793 30 18,590West ........................................................................... 10,742 47 45,520
Percent minority enrollmentLess than 5 percent..................................................... 7,020 29 18,7005 to 19 percent............................................................ 7,005 40 19,68020 to 49 percent.......................................................... 6,704 38 18,47050 percent or more ..................................................... 8,151 47 40,440
Percent of students eligible for free orreduced-price school lunch
Less than 20 percent................................................... 6,853 37 19,31020 to 34 percent.......................................................... 5,821 34 17,69035 to 49 percent.......................................................... 4,906 38 14,73050 to 74 percent.......................................................... 6,237 39 20,15075 percent or more ..................................................... 5,211 42 25,800
Zero tolerance policy for violenceYes ............................................................................. 24,098 40 83,250No .............................................................................. 5,142 31 15,180
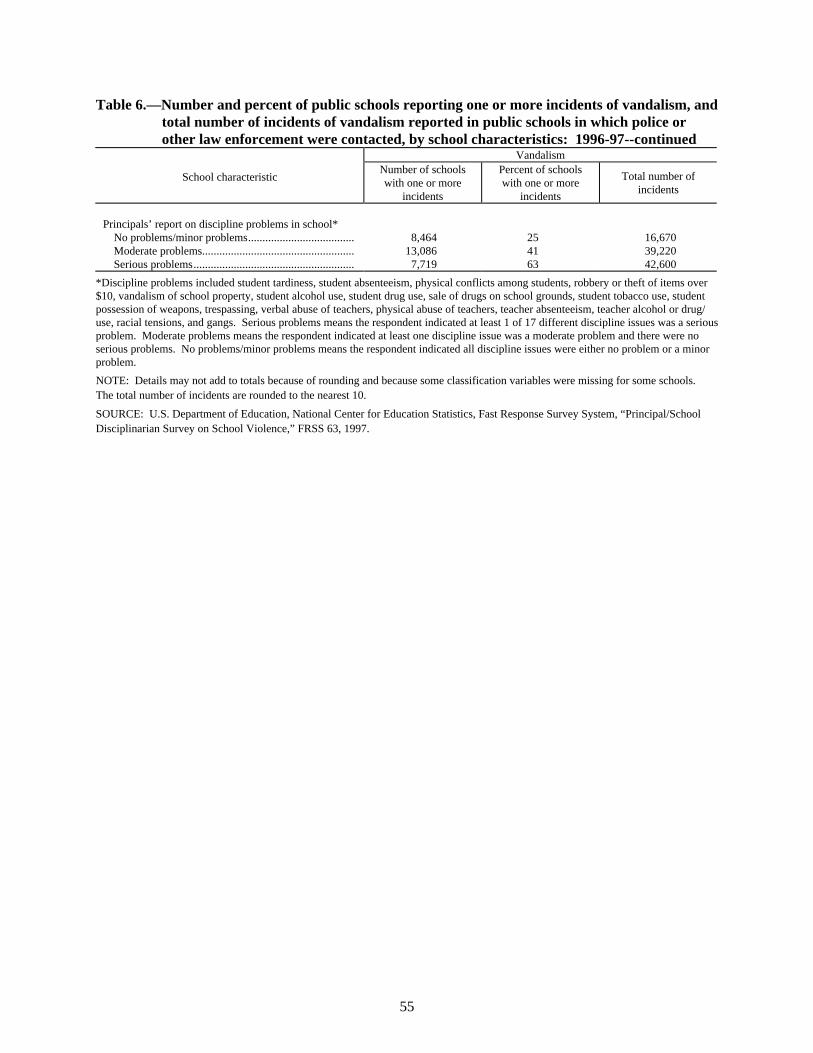
55
Table 6.—Number and percent of public schools reporting one or more incidents of vandalism, andtotal number of incidents of vandalism reported in public schools in which police orother law enforcement were contacted, by school characteristics: 1996-97--continued
Vandalism
School characteristicNumber of schoolswith one or more
incidents
Percent of schoolswith one or more
incidents
Total number ofincidents
Principals’ report on discipline problems in school*No problems/minor problems..................................... 8,464 25 16,670Moderate problems..................................................... 13,086 41 39,220Serious problems........................................................ 7,719 63 42,600
*Discipline problems included student tardiness, student absenteeism, physical conflicts among students, robbery or theft of items over$10, vandalism of school property, student alcohol use, student drug use, sale of drugs on school grounds, student tobacco use, studentpossession of weapons, trespassing, verbal abuse of teachers, physical abuse of teachers, teacher absenteeism, teacher alcohol or drug/use, racial tensions, and gangs. Serious problems means the respondent indicated at least 1 of 17 different discipline issues was a seriousproblem. Moderate problems means the respondent indicated at least one discipline issue was a moderate problem and there were noserious problems. No problems/minor problems means the respondent indicated all discipline issues were either no problem or a minorproblem.
NOTE: Details may not add to totals because of rounding and because some classification variables were missing for some schools.The total number of incidents are rounded to the nearest 10.
SOURCE: U.S. Department of Education, National Center for Education Statistics, Fast Response Survey System, “Principal/SchoolDisciplinarian Survey on School Violence,” FRSS 63, 1997.

56
Table 6a.—Standard errors of the number and percent of public schools reporting one or moreincidents of vandalism, and of the total number of incidents of vandalism reported inpublic schools in which police or other law enforcement were contacted, by schoolcharacteristics: 1996-97
Vandalism
School characteristicNumber of schoolswith one or more
incidents
Percent of schoolswith one or more
incidents
Total number ofincidents
All public schools .................................................. 1,326.4 1.6 5,576.6
Instructional levelElementary school ...................................................... 1,104.8 2.3 4,207.6Middle school............................................................. 396.0 2.6 2,283.3High school ................................................................ 452.3 2.7 2,875.9
Size of enrollmentLess than 300 ............................................................. 846.1 3.9 2,448.2300-999...................................................................... 874.4 1.7 4,138.71,000 or more ............................................................. 281.4 3.3 3,601.1
LocaleCity............................................................................. 561.5 3.2 3,381.5Urban fringe ............................................................... 559.9 2.9 3,505.2Town .......................................................................... 696.5 3.5 2,780.0Rural .......................................................................... 804.3 3.7 2,654.4
RegionNortheast .................................................................... 649.2 3.6 2,380.1Southeast .................................................................... 543.9 3.1 1,843.6Central........................................................................ 904.1 3.6 2,688.8West ........................................................................... 834.6 3.5 4,396.3
Percent minority enrollmentLess than 5 percent..................................................... 855.1 3.3 2,774.55 to 19 percent............................................................ 707.8 3.0 2,868.120 to 49 percent.......................................................... 679.6 3.5 2,223.450 percent or more ..................................................... 859.8 3.3 5,169.1
Percent of students eligible for free orreduced-price school lunch
Less than 20 percent................................................... 714.3 3.6 2,333.820 to 34 percent.......................................................... 704.7 4.0 2,329.235 to 49 percent.......................................................... 621.7 4.4 1,966.650 to 74 percent.......................................................... 760.9 3.6 2,562.975 percent or more ..................................................... 659.0 3.9 4,306.3
Zero tolerance policy for violenceYes ............................................................................. 1,241.5 1.8 5,247.7No .............................................................................. 578.1 3.3 2,327.7
Principals’ report on discipline problems in schoolNo problems/minor problems..................................... 873.2 2.5 2,076.1Moderate problems..................................................... 892.5 2.5 3,259.4Serious problems........................................................ 746.1 4.5 4,662.7
SOURCE: U.S. Department of Education, National Center for Education Statistics, Fast Response Survey System, “Principal/SchoolDisciplinarian Survey on School Violence,” FRSS 63, 1997.

57
Table 7.—Percent of public schools reporting crime incidents and the seriousness of crimeincidents reported, by school characteristics: 1996-97
Seriousness of reported crime
School characteristicNo incidents
reportedAny incidents
reportedSerious violent
crime
Less serious ornonviolentcrime only
All public schools ............................................ 43 57 10 47
Instructional levelElementary school ................................................ 55 45 4 41Middle school....................................................... 26 74 19 55High school .......................................................... 23 77 21 56
Size of enrollmentLess than 300 ....................................................... 62 38 4 34300-999................................................................ 40 60 9 501,000 or more ....................................................... 11 89 33 56
LocaleCity....................................................................... 41 59 17 42Urban fringe ......................................................... 42 58 11 47Town .................................................................... 37 63 5 58Rural .................................................................... 53 47 8 39
RegionNortheast .............................................................. 48 52 7 45Southeast .............................................................. 41 59 9 50Central.................................................................. 49 51 11 40West ..................................................................... 36 64 12 52
Percent minority enrollmentLess than 5 percent............................................... 53 47 6 415 to 19 percent...................................................... 42 58 11 4720 to 49 percent.................................................... 42 58 11 4750 percent or more ............................................... 32 68 15 53
Percent of students eligible for free orreduced-price school lunch
Less than 20 percent............................................. 46 54 9 4620 to 34 percent.................................................... 47 53 12 4235 to 49 percent.................................................... 41 59 12 4850 to 74 percent.................................................... 41 59 9 4975 percent or more ............................................... 41 59 10 49
Zero tolerance policy for violenceYes ....................................................................... 41 59 11 48No ........................................................................ 53 47 7 40
Policy to report crimes to publicYes ....................................................................... 50 50 9 41No ........................................................................ 39 61 11 50
Police/law enforcement presence30 or more hours per week................................... 14 86 38 4910-29 hours per week........................................... 20 80 19 611-9 hours per week............................................... 13 87 28 58Stationed as needed .............................................. 23 77 14 62None stationed...................................................... 50 50 6 43

58
Table 7.—Percent of public schools reporting crime incidents and the seriousness of crimeincidents reported, by school characteristics: 1996-97--continued
Seriousness of reported crime
School characteristicNo incidents
reportedAny incidents
reportedSerious violent
crime
Less serious ornonviolentcrime only
Principals’ report on discipline problems in
school*
No problems/minor problems........................... 60 40 3 37
Moderate problems........................................... 38 62 10 52
Serious problems.............................................. 14 86 28 57
*Discipline problems included student tardiness, student absenteeism, physical conflicts among students, robbery or theft of items over$10, vandalism of school property, student alcohol use, student drug use, sale of drugs on school grounds, student tobacco use, studentpossession of weapons, trespassing, verbal abuse of teachers, physical abuse of teachers, teacher absenteeism, teacher alcohol or druguse, racial tensions, and gangs. Serious problems means the respondent indicated at least 1 of 17 different discipline issues was a seriousproblem. Moderate problems means the respondent indicated at least one discipline issue was a moderate problem and there were noserious problems. No problems/minor problems means the respondent indicated all discipline issues were either no problem or a minorproblem.
NOTE: Serious violent crime means that at least one of the following crimes occurred at the school and police were contacted: murder,rape or other type of sexual battery, suicide, physical attack or fight with a weapon, or robbery. Less serious or nonviolent crime meansthat no serious violent crimes occurred and at least one of the following occurred at the school for which police were contacted: physicalattack or fight without a weapon, theft/larceny, or vandalism. No incidents reported means that the school reported that police were notcontacted for any of the specified crimes. Specified crimes may have occurred but police were not contacted, or other, nonspecifiedcrimes may have occurred at the school. Details may not add to totals because of rounding.
SOURCE: U.S. Department of Education, National Center for Education Statistics, Fast Response Survey System, “Principal/SchoolDisciplinarian Survey on School Violence,” FRSS 63, 1997.

59
Table 7a.—Standard errors of the percent of public schools reporting crime incidents and theseriousness of crime incidents reported, by school characteristics: 1996-97
Seriousness of reported crime
School characteristicNo incidents
reportedAny incidents
reportedSerious violent
crime
Less serious ornonviolentcrime only
All public schools ............................................ 2.1 2.1 0.8 2.1
Instructional levelElementary school ................................................ 3.2 3.2 1.1 3.2Middle school....................................................... 2.3 2.3 1.9 2.8High school .......................................................... 2.4 2.4 2.1 3.0
Size of enrollmentLess than 300 ....................................................... 4.9 4.9 1.4 4.4300-999................................................................ 2.2 2.2 1.2 2.51,000 or more ....................................................... 2.3 2.3 2.4 3.2
LocaleCity....................................................................... 3.7 3.7 2.1 4.1Urban fringe ......................................................... 3.2 3.2 1.8 3.2Town .................................................................... 3.8 3.8 1.4 3.7Rural .................................................................... 4.2 4.2 1.5 4.1
RegionNortheast .............................................................. 4.4 4.4 1.1 4.7Southeast .............................................................. 3.8 3.8 1.6 3.9Central.................................................................. 4.5 4.5 2.2 4.1West ..................................................................... 3.5 3.5 1.4 3.7
Percent minority enrollmentLess than 5 percent............................................... 3.7 3.7 1.3 3.55 to 19 percent...................................................... 3.8 3.8 2.1 3.620 to 49 percent.................................................... 3.6 3.6 1.6 3.650 percent or more ............................................... 3.2 3.2 1.8 3.9
Percent of students eligible for free orreduced-price school lunch
Less than 20 percent............................................. 3.3 3.3 1.5 3.220 to 34 percent.................................................... 4.3 4.3 2.0 4.335 to 49 percent.................................................... 5.0 5.0 2.3 5.050 to 74 percent.................................................... 4.1 4.1 1.4 4.575 percent or more ............................................... 4.7 4.7 1.7 4.7
Zero tolerance policy for violenceYes ....................................................................... 2.4 2.4 0.9 2.4No ........................................................................ 4.1 4.1 1.4 4.0
Policy to report crimes to publicYes ....................................................................... 2.9 2.9 1.0 3.1No ........................................................................ 2.4 2.4 1.0 2.5
Police/law enforcement presence30 or more hours per week................................... 4.1 4.1 3.1 4.710-29 hours per week........................................... 12.1 12.1 8.4 12.51-9 hours per week............................................... 5.9 5.9 6.9 6.4Stationed as needed .............................................. 4.4 4.4 2.7 5.0None stationed...................................................... 2.3 2.3 0.8 2.2
Principals’ report on discipline problems in
school
No problems/minor problems........................... 3.1 3.1 1.0 3.0
Moderate problems........................................... 2.8 2.8 1.3 3.0
Serious problems.............................................. 4.0 4.0 2.9 4.4
SOURCE: U.S. Department of Education, National Center for Education Statistics, Fast Response Survey System, “Principal/SchoolDisciplinarian Survey on School Violence,” FRSS 63, 1997.

60
Table 8.—Percent of public schools reporting that various crimes occurred at the school, involvedstudents, and occurred during school hours or at school-sponsored events, by type ofcrime at the school: 1996-97
Percent of schools reporting any:
Type of crime Incidents2
Incidents2 involving
students as either
victims or perpetrators
Incidents2 occurring
during school hours or
at school-sponsored
events or activities
Murder1 ................................................................ † † †
Suicide1 ................................................................ † † †
Rape or other type of sexual battery..................... 3 3 2
Physical attack or fight with a weapon ................ 6 6 6
Robbery................................................................ 3 3 3
Physical attack or fight without a weapon ........... 28 27 26
Theft or larceny.................................................... 31 25 25
Vandalism............................................................ 38 24 171In the sample of 1,234 public schools, no incidents of murder were reported and 4 schools reported that a suicide had occurred. Itshould be noted that the sample size was not adequate to produce reliable estimates for either of these crimes, which are believed to havea very low incidence.2Schools were asked to report only incidents serious enough for the school to have contacted the police or other law enforcementrepresentative.
SOURCE: U.S. Department of Education, National Center for Education Statistics, Fast Response Survey System, “Principal/SchoolDisciplinarian Survey on School Violence,” FRSS 63, 1997.

61
Table 8a.—Standard errors of the percent of public schools reporting that various crimes occurredat the school, involved students, and occurred during school hours or at school-sponsored events, by type of crime at the school: 1996-97
Percent of schools reporting any:
Type of crime Incidents
Incidents involving
students as either
victims or perpetrators
Incidents occurring
during school hours or
at school-sponsored
events or activities
Murder ................................................................. -- -- --
Suicide ................................................................. -- -- --
Rape or other type of sexual battery..................... 0.5 0.5 0.4
Physical attack or fight with a weapon ................ 0.5 0.5 0.5
Robbery................................................................ 0.4 0.4 0.3
Physical attack or fight without a weapon ........... 1.1 1.1 1.1
Theft or larceny.................................................... 1.5 1.2 1.3
Vandalism............................................................ 1.6 1.3 0.9
-- Estimate of standard error is not derived because it is based on a statistic estimated at less than 0.5 percent.
SOURCE: U.S. Department of Education, National Center for Education Statistics, Fast Response Survey System, “Principal/School
Disciplinarian Survey on School Violence,” FRSS 63, 1997.

62
Table 9.—Ratio of crimes per 100,000 public school students, by school characteristics: 1996-97Seriousness of reported crime
School characteristic All incidents reported Serious violent crimeLess serious or
nonviolent crime only
All public schools ............................................ 1,003 53 949
Instructional levelElementary school ................................................ 352 13 339Middle school....................................................... 1,623 93 1,530High school .......................................................... 1,807 103 1,704
Size of enrollmentLess than 300 ....................................................... 1,073 61 1,013300-999................................................................ 730 38 6921,000 or more ....................................................... 1,692 90 1,602
LocaleCity....................................................................... 1,164 95 1,070Urban fringe ......................................................... 882 38 845Town .................................................................... 1,023 28 995Rural .................................................................... 899 45 854
RegionNortheast .............................................................. 806 39 768Southeast .............................................................. 922 40 883Central.................................................................. 954 78 876West ..................................................................... 1,218 55 1,164
Percent minority enrollmentLess than 5 percent............................................... 693 19 6745 to 19 percent...................................................... 871 40 83020 to 49 percent.................................................... 1,018 51 96850 percent or more ............................................... 1,325 96 1,229
Percent of students eligible for free orreduced-price school lunch
Less than 20 percent............................................. 813 26 78720 to 34 percent.................................................... 916 58 85835 to 49 percent.................................................... 1,073 49 1,02450 to 74 percent.................................................... 1,167 68 1,09975 percent or more ............................................... 1,125 81 1,044
Zero tolerance policy for violenceYes ....................................................................... 1,047 57 990No ........................................................................ 814 39 775
Police/law enforcement presence30 or more hours per week................................... 2,343 137 2,20610-29 hours per week........................................... 1,549 58 1,4901-9 hours per week............................................... 1,679 130 1,549Stationed as needed .............................................. 1,258 41 1,217None stationed...................................................... 608 33 575

63
Table 9.—Ratio of crimes per 100,000 public school students, by school characteristics: 1996-97--continued
Seriousness of reported crimeSchool characteristic All incidents reported Serious violent crime
Less serious ornonviolent crime only
Principals’ report on discipline problems in
school*
No problems/minor problems........................... 299 8 290
Moderate problems........................................... 1,058 52 1,006
Serious problems.............................................. 2,051 130 1,921
*Discipline problems included student tardiness, student absenteeism, physical conflicts among students, robbery or theft of items over$10, vandalism of school property, student alcohol use, student drug use, sale of drugs on school grounds, student tobacco use, studentpossession of weapons, trespassing, verbal abuse of teachers, physical abuse of teachers, teacher absenteeism, teacher alcohol or druguse, racial tensions, and gangs. Serious problems means the respondent indicated at least 1 of 17 different discipline issues was a seriousproblem. Moderate problems means the respondent indicated at least one discipline issue was a moderate problem and there were noserious problems. No problems/minor problems means the respondent indicated all discipline issues were either no problem or a minorproblem.
NOTE: Serious violent crime means that at least one of the following crimes occurred at the school and police were contacted: murder,rape or other type of sexual battery, suicide, physical attack or fight with a weapon, or robbery. Less serious or nonviolent crime meansthat no serious violent crimes occurred and at least one of the following occurred at the school for which police were contacted: physicalattack or fight without a weapon, theft/larceny, or vandalism. No incidents reported means that the school reported that police were notcontacted for any of the specified crimes. Specified crimes may have occurred but police were not contacted, or other, nonspecifiedcrimes may have occurred at the school. Details may not add to totals because of rounding and because some classification variableswere missing for some schools.
SOURCE: U.S. Department of Education, National Center for Education Statistics, Fast Response Survey System, “Principal/SchoolDisciplinarian Survey on School Violence,” FRSS 63, 1997.
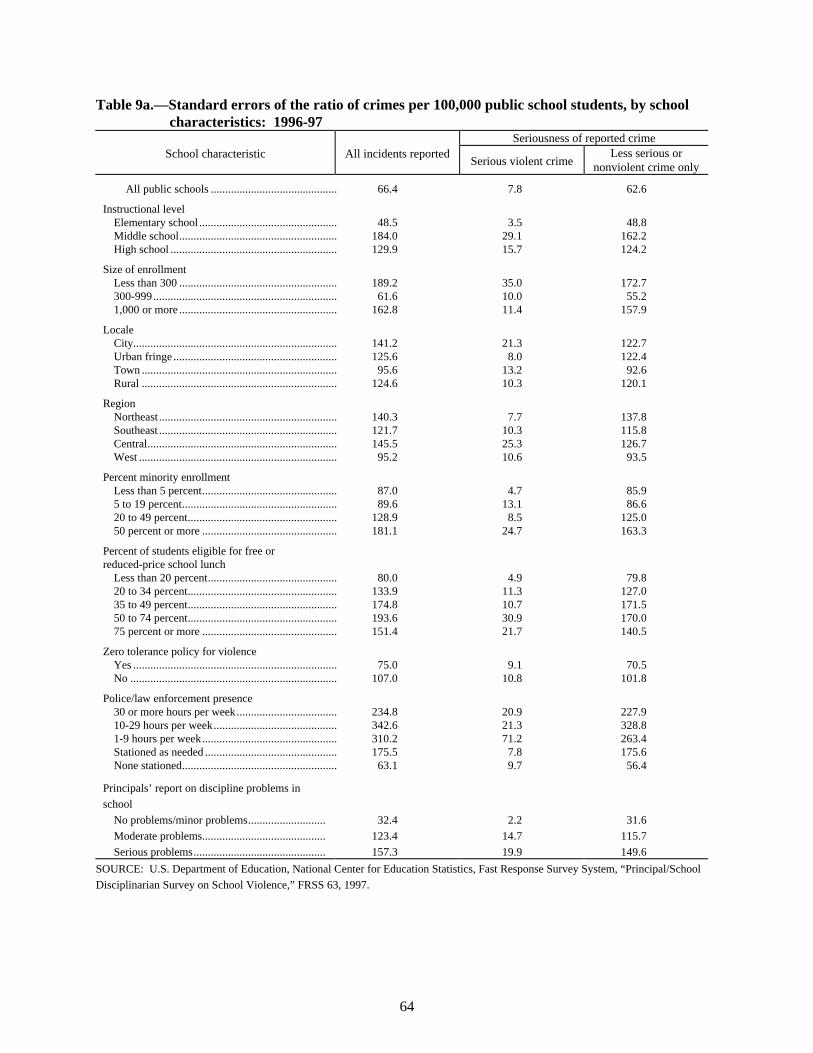
64
Table 9a.—Standard errors of the ratio of crimes per 100,000 public school students, by schoolcharacteristics: 1996-97
Seriousness of reported crimeSchool characteristic All incidents reported
Serious violent crimeLess serious or
nonviolent crime only
All public schools ............................................ 66.4 7.8 62.6
Instructional levelElementary school ................................................ 48.5 3.5 48.8Middle school....................................................... 184.0 29.1 162.2High school .......................................................... 129.9 15.7 124.2
Size of enrollmentLess than 300 ....................................................... 189.2 35.0 172.7300-999................................................................ 61.6 10.0 55.21,000 or more ....................................................... 162.8 11.4 157.9
LocaleCity....................................................................... 141.2 21.3 122.7Urban fringe ......................................................... 125.6 8.0 122.4Town .................................................................... 95.6 13.2 92.6Rural .................................................................... 124.6 10.3 120.1
RegionNortheast .............................................................. 140.3 7.7 137.8Southeast .............................................................. 121.7 10.3 115.8Central.................................................................. 145.5 25.3 126.7West ..................................................................... 95.2 10.6 93.5
Percent minority enrollmentLess than 5 percent............................................... 87.0 4.7 85.95 to 19 percent...................................................... 89.6 13.1 86.620 to 49 percent.................................................... 128.9 8.5 125.050 percent or more ............................................... 181.1 24.7 163.3
Percent of students eligible for free orreduced-price school lunch
Less than 20 percent............................................. 80.0 4.9 79.820 to 34 percent.................................................... 133.9 11.3 127.035 to 49 percent.................................................... 174.8 10.7 171.550 to 74 percent.................................................... 193.6 30.9 170.075 percent or more ............................................... 151.4 21.7 140.5
Zero tolerance policy for violenceYes ....................................................................... 75.0 9.1 70.5No ........................................................................ 107.0 10.8 101.8
Police/law enforcement presence30 or more hours per week................................... 234.8 20.9 227.910-29 hours per week........................................... 342.6 21.3 328.81-9 hours per week............................................... 310.2 71.2 263.4Stationed as needed .............................................. 175.5 7.8 175.6None stationed...................................................... 63.1 9.7 56.4
Principals’ report on discipline problems in
school
No problems/minor problems........................... 32.4 2.2 31.6
Moderate problems........................................... 123.4 14.7 115.7
Serious problems.............................................. 157.3 19.9 149.6
SOURCE: U.S. Department of Education, National Center for Education Statistics, Fast Response Survey System, “Principal/School
Disciplinarian Survey on School Violence,” FRSS 63, 1997.

65
Table 10.—Ratio of reported crimes per 100,000 public school students, by type of crime andinstructional level: 1996-97
Instructional levelType of crime
All public
schoolsElementary
schoolMiddle school High school
Murder1 ................................................................. † † † †
Suicide1 ................................................................. † † † †
Rape/sexual battery............................................... 10 3 17 18
Attack/fight with a weapon................................... 26 7 49 46
Robbery................................................................. 17 2 28 38
Attack/fight without a weapon.............................. 444 96 872 808
Theft/larceny......................................................... 274 87 374 562
Vandalism............................................................. 234 157 283 3471In the sample of 1,234 public schools, no incidents of murder were reported and 4 schools reported that a suicide had occurred. Itshould be noted that the sample size was not adequate to produce reliable estimates for either of these crimes, which are believed to havea very low incidence.
SOURCE: U.S. Department of Education, National Center for Education Statistics, Fast Response Survey System, “Principal/SchoolDisciplinarian Survey on School Violence,” FRSS 63, 1997.

66
Table 10a.—Standard errors of the ratio of reported crimes per 100,000 public school students, bytype of crime and instructional level: 1996-97
Instructional levelType of crime
All public
schoolsElementary
schoolMiddleschool
Highschool
Murder .................................................................. -- -- -- --Suicide .................................................................. -- -- -- --Rape/sexual battery............................................... 1.6 1.9 4.3 2.9Attack/fight with a weapon................................... 4.5 2.5 17.1 9.4Robbery................................................................. 3.7 0.9 12.2 7.7Attack/fight without a weapon.............................. 41.0 31.2 123.1 83.1Theft/larceny......................................................... 19.9 15.0 39.5 49.5Vandalism............................................................. 13.4 19.2 27.2 24.4
-- Estimate of standard error is not derived because it is based on a statistic estimated at less than 0.5 percent.
SOURCE: U.S. Department of Education, National Center for Education Statistics, Fast Response Survey System, “Principal/School
Disciplinarian Survey on School Violence,” FRSS 63, 1997.

67
Table 11.—Percent of public school principals indicating the extent of problems in their schoolswith certain discipline issues: 1990-91 and 1996-97
Extent of problem
1990-91 1996-97Discipline issue
Serious Moderate MinorNot a
problemSerious Moderate Minor
Not a
problem
Student tardiness............................ 6 28 46 20 9 32 45 14
Student absenteeism/class cutting.. 5 20 40 35 4 21 46 29
Physical conflicts among students .
3 20 53 25 1 20 59 21
Robbery or theft of items over $10.
(+) 7 31 62 1 5 37 58
Vandalism of school property........ 1 11 42 46 2 6 49 43
Student alcohol use........................ 3 7 17 72 2 5 19 74
Student drug use ............................ 1 5 20 74 2 8 20 70
Sale of drugs on school grounds .... (+) 1 11 89 (+) 2 15 83
Student tobacco use ....................... 3 10 24 63 4 10 25 60
Student possession of weapons...... (+) 3 16 81 (+) 2 21 77
Trespassing.................................... 1 6 27 67 (+) 4 25 71
Verbal abuse of teachers................ 2 9 44 45 2 10 46 42
Physical abuse of teachers ............. (+) 1 8 91 0 2 9 89
Teacher absenteeism...................... 1 13 37 49 1 10 38 52
Teacher alcohol or drug use........... (+) 1 10 89 0 (+) 6 94
Racial tensions............................... (+) 5 21 74 (+) 3 24 73
Gangs............................................. ‡ ‡ ‡ ‡ (+) 4 19 76
‡ Data not available because this item was not asked in the 1991 survey.
(+) Less than 0.5 percent.
NOTE: Percents may not add to 100 because of rounding.
SOURCE: U.S. Department of Education, National Center for Education Statistics, Fast Response Survey System, “Principal/SchoolDisciplinarian Survey on School Violence,” FRSS 63, 1997; “Public School Principal Survey on Safe, Disciplined and Drug-FreeSchools,” FRSS 41, 1991.

68
Table 11a.—Standard errors of the percent of public school principals indicating the extent ofproblems in their schools with certain discipline issues: 1990-91 and 1996-97
Extent of problem
1990-91 1996-97Discipline issue
Serious Moderate MinorNot a
problemSerious Moderate Minor
Not a
problem
Student tardiness............................ 0.8 2.4 2.1 1.8 0.8 1.4 1.8 1.5
Student absenteeism/class cutting.. 0.8 1.6 1.9 1.6 0.6 1.4 1.7 1.7
Physical conflicts among students .
0.6 1.5 1.7 1.8 0.3 1.2 1.9 1.6
Robbery or theft of items over $10.
-- 0.8 1.6 2.0 0.2 0.6 1.5 1.6
Vandalism of school property........ 0.5 1.0 1.4 1.6 0.4 0.6 1.5 1.4
Student alcohol use........................ 0.5 0.9 1.5 1.6 0.3 0.6 1.0 1.1
Student drug use ............................ 0.3 0.6 1.3 1.4 0.3 0.6 1.0 0.9
Sale of drugs on school grounds .... -- 0.2 1.0 1.0 -- 0.3 0.8 0.7
Student tobacco use ....................... 0.5 1.0 1.6 1.8 0.5 0.8 1.3 1.3
Student possession of weapons...... -- 0.4 1.0 1.0 -- 0.4 1.1 1.2
Trespassing.................................... 0.3 0.9 1.7 1.9 -- 0.6 1.4 1.5
Verbal abuse of teachers................ 0.4 1.0 1.9 1.8 0.4 0.9 1.8 1.7
Physical abuse of teachers ............. -- 0.3 1.0 1.1 -- 0.6 1.0 1.0
Teacher absenteeism...................... 0.4 1.2 1.3 1.7 0.2 0.8 1.7 1.6
Teacher alcohol or drug use........... -- 0.4 1.3 1.3 -- -- 0.9 0.9
Racial tensions............................... -- 0.7 1.5 1.5 -- 0.4 1.3 1.3
Gangs............................................. ‡ ‡ ‡ ‡ -- 0.5 1.2 1.2
‡ Data not available because this item was not asked in the 1991 survey.
-- Estimate of standard error is not derived because it is based on a statistic estimated at less than 0.5 percent or at 100 percent.
SOURCE: U.S. Department of Education, National Center for Education Statistics, Fast Response Survey System, “Principal/School
Disciplinarian Survey on School Violence,” FRSS 63, 1997; “Public School Principal Survey on Safe, Disciplined and Drug-Free
Schools,” FRSS 41, 1991.

69
Table 12.—Percent of public school principals reporting level of discipline problems in theirschools, by school characteristics: 1996-97
School characteristicNo problems/minor
problemsModerate problems Serious problems
All public schools .................................................. 43 41 16
Instructional levelElementary school ...................................................... 56 36 8Middle school............................................................. 30 51 18High school ................................................................ 15 48 37
Size of enrollmentLess than 300 ............................................................. 52 39 10300-999...................................................................... 44 41 151,000 or more ............................................................. 14 49 38
LocaleCity............................................................................. 35 46 19Urban fringe ............................................................... 41 45 14Town .......................................................................... 45 39 16Rural .......................................................................... 49 35 16
RegionNortheast .................................................................... 48 39 13Southeast .................................................................... 38 44 18Central........................................................................ 50 37 14West ........................................................................... 36 45 18
Percent minority enrollmentLess than 5 percent..................................................... 57 33 105 to 19 percent............................................................ 43 40 1720 to 49 percent.......................................................... 38 45 1750 percent or more ..................................................... 28 50 22
Percent of students eligible for free orreduced-price school lunch
Less than 20 percent................................................... 52 35 1320 to 34 percent.......................................................... 46 39 1635 to 49 percent.......................................................... 33 48 1950 to 74 percent.......................................................... 43 41 1675 percent or more ..................................................... 37 46 17
Zero tolerance policy for violenceYes ............................................................................. 41 43 16No .............................................................................. 51 35 14
Police/law enforcement presence30 or more hours per week......................................... 15 47 3910-29 hours per week................................................. 14 58 291-9 hours per week..................................................... 17 52 31Stationed as needed .................................................... 26 50 24None stationed............................................................ 49 39 12
NOTE: Serious problems means the respondent indicated at least 1 of 17 specified discipline issue was a serious problem. Moderateproblems means the respondent indicated at least one discipline issue was a moderate problem and there were no serious problems. Noproblems/minor problems means the respondent indicated all discipline issues were either no problem or a minor problem. Percents maynot add to 100 because of rounding.
SOURCE: U.S. Department of Education, National Center for Education Statistics, Fast Response Survey System, “Principal/SchoolDisciplinarian Survey on School Violence,” FRSS 63, 1997.

70
Table 12a.—Standard errors of the percent of public school principals reporting level of disciplineproblems in their schools, by school characteristics: 1996-97
School characteristicNo problems/
minor problemsModerateproblems
Seriousproblems
All public schools .................................................. 1.7 1.6 1.2
Instructional levelElementary school ...................................................... 2.4 2.2 1.6Middle school............................................................. 2.5 2.5 1.8High school ................................................................ 2.0 2.8 2.5
Size of enrollmentLess than 300 ............................................................. 4.5 4.2 2.1300-999...................................................................... 2.1 1.9 1.51,000 or more ............................................................. 2.6 3.3 2.9
LocaleCity............................................................................. 3.6 3.9 2.3Urban fringe ............................................................... 3.5 3.6 2.0Town .......................................................................... 3.4 3.3 1.9Rural .......................................................................... 3.9 3.5 2.7
RegionNortheast .................................................................... 4.0 3.7 2.4Southeast .................................................................... 3.5 3.3 2.3Central........................................................................ 3.7 3.6 2.0West ........................................................................... 3.4 3.0 2.6
Percent minority enrollmentLess than 5 percent..................................................... 3.6 3.2 1.55 to 19 percent............................................................ 3.9 3.3 2.120 to 49 percent.......................................................... 3.5 4.1 3.050 percent or more ..................................................... 3.2 3.9 2.7
Percent of students eligible for free orreduced-price school lunch
Less than 20 percent................................................... 3.6 3.5 1.420 to 34 percent.......................................................... 4.6 3.9 2.535 to 49 percent.......................................................... 3.8 4.4 3.150 to 74 percent.......................................................... 4.6 3.8 2.575 percent or more ..................................................... 4.2 5.0 2.9
Zero tolerance policy for violenceYes ............................................................................. 1.6 1.9 1.4No .............................................................................. 4.7 4.1 2.2
Police/law enforcement presence30 or more hours per week......................................... 3.8 4.6 3.510-29 hours per week................................................. 8.0 13.0 12.31-9 hours per week..................................................... 7.2 7.5 7.2Stationed as needed .................................................... 4.5 5.2 3.9None stationed............................................................ 2.0 2.0 1.2
SOURCE: U.S. Department of Education, National Center for Education Statistics, Fast Response Survey System, “Principal/SchoolDisciplinarian Survey on School Violence,” FRSS 63, 1997.

71
Table 13.—Percent of public school principals reporting that certain discipline issues were seriousor moderate problems in their schools, by type of issue and instructional level: 1990-91and 1996-97
Instructional level
1990-91 1996-97Discipline issue
TotalElementary
school
Middle
school
High
schoolTotal
Elementary
school
Middle
school
High
school
Student tardiness............................... 34 25 44 50 40 32 40 67
Student absenteeism/class cutting..... 25 18 31 39 25 17 24 52
Physical conflicts among students .... 23 20 40 17 21 18 35 17
Robbery or theft of items over $10 ... 7 4 10 14 5 2 7 15
Vandalism of school property........... 12 10 16 13 8 6 10 13
Student alcohol use........................... 10 1 10 37 7 1 7 27
Student drug use ............................... 6 1 5 20 9 (+) 10 36
Sale of drugs on school grounds ....... 1 (+) 1 2 2 0 1 10
Student tobacco use .......................... 13 1 21 40 14 2 19 48
Student possession of weapons......... 3 2 6 3 2 1 5 2
Trespassing....................................... 7 5 14 7 4 3 5 8
Verbal abuse of teachers................... 11 8 20 13 12 6 23 20
Physical abuse of teachers ................ 1 1 2 1 2 2 2 1
Teacher absenteeism......................... 14 11 21 17 10 7 15 17
Teacher alcohol or drug use.............. 1 1 2 1 (+) 0 (+) (+)
Racial tensions.................................. 5 4 7 5 3 2 4 7
Gangs................................................ ‡ ‡ ‡ ‡ 5 2 10 9
‡ Data not available because this item was not asked in the 1991 survey.
(+) Less than 0.5 percent.
SOURCE: U.S. Department of Education, National Center for Education Statistics, Fast Response Survey System, “Principal/SchoolDisciplinarian Survey On School Violence,” FRSS 63, 1997; “Public School Principal Survey on Safe, Disciplined and Drug-FreeSchools,” FRSS 41, 1991.

72
Table 13a.—Standard errors of the percent of public school principals reporting that certaindiscipline issues were serious or moderate problems in their schools, by type of issueand instructional level: 1990-91 and 1996-97
Instructional level
1990-91 1996-97Problem
TotalElementary
school
Middle
school
High
schoolTotal
Elementary
school
Middle
school
High
school
Student tardiness............................... 2.5 3.0 4.7 3.5 1.6 2.6 2.4 2.6
Student absenteeism/class cutting..... 1.8 2.3 4.2 3.2 1.5 2.3 2.2 2.8
Physical conflicts among students .... 1.4 2.1 5.1 2.3 1.2 1.6 2.6 1.6
Robbery or theft of items over $10 ... 0.9 1.0 2.0 2.2 0.6 0.6 1.2 1.8
Vandalism of school property........... 1.2 1.7 3.1 2.2 0.8 1.2 1.6 1.6
Student alcohol use........................... 1.0 0.7 2.9 3.8 0.7 0.5 1.6 2.3
Student drug use ............................... 0.7 0.6 1.6 2.5 0.6 -- 1.6 2.5
Sale of drugs on school grounds ....... 0.2 -- 0.7 0.9 0.3 -- 0.6 1.7
Student tobacco use .......................... 1.1 0.5 3.1 3.8 0.9 1.0 1.9 3.0
Student possession of weapons......... 0.4 0.5 1.4 1.0 0.4 0.5 1.2 0.6
Trespassing....................................... 1.0 1.3 2.7 1.3 0.6 0.8 1.1 1.3
Verbal abuse of teachers................... 1.1 1.2 2.9 2.4 1.0 1.3 2.0 1.9
Physical abuse of teachers ................ 0.3 0.5 1.4 0.4 0.6 0.8 0.7 0.4
Teacher absenteeism......................... 1.2 1.4 3.6 2.5 0.8 1.2 1.8 1.7
Teacher alcohol or drug use.............. 0.4 0.4 1.9 0.7 -- -- -- --
Racial tensions.................................. 0.7 1.1 1.7 1.2 0.5 0.6 1.1 1.2
Gangs................................................ ‡ ‡ ‡ ‡ 0.5 0.7 1.6 1.3
‡ Data not available because this item was not asked in the 1991 survey.
-- Estimate of standard error is not derived because it is based on a statistic estimated at less than 0.5 percent or at 100 percent.
SOURCE: U.S. Department of Education, National Center for Education Statistics, Fast Response Survey System, “Principal/SchoolDisciplinarian Survey on School Violence,” FRSS 63, 1997; “Public School Principal Survey on Safe, Disciplined and Drug-FreeSchools,” FRSS 41, 1991.

73
Table 14.—Percent of public school principals reporting that certain discipline issues were seriousor moderate problems in their schools, by type of issue and size of school: 1990-91 and1996-97
School size
1990-91 1996-97Discipline issue
Total <300 300-9991,000 or
moreTotal <300 300-999
1,000 or
more
Student tardiness.......................................... 34 26 34 62 40 29 42 64
Student absenteeism/class cutting................ 25 18 25 44 25 19 24 53
Physical conflicts among students ............... 23 16 25 30 21 13 22 31
Robbery or theft of items over $10 .............. 7 5 7 16 5 2 6 12
Vandalism of school property...................... 12 12 10 24 8 7 7 20
Student alcohol use...................................... 10 13 7 25 7 7 6 18
Student drug use .......................................... 6 6 3 19 9 8 7 29
Sale of drugs on school grounds .................. 1 0 1 4 2 1 1 11
Student tobacco use ..................................... 13 11 10 33 14 13 11 40
Student possession of weapons.................... 3 1 3 9 2 1 2 3
Trespassing.................................................. 7 3 8 12 4 2 4 12
Verbal abuse of teachers.............................. 11 4 14 17 12 7 12 26
Physical abuse of teachers ........................... 1 1 1 2 2 3 1 1
Teacher absenteeism.................................... 14 9 15 26 10 5 11 25
Teacher alcohol or drug use......................... 1 1 1 2 (+) 0 (+) 1
Racial tensions............................................. 5 3 5 11 3 (+) 4 7
Gangs........................................................... ‡ ‡ ‡ ‡ 5 2 5 16
‡ Data not available because this item was not asked in the 1991 survey.
(+) Less than 0.5 percent.
SOURCE: U.S. Department of Education, National Center for Education Statistics, Fast Response Survey System, “Principal/SchoolDisciplinarian Survey on School Violence,” FRSS 63, 1997; “Public School Principal Survey on Safe, Disciplined and Drug-FreeSchools,” FRSS 41, 1991.

74
Table 14a.—Standard errors of the percent of public school principals reporting that certaindiscipline issues were serious or moderate problems in their schools, by type of issueand size of school: 1990-91 and 1996-97
School size
1990-91 1996-97Discipline issue
Total <300 300-9991,000 or
moreTotal <300 300-999
1,000 or
more
Student tardiness.......................................... 2.5 3.5 2.9 6.0 1.6 3.6 2.2 3.3
Student absenteeism/class cutting................ 1.8 3.3 2.4 5.3 1.5 3.4 1.9 3.1
Physical conflicts among students ............... 1.4 3.3 1.8 3.5 1.2 3.0 1.4 3.3
Robbery or theft of items over $10 .............. 0.9 1.8 1.1 3.8 0.6 0.7 0.9 1.7
Vandalism of school property...................... 1.2 3.0 1.4 4.4 0.8 1.8 1.0 2.4
Student alcohol use...................................... 1.0 2.5 1.0 4.2 0.7 2.0 0.6 2.3
Student drug use .......................................... 0.7 2.1 0.8 3.3 0.6 1.6 0.6 2.5
Sale of drugs on school grounds .................. 0.2 -- 0.3 1.6 0.3 0.6 0.3 2.0
Student tobacco use ..................................... 1.1 1.6 1.3 4.2 0.9 2.6 0.8 3.0
Student possession of weapons.................... 0.4 0.7 0.6 2.8 0.4 0.6 0.5 0.9
Trespassing.................................................. 1.0 1.5 1.3 3.0 0.6 1.1 0.8 2.2
Verbal abuse of teachers.............................. 1.1 1.6 1.4 3.6 1.0 2.3 1.2 2.8
Physical abuse of teachers ........................... 0.3 0.7 0.5` 1.1 0.6 1.9 0.5 0.4
Teacher absenteeism.................................... 1.2 2.3 1.8 4.8 0.8 1.9 1.2 2.8
Teacher alcohol or drug use......................... 0.4 1.0 0.4 1.2 -- -- -- 0.6
Racial tensions............................................. 0.7 1.2 0.9 2.6 0.5 -- 0.7 1.5
Gangs........................................................... ‡ ‡ ‡ ‡ 0.5 0.7 0.7 1.9
‡ Data not available because this item was not asked in the 1991 survey.
-- Estimate of standard error is not derived because it is based on a statistic estimated at less than 0.5 percent or at 100 percent.
SOURCE: U.S. Department of Education, National Center for Education Statistics, Fast Response Survey System, “Principal/SchoolDisciplinarian Survey on School Violence,” FRSS 63, 1997; “Public School Principal Survey on Safe, Disciplined and Drug-FreeSchools,” FRSS 41, 1991.
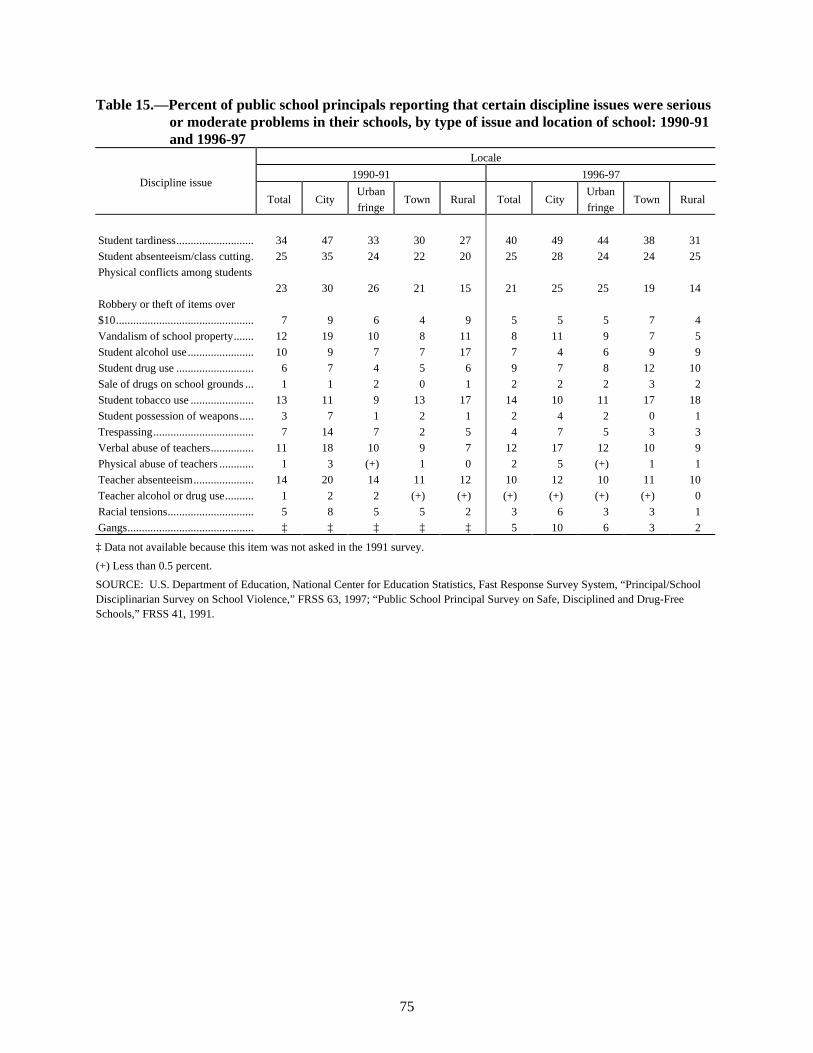
75
Table 15.—Percent of public school principals reporting that certain discipline issues were seriousor moderate problems in their schools, by type of issue and location of school: 1990-91and 1996-97
Locale
1990-91 1996-97Discipline issue
Total CityUrban
fringeTown Rural Total City
Urban
fringeTown Rural
Student tardiness........................... 34 47 33 30 27 40 49 44 38 31
Student absenteeism/class cutting. 25 35 24 22 20 25 28 24 24 25
Physical conflicts among students
23 30 26 21 15 21 25 25 19 14
Robbery or theft of items over
$10................................................ 7 9 6 4 9 5 5 5 7 4
Vandalism of school property....... 12 19 10 8 11 8 11 9 7 5
Student alcohol use....................... 10 9 7 7 17 7 4 6 9 9
Student drug use ........................... 6 7 4 5 6 9 7 8 12 10
Sale of drugs on school grounds ... 1 1 2 0 1 2 2 2 3 2
Student tobacco use ...................... 13 11 9 13 17 14 10 11 17 18
Student possession of weapons..... 3 7 1 2 1 2 4 2 0 1
Trespassing................................... 7 14 7 2 5 4 7 5 3 3
Verbal abuse of teachers............... 11 18 10 9 7 12 17 12 10 9
Physical abuse of teachers ............ 1 3 (+) 1 0 2 5 (+) 1 1
Teacher absenteeism..................... 14 20 14 11 12 10 12 10 11 10
Teacher alcohol or drug use.......... 1 2 2 (+) (+) (+) (+) (+) (+) 0
Racial tensions.............................. 5 8 5 5 2 3 6 3 3 1
Gangs............................................ ‡ ‡ ‡ ‡ ‡ 5 10 6 3 2
‡ Data not available because this item was not asked in the 1991 survey.
(+) Less than 0.5 percent.
SOURCE: U.S. Department of Education, National Center for Education Statistics, Fast Response Survey System, “Principal/SchoolDisciplinarian Survey on School Violence,” FRSS 63, 1997; “Public School Principal Survey on Safe, Disciplined and Drug-FreeSchools,” FRSS 41, 1991.

76
Table 15a.—Standard errors of the percent of public school principals reporting that certaindiscipline issues were serious or moderate problems in their schools, by type of issueand location of school: 1990-91 and 1996-97
Locale
1990-91 1996-97Discipline issue
Total CityUrban
fringeTown Rural Total City
Urban
fringeTown Rural
Student tardiness........................... 2.5 4.4 4.4 3.2 3.1 1.6 3.4 3.8 3.0 3.1
Student absenteeism/class cutting. 1.8 3.7 3.7 2.6 2.7 1.5 2.6 3.1 2.8 3.5
Physical conflicts among students
1.4 3.0 3.3 2.5 3.5 1.2 2.6 3.4 2.6 2.6
Robbery or theft of items over
$10 ............................................ 0.9 1.6 1.5 1.3 2.0 0.6 1.2 1.3 1.1 1.1
Vandalism of school property....... 1.2 3.2 2.1 1.9 3.3 0.8 1.9 2.0 1.8 1.2
Student alcohol use....................... 1.0 2.1 1.3 1.2 2.6 0.7 0.6 1.0 1.1 2.1
Student drug use ........................... 0.7 1.6 1.1 1.4 1.9 0.6 0.8 1.2 1.3 1.7
Sale of drugs on school grounds ... 0.2 0.4 0.7 -- 0.5 0.3 0.4 0.5 0.8 0.7
Student tobacco use ...................... 1.1 2.2 1.5 2.0 2.1 0.9 1.1 1.4 1.4 2.6
Student possession of weapons..... 0.4 1.6 0.6 1.1 0.6 0.4 1.0 0.9 -- 0.6
Trespassing................................... 1.0 2.3 1.8 0.7 2.0 0.6 1.9 1.3 0.7 1.0
Verbal abuse of teachers............... 1.1 2.7 1.8 1.8 2.0 1.0 2.5 2.0 1.7 1.8
Physical abuse of teachers ............ 0.3 1.2 -- 0.9 -- 0.6 1.8 -- 0.6 1.0
Teacher absenteeism..................... 1.2 3.0 1.9 2.1 2.3 0.8 1.8 1.7 1.9 2.2
Teacher alcohol or drug use.......... 0.4 1.0 1.6 -- -- -- -- -- -- --
Racial tensions.............................. 0.7 2.2 1.2 1.4 0.9 0.5 1.4 0.8 1.1 0.5
Gangs............................................ ‡ ‡ ‡ ‡ ‡ 0.5 1.9 1.4 0.7 0.7
‡ Data not available because this item was not asked in the 1991 survey.
-- Estimate of standard error is not derived because it is based on a statistic estimated at less than 0.5 percent or at 100 percent.
SOURCE: U.S. Department of Education, National Center for Education Statistics, Fast Response Survey System, “Principal/SchoolDisciplinarian Survey on School Violence,” FRSS 63, 1997; “Public School Principal Survey on Safe, Disciplined and Drug-FreeSchools,” FRSS 41, 1991.

77
Table 16.—Percent of public school principals reporting that certain discipline issues were seriousor moderate problems in their schools, by type of issue and minority enrollmentof school: 1990-91 and 1996-97
Minority enrollment
1990-91 1996-97Discipline issue
Total <5% 5-19% 20-49%50% or
moreTotal <5% 5-19% 20-49%
50% or
more
Student tardiness....................................... 34 22 32 48 53 41 25 42 45 56
Student absenteeism/class cutting............. 25 18 17 36 39 26 19 24 26 35
Physical conflicts among students ............ 23 16 16 32 40 21 12 19 23 31
Robbery or theft of items over $10 ........... 7 5 10 7 9 5 4 6 5 7
Vandalism of school property................... 12 7 11 18 21 8 6 6 6 16
Student alcohol use................................... 10 11 12 6 11 7 10 10 5 3
Student drug use ....................................... 6 6 4 5 7 9 9 14 7 7
Sale of drugs on school grounds ............... 1 1 1 1 1 2 1 4 1 3
Student tobacco use .................................. 13 16 11 10 9 14 16 19 15 7
Student possession of weapons................. 3 2 (+) 5 7 2 1 2 2 3
Trespassing............................................... 7 4 7 8 12 4 2 6 3 7
Verbal abuse of teachers........................... 11 9 5 19 15 12 9 11 13 17
Physical abuse of teachers ........................ 1 1 0 1 3 2 1 2 3 1
Teacher absenteeism................................. 14 11 9 15 28 10 9 5 9 18
Teacher alcohol or drug use...................... 1 1 (+) 1 1 (+) (+) 0 0 (+)
Racial tensions.......................................... 5 2 2 13 6 3 1 5 3 4
Gangs........................................................ ‡ ‡ ‡ ‡ ‡ 5 (+) 5 4 12
‡ Data not available because this item was not asked in the 1991 survey.
(+) Less than 0.5 percent.
SOURCE: U.S. Department of Education, National Center for Education Statistics, Fast Response Survey System, “Principal/School
Disciplinarian Survey on School Violence,” FRSS 63, 1997; “Public School Principal Survey on Safe, Disciplined and Drug-Free
Schools,” FRSS 41, 1991.

78
Table 16a.—Standard errors of the percent of public school principals reporting that certaindiscipline issues were serious or moderate problems in their schools, by type of issueand minority enrollment of school: 1990-91 and 1996-97
Minority enrollment
1990-91 1996-97Discipline issue
Total <5% 5-19% 20-49%50% or
moreTotal <5% 5-19% 20-49%
50% or
more
Student tardiness....................................... 2.5 2.2 3.0 6.0 6.3 1.5 2.7 3.9 3.7 3.4
Student absenteeism/class cutting............. 1.8 2.4 2.7 4.7 5.3 1.5 2.4 2.9 3.3 2.9
Physical conflicts among students ............ 1.4 2.6 3.2 4.8 4.4 1.2 2.1 3.5 3.0 3.2
Robbery or theft of items over $10 ........... 0.9 1.1 2.3 1.8 2.1 0.7 1.1 1.2 0.9 1.5
Vandalism of school property................... 1.2 1.6 2.4 4.0 3.1 0.8 1.6 1.4 1.3 2.4
Student alcohol use................................... 1.0 1.2 2.3 2.0 2.6 0.7 1.5 1.3 1.5 0.7
Student drug use ....................................... 0.7 1.1 1.3 1.1 2.5 0.6 1.4 1.7 1.3 1.2
Sale of drugs on school grounds ............... 0.2 0.4 0.7 0.4 0.7 0.3 0.5 1.0 0.4 0.8
Student tobacco use .................................. 1.1 1.9 2.6 2.4 2.6 0.9 2.2 2.0 2.0 1.1
Student possession of weapons................. 0.4 0.6 0.3 1.4 2.1 0.4 0.4 1.0 1.1 0.6
Trespassing............................................... 1.0 1.3 2.6 2.5 2.7 0.6 0.7 1.7 0.7 1.9
Verbal abuse of teachers........................... 1.1 1.4 1.7 2.8 3.7 1.0 1.6 1.8 2.4 2.4
Physical abuse of teachers ........................ 0.3 0.6 -- 0.6 1.5 0.6 1.2 1.4 1.3 0.2
Teacher absenteeism................................. 1.2 1.8 2.6 2.7 3.9 0.8 1.7 0.9 1.2 2.5
Teacher alcohol or drug use...................... 0.4 0.8 0.3 1.0 1.0 -- -- -- -- --
Racial tensions.......................................... 0.7 0.6 0.9 3.1 2.3 0.5 0.4 1.1 1.2 1.5
Gangs........................................................ ‡ ‡ ‡ ‡ ‡ 0.5 -- 1.4 1.1 1.8
‡ Data not available because this item was not asked in the 1991 survey.
-- Estimate of standard error is not derived because it is based on a statistic estimated at less than 0.5 percent or at 100 percent.
SOURCE: U.S. Department of Education, National Center for Education Statistics, Fast Response Survey System, “Principal/SchoolDisciplinarian Survey on School Violence,” FRSS 63, 1997; “Public School Principal Survey on Safe, Disciplined and Drug-FreeSchools,” FRSS 41, 1991.

79
Table 17.—Percent of public school principals reporting that certain discipline issues were seriousor moderate problems in their schools, by type of issue and poverty level* of school:1990-91 and 1996-97
Percent of students eligible for the federally funded
free or reduced-price lunch program
1990-91 1996-97Discipline issue
Total <20%20-
34%
35-
49%
50-
74%
75% or
moreTotal <20%
20-
34%
35-
49%
50-
74%
75% or
more
Student tardiness....................................... 34 27 26 30 49 51 40 36 36 45 42 47
Student absenteeism/class cutting............. 25 17 18 23 35 46 25 21 24 25 28 32
Physical conflicts among students ............ 23 15 19 21 32 40 21 13 19 22 24 29
Robbery or theft of items over $10 ........... 7 7 6 4 11 8 5 6 6 5 4 6
Vandalism of school property................... 12 7 9 11 16 25 8 5 6 6 8 17
Student alcohol use................................... 10 13 9 7 9 12 7 11 8 8 4 3
Student drug use ....................................... 6 7 3 2 4 13 9 12 10 9 7 5
Sale of drugs on school grounds ............... 1 1 1 (+) (+) 0 2 3 3 1 2 1
Student tobacco use .................................. 13 16 11 10 13 9 14 18 17 20 10 6
Student possession of weapons................. 3 1 2 2 4 11 2 1 1 3 3 2
Trespassing............................................... 7 7 5 3 9 13 4 3 3 4 5 7
Verbal abuse of teachers........................... 11 7 7 9 17 24 12 8 13 13 13 13
Physical abuse of teachers ........................ 1 0 1 0 2 6 2 0 2 4 2 1
Teacher absenteeism................................. 14 9 11 12 16 33 10 7 8 13 11 15
Teacher alcohol or drug use...................... 1 1 (+) 2 1 1 (+) (+) (+) 0 (+) 0
Racial tensions.......................................... 5 3 2 6 7 7 3 3 3 3 4 4
Gangs........................................................ ‡ ‡ ‡ ‡ ‡ ‡ 5 1 4 4 6 11
*The percent of students eligible for the federally funded free or reduced-price lunch program was used as a measure of poverty for theschool population.
‡ Data not available because this item was not asked in the 1991 survey.
(+) Less than 0.5 percent.
SOURCE: U.S. Department of Education, National Center for Education Statistics, Fast Response Survey System, “Principal/School
Disciplinarian Survey on School Violence,” FRSS 63, 1997; “Public School Principal Survey on Safe, Disciplined and Drug-Free
Schools,” FRSS 41, 1991.

80
Table 17a.—Standard errors of the percent of public school principals reporting that certaindiscipline issues were serious or moderate problems in their schools, by type of issueand poverty level of school: 1990-91 and 1996-97
Percent of students eligible for the federally funded
free or reduced-price lunch program
1990-91 1996-97Discipline issue
Total <20%20-
34%
35-
49%
50-
74%
75% or
moreTotal <20%
20-
34%
35-
49%
50-
74%
75% or
more
Student tardiness....................................... 2.5 2.2 3.5 5.4 5.4 7.0 1.6 3.4 4.1 3.7 4.2 4.2
Student absenteeism/class cutting............. 1.8 2.0 2.8 5.0 5.3 6.2 1.5 2.7 3.0 3.3 3.6 3.6
Physical conflicts among students ............ 1.4 2.2 2.8 3.8 4.4 5.5 1.2 2.0 2.7 3.3 3.6 3.9
Robbery or theft of items over $10 ........... 0.9 1.4 1.6 2.0 2.8 2.8 0.6 1.3 1.1 1.4 1.1 2.0
Vandalism of school property................... 1.2 1.1 2.6 3.7 2.9 5.3 0.8 1.3 2.1 2.2 1.8 2.8
Student alcohol use................................... 1.0 1.4 2.2 1.9 2.7 5.9 0.7 1.9 1.4 2.1 1.1 1.0
Student drug use ....................................... 0.7 1.2 1.1 1.1 1.5 5.2 0.6 1.6 1.4 1.9 1.8 1.4
Sale of drugs on school grounds ............... 0.2 0.5 0.7 -- -- -- 0.3 0.8 0.7 0.6 0.8 0.7
Student tobacco use .................................. 1.1 1.7 1.7 3.3 2.7 4.3 0.9 2.0 2.0 3.6 1.7 1.5
Student possession of weapons................. 0.4 0.4 0.8 1.3 1.3 3.5 0.4 0.6 0.2 1.5 1.0 0.6
Trespassing............................................... 1.0 1.6 1.8 1.2 2.6 3.3 0.6 0.8 1.1 1.8 1.6 2.7
Verbal abuse of teachers........................... 1.1 1.3 2.1 3.0 3.1 5.8 1.0 1.3 2.2 2.5 2.5 2.4
Physical abuse of teachers ........................ 0.3 -- 0.7 -- 0.9 2.8 0.6 -- 1.4 1.9 1.3 0.4
Teacher absenteeism................................. 1.2 1.5 2.1 3.3 3.6 5.3 0.8 1.4 1.7 2.7 2.1 2.9
Teacher alcohol or drug use...................... 0.4 1.0 -- 1.2 0.8 1.0 -- -- -- -- -- --
Racial tensions.......................................... 0.7 0.9 1.0 2.6 2.0 2.9 0.5 0.6 0.7 1.4 1.2 1.8
Gangs........................................................ ‡ ‡ ‡ ‡ ‡ ‡ 0.5 0.4 0.9 1.5 1.3 2.1
‡ Data not available because this item was not asked in the 1991 survey.
-- Estimate of standard error is not derived because it is based on a statistic estimated at less than 0.5 percent or at 100 percent.
SOURCE: U.S. Department of Education, National Center for Education Statistics, Fast Response Survey System, “Principal/SchoolDisciplinarian Survey on School Violence,” FRSS 63, 1997; “Public School Principal Survey on Safe, Disciplined and Drug-FreeSchools,” FRSS 41, 1991.

81
Table 18.—Number and percent of schools in which specified disciplinary actions were takenagainst students, total number of actions taken, and percent of specific disciplinaryactions taken against students, by type of infraction: 1996-97
Percent distribution of actions taken
Infraction
Totalnumber of
schoolstaking oneor more of
thesespecifiedactions
Percent ofschools
taking oneor more of
thesespecifiedactions
Totalnumber of
thesespecifiedactionstaken
Expulsions
Transfers toalternativeschools orprograms
Out-of-school
suspensionslasting
5 or moredays
Possession or use of a firearm................. 4,170 5 16,587 31 20 49
Possession or use of a weapon other
than a firearm ...................................... 16,740 22 58,554 23 22 55
Possession, distribution, or use of
alcohol or drugs, including tobacco .... 20,960 27 170,464 18 20 62
Physical attacks or fights ........................ 30,160 39 330,696 15 19 66
SOURCE: U.S. Department of Education, National Center for Education Statistics, Fast Response Survey System, “Principal/School
Disciplinarian Survey on School Violence,” FRSS 63, 1997

82
Table 18a.—Standard errors of the number and percent of schools in which specified disciplinaryactions were taken against students, total number of actions taken, and percent ofspecific disciplinary actions taken against students, by type of infraction: 1996-97
Percent distribution of actions taken
Infraction
Totalnumber of
schoolstaking oneor more of
thesespecifiedactions
Percent ofschools
taking oneor more of
thesespecifiedactions
Totalnumber of
thesespecifiedactionstaken Expulsions
Transfers toalternativeschools orprograms
Out-of-school
suspensionslasting 5 ormore days
Possession or use of a firearm................. 480.6 0.6 3,778.2 5.4 6.3 6.5
Possession or use of a weapon other
than a firearm ...................................... 969.1 1.3 3,781.8 1.7 1.7 2.4
Possession, distribution, or use of
alcohol or drugs, including tobacco .... 782.7 1.0 8,734.6 1.5 2.0 2.0
Physical attacks or fights ........................ 1,081.4 1.4 15,964.2 1.5 2.1 2.6
SOURCE: U.S. Department of Education, National Center for Education Statistics, Fast Response Survey System, “Principal/School
Disciplinarian Survey on School Violence,” FRSS 63, 1997.

83
Table 19.—Percent of public schools reporting that they have a zero tolerance policy for variousspecified student offenses, by school characteristics: 1996-97
Types of offenses
School characteristicViolence Firearms
Weapons,other thanfirearms
Alcohol Drugs Tobacco
All public schools ........................... 79 94 91 87 88 79
Instructional levelElementary school ............................... 79 93 91 87 88 82Middle school...................................... 75 95 90 86 90 77High school ......................................... 80 96 92 86 89 72
Size of enrollmentLess than 300 ...................................... 76 93 89 84 84 76300-999............................................... 79 94 91 88 89 821,000 or more ...................................... 86 98 93 85 92 72
LocaleCity...................................................... 87 97 95 89 91 83Urban fringe ........................................ 82 95 90 88 90 80Town ................................................... 71 90 86 82 83 77Rural ................................................... 76 94 92 88 89 78
RegionNortheast ............................................. 78 89 90 83 84 79Southeast ............................................. 83 95 89 90 92 80Central................................................. 72 93 88 82 83 75West .................................................... 83 97 95 91 93 83
Percent minority enrollmentLess than 5 percent.............................. 71 92 88 82 83 755 to 19 percent..................................... 79 94 92 89 90 8020 to 49 percent................................... 83 95 90 87 89 7950 percent or more .............................. 85 97 94 90 92 83
Percent of students eligible for free orreduced-price school lunch
Less than 20 percent............................ 76 92 88 86 87 7720 to 34 percent................................... 77 94 90 87 88 8235 to 49 percent................................... 79 97 95 89 92 8170 to 74 percent................................... 80 95 90 85 88 7975 percent or more .............................. 84 95 93 87 89 81
Zero tolerance policy for violenceYes ...................................................... 100 100 99 97 97 93No ....................................................... 0 73 59 49 54 30

84
Table 19.—Percent of public schools reporting that they have a zero tolerance policy for variousspecified student offenses, by school characteristics: 1996-97--continued
Types of offenses
School characteristicViolence Firearms
Weapons,other thanfirearms
Alcohol Drugs Tobacco
Principals’ report on problems inschool1
No problems/minor problems.............. 75 91 88 85 86 79Moderate problems.............................. 82 97 95 88 90 81Serious problem .................................. 81 96 89 85 89 77
Types of crimes reported2
No crime.............................................. 74 92 88 85 85 78Any crime............................................ 82 96 92 88 90 80 Less serious or nonviolent crimes
only ............................................... 82 96 92 88 90 81 Serious violent crimes ...................... 85 96 94 89 91 76
1Discipline problems included student tardiness, student absenteeism, physical conflicts among students, robbery or theft of items over$10, vandalism of school property, student alcohol use, student drug use, sale of drugs on school grounds, student tobacco use, studentpossession of weapons, trespassing, verbal abuse of teachers, physical abuse of teachers, teacher absenteeism, teacher alcohol or druguse, racial tensions, and gangs. Serious problems means the respondent indicated at least 1 of 17 different discipline issues was a seriousproblem. Moderate problems means the respondent indicated at least one discipline issue was a moderate problem and there were noserious problems. No problems/minor problems means the respondent indicated all discipline issues were either no problem or a minorproblem.2Serious violent crime means that at least one of the following crimes occurred at the school and police were contacted: murder, rape orother type of sexual battery, suicide, physical attack or fight with a weapon, or robbery. Less serious or nonviolent crime means that noserious violent crimes occurred and at least one of the following occurred at the school for which police were contacted: physical attackor fight without a weapon, theft/larceny, or vandalism. No incidents reported means that the school reported that police were notcontacted for any of the specified crimes. Specified crimes may have occurred but police were not contacted, or other, nonspecifiedcrimes may have occurred at the school.
SOURCE: U.S. Department of Education, National Center for Education Statistics, Fast Response Survey System, “Principal/SchoolDisciplinarian Survey on School Violence,” FRSS 63, 1997.

85
Table 19a.—Standard errors of the percent of public schools reporting that they have a zerotolerance policy for various specified student offenses, by school characteristics:1996-97
Types of offenses
School characteristic Violence FirearmsWeapons,other thanfirearms
Alcohol Drugs Tobacco
All public schools ........................... 1.6 1.0 1.2 1.2 1.1 1.5
Instructional levelElementary school ............................... 2.4 1.6 1.8 1.8 1.8 2.1Middle school...................................... 2.3 1.4 1.7 2.0 1.8 2.3High school ......................................... 2.0 1.1 1.5 2.2 1.9 2.4
Size of enrollmentLess than 300 ...................................... 3.8 2.7 3.1 3.6 3.6 3.8300-999............................................... 1.8 1.0 1.2 1.2 1.2 1.51,000 or more ...................................... 2.4 0.7 1.8 2.3 1.7 2.8
LocaleCity...................................................... 2.5 1.4 1.6 2.2 2.1 2.3Urban fringe ........................................ 2.7 1.5 2.2 2.4 2.2 2.6Town ................................................... 3.2 2.4 2.5 2.7 2.7 3.1Rural ................................................... 3.5 2.0 2.3 2.4 2.3 2.9
RegionNortheast ............................................. 3.6 2.5 2.4 2.9 2.9 3.6Southeast ............................................. 2.6 1.3 2.1 1.5 1.4 2.7Central................................................. 3.4 2.1 2.8 3.0 3.0 3.3West .................................................... 2.3 1.3 1.5 1.9 1.8 2.0
Percent minority enrollmentLess than 5 percent.............................. 3.4 2.7 2.9 2.9 2.9 3.25 to 19 percent..................................... 3.9 1.8 2.2 2.6 2.6 2.920 to 49 percent................................... 2.4 1.8 2.2 2.2 2.2 2.550 percent or more .............................. 2.2 1.2 1.4 1.9 1.9 2.1
Percent of students eligible for free orreduced-price school lunch
Less than 20 percent............................ 3.4 2.2 2.6 2.6 2.7 3.020 to 34 percent................................... 3.7 2.7 2.9 3.1 3.0 3.235 to 49 percent................................... 4.2 1.8 1.9 2.8 2.8 3.250 to 74 percent................................... 3.2 1.8 2.3 3.1 2.8 3.275 percent or more .............................. 3.6 2.2 2.4 3.2 3.2 3.4
Zero tolerance policy for violenceYes ...................................................... -- -- 0.3 0.8 0.7 0.9No ....................................................... -- 4.1 4.4 4.1 4.1 4.1
Principals’ report on disciplineproblems in school
No problems/minor problems.............. 2.9 2.3 2.5 2.3 2.4 2.7Moderate problems.............................. 2.2 0.8 1.0 1.6 1.5 1.9Serious problems................................. 2.7 1.1 2.4 2.6 2.2 3.0
Types of crimes reportedNo crime.............................................. 3.1 2.1 2.6 2.6 2.5 2.9Any crime............................................ 1.4 0.8 0.9 1.2 1.1 1.6 Less serious or nonviolent crimes
only ............................................. 1.7 1.0 1.1 1.4 1.3 1.8 Serious violent crimes ..................... 2.6 1.7 1.8 2.1 2.1 2.9
-- Estimate of standard error is not derived because it is based on a statistic estimated at less than 0.5 percent or at 100 percent.
SOURCE: U.S. Department of Education, National Center for Education Statistics, Fast Response Survey System, “Principal/SchoolDisciplinarian Survey on School Violence,” FRSS 63, 1997.

86
Table 20.—Percent of public schools with policy to report crimes to the public, by schoolcharacteristics: 1996-97
School characteristic Policy to report serious crimes to the public
All public schools ......................................................... 39
Instructional levelElementary school ............................................................. 42Middle school.................................................................... 35High school ....................................................................... 33
Size of enrollmentLess than 300 .................................................................... 49300-999............................................................................. 351,000 or more .................................................................... 40
LocaleCity.................................................................................... 43Urban fringe ...................................................................... 40Town ................................................................................. 34Rural ................................................................................. 40
RegionNortheast ........................................................................... 36Southeast ........................................................................... 42Central............................................................................... 38West .................................................................................. 41
Percent minority enrollmentLess than 5 percent............................................................ 355 to 19 percent................................................................... 4120 to 49 percent................................................................. 4050 percent or more ............................................................ 43
Percent of students eligible for free orreduced-price school lunch
Less than 20 percent.......................................................... 4020 to 34 percent................................................................. 3435 to 49 percent................................................................. 3350 to 74 percent................................................................. 4475 percent or more ............................................................ 44
Zero tolerance policy for violenceYes .................................................................................... 42No ..................................................................................... 30

87
Table 20.—Percent of public schools with policy to report crimes to the public, by schoolcharacteristics: 1996-97--continued
School characteristic
Policy to report serious crimes to the public
Principals’ report on discipline problems in school1
No problems/minor problems............................................ 43Moderate problems............................................................ 37Serious problems............................................................... 35
Types of crimes reported2
No crime............................................................................ 46Any crime.......................................................................... 34 Less serious or nonviolent crimes only.......................... 34 Serious violent crimes ................................................... 34
1Discipline problems included student tardiness, student absenteeism, physical conflicts among students, robbery or theft of items over$10, vandalism of school property, student alcohol use, student drug use, sale of drugs on school grounds, student tobacco use, studentpossession of weapons, trespassing, verbal abuse of teachers, physical abuse of teachers, teacher absenteeism, teacher alcohol or druguse, racial tensions, and gangs. Serious problems means the respondent indicated at least 1 of 17 different discipline issues was a seriousproblem. Moderate problems means the respondent indicated at least one discipline issue was a moderate problem and there were noserious problems. No problems/minor problems means the respondent indicated all discipline issues were either no problem or a minorproblem.2Serious violent crime means that at least one of the following crimes occurred at the school and police were contacted: murder, rape orother type of sexual battery, suicide, physical attack or fight with a weapon, or robbery. Less serious or nonviolent crime means that noserious violent crimes occurred and at least one of the following occurred at the school for which police were contacted: physical attackor fight without a weapon, theft/larceny, or vandalism. No incidents reported means that the school reported that police were notcontacted for any of the specified crimes. Specified crimes may have occurred but police were not contacted, or other, nonspecifiedcrimes may have occurred at the school.
SOURCE: U.S. Department of Education, National Center for Education Statistics, Fast Response Survey System, “Principal/SchoolDisciplinarian Survey on School Violence,” FRSS 63, 1997.

88
Table 20a.—Standard errors of the percent of public schools with policy to report crimes to thepublic, by school characteristics: 1996-97Seriousness and type of problem Policy to report serious crimes to the public
All public schools ................................................................. 1.9
Instructional levelElementary school ..................................................................... 2.9Middle school............................................................................ 2.5High school ............................................................................... 2.5
Size of enrollmentLess than 300 ............................................................................ 5.0300-999..................................................................................... 2.11,000 or more ............................................................................ 3.4
LocaleCity............................................................................................ 4.0Urban fringe .............................................................................. 3.4Town ......................................................................................... 3.6Rural ......................................................................................... 3.2
RegionNortheast ................................................................................... 4.2Southeast ................................................................................... 4.1Central....................................................................................... 3.5West .......................................................................................... 3.8
Percent minority enrollmentLess than 5 percent.................................................................... 3.35 to 19 percent........................................................................... 3.220 to 49 percent......................................................................... 4.150 percent or more .................................................................... 3.2
Percent of students eligible for free orreduced-price school lunch
Less than 20 percent.................................................................. 3.220 to 34 percent......................................................................... 3.735 to 49 percent......................................................................... 4.250 to 74 percent......................................................................... 4.375 percent or more .................................................................... 5.0
Zero tolerance policy for violenceYes ............................................................................................ 2.0No ............................................................................................. 3.8
Principals’ report on discipline problems in schoolNo problems/minor problems.................................................... 3.2Moderate problems.................................................................... 2.5Serious problems....................................................................... 4.3
Types of crimes reportedNo crime.................................................................................... 3.2Any crime.................................................................................. 1.8 Less serious or nonviolent crimes only.................................. 2.2 Serious violent crimes ........................................................... 3.1
SOURCE: U.S. Department of Education, National Center for Education Statistics, Fast Response Survey System, “Principal/School
Disciplinarian Survey on School Violence,” FRSS 63, 1997.

89
Table 21.—Percent of public schools reporting that students were required to wear schooluniforms, by school characteristics: 1996-97
School characteristic Uniforms required
All public schools .................................................. 3
Instructional levelElementary school ...................................................... 4Middle school............................................................. 4High school ................................................................ (+)
Size of enrollmentLess than 300 ............................................................. 0300-999...................................................................... 41,000 or more ............................................................. 8
LocaleCity............................................................................. 9Urban fringe ............................................................... 6Town .......................................................................... (+)Rural .......................................................................... (+)
RegionNortheast .................................................................... 1Southeast .................................................................... 4Central........................................................................ 2West ........................................................................... 6
Percent minority enrollmentLess than 5 percent..................................................... (+)5 to 19 percent............................................................ 020 to 49 percent.......................................................... 250 percent or more ..................................................... 13
Percent of students eligible for free orreduced-price school lunch
Less than 20 percent................................................... (+)20 to 34 percent.......................................................... 135 to 49 percent.......................................................... 250 to 74 percent.......................................................... 575 percent or more ..................................................... 11
Zero tolerance policy for violenceYes ............................................................................. 4No .............................................................................. 1

90
Table 21.—Percent of public schools reporting that students were required to wear schooluniforms, by school characteristics: 1996-97--continued
School characteristic Uniforms required
Principals’ report on discipline problems in school1
No problems/minor problems..................................... 2Moderate problems..................................................... 4Serious problems........................................................ 3
Types of crimes reported2
No crime..................................................................... 4Any crime................................................................... 3
Less serious or nonviolent crimes only .................. 3Serious violent crimes ............................................ 5
(+) Less than 0.5 percent.1Discipline problems included student tardiness, student absenteeism, physical conflicts among students, robbery or theft of items over$10, vandalism of school property, student alcohol use, student drug use, sale of drugs on school grounds, student tobacco use, studentpossession of weapons, trespassing, verbal abuse of teachers, physical abuse of teachers, teacher absenteeism, teacher alcohol or druguse, racial tensions, and gangs. Serious problems means the respondent indicated at least 1 of 17 different discipline issues was a seriousproblem. Moderate problems means the respondent indicated at least one discipline issue was a moderate problem and there were noserious problems. No problems/minor problems means the respondent indicated all discipline issues were either no problem or a minorproblem.2Serious violent crime means that at least one of the following crimes occurred at the school and police were contacted: murder, rape orother type of sexual battery, suicide, physical attack or fight with a weapon, or robbery. Less serious or nonviolent crime means that noserious violent crimes occurred and at least one of the following occurred at the school for which police were contacted: physical attackor fight without a weapon, theft/larceny, or vandalism. No incidents reported means that the school reported that police were notcontacted for any of the specified crimes. Specified crimes may have occurred but police were not contacted, or other, nonspecifiedcrimes may have occurred at the school.
SOURCE: U.S. Department of Education, National Center for Education Statistics, Fast Response Survey System, “Principal/SchoolDisciplinarian Survey on School Violence,” FRSS 63, 1997.

91
Table 21a.—Standard errors of the percent of public schools reporting that students were requiredto wear school uniforms, by school characteristics: 1996-97
School characteristic Uniforms required
All public schools .................................................. 0.6
Instructional levelElementary school ...................................................... 0.9Middle school............................................................. 0.8High school ................................................................ --
Size of enrollmentLess than 300 ............................................................. --300-999...................................................................... 0.91,000 or more ............................................................. 2.2
LocaleCity............................................................................. 1.9Urban fringe ............................................................... 1.8Town .......................................................................... --Rural .......................................................................... --
RegionNortheast .................................................................... 0.9Southeast .................................................................... 1.4Central........................................................................ 1.0West ........................................................................... 1.4
Percent minority enrollmentLess than 5 percent..................................................... --5 to 19 percent............................................................ --20 to 49 percent.......................................................... 1.050 percent or more ..................................................... 2.3
Percent of students eligible for free orreduced-price school lunch
Less than 20 percent................................................... --20 to 34 percent.......................................................... 0.735 to 49 percent.......................................................... 1.250 to 74 percent.......................................................... 1.675 percent or more ..................................................... 2.6
Zero tolerance policy for violenceYes ............................................................................. 0.7No .............................................................................. 0.9
Principals’ report on discipline problems in schoolNo problems/minor problems..................................... 0.8Moderate problems..................................................... 1.2Serious problems........................................................ 1.3
Types of crimes reportedNo crime..................................................................... 1.0Any crime................................................................... 0.6 Less serious or nonviolent crimes only................... 0.8 Serious violent crimes ............................................ 1.2
-- Estimate of standard error is not derived because it is based on a statistic estimated at less than 0.5 percent or at 100 percent.
SOURCE: U.S. Department of Education, National Center for Education Statistics, Fast Response Survey System, “Principal/SchoolDisciplinarian Survey on School Violence,” FRSS 63, 1997.

92
Table 22.—Percent of public schools reporting various types of security measures at the schools, by schoolcharacteristics: 1996-97
School characteristicVisitors
must signin
Closedcampus for
moststudentsduringlunch
Controlledaccess toschool
buildings
Controlledaccess toschool
grounds
One ormore drug
sweeps
Randommetal
detectorcheck onstudents
Studentsmust passthroughmetal
detectorseach day
All public schools .............................. 96 80 53 24 19 4 1
Instructional levelElementary school .................................. 96 76 57 25 5 1 (+)Middle school......................................... 96 93 51 22 36 7 1High school ............................................ 97 78 40 25 45 9 2
Size of enrollmentLess than 300 ......................................... 91 67 40 16 22 (+) 1300-999.................................................. 98 84 57 24 15 4 11,000 or more......................................... 99 82 55 49 34 15 3
LocaleCity ........................................................ 100 81 62 35 12 8 2Urban fringe........................................... 98 85 68 31 13 3 (+)Town ...................................................... 96 77 49 20 23 2 1Rural ...................................................... 92 75 33 13 27 2 (+)
RegionNortheast................................................ 98 83 70 30 6 1 (+)Southeast ................................................ 99 86 52 28 24 9 1Central.................................................... 95 76 48 12 17 1 1West ....................................................... 94 76 46 31 25 4 1
Percent minority enrollmentLess than 5 percent................................. 94 77 42 14 17 (+) 05 to 19 percent........................................ 97 81 55 22 23 1 (+)20 to 49 percent...................................... 98 77 55 27 18 6 (+)50 percent or more ................................. 97 84 63 38 18 9 4
Percent of students eligible for free orreduced-price school lunch
Less than 20 percent............................... 94 74 50 18 17 1 020 to 34 percent...................................... 99 77 51 19 20 3 (+)35 to 49 percent...................................... 96 80 49 25 22 5 (+)50 to 74 percent...................................... 95 85 57 27 22 4 175 percent or more ................................. 97 83 58 37 13 8 5
Zero tolerance policy for violenceYes ......................................................... 96 80 54 25 20 4 1No .......................................................... 95 78 46 21 15 4 1

93
Table 22.—Percent of public schools reporting various types of security measures at the schools, by schoolcharacteristics: 1996-97--continued
School characteristicVisitors
must signin
Closedcampus for
moststudentsduringlunch
Controlledaccess toschool
buildings
Controlledaccess toschool
grounds
One ormore drug
sweeps
Randommetal
detectorcheck onstudents
Studentsmust passthroughmetal
detectorseach day
Principals’ report on discipline problemsin school1
No problems/minor problems................. 94 75 48 18 9 2 (+)Moderate problems ................................ 97 86 58 29 22 5 1Serious problems.................................... 98 75 50 28 38 7 3
Types of crimes reported2
No crime ................................................ 95 74 53 24 10 1 (+)Any crime............................................... 97 84 52 25 25 6 2
Less serious or nonviolent crimes only ................................................. 96 85 50 24 24 4 1Serious violent crimes........................ 100 80 59 31 33 15 4
(+) Less than 0.5 percent.1Discipline problems included student tardiness, student absenteeism, physical conflicts among students, robbery or theft of items over $10,vandalism of school property, student alcohol use, student drug use, sale of drugs on school grounds, student tobacco use, student possessionof weapons, trespassing, verbal abuse of teachers, physical abuse of teachers, teacher absenteeism, teacher alcohol or drug use, racialtensions, and gangs. Serious problems means the respondent indicated at least 1 of 17 different discipline issues was a serious problem.Moderate problems means the respondent indicated at least one discipline issue was a moderate problem and there were no serious problems.No problems/minor problems means the respondent indicated all discipline issues were either no problem or a minor problem.2Serious violent crime means that at least one of the following crimes occurred at the school and police were contacted: murder, rape or othertype of sexual battery, suicide, physical attack or fight with a weapon, or robbery. Less serious or nonviolent crime means that no seriousviolent crimes occurred and at least one of the following occurred at the school for which police were contacted: physical attack or fightwithout a weapon, theft/larceny, or vandalism. No incidents reported means that the school reported that the police were not contacted for anyof the specified crimes. Specified crimes may have occurred but police were not contacted, or other, nonspecified crimes may have occurredat the school.
SOURCE: U.S. Department of Education, National Center for Education Statistics, Fast Response Survey System, “Principal/School Disciplinarian Surveyon School Violence,” FRSS 63, 1997.

94
Table 22a.—Standard errors of the percent of public schools reporting various types of security measures atthe schools, by school characteristics: 1996-97
School characteristicVisitors
must signin
Closedcampus for
moststudentsduringlunch
Controlledaccess toschool
buildings
Controlledaccess toschool
grounds
One ormore drug
sweeps
Randommetal
detectorcheck onstudents
Studentsmust passthroughmetal
detectorseach day
All public schools .............................. 0.9 1.7 1.9 1.5 1.1 0.4 0.3
Instructional levelElementary school .................................. 1.4 2.5 2.8 2.3 1.3 0.5 --Middle school......................................... 1.2 1.7 2.7 1.9 2.4 1.0 0.4High school ............................................ 1.0 2.2 2.3 2.0 3.2 1.1 0.7
Size of enrollmentLess than 300 ......................................... 3.0 3.9 3.7 3.2 3.2 -- 0.4300-999.................................................. 0.6 1.8 2.4 2.1 1.1 0.6 0.41,000 or more......................................... 0.5 2.5 3.3 3.3 2.8 1.9 0.9
LocaleCity ........................................................ -- 2.9 3.2 3.7 1.0 1.0 0.5Urban fringe........................................... 1.2 2.8 3.6 3.6 1.5 0.8 --Town ...................................................... 1.5 3.6 3.7 2.7 2.8 0.8 0.8Rural ...................................................... 2.4 3.4 3.8 2.8 3.0 1.0 --
RegionNortheast................................................ 1.2 4.0 3.9 3.9 1.2 0.5 --Southeast ................................................ 0.9 2.8 3.9 2.8 2.4 1.4 0.7Central.................................................... 1.5 3.3 3.2 2.6 2.4 0.3 0.3West ....................................................... 1.8 3.9 3.8 2.9 2.4 0.9 0.7
Percent minority enrollmentLess than 5 percent................................. 2.3 3.3 3.6 2.6 2.4 -- --5 to 19 percent........................................ 1.1 3.2 3.9 3.0 2.6 0.7 --20 to 49 percent...................................... 0.9 3.9 4.0 3.2 2.5 1.2 --50 percent or more ................................. 1.6 3.2 4.1 3.8 2.1 1.3 1.2
Percent of students eligible for free orreduced-price school lunch
Less than 20 percent............................... 2.4 3.5 3.6 2.7 2.2 0.5 --20 to 34 percent...................................... 0.5 3.6 4.6 3.5 3.0 0.8 --35 to 49 percent...................................... 2.1 3.2 5.0 3.0 3.0 1.3 --50 to 74 percent...................................... 1.9 4.0 4.4 3.9 2.9 0.8 0.475 percent or more ................................. 1.7 4.5 5.1 5.0 2.2 1.6 1.5
Zero tolerance policy for violenceYes ......................................................... 0.8 2.0 2.0 1.8 1.3 0.4 0.3No .......................................................... 1.9 3.6 4.5 3.3 1.8 1.0 0.8
Principals’ report on discipline problemsin school
No problems/minor problems................. 2.0 2.8 3.0 2.4 1.5 0.6 --Moderate problems ................................ 0.8 2.2 3.0 2.3 1.7 0.7 0.6Serious problems.................................... 0.8 3.6 3.4 3.3 3.1 1.1 0.9
Types of crimes reportedNo crime ................................................ 1.9 3.1 3.0 2.7 1.6 0.5 --Any crime............................................... 0.8 2.1 2.7 1.8 1.8 0.7 0.4 Less serious or nonviolent crimes
only ............................................... 1.0 2.3 2.9 2.1 1.9 0.7 0.5 Serious violent crimes ........................ -- 3.9 4.2 3.7 4.2 2.2 1.3
-- Estimate of standard error is not derived because it is based on a statistic estimated at less than 0.5 percent or at 100 percent.
SOURCE: U.S. Department of Education, National Center for Education Statistics, Fast Response Survey System, “Principal/School Disciplinarian Surveyon School Violence,” FRSS 63, 1997.

95
Table 23.—Percent of public schools reporting various levels of police or other law enforcementpresence during a typical week, by school characteristics: 1996-97
Police or other law enforcement representatives:Stationed at the school
School characteristic30 hours or
more10 to 29 hours 1 to 9 hours
Not stationed
during a typical
week, but
available as
needed
None stationed
at school during
1996-97
All public schools ...................................... 6 1 3 12 78
Instructional levelElementary school.......................................... 1 1 1 8 89Middle school ................................................ 10 3 5 17 65High school.................................................... 19 2 6 18 54
Size of enrollmentLess than 300................................................. 1 (+) 1 9 89300-999.......................................................... 4 1 3 12 801,000 or more................................................. 39 5 7 15 34
LocaleCity ................................................................ 13 4 3 11 69Urban fringe................................................... 7 1 2 11 80Town.............................................................. 5 1 4 11 78Rural .............................................................. 1 (+) 2 14 83
RegionNortheast........................................................ 6 (+) 2 11 81Southeast........................................................ 9 2 2 11 77Central ........................................................... 4 2 3 11 81West............................................................... 7 1 4 14 74
Percent minority enrollmentLess than 5 percent ........................................ 1 1 3 10 855 to 19 percent ............................................... 6 1 3 10 8020 to 49 percent ............................................. 7 1 2 13 7750 percent or more ......................................... 13 3 3 14 67
Percent of students eligible for free orreduced-price school lunch
Less than 20 percent ...................................... 5 1 4 10 7920 to 34 percent ............................................. 7 1 2 10 8035 to 49 percent ............................................. 5 (+) 3 12 8050 to 74 percent ............................................. 6 2 1 13 7875 percent or more ......................................... 8 2 4 14 72
Zero tolerance policy for violenceYes................................................................. 7 1 3 13 76No .................................................................. 4 1 3 7 85

96
Table 23.—Percent of public schools reporting various levels of police or other law enforcementpresence during a typical week, by school characteristics: 1996-97--continued
Police or other law enforcement representatives:Stationed at the school
School characteristic30 hours or
more10 to 29 hours 1 to 9 hours
Not stationed
during a typical
week, but
available as
needed
None stationed
at school during
1996-97
Principals’ report on discipline problems inschool1
No problems/minor problems ........................ 2 (+) 1 7 89Moderate problems ........................................ 7 2 4 14 73Serious problem ............................................. 15 3 5 18 59
Types of crimes reported2
No crime ........................................................ 2 1 1 6 90Any crime ...................................................... 10 2 4 16 68 Less serious or nonviolent crimes only ...... 7 2 4 16 72 Serious violent crimes................................ 23 3 8 16 50
(+) Less than 0.5 percent.1Discipline problems included student tardiness, student absenteeism, physical conflicts among students, robbery or theft of items over$10, vandalism of school property, student alcohol use, student drug use, sale of drugs on school grounds, student tobacco use, studentpossession of weapons, trespassing, verbal abuse of teachers, physical abuse of teachers, teacher absenteeism, teacher alcohol or druguse, racial tensions, and gangs. Serious problems means the respondent indicated at least 1 of 17 different discipline issues was a seriousproblem. Moderate problems means the respondent indicated at least one discipline issue was a moderate problem and there were noserious problems. No problems/minor problems means the respondent indicated all discipline issues were either no problem or a minorproblem.2Serious violent crime means that at least one of the following crimes occurred at the school and police were contacted: murder, rape orother type of sexual battery, suicide, physical attack or fight with a weapon, or robbery. Less serious or nonviolent crime means that noserious violent crimes occurred and at least one of the following occurred at the school for which police were contacted: physical attackor fight without a weapon, theft/larceny, or vandalism. No incidents reported means that the school reported that police were notcontacted for any of the specified crimes. Specified crimes may have occurred but police were not contacted, or other, nonspecifiedcrimes may have occurred at the school.
NOTE: Percents may not add to 100 because of rounding.
SOURCE: U.S. Department of Education, National Center for Education Statistics, Fast Response Survey System, “Principal/SchoolDisciplinarian Survey on School Violence,” FRSS 63, 1997.
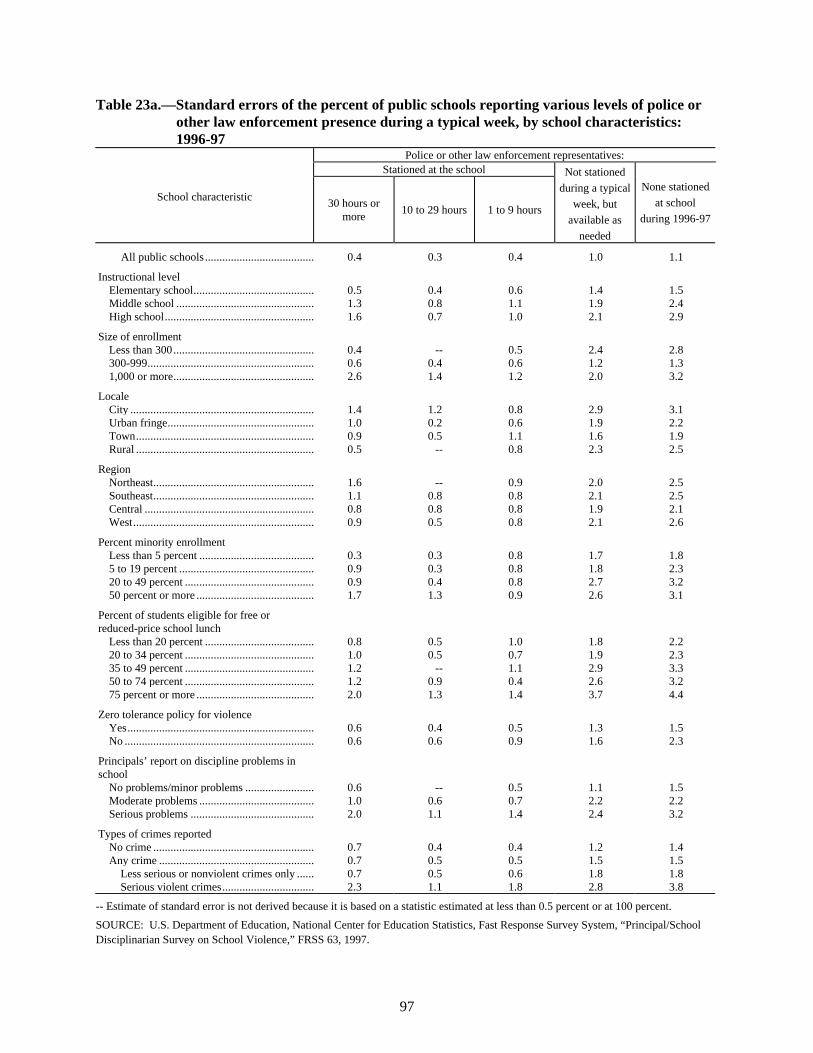
97
Table 23a.—Standard errors of the percent of public schools reporting various levels of police orother law enforcement presence during a typical week, by school characteristics:1996-97
Police or other law enforcement representatives:Stationed at the school
School characteristic30 hours or
more10 to 29 hours 1 to 9 hours
Not stationed
during a typical
week, but
available as
needed
None stationed
at school
during 1996-97
All public schools ...................................... 0.4 0.3 0.4 1.0 1.1
Instructional levelElementary school.......................................... 0.5 0.4 0.6 1.4 1.5Middle school ................................................ 1.3 0.8 1.1 1.9 2.4High school.................................................... 1.6 0.7 1.0 2.1 2.9
Size of enrollmentLess than 300................................................. 0.4 -- 0.5 2.4 2.8300-999.......................................................... 0.6 0.4 0.6 1.2 1.31,000 or more................................................. 2.6 1.4 1.2 2.0 3.2
LocaleCity ................................................................ 1.4 1.2 0.8 2.9 3.1Urban fringe................................................... 1.0 0.2 0.6 1.9 2.2Town.............................................................. 0.9 0.5 1.1 1.6 1.9Rural .............................................................. 0.5 -- 0.8 2.3 2.5
RegionNortheast........................................................ 1.6 -- 0.9 2.0 2.5Southeast........................................................ 1.1 0.8 0.8 2.1 2.5Central ........................................................... 0.8 0.8 0.8 1.9 2.1West............................................................... 0.9 0.5 0.8 2.1 2.6
Percent minority enrollmentLess than 5 percent ........................................ 0.3 0.3 0.8 1.7 1.85 to 19 percent ............................................... 0.9 0.3 0.8 1.8 2.320 to 49 percent ............................................. 0.9 0.4 0.8 2.7 3.250 percent or more ......................................... 1.7 1.3 0.9 2.6 3.1
Percent of students eligible for free orreduced-price school lunch
Less than 20 percent ...................................... 0.8 0.5 1.0 1.8 2.220 to 34 percent ............................................. 1.0 0.5 0.7 1.9 2.335 to 49 percent ............................................. 1.2 -- 1.1 2.9 3.350 to 74 percent ............................................. 1.2 0.9 0.4 2.6 3.275 percent or more ......................................... 2.0 1.3 1.4 3.7 4.4
Zero tolerance policy for violenceYes................................................................. 0.6 0.4 0.5 1.3 1.5No .................................................................. 0.6 0.6 0.9 1.6 2.3
Principals’ report on discipline problems inschool
No problems/minor problems ........................ 0.6 -- 0.5 1.1 1.5Moderate problems ........................................ 1.0 0.6 0.7 2.2 2.2Serious problems ........................................... 2.0 1.1 1.4 2.4 3.2
Types of crimes reportedNo crime ........................................................ 0.7 0.4 0.4 1.2 1.4Any crime ...................................................... 0.7 0.5 0.5 1.5 1.5 Less serious or nonviolent crimes only ...... 0.7 0.5 0.6 1.8 1.8 Serious violent crimes................................ 2.3 1.1 1.8 2.8 3.8
-- Estimate of standard error is not derived because it is based on a statistic estimated at less than 0.5 percent or at 100 percent.
SOURCE: U.S. Department of Education, National Center for Education Statistics, Fast Response Survey System, “Principal/SchoolDisciplinarian Survey on School Violence,” FRSS 63, 1997.

98
Table 24.—Percent of public schools with various degrees of security measures, by schoolcharacteristics: 1996-97
Degree of security measures1
School characteristicNo security Low security Moderate security Stringent security
All public schools ...................................... 3 84 11 2
Instructional levelElementary school.......................................... 4 92 4 0Middle school ................................................ 2 75 20 3High school.................................................... 1 68 26 5
Size of enrollmentLess than 300................................................. 8 90 2 0300-999.......................................................... 2 87 10 11,000 or more................................................. 0 46 43 11
LocaleCity ................................................................ (+) 77 19 4Urban fringe................................................... 1 89 9 1Town.............................................................. 3 84 12 (+)Rural .............................................................. 8 86 6 0
RegionNortheast........................................................ (+) 91 8 1Southeast........................................................ 2 80 16 3Central ........................................................... 4 87 8 1West............................................................... 5 80 14 2
Percent minority enrollmentLess than 5 percent ........................................ 6 89 4 05 to 19 percent ............................................... 2 88 10 (+)20 to 49 percent ............................................. 1 84 14 150 percent or more ......................................... 3 74 19 5
Percent of students eligible for free orreduced-price school lunch
Less than 20 percent ...................................... 5 84 10 120 to 34 percent ............................................. 1 88 10 135 to 49 percent ............................................. 3 85 11 150 to 74 percent ............................................. 4 85 10 175 percent or more ......................................... 3 78 16 3
Zero tolerance policy for violenceYes................................................................. 3 84 12 2No .................................................................. 3 85 11 1

99
Table 24.—Percent of public schools with various degrees of security measures, by schoolcharacteristics: 1996-97--continued
Degree of security measures1
School characteristicNo security Low security Moderate security Stringent security
Principals’ report on discipline problems inschool2
No problems/minor problems ........................ 6 89 5 (+)Moderate problems ........................................ 1 83 14 2Serious problems ........................................... 1 73 21 5
Types of crimes reported3
No crime ........................................................ 4 91 5 0Any crime ...................................................... 3 78 16 3
Less serious or nonviolent crimes only ...... 3 82 13 1Serious violent crimes................................ 0 61 31 8
(+) Less than 0.5 percent.1Security measures were considered stringent if a full-time (i.e., 30 hours or more) guard was present and students must pass through ametal detector daily or were subject to random checks with metal detectors. Moderate security measures were defined as either a full-time guard with no metal detectors and no restricted access to school, or a part-time guard with or without metal detectors and restrictedaccess to the school. Schools with no regular guard, but metal detectors were also considered to have moderate security measures.Schools with low security measures were those with no guards, no metal detectors, but restricted access. No security measures wereschools with no guards, no metal detectors, and no restricted access to the school.2Discipline problems included student tardiness, student absenteeism, physical conflicts among students, robbery or theft of items over$10, vandalism of school property, student alcohol use, student drug use, sale of drugs on school grounds, student tobacco use, studentpossession of weapons, trespassing, verbal abuse of teachers, physical abuse of teachers, teacher absenteeism, teacher alcohol or druguse, racial tensions, and gangs. Serious problems means the respondent indicated at least 1 of 17 different discipline issues was a seriousproblem. Moderate problems means the respondent indicated at least one discipline issue was a moderate problem and there were noserious problems. No problems/minor problems means the respondent indicated all discipline issues were either no problem or a minorproblem.3Serious violent crime means that at least one of the following crimes occurred at the school and police were contacted: murder, rape orother type of sexual battery, suicide, physical attack or fight with a weapon, or robbery. Less serious or nonviolent crime means that noserious violent crimes occurred and at least one of the following occurred at the school for which police were contacted: physical attackor fight without a weapon, theft/larceny, or vandalism. No incidents reported means that the school reported that police were notcontacted for any of the specified crimes. Specified crimes may have occurred but police were not contacted, or other, nonspecifiedcrimes may have occurred at the school.
NOTE: Percents may not add to 100 because of rounding.
SOURCE: U.S. Department of Education, National Center for Education Statistics, Fast Response Survey System, “Principal/SchoolDisciplinarian Survey on School Violence,” FRSS 63, 1997.

100
Table 24a.—Standard errors of the percent of public schools with various degrees of securitymeasures, by school characteristics: 1996-97
Degree of security measuresSchool characteristic
No security Low security Moderate security Stringent security
All public schools ...................................... 0.9 1.2 0.8 0.2
Instructional levelElementary school.......................................... 1.4 1.7 1.2 --Middle school ................................................ 0.9 2.1 1.9 0.6High school.................................................... 0.8 2.4 2.2 0.7
Size of enrollmentLess than 300................................................. 3.0 3.1 0.7 --300-999.......................................................... 0.6 1.3 1.2 0.21,000 or more................................................. -- 3.3 3.3 1.6
LocaleCity ................................................................ -- 2.2 2.3 0.5Urban fringe................................................... 0.7 1.5 1.1 0.4Town.............................................................. 1.5 2.1 1.6 --Rural .............................................................. 2.5 2.9 1.3 --
RegionNortheast........................................................ 0.2 1.9 1.8 0.4Southeast........................................................ 1.2 2.4 2.2 0.6Central ........................................................... 1.5 2.2 1.6 0.2West............................................................... 1.8 2.2 1.5 0.3
Percent minority enrollmentLess than 5 percent ........................................ 2.4 2.5 0.8 0.25 to 19 percent ............................................... 1.0 1.8 1.4 --20 to 49 percent ............................................. 0.8 1.7 1.8 0.350 percent or more ......................................... 1.5 3.2 3.1 0.6
Percent of students eligible for free orreduced-price school lunch
Less than 20 percent ...................................... 2.4 2.6 1.5 0.320 to 34 percent ............................................. 0.4 1.5 1.4 0.435 to 49 percent ............................................. 1.8 2.7 1.9 0.450 to 74 percent ............................................. 1.9 2.5 1.6 0.475 percent or more ......................................... 1.7 4.3 3.9 0.7
Zero tolerance policy for violenceYes................................................................. 0.9 1.3 1.0 0.2No .................................................................. 1.8 2.3 1.6 0.3
Principals’ report on discipline problems inschool
No problems/minor problems ........................ 2.0 2.2 1.1 --Moderate problems ........................................ 0.6 1.6 1.7 0.2Serious problems ........................................... 0.7 2.3 2.2 0.8
Types of crimes reportedNo crime ........................................................ 1.9 2.1 1.0 --Any crime ...................................................... 0.8 1.4 1.3 0.3 Less serious or nonviolent crimes only ...... 1.0 1.7 1.5 0.3 Serious violent crimes................................ -- 3.4 3.5 1.4
-- Estimate of standard error is not derived because it is based on a statistic estimated at less than 0.5 percent or at 100 percent.
SOURCE: U.S. Department of Education, National Center for Education Statistics, Fast Response Survey System, “Principal/SchoolDisciplinarian Survey on School Violence,” FRSS 63, 1997.

101
Table 25.—Percent of public schools with formal school violence prevention or reduction programsor efforts, by school characteristics: 1996-97
School characteristicPercent of schoolswith any programs
Percent of schoolswith only 1-day
programs
Percent of schoolswith only ongoing
programs
Percent of schoolswith both 1-day andongoing programs
All public schools ........................... 78 11 24 43
Instructional levelElementary school ............................... 78 9 28 42Middle school...................................... 82 7 19 56High school ......................................... 74 20 15 38
Size of enrollmentLess than 300 ...................................... 68 14 20 34300-999............................................... 81 10 26 451,000 or more ...................................... 84 8 17 59
LocaleCity...................................................... 87 5 25 57Urban fringe ........................................ 82 5 30 47Town ................................................... 72 11 22 38Rural ................................................... 73 21 18 35
RegionNortheast ............................................. 75 8 27 40Southeast ............................................. 84 13 28 44Central................................................. 76 9 21 46West .................................................... 77 14 20 43
Percent minority enrollmentLess than 5 percent.............................. 67 11 20 365 to 19 percent..................................... 78 10 24 4420 to 49 percent................................... 86 12 30 4450 percent or more .............................. 84 10 22 52
Percent of students eligible for free orreduced-price school lunch
Less than 20 percent............................ 73 8 22 4320 to 34 percent................................... 75 6 24 4435 to 49 percent................................... 81 15 27 4050 to 74 percent................................... 80 16 20 4475 percent or more .............................. 85 12 26 47
Zero tolerance policy for violenceYes ...................................................... 81 11 24 45No ....................................................... 69 11 21 37

102
Table 25.—Percent of public schools with formal school violence prevention or reduction programsor efforts, by school characteristics: 1996-97--continued
School characteristicPercent of schoolswith any programs
Percent of schoolswith only 1-day
programs
Percent of schoolswith only ongoing
programs
Percent of schoolswith both 1-day andongoing programs
Principals’ report on disciplineproblems in school1
No problems/minor problems.............. 73 11 25 38Moderate problems.............................. 81 11 24 46Serious problems................................. 83 13 16 53
Types of crimes reported2
No crime.............................................. 74 10 24 39Any crime............................................ 82 11 23 47
Less serious or nonviolent crimes ... 79 12 24 43Serious violent crimes ..................... 93 8 19 66
1Discipline problems included student tardiness, student absenteeism, physical conflicts among students, robbery or theft of items over$10, vandalism of school property, student alcohol use, student drug use, sale of drugs on school grounds, student tobacco use, studentpossession of weapons, trespassing, verbal abuse of teachers, physical abuse of teachers, teacher absenteeism, teacher alcohol or druguse, racial tensions, and gangs. Serious problems means the respondent indicated at least 1 of 17 different discipline issues was a seriousproblem. Moderate problems means the respondent indicated at least one discipline issue was a moderate problem and there were noserious problems. No problems/minor problems means the respondent indicated all discipline issues were either no problem or a minorproblem.2Serious violent crime means that at least one of the following crimes occurred at the school and police were contacted: murder, rape orother type of sexual battery, suicide, physical attack or fight with a weapon, or robbery. Less serious or nonviolent crime means that noserious violent crimes occurred and at least one of the following occurred at the school for which police were contacted: physical attackor fight without a weapon, theft/larceny, or vandalism. No incidents reported means that the school reported that police were notcontacted for any of the specified crimes. Specified crimes may have occurred but police were not contacted, or other, nonspecifiedcrimes may have occurred at the school.
NOTE: Details may not add to totals because of rounding.
SOURCE: U.S. Department of Education, National Center for Education Statistics, Fast Response Survey System, “Principal/School
Disciplinarian Survey on School Violence,” FRSS 63, 1997.

103
Table 25a.—Standard errors of the percent of public schools with formal school violenceprevention or reduction programs or efforts, by school characteristics: 1996-97
School characteristicPercent of schoolswith any programs
Percent of schoolswith only 1-day
programs
Percent of schoolswith only ongoing
programs
Percent of schoolswith both 1-day andongoing programs
All public schools ........................... 1.5 1.2 1.6 1.4
Instructional levelElementary school ............................... 2.3 1.6 2.5 2.5Middle school...................................... 2.0 1.5 1.9 2.8High school ......................................... 2.2 2.4 1.8 2.1
Size of enrollmentLess than 300 ...................................... 4.2 3.0 4.0 4.0300-999............................................... 1.6 1.2 1.9 1.81,000 or more ...................................... 2.8 1.5 2.5 3.7
LocaleCity...................................................... 2.6 1.4 3.3 3.6Urban fringe ........................................ 3.0 1.3 3.1 3.3Town ................................................... 3.5 2.3 3.1 3.1Rural ................................................... 3.2 3.2 2.9 3.3
RegionNortheast ............................................. 4.4 2.3 4.0 4.1Southeast ............................................. 2.5 2.8 3.4 3.7Central................................................. 3.3 1.7 2.7 3.6West .................................................... 2.8 2.3 2.5 2.8
Percent minority enrollmentLess than 5 percent.............................. 3.7 2.0 2.8 3.65 to 19 percent..................................... 3.5 1.9 2.5 3.120 to 49 percent................................... 2.7 2.6 3.7 3.750 percent or more .............................. 2.7 2.5 3.0 3.4
Percent of students eligible for free orreduced-price school lunch
Less than 20 percent............................ 3.0 1.5 2.9 3.420 to 34 percent................................... 3.0 2.0 3.7 3.935 to 49 percent................................... 4.2 3.5 4.6 3.850 to 74 percent................................... 3.6 3.2 3.8 3.975 percent or more .............................. 3.4 3.8 4.3 4.6
Zero tolerance policy for violenceYes ...................................................... 1.5 1.4 1.7 1.7No ....................................................... 4.5 2.1 2.8 3.8
Principals’ report on disciplineproblems in school
No problems/minor problems.............. 2.7 1.8 2.5 2.9Moderate problems.............................. 2.1 1.6 2.5 2.3Serious problems................................. 2.1 2.5 2.2 3.1
Types of crimes reportedNo crime.............................................. 2.7 1.9 3.0 2.9Any crime............................................ 1.9 1.6 1.9 2.1 Less serious or nonviolent crimes
only .............................................. 2.3 1.9 2.3 2.3 Serious violent crimes ..................... 1.5 2.0 3.3 3.9
SOURCE: U.S. Department of Education, National Center for Education Statistics, Fast Response Survey System, “Principal/SchoolDisciplinarian Survey on School Violence,” FRSS 63, 1997.

104
Table 26.—Number of schools with violence prevention or reduction programs or efforts, andmean number of programs in schools with violence prevention or reduction programsor efforts, by school characteristics: 1996-97
School characteristic Number of schools Mean number of programs
All public schools ........................... 60,720 3.7
Instructional levelElementary school ............................... 37,700 3.7Middle school...................................... 11,460 4.3High school ......................................... 11,550 3.2
Size of enrollmentLess than 300 ...................................... 13,750 2.3300-999............................................... 40,770 4.01,000 or more ...................................... 6,200 5.3
LocaleCity...................................................... 15,710 5.2Urban fringe ........................................ 15,520 4.0Town ................................................... 14,110 3.0Rural ................................................... 15,380 2.8
RegionNortheast ............................................. 11,350 3.8Southeast ............................................. 14,300 4.3Central................................................. 17,160 3.0West .................................................... 17,910 3.8
Percent minority enrollmentLess than 5 percent.............................. 16,200 2.45 to 19 percent..................................... 13,750 3.420 to 49 percent................................... 15,340 4.050 percent or more .............................. 14,710 5.3
Percent of students eligible for free orreduced-price school lunch
Less than 20 percent............................ 13,370 3.020 to 34 percent................................... 12,990 3.035 to 49 percent................................... 10,530 4.350 to 74 percent................................... 12,880 3.875 percent or more .............................. 10,600 4.8
Zero tolerance policy for violenceYes ...................................................... 49,290 3.8No ....................................................... 11,400 3.3

105
Table 26.—Number of schools with violence prevention or reduction programs or efforts, andmean number of programs in schools with violence prevention or reduction programsor efforts, by school characteristics: 1996-97--continued
School characteristic Number of schools Mean number of programs
Principals’ report on disciplineproblems in school1
No problems/minor problems.............. 24,450 3.0Moderate problems.............................. 25,910 4.1Serious problems................................. 10,250 4.5
Types of crimes reported2
No crime.............................................. 24,860 3.4Any crime............................................ 35,850 3.9
Less serious or nonviolent crimes only .............................................. 28,540 3.4Serious violent crimes ..................... 7,320 6.0
1Discipline problems included student tardiness, student absenteeism, physical conflicts among students, robbery or theft of items over$10, vandalism of school property, student alcohol use, student drug use, sale of drugs on school grounds, student tobacco use, studentpossession of weapons, trespassing, verbal abuse of teachers, physical abuse of teachers, teacher absenteeism, teacher alcohol or druguse, racial tensions, and gangs. Serious problems means the respondent indicated at least 1 of 17 different discipline issues was a seriousproblem. Moderate problems means the respondent indicated at least one discipline issue was a moderate problem and there were noserious problems. No problems/minor problems means the respondent indicated all discipline issues were either no problem or a minorproblem.2Serious violent crime means that at least one of the following crimes occurred at the school and police were contacted: murder, rape orother type of sexual battery, suicide, physical attack or fight with a weapon, or robbery. Less serious or nonviolent crime means that noserious violent crimes occurred and at least one of the following occurred at the school for which police were contacted: physical attackor fight without a weapon, theft/larceny, or vandalism. No incidents reported means that the school reported that police were notcontacted for any of the specified crimes. Specified crimes may have occurred but police were not contacted, or other, nonspecifiedcrimes may have occurred at the school.
NOTE: Details may not add to totals because of rounding and because some classification variables were missing for some schools.
SOURCE: U.S. Department of Education, National Center for Education Statistics, Fast Response Survey System, “Principal/SchoolDisciplinarian Survey on School Violence,” FRSS 63, 1997.

106
Table 26a.—Standard errors of the number of schools with violence prevention or reductionprograms or efforts, and of the mean number of programs in schools with violenceprevention or reduction programs or efforts, by school characteristics: 1996-97
School characteristic Number of schools Mean number of programs
All public schools ........................... 1,240.4 0.2
Instructional levelElementary school ............................... 1,141.2 0.3Middle school...................................... 292.8 0.3High school ......................................... 411.9 0.2
Size of enrollmentLess than 300 ...................................... 1,124.0 0.3300-999............................................... 941.2 0.21,000 or more ...................................... 273.1 0.3
LocaleCity...................................................... 678.2 0.4Urban fringe ........................................ 715.3 0.4Town ................................................... 642.5 0.3Rural ................................................... 798.7 0.4
RegionNortheast ............................................. 1,073.8 0.6Southeast ............................................. 914.2 0.6Central................................................. 1,058.5 0.2West .................................................... 980.7 0.3
Percent minority enrollmentLess than 5 percent.............................. 1,258.0 0.35 to 19 percent..................................... 1,200.3 0.320 to 49 percent................................... 1,106.7 0.450 percent or more .............................. 800.2 0.5
Percent of students eligible for free orreduced-price school lunch
Less than 20 percent............................ 861.7 0.320 to 34 percent................................... 989.2 0.235 to 49 percent................................... 830.3 0.750 to 74 percent................................... 1,066.5 0.475 percent or more .............................. 907.2 0.6
Zero tolerance policy for violenceYes ...................................................... 1,332.8 0.2No ....................................................... 1,011.3 0.5
Principals’ report on disciplineproblems in school
No problems/minor problems.............. 1,308.3 0.4Moderate problems.............................. 1,251.8 0.3Serious problems................................. 795.3 0.3
Types of crimes reportedNo crime.............................................. 1,455.8 0.4Any crime............................................ 1,434.7 0.2 Less serious or nonviolent crimes
only ............................................ 1,439.1 0.2 Serious violent crimes ..................... 579.3 0.4
SOURCE: U.S. Department of Education, National Center for Education Statistics, Fast Response Survey System, “Principal/School
Disciplinarian Survey on School Violence,” FRSS 63, 1997.

107
Table 27.—Percent of public schools with formal school violence prevention or reduction programsand the mean number of programs, by type of crime reported at the school: 1996-97
Type of crime Percent of schools with program Mean number of programs
All public schools ..................... 78 3.7
No crime ........................................... 74 3.4
Any crime ......................................... 82 3.9
Lesser crime only .......................... 79 3.4
Some serious crimes...................... 93 6.0
NOTE: Serious violent crime means that at least one of the following crimes occurred at the school and police were contacted: murder,rape or other type of sexual battery, suicide, physical attack or fight with a weapon, or robbery. Less serious or nonviolent crime meansthat no serious violent crimes occurred and at least one of the following occurred at the school for which police were contacted: physicalattack or fight without a weapon, theft/larceny, or vandalism. No incidents reported means that the school reported that police were notcontacted for any of the specified crimes. Specified crimes may have occurred but police were not contacted, or other, nonspecifiedcrimes may have occurred at the school.
SOURCE: U.S. Department of Education, National Center for Education Statistics, Fast Response Survey System, “Principal/SchoolDisciplinarian Survey on School Violence,” FRSS 63, 1997.
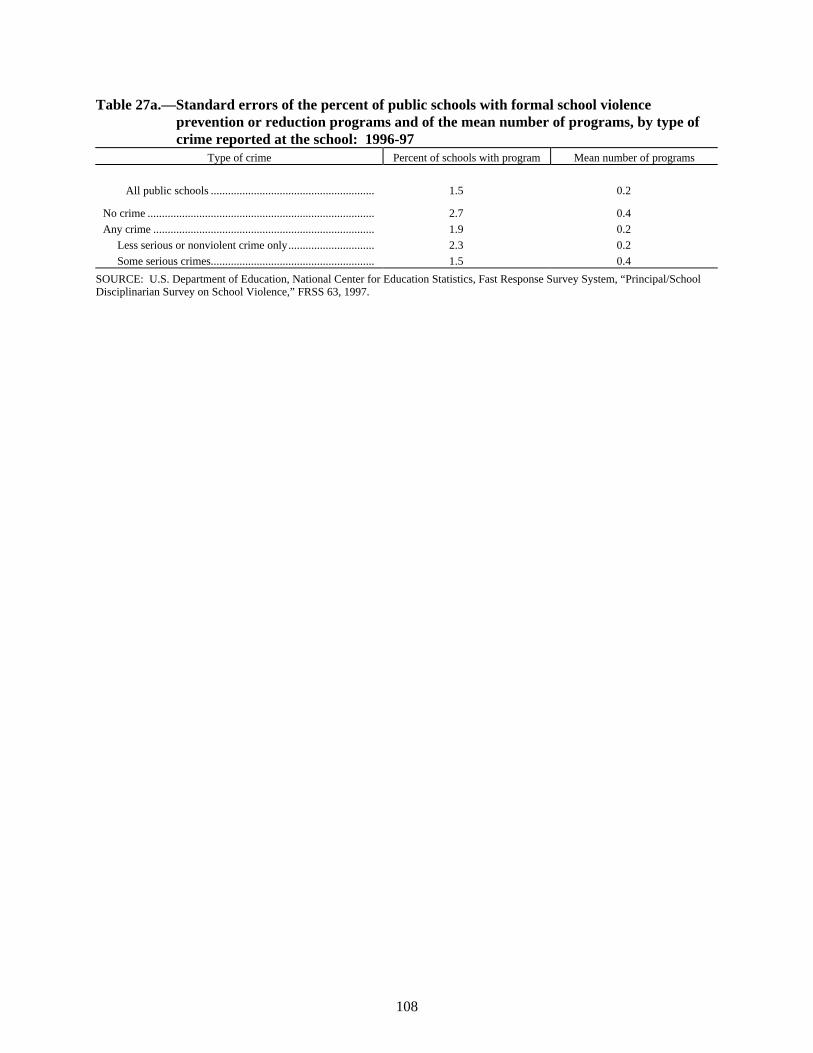
108
Table 27a.—Standard errors of the percent of public schools with formal school violenceprevention or reduction programs and of the mean number of programs, by type ofcrime reported at the school: 1996-97
Type of crime Percent of schools with program Mean number of programs
All public schools ......................................................... 1.5 0.2
No crime ............................................................................... 2.7 0.4
Any crime ............................................................................. 1.9 0.2
Less serious or nonviolent crime only.............................. 2.3 0.2
Some serious crimes......................................................... 1.5 0.4
SOURCE: U.S. Department of Education, National Center for Education Statistics, Fast Response Survey System, “Principal/SchoolDisciplinarian Survey on School Violence,” FRSS 63, 1997.

109
Table 28.—Percent of public schools with violence prevention programs and reporting one or morecrimes to the police in 1996-97 indicating that crimes were used to modify or tointroduce new violence prevention programs, by school characteristics: 1996-97
School characteristicNumber of schools with violence preventionprograms that reported one or more crimes
to the police in 1996-97
Percent of those schools indicating1996-97 criminal incidents used tomodify or introduce new violence
prevention programs
All public schools ........................... 35,330 31
Instructional levelElementary school ............................... 17,410 22Middle school...................................... 8,930 34High school ......................................... 8,990 44
Size of enrollmentLess than 300 ...................................... 5,130 26300-999............................................... 24,650 291,000 or more ...................................... 5,550 44
LocaleCity...................................................... 9,610 36Urban fringe ........................................ 9,250 28Town ................................................... 9,290 28Rural ................................................... 7,190 30
RegionNortheast ............................................. 5,890 29Southeast ............................................. 8,060 25Central................................................. 9,230 37West .................................................... 12,150 30
Percent minority enrollmentLess than 5 percent.............................. 8,120 315 to 19 percent..................................... 8,090 2420 to 49 percent................................... 8,650 3050 percent or more .............................. 10,070 37
Percent of students eligible for free orreduced-price school lunch
Less than 20 percent............................ 7,580 3020 to 34 percent................................... 7,670 2935 to 49 percent................................... 6,250 2550 to 74 percent................................... 7,290 3575 percent or more .............................. 6,290 36
Zero tolerance policy for violenceYes ...................................................... 29,690 32No ....................................................... 5,620 24

110
Table 28.—Percent of public schools with violence prevention programs and reporting one or morecrimes to the police in 1996-97 indicating that crimes were used to modify or tointroduce new violence prevention programs, by school characteristics: 1996-97--continued
School characteristicNumber of schools with violence preventionprograms that reported one or more crimes
to the police in 1996-97
Percent of those schools indicating1996-97 criminal incidents used tomodify or introduce new violence
prevention programs
Principals’ report on disciplineproblems in school1
No problems/minor problems.............. 10,270 23Moderate problems.............................. 16,310 30Serious problems................................. 8,640 42
Types of crimes reported2
No crime.............................................. (--) (--)Any crime............................................ 35,240 31 Less serious or nonviolent crimes ... 28,030 27 Serious violent crimes ..................... 7,210 47
(--) Not applicable.1Discipline problems included student tardiness, student absenteeism, physical conflicts among students, robbery or theft of items over$10, vandalism of school property, student alcohol use, student drug use, sale of drugs on school grounds, student tobacco use, studentpossession of weapons, trespassing, verbal abuse of teachers, physical abuse of teachers, teacher absenteeism, teacher alcohol or druguse, racial tensions, and gangs. Serious problems means the respondent indicated at least 1 of 17 different discipline issues was a seriousproblem. Moderate problems means the respondent indicated at least one discipline issue was a moderate problem and there were noserious problems. No problems/minor problems means the respondent indicated all discipline issues were either no problem or a minorproblem.2Serious violent crime means that at least one of the following crimes occurred at the school and police were contacted: murder, rape orother type of sexual battery, suicide, physical attack or fight with a weapon, or robbery. Less serious or nonviolent crime means that noserious violent crimes occurred and at least one of the following occurred at the school for which police were contacted: physical attackor fight without a weapon, theft/larceny, or vandalism. No incidents reported means that the school reported that police were notcontacted for any of the specified crimes. Specified crimes may have occurred but police were not contacted, or other, nonspecifiedcrimes may have occurred at the school.
NOTE: Details may not add to totals because of rounding and because data for some schools were not available.
SOURCE: U.S. Department of Education, National Center for Education Statistics, Fast Response Survey System, “Principal/SchoolDisciplinarian Survey on School Violence,” FRSS 63, 1997.

111
Table 28a.—Standard errors of the percent of public schools with violence prevention programsand reporting one or more crimes to the police in 1996-97 indicating that crimes wereused to modify or to introduce new violence prevention programs, by schoolcharacteristics: 1996-97
School characteristic
Number of schools with violence preventionprograms that reported one or more crimes
to the police in 1996-97
Percent of schools indicating 1996-97criminal incidents used to modify or
introduce new violence prevention programs
All public schools ........................... 1,467.5 1.9
Instructional levelElementary school ............................... 1,323.9 3.3Middle school...................................... 359.0 3.2High school ......................................... 440.3 2.9
Size of enrollmentLess than 300 ...................................... 879.3 6.9300-999............................................... 1,165.6 2.51,000 or more ...................................... 271.7 3.1
LocaleCity...................................................... 431.2 3.9Urban fringe ........................................ 297.6 3.3Town ................................................... 459.8 4.5Rural ................................................... 495.3 6.2
RegionNortheast ............................................. 756.8 4.6Southeast ............................................. 706.3 4.1Central................................................. 975.0 4.1West .................................................... 868.1 3.5
Percent minority enrollmentLess than 5 percent.............................. 829.2 4.65 to 19 percent..................................... 795.9 5.020 to 49 percent................................... 773.8 4.350 percent or more .............................. 695.3 3.8
Percent of students eligible for free orreduced-price school lunch
Less than 20 percent............................ 570.4 4.320 to 34 percent................................... 753.7 5.035 to 49 percent................................... 692.2 5.250 to 74 percent................................... 810.4 5.575 percent or more .............................. 710.2 5.4
Zero tolerance policy for violenceYes ...................................................... 1,396.6 2.2No ....................................................... 630.4 4.2
Principals’ report on disciplineproblems in school
No problems/minor problems.............. 179.6 4.1Moderate problems.............................. 1,028.4 2.8Serious problems................................. 649.9 3.5
Types of crimes reportedNo crime.............................................. -- --Any crime............................................ 1,463.0 1.9 Less serious or nonviolent crimes
only ............................................. 1,463.3 2.2 Serious violent crimes ..................... 583.5 4.4
-- Estimate of standard error is not derived because it is based on a statistic estimated at less than 0.5 percent or at 100 percent.
SOURCE: U.S. Department of Education, National Center for Education Statistics, Fast Response Survey System, “Principal/SchoolDisciplinarian Survey on School Violence,” FRSS 63, 1997.
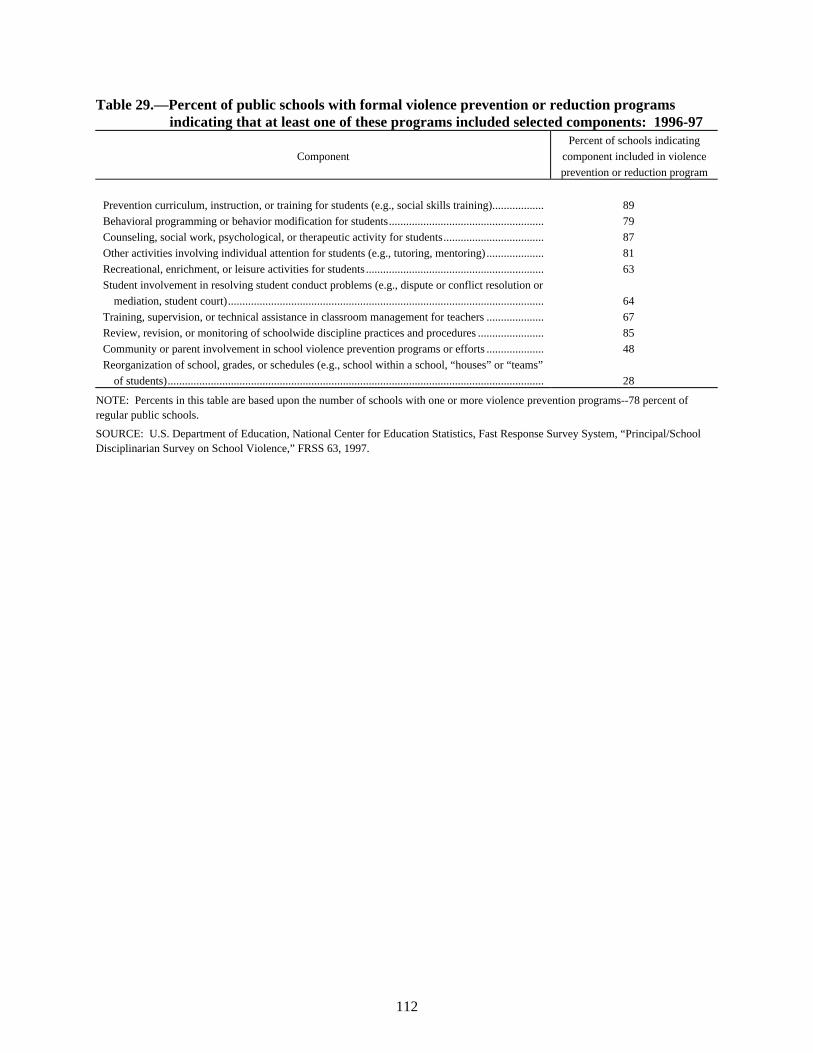
112
Table 29.—Percent of public schools with formal violence prevention or reduction programsindicating that at least one of these programs included selected components: 1996-97
Component
Percent of schools indicating
component included in violence
prevention or reduction program
Prevention curriculum, instruction, or training for students (e.g., social skills training).................. 89
Behavioral programming or behavior modification for students...................................................... 79
Counseling, social work, psychological, or therapeutic activity for students................................... 87
Other activities involving individual attention for students (e.g., tutoring, mentoring) .................... 81
Recreational, enrichment, or leisure activities for students .............................................................. 63
Student involvement in resolving student conduct problems (e.g., dispute or conflict resolution or
mediation, student court).............................................................................................................. 64
Training, supervision, or technical assistance in classroom management for teachers .................... 67
Review, revision, or monitoring of schoolwide discipline practices and procedures ....................... 85
Community or parent involvement in school violence prevention programs or efforts .................... 48
Reorganization of school, grades, or schedules (e.g., school within a school, “houses” or “teams”
of students)................................................................................................................................... 28
NOTE: Percents in this table are based upon the number of schools with one or more violence prevention programs--78 percent ofregular public schools.
SOURCE: U.S. Department of Education, National Center for Education Statistics, Fast Response Survey System, “Principal/SchoolDisciplinarian Survey on School Violence,” FRSS 63, 1997.

113
Table 29a.—Standard errors of the percent of public schools with formal violence prevention orreduction programs indicating that at least one of these programs included selectedcomponents: 1996-97
Component
Percent of schools indicating
component included in violence
prevention or reduction program
Prevention curriculum, instruction, or training for students (e.g., social skills training).................. 1.1
Behavioral programming or behavior modification for students...................................................... 1.7
Counseling, social work, psychological, or therapeutic activity for students................................... 1.6
Other activities involving individual attention for students (e.g., tutoring, mentoring) .................... 1.8
Recreational, enrichment, or leisure activities for students .............................................................. 1.7
Student involvement in resolving student conduct problems (e.g., dispute or conflict resolution or
mediation, student court).............................................................................................................. 1.9
Training, supervision, or technical assistance in classroom management for teachers .................... 2.0
Review, revision, or monitoring of schoolwide discipline practices and procedures ....................... 1.4
Community or parent involvement in school violence prevention programs or efforts .................... 1.9
Reorganization of school, grades, or schedules (e.g., school within a school, “houses” or “teams”
of students)................................................................................................................................... 1.7
SOURCE: U.S. Department of Education, National Center for Education Statistics, Fast Response Survey System, “Principal/SchoolDisciplinarian Survey on School Violence,” FRSS 63, 1997.

114
Table 30.—Percent of public schools with violence prevention programs indicating the proportionof their students participating in school violence prevention or reduction programs thatdirectly serve students, by school characteristics: 1996-97
Students participate in violence prevention or reduction programsSchool characteristic All or
almost all Most About half Some Few None
All public schools ........................... 50 10 8 14 13 4
Instructional levelElementary school ............................... 56 10 7 10 12 4Middle school...................................... 53 11 9 17 10 1High school ......................................... 25 10 10 26 22 7
Size of enrollmentLess than 300 ...................................... 46 10 10 12 17 5300-999............................................... 53 10 7 14 12 41,000 or more ...................................... 36 15 11 23 13 2
LocaleCity...................................................... 53 15 9 15 6 2Urban fringe ........................................ 53 8 10 13 10 5Town ................................................... 50 8 6 16 15 5Rural ................................................... 43 10 7 12 23 5
RegionNortheast ............................................. 44 8 8 18 17 5Southeast ............................................. 52 9 3 15 14 7Central................................................. 48 10 9 14 14 5West .................................................... 53 13 11 12 10 1
Percent minority enrollmentLess than 5 percent.............................. 47 7 8 15 18 55 to 19 percent..................................... 43 13 4 16 15 820 to 49 percent................................... 56 10 10 12 10 250 percent or more .............................. 51 12 11 14 10 2
Percent of students eligible for free orreduced-price school lunch
Less than 20 percent............................ 42 8 8 17 17 720 to 34 percent................................... 47 12 7 15 17 235 to 49 percent................................... 61 6 4 12 11 550 to 74 percent................................... 48 13 9 14 13 375 percent or more .............................. 53 11 15 12 6 3
Zero tolerance policy for violenceYes ...................................................... 49 11 8 13 14 5No ....................................................... 51 7 9 18 12 2

115
Table 30.—Percent of public schools with violence prevention programs indicating the proportionof their students participating in school violence prevention or reduction programs thatdirectly serve students, by school characteristics: 1996-97--continued
Students participate in violence prevention or reduction programsSchool characteristic All or
almost all Most About half Some Few None
Principals’ report on disciplineproblems in school1
No problems/minor problems.............. 54 9 7 11 13 6Moderate problems.............................. 49 12 9 18 11 2Serious problems................................. 41 9 10 15 21 4
Types of crimes reported2
No crime.............................................. 54 10 10 11 11 5Any crime............................................ 47 11 7 17 15 4 Less serious or nonviolent crimes ... 46 11 7 16 16 4 Serious violent crimes ..................... 49 10 7 21 11 2
1Discipline problems included student tardiness, student absenteeism, physical conflicts among students, robbery or theft of items over$10, vandalism of school property, student alcohol use, student drug use, sale of drugs on school grounds, student tobacco use, studentpossession of weapons, trespassing, verbal abuse of teachers, physical abuse of teachers, teacher absenteeism, teacher alcohol or druguse, racial tensions, and gangs. Serious problems means the respondent indicated at least 1 of 17 different discipline issues was a seriousproblem. Moderate problems means the respondent indicated at least one discipline issue was a moderate problem and there were noserious problems. No problems/minor problems means the respondent indicated all discipline issues were either no problem or a minorproblem.2Serious violent crime means that at least one of the following crimes occurred at the school and police were contacted: murder, rape orother type of sexual battery, suicide, physical attack or fight with a weapon, or robbery. Less serious or nonviolent crime means that noserious violent crimes occurred and at least one of the following occurred at the school for which police were contacted: physical attackor fight without a weapon, theft/larceny, or vandalism. No incidents reported means that the school reported that police were notcontacted for any of the specified crimes. Specified crimes may have occurred but police were not contacted, or other, nonspecifiedcrimes may have occurred at the school.
NOTE: Percents in this table are based upon the number of schools with one or more violence prevention programs--78 percent ofregular public schools. Percents may not add to 100 because of rounding.
SOURCE: U.S. Department of Education, National Center for Education Statistics, Fast Response Survey System, “Principal/SchoolDisciplinarian Survey on School Violence,” FRSS 63, 1997.

116
Table 30a.—Standard errors of the percent of public schools with violence prevention programsindicating the proportion of their students participating in school violence preventionor reduction programs that directly serve students, by school characteristics: 1996-97
Students participate in violence prevention or reduction programsSchool characteristic All or
almost all Most About half Some Few None
All public schools ........................... 1.8 1.2 1.1 1.2 1.3 0.8
Instructional levelElementary school ............................... 2.9 1.7 1.5 1.7 1.9 1.1Middle school...................................... 2.6 1.4 1.7 2.0 2.0 0.8High school ......................................... 2.7 1.8 2.1 3.1 2.6 1.9
Size of enrollmentLess than 300 ...................................... 5.5 4.0 3.4 3.2 4.0 1.8300-999............................................... 2.2 1.4 1.0 1.3 1.5 1.01,000 or more ...................................... 3.4 2.4 2.6 2.9 2.1 1.0
LocaleCity...................................................... 3.5 2.8 2.2 3.0 1.5 1.2Urban fringe ........................................ 3.5 2.2 2.5 2.6 2.1 1.7Town ................................................... 3.5 2.4 1.4 2.6 3.0 1.9Rural ................................................... 4.2 2.9 2.2 2.8 3.5 1.7
RegionNortheast ............................................. 4.7 2.5 3.0 3.2 4.0 2.4Southeast ............................................. 3.9 2.4 1.1 2.8 2.9 2.0Central................................................. 3.9 2.8 2.6 2.5 2.6 1.8West .................................................... 3.4 2.3 2.2 1.8 2.4 0.7
Percent minority enrollmentLess than 5 percent.............................. 4.4 2.4 2.3 2.4 3.3 2.15 to 19 percent..................................... 4.2 2.7 1.4 3.3 2.8 2.420 to 49 percent................................... 4.0 2.5 2.5 2.3 2.2 1.250 percent or more .............................. 4.2 2.5 2.5 2.5 2.3 1.1
Percent of students eligible for free orreduced-price school lunch
Less than 20 percent............................ 3.9 2.1 2.2 2.8 2.9 2.020 to 34 percent................................... 4.5 3.6 1.8 2.9 3.3 1.235 to 49 percent................................... 4.6 2.0 1.8 2.7 2.9 2.350 to 74 percent................................... 4.5 2.8 2.4 3.0 3.2 1.875 percent or more .............................. 5.1 3.2 3.9 3.0 2.2 1.7
Zero tolerance policy for violenceYes ...................................................... 2.0 1.4 1.2 1.4 1.5 1.0No ....................................................... 4.4 1.8 3.1 3.3 3.0 0.9
Principals’ report on disciplineproblems in school
No problems/minor problems.............. 3.7 2.1 1.8 2.0 2.4 1.7Moderate problems.............................. 2.6 1.9 1.8 2.1 1.8 0.9Serious problems................................. 3.6 2.1 2.3 3.0 3.0 1.7
Types of crimes reportedNo crime.............................................. 3.6 2.3 2.4 1.7 2.4 1.5Any crime............................................ 2.1 1.3 1.0 1.9 1.3 1.0 Less serious or nonviolent crimes
only .............................................. 2.4 1.6 1.2 2.0 1.6 1.2 Serious violent crimes ..................... 3.9 1.9 1.4 3.2 2.1 1.1
SOURCE: U.S. Department of Education, National Center for Education Statistics, Fast Response Survey System, “Principal/SchoolDisciplinarian Survey on School Violence,” FRSS 63, 1997.

117
Table 31.—Percent of public schools with violence prevention programs indicating the proportion ofteachers and staff in the school who were substantially involved in school violence effortsor programs, by school characteristics: 1996-97
Teachers and staff substantially involved in school violence efforts or programsSchool characteristic All or
almost all Most About half Some Few None
All public schools ........................... 44 12 8 15 18 3
Instructional levelElementary school ............................... 51 13 8 10 16 3Middle school...................................... 40 12 8 21 18 2High school ......................................... 26 9 7 25 27 7
Size of enrollmentLess than 300 ...................................... 43 17 6 15 16 3300-999............................................... 46 10 9 14 18 41,000 or more ...................................... 32 12 7 23 25 1
LocaleCity...................................................... 48 17 8 13 13 1Urban fringe ........................................ 48 10 8 15 17 3Town ................................................... 39 10 5 18 23 4Rural ................................................... 40 10 10 13 22 5
RegionNortheast ............................................. 37 9 11 18 23 2Southeast ............................................. 50 6 5 13 19 8Central................................................. 41 18 6 13 19 3West .................................................... 46 12 10 16 15 1
Percent minority enrollmentLess than 5 percent.............................. 40 11 8 13 23 45 to 19 percent..................................... 44 9 6 15 23 320 to 49 percent................................... 45 12 6 17 15 450 percent or more .............................. 48 13 9 14 13 2
Percent of students eligible for free orreduced-price school lunch
Less than 20 percent............................ 39 14 6 13 25 320 to 34 percent................................... 40 11 11 15 21 335 to 49 percent................................... 47 6 8 13 20 650 to 74 percent................................... 43 14 6 18 17 175 percent or more .............................. 53 13 9 14 7 4
Zero tolerance policy for violenceYes ...................................................... 46 11 8 14 17 3No ....................................................... 37 15 5 17 24 3
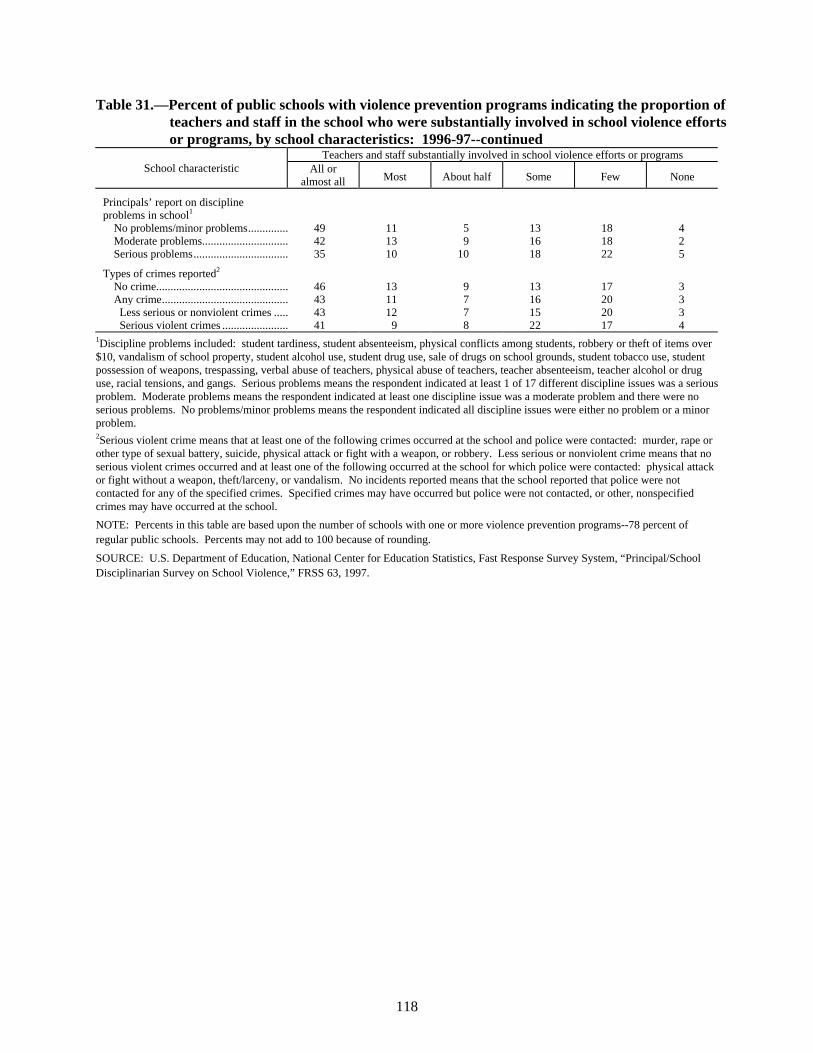
118
Table 31.—Percent of public schools with violence prevention programs indicating the proportion ofteachers and staff in the school who were substantially involved in school violence effortsor programs, by school characteristics: 1996-97--continued
Teachers and staff substantially involved in school violence efforts or programsSchool characteristic All or
almost all Most About half Some Few None
Principals’ report on disciplineproblems in school1
No problems/minor problems.............. 49 11 5 13 18 4Moderate problems.............................. 42 13 9 16 18 2Serious problems................................. 35 10 10 18 22 5
Types of crimes reported2
No crime.............................................. 46 13 9 13 17 3Any crime............................................ 43 11 7 16 20 3 Less serious or nonviolent crimes ..... 43 12 7 15 20 3 Serious violent crimes ....................... 41 9 8 22 17 4
1Discipline problems included: student tardiness, student absenteeism, physical conflicts among students, robbery or theft of items over$10, vandalism of school property, student alcohol use, student drug use, sale of drugs on school grounds, student tobacco use, studentpossession of weapons, trespassing, verbal abuse of teachers, physical abuse of teachers, teacher absenteeism, teacher alcohol or druguse, racial tensions, and gangs. Serious problems means the respondent indicated at least 1 of 17 different discipline issues was a seriousproblem. Moderate problems means the respondent indicated at least one discipline issue was a moderate problem and there were noserious problems. No problems/minor problems means the respondent indicated all discipline issues were either no problem or a minorproblem.2Serious violent crime means that at least one of the following crimes occurred at the school and police were contacted: murder, rape orother type of sexual battery, suicide, physical attack or fight with a weapon, or robbery. Less serious or nonviolent crime means that noserious violent crimes occurred and at least one of the following occurred at the school for which police were contacted: physical attackor fight without a weapon, theft/larceny, or vandalism. No incidents reported means that the school reported that police were notcontacted for any of the specified crimes. Specified crimes may have occurred but police were not contacted, or other, nonspecifiedcrimes may have occurred at the school.
NOTE: Percents in this table are based upon the number of schools with one or more violence prevention programs--78 percent ofregular public schools. Percents may not add to 100 because of rounding.
SOURCE: U.S. Department of Education, National Center for Education Statistics, Fast Response Survey System, “Principal/SchoolDisciplinarian Survey on School Violence,” FRSS 63, 1997.

119
Table 31a.—Standard errors of the percent of public schools with violence prevention programsindicating the proportion of teachers and staff in the school who were substantiallyinvolved in school violence efforts or programs, by school characteristics: 1996-97
Teachers and staff substantially involved in school violence efforts or programsSchool characteristic All or
almost all Most About half Some Few None
All public schools ........................... 1.7 1.3 1.1 1.3 1.2 0.7
Instructional levelElementary school ............................... 2.7 2.0 1.6 1.8 1.7 1.0Middle school...................................... 2.7 1.6 1.6 2.3 2.5 0.9High school ......................................... 2.9 1.9 1.3 2.7 2.5 1.6
`Size of enrollment
Less than 300 ...................................... 5.3 4.3 2.6 3.4 3.6 1.3300-999............................................... 2.2 1.6 1.3 1.3 1.6 1.01,000 or more ...................................... 3.4 2.2 1.7 2.6 2.9 0.7
LocaleCity...................................................... 4.2 3.5 2.1 2.8 2.6 1.0Urban fringe ........................................ 3.8 3.0 2.1 2.6 2.5 1.1Town ................................................... 3.8 2.6 1.5 2.8 3.4 1.7Rural ................................................... 4.6 3.2 2.7 2.8 3.5 1.7
RegionNortheast ............................................. 4.8 2.4 3.2 3.5 4.1 1.4Southeast ............................................. 3.2 1.7 1.8 2.7 2.8 2.3Central................................................. 4.2 3.2 1.9 2.7 3.1 1.1West .................................................... 3.5 2.2 2.5 2.3 2.2 0.6
Percent minority enrollmentLess than 5 percent.............................. 4.4 2.9 2.6 2.9 3.2 1.45 to 19 percent..................................... 4.6 2.2 1.8 3.2 3.8 1.320 to 49 percent................................... 3.7 2.8 2.1 2.8 2.3 1.650 percent or more .............................. 4.0 2.7 2.0 2.4 2.7 1.1
Percent of students eligible for free orreduced-price school lunch
Less than 20 percent............................ 4.2 3.3 1.8 2.5 3.1 1.520 to 34 percent................................... 4.1 3.0 2.9 2.7 3.8 1.435 to 49 percent................................... 5.1 2.5 2.7 2.5 3.3 2.050 to 74 percent................................... 4.5 3.7 2.2 2.9 3.5 1.075 percent or more .............................. 4.4 3.3 2.8 3.2 2.0 1.9
Zero tolerance policy for violenceYes ...................................................... 2.0 1.4 1.2 1.6 1.2 0.8No ....................................................... 4.4 3.9 1.8 3.1 3.8 1.1
Principals’ report on disciplineproblems in school
No problems/minor problems.............. 3.8 2.4 1.5 2.3 2.7 1.2Moderate problems.............................. 3.1 2.2 1.9 2.0 2.0 0.7Serious problems................................. 3.9 2.0 3.3 2.9 2.8 1.9
Types of crimes reportedNo crime.............................................. 3.7 2.2 2.1 2.7 2.6 1.0Any crime............................................ 2.5 1.4 1.3 1.5 1.8 0.9 Less serious or nonviolent crimes
only .............................................. 2.6 1.8 1.3 1.6 2.1 1.0 Serious violent crimes ..................... 4.6 1.5 2.4 3.4 2.7 1.8
SOURCE: U.S. Department of Education, National Center for Education Statistics, Fast Response Survey System, “Principal/SchoolDisciplinarian Survey on School Violence,” FRSS 63, 1997.
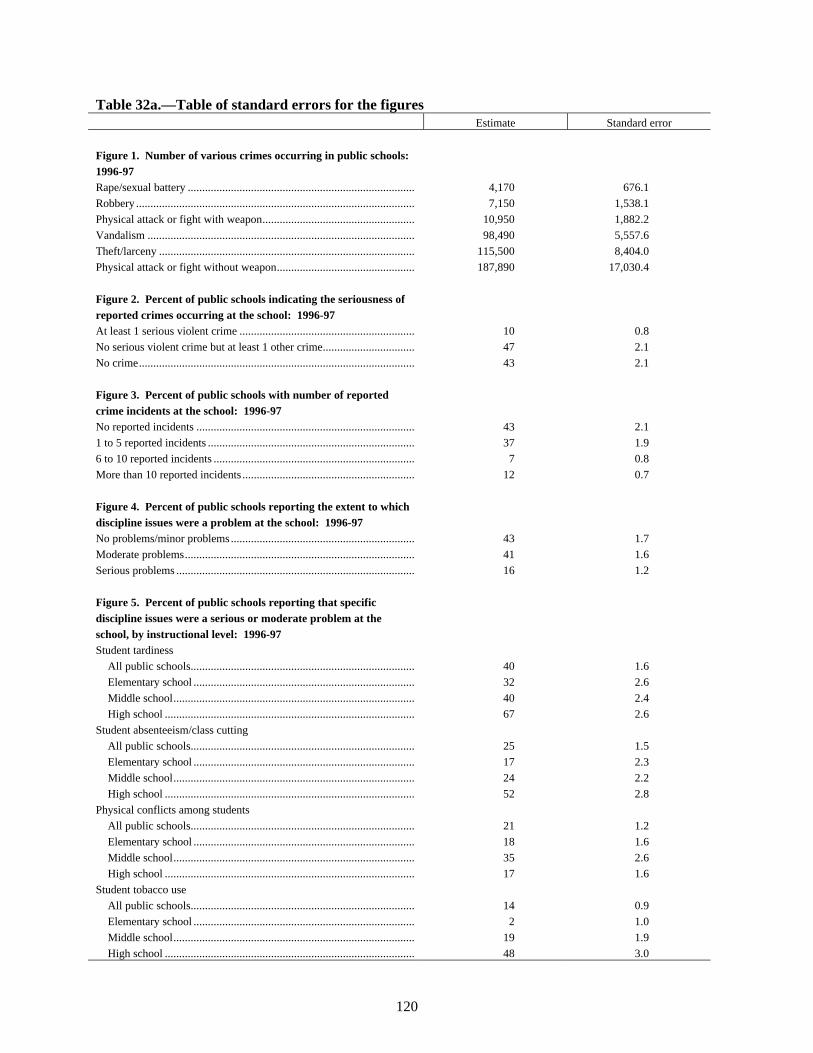
120
Table 32a.—Table of standard errors for the figuresEstimate Standard error
Figure 1. Number of various crimes occurring in public schools:1996-97Rape/sexual battery ............................................................................... 4,170 676.1
Robbery ................................................................................................. 7,150 1,538.1
Physical attack or fight with weapon..................................................... 10,950 1,882.2
Vandalism ............................................................................................. 98,490 5,557.6
Theft/larceny ......................................................................................... 115,500 8,404.0
Physical attack or fight without weapon................................................ 187,890 17,030.4
Figure 2. Percent of public schools indicating the seriousness ofreported crimes occurring at the school: 1996-97At least 1 serious violent crime ............................................................. 10 0.8
No serious violent crime but at least 1 other crime................................ 47 2.1
No crime................................................................................................ 43 2.1
Figure 3. Percent of public schools with number of reportedcrime incidents at the school: 1996-97No reported incidents ............................................................................ 43 2.1
1 to 5 reported incidents ........................................................................ 37 1.9
6 to 10 reported incidents ...................................................................... 7 0.8
More than 10 reported incidents ............................................................ 12 0.7
Figure 4. Percent of public schools reporting the extent to whichdiscipline issues were a problem at the school: 1996-97No problems/minor problems................................................................ 43 1.7
Moderate problems................................................................................ 41 1.6
Serious problems ................................................................................... 16 1.2
Figure 5. Percent of public schools reporting that specificdiscipline issues were a serious or moderate problem at theschool, by instructional level: 1996-97Student tardiness
All public schools.............................................................................. 40 1.6
Elementary school ............................................................................. 32 2.6
Middle school.................................................................................... 40 2.4
High school ....................................................................................... 67 2.6
Student absenteeism/class cutting
All public schools.............................................................................. 25 1.5
Elementary school ............................................................................. 17 2.3
Middle school.................................................................................... 24 2.2
High school ....................................................................................... 52 2.8
Physical conflicts among students
All public schools.............................................................................. 21 1.2
Elementary school ............................................................................. 18 1.6
Middle school.................................................................................... 35 2.6
High school ....................................................................................... 17 1.6
Student tobacco use
All public schools.............................................................................. 14 0.9
Elementary school ............................................................................. 2 1.0
Middle school.................................................................................... 19 1.9
High school ....................................................................................... 48 3.0

121
Table 32a.—Table of standard errors for the figures--continuedEstimate Standard error
Figure 6. Percent of public schools reporting the extent to whichdiscipline issues were a problem at the school, by reported crimein the school: 1996-97No problems/minor problems
No crime............................................................................................ 59 3.0
Any crime.......................................................................................... 31 2.0
Moderate problems
No crime............................................................................................ 36 2.8
Any crime.......................................................................................... 45 2.2
Serious problems
No crime............................................................................................ 5 1.6
Any crime.......................................................................................... 24 1.6
Figure 7. Percent of specified disciplinary actions taken by publicschools for specific offenses, by type of action taken: 1996-97Possession or use of a firearm
Expulsions......................................................................................... 31 5.4
Transfers to alternative schools or programs..................................... 20 7.6
Out-of-school suspensions lasting 5 or more days ............................ 49 6.5
Possession or use of weapon other than a firearm
Expulsions......................................................................................... 23 1.7
Transfers to alternative schools or programs..................................... 22 1.7
Out-of-school suspensions lasting 5 or more days ............................ 55 2.4
Possession, distribution, or use of alcohol or drugs, including tobacco
Expulsions......................................................................................... 18 1.5
Transfers to alternative schools or programs..................................... 20 2.0
Out-of-school suspensions lasting 5 or more days ............................ 62 2.0
Physical attacks or fights
Expulsions......................................................................................... 15 1.5
Transfers to alternative schools or programs..................................... 19 2.1
Out-of-school suspensions lasting 5 or more days ............................ 66 2.6
Figure 8. Percent of public schools that have adopted zerotolerance policies for various student offenses: 1996-97Violence ................................................................................................ 79 1.6
Tobacco................................................................................................. 79 1.5
Alcohol.................................................................................................. 87 1.2
Drugs..................................................................................................... 88 1.1
Weapons, other than firearms................................................................ 91 1.2
Firearms................................................................................................. 94 1.0
Figure 9. Percent of public schools requiring school uniforms, byyear requirement initiatedPrior to 1994-95 school year ................................................................. 26 9.4
1994-95 or 1995-96 school year............................................................ 40 9.1
1996-97 school year .............................................................................. 34 9.6
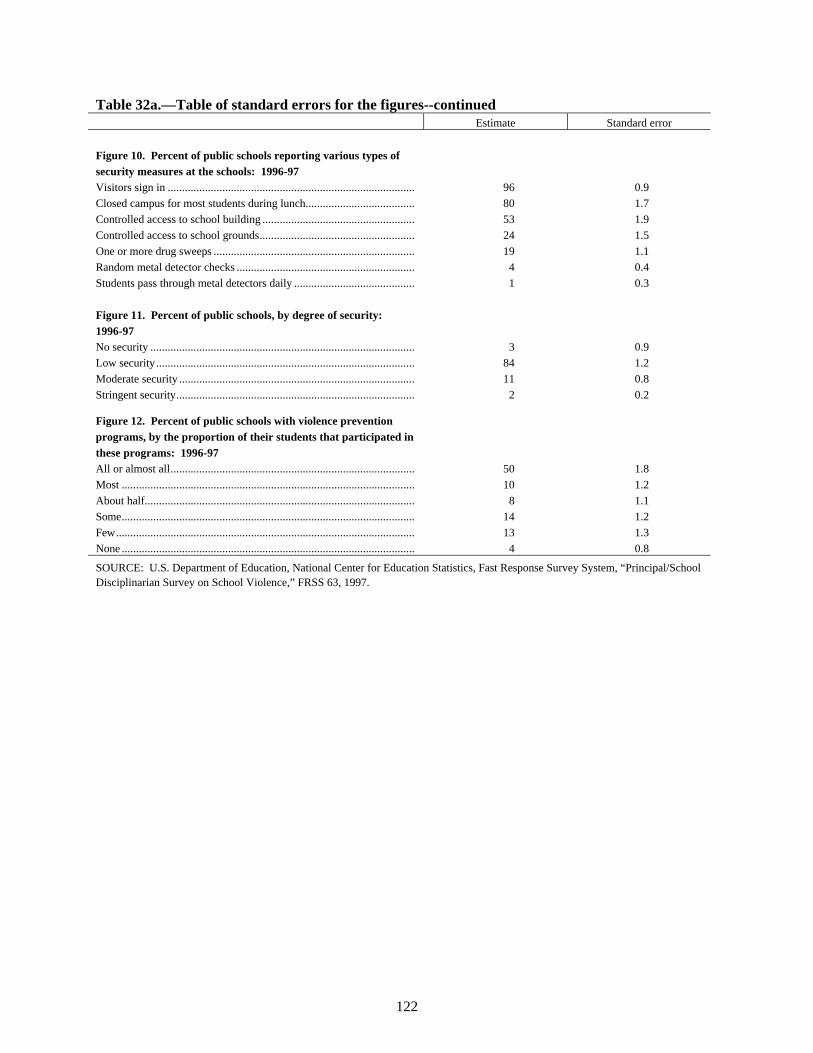
122
Table 32a.—Table of standard errors for the figures--continuedEstimate Standard error
Figure 10. Percent of public schools reporting various types ofsecurity measures at the schools: 1996-97Visitors sign in ...................................................................................... 96 0.9
Closed campus for most students during lunch...................................... 80 1.7
Controlled access to school building ..................................................... 53 1.9
Controlled access to school grounds...................................................... 24 1.5
One or more drug sweeps ...................................................................... 19 1.1
Random metal detector checks .............................................................. 4 0.4
Students pass through metal detectors daily .......................................... 1 0.3
Figure 11. Percent of public schools, by degree of security:1996-97No security ............................................................................................ 3 0.9
Low security.......................................................................................... 84 1.2
Moderate security .................................................................................. 11 0.8
Stringent security................................................................................... 2 0.2
Figure 12. Percent of public schools with violence preventionprograms, by the proportion of their students that participated inthese programs: 1996-97All or almost all..................................................................................... 50 1.8
Most ...................................................................................................... 10 1.2
About half.............................................................................................. 8 1.1
Some...................................................................................................... 14 1.2
Few........................................................................................................ 13 1.3
None ...................................................................................................... 4 0.8
SOURCE: U.S. Department of Education, National Center for Education Statistics, Fast Response Survey System, “Principal/SchoolDisciplinarian Survey on School Violence,” FRSS 63, 1997.

A-1
Appendix A
Survey Questionnaire

A-2

A-3
U.S. DEPARTMENT OF EDUCATION FORM APPROVEDNATIONAL CENTER FOR EDUCATION STATISTICS O.M.B. NO.: 1850-0733
WASHINGTON, D.C. 20208-5651 EXPIRATION DATE: 4/30/98
PRINCIPAL/SCHOOL DISCIPLINARIAN SURVEY ON SCHOOL VIOLENCE
FAST RESPONSE SURVEY SYSTEM
This survey is authorized by law (20 U.S.C. 1221e-1). While you are not required to respond, your cooperation is needed to make the results ofthis survey comprehensive, accurate, and timely.
LABEL
IF ABOVE INFORMATION IS INCORRECT, PLEASE MAKE CORRECTIONS DIRECTLY ON LABEL.
Name of person completing form: ____________________________________ Telephone:________________________
Title/position: _____________________________________________ Number of years at this school:________________
Best days and times to reach you (in case of questions): ______________________________________________________
E-mail: _________________________________________________________
PLEASE RETURN COMPLETED FORM TO: IF YOU HAVE ANY QUESTIONS, CONTACT:
WESTAT Sheila Heaviside1650 Research Boulevard 800-937-8281, ext. 8391Rockville, Maryland 20850 Fax: 800-254-0984Attention: 900262-Heaviside E:mail: [email protected]
According to the Paperwork Reduction Act of 1995, no persons are required to respond to a collection of information unless it displays a validOMB control number. The valid OMB control number for this information collection is 1850-0733. The time required to complete thisinformation collection is estimated to average 30 minutes per response, including the time to review instructions, search existing dataresources, gather the data needed, and complete and review the information collected. If you have any comments concerning the accuracy ofthe time estimate(s) or suggestions for improving this form, please write to: U.S. Department of Education, Washington, D.C. 20202-4651. Ifyou have comments or concerns regarding the status of your individual submission of this form, write directly to: National Center for EducationStatistics, 555 New Jersey Avenue, N.W., Washington, D.C. 20208.
FRSS Form No. 63, 4/97

A-4
Definitions
Firearm - any weapon that is designed to (or may readily be converted to) expel a projectile by the action of an explosive.This includes guns, bombs, grenades, mines, rockets, missiles, pipebombs, or similar devices designed to explode andcapable of causing bodily harm or property damage.
Incident - a specific criminal act or offense involving one or more victims and one or more offenders.
Physical attack or fight with a weapon - an actual and intentional touching or striking of another person against his orher will, or the intentional causing of bodily harm to an individual with a weapon. This category should be used only whenthe attack is serious enough to warrant calling the police or other law enforcement representative.
Physical attack or fight without a weapon - an actual and intentional touching or striking of another person against hisor her will, or the intentional causing of bodily harm to an individual without using a weapon. This category should be usedonly when the attack is serious enough to warrant calling the police or other law enforcement representative.
Police or other law enforcement representatives - any regular state or local law enforcement officers, school resourceofficers, campus police, security personnel employed by school or district, or other security personnel with power to arrestor hold for arrest.
Robbery - the taking or attempting to take anything of value that is owned by another person or organization, underconfrontational circumstances by force or threat of force or violence and/or by putting the victim in fear. A key differencebetween robbery and theft/larceny is that a threat or battery is involved in robbery.
Sexual battery - an incident that includes rape, fondling, indecent liberties, child molestation, or sodomy. These incidentsshould take into consideration the age and developmentally appropriate behavior of the offenders and are severe enoughto warrant calling the police or other law enforcement representative.
Theft/larceny - the unlawful taking of another person’s property without personal confrontation, threat, violence, or bodilyharm. Included are pocket picking, stealing purse or backpack (if left unattended or no force was used to take it fromowner), theft from a building, theft from a motor vehicle or motor vehicle parts or accessories, theft of bicycles, theft fromvending machines, and all other types of thefts.
Typical week - a typical full week of school. Avoid weeks with holidays, vacation periods, or weeks when unusual eventstook place at the school.
Vandalism - the damage or destruction of school property including bombing, arson, graffiti, and other acts that causeproperty damage.
Weapon - any instrument or object used with the intent to threaten, injure, or kill. Examples include guns, knives, razorblades or other sharp-edged objects, ice picks, other pointed objects (including pens, pencils), baseball bats, frying pans,sticks, rocks, and bottles.
Zero tolerance policy - a school or district policy that mandates predetermined consequences or punishment for specificoffenses.

A-5
1. Circle the number indicating to what extent, if any, each of the following has been a problem in your school duringthe 1996-97 school year.
Not aSerious Moderate Minor problem
a. Student tardiness........................................................... 1 2 3 4b. Student absenteeism/class cutting................................ 1 2 3 4c. Physical conflicts among students................................. 1 2 3 4d. Robbery or theft of items over $10 ................................ 1 2 3 4e. Vandalism of school property ........................................ 1 2 3 4f. Student alcohol use ....................................................... 1 2 3 4g. Student drug use ........................................................... 1 2 3 4h. Sale of drugs on school grounds ................................... 1 2 3 4i. Student tobacco use...................................................... 1 2 3 4j. Student possession of weapons.................................... 1 2 3 4k. Trespassing ................................................................... 1 2 3 4l. Verbal abuse of teachers............................................... 1 2 3 4m. Physical abuse of teachers............................................ 1 2 3 4n. Teacher absenteeism.................................................... 1 2 3 4o. Teacher alcohol or drug use.......................................... 1 2 3 4p. Racial tensions .............................................................. 1 2 3 4q. Gangs ............................................................................ 1 2 3 4
2. During the 1996-97 school year, how many incidents involving each type of the following crimes or offenses haveoccurred at your school? Only include incidents in which police or other law enforcement representatives (seedefinition) were contacted.
In column I, record the number of incidents for each type of crime in which one or more incidents occurred at yourschool.• If one incident included multiple crimes, include the incident only once in the first appropriate crime listed. For
example, if an incident included murder and rape, include the incident only under murder.• Include all incidents that occurred “at your school” including in school buildings, on school buses, on school
grounds, and at places that are holding school-sponsored events or activities, but are not officially on schoolgrounds. Include events or activities that took place both during and after normal school hours, including dayswhen school was not in session.
• If a particular incident has not occurred at your school during the 1996-97 school year, enter “0” in column I andleave columns II and III blank.
In column II, indicate how many of the incidents reported in column I involved one or more of your students aseither a victim or perpetrator.
In column III, indicate how many of the incidents reported in column I occurred either during school hours or atschool-sponsored events or activities after school hours.
I. Number ofincidents inwhich policeor other lawenforcement
werecontacted?
II. How manyincidents involvedstudents as either
victims orperpetrators?
III. How manyincidents occurred
during schoolhours or at school-sponsored events
or activities?
a. Murder .................................................................... _______ ________ _________b. Rape or other type of sexual battery .................. _______ ________ _________c. Suicide.................................................................... _______ ________ _________d. Physical attack or fight with a weapon ............... _______ ________ _________e. Physical attack or fight without a weapon.......... _______ ________ _________f. Robbery - the taking of things directly from a
person by force....................................................... _______ ________ _________g. Theft/larceny - the taking of things without
personal confrontation ......................................... _______ ________ _________h. Vandalism - damage or destruction of school
property or personal items on school property . _______ ________ _________

A-6
3. Does your school have a policy to report information about the types of incidents listed in question 2 to the public(e.g., to parents in a school newsletter)?
Yes..... 1 No...... 2
4. During the 1996-97 school year, how many of the following disciplinary actions have been taken for each of thelisted offenses? Include all incidents listed below (a-d) for which the following disciplinary actions have been taken.Police or other law enforcement representatives need not have been called. Report the number of times a givendisciplinary action was taken—one student suspended 5 times would be 5 suspensions.
Numbers of:
Expulsions
Transfersto alternative
schools orprograms
Out-of-schoolsuspensionslasting 5 ormore days
a. Possession or use of a firearm............................................. _________ _________ _________
b. Possession or use of a weapon other than a firearm........... _________ _________ _________
c. Possession, distribution, or use of alcohol or drugs,including tobacco.................................................................. _________ _________ _________
d. Physical attacks or fights ...................................................... _________ _________ _________
5. During the 1996-97 school year, did your school have:Yes No
a. A requirement that visitors sign or check in?......................................................... 1 2
b. Controlled access to school grounds (e.g., locked or monitored gates)? ............. 1 2
c. Controlled access to school buildings (e.g., locked or monitored doors)? ............ 1 2
d. Metal detectors through which all students must pass each day? ........................ 1 2
e. Random metal detector checks on students? ....................................................... 1 2
f. Closed campus for most students during lunch (i.e., most studentsare not allowed to leave school grounds for lunch)? ............................................. 1 2
g. One or more drug sweeps (e.g., locker searches, dog searches)? ...................... 1 2
6. In a typical week during the 1996-97 school year, how many school hours have one or more police or other lawenforcement representatives (see definition) been stationed at your school (other than for instructional purposes)?(Circle one)
30 hours or more per week ........................................................ 1
10-29 hours per week................................................................. 2
1-9 hours per week..................................................................... 3
None during the typical week, but stationed as needed ............. 4
None stationed at school during 1996-97................................... 5
7. During the 1996-97 school year, does your school have a zero tolerance policy (see definition) for:
Yes No
a. Violence?.................................................................................... 1 2
b. Firearms? ................................................................................... 1 2
c. Weapons, other than firearms?.................................................. 1 2
d. Alcohol?...................................................................................... 1 2
e. Drugs? ........................................................................................ 1 2
f. Tobacco?.................................................................................... 1 2
8. During the 1996-97 school year, are students at your school required to wear school uniforms?
Yes ..... 1 In what school year were uniforms first required? 19_____ — 19_____ school year
No....... 2
9. During the 1996-97 school year, what percentage of your students are eligible for the federally funded free orreduced-price lunch program? ______%

A-7
10. During the 1996-97 school year, how many formal (planned and organized) programs or efforts did your schoolhave that were intended to prevent or reduce school violence? (These programs or efforts can includeinstruction, other services to students, or changes to classroom and school management, and can take place eitherduring school hours or after school hours.)
Number of one-day, one-time programs .................... __________
Number of ongoing programs (more than one day) ... __________(If your school has no programs, enter “0’s” and go to question 15.)
11. Were the incidents of crimes and offenses reported in question 2 used to modify these programs or to introducenew programs? Yes..... 1 No...... 2 No incidents reported in question 2..... 3
12. During the 1996-97 school year, did any of your formal programs or efforts intended to prevent or reduce schoolviolence include the following?
Yes No
a. Prevention curriculum, instruction, or training for students (e.g., social skills training) ............ 1 2
b. Behavioral programming or behavior modification for students ............................................... 1 2
c. Counseling, social work, psychological, or therapeutic activity for students ............................ 1 2
d. Other activities involving individual attention for students (e.g., tutoring, mentoring)............... 1 2
e. Recreational, enrichment, or leisure activities for students ...................................................... 1 2
f. Student involvement in resolving student conduct problems (e.g., dispute or conflictresolution or mediation, student court) ..................................................................................... 1 2
g. Training, supervision, or technical assistance in classroom management for teachers .......... 1 2
h. Review, revision, or monitoring of school wide discipline practices and procedures ............... 1 2
i. Community or parent involvement in school violence prevention programs or efforts ............. 1 2
j. Reorganization of school, grades, or schedules (e.g., school within a school,“houses” or “teams” of students) .............................................................................................. 1 2
13. During the 1996-97 school year, about how many students in your school participated in (or will participate in)programs or efforts that directly serve students and were intended to prevent or reduce school violence?(Circle one)
All or almost all (91-100%) ......................................................... 1
Most (61-90%) ............................................................................ 2
About half (41-60%).................................................................... 3
Some (11-40%) .......................................................................... 4
Few (1-10%) ............................................................................... 5
None ........................................................................................... 6
14. During the 1996-97 school year, about how many teachers and staff in your school were substantially involved inany of the programs or efforts that were intended to prevent or reduce school violence? (Circle one)
All or almost all (91-100%) ......................................................... 1
Most (61-90%) ............................................................................ 2
About half (41-60%).................................................................... 3
Some (11-40%) .......................................................................... 4
Few (1-10%) ............................................................................... 5
None ........................................................................................... 6
15. During the 1996-97 school year (including or in addition to those programs reported in question 10), did your schoolprovide or sponsor any afterschool programs? Yes..... 1 No...... 2
16. The U.S. Department of Education may want to ask some of the schools responding to this survey to participate ina followup study on school safety at a later time. Like this survey, the followup study will be voluntary, and no datawill be released with identifying information. Does the U.S. Department of Education have your permission toconsider your school for a followup study? (Approximately 1 in 6 schools will be selected.)
Yes..... 1 No..... 2

A-8