Viola Stefania - LMU
111
Dissertation Expression of higher plant photosynthetic proteins in the cyanobacterium Synechocystis sp. PCC 6803 Dissertation der Fakultät für Biologie der Ludwig-Maximilians- Universität München vorgelegt von Stefania Viola 23.01.14
Transcript of Viola Stefania - LMU
Dissertation
Expression of higher plant photosynthetic proteins in
the cyanobacterium Synechocystis sp. PCC 6803
Dissertation der Fakultät für Biologie der Ludwig-Maximilians-
Universität München
vorgelegt von
Stefania Viola
23.01.14
Expression of higher plant photosynthetic proteins in
the cyanobacterium Synechocystis sp. PCC 6803
Dissertation
zur Erlangung des Doktorgrades der Fakultät für Biologie
der Ludwig-Maximilians-Universität München
Stefania Viola
Erstgutachter: Prof. Dr. Dario Leister
Zweitgutachter: Prof. Dr. Jörg Nickelsen
Tag der Einreichung: 18.12.2013
Tag der mündlichen Prüfung: 23.01.2014
Expression of higher plant photosynthetic proteins in the cyanobacterium Synechocystis sp. PCC 6803
i
Summary
In plants, oxygenic photosynthesis occurs in chloroplasts, specialized organelles that
originated from the endosymbiosis of an ancestral cyanobacterium. During evolution, the
photosynthetic apparatus of higher plants underwent several changes in order to adapt to the
new environmental light and oxygen conditions. The biogenesis and function of the
photosynthetic complexes require many auxiliary and regulatory proteins that evolved in land
plants, together with novel physiological mechanisms, in order to optimize the photosynthetic
efficiency. The identification of these newly-evolved photosynthetic proteins is hampered by
technical and biological limits of the plant model organisms. Here, we show the establishment
of new tools for the study of higher plant photosynthesis that rely on the expression of
Arabidopsis proteins in the unicellular cyanobacterium Synechocystis sp. PCC 6803. The use
of a cyanobacterial platform benefits from the possibility to perform targeted gene
manipulation, homologous complementation experiments and its short generation time. In this
study, the PsaA and PsaB core subunits of Synechocystis photosystem I (PSI) have been
replaced with the homologs from Arabidopsis and were shown to partially complement their
function, although no functional PSI could form. The CURT1A protein from Arabidopsis,
responsible for the curvature of the thylakoid grana margins, was expressed in Synechocystis
in addition to or in replacement of the bacterial synCURT1 homolog. CURT1A functionally
interacted with and partially complemented synCURT1, showing membrane-bending
properties that increased when removing the bulky cyanobacterial phycobilisomes. In order to
easily perform the elaborate gene manipulations required to substitute the Synechocystis
photosynthetic apparatus, an alternative single-vector based marker-less gene replacement
strategy was developed. The strategy was applied to introduce the Arabidopsis PGRL1 and
PGR5 proteins in Synechocystis. These proteins are responsible for the antimycin A-sensitive
variant of cyclic electron flow in plants. The expressed proteins caused changes in the PSI
oxidation-reduction kinetics, interacting with the electron transport chain in a manner that
needs to be further elucidated. The strategy also proved to be useful to sequentially disrupt
and replace the Synechocystis psaA gene with the Arabidopsis evolutionary descendant.
Expression of higher plant photosynthetic proteins in the cyanobacterium Synechocystis sp. PCC 6803
ii
Zusammenfassung
Die oxygene Photosynthese der Pflanzen findet in spezialisierten Organellen, den Chloroplasten,
statt, welche durch ein endosymbiotisches Ereignis entstanden sind. Als Folge der Anpassung an die
neue zelluläre Umgebung erfuhr der Chloroplast cyanobakteriellen Ursprungs im Laufe der
Evolution eine deutliche Veränderung. Diese ging mit dem Erwerb neuartiger Proteine und
physiologischen Mechanismen einher, die die Biogenese und Funktion der Photosynthesekomplexe
an die eukaryotische Situation angepasst haben. Die Identifizierung dieser neu entstandenen,
photosynthetischen Proteine wird durch technische und biologische Limitierungen der pflanzlichen
Modellorganismen erschwert. Im Rahmen dieser Arbeit wurden daher neue Methoden für die
Untersuchung der Photosynthese höherer Pflanzen entwickelt, die den Transfer und die Expression
von Proteinen aus Arabidopsis in dem Cyanobakterium Synechocystis sp. PCC 6803 erlauben. Die
Vorteile dieses Einzellers liegen vorwiegend in der relativ kurzen Generationszeit sowie in der
Möglichkeit zur gezielten Genmanipulation und homologen Komplementation. In dieser Arbeit
wurden die Untereinheiten des Photosystems I (PSI) aus Synechocystis, PsaA und PsaB, durch die
homologen Proteine aus Arabidopsis ersetzt. Hierbei wurde gezeigt, dass sich die Funktion dieser
Proteine durch deren Homologe aus Arabidposis teilweise ersetzen lässt, auch wenn kein
funktionstüchtiges PSI assembliert werden konnte. Desweitern wurde das CURT1A-Protein aus
Arabidopsis, welches für die Biegung der Thylakoidmembran in den Randbereichen der
Granastapel zuständig ist, in Synechocystis zusätzlich oder als Ersatz für dessen homologes
synCURT1-Protein exprimiert. CURT1A war in der Lage, mit synCURT1 zu interagieren und
dessen membranbiegende Funktion teilweise zu ersetzen. Die membranbiegende Fähigkeit ließ sich
zudem durch das Entfernen der voluminösen Phycobilisomen deutlich verstärken. Ein weiteres Ziel
dieser Arbeit bestand in der Etablierung einer alternativen Genaustauschstrategie, welche die
aufwändige, mehrstufige Genmanipulationen von Synechocystis vereinfacht und auf dem Transfer
eines Marker-freien Einzelvektors beruht. Unter Verwundung dieser Strategie konnten die Proteine
PGRL1 und PGR5 von Arabidopsis, die für den Antimycin A-empfindlichen zyklischen
Elektronentransport verantwortlich sind, in Synechocystis exprimiert werden. Die Expression dieser
Proteine führte zu Veränderungen in der PSI-Redox-Kinetik, wobei der genaue
Wirkungsmechanismus unbekannt ist und weitere Analysen erforderlich sind. Diese Strategie
wurde zudem erfolgreich angewandt, um das endogene psaA-Gen in Synechocystis zu stören und
anschließend durch dessen evolutionären Nachkommen aus Arabidopsis zu ersetzen.
Expression of higher plant photosynthetic proteins in the cyanobacterium Synechocystis sp. PCC 6803
iii
Index
Summary...............................................................................................................
Zusammenfassung................................................................................................
Index......................................................................................................................
List of Figures.......................................................................................................
List of Tables........................................................................................................
Abbreviations........................................................................................................
1. Introduction....................................................................................................
1.1. Endosymbiotic origin of plant chloroplasts..............................................
1.2. Higher plant photosynthesis in the light of evolution..............................
1.3. Evolution of PSI........................................................................................
1.4. Evolution of the thylakoid membrane architecture..................................
1.5. Limitations of plant photosynthesis research............................................
1.6. Designing a cyanobacterial platform to study higher plant
photosynthesis...........................................................................................
1.7. Synechocystis as a model organism..........................................................
1.8. Aim of the work........................................................................................
2. Materials and Methods..................................................................................
2.1. Chemicals, enzymes and radioactive substances......................................
2.2. Bacterial strains and vectors.....................................................................
2.3. Generation of recombinant plasmids........................................................
2.4. Synechocystis transformation....................................................................
2.5. Synechocystis counter-selection and frequency calculation of second
recombinants.............................................................................................
2.6. Plant cultivation and growth conditions...................................................
2.7. Nucleic acid manipulation........................................................................
2.7.1. Standard and high-fidelity PCR.....................................................
2.7.2. Genomic DNA isolation.................................................................
2.7.3. RNA isolation.................................................................................
2.7.4. Plant cDNA synthesis.....................................................................
2.7.5. Southern analyses...........................................................................
2.7.6. Northern analyses...........................................................................
i
ii
iii
vi
vii
viii
1
1
2
7
12
14
16
16
19
20
20
21
23
30
30
31
31
31
31
32
33
33
35
Expression of higher plant photosynthetic proteins in the cyanobacterium Synechocystis sp. PCC 6803
iv
2.8. Protein manipulation.................................................................................
2.8.1. Protein preparation and immuno-blot analyses..............................
2.8.2. Blue-Native analyses of thylakoid protein complexes...................
2.8.3. In vivo translation assay..................................................................
2.9. Spectroscopic and fluorimetric analyses...................................................
2.9.1. P700 oxidation-reduction kinetics measurements.........................
2.9.2. Bacterial whole-cell absorbance spectra........................................
2.9.3. Low temperature (77 K) fluorescence emission spectra................
2.10. Luciferase assay..............................................................................
2.11. TEM analyses.................................................................................
2.12. Database analyses and software tools.............................................
3. Results and Discussion...................................................................................
3.1. Replacement of the Synechocystis PSI complex.......................................
3.1.1. Generation of the PSI core subunits PsaA and PsaB mutants........
3.1.2. Molecular analysis of the PSI core mutants...................................
3.1.3. Discussion: Arabidopsis PsaA and PsaB can partially
complement the function of the Synechocystis homologs.................
3.2. Effects of CURT1 proteins levels on the thylakoid architecture in
Synechocystis............................................................................................
3.2.1. Generation of Synechocystis mutants with altered CURT1
protein levels......................................................................................
3.2.2. Knockout of phycobilisomes in CURT1A syncurt1.......................
3.2.3. Discussion: Synechocystis and Arabidopsis CURT1 proteins
have a conserved function in determining the thylakoid
architecture.........................................................................................
3.3. Development of a single vector-based based strategy for marker-less
gene replacement in Synechocystis...........................................................
3.3.1. Design of the strategy.....................................................................
3.3.2. Confirmation of the strategy: introduction of the luciferase
reporter system...................................................................................
3.3.3. Application of the strategy: 1. Introduction of Arabidopsis
PGRL1 and PGR5 proteins................................................................
3.3.4. Application of the strategy: 2. The psaA gene................................
36
36
36
37
38
38
38
39
39
39
39
41
41
42
44
50
54
55
57
60
60
60
63
67
72
Expression of higher plant photosynthetic proteins in the cyanobacterium Synechocystis sp. PCC 6803
v
3.3.5. Discussion: advantages of the single-step replacement strategy....
4. Conclusions.....................................................................................................
4.1. Dissecting the molecular function of known proteins: the CURT1
family and the PGRL1/PGR5-mediated CEF...........................................
4.2. Generating a cyanobacterium with a plant-type photosynthetic
machinery: replacement of PSI.................................................................
4.3. Improving the molecular tools for large-scale gene knockout and
replacement in Synechocystis....................................................................
References.............................................................................................................
Acknowledgements...............................................................................................
Curriculum vitae..................................................................................................
Declaration / Eidesstattliche Erklärung.............................................................
75
78
79
80
81
84
95
96
98
Expression of higher plant photosynthetic proteins in the cyanobacterium Synechocystis sp. PCC 6803
vi
List of Figures
Figure 1.1 Scheme of linear electron transport (LEF)...........................................
Figure 1.2 Major protein and protein complexes of the photosynthetic apparatus
of Arabidopsis thaliana and the cyanobacterium Thermosynechococcus
elongatus (Adapted and reprinted from Trends in Plant Science, 16, Allen, J.F.,
de Paula, W.B., Puthiyaveetil, S., and Nield, J., A structural phylogenetic map
for chloroplast photosynthesis., pages 645-655, 2011, with permission from
Elsevier).................................................................................................................
Figure 1.3 Scheme of cyclic electron transport (CEF) in higher plants.................
Figure 1.4 Schematic depiction of the classical double recombination strategy...
Figure 3.1 Analysis of the psaA-psaB mutant strains............................................
Figure 3.2 Expression and translation analysis in the psaA-psaB strains..............
Figure 3.3 Analyses of photosynthetic complexes in the WT, ΔpsaA and
AB_opt strains........................................................................................................
Figure 3.4 Characteristics of CURT1 proteins.......................................................
Figure 3.5 Analysis of the CURT1 strains.............................................................
Figure 3.6 Analysis of thylakoid structure of CURT1 mutants by TEM...............
Figure 3.6 Analysis of the phycobilisome mutant strains......................................
Figure 3.7 Analysis of thylakoid structure of Δapc mutants by TEM...................
Figure 3.8 Schematic depiction of the single-step double recombination strategy
Figure 3.9 Analysis of the lux strains.....................................................................
Figure 3.10 Analysis of the PGRL1 strains............................................................
Figure 3.11 Physiological characterization of the PGRL1 strains.........................
Figure 3.12 Analysis of the psaA strains................................................................
3
5
11
18
45
47
49
54
56
57
58
59
62
65
68
70
73
Expression of higher plant photosynthetic proteins in the cyanobacterium Synechocystis sp. PCC 6803
vii
List of Tables
Table 1.1 List of the photosystem I subunits in Arabidopsis thaliana and their
homologs from Synechocystis sp. PCC 6803..........................................................
Table 2.1 Strains used in this study.........................................................................
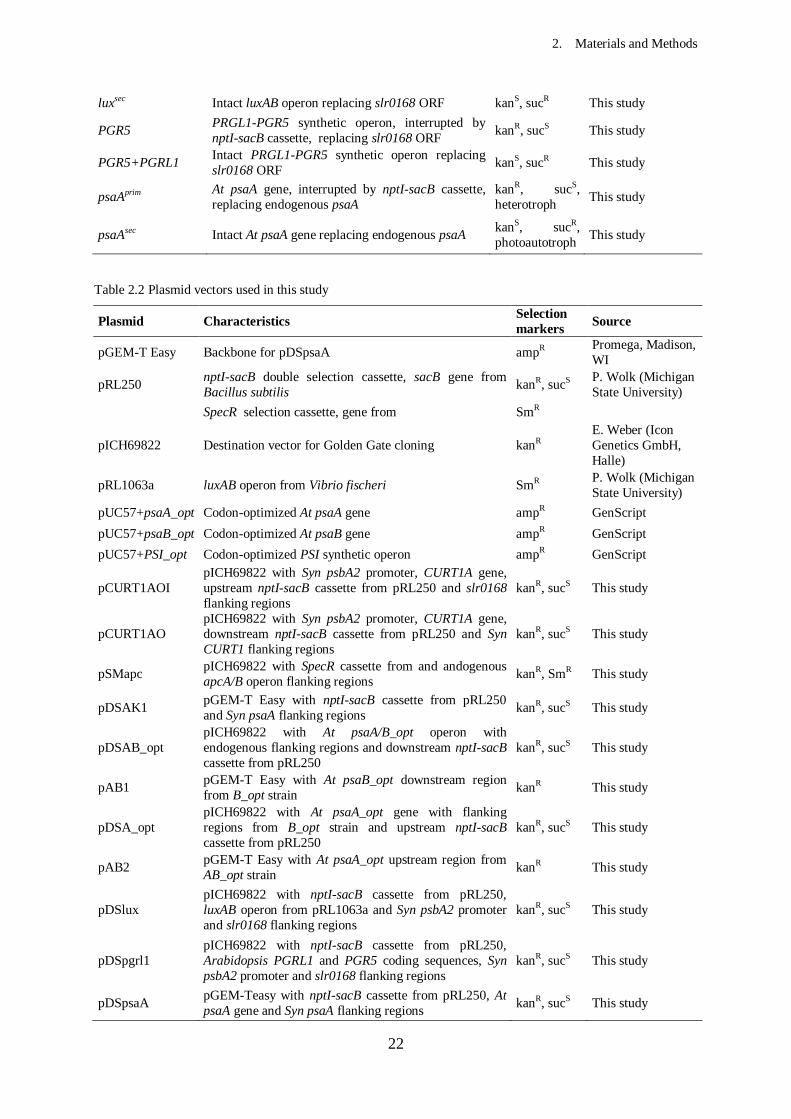
Table 2.2 Plasmid vectors used in this study...........................................................
Table 2.3 Primers used in the PSI project...............................................................
Table 2.4 Primers used in the CURT1 project........................................................
Table 2.5 Primers used in the marker-less gene replacement project.....................
Table 3.1 Frequency of the second recombination event in independent luxprim
strains.......................................................................................................................
Table 3.2 Luciferase activity relative to OD730 in Synechocystis luxprim
and luxsec
mutants....................................................................................................................
8
21
22
24
26
28
63
66
Expression of higher plant photosynthetic proteins in the cyanobacterium Synechocystis sp. PCC 6803
viii
Abbreviations
A. thaliana Arabidopsis thaliana
AA antimycin A
A absorbance
ATP adenosine triphosphate
ATPase ATP synthase
β-DM n-dodecyl β-D-maltoside
BN blue-native
bp base pair
BSA bovine serum albumin
CAI Codon Adaptation Index
cDNA complementary deoxyribonucleic acid
CEF cyclic electron flow
Chl (a/b) chlorophyll (a/b)
cTP chloroplast transit peptide
cyt cytochrome
DBMIB 2,5-dibromo-3-methyl-5-isopropyl-/7-benzoquinone
DCMU 3-(3,4-dichlorophenyl)-1,1-dimethylurea
DNA deoxyribonucleic acid
DTT dithiothreitol
EDTA ethylene diamine tetraacetic acid
Fd ferredoxin
FNR ferredoxin-NADP+-oxido-reductase
LAHG Light Activated Heterotrophic Growth
LB lysogeny broth
LDS lithium dodecyl sulphate
LEF linear electron flow
LHC (I/II) light harvesting complex (I/II)
mRNA messenger ribonucleic acid
NADP+/H Nicotinamide adenine dinucleotide phosphate
NDH NADPH deydrogenase complex
OD optical density
ORF open reading frame
Expression of higher plant photosynthetic proteins in the cyanobacterium Synechocystis sp. PCC 6803
ix
P680 PSII reaction centre
P700 PSI reaction centre
PAGE polyacrylamide gel electrophoresis
PAM pulse amplitude modulation
PC plastocyanin
PCR polymerase chain reaction
PGR5 PROTON GRADIENT REGULATION 5
PGRL1 PROTON GRADIENT REGULATION 5-LIKE 1
PQ(H2) plastoquinone oxidised (reduced)
PS (I/II) photosystem (I/II)
RNA ribonucleic acid
rRNA ribosomal RNA
RT-PCR reverse transcriptase PCR
Synechocystis Synechocystis sp. PCC 6803
SDS sodium dodecyl sulphate
T-DNA transfer-DNA
TM transmembrane domain
Tris tris (hydroxymethyl) aminomethane
tRNA transfer RNA
WT wild type
Units
°C degree Celsius
Da Dalton
g gram
g gravity
h hour
K Kelvin
k kilo
l litre
μ micro
M molar
m metre
min minutes

Expression of higher plant photosynthetic proteins in the cyanobacterium Synechocystis sp. PCC 6803
x
ml millilitre
mM millimolar
mol molar
nm nanometre
rmp rounds per minute
sec second
v volume
w weight
1. Introduction
1
1. INTRODUCTION
1.1. Endosymbiotic origin of plant chloroplasts
Oxygenic photosynthesis evolved about 2.7 billion years ago (Holland, 2006), when
cyanobacteria started to use the energy of sunlight to extract electrons from water and channel
them through two photosystems in series (photosystem II and photosystem I) to generate
high-energy chemical bonds and reducing power as final products. In photosynthetic
eukaryotes (algae and plants), this process takes place inside specialized organelles called
chloroplasts that are now widely believed to derive from a endosymbiotic relationship
between an ancestral cyanobacterium and a heterotrophic eukaryote. Like mitochondria, these
so-called “primary” plastids are probably monophyletic and derive from a single
endosymbiotic event (Howe et al., 2003; Douglas and Raven, 2003). Although chlorophyll b
and c, photosynthetic pigments present in chloroplasts, are found only in certain
cyanobacteria called prochlorophytes, this appears not to be an unequivocal proof for this
specific clade to be the plastidial ancestor. Indeed, prochlorophytes are no monophyletic
group by themselves (Lewin, 2002) and this suggests that chlorophyll b or c emerged
independently several times during evolution. In contrast, it was recently shown that
chloroplasts share the highest genetic similarity with the cyanobacterium Nostoc punctiforme
(Meeks et al., 2001).
From the comparison of different cyanobacterial and plant chloroplast genomes, it can be
concluded that the latter are strongly reduced in size and encode less genes than their
evolutionary ancestors. Indeed, the genome length of Nostoc punctiforme approaches 9 Mbp
and contains up to 7500 ORFs (Meeks et al., 2001), while the chloroplast genome from
Arabidopsis thaliana, a well-characterized angiosperm, is 154 kb long and contains 87
putative protein-coding genes, 4 rRNA genes and 37 tRNA genes (Sato et al., 1999). In
addition to the products of the few annotated plastidial genes, the Arabidopsis chloroplast
proteome comprises about 2-3000 proteins, most of which are encoded by nuclear genes. On
the other hand, up to 4500 (18 %) of Arabidopsis nuclear genes have direct homologs in
cyanobacteria (Martin et al., 2002). Indeed, after the endosymbiotic event that originated
chloroplasts, many genes became transferred from the plastidial to the nuclear genome of the
host cell (Kleine et al., 2009). In this scenario, while the genetic autonomy of the organelles
was reduced, new mechanisms required for the functionality of the transferred genes arose in
the host cell. The newly evolved nuclear genes needed to be coupled with adequate DNA
1. Introduction
2
regulatory elements (promoters, terminators) in order to be transcribed by the eukaryotic
transcription machinery. Once translated in the cytosol, the proteins needed to be re-targeted
to the organelle of origin in order to complete their function (Cavalier-Smith and Lee, 1985;
Martin, 2003). Some of these genes acquired targeting elements that enabled them to be
imported into the chloroplast while some others were not re-targeted to plastids anymore and
gained new functions in other organelles or pathways of the host cell. Moreover, copies of the
same gene deriving from duplication events diverged in their function, occasionally
generating new metabolic pathways via their interaction with host proteins (Leister, 2003;
Timmis et al., 2004). The integration process of the endosymbiont also included the targeting
to the new organelle of nuclear genes that were not of cyanobacterial origin. Because of the
gene transfer, the chloroplast protein complexes and supercomplexes are mosaics of plastid-
and nuclear-encoded proteins, therefore making it necessary to efficiently coordinate the gene
expression in both genetic compartments to guarantee a correct plastid development and
functionality (reviewed in Pesaresi et al., 2007; Woodson and Chory, 2008). Indeed, the
assembly of the chimeric protein complexes, their cofactors and the stoichiometric adaption of
the photosynthetic machinery to the changing environmental conditions require an intricate
bidirectional communication between the organelle and the nucleus. Therefore, integration of
the photosynthetic endosymbiont in the host cell led to the rise of new plant-specific
regulatory, signalling and transport functions, thus introducing new levels of complexity in
eukaryotic photosynthesis.
Cyanobacteria and plant chloroplasts, although basically performing the same photosynthetic
reaction, find themselves facing different environmental conditions and the various biological
challenges that derive from them. Plants are sessile organisms and cannot avert drastic or
unfavourable changes in the surrounding environment. Therefore, they needed to evolve new
strategies to modulate the photosynthetic process in order to maintain its efficiency and avoid
damages. Modern plant chloroplasts differ from modern cyanobacteria in many aspects and
all of them can be understood in the light of evolution.
1.2. Higher plant photosynthesis in the light of evolution
Oxygenic photosynthesis is the process in which solar energy is used to synthesize carbon
compounds from water and carbon dioxide. During the photosynthetic light reactions, the
light energy is used to photolyse H2O and to generate reducing power (NADPH) and high-
energy chemical bonds (ATP).
1. Introduction
3
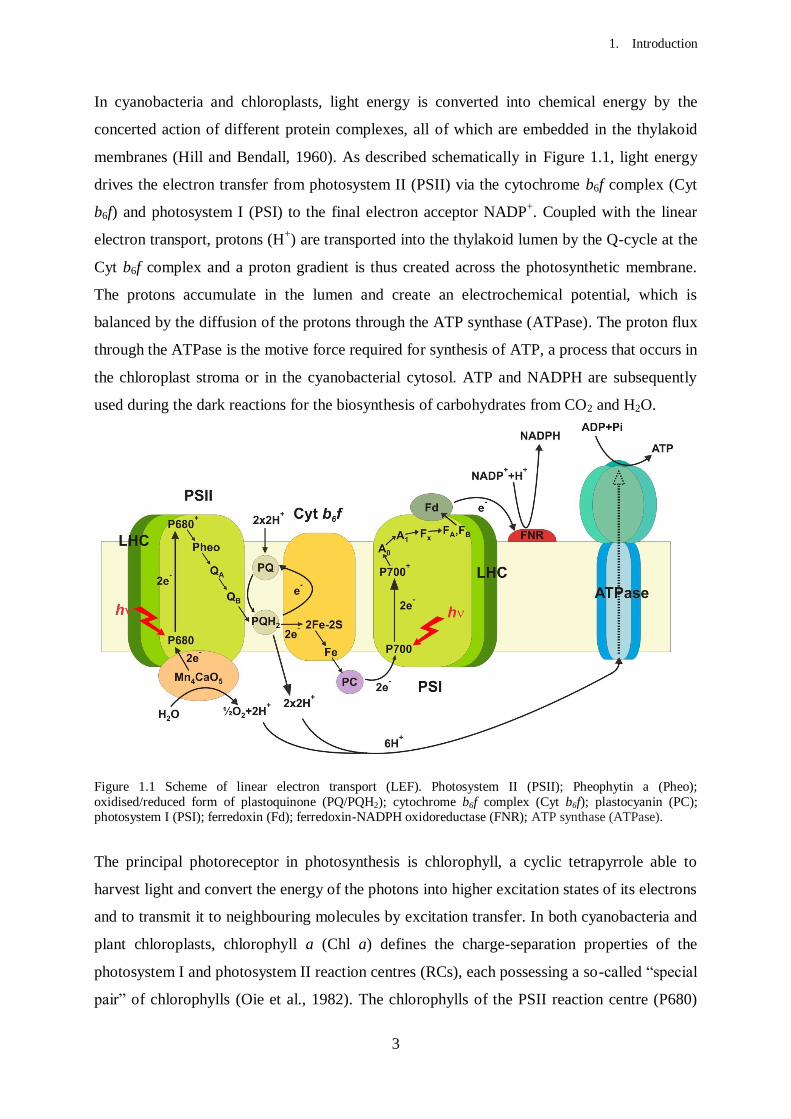
In cyanobacteria and chloroplasts, light energy is converted into chemical energy by the
concerted action of different protein complexes, all of which are embedded in the thylakoid
membranes (Hill and Bendall, 1960). As described schematically in Figure 1.1, light energy
drives the electron transfer from photosystem II (PSII) via the cytochrome b6f complex (Cyt
b6f) and photosystem I (PSI) to the final electron acceptor NADP+. Coupled with the linear
electron transport, protons (H+) are transported into the thylakoid lumen by the Q-cycle at the
Cyt b6f complex and a proton gradient is thus created across the photosynthetic membrane.
The protons accumulate in the lumen and create an electrochemical potential, which is
balanced by the diffusion of the protons through the ATP synthase (ATPase). The proton flux
through the ATPase is the motive force required for synthesis of ATP, a process that occurs in
the chloroplast stroma or in the cyanobacterial cytosol. ATP and NADPH are subsequently
used during the dark reactions for the biosynthesis of carbohydrates from CO2 and H2O.
Figure 1.1 Scheme of linear electron transport (LEF). Photosystem II (PSII); Pheophytin a (Pheo);
oxidised/reduced form of plastoquinone (PQ/PQH2); cytochrome b6f complex (Cyt b6f); plastocyanin (PC); photosystem I (PSI); ferredoxin (Fd); ferredoxin-NADPH oxidoreductase (FNR); ATP synthase (ATPase).
The principal photoreceptor in photosynthesis is chlorophyll, a cyclic tetrapyrrole able to
harvest light and convert the energy of the photons into higher excitation states of its electrons
and to transmit it to neighbouring molecules by excitation transfer. In both cyanobacteria and
plant chloroplasts, chlorophyll a (Chl a) defines the charge-separation properties of the
photosystem I and photosystem II reaction centres (RCs), each possessing a so-called “special
pair” of chlorophylls (Oie et al., 1982). The chlorophylls of the PSII reaction centre (P680)
1. Introduction
4
have an excitation wavelength peak at 680 nm and transfer electrons from water to the
primary acceptor pheophytin (Pheo) (Debus, 1992). From PSII, the electrons are transferred
by the plastoquinones, lipid-soluble electron carriers, to the Cyt b6f complex. This, in turn,
transfers them to the lumenal soluble carrier plastocyanin, replaced by the cytochrome c6 in
cyanobacteria under copper deficiency conditions (reviewed in Kerfeld and Krogmann, 1998).
The photosystem I (PSI) complex catalyzes the oxidation of plastocyanin and the reduction of
ferredoxin or flavodoxin, a small iron-sulphur protein located in the stroma of chloroplasts or
in the cytosol in cyanobacteria. In PSI the primary photochemistry is initiated by a Chl a
dimer, P700, with an excitation peak at 700 nm and the charge separation of P700 transfers
electrons to a chlorophyll a monomer (Ao). In addition 4Fe-4S centres serve as electron
carriers in PSI (van der Est et al., 1994).
Although they perform the same fundamental process, the photosynthetic machineries of
cyanobacteria and higher plant evidently display many differences in both their structure and
their physiology, as shown in Figure 1.2 (modified from Allen et al., 2011). To increase the
absorption cross-section of the chlorophylls located in the photosynthetic RCs, light-
harvesting antenna systems are normally associated with them. In contrast to PSII, many of
the antenna chlorophyll molecules in PSI are bound to the proteins of the reaction centre and,
therefore, the antennas serving the two photosystems are also different (Rakhimberdieva et
al., 2001). The antenna systems of cyanobacteria and land plants present an extraordinary
variety of protein structures and pigments, suggesting that they diverged during evolution to
adapt to different light environments. In cyanobacteria, the light-harvesting antennas are
constituted by the phycobilisomes (PBSs), protein-pigment complexes peripherally associated
with the thylakoid membrane (external antenna) (Liu et al., 2013). Phycobilisomes are
constituted by a core of allophycocyanin (APC), which is connected to the membrane through
linker polypeptides and is surrounded by six rods of chromophorylated phycocyanin (PC) and
phycoerytrin (PE) proteins (reviewed in Adir, 2005). All chlorophylls in cyanobacteria are
exclusively localized in the core antennas of PSI and PSII, whereas the chromophores
associated with the PSBs are the bilins, a class of open-chained tetrapyrrols that are
responsible for the blue-green colour of cyanobacteria. Pigments of lateral rods transfer the
excitation energy via APC to the terminal acceptor of energy (also APC) which, in turn, relays
the excitation to antenna chlorophylls of PSII and PSI localized within the membrane
(Mullineaux, 2008).
In higher plants, the Light Harvesting Complexes (LHCs) are associated with Chl a and Chl b
and therefore belong to the CAB (chlorophyll a/b-binding) protein class. Although Chl a is
1. Introduction
5
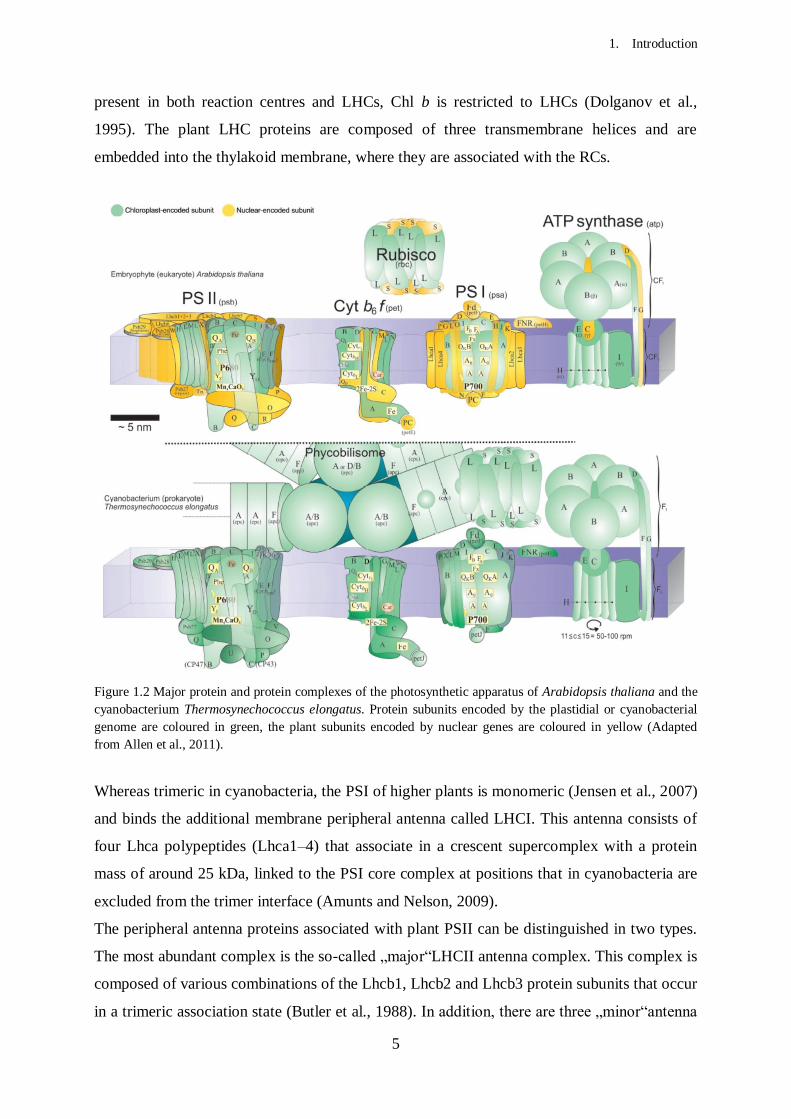
present in both reaction centres and LHCs, Chl b is restricted to LHCs (Dolganov et al.,
1995). The plant LHC proteins are composed of three transmembrane helices and are
embedded into the thylakoid membrane, where they are associated with the RCs.
Figure 1.2 Major protein and protein complexes of the photosynthetic apparatus of Arabidopsis thaliana and the
cyanobacterium Thermosynechococcus elongatus. Protein subunits encoded by the plastidial or cyanobacterial
genome are coloured in green, the plant subunits encoded by nuclear genes are coloured in yellow (Adapted
from Allen et al., 2011).
Whereas trimeric in cyanobacteria, the PSI of higher plants is monomeric (Jensen et al., 2007)
and binds the additional membrane peripheral antenna called LHCI. This antenna consists of
four Lhca polypeptides (Lhca1–4) that associate in a crescent supercomplex with a protein
mass of around 25 kDa, linked to the PSI core complex at positions that in cyanobacteria are
excluded from the trimer interface (Amunts and Nelson, 2009).
The peripheral antenna proteins associated with plant PSII can be distinguished in two types.
The most abundant complex is the so-called „major“LHCII antenna complex. This complex is
composed of various combinations of the Lhcb1, Lhcb2 and Lhcb3 protein subunits that occur
in a trimeric association state (Butler et al., 1988). In addition, there are three „minor“antenna
1. Introduction
6
proteins, called Lhcb4 (CP29), Lhcb5 (CP26) and Lhcb6 (CP24) that normally occur in
monomeric aggregation states. The LHC antennas arose during the evolutionary divergence
from the cyanobacterial ancestor to adapt to the highly variable light conditions plants had to
face with terrestrial life. Indeed, the redistribution of the mobile LHCII pool between PSII and
PSI, called state transition, enables chloroplasts to modulate the excitation pressure on the two
photosystems, thus maintaining the optimal photochemical efficiency (Kargul et al., 2005).
The LHCII redistribution process involves phosphorylation/dephosphorylation events
(Depege et al., 2003) and a structural reorganization of the photosynthetic complexes and of
the thylakoids themselves.
Although more conserved than the antenna systems, the photosynthetic reaction centres differ
between cyanobacteria and chloroplasts in terms of their spatial distribution, stoichiometry,
supermolecular organization and subunit composition. Adjustments in the relative amounts of
the two photosystems represent another mechanism through which cyanobacteria and plants
redistribute the excitation energy along the electron transport chain (Murakami, 1997; Allen
and Pfannschmidt, 2000). PSII is the complex responsible for the photolysis of water, the
hallmark and starting point of oxygenic photosynthesis and its main physiological form in
both plants and cyanobacteria is a dimer (Holzenburg et al., 1993). The plant and bacterial
PSII complexes have a slightly different subunit composition (Hankamer et al., 2001) but an
overall similar structure (Büchel and Kühlbrandt, 2005). In both classes of organisms, the
biogenesis of PSII is a highly regulated process and the subsequent events that lead to the
assembly of the complex have been investigated in detail, as well as the integration of the
cofactors (for a review, see Nickelsen and Rengstl, 2013). Additionally, a plethora of trans-
acting PSII assembly factors are known and most of them have been conserved throughout
evolution, not surprisingly since the PSII subunits and their assembly order are highly
conserved. Those that are not conserved represent plant-specific factors that might have
evolved either as substitutes to cyanobacterial counterparts or, especially the repair factors, in
response to the new conditions of the life on land (Komenda et al., 2012). In the biogenesis of
PSII and of PSI, a further regulatory level derives from the plant-specific
compartmentalization inside the cell that requires the post-translational targeting of the
nuclear-encoded subunits to the chloroplast and the concerted biosynthesis and integration of
the cofactors, as well as the coordinated expression of the nuclear and the chloroplast genes.
Whereas the molecular details of PSII structure and physiology have been studied and
dissected extensively, the biogenesis and assembly of PSI are still poorly understood in higher
1. Introduction
7
plants, particularly because of the difficulties in identifying the assembly intermediates and
because of the lethality caused by PSI depletion.
1.3. Evolution of PSI
Photosystem I is the plastocyanin-ferredoxin oxidoreductase in the thylakoid membranes of
cyanobacteria and chloroplasts that catalyses the last step of the photosynthetic electron
transport. It is one of the most complex membrane protein complexes known in nature and its
quantum efficiency in the transfer of electrons is close to 1.0 (Nelson and Ben-Shem, 2002).
PSI has a longer half-life than PSII (Yao et al., 2011) and is less susceptible to photodamage,
because PSI-catalyzed reactions do not occur at extremely oxidizing redox potentials (Powles,
1984). Because of these characteristics, PSI is studied by many groups from different
disciplines, with a focus on energy utilization and the design of photosensors (Carmeli et al.,
2007; Terasaki et al., 2007). Probably for the same reason, it is highly conserved along the
green lineage, although some key modifications arose in the PSI of land plants to adapt to
different ecological niches.
Eukaryotic PSI structurally consists of two membrane complexes: the reaction centre (RC),
composed of 15 subunits, and the LHCI antenna system, composed of 4 subunits (Amunts et
al., 2007). The currently known PSI-LHCI supercomplex therefore consists of a total of 19
protein subunits and approximately 200 cofactors, non-covalently bound to the core complex
and to the antennas (Jensen et al., 2007). The plant PSI-LHCI supercomplex is much larger
than the cyanobacterial PSI that lacks the surrounding antenna proteins and is composed of 12
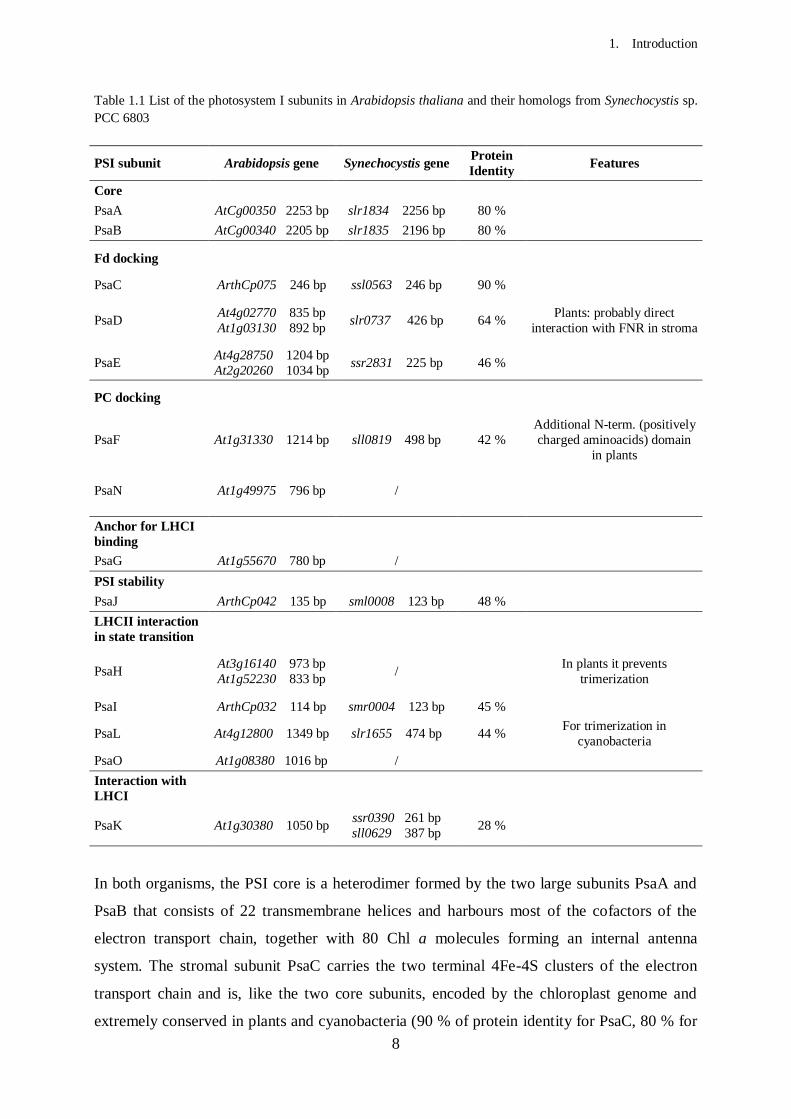
subunits and 127 associated cofactors (Jordan et al., 2001). The protein components of the PSI
core complexes from Arabidopsis thaliana, together with their homologs in Synechocystis sp.
PCC 6803, are listed in Table 1.1. The cyanobacterial PsaM and PsaX subunits are not
conserved in higher plants in which, in return, the four additional subunits PsaG, PsaH, PsaN
and PsaO evolved.
Of the 15 genes encoding the subunits of the higher plant PSI reaction centre, only 4
(encoding PsaA, PsaB, PsaC and PsaJ) are located in the chloroplast genome, while the other
11 are scattered throughout the nuclear chromosomes (Table 1.1). The nuclear genes encode
for proteins translated in the cytoplasm and subsequently imported in the chloroplast (Soll and
Schleiff, 2004) to be assembled with the cofactors and the plastid-encoded proteins.
Therefore, additional steps of regulation are needed, with respect to cyanobacteria, for the
biogenesis of a functional PSI.
1. Introduction
8
Table 1.1 List of the photosystem I subunits in Arabidopsis thaliana and their homologs from Synechocystis sp.
PCC 6803
PSI subunit Arabidopsis gene Synechocystis gene Protein
Identity Features
Core
PsaA AtCg00350 2253 bp slr1834 2256 bp 80 %
PsaB AtCg00340 2205 bp slr1835 2196 bp 80 %
Fd docking
PsaC ArthCp075 246 bp ssl0563 246 bp 90 %
PsaD At4g02770 835 bp
At1g03130 892 bp slr0737 426 bp 64 %
Plants: probably direct
interaction with FNR in stroma
PsaE At4g28750 1204 bp
At2g20260 1034 bp ssr2831 225 bp 46 %
PC docking
PsaF At1g31330 1214 bp sll0819 498 bp 42 %
Additional N-term. (positively
charged aminoacids) domain
in plants
PsaN At1g49975 796 bp /
Anchor for LHCI
binding
PsaG At1g55670 780 bp /
PSI stability
PsaJ ArthCp042 135 bp sml0008 123 bp 48 %
LHCII interaction
in state transition
PsaH At3g16140 973 bp
At1g52230 833 bp /
In plants it prevents
trimerization
PsaI ArthCp032 114 bp smr0004 123 bp 45 %
PsaL At4g12800 1349 bp slr1655 474 bp 44 % For trimerization in
cyanobacteria
PsaO At1g08380 1016 bp /
Interaction with
LHCI
PsaK At1g30380 1050 bp ssr0390 261 bp
sll0629 387 bp 28 %
In both organisms, the PSI core is a heterodimer formed by the two large subunits PsaA and
PsaB that consists of 22 transmembrane helices and harbours most of the cofactors of the
electron transport chain, together with 80 Chl a molecules forming an internal antenna
system. The stromal subunit PsaC carries the two terminal 4Fe-4S clusters of the electron
transport chain and is, like the two core subunits, encoded by the chloroplast genome and
extremely conserved in plants and cyanobacteria (90 % of protein identity for PsaC, 80 % for
1. Introduction
9
PsaA and PsaB). The assembly of the core dimer starts with the co-translational insertion in
the thylakoid membrane of PsaA and PsaB. This reaction centre (165 kDa) constitutes almost
half of the molecular mass of the PSI complex (390 kDa) and forms the docking site for the
subsequent assembly of the peripheral subunits PsaC, PsaD and PsaE. In the stroma, these
three subunits form the docking site for the final electron acceptor ferredoxin, the reduction of
which seems to have been optimized in plants with respect to cyanobacteria (Hanley et al.,
1996; Fischer et al., 1998). Moreover, the plant ferredoxin:NDP+ oxidoreductase (FNR)
seems to accept electrons from ferredoxin by directly interacting with PSI, whereas this direct
interaction has never been detected in cyanobacteria (Vallejos et al., 1984; Andersen et al.,
1992). The site of interaction of the electron donor plastocyanin on the lumenal side of PSI
was also refined by evolution (Hippler et al., 1996), with the introduction of an extension in
the lumenal N-terminus of the plant PsaF subunit. PsaF is an integral membrane protein and
its exposed lumenal region contains the positively charged patch responsible for plastocyanin
interaction (Hippler et al., 1998). The order and modality with which the other subunits are
assembled into the plant PSI complex is still unclear (Ozawa et al., 2010), because their small
sizes make it difficult to resolve assembly intermediates by mass-based separation techniques.
Identification of auxiliary proteins involved in PSI biogenesis is also problematic and, to date,
only a limited number of regulatory factors specifically involved in PSI assembly have been
identified, as reviewed in Schöttler et al. (2011) and Chi et al. (2012). Although these factors
are generally conserved in chloroplasts and cyanobacteria, the functions of some of them
evolved together with eukaryotic photosynthesis. The plastid-encoded proteins YCF3
(Schwabe and Kruip, 2000; Naver et al., 2001) and YCF4 (Wilde et al., 1995; Krech et al.,
2012) are highly conserved in cyanobacteria and, in both organisms, they have been proposed
to function as molecular chaperones during the formation of the PSI complex. In chloroplasts,
lack of these proteins causes a complete loss of PSI (Boudreau et al., 1997; Ruf et al., 1997),
while PSI amount are only reduced in Synechocystis ycf4 mutants (Wilde et al., 1995). Two
additional factors involved in the assembly of the plant PSI subunits are the nuclear-encoded
proteins Y3IP1 (Albus et al., 2010), not characterized in cyanobacteria, and Pyg7-1 (Stöckel
et al., 2006), that is essential for PSI accumulation in plants, in contrast to the cyanobacterial
homolog Ycf37 that has only an accessory function in PSI biogenesis (Wilde et al., 2001).
Additional plant nuclear-encoded proteins that are required for the assembly of PSI cofactors
have been identified. Among these, Hcf101 is involved in the association of the 4Fe-4S
clusters with the PSI apoproteins (Lezhneva et al., 2004), while in mutants lacking the Apo1
protein all the chloroplast iron-sulphur proteins are strongly affected (Amann et al., 2004).
1. Introduction
10
The PSI of higher plants occurs as a monomer surrounded by the LHCI antennas at the
PsaF/PsaG side (Amunts et al., 2007), whereas in cyanobacteria no antenna system is present
and the PSI reaction centres are organized in trimeric supercomplexes (Jordan et al., 2001).
PsaL is responsible for trimerization in cyanobacteria, while the plant-specific PsaH protein
prevents oligomerization and it has been proposed to be important for the PSI-LHCII
interaction during state transition (Lunde et al., 2000; Kouril et al., 2005). The switch of the
mobile LHCII pool between the two photosystems serves to balance their respective
excitations and it can be considered as a vital adaption of plant photosynthesis to the
fluctuating light conditions of their environment (Kargul and Barber, 2008). The trimeric state
of cyanobacterial PSI can be seen, on the opposite, as a way to optimize harvesting of the dim
light in aqueous environments by providing a larger intrinsic antenna system (Amunts and
Nelson, 2009). Besides adaptive differences with respect to the prokaryotic ancestor, the plant
PSI displays an extreme conservation of all the cofactors of the electron transport chain and of
the protein structures they are associated with.
During the Linear Electron Flow (LEF, see Figure 1.1), PSI acts downstream of PSII in
transferring electrons from water molecules to the terminal acceptor NADP+, with the final
overall production of NADPH and ATP. For effective photosynthesis, though, the Cyclic
Electron Flow (CEF, for reviews see Shikanai, 2007; Joliot and Johnson, 2011) pathway is
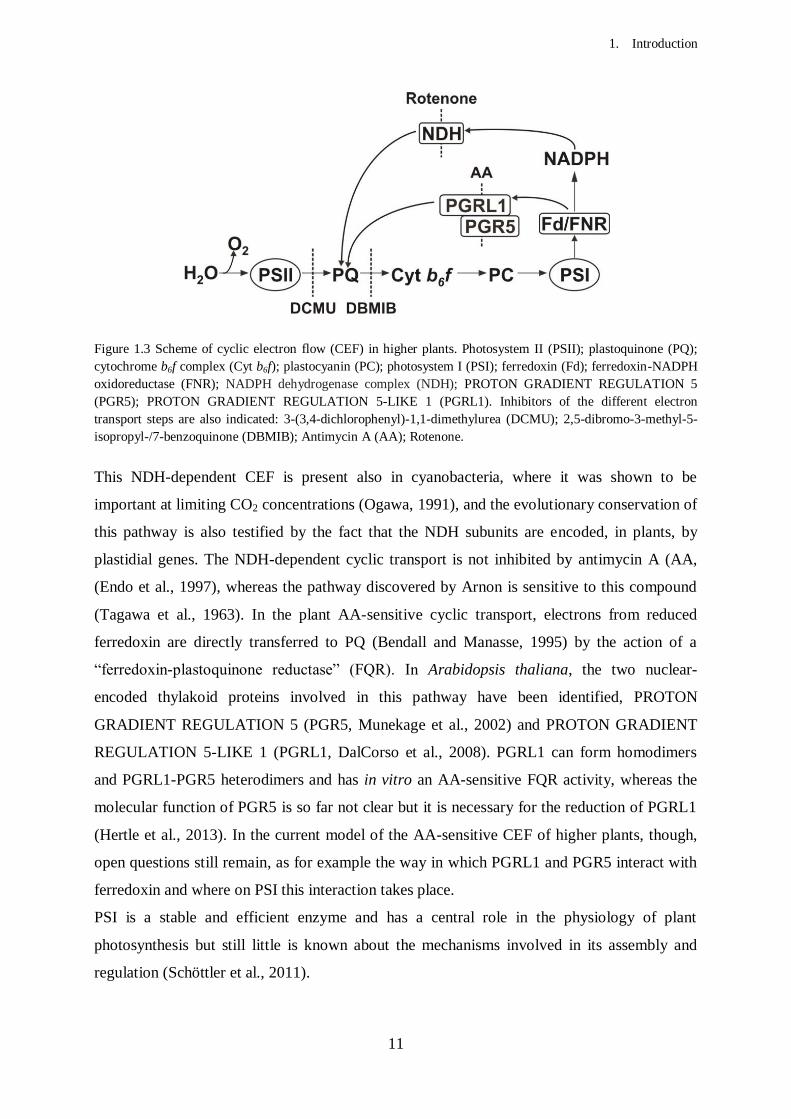
also required and this solely depends on the PSI photochemical reactions. In CEF (Figure 1.3)
electrons are recycled from the photoreduced ferredoxin to the PQ pool and, through Cyt b6f,
back to PSI. During this process no net reducing power is produced, but the Q-cycle still
generates the proton motive force to drive the synthesis of ATP. The electron transport in
thylakoids is therefore subjected to a photosynthetic control (Foyer et al., 2012) that balances
the ratios of produced reductants and ATP, in order to meet the metabolic needs of the cell.
Another important role of CEF is to induce the acidification of the lumen necessary to
regulate the quenching of high energy states in fluctuating light conditions (Niyogi et al.,
2005). Two partially redundant pathways of cyclic electron flow around PSI are present in
higher plants, the one discovered by Arnon and co-workers (Arnon et al., 1954) and a second
one that depends on the chloroplast NAD(P)H dehydrogenase complex (NDH, Burrows et al.,
1998).
1. Introduction
11
Figure 1.3 Scheme of cyclic electron flow (CEF) in higher plants. Photosystem II (PSII); plastoquinone (PQ);
cytochrome b6f complex (Cyt b6f); plastocyanin (PC); photosystem I (PSI); ferredoxin (Fd); ferredoxin-NADPH
oxidoreductase (FNR); NADPH dehydrogenase complex (NDH); PROTON GRADIENT REGULATION 5
(PGR5); PROTON GRADIENT REGULATION 5-LIKE 1 (PGRL1). Inhibitors of the different electron
transport steps are also indicated: 3-(3,4-dichlorophenyl)-1,1-dimethylurea (DCMU); 2,5-dibromo-3-methyl-5-
isopropyl-/7-benzoquinone (DBMIB); Antimycin A (AA); Rotenone.
This NDH-dependent CEF is present also in cyanobacteria, where it was shown to be
important at limiting CO2 concentrations (Ogawa, 1991), and the evolutionary conservation of
this pathway is also testified by the fact that the NDH subunits are encoded, in plants, by
plastidial genes. The NDH-dependent cyclic transport is not inhibited by antimycin A (AA,
(Endo et al., 1997), whereas the pathway discovered by Arnon is sensitive to this compound
(Tagawa et al., 1963). In the plant AA-sensitive cyclic transport, electrons from reduced
ferredoxin are directly transferred to PQ (Bendall and Manasse, 1995) by the action of a
“ferredoxin-plastoquinone reductase” (FQR). In Arabidopsis thaliana, the two nuclear-
encoded thylakoid proteins involved in this pathway have been identified, PROTON
GRADIENT REGULATION 5 (PGR5, Munekage et al., 2002) and PROTON GRADIENT
REGULATION 5-LIKE 1 (PGRL1, DalCorso et al., 2008). PGRL1 can form homodimers
and PGRL1-PGR5 heterodimers and has in vitro an AA-sensitive FQR activity, whereas the
molecular function of PGR5 is so far not clear but it is necessary for the reduction of PGRL1
(Hertle et al., 2013). In the current model of the AA-sensitive CEF of higher plants, though,
open questions still remain, as for example the way in which PGRL1 and PGR5 interact with
ferredoxin and where on PSI this interaction takes place.
PSI is a stable and efficient enzyme and has a central role in the physiology of plant
photosynthesis but still little is known about the mechanisms involved in its assembly and
regulation (Schöttler et al., 2011).
1. Introduction
12
1.4. Evolution of the membrane architecture
Cyanobacteria are Gram-negative eubacteria and have a cell envelope composed of an outer
and a plasma membrane that surround a peptidoglycan layer and the cytoplasmic aqueous
compartment. Embedded in the cytosol they have a distinct intracellular system of
membranes, the thylakoids, where the light-dependent reactions of photosynthesis take place.
In most cases, cyanobacterial thylakoids form flattened layers of lipid-bilayer membranes
organized in stacks that encircle the cell and cover much of the cytoplasmic space (for a
review, see Murat et al., 2012). The number and spacing of the layers in a single stack are
species-specific but, in general, they seem not to be fused to the plasma membrane, even if
this is still under debate (Liberton et al., 2006). In Synechocystis sp. PCC 6803, a well-studied
unicellular cyanobacterium, the three to eight thylakoid layers of a single stack converge to
sites close to the plasma membranes that have been proposed to connect the two membrane
systems in a dynamic way (Nickelsen et al., 2010). Indeed, cyanobacterial thylakoids form a
complex network that includes perforations and internal membrane bridges between the layers
and large vescicles often close or fused to them. The highly networked structure of
cyanobacterial thylakoids ensures communication and flow of cellular components in between
the layer stacks (Nevo et al., 2007).
Chloroplasts of land plants are enclosed by a system of two membranes, the outer and inner
envelope, that derive from the plasma and outer membranes of the progenitor prokaryote and
delimit an aqueous matrix called stroma. The thylakoid membranes, embedded in the stroma,
house the photosynthetic protein complexes as in the case on cyanobacteria but they show
striking differences in architecture. Chloroplasts thylakoids form grana, cylindrical stacks of
300 to 600 nm in diameter composed of a number of membrane layer that varies from 5 to 20,
approximately (Mustárdy and Garab, 2003; Mullineaux, 2005). Each granum consists of
superimposed discs connected to each other in a central core of appressed membranes, with
the two discs at the top and bottom of the structure having one face exposed to the stroma.
The margins of a single disc are highly curved and constitute the merging point of two
neighbouring grana membranes at their periphery. The distinct grana stacks of a single
chloroplast are interconnected by the stroma lamellae, membrane pairs of few micrometers in
length that depart from the grana cylinder and are exposed to the stroma at their external
surfaces. The grana stacks and stroma lamellae within one chloroplast form a single
continuous network of thylakoid membranes that delimit a single internal aqueous phase, the
lumen (Shimoni et al., 2005). This thylakoid network therefore shows a complex architecture

1. Introduction
13
whose precise topography is still debated (Allen and Forsberg, 2001; Shimoni et al., 2005;
Mustárdy et al., 2008; Daum and Kühlbrandt, 2011).
Despite the remarkable differences in their architecture, both the bacterial and the plant
photosynthetic membranes exhibit similar features, such as bifurcation, bending and folding,
that once again demonstrate their tight evolutionary link. Although the mechanism underneath
the curvature of thylakoids is not yet known, a protein family has recently been shown to
control bending of the photosynthetic membranes and grana formation in Arabidopsis
thaliana (Armbruster et al., 2013). The family of proteins named CURVATURE
THYLAKOID 1 (CURT1) is composed of four members (CURT1A, B, C and D) that are
specifically located to the grana margins of Arabidopsis thylakoids. They are integral
membranes proteins spanning the thylakoid membranes with two transmembrane helices, with
their N- and C-termini facing the stroma. They form oligomers, either homo- or hetero-
complexes, and their levels within the chloroplast strongly determine the thylakoid
architecture. Indeed, in mutant plants lacking the major CURT1 isoform, CURT1A, alone or
in combination with the depletion also of the other family members, transmission electron
microscopy (TEM) analysis revealed marked aterations of the thylakoid structure. The mutant
thylakoids formed disorganized stretches of unstacked membranes and grana stacks much
broader and formed by fewer layers than in wild type chloroplasts. In the multiple mutants
further modifications involved the presence of curved instead of flat membrane layers as well
as of vescicular structures. On the contrary, Arabidopsis mutants overexpressing CURT1A
have chloroplasts containing grana stacks that are slimmer and reduced in diameter but higher
and more abundant than in the wild type, thus confirming the correlation between the CURT1
protein levels and the architecture of the thylakoid membranes. The negative correlation
between grana diameter and height is related to the fact that only a fixed proportion of the
thylakoid membrane is incorporated in the grana stacks (Albertsson and Andreasson, 2004).
The intrinsic ability of the CURT1 proteins to bend membranes was also confirmed by in
vitro studies, using liposomes with thylakoid-like lipid composition.
In the absence of CURT1 proteins, pleiotropic effects on the photosynthesis were observed.
Indeed, the photosynthetic electron flow resulted to be impaired, especially at high light
intensities, and the chloroplast ability of reversibly re-distributing excitation between the two
photosystems was also reduced. These effects on photosynthesis can be attributed to the fact
that plants adopted several mechanisms to adapt to varying light conditions and that one of
them is to modulate in a dynamic manner the degree of thylakoid stacking within their
chloroplasts. Indeed, plants adapted to shade and low-light conditions display grana composed
1. Introduction
14
of many more layers of thylakoid membranes than those that prefer bright sunlight
(Andersson, 1986).
The photosynthetic membrane topology of land plants reveals a further evolutionary adaption,
with respect to the cyanobacterial counterpart, that depends on a non-homogeneous
distribution of the photosystems which are, instead, spatially separated. There is no evidence
for an extensive domain organization in cyanobacterial thylakoid membranes, except for row-
like associations of PSII dimers (Folea et al., 2008), while in higher plant thylakoids PSI and
PSII are spatially separated in order to optimize the photosynthetic efficiency. This spatial
separation, called „lateral heterogeneity“ (Andersson, 1986), is just one of the mechanisms
with which plants adapt to changing light conditions. PSII and its main antenna proteins,
LHCII, are mainly located in grana thylakoids that are, on the opposite, deficient in PSI and
LHCI, which are instead predominantly confined to the stroma membranes. This lateral
heterogeneity prevents the unregulated transfer of excitation energy between the two pigment
systems: electron flow through PSI is much faster than the one through PSII, given the higher
quantum efficiency of the first, and therefore spatial separation can help to balance the energy
distribution in order to optimize the photosynthetic efficiency (Mustárdy and Garab, 2003).
The structure of the thylakoid grana is flexible and the degree of stacking is regulated by the
phosphorylation of the LHCII and other phosphoproteins (Fristedt et al., 2009) as well as by
the amount of CURT1 proteins (Armbruster et al., 2013). Modifications of the grana structure,
in turn, facilitate the mobility of the antenna complexes during state transitions and the switch
between linear and cyclic electron flow. Therefore, grana appear to be evolved by higher
plants to enhance light harvesting in fluctuating light conditions (Trissl and Wilhelm, 1993;
Mustárdy and Garab, 2003; Dekker and Boekema, 2005; Mullineaux, 2005; Daum and
Kühlbrandt, 2011).
1.5. Limitations of plant photosynthesis research
Higher plant photosynthesis exhibits an increased complexity with respect to the ancestral
counterpart represented by cyanobacteria, despite the conservation of the basic structures and
physiology. Many assembly and regulatory mechanisms that specifically evolved in
eukaryotic photosynthesis still have to be identified or clarified. Moreover, besides playing
the central role in the energy metabolism of plants, the photosynthetic process has been
recently shown to be closely related to a variety of other physiological processes that go
beyond the chloroplast and influence the physiology of the whole cell, like control of the
redox-state (Buchanan and Balmer, 2005), the generation of regulatory reacting oxygen
1. Introduction
15
species (Wagner et al., 2004) and the regulation of the cell cycle (Fukushima et al., 2009).
Despite its central role in plant biology, photosynthesis research has been so far challenged by
several limiting aspects that are either due to technical shortcomings or are intrinsic to the
model species used. Plants are multicellular eukaryotic organisms with specialized organs and
a complex physiology and a life-span varying from few weeks to centuries. Arabidopsis
thaliana is one of the most used model plants for the study of photosynthesis, because of the
ease to manipulate it and its relatively short life cycle (about six weeks). Analysis of the
function of photosynthesis-related nuclear genes in Arabidopsis traditionally relies on the
screening of mutants’ sets deriving from chemical mutagenesis (EMS, Maple and Møller,
2007) or by the Agrobacterium-mediated T-DNA insertion into the genome (Krysan et al.,
1999), which can also be used to introduce exogenous sequences into the plant. Both
techniques, though, generate mutation in random loci and do not allow targeted mutagenesis
because plants usually do not undergo homologous recombination in the nuclear genome. In
addition to this, segregation of the generated mutations and screening for the desired
phenotype - supposing to have suitable selection conditions - requires quite long time periods
and a considerable amount of work. To generate mutants for multiple genes, classical plant
crossing techniques have to be employed, together with the subsequent segregation and
screening phases. Targeted manipulation is possible in the case of chloroplast genes, because
the organellar genetic machinery is prokaryote-like and homologous recombination is
therefore taking place. Generation of transplastomic plants is normally done by transforming
plastids via particle bombardment of embryos or young plant cells and leads to the integration
of the desired DNA into the homologous sequence of the plastidial genome (Gan, 1989).
Integration of the exogenous DNA into the target genome can be selected using selectable
markers, therefore reducing the screening process (Day and Goldschmidt-Clermont, 2011)
and techniques to remove the marker after isolation of the desired mutants have also been
developed (Klaus et al., 2004; Day and Goldschmidt-Clermont, 2011). Besides the presented
advantages, this technique has so far been limited to a few specied, mostly tobacco in the case
of photosynthesis research, and is restricted to the few genes still retained by the plastidial
genome.
Irrespectively of the genomic compartment where a photosynthesis-related gene is located,
studying its function presents an additional level of complexity represented by the fact that a
gene mutation quite often results in pleiotropic effects, thus rendering it difficult to identify
the primary function of the gene product. Moreover, the quest for new photosynthesis-related
candidates is currently based on forward genetics approaches, done by screening sets of
1. Introduction
16
randomly mutated plants for a photosynthetic phenotype. Although successfully used to
identify many new players in the photosynthetic process, this approach is limited by the
viability of the gene mutations and, on the opposite, by the lack of phenotype in the case of
genetic redundancy. Moreover, setting up the appropriate screening procedure for a certain
biological process can be often challenging. The increasing number of sequenced genomes
recently led to new screenings based on a bioinformatics approach, as in the case of the
GreenCut project (Grossman et al., 2010). Although very promising, these methods could still
be biased by the limited information and limited understanding they are based on.
1.6. Designing a cyanobacterial platform to study higher plant photosynthesis
Cyanobacteria are the evolutionary ancestors of higher plant chloroplasts and, as such, they
harbour a complete photosynthetic apparatus, but they lack all those protein functions and
adaptive mechanisms that evolved in the eukaryotic photosynthetic organisms and are
therefore plant-specific. Being prokaryotes, they present some advantages with respect to
plants. First of all, they contain a single genomic unit in varying number of copies per cell;
therefore, there is no need for the co-regulation of genes encoded by two different genomes,
like in plants. Cyanobacteria have a shorter life cycle than plants and, being unicellular, a
physiology with less levels of complexity. When working with cyanobacteria, an enormous
advantage derives from their ability to undergo homologous DNA recombination, which
makes it possible to perform targeted gene and genome manipulations. When considering the
cyanobacterial qualities in the perspective of research on higher plant photosynthesis, these
organisms appear to be potential tools to investigate the function of plant photosynthetic
proteins. Indeed, the function of a plant-specific protein expressed in cyanobacteria could be
studied in a simpler physiological environment and in the absence of other eukaryotic
regulatory components that, if necessary for the function, could be subsequently added.
Moreover, it could be possible to replace the photosynthetic machinery of cyanobacteria with
the one from higher plants via targeted genomic manipulation in order to identify all the
components required for its correct functioning. To this end, libraries of plant transcripts
could be used to fish new photosynthesis-related genes by complementing cyanobacterial
chimeras containing the plant-type minimal photosynthetic machinery.
1.7. Synechocystis as a model organism
One of the most used genetic models for higher plant photosynthesis is Arabidopsis thaliana.
To generate the proposed cyanobacterial platform, the cyanobacterium Synechocystis sp. PCC
1. Introduction
17
6803 (in the following designated Synechocystis) is the organism of choice. Synechocystis is
an excellent cyanobacterial model organism, because it is unicellular and, not forming
filamentous structures, it does not fix nitrogen. It has a small, sequenced genome (3.6 Mb)
(Kaneko et al., 1996), is able to take up spontaneously exogenous DNA and to integrate it via
homologous recombination into the genome. In addition, a spontaneous glucose-tolerant
mutant strain is available (Williams, 1988) which can grow heterotrophically in the presence
of sugar even in complete darkness (Anderson and McIntosh, 1991), thus making it a
convenient organism to study oxygenic photosynthesis. Photosynthetic Synechocystis mutants
have been extensively used to study PSI (Dühring et al., 2007; Xu et al., 2011) and PSII
(Vermaas et al., 1986; Vermaas et al., 1987) and also to investigate the functionality of
photosynthesis-related proteins from higher plants in cyanobacteria (Nixon et al., 1991; He et
al., 1999). All these studies relied on the employment of gene deletions or replacements.
The classical strategy to delete a target gene or to insert exogenous genetic material into the
Synechocystis genome via homologous recombination involves the use of a resistance marker
(Labarre et al., 1989; Vermaas, 1996). In this approach, the marker, exogenous DNA and two
homologous genomic sequences flanking the insertion cassette are cloned into a suicide
vector, which is not able to replicate itself in the host cell. After integration of the insertion
cassette into the host genome, the resistance-mediating marker allows positive selection of
those mutant organisms, in which the integration has occurred. However, to perform
additional genomic modifications, the use of different resistance markers is necessary.
Consequently, the number of available markers restricts the number of genetic manipulations.
To overcome this limitation, so called marker-less strategies have been developed, allowing
the removal of the integrated marker. The first marker-less method was established in Gram-
negative bacteria using the nptI-sacB double selection cassette (Ried and Collmer, 1987): the
nptI gene confers resistance to the antibiotic kanamycin, while the sacB gene from Bacillus
subtilis (Fouet et al., 1984; Steinmetz et al., 1985) is conditionally lethal for Gram-negative
bacteria when grown in the presence of 5 % sucrose. It encodes the enzyme levansucrase that
hydrolyzes sucrose leading to the final production of levans (Gay et al., 1983) polymers that
are lethal for Gram-negative bacteria. Thus, cells harbouring the sacB gene die when grown in
presence of 5 % sucrose, although the underlying mechanism is not fully understood. In
cyanobacteria, the nptI-sacB cartridge was first used to establish marker-less gene
replacement in Anabaena sp. PCC 7120 (Cai and Wolk, 1990).
1. Introduction
18
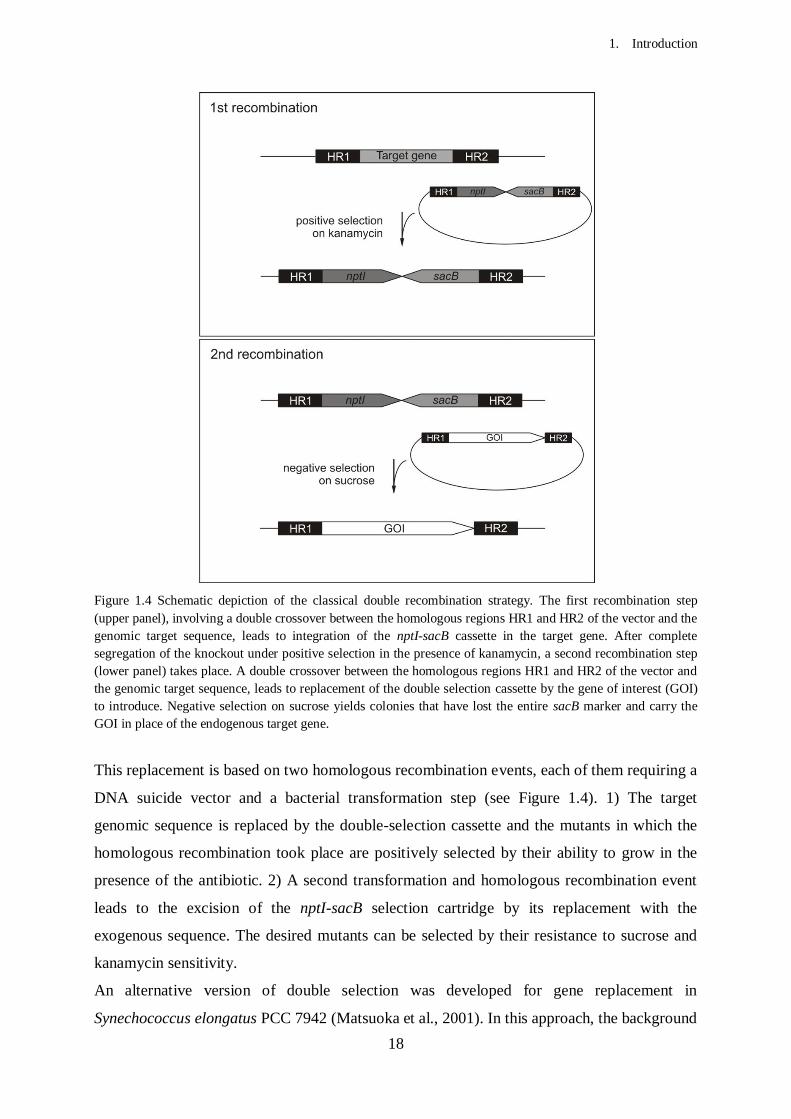
Figure 1.4 Schematic depiction of the classical double recombination strategy. The first recombination step
(upper panel), involving a double crossover between the homologous regions HR1 and HR2 of the vector and the
genomic target sequence, leads to integration of the nptI-sacB cassette in the target gene. After complete
segregation of the knockout under positive selection in the presence of kanamycin, a second recombination step
(lower panel) takes place. A double crossover between the homologous regions HR1 and HR2 of the vector and
the genomic target sequence, leads to replacement of the double selection cassette by the gene of interest (GOI)
to introduce. Negative selection on sucrose yields colonies that have lost the entire sacB marker and carry the
GOI in place of the endogenous target gene.
This replacement is based on two homologous recombination events, each of them requiring a
DNA suicide vector and a bacterial transformation step (see Figure 1.4). 1) The target
genomic sequence is replaced by the double-selection cassette and the mutants in which the
homologous recombination took place are positively selected by their ability to grow in the
presence of the antibiotic. 2) A second transformation and homologous recombination event
leads to the excision of the nptI-sacB selection cartridge by its replacement with the
exogenous sequence. The desired mutants can be selected by their resistance to sucrose and
kanamycin sensitivity.
An alternative version of double selection was developed for gene replacement in
Synechococcus elongatus PCC 7942 (Matsuoka et al., 2001). In this approach, the background
1. Introduction
19
strain carries a mutated form of the rps12 gene (which encodes for the 30S ribosomal subunit
S12) conferring resistance to spectinomycin (Funatsu and Wittmann, 1972; Timms et al.,
1992). Since the mutation is recessive, the double selection cassette is composed of the
kanamycin resistance gene and - as an alternative negative selection marker - of an rps12 wild
type copy, which confers a dominant spectinomycin-sensitive phenotype. Limiting aspects of
the rps12 marker system are the availability of spectinomycin-resistant mutants in other
cyanobacterial species and the need to perform all multiple replacements in the rps12 mutant
background.
1.8. Aim of the work
The goal of the presented project was the establishment of a cyanobacterial platform to study
novel photosynthesis-related protein functions from higher plants. As a starting point, the PSI
core subunits from Synechocystis were replaced with the Arabidopsis homologs.
In a second approach, the effects of the Arabidopsis CURT1A protein on the structure of the
Synechocystis thylakoids were tested by expressing it in addition to, or in replacement of, the
cyanobacterial homolog.
In order to facilitate further extensive manipulations of the Synechocystis genome, an
alternative marker-less gene replacement strategy was developed which relies on the use of a
single plasmid vector and a single transformation step in order to obtain both knockout and
replacement bacterial strains. The developed strategy was used to test the function of the
Arabidopsis PGRL1 and PGR5 proteins in Synechocystis and to replace the cyanobacterial
PSI PsaA core subunit with the plant homolog.
2. Materials and Methods
20
2. MATERIALS AND METHODS
2.1. Chemicals, enzymes and radioactive substances
Standard chemicals were purchased from Roth (Karlsruhe, Germany), Duchefa (Haarlen,
Netherlands), Applichem (Darmstadt, Germany), Serva (Heidelberg, German), Invitrogen
(Darmstadt, Germany) and Sigma-Aldrich (Steinheim, Germany).
Restriction enzymes were purchased from New England Biolabs (Ipswich, MA, USA) and
Fermentas (Thermo Scientific, Rockford, USA), Taq DNA polymerase from QIAgen (Venlo,
Netherlands) and Phusion High-Fidelity DNA polymerase from Fermentas.
Radiochemicals (32
P-dCTP, 35
S-Met,) were from Hartmann Analytic (Braunschweig,
Germany).
Molecular weight markers
GeneRulerTM
1 kb Plus DNA ladder (Thermo Scientific, Rockford, USA), was used as DNA
length standard.
The apparent molecular weight of proteins in SDS-polyacrylamide gel electrophoresis was
determined according to PageRuler pre-stained molecular weight marker (10 to 170 kDa)
from Pierce (Thermo Scientific).
DNA Primers
All the primers used in this study were purchased from Metabion GmbH (Martinsried,
Germany).
Antibodies
Immuno-decoration of Western blot membranes was done with the following antibodies: α-
CURT1A (Agrisera, Vännäs, Sweden); α-synCURT1 peptide (BioGenes GmbH, Berlin,
Germany), α-APC α/β, (Agrisera), α-PGRL1 (Roberto Barbato, Dipartimento di Scienze
dell'Ambiente e della Vita, Università del Piemonte Orientale, Alessandria, Italy; Paolo
Pesaresi, Dipartimento di Bioscienze, Università degli Studi di Milano, Milano, Italy), α-
PGR5 (Toshiharu Shikanai, Department of Botany, Graduate School of Science, Kyoto
University, Sakyo-ku, Kyoto, Japan).
2. Materials and Methods
21
2.2. Bacterial strains and vectors
The bacterial strains and plasmids used are described in Table 2.1. E. coli DH5α cultures were
grown in Luria Broth (LB) medium at 37 °C and shaking at 225 rpm.
Unless otherwise indicated, Synechocystis sp. PCC 6803 glucose-tolerant wild type (GT,
Himadri Pakrasi, Department of Biology, Washington University, St. Louis) and mutant
strains were grown at 30 °C in BG11 medium containing 5 mM glucose (Rippka et al., 1979),
under continuous illumination at 30 µmol photons m-2
s-1
. Liquid cultures were shaken at 120
rpm. For growth on plates, 1.5 % (w/v) agar and 0.3 % (w/v) sodium thiosulfate were added
to the BG11 medium. The PSI-defective mutant strains were grown in LAHG conditions
(Light Activated Heterotrophic Growth: darkness, unless 5 min of light per day, as described
by Anderson and McIntosh, 1991), in the presence of glucose.
For positive selection of the mutants, increasing concentrations of kanamycin (10 to 100
µg/ml) were added to the medium. For negative selection, BG11 containing 5 % (w/v) sucrose
was used.
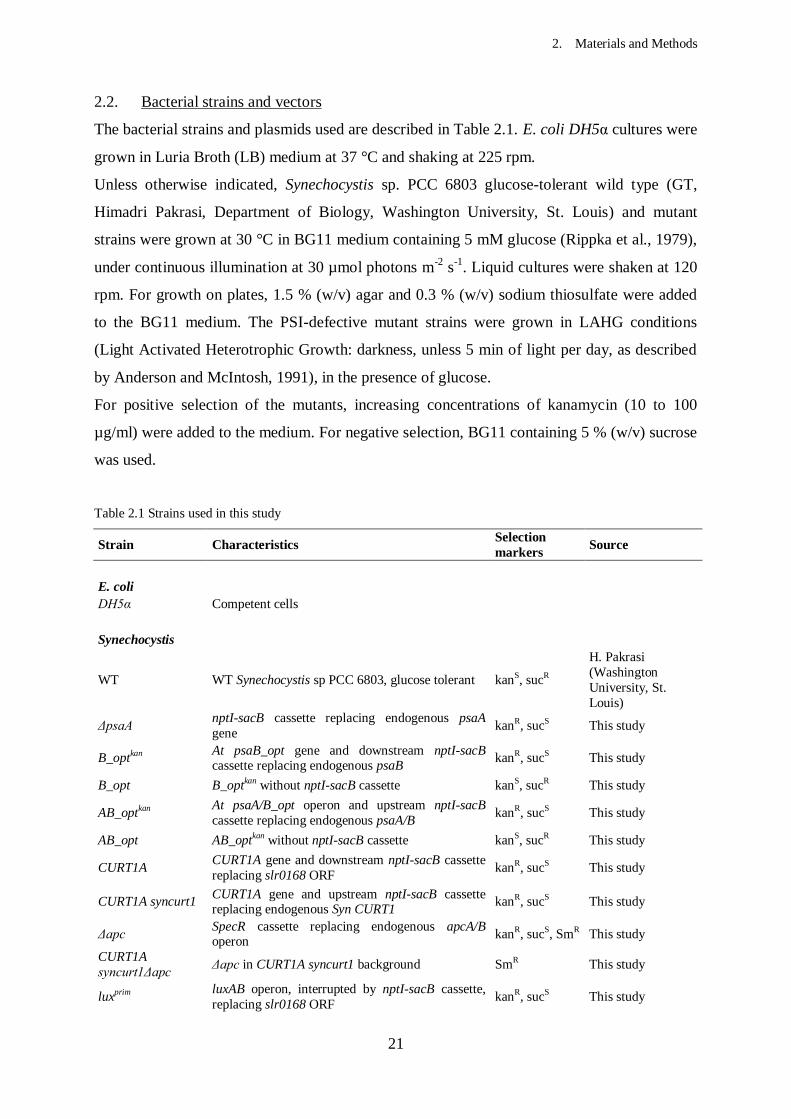
Table 2.1 Strains used in this study
Strain Characteristics Selection
markers Source
E. coli
DH5α Competent cells
Synechocystis
WT WT Synechocystis sp PCC 6803, glucose tolerant kanS, sucR
H. Pakrasi
(Washington
University, St.
Louis)
ΔpsaA nptI-sacB cassette replacing endogenous psaA
gene kanR, sucS This study
B_optkan At psaB_opt gene and downstream nptI-sacB cassette replacing endogenous psaB
kanR, sucS This study
B_opt B_optkan without nptI-sacB cassette kanS, sucR This study
AB_optkan At psaA/B_opt operon and upstream nptI-sacB
cassette replacing endogenous psaA/B kanR, sucS This study
AB_opt AB_optkan without nptI-sacB cassette kanS, sucR This study
CURT1A CURT1A gene and downstream nptI-sacB cassette
replacing slr0168 ORF kanR, sucS This study
CURT1A syncurt1 CURT1A gene and upstream nptI-sacB cassette replacing endogenous Syn CURT1
kanR, sucS This study
Δapc SpecR cassette replacing endogenous apcA/B operon
kanR, sucS, SmR This study
CURT1A
syncurt1Δapc Δapc in CURT1A syncurt1 background SmR This study
luxprim luxAB operon, interrupted by nptI-sacB cassette,
replacing slr0168 ORF kanR, sucS This study
2. Materials and Methods
22
luxsec Intact luxAB operon replacing slr0168 ORF kanS, sucR This study
PGR5 PRGL1-PGR5 synthetic operon, interrupted by
nptI-sacB cassette, replacing slr0168 ORF kanR, sucS This study
PGR5+PGRL1 Intact PRGL1-PGR5 synthetic operon replacing
slr0168 ORF kanS, sucR This study
psaAprim At psaA gene, interrupted by nptI-sacB cassette,
replacing endogenous psaA
kanR, sucS,
heterotroph This study
psaAsec Intact At psaA gene replacing endogenous psaA kanS, sucR,
photoautotroph This study
Table 2.2 Plasmid vectors used in this study
Plasmid Characteristics Selection
markers Source
pGEM-T Easy Backbone for pDSpsaA ampR Promega, Madison,
WI
pRL250 nptI-sacB double selection cassette, sacB gene from
Bacillus subtilis kanR, sucS
P. Wolk (Michigan
State University)
SpecR selection cassette, gene from SmR
pICH69822 Destination vector for Golden Gate cloning kanR
E. Weber (Icon
Genetics GmbH,
Halle)
pRL1063a luxAB operon from Vibrio fischeri SmR P. Wolk (Michigan
State University)
pUC57+psaA_opt Codon-optimized At psaA gene ampR GenScript
pUC57+psaB_opt Codon-optimized At psaB gene ampR GenScript
pUC57+PSI_opt Codon-optimized PSI synthetic operon ampR GenScript
pCURT1AOI
pICH69822 with Syn psbA2 promoter, CURT1A gene,
upstream nptI-sacB cassette from pRL250 and slr0168
flanking regions
kanR, sucS This study
pCURT1AO
pICH69822 with Syn psbA2 promoter, CURT1A gene,
downstream nptI-sacB cassette from pRL250 and Syn
CURT1 flanking regions
kanR, sucS This study
pSMapc pICH69822 with SpecR cassette from and andogenous
apcA/B operon flanking regions kanR, SmR This study
pDSAK1 pGEM-T Easy with nptI-sacB cassette from pRL250
and Syn psaA flanking regions kanR, sucS This study
pDSAB_opt
pICH69822 with At psaA/B_opt operon with
endogenous flanking regions and downstream nptI-sacB
cassette from pRL250
kanR, sucS This study
pAB1 pGEM-T Easy with At psaB_opt downstream region
from B_opt strain kanR This study
pDSA_opt
pICH69822 with At psaA_opt gene with flanking
regions from B_opt strain and upstream nptI-sacB
cassette from pRL250
kanR, sucS This study
pAB2 pGEM-T Easy with At psaA_opt upstream region from
AB_opt strain kanR This study
pDSlux
pICH69822 with nptI-sacB cassette from pRL250,
luxAB operon from pRL1063a and Syn psbA2 promoter
and slr0168 flanking regions
kanR, sucS This study
pDSpgrl1
pICH69822 with nptI-sacB cassette from pRL250,
Arabidopsis PGRL1 and PGR5 coding sequences, Syn
psbA2 promoter and slr0168 flanking regions
kanR, sucS This study
pDSpsaA pGEM-Teasy with nptI-sacB cassette from pRL250, At
psaA gene and Syn psaA flanking regions kan
R, suc
S This study

2. Materials and Methods
23
2.3. Generation of recombinant plasmids
All DNA techniques such as plasmid isolation, restriction and ligation were performed
according to standard protocols (Sambrook et al., 1989). Synechocystis sequences were
obtained from Cyanobase (http://genome.kazusa.or.jp/cyanobase/Synechocystis). All the
plasmids used are listed in Table 2.2. To generate all the fragments used for plasmid
constructions, sequences of interest were PCR amplified and then purified from 1 % agarose
gel with the QIAgen (Venlo, Netherlands) gel extraction kit following the producer’s
instructions.
For all vectors, except pDSAK1 and pDSpsaA, the amplified fragments were assembled into
the final construct using the one-step Golden Gate Shuffling cloning strategy (Engler et al.,
2009) and the plasmid pICH69822 as destination vector. The nptI-sacB double-selection
cassette was amplified from the pRL250 plasmid, the SpecR cassette from a pUR plasmid
backbone. The Synechocystis slr0168 ORF (Kunert et al., 2000) was used as neutral genomic
site for the stable integration of the pDSLux and pCURT1A vectors, using the upstream and
downstream genomic regions of slr0168 (~1 kb each) as flanking regions for homologous
recombination. The sequences of the Arabidopsis thaliana psaA and psaB genes with a codon
usage optimized for expression into Synechocystis sp. PCC6803 (At psaA_opt and At
psaB_opt) were purchased, cloned into the EcoRV restriction site of pUC57, from GenScript
(Hong Kong).
The pDSAK1 plasmid was constructed by standard cloning and the Synechocystis psaA gene
was chosen as insertion site, using its upstream and downstream genomic regions (~500 bp
each) as flanking regions for homologous recombination. To generate the vector, the nptI-
sacB cassette was excised from the pRL250 plasmid with BamHI and then cloned into the
pGEM-T Easy vector (Promega, Madison, Wisconsin) according to the manufacturer’s
instructions. The Syn psaA downstream region was cloned at the 3’ of the nptI-sacB cassette
between the SpeI and SacI restriction sites, then the upstream region was inserted upstream of
the cassette between the ApaI and NcoI restriction sites. For pDSAB_opt generation, the At
psaA_opt and At psaB_opt sequences were amplified from the pUC57+psaA_opt and
pUC57+psaB_opt vectors (GenScript). The two artificial genes were then assembled into a
synthetic operon using the Synechocystis psaA upstream region (~500 bp), psaA/psaB
intergenic region (A/B IR, 245 bp) and psaB downstream region (~500 bp). The nptI-sacB
double selection cassette was placed at the 3’ of the Syn psaB downstream region and was
then followed by a second copy of the same flanking sequences. The pAB1 vector was
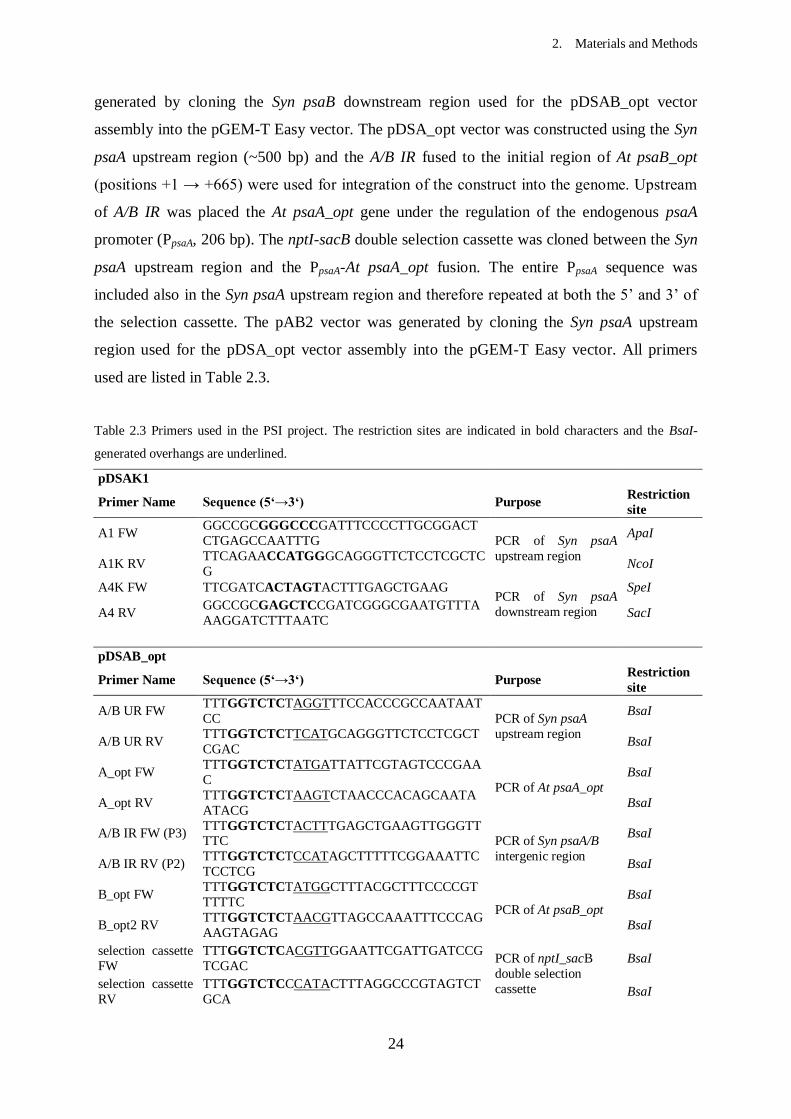
2. Materials and Methods
24
generated by cloning the Syn psaB downstream region used for the pDSAB_opt vector
assembly into the pGEM-T Easy vector. The pDSA_opt vector was constructed using the Syn
psaA upstream region (~500 bp) and the A/B IR fused to the initial region of At psaB_opt
(positions +1 → +665) were used for integration of the construct into the genome. Upstream
of A/B IR was placed the At psaA_opt gene under the regulation of the endogenous psaA
promoter (PpsaA, 206 bp). The nptI-sacB double selection cassette was cloned between the Syn
psaA upstream region and the PpsaA-At psaA_opt fusion. The entire PpsaA sequence was
included also in the Syn psaA upstream region and therefore repeated at both the 5’ and 3’ of
the selection cassette. The pAB2 vector was generated by cloning the Syn psaA upstream
region used for the pDSA_opt vector assembly into the pGEM-T Easy vector. All primers
used are listed in Table 2.3.
Table 2.3 Primers used in the PSI project. The restriction sites are indicated in bold characters and the BsaI-
generated overhangs are underlined.
pDSAK1
Primer Name Sequence (5‘→3‘) Purpose Restriction
site
A1 FW GGCCGCGGGCCCGATTTCCCCTTGCGGACT
CTGAGCCAATTTG PCR of Syn psaA
upstream region
ApaI
A1K RV TTCAGAACCATGGGCAGGGTTCTCCTCGCTC
G NcoI
A4K FW TTCGATCACTAGTACTTTGAGCTGAAG PCR of Syn psaA
downstream region
SpeI
A4 RV GGCCGCGAGCTCCGATCGGGCGAATGTTTA
AAGGATCTTTAATC SacI
pDSAB_opt
Primer Name Sequence (5‘→3‘) Purpose Restriction
site
A/B UR FW TTTGGTCTCTAGGTTTCCACCCGCCAATAAT
CC PCR of Syn psaA
upstream region
BsaI
A/B UR RV TTTGGTCTCTTCATGCAGGGTTCTCCTCGCT
CGAC BsaI
A_opt FW TTTGGTCTCTATGATTATTCGTAGTCCCGAA
C PCR of At psaA_opt
BsaI
A_opt RV TTTGGTCTCTAAGTCTAACCCACAGCAATA
ATACG BsaI
A/B IR FW (P3) TTTGGTCTCTACTTTGAGCTGAAGTTGGGTTTTC PCR of Syn psaA/B
intergenic region
BsaI
A/B IR RV (P2) TTTGGTCTCTCCATAGCTTTTTCGGAAATTC
TCCTCG BsaI
B_opt FW TTTGGTCTCTATGGCTTTACGCTTTCCCCGT
TTTTC PCR of At psaB_opt
BsaI
B_opt2 RV TTTGGTCTCTAACGTTAGCCAAATTTCCCAG
AAGTAGAG BsaI
selection cassette
FW
TTTGGTCTCACGTTGGAATTCGATTGATCCG
TCGAC PCR of nptI_sacB
double selection
cassette
BsaI
selection cassette
RV
TTTGGTCTCCCATACTTTAGGCCCGTAGTCT
GCA BsaI
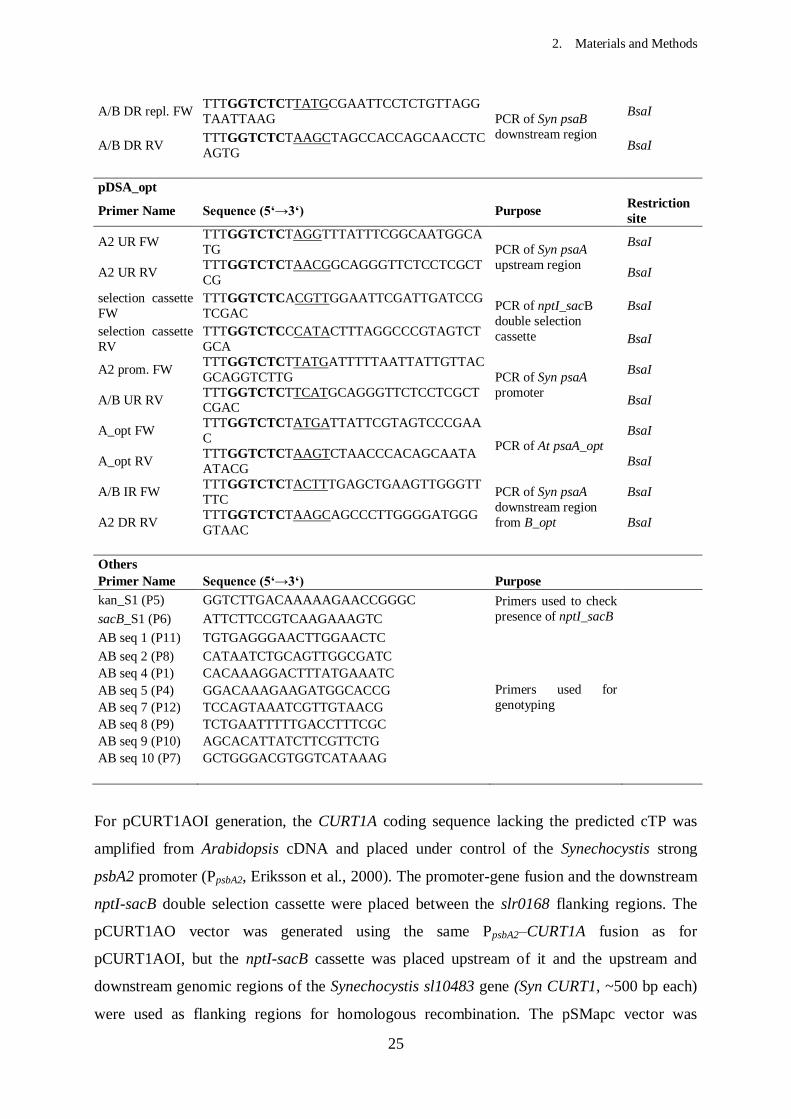
2. Materials and Methods
25
A/B DR repl. FW TTTGGTCTCTTATGCGAATTCCTCTGTTAGG
TAATTAAG PCR of Syn psaB
downstream region
BsaI
A/B DR RV TTTGGTCTCTAAGCTAGCCACCAGCAACCTC
AGTG BsaI
pDSA_opt
Primer Name Sequence (5‘→3‘) Purpose Restriction
site
A2 UR FW TTTGGTCTCTAGGTTTATTTCGGCAATGGCA
TG PCR of Syn psaA
upstream region
BsaI
A2 UR RV TTTGGTCTCTAACGGCAGGGTTCTCCTCGCT
CG BsaI
selection cassette
FW
TTTGGTCTCACGTTGGAATTCGATTGATCCG
TCGAC PCR of nptI_sacB
double selection
cassette
BsaI
selection cassette
RV
TTTGGTCTCCCATACTTTAGGCCCGTAGTCT
GCA BsaI
A2 prom. FW TTTGGTCTCTTATGATTTTTAATTATTGTTAC
GCAGGTCTTG PCR of Syn psaA
promoter
BsaI
A/B UR RV TTTGGTCTCTTCATGCAGGGTTCTCCTCGCTCGAC
BsaI
A_opt FW TTTGGTCTCTATGATTATTCGTAGTCCCGAA
C PCR of At psaA_opt
BsaI
A_opt RV TTTGGTCTCTAAGTCTAACCCACAGCAATA
ATACG BsaI
A/B IR FW TTTGGTCTCTACTTTGAGCTGAAGTTGGGTT
TTC PCR of Syn psaA
downstream region
from B_opt
BsaI
A2 DR RV TTTGGTCTCTAAGCAGCCCTTGGGGATGGG
GTAAC BsaI
Others
Primer Name Sequence (5‘→3‘) Purpose
kan_S1 (P5) GGTCTTGACAAAAAGAACCGGGC Primers used to check
presence of nptI_sacB
sacB_S1 (P6) ATTCTTCCGTCAAGAAAGTC
AB seq 1 (P11) TGTGAGGGAACTTGGAACTC
Primers used for
genotyping
AB seq 2 (P8) CATAATCTGCAGTTGGCGATC
AB seq 4 (P1) CACAAAGGACTTTATGAAATC
AB seq 5 (P4) GGACAAAGAAGATGGCACCG
AB seq 7 (P12) TCCAGTAAATCGTTGTAACG
AB seq 8 (P9) TCTGAATTTTTGACCTTTCGC
AB seq 9 (P10) AGCACATTATCTTCGTTCTG
AB seq 10 (P7) GCTGGGACGTGGTCATAAAG
For pCURT1AOI generation, the CURT1A coding sequence lacking the predicted cTP was
amplified from Arabidopsis cDNA and placed under control of the Synechocystis strong
psbA2 promoter (PpsbA2, Eriksson et al., 2000). The promoter-gene fusion and the downstream
nptI-sacB double selection cassette were placed between the slr0168 flanking regions. The
pCURT1AO vector was generated using the same PpsbA2–CURT1A fusion as for
pCURT1AOI, but the nptI-sacB cassette was placed upstream of it and the upstream and
downstream genomic regions of the Synechocystis sl10483 gene (Syn CURT1, ~500 bp each)
were used as flanking regions for homologous recombination. The pSMapc vector was
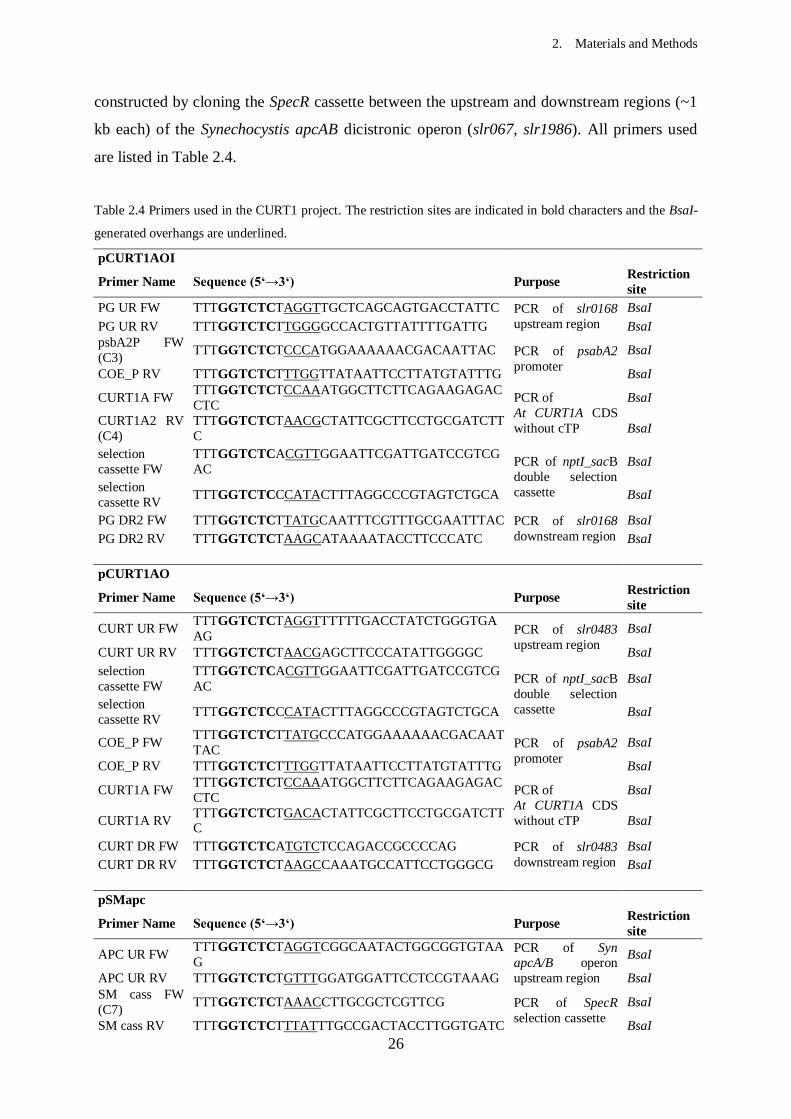
2. Materials and Methods
26
constructed by cloning the SpecR cassette between the upstream and downstream regions (~1
kb each) of the Synechocystis apcAB dicistronic operon (slr067, slr1986). All primers used
are listed in Table 2.4.
Table 2.4 Primers used in the CURT1 project. The restriction sites are indicated in bold characters and the BsaI-
generated overhangs are underlined.
pCURT1AOI
Primer Name Sequence (5‘→3‘) Purpose Restriction
site
PG UR FW TTTGGTCTCTAGGTTGCTCAGCAGTGACCTATTC PCR of slr0168
upstream region
BsaI
PG UR RV TTTGGTCTCTTGGGGCCACTGTTATTTTGATTG BsaI
psbA2P FW
(C3) TTTGGTCTCTCCCATGGAAAAAACGACAATTAC PCR of psabA2
promoter
BsaI
COE_P RV TTTGGTCTCTTTGGTTATAATTCCTTATGTATTTG BsaI
CURT1A FW TTTGGTCTCTCCAAATGGCTTCTTCAGAAGAGAC
CTC PCR of
At CURT1A CDS
without cTP
BsaI
CURT1A2 RV
(C4)
TTTGGTCTCTAACGCTATTCGCTTCCTGCGATCTT
C BsaI
selection
cassette FW
TTTGGTCTCACGTTGGAATTCGATTGATCCGTCG
AC PCR of nptI_sacB
double selection
cassette
BsaI
selection
cassette RV TTTGGTCTCCCATACTTTAGGCCCGTAGTCTGCA BsaI
PG DR2 FW TTTGGTCTCTTATGCAATTTCGTTTGCGAATTTAC PCR of slr0168
downstream region
BsaI
PG DR2 RV TTTGGTCTCTAAGCATAAAATACCTTCCCATC BsaI
pCURT1AO
Primer Name Sequence (5‘→3‘) Purpose Restriction
site
CURT UR FW TTTGGTCTCTAGGTTTTTTGACCTATCTGGGTGA
AG PCR of slr0483
upstream region
BsaI
CURT UR RV TTTGGTCTCTAACGAGCTTCCCATATTGGGGC BsaI
selection
cassette FW
TTTGGTCTCACGTTGGAATTCGATTGATCCGTCG
AC PCR of nptI_sacB
double selection
cassette
BsaI
selection
cassette RV TTTGGTCTCCCATACTTTAGGCCCGTAGTCTGCA BsaI
COE_P FW TTTGGTCTCTTATGCCCATGGAAAAAACGACAAT
TAC PCR of psabA2
promoter
BsaI
COE_P RV TTTGGTCTCTTTGGTTATAATTCCTTATGTATTTG BsaI
CURT1A FW TTTGGTCTCTCCAAATGGCTTCTTCAGAAGAGAC
CTC PCR of
At CURT1A CDS
without cTP
BsaI
CURT1A RV TTTGGTCTCTGACACTATTCGCTTCCTGCGATCTTC
BsaI
CURT DR FW TTTGGTCTCATGTCTCCAGACCGCCCCAG PCR of slr0483
downstream region
BsaI
CURT DR RV TTTGGTCTCTAAGCCAAATGCCATTCCTGGGCG BsaI
pSMapc
Primer Name Sequence (5‘→3‘) Purpose Restriction
site
APC UR FW TTTGGTCTCTAGGTCGGCAATACTGGCGGTGTAA
G PCR of Syn apcA/B operon
upstream region
BsaI
APC UR RV TTTGGTCTCTGTTTGGATGGATTCCTCCGTAAAG BsaI
SM cass FW
(C7) TTTGGTCTCTAAACCTTGCGCTCGTTCG PCR of SpecR
selection cassette
BsaI
SM cass RV TTTGGTCTCTTTATTTGCCGACTACCTTGGTGATC BsaI
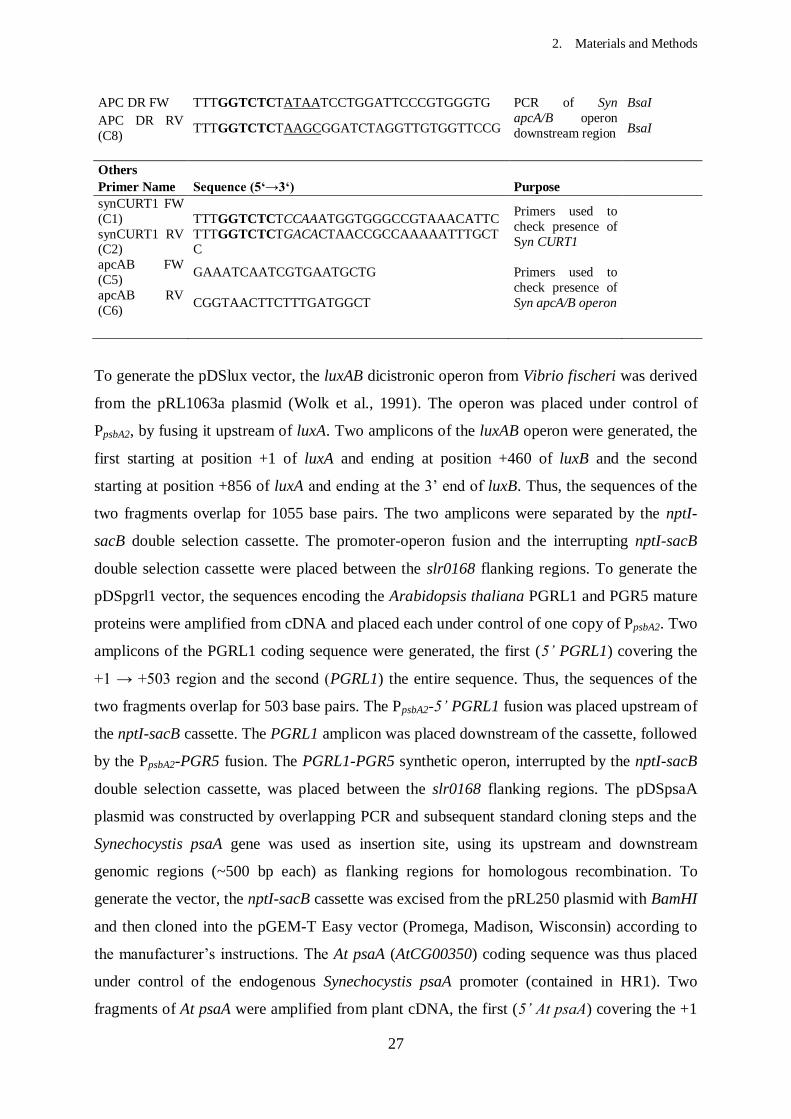
2. Materials and Methods
27
APC DR FW TTTGGTCTCTATAATCCTGGATTCCCGTGGGTG PCR of Syn
apcA/B operon
downstream region
BsaI
APC DR RV
(C8) TTTGGTCTCTAAGCGGATCTAGGTTGTGGTTCCG BsaI
Others
Primer Name Sequence (5‘→3‘) Purpose
synCURT1 FW
(C1) TTTGGTCTCTCCAAATGGTGGGCCGTAAACATTC Primers used to
check presence of
Syn CURT1
synCURT1 RV (C2)
TTTGGTCTCTGACACTAACCGCCAAAAATTTGCTC
apcAB FW
(C5) GAAATCAATCGTGAATGCTG Primers used to
check presence of
Syn apcA/B operon
apcAB RV
(C6) CGGTAACTTCTTTGATGGCT
To generate the pDSlux vector, the luxAB dicistronic operon from Vibrio fischeri was derived
from the pRL1063a plasmid (Wolk et al., 1991). The operon was placed under control of
PpsbA2, by fusing it upstream of luxA. Two amplicons of the luxAB operon were generated, the
first starting at position +1 of luxA and ending at position +460 of luxB and the second
starting at position +856 of luxA and ending at the 3’ end of luxB. Thus, the sequences of the
two fragments overlap for 1055 base pairs. The two amplicons were separated by the nptI-
sacB double selection cassette. The promoter-operon fusion and the interrupting nptI-sacB
double selection cassette were placed between the slr0168 flanking regions. To generate the
pDSpgrl1 vector, the sequences encoding the Arabidopsis thaliana PGRL1 and PGR5 mature
proteins were amplified from cDNA and placed each under control of one copy of PpsbA2. Two
amplicons of the PGRL1 coding sequence were generated, the first (5’ PGRL1) covering the
+1 → +503 region and the second (PGRL1) the entire sequence. Thus, the sequences of the
two fragments overlap for 503 base pairs. The PpsbA2-5’ PGRL1 fusion was placed upstream of
the nptI-sacB cassette. The PGRL1 amplicon was placed downstream of the cassette, followed
by the PpsbA2-PGR5 fusion. The PGRL1-PGR5 synthetic operon, interrupted by the nptI-sacB
double selection cassette, was placed between the slr0168 flanking regions. The pDSpsaA
plasmid was constructed by overlapping PCR and subsequent standard cloning steps and the
Synechocystis psaA gene was used as insertion site, using its upstream and downstream
genomic regions (~500 bp each) as flanking regions for homologous recombination. To
generate the vector, the nptI-sacB cassette was excised from the pRL250 plasmid with BamHI
and then cloned into the pGEM-T Easy vector (Promega, Madison, Wisconsin) according to
the manufacturer’s instructions. The At psaA (AtCG00350) coding sequence was thus placed
under control of the endogenous Synechocystis psaA promoter (contained in HR1). Two
fragments of At psaA were amplified from plant cDNA, the first (5’ At psaA) covering the +1
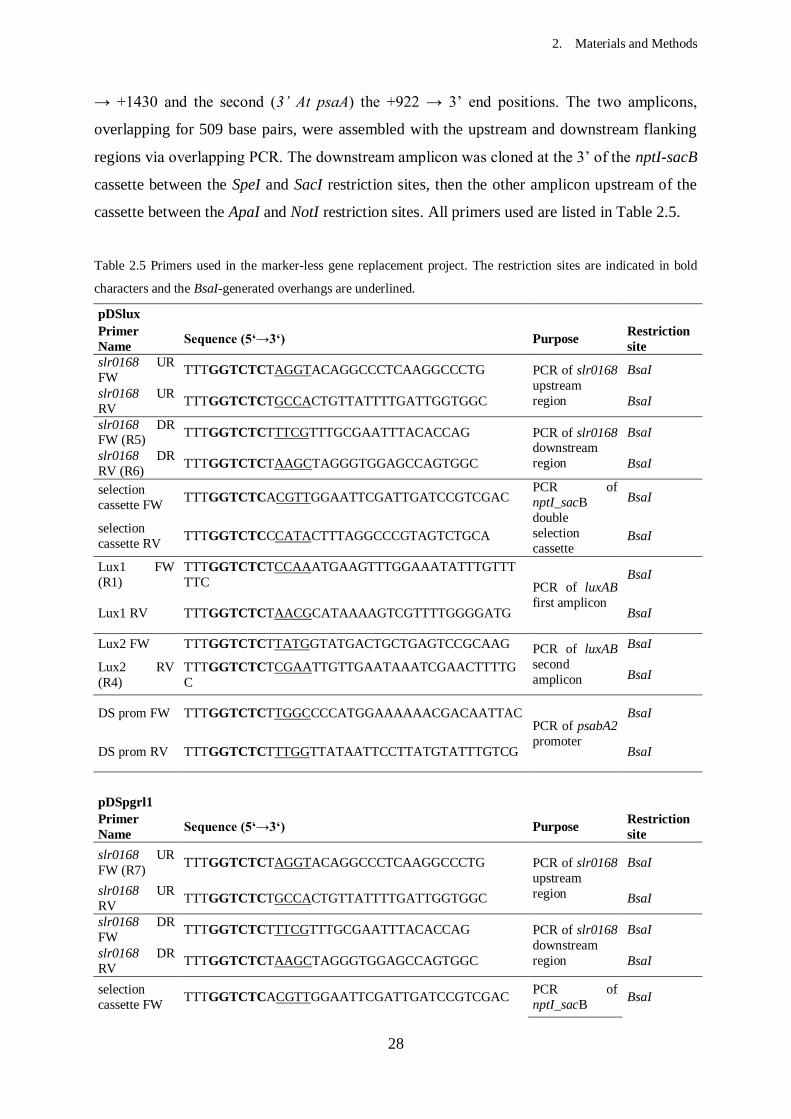
2. Materials and Methods
28
→ +1430 and the second (3’ At psaA) the +922 → 3’ end positions. The two amplicons,
overlapping for 509 base pairs, were assembled with the upstream and downstream flanking
regions via overlapping PCR. The downstream amplicon was cloned at the 3’ of the nptI-sacB
cassette between the SpeI and SacI restriction sites, then the other amplicon upstream of the
cassette between the ApaI and NotI restriction sites. All primers used are listed in Table 2.5.
Table 2.5 Primers used in the marker-less gene replacement project. The restriction sites are indicated in bold
characters and the BsaI-generated overhangs are underlined.
pDSlux
Primer
Name Sequence (5‘→3‘) Purpose
Restriction
site
slr0168 UR
FW TTTGGTCTCTAGGTACAGGCCCTCAAGGCCCTG PCR of slr0168
upstream
region
BsaI
slr0168 UR
RV TTTGGTCTCTGCCACTGTTATTTTGATTGGTGGC BsaI
slr0168 DR FW (R5)
TTTGGTCTCTTTCGTTTGCGAATTTACACCAG PCR of slr0168 downstream
region
BsaI
slr0168 DR
RV (R6) TTTGGTCTCTAAGCTAGGGTGGAGCCAGTGGC BsaI
selection
cassette FW TTTGGTCTCACGTTGGAATTCGATTGATCCGTCGAC
PCR of
nptI_sacB
double
selection
cassette
BsaI
selection
cassette RV TTTGGTCTCCCATACTTTAGGCCCGTAGTCTGCA BsaI
Lux1 FW
(R1)
TTTGGTCTCTCCAAATGAAGTTTGGAAATATTTGTTT
TTC PCR of luxAB
first amplicon
BsaI
Lux1 RV TTTGGTCTCTAACGCATAAAAGTCGTTTTGGGGATG BsaI
Lux2 FW TTTGGTCTCTTATGGTATGACTGCTGAGTCCGCAAG PCR of luxAB
second
amplicon
BsaI
Lux2 RV
(R4)
TTTGGTCTCTCGAATTGTTGAATAAATCGAACTTTTG
C BsaI
DS prom FW TTTGGTCTCTTGGCCCCATGGAAAAAACGACAATTAC PCR of psabA2
promoter
BsaI
DS prom RV TTTGGTCTCTTTGGTTATAATTCCTTATGTATTTGTCG BsaI
pDSpgrl1
Primer
Name Sequence (5‘→3‘) Purpose
Restriction
site
slr0168 UR
FW (R7) TTTGGTCTCTAGGTACAGGCCCTCAAGGCCCTG PCR of slr0168
upstream
region
BsaI
slr0168 UR
RV TTTGGTCTCTGCCACTGTTATTTTGATTGGTGGC BsaI
slr0168 DR
FW TTTGGTCTCTTTCGTTTGCGAATTTACACCAG PCR of slr0168
downstream
region
BsaI
slr0168 DR
RV TTTGGTCTCTAAGCTAGGGTGGAGCCAGTGGC BsaI
selection
cassette FW TTTGGTCTCACGTTGGAATTCGATTGATCCGTCGAC
PCR of
nptI_sacB BsaI
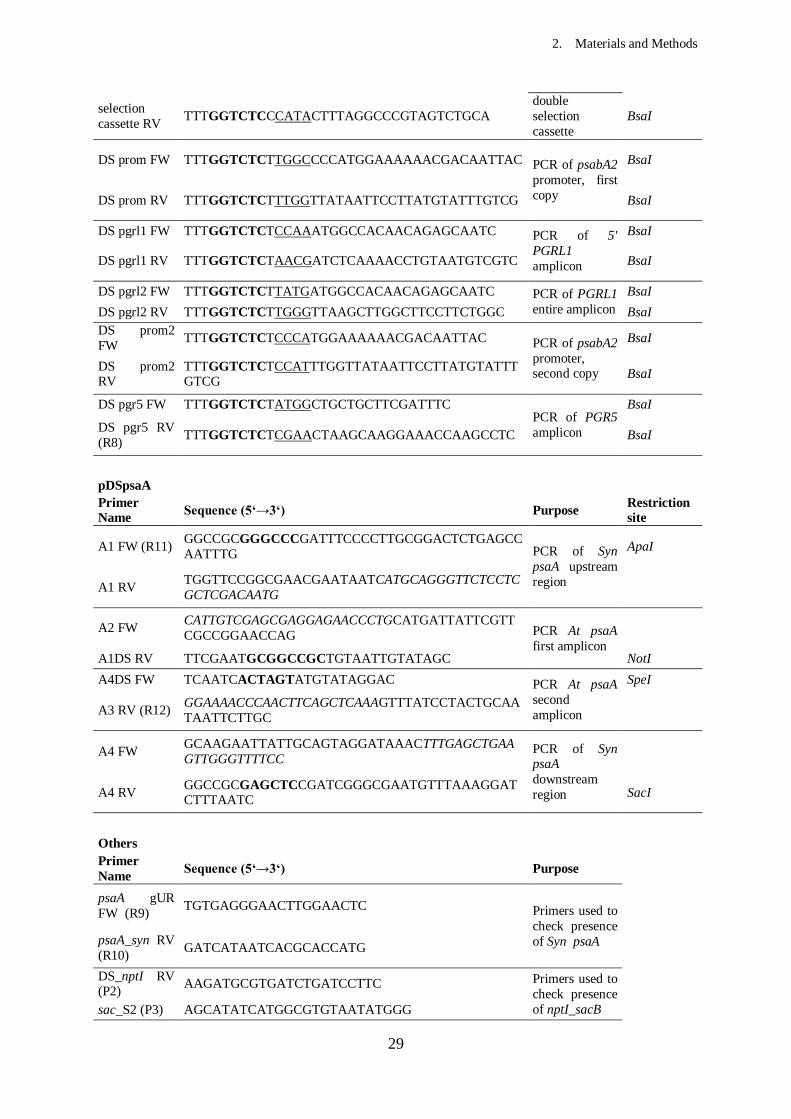
2. Materials and Methods
29
selection
cassette RV TTTGGTCTCCCATACTTTAGGCCCGTAGTCTGCA
double
selection
cassette
BsaI
DS prom FW TTTGGTCTCTTGGCCCCATGGAAAAAACGACAATTAC PCR of psabA2
promoter, first
copy
BsaI
DS prom RV TTTGGTCTCTTTGGTTATAATTCCTTATGTATTTGTCG BsaI
DS pgrl1 FW TTTGGTCTCTCCAAATGGCCACAACAGAGCAATC PCR of 5'
PGRL1
amplicon
BsaI
DS pgrl1 RV TTTGGTCTCTAACGATCTCAAAACCTGTAATGTCGTC BsaI
DS pgrl2 FW TTTGGTCTCTTATGATGGCCACAACAGAGCAATC PCR of PGRL1
entire amplicon
BsaI
DS pgrl2 RV TTTGGTCTCTTGGGTTAAGCTTGGCTTCCTTCTGGC BsaI
DS prom2
FW TTTGGTCTCTCCCATGGAAAAAACGACAATTAC PCR of psabA2
promoter, second copy
BsaI
DS prom2 RV
TTTGGTCTCTCCATTTGGTTATAATTCCTTATGTATTTGTCG
BsaI
DS pgr5 FW TTTGGTCTCTATGGCTGCTGCTTCGATTTC PCR of PGR5
amplicon
BsaI
DS pgr5 RV
(R8) TTTGGTCTCTCGAACTAAGCAAGGAAACCAAGCCTC BsaI
pDSpsaA
Primer
Name Sequence (5‘→3‘) Purpose
Restriction
site
A1 FW (R11) GGCCGCGGGCCCGATTTCCCCTTGCGGACTCTGAGCC
AATTTG PCR of Syn
psaA upstream
region
ApaI
A1 RV TGGTTCCGGCGAACGAATAATCATGCAGGGTTCTCCTC
GCTCGACAATG
A2 FW CATTGTCGAGCGAGGAGAACCCTGCATGATTATTCGTT
CGCCGGAACCAG PCR At psaA
first amplicon
A1DS RV TTCGAATGCGGCCGCTGTAATTGTATAGC NotI
A4DS FW TCAATCACTAGTATGTATAGGAC PCR At psaA
second
amplicon
SpeI
A3 RV (R12) GGAAAACCCAACTTCAGCTCAAAGTTTATCCTACTGCAA
TAATTCTTGC
A4 FW GCAAGAATTATTGCAGTAGGATAAACTTTGAGCTGAA
GTTGGGTTTTCC PCR of Syn psaA
downstream
region
A4 RV GGCCGCGAGCTCCGATCGGGCGAATGTTTAAAGGATCTTTAATC
SacI
Others
Primer
Name Sequence (5‘→3‘) Purpose
psaA gUR
FW (R9) TGTGAGGGAACTTGGAACTC Primers used to
check presence
of Syn psaA
psaA_syn RV
(R10) GATCATAATCACGCACCATG
DS_nptI RV (P2)
AAGATGCGTGATCTGATCCTTC Primers used to
check presence
of nptI_sacB
sac_S2 (P3) AGCATATCATGGCGTGTAATATGGG
2. Materials and Methods
30
2.4. Synechocystis transformation
Synechocystis WT or mutant strains were transformed with plasmid vectors purified with the
QIAgen (Venlo, Netherlands) Midiprep kit.
For each transformation, 10 ml of growing cells at an OD730 of 0.4 were harvested by
centrifugation and resuspended in 1/20 volume of BG11. The cell number per ml was
calculated from OD730 with the formula: 1 OD730 = 7×10⁷ cells. 2 μg of plasmid DNA per
transformation were added to the cells. Transformations were incubated in light for 5 hours,
the last 3 hours with shaking. For recovery, fresh BG11 was added and the transformations
were incubated overnight in the dark with shaking at 30 °C. On the next day, cells were
collected by centrifugation at 4500xg for 10 min, resuspended in a small volume of fresh
BG11 medium and plated on BG11 agar plates containing the correct antibiotic. Mutants that
integrated the nptI-sacB cassette in their genome were positively selected on BG11 agar plates
containing 10 μg/ml kanamycin, whereas those that integrated the SpecR cassette were
selected on BG11 agar plates containing 5 μg/ml spectinomycin. Unless otherwise indicated,
plates of transformed cells transformed were incubated in light at 30 °C. To calculate the
transformation efficiencies, the number of obtained transformants was counted and then the
following equation was used: Transformation frequency = ‘number of transformants’ / ‘total
number of cells before transformation’. For complete segregation of the mutants, increasing
kanamycin (up to 100 μg/ml) and spectinomycin (up to 50 μg/ml) concentrations were used.
2.5. Synechocystis counter-selection and frequency calculation of second recombinants
For second recombination, with consequent removal of the nptI-sacB cassette and counter
selection, completely segregated strains harbouring the double selection cartridge were used.
Cells were grown in BG11 liquid medium containing 100 μg/ml kanamycin to an OD730 of
0.4, then 10 ml were harvested by centrifugation and resuspended in 1/20 volume of fresh
BG11 and the cell number per ml was calculated as described before. 2 μg of plasmid DNA
per transformation were added to the cells and transformations were incubated in light for 5
hours, the last 3 hours with shaking. As Synechocystis cells contain multiple copies of the
genome, liquid cultures were then allowed to recover for 5 days in fresh BG11 medium
without selection in order to allow them to lose all the copies of sacB. After the incubation
period, 2 ml of each liquid culture were plated on BG11 solid medium containing 5 %
sucrose. Unless otherwise specified, plates were incubated in light at 30°C. To calculate the
frequency of second recombination, the number of recombinants was counted and the

2. Materials and Methods
31
following equation was used: ‘Recombination frequency’ = ‘number of recombinants’ / ‘total
number of cells’ before recombination. Genomic PCR was used to confirm the complete
segregation of first and second recombinants.
For second recombination and counter selection in the case of the “single-step” double
recombination strategy, completely segregated first recombinant strains were grown in liquid
BG11 containing 100 μg/ml kanamycin to an OD730 of 1. For each of these cultures 500 μl
were pelleted, washed and resuspended in 10 volumes of BG11 without antibiotic and the cell
number per ml was calculated as described before. The liquid cultures were then grown for 5
days without selection and subsequently 2 ml of each liquid culture were plated on BG11
solid medium containing 5 % sucrose.
2.6. Plant cultivation and growth conditions
Arabidopsis thaliana WT (ecotype Col-0) seeds were incubated in the dark on wet Whatman
paper for two days at 4 °C, then transferred to soil under controlled climate chamber
conditions (PFD: 80 μmol m-2
s-1
16h/8h dark/light).
2.7. Nucleic acid manipulation
2.7.1. Standard and high-fidelity PCR
For genotyping of bacterial strains, PCR analysis was performed using 0.5 μl of genomic
DNA as template in a total reaction volume of 20 μl. The reaction mix contained 1x PCR-
buffer (QIAgen), 100 μM dNTPs, 200 μM primers, 0.5 units of Taq DNA polymerase. The
PCR products were then loaded on a 1% agarose TAE (150 mM Tris-HCl, 1.74 M Acetic
acid, 1 mM EDTA) gel and visualized by Ethidium bromide staining.
DNA fragments were amplified from Synechocystis genomic DNA or Arabidopsis Col-0
cDNA with the Phusion High-Fidelity DNA Polymerase (Thermo Scientific, Rockford,
USA). Reactions were performed in a total volume of 20 μl each containing 1x Phusion HF
reaction buffer, 200 μM dNTPs, 200 μM of each primer and 0.4 units Phusion HF DNA
Polymerase. The PCR-products were loaded on a 1% agarose gel and then cut from the gel
and purified with the QIAgen gel extraction kit following the producer’s instructions.
2.7.2. Genomic DNA isolation
Small-scale isolation of Synechocystis genomic DNA for genotyping and cloning was
performed using the xanthogenate method, according to Tillett and Neilan (2000). Two ml of
2. Materials and Methods
32
exponentially growing liquid cultures were pelleted and resuspended in 50 μl of TE buffer (10
mM Tris/HCl pH 7.4, 1 mM EDTA pH 8.0) containing 100 μg/ml RNAse A (DNAse-free).
750 μl XS buffer (1 % calciumethylxanthogenate, 100 mM Tris/HCl pH 7.4, 20 mM EDTA
pH 8.0, 1% SDS, 800 mM NH4OAc) was added to each sample and, after inverting them 4-6
times, the tubes were incubated at 70 °C for 2 hours to dissolve membranes. The suspensions
were then vortexed for 10 sec, incubated in ice for 30 min and centrifuged for 10 min at
13000xg. The supernatant was transferred in a new tube and DNA was precipitated by adding
0.7 volumes of isopropanol and by centrifuging for 10 min at 12000xg. The DNA pellet was
washed with 70 % ethanol, dried and resuspended in 100 μl of ddH2O.
For Southern blot analysis, high-quality genomic DNA was isolated as follows. 50 ml of
liquid culture in the late exponential phase were centrifuged at 4000xg for 10 min at 4 °C and
washed twice in 10 ml of TE buffer. The pellet was resuspended in 1 ml of TES buffer (25 %
w/v sucrose, 50 mM Tris/HCl, 1 mM EDTA pH 8.0), frozen in liquid N2, thawed at 60°C and
frozen again. After thawing again, 5 mg/ml lysozyme, 0.1 µg/ml RNAseA and 100 mM
EDTA (pH 8.0) were added and the suspension was incubated at 37 °C for 1 hour. Then, 3
units of proteinase K and 2 % SDS were added and the sample was incubated at 60 °C for an
additional hour. The genomic DNA was extracted twice by adding an equal volume of
phenol-chloroform (1:1 w/v) and the obtained aqueous phase was cleaned from traces of
phenol with one volume of chloroform. The DNA in the aqueous phase was then precipitated
with 0.7 volumes of isopropanol and washed with 70 % ethanol. The DNA pellet was air-
dried for 1 hour and resuspended overnight at 4 °C in 50 µl of H2O. All centrifugation steps
were performed at 4 °C.
2.7.3. RNA isolation
The total RNA from Arabidopsis thaliana was extracted from leaf ground tissue using one
volume of extraction buffer (300 mM NaCl, 50 mM Tris-HCl pH 7.5, 20 mM EDTA, 0.5 %
SDS) and one volume of phenol-chloroform-isoamylalcohol (PCI) followed by solubilization
at 65 °C for 5 minutes. After a centrifugation step (10 minutes at 7000 g), the supernatant was
mixed with one volume of 8 M LiCl, incubated for two hours at -20 °C and centrifuged for 30
minutes at 4 °C at 7000xg. The pellet was then washed with 75 % ethanol and resuspended in
80 μl of DEPC-treated water.
The total RNA from Synechocystis sp. PCC 6803 was extracted with the PGTX 95 method,
according to Pinto et al. (2009). Cells from 50 ml of exponentially liquid cultures were
pelleted, resuspended in 1 ml of PGTX (phenol 39.6 % w/v, glycerol 6.9 % w/v, 8-
2. Materials and Methods
33
hydroxyquinoline 0.1 % w/v, EDTA 0.58 % w/v, sodium acetate 0.8 % w/v, guanidine
thiocyanate 9.5 % w/v, guanidine hydrochloride 4.6 % w/v and Triton X-100 2 % w/v) and
incubated at 95 °C for 5 min. After cooling on ice for 5 min, samples were vigorously mixed
with 1/10 volume of chloroform, incubated 5 min at room temperature and centrifuged for 15
min at 12000xg, 4 °C. The aqueous phase was then further extracted with one volume of
phenol-chloroform-isoamylalcohol (PCI), and the RNA in the supernatant was precipitated
with 0.7 volumes of isopropanol. The RNA pellet was washed with 75 % ethanol, air-dried
and resuspended in 80 μl of DEPC-treated water.
2.7.4. Plant cDNA synthesis
Synthesis of Arabidopsis thaliana cDNA was performed using the iScript reverse
transcriptase kit (Bio-Rad, Hercules, CA, USA). During the whole procedure, DEPC-treated
water was used. For digestion of DNA contaminations, DNAse treatment of 1 μg of RNA was
performed in a total reaction volume of 10 μl, containing 1x PCR buffer (Qiagen, Venlo,
Netherlands) + MgCl2 and 0.5 units of DNAse I. The reaction mix was incubated at room
temperature for 30 minutes and the enzyme was then inactivated by adding 2.5 mM EDTA
and further incubating for 15 min at 65 °C. Each RNA sample was then used in a total reverse
transcription reaction volume of 20 μl, containing 1x iScript reaction mix buffer and 1 μl of
iScript reverse transcriptase. The first-strand cDNA synthesis was performed according to the
following protocol by using a thermocycler (BioRad): 5 minutes at 25 °C, 40 minutes at 42 °C
and 5 minutes at 85 °C.
2.7.5. Southern analyses
Southern blot analyses were performed according to Sambrook et al. (1989). For Southern
blot analysis, 5 μg of genomic DNA were digested, in 100 μl of total reaction volume, with 5
units of the appropriate restriction enzyme, according to the manufacturer’s instructions.
Reactions were incubated overnight at 37 °C. The obtained digestion products were purified
with phenol-chloroform extraction, precipitated with isopropanol and resuspended overnight
at 4°C in 20 μl ddH2O each. After 5 min denaturation at 65 °C, the samples were mixed with
4 μl of 6x loading dye and electrophoretically separated on a 0.8 % agarose gel in 0.5x TBE
(40 mM Tris-HCl, pH 8.3, 45 mM boric acid, 1 mM EDTA) at 80 V for 6 hours. After the
separation, the DNA fragments in the gel were visualized with Ethidium bromide staining and
then they were depurinated by incubating the gel in 0.2 M HCl for 10 min. After careful
rinsing, the gel was denatured by gently shaking it in 1.5 M NaCl, 0.5 M NaOH for 45 min
2. Materials and Methods
34
and then neutralized for further 45 min in 3 M NaCl, 0.5 M Tris, pH 7.0. The gel was then
blotted on a positively-charged nylon membrane (Hybond N+; GE Healthcare, Freiburg,
Germany) by using the capillary transfer technique. A glass plate was placed on top of a glass
basin filled with 20x SSC buffer (2 M NaCl, 0.2 M Na-citrate; pH 7.0). A paper bridge was
placed on top of this plate, consisting of 1 piece of Whatman paper (3 MM) slightly larger
than the gel and long, in order to reach into the 20x SSC buffer in the basin. The bridge was
wetted with 10xSSC and, on top of that, 2 pieces of Whatman paper of the same size of the
gel and also wetted with 10xSSC were placed. Air bubbles were carefully removed and the
gel was placed upside down on the paper and then, on its back side, the positively charged
nylon membrane upfront pre-incubated in 2x SSC buffer. On top of the membrane 2 further
sheets of Whatman paper were added, also pre-wetted in 2x SSC buffer and a stack of paper
towels about 10 cm tall. A weight of about 400 g was placed on top of the sandwich, to drive
the flux of the blotting buffer via capillary force. The capillary transfer was allowed to run
over night for approximately 16 hours. The membrane was UV-crosslinked. For the pre-
hybridization-step, the membrane was placed into a glass tube containing 20 ml of
hybridization buffer preheated to 60 °C. 160 μl of previously denatured (100 °C, 5 minutes)
herring sperm DNA (10 ng/μl) were added and the tube was then incubated in a rotating oven
at 67 °C for at least 5 hours. For probe preparation, approximately 100 ng of PCR-product
were filled up to 12 μl with ddH2O, denatured at 100 °C for 5 minutes and cooled on ice for 5
minutes. Afterwards, 4 μl of 1xOLB Buffer (50 mM Tris pH 6.8, 10 mM MgOAc, 50 mM
DTT, 0.5 mg/ml BSA, 33 μM each of dATP, dTTP and dGTP), 1 μl of Klenow DNA
polymerase and 3 μl of radioactive 32
P-dCTP were added to the probe and the reaction was
incubated at 37 °C for 1 hour. The probe was purified with the Illustra MicroSpinTM
G-25
Columns (Freiburg, Germany) according to the producer’s instructions and eluted in 100 μl
ddH2O. The probe was then denatured (100 °C for 5 min) together with 60 μl of herring
sperm DNA (10 ng/μl) and added to the filter. Hybridization was carried on overnight at 67
°C in the rotating oven. For the washing step, the probe was discarded and 10 ml of washing
buffer (0.1 % SDS, 0.2 M NaCl, 20 mM NaH2PO4, 5 mM EDTA; pH7.4) pre-warmed to 60
°C were added in the tube that was further incubated at 67 °C. After 30 minutes the washing
buffer was exchanged and the tubes were put back in the oven for 15 minutes. The washing
buffer was discarded and the membrane was washed again at room temperature in RT buffer
(6 mM NaH2PO4, 1 mM EDTA, 0.2 % SDS; pH 7.0) for one hour on a shaker. The membrane
was then exposed on a radioactive-sensitive phosphor-screen overnight. Primers used to
amplify the probes are listed in Table 2.
2. Materials and Methods
35
Signals were detected with a phosphor imager and IMAGEQUANT (Typhoon, GE
Healthcare, http://www.gehealthcare.com/).
2.7.6. Northern analyses
Northern blot analyses were performed according to Sambrook et al. (1989) loading 15 μg of
total RNA. To 15 μl of RNA 15 μl of formamide, 4 μl of formaldehyde and 3 μl of 10x MEN
(0.2 M MOPS, 50 mM Na acetate, 10 mM EDTA; pH 7.0) buffer were added. The samples
were incubated at 65 °C for 15 minutes and afterwards put on ice for 5 minutes. Then 8 μl of
6x loading dye were added, the samples were loaded on an agarose gel (2 % agarose, 6 %
formaldehyde, 1x MEN buffer) and then ran at 40 V for 3 hours. The gel was then blotted on
a positively-charged nylon membrane (Hybond N+; GE Healthcare, Freiburg, Germany) by
using the capillary transfer technique as previously described for the southern blot. The
blotting assembly was allowed to run over night for approximately 16 hours and the
membrane was afterwards UV-crosslinked. For the pre-hybridization-step the hybridization
buffer was preheated to 60 °C. 20 ml of hybridization buffer and 160 μl of previously
denaturated (100 °C, 5minutes) herring sperm DNA (10 ng/μl) were added. The tube was
incubated in a rotating oven at 60 °C overnight. For probe preparation approximately 100 ng
of PCR-product were filled up to 12 μl with ddH2O, denaturated at 100 °C for 5 minutes and
cooled down on ice for 5 minutes. Afterwards, 4 μl of 1x NEBuffer 2, 1 μl of Klenow DNA
polymerase, 33 μM dNTPs (without CTP) and 3 μl of radioactive 32
P-dCTP were added to the
probe followed by incubation over night at room temperature. For probe purification, Illustra
MicroSpinTM G-25 Columns were used according to the producer’s instructions. For the
washing step the washing buffer (0.1 % SDS, 0.2 M NaCl, 20 mM NaH2PO4, 5 mM EDTA;
pH7.4) was pre-warmed in a water bath to 60 °C. The probe was discarded and 10 ml of
washing buffer were added and further incubated at 65 °C. The washing buffer was kept at 60
°C. After 30 minutes the washing buffer was exchanged and the tubes were put back to 60 °C
for 15 minutes. The membrane was then exposed to a radioactive sensitive screen overnight.
Primers used to amplify the probes are listed in Table 2.3. Signals were acquired and
quantified with a phosphor imager and IMAGEQUANT (Typhoon, GE Healthcare,
www3.gehealthcare.com).

2. Materials and Methods
36
2.8. Protein manipulation
2.8.1. Protein preparation and immuno-blot analyses
For total protein extraction, Synechocystis cultures in the exponential growth phase were
collected by centrifugation and resuspended in 1 volume of thylakoid buffer (50 mM
HEPES/NaOH pH 7.0, 5 mM MgCl2, 25 mM CaCl
2, 10 % glycerin). Cell suspensions were
transferred into a 2 ml tube together with 0.5 volumes of glass beads (0.25-0.5 mm diameter),
and vortexed 5 times for 20 sec. Samples were placed on ice for 1 min between each
vortexing step. Beads and unbroken cells were pelleted by centrifuging at 16000xg for 3 min
and then the supernatant, corresponding to the total protein fraction, was transferred into a
new tube. For preparation of thylakoid fractions, the crude extract was diluted in 2 volumes of
thylakoid buffer and membranes were pelleted at 16000xg, 4 °C, for 30 min. The thylakoid
pellet was washed once more in thylakoid buffer and resuspended in a small volume of it.
Proteins from both total and membrane fractions were solubilized with 2 % LDS and 100 mM
DTT at room temperature for 1 hour and subsequently denatured at 80°C for 1 min. Non
soluble material was removed by centrifugation at 16000xg for 10 min. Total protein
concentration in the samples was measured with Amido Black staining (Schaffner and
Weissmann, 1973).
The protein samples were loaded on a Tris-tricine SDS-Polyacrylamide gel (Schagger and
von Jagow, 1987) with the desired acrylamide concentration and, afterwards, proteins were
transferred to PVDF membranes (Ihnatowicz et al., 2004). After blotting, membranes were
saturated with 5 % milk proteins dissolved in 1x TBS-T (150 mM NaCl, 10 mM Tris pH 8.0,
0.1 % v/v Tween20) and saturated membranes were incubated overnight at 4°C with the
specific primary antibody diluted in TBS-T containing 5 % milk proteins. After removal of
the primary antibody and 3 washing steps in TBS-T (10 min each), membranes were
incubated for 1 hour with the corresponding secondary antibody, diluted in TBS-T containing
5 % milk proteins, conjugated with horseradish peroxidase. Detection of the horseradish
peroxidase signal was performed using the Pierce ECL Western Blotting Substrate kit
(Thermo Scientific, Rockford, USA).
2.8.2. Blue-Native analyses of thylakoid protein complexes
For native electrophoretical separation of thylakoid complexes, Synechocystis thylakoid
fractions were prepared as described above but all steps were performed on ice and protease
inhibitors (1 mM ACA, 1 mM PMSF, 4 mM benzamidin) were added to the thylakoid buffer.
2. Materials and Methods
37
Chlorophyll concentration of thylakoid suspensions was then measured as follows: 5 μl of
each sample were diluted 1:200 in 80 % acetone and incubated in the dark at -20 °C for 30
min. Membrane debris were pelleted at 16000xg for 10 min. Absorbance at 663 nm was
measured and the chlorophyll concentration was calculated with the formula: C= A663 x dil.
factor / 86.86.
50 μg of chlorophyll for each sample were washed and resuspended to a final concentration of
0.5 μg/μl in thylakoid buffer containing 1 % n-Dodecyl-β-D-Maltoside. Solubilisation was
performed on ice at 4 °C with gentle shaking for 50 min, followed by 10 more min at room
temperature. Insoluble material was pelleted by centrifugation at 16000xg, 4 °C, for 30 min
and supernatant was then mixed with 0.1 volumes of Coomassie loading solution (750 mM
aminocaproic acid, 5 % Coomassie-G). Thylakoid protein complexes were separated on a
Blue-Native PAGE (gradient gel, 4-12 % polyacrylamide) (Schagger et al., 1988). After 12
hours of run, the blue cathode buffer (50 mM Tricine, 15 mM Bis-Tris pH 7.0, 0.02 %
Coomassie-G) was replaced with fresh buffer without Coomassie-G. Anode buffer (50 mM
Bis-Tris pH 7.0) was replaced as well with fresh one. After the run, gel stripes corresponding
to single samples were incubated for 20 s in a denaturing buffer (6 % SDS, 200 mM Na2CO3,
3 % β-mercaptoethanol) and proteins separated in the second dimension by SDS-PAGE (15 %
polyacrylamide gel (Shapiro et al., 1967). 2D gel was stained with Colloidal Coomassie
staining (10 % ammonium sulfate, 0.1 % Coomassie G-250, 3 % orthophosphoric acid, 20 %
Ethanol) and destained with water.
2.8.3. In vivo translation assay
For in vivo radioactive labelling of thylakoid proteins, Synechocystis liquid cultures in the
exponential growth phase were used. Equal amount of cells, based on the OD730, were
harvested by centrifugation at 4500xg for 10 min and then resuspended in BG11
supplemented with 5 mM glucose to a final OD730 corresponding to 300 ng/μl of chlorophyll
a in the wild type sample. The same volume of the wild type was used for the other samples.
The samples were incubated for 1 hour under normal growth conditions (30 µmol m-2
s-1
light
intensities, 30 °C), with shaking, then supplemented with 500 μCi/ml of 35
S-Met and
incubated for additional 30 min, in order to radiolabel newly translated proteins. Protein
radiolabelling was terminated by 1 mM of non-radioactive Methionine and cells were then
collected by centrifugation at 4000xg, for 10 min, in a centrifuge pre-cooled to 4 °C.
Thylakoids fractions were prepared as described before, resuspended to a final concentration
corresponding - in the wild type - to 0.5 μg/μl of chlorophyll a and solubilised for 1 hour at
2. Materials and Methods
38
room temperature with 2 % LDS and 100 mM DTT. The same volume of the wild type was
used for the other samples. The soluble fraction was obtained by centrifugation at 16000xg for
10 min at room temperature. Samples corresponding, in the wild type, to 15 μg of chlorophyll
were loaded and separated on an SDS-PAGE gel with 12 % polyacrylamide. The gel was then
stained with Colloidal Coomassie staining, dried and exposed to Storage Phosphor Screen
(Fuji) and radioactive labelled proteins were detected with the Typhoon PhosphorImager (GE
Healthcare, Munich, Germany).
2.9. Spectroscopic and fluorimetric analyses
2.9.1. P700 oxidation-reduction kinetics measurements
The photo-oxidation and dark-reduction kinetics of P700 were measured in intact cells using
the A820 change, as described (Herbert et al., 1995). The A820 was monitored using the
modulated Duel-PAM 100 detection system (Walz, Effeltrich, Germany). The instrument
operated with a time constant of 20 ms. Samples for A820 measurements were prepared at
room temperature by washing exponentially growing cultures with BG11 not supplemented
with glucose and resuspending them to a final OD730 of 1. After 10 min of dark-adaption, the
samples were placed in a quartz cuvette with 1 cm of path length into the Optical Unit ED-
101US/MD mounted to Mounting Stand ST-101 with attached Measuring Heads DUAL-E
and DUAL-DB. Inhibitors of electron transport were added to the samples prior to
measurements to block different inputs of electrons to PSI, as has been done previously
(Maxwell and Biggins, 1976; Herbert et al., 1992; Yu et al., 1993). Input from PSII was
blocked with 25 μm DCMU. Input from the plastoquinone pool was blocked with 25 μm
DBMIB. Stock solutions of the inhibitors were prepared to 1 mM in 1 % ethanol and then
diluted 40x in the final samples. Mock treatment of the samples was performed, as a control,
adding 1/40 of their final volume of 1 % ethanol prior to measurements. For the P700
measurements, modulated far red measuring light was used and samples were excited with
white actinic light (100 µmol m-2
s-1
light intensities) for 3 sec, followed by a dark period of 5
sec. The P700 traces shown are representative of three independent experiments.
2.9.2. Bacterial whole-cell absorbance spectra
Absorbance spectra of whole Synechocystis cells were recorded using a spectrophotometer.
Cells were harvested, washed and resuspended in BG11 liquid medium to a final OD730
of 0.5.
2. Materials and Methods
39
Their absorbance spectra were recorded between 350 and 750 nm and normalized to the light
scattering at 730 nm.
2.9.3. Low temperature (77 K) fluorescence emission spectra
77K fluorescence was recorded using an in-house built spectrofluorometer. Synechocystis
samples grown under different light intensities were used. Cells were harvested, washed and
resuspended in BG11 liquid medium to a final OD730
of 0.5, dark-adapted for 10 min and then
rapidly frozen in liquid nitrogen. To investigate the stoichiometry of the PSI and PSII
complexes, their fluorescence emission spectra under the Chl a excitation at 435 nm were
recorded between 600 and 800 nm. Fluorescence emission peaks of PSI (720 nm) of the
different strains were compared by normalizing the PSII emission peak (695 nm) to the one
from WT.
2.10. Luciferase assay
Luciferase activity was induced by the addition of decanal, an analogue of the luciferase
substrate luciferin, to the cyanobacterial suspension to a final concentration of 1 mM (from 50
mM decanal in methanol/water 50 %, v/v stock). The reaction was incubated for 15 min with
mild shaking and then luminescence was measured with a microplate reader (Safire2; Tecan,
http://www.tecan.com/) at room temperature. Luminescence values were related to the
suspension optical density at 730 nm, also measured with the microplate reader. Each
suspension was measured in duplicates and the assay was repeated twice with independently
grown cultures.
For luciferase activity from agar plates, cells grown on solid medium were spread with the
decanal solution and luminescence was detected with the FUSION FXT imaging system
(Peqlab Biotechnologie GmbH, Erlangen, Germany).
2.11. TEM analyses
Transmission electron microscopy analysis of Synechocystis cells was performed in
collaboration with Prof. Dr. Gerhard Wanner, Biozentrum der LMU, Planegg-Martinsried,
Germany.
2.12. Database analyses and software tools
Gene models, mRNAs and gene sequences have been obtained from the NCBI
(http://ncbi.nlm.nih.gov), Cyanobase (http://genome.kazusa.or.jp/cyanobase/) and TAIR

2. Materials and Methods
40
(http://arabidopsis.org) databases. Nucleic acid sequence analysis and in silico manipulation
was performed using the VectorNTI Advance 9.1 (Invitrogen) and BioEdit Sequence
Alignment Editor (www.mbio.ncsu.edu/bioedit/bioedit.html) software. Chloroplast transit
peptides of Arabidopsis proteins were predicted by consulting the TargetP database
(www.cbs.dtu.dk/services/TargetP). Protein multi-alignments were performed using ClustalW
(Thompson et al., 2002) and Boxshade (http:// ch.embnet.org/software/BOX_form.html).
3. Results and discussion
41
3. RESULTS AND DISCUSSIONS
3.1. Replacement of the Synechocystis PSI complex
The introduction of Arabidopsis PSI in replacement of the Synechocystis endogenous one was
chosen as starting point for the project because of its high degree of conservation between the
two organisms and, in general, along the green lineage. As already shown in Table 1.1, 11
genes must be replaced and 4 introduced de novo in order to introduce the Arabidopsis PSI in
Synechocystis. The two largest PSI proteins PsaA and PsaB were exchanged in the first place.
The PsaA and PsaB subunits originated through gene duplication (Kirsch et al., 1986) and are
highly conserved even in organisms separated by a billion years of evolution, which is
underlined by the high sequence similarity (about 80 %) in pairwise alignments with the
Arabidopsis and Synechocystis proteins. Strongly conserved regions include the four cysteines
(two each provided by psaA and psaB) that organize the iron-sulphur cluster (4Fe-4S) Fx,
which is essential for functional electron transfer (Heathcote et al., 2003).
PsaA and PsaB are encoded by the plastidial tri-cistronic operon psaA-psaB-rps14 in
Arabidopsis and in all the higher plants and are under the transcriptional regulation of the
light-responsive psaA promoter PpsaA (Chen et al., 1993; Lezhneva and Meurer, 2004).
Accumulation of the psaA/B transcript is regulated in all higher plants and the amounts of PSI
and PSII are transcriptionally modulated in a complementary manner according to changes in
light quantity and quality (Allen and Pfannschmidt, 2000). The structure of the psaA-psaB
operon in Synechocystis is similar to the Arabidopsis counterpart, but is di-cistronic as it lacks
the rps14 gene at its 3’ end. The chloroplastic and the bacterial operon possess a number of
common genetic regulatory elements since they are both transcribed and translated by a
prokaryotic machinery. The Synechocystis PpsaA promoter also displays a light-dependent
functional regulation that probably involves regulatory components mediating the signalling
from photoreceptors (Herranen et al., 2005). Moreover, the psaA and psaB genes are
separated in both organisms by an intergenic region (A/B IR) whose low divergence
throughout the photoautotrophs lineage suggests the retention of cis-acting elements similar to
those involved in prokaryotic translation initiation (Peredo et al., 2012). Indeed, the two
intergenic regions have slightly different sizes (26 bp in Arabidopsis, 246 bp in
Synechocystis) but both contain a Shine-Dalgarno sequence that promotes translation in
prokaryotes.
Although the psaA-psaB regulatory elements are partially conserved between Synechocystis
and Arabidopsis, they diverged during evolution in order to adapt to the different cellular and
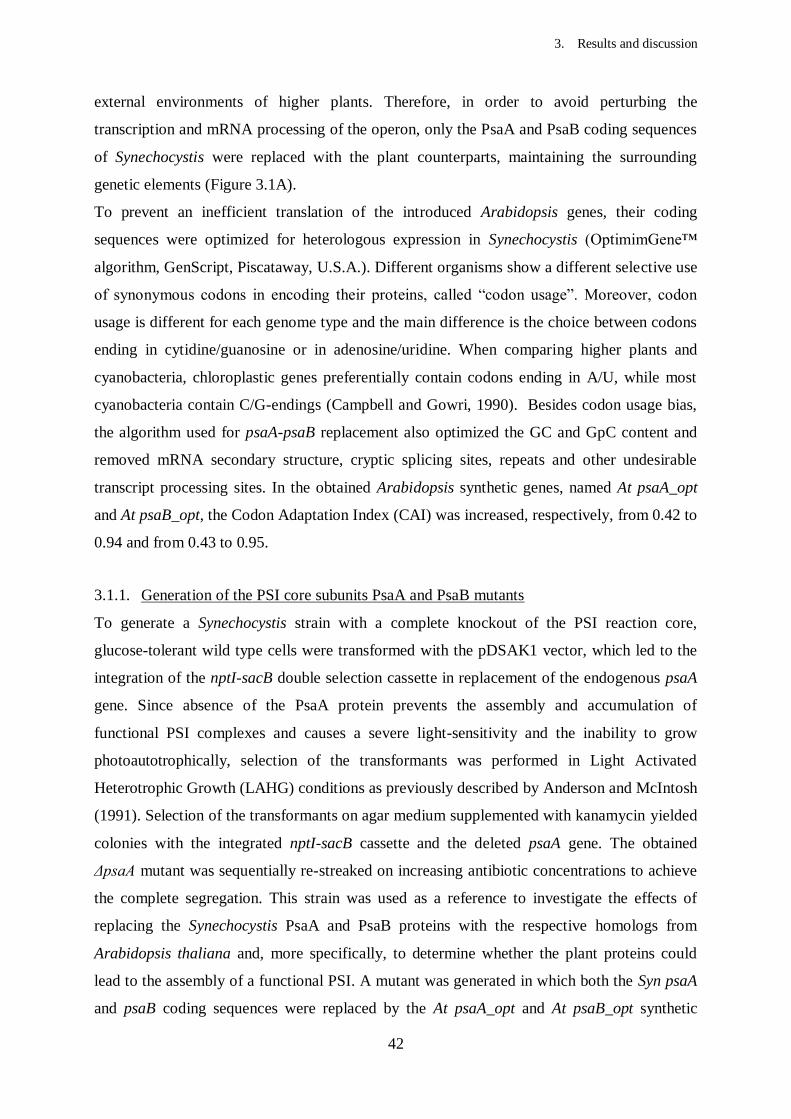
3. Results and discussion
42
external environments of higher plants. Therefore, in order to avoid perturbing the
transcription and mRNA processing of the operon, only the PsaA and PsaB coding sequences
of Synechocystis were replaced with the plant counterparts, maintaining the surrounding
genetic elements (Figure 3.1A).
To prevent an inefficient translation of the introduced Arabidopsis genes, their coding
sequences were optimized for heterologous expression in Synechocystis (OptimimGene™
algorithm, GenScript, Piscataway, U.S.A.). Different organisms show a different selective use
of synonymous codons in encoding their proteins, called “codon usage”. Moreover, codon
usage is different for each genome type and the main difference is the choice between codons
ending in cytidine/guanosine or in adenosine/uridine. When comparing higher plants and
cyanobacteria, chloroplastic genes preferentially contain codons ending in A/U, while most
cyanobacteria contain C/G-endings (Campbell and Gowri, 1990). Besides codon usage bias,
the algorithm used for psaA-psaB replacement also optimized the GC and GpC content and
removed mRNA secondary structure, cryptic splicing sites, repeats and other undesirable
transcript processing sites. In the obtained Arabidopsis synthetic genes, named At psaA_opt
and At psaB_opt, the Codon Adaptation Index (CAI) was increased, respectively, from 0.42 to
0.94 and from 0.43 to 0.95.
3.1.1. Generation of the PSI core subunits PsaA and PsaB mutants
To generate a Synechocystis strain with a complete knockout of the PSI reaction core,
glucose-tolerant wild type cells were transformed with the pDSAK1 vector, which led to the
integration of the nptI-sacB double selection cassette in replacement of the endogenous psaA
gene. Since absence of the PsaA protein prevents the assembly and accumulation of
functional PSI complexes and causes a severe light-sensitivity and the inability to grow
photoautotrophically, selection of the transformants was performed in Light Activated
Heterotrophic Growth (LAHG) conditions as previously described by Anderson and McIntosh
(1991). Selection of the transformants on agar medium supplemented with kanamycin yielded
colonies with the integrated nptI-sacB cassette and the deleted psaA gene. The obtained
ΔpsaA mutant was sequentially re-streaked on increasing antibiotic concentrations to achieve
the complete segregation. This strain was used as a reference to investigate the effects of
replacing the Synechocystis PsaA and PsaB proteins with the respective homologs from
Arabidopsis thaliana and, more specifically, to determine whether the plant proteins could
lead to the assembly of a functional PSI. A mutant was generated in which both the Syn psaA
and psaB coding sequences were replaced by the At psaA_opt and At psaB_opt synthetic
3. Results and discussion
43
genes. In this mutant, called AB_opt, the synthetic coding sequences replaced the endogenous
ones.
The AB_opt mutant was generated stepwise. The glucose-tolerant wild type Synechocystis
strain was initially transformed with the pDSAB_opt vector in order to substitute the entire
psaA/B operon. Selection of the transformants on kanamycin was performed in normal light,
in order to select for a light-tolerant phenotype, but still on BG11 medium containing glucose.
In the obtained transformants the nptI-sacB double selection cassette downstream of the
operon and the At psaB_opt gene could be detected, but not At psaA_opt (data not shown).
PCR on genomic DNA and sequencing of the obtained amplified fragments revealed that the
first homologous recombination occurred through the psaA/B intergenic region and the psaB
downstream region, thus leading only to the replacement of the Syn psaB gene.The reason
why the At psaA_opt gene was not integrated properly can be explained by the length of the
entire synthetic operon (~5 kb) and by the presence of the homologous intergenic region (A/B
IR) separating the desired recombination site and the nptI positive marker. The obtained
mutant (B_optkanR
) was used as background for the subsequent replacement of Syn psaA.
B_optkanR
was transformed with the plasmid pAB1 in order to excise the nptI-sacB cassette
and to obtain a marker-less strain. After a recovery of 5 days, transformants lost all sacB
copies and selection on 5 % sucrose yielded markerless mutants, called B_opt.
Transformation of B_opt was performed using the pDSA_opt vector in order to replace Syn
psaA with the artificial homolog At psaA_opt, this time introducing the nptI-sacB cassette
upstream of the operon. The endogenous psaA promoter, placed between the cassette and the
recombinant gene, could have caused an undesired recombination as A/B IR did in the case of
pDSAB_opt, even if its smaller size would correlate with a lower probability of
recombination. Anyway, PpsaA was kept in order to allow expression of the introduced At
psaA_opt also before removal of the double selection cassette. Indeed, selection on
kanamycin yielded colonies still able to grow in full light and harbouring the entire At
psaA/B_opt synthetic operon. Complete segregation of the mutant, AB_optkanR
, was confirmed
by PCR and subsequent removal of the double selection cassette was performed via
transformation with the pAB2 vector. Cells that still contained nptI-sacB were negatively
selected on 5 % sucrose while the surviving transformants constituted the AB_opt mutant
strain. These mutants were, as those of all the previous recombination steps, still bluish, but
not light sensitive like the ΔpsaA knockout strain and they could grow under normal light
conditions (Figure 3.1C). To confirm correct segregation of the genotypes in the ΔpsaA,
AB_optkanR
and AB_opt mutants, genomic PCR was performed using six primer pairs (Figure

3. Results and discussion
44
3.1B). In the wild type strain, the primer pairs P1+P2 and P3+P4 generated amplicons
spanning the Syn psaA-psaB intergenic region and the Syn psaA and Syn psaB genes,
respectively. None of these PCR products were detectable in the two replacement strains,
confirming that they had lost both the endogenous genes, while only primers P3+P4 generated
an amplicon in ΔpsaA that still retained Syn psaB. Primer pair P5+P6 amplified the nptI-sacB
selection cassette from the ΔpsaA and AB_optkanR
, but not AB_opt, genomes. The region
spanning the At psaB_opt gene and its downstream region could be amplified, combining
primers P7 and P8, in the AB_optkanR
and AB_opt mutants, as well as the amplicon spanning
the At psaA_opt and At psaB_opt recombinant genes (primer pair P9+P10). The primers P11
and P12 generated a PCR product covering the At psaA_opt 5' end and its upstream genomic
region in the AB_opt mutant strain, confirming the complete excision of the nptI-sacB
cassette. In the case of AB_opt, partially overlapping amplicons covering the whole integrated
synthetic operon, including the upstream and downstream flanking sequences, were also
sequenced to confirm its accuracy.
3.1.2. Molecular analysis of the PSI core mutants
The growth phenotypes of the ΔpsaA, AB_optkanR
and AB_opt mutant strains were analyzed by
spotting them on BG11-agar plates under different selective and trophic conditions (Figure
3.1C). The ΔpsaA mutant displayed resistance to kanamycin, deriving from the integrated nptI
resistance gene, but, being PSI-deficient, it only grew under LAHG conditions. In LAHG,
bacteria are grown heterotrophically in presence of 5 mM glucose, in the dark except for a
single short exposure to dim light every 24 h, which is necessary to maintain the circadian
rhythm and ensure normal progression through the cell cycle. Being an obligate heterotroph
and light-sensitive, psaA was unable to grow neither in continuous bright light nor without
glucose. The AB_optkanR
mutant was also resistant to kanamycin while AB_opt was sensitive
to the presence of the antibiotic. Interestingly, both the mutants containing the psaA and psaB
optimized genes from Arabidopsis were not light sensitive and were partially able to grow
photoautotrophically on BG11 agar plates containing no sugar. Although in these conditions
they could grow only at a much slower rate (see Figure 3.1C) than the wild type, this
suggested that the At PsaA and At PsaB proteins could partially replace the function of the
Synechocystis homologs, at least to the extent of restoring light tolerance and the ability to
grow photoautotrophically. Moreover, the presence of the same phenotype in both
replacement mutants indicated that the nptI-sacB cassette upstream of the PpsaA promoter in
AB_optkanR
did not influence the operon function.
3. Results and discussion
45
Figure 3.1 Analysis of the psaA-psaB mutant strains (A) Schematic depiction of the mutant strains after the subsequent transformation steps. The genomic regions
used for targeted homologous recombination are highlighted at each step (HR1-10). Annealing sites of the
primers used for genotyping (P1-12) are indicated. (B) Complete segregation of the Synechocystis ΔpsaA, AB_optkanR and AB_opt strains generated by the genetic
manipulations represented in (A). Note that B_optkanR and B_opt are not shown because they already constituted
the background genotypes of the AB_optkanR and AB_opt mutants shown here. (D) Drop test of ΔpsaA, AB_optkanR and AB_opt mutants on selective media. Liquid cultures at an OD730 of 0.4
were washed with BG11 without glucose and spotted (15 μl each) onto BG11 medium containing either 100
μg/ml kanamycin or no selection. When tested for light sensitivity, cells were grown mixotrophically, in
3. Results and discussion
46
continuous light at 30 μmol photons m-2 s-1 on BG11 supplemented with 5mM glucose. When tested for
autotrophic growth, cells were grown in continuous light at 30 μmol photons m-2 s-1 on BG11 without glucose.
When grown in Light Activated Heterotrophic Growth (LAHG) conditions, the cells were incubated in the dark
on BG11 supplemented with 5 mM glucose, and exposed to light for 5 min every 24 hours.
The growth phenotype of the Synechocystis mutants with the At psaA and At psaB optimized
genes replacing the endogenous counterparts suggested that the introduced recombinant genes
were functional at least to some extent, because their presence was sufficient to partially
rescue the PSI-deficient phenotype of ΔpsaA. Expression of the cyanobacterial and plant PSI
core genes was analyzed by Northern blot in the wild type, ΔpsaA and AB_opt strains (Figure
3.2A). When hybridizing the filters with the Syn psaA and Syn psaB radiolabelled probes, the
target transcripts were detected only in WT. In both cases, a 5 kb and a 2.2 kb band,
corresponding to the unprocessed Syn psaA-psaB and to the processed Syn psaA or Syn psaB
transcripts, respectively, were present, as already reported in literature (Herranen et al., 2005).
The probes hybridized neither to the AB_opt nor to the psaA RNA sample, which confirms
that disruption of the psaA gene prevents also transcription of psaB. On the contrary, the At
psaAo and At psaBo probes hybridized to the AB_opt RNA sample, thus confirming that the
two plant genes were transcribed in this mutant strain. Moreover, two bands (of 5 and 2.2 kb,
respectively) were present in both cases as it was shown for the endogenous counterparts,
demonstrating that the replacement operon could be transcribed and the mRNA was correctly
processed. The abundance of the At psaA_opt and At psaB_opt transcripts could not be
quantified and compared with that of the endogenous ones in WT, because of the different
hybridization efficiencies of the probes.
Although the plant genes were transcribed in the AB_opt strain, it was not possible to detect
the corresponding proteins when performing immunoblot analysis on total or thylakoid
protein fractions. Failure to detect At PsaA and At PsaB proteins could either be explained by
a drastically lowered translation rate or by an increased instability of the synthesized
polypeptides.
In order to identify the cause for the absence of At PsaA and At PsaB, in vivo pulse labelling
of proteins from WT, psaA and AB_opt strains was performed. Cells were incubated for 30
min in light in the presence of 35
S-Methionine that was incorporated into newly translated
proteins. After the incubation period, de novo synthesized thylakoid proteins were isolated
and separated on a denaturing polyacrylamide gel. Prior to loading, samples were adjusted
according to the OD730 of the initial cell suspensions. Equal loading was confirmed by
Coomassie staining of the gel and, in the wild type, positions of the PsaA and PsaB proteins
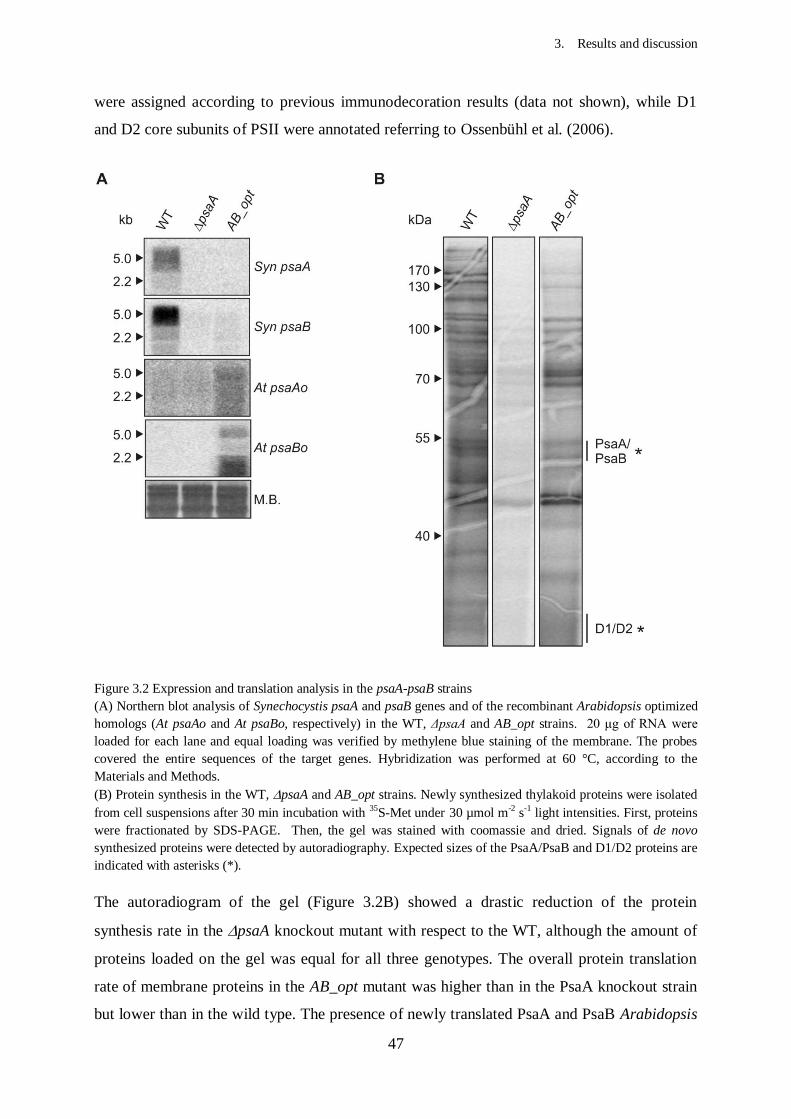
3. Results and discussion
47
were assigned according to previous immunodecoration results (data not shown), while D1
and D2 core subunits of PSII were annotated referring to Ossenbühl et al. (2006).
Figure 3.2 Expression and translation analysis in the psaA-psaB strains (A) Northern blot analysis of Synechocystis psaA and psaB genes and of the recombinant Arabidopsis optimized
homologs (At psaAo and At psaBo, respectively) in the WT, ΔpsaA and AB_opt strains. 20 μg of RNA were
loaded for each lane and equal loading was verified by methylene blue staining of the membrane. The probes
covered the entire sequences of the target genes. Hybridization was performed at 60 °C, according to the
Materials and Methods.
(B) Protein synthesis in the WT, psaA and AB_opt strains. Newly synthesized thylakoid proteins were isolated
from cell suspensions after 30 min incubation with 35S-Met under 30 µmol m-2 s-1 light intensities. First, proteins
were fractionated by SDS-PAGE. Then, the gel was stained with coomassie and dried. Signals of de novo
synthesized proteins were detected by autoradiography. Expected sizes of the PsaA/PsaB and D1/D2 proteins are
indicated with asterisks (*).
The autoradiogram of the gel (Figure 3.2B) showed a drastic reduction of the protein
synthesis rate in the psaA knockout mutant with respect to the WT, although the amount of
proteins loaded on the gel was equal for all three genotypes. The overall protein translation
rate of membrane proteins in the AB_opt mutant was higher than in the PsaA knockout strain
but lower than in the wild type. The presence of newly translated PsaA and PsaB Arabidopsis
3. Results and discussion
48
proteins could not be unambiguously determined due to a lack of precise information about
electrophoretic mobility of the different membrane proteins.
Although it could not be clarified that synthesis and accumulation of the Arabidopsis PSI core
proteins took place in the replacement mutant, the presence of At psaA_opt and At psaB_opt
transcripts lead to a partial rescue of the drastic psaA translational impairment shown in
Figure 3.2B. These preliminary results were consistent with the growth phenotypes of the
analyzed strains.
To investigate the effects of the genetic manipulations in ΔpsaA and AB_opt on the assembly
and accumulation of the membrane protein complexes, BN-PAGE analysis was performed.
Thylakoid membranes were solubilised with β-DM and photosynthetic complexes were
fractionated by Blue Native PAGE. Six major bands, representing the PSI supercomplexes,
trimeric PSI, dimeric PSI, dimeric PSII/ATPase, monomeric PSI, and monomeric PSII, were
detected in the WT (Figure 3.3A, left panel) and annotated according to available literature
(Herranen et al., 2004; Yao et al., 2011). It has to be noted that the bands representing PSI
complexes are the only green ones, as chlorophyll a is mainly associated to photosystem I in
Synechocystis (Fujita et al., 1988). Blue Native gels were stained with Coomassie in order to
visualize pigment-less and low-abundant complexes (Figure 3.3A, right panel). The unstained
and the Coomassie-stained BN PAGES revealed that all PSI complexes and supercomplexes
were absent in psaA, while PSII and ATPase complexes were still present in wild type-like
amounts. Instead, two additional chlorophyll-containing complexes could be identified in the
AB_opt mutant strains (indicated by the asterisks). The two additional complexes migrated
similarly into the BN PAGE compared to the PSI dimer and the PSI supercomplexes of the
wild type sample. No PSI trimer - the most abundant PSI supercomplex in the wild type - ,
could be identified in the PSI-core replacement mutant. The observed differences in the
photosynthetic complexes corresponded to changes in the in vivo absorption spectra of the
analyzed strains (Figure 3.3B). In psaA the absorption peaks of Chl a, at 438 and 681 nm,
were essentially absent and also the peak corresponding to phycocyanin (PC) was reduced
with respect to the wild type. In the AB_opt strain, the PC peak was higher than in psaA,
although it was still lower than in WT. Notably, the replacement mutant accumulated to a
certain extent also chlorophyll, thus confirming that the additional complexes observed in the
BN-PAGE were associated with the pigment. The markedly reduced Chl a/PC ratios
accounted for the blue colour of both mutant strains.
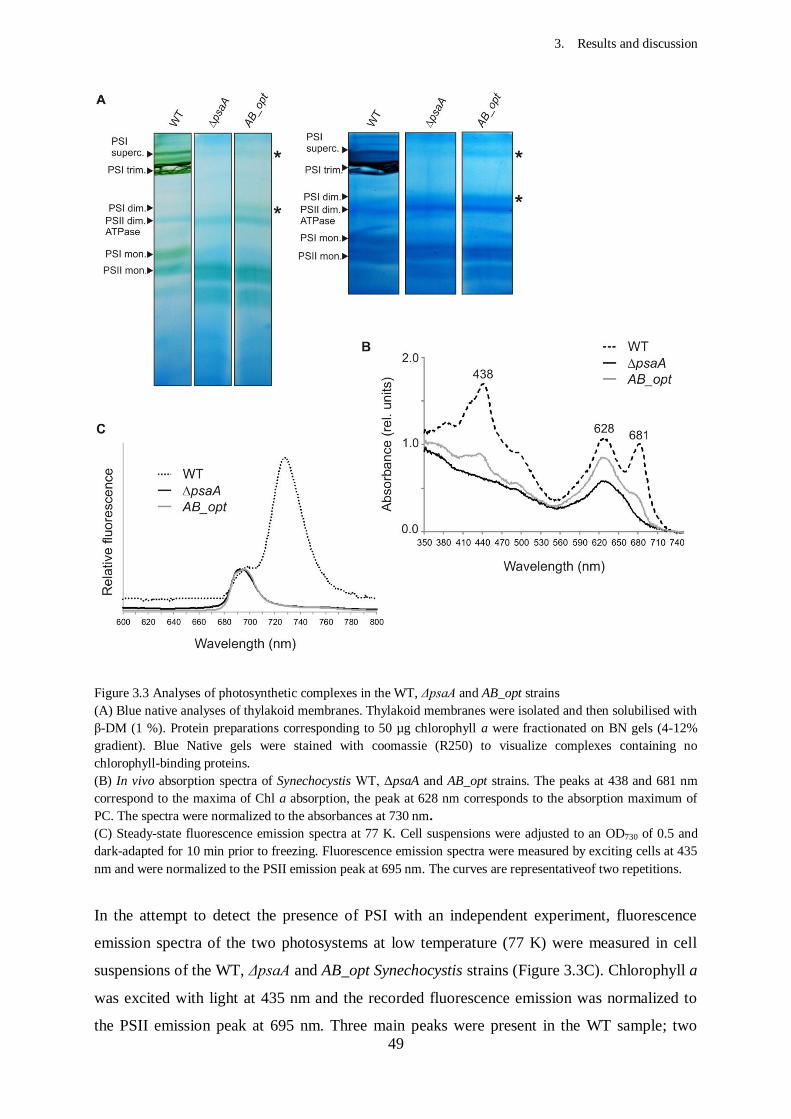
3. Results and discussion
49
Figure 3.3 Analyses of photosynthetic complexes in the WT, ΔpsaA and AB_opt strains (A) Blue native analyses of thylakoid membranes. Thylakoid membranes were isolated and then solubilised with
β-DM (1 %). Protein preparations corresponding to 50 µg chlorophyll a were fractionated on BN gels (4-12%
gradient). Blue Native gels were stained with coomassie (R250) to visualize complexes containing no
chlorophyll-binding proteins.
(B) In vivo absorption spectra of Synechocystis WT, ΔpsaA and AB_opt strains. The peaks at 438 and 681 nm
correspond to the maxima of Chl a absorption, the peak at 628 nm corresponds to the absorption maximum of
PC. The spectra were normalized to the absorbances at 730 nm.
(C) Steady-state fluorescence emission spectra at 77 K. Cell suspensions were adjusted to an OD730 of 0.5 and
dark-adapted for 10 min prior to freezing. Fluorescence emission spectra were measured by exciting cells at 435
nm and were normalized to the PSII emission peak at 695 nm. The curves are representativeof two repetitions.
In the attempt to detect the presence of PSI with an independent experiment, fluorescence
emission spectra of the two photosystems at low temperature (77 K) were measured in cell
suspensions of the WT, ΔpsaA and AB_opt Synechocystis strains (Figure 3.3C). Chlorophyll a
was excited with light at 435 nm and the recorded fluorescence emission was normalized to
the PSII emission peak at 695 nm. Three main peaks were present in the WT sample; two
3. Results and discussion
50
originating from PSII, at 685 and 695 nm, and one at 725 nm which corresponds to PSI
(Murakami, 1997). As expected, PSI fluorescence at 725 nm was higher than PSII
fluorescence at 695 nm, because the PSI/PSII ratio varies from about 1 to almost 4 in
Synechocystis depending on the growth light conditions. Despite the observed differences in
their photosynthetic complex composition (Figure 3.3A), the psaA and AB_opt mutants
showed comparable fluorescence emission spectra. Both displayed the 685 and 695 nm
emission peaks deriving from the PSII-associated chlorophyll a molecules but no PSI
fluorescence emission could be observed. Based on the absence of PSI fluorescence emission,
the Synechocystis AB_opt mutants appear not to accumulate any functional PSI reaction
centre.
3.1.3. Discussion: Arabidopsis PsaA and PsaB can partially complement the function of the
Synechocystis homologs
Among the two photosystems characterizing all the photo-oxygenic organisms, PSI is more
conserved between cyanobacteria and higher plants. PSI is responsible of transferring
electrons from plastocyanin, located on the luminal side of thylakoids, to ferredoxin on the
stromal side. Although core components and structures of the cyanobacterial and chloroplast
PSI complexes are similar, some differences exist between them. In cyanobacteria, PSI is
normally trimeric and each monomer consists of 12 protein subunits, whereas that of plants is
composed of at least 15 subunits and mainly exists as a monomer associated with thylakoid-
embedded light-harvesting proteins. Four out of 15 subunits (PsaG, PsaH, PsaN and PsaO) are
newly evolved in chloroplasts, whereas one cyanobacterial subunit (PsaM) was lost in higher
plants. PSI complex assembly is only poorly understood presumably because assembly
intermediates cannot be readily identified. In recent years, forward and reverse genetic
approaches provided a starting point for the study of PSI assembly, but the analysis of
mutants with impaired accumulation of the complex is difficult in plants, where a complete
PSI depletion is lethal. This aspect could be responsible for the failure to identify fundamental
regulatory proteins required for the assembly and function of PSI. For this reason, together
with the high homology level, photosystem I was chosen as the starting point to generate the
Synechocystis platform having the photosynthetic machinery replaced by that of the flowering
plant Arabidopsis thaliana.
As already reported in previous studies, knockout of the psaA and psaB genes prevents the
assembly of any functional PSI complex in Synechocystis. Although these mutants are PSI-
deficient, they can grow in Light Activated Heterotrophic Growth conditions, whereas the
3. Results and discussion
51
mutation is lethal in both photoautotrophic and mixotrophic conditions. Indeed, PSI depletion
was found to correlate with an extreme light sensitivity of the resulting mutants; this is
observed both in Anabaena variabilis ATCC 29413 (Mannan et al., 1991) and Synechocystis
sp. PCC 6803 (Smart et al., 1991; Smart and McIntosh, 1993). The same phenotype can be
observed in the ΔpsaA mutant generated in the present study, where the Syn psaA gene is
completely replaced by the nptI-sacB double selection cassette. This strain is characterized by
a turquoise-blue colour, since most of chlorophyll a is associated with PSI in cyanobacteria.
As expected, the psaA knockout causes a severe light sensitivity and the mutant’s inability to
grow in absence of glucose as energy supply.
The replacement of the Synechocystis psaA and psaB coding sequences with the optimized
homologs from Arabidopsis thaliana, in the generated AB_opt strain, results in a partial
rescue of the described phenotype, at least regarding the light sensitivity. Indeed, AB_opt cells
are capable of growing under both LAHG and mixotrophic conditions, even if their colour
still resembled that of ΔpsaA. The double replacement mutant is also able to grow
photoautotrophically, but with slower growth rates under mixotrophic conditions. The fact
that the mutant shows only partial complementation could not be traced back to a lack of
transcription, because both plant genes were proven to be transcribed (Figure 3.2A). At
psaA_opt and At psaB_opt transcripts accumulate in the mutant cells, with a wild type-like
processing pattern which consists of a 5 kb psaA-psaB transcript and of the mature 2.2 kb
transcripts, respectively.
Several attempts to express photosynthetic genes from higher plants in Synechocystis were
carried out in former studies. The psbA gene from Poa annua was introduced into a
Synechocystis mutant background strain missing all three psbA genes (psbA1/2/3). It could be
shown that the corresponding plant PSII core protein accumulated in the Synechocystis mutant
strain (Nixon et al., 1991). Instead, CP43 from spinach accumulated in cyanobacterial cells
only when fused with the C-terminus of the endogenous Synechocystis counterpart, which is
apparently necessary for its stability (Carpenter et al., 1993). In another study an Lhcb gene
from pea was introduced into Synechocystis but the protein did not accumulate, because it
was degraded (He et al., 1999). However, the full-length translated recombinant protein could
be detected in low amounts by pulse labelling experiments.
In this study it cannot be unambiguously determined if the plant PsaA and PsaB full-length
proteins are translated in AB_opt, because annotation of protein bands in in vivo pulse
labelling experiments (Figure 3.2B) was uncertain. Irrespectively of this, major changes in the
general translation profiles of the analyzed strains are present. When comparing equal steady-
3. Results and discussion
52
state amounts of thylakoid proteins, de novo synthesis is drastically reduced in the ΔpsaA
knockout with respect with wild type, whereas in the AB_opt replacement strain the overall
translational rate is partially increased, but lower than in WT. Therefore, although the
presence of the recombinant PsaA and PsaB proteins could not be demonstrated, several
phenotypic differences were observed after introducing the two plant genes in AB_opt which
cannot be explained by their gene transcription alone (Figure 3.1C). The extreme sensitivity to
photoinhibition of Synechocystis mutants depleted of PSI and of the associated chlorophylls
has been proposed to originate from their inability to efficiently quench the electrons coming
from PSII (Smart et al., 1991). Indeed, functional PSII and phycobilisome complexes
assemble in unmodified amounts in the PSI-less strains (Figure 3.3A), suggesting that
syntheses of these three complexes are independently regulated (Shen et al., 1993). Three
possible electron acceptors for PSII have been proposed to act in strains lacking PSI: i)
ferredoxin, which reduces NADP+ (Arnon et al., 1981) ii) cytochrome oxidase, via the Cyt b6f
complex, which is shared between photosynthesis and respiration in cyanobacteria (Sandmann
and Malkin, 1984) iii) or a hydrogenase, which would reduce H+ to hydrogen gas and has
been purified from cyanobacteria (Ewart and Smith, 1989). According to these findings, the
markedly reduced sensitivity to photoinhibiton of the AB_opt mutants (Figure 3.1C drop
test, growth in normal light) can be attributed to the presence of an electron acceptor for PSII
not present in Δpsa. In the thylakoids of the knockout strain, all various PSI complexes and
super complexes are completely missing, while the other complexes of the photosynthetic
machinery are still present. In the mutant expressing the Arabidopsis psaA-psaB genes, two
more complexes can in fact be detected in addition to those present in Δpsa. The greenish
appearance of these novel complexes suggests their association with chlorophyll molecules
and their sizes are comparable with those of the wild type PSI dimer and supercomplexes.
Despite these strong suggestions of the presence of some chimeric PSI complex, the generated
Synechocystis replacement mutant shows the same fluorescence emission spectrum as the
PSI-less strain. Absence of the PSI fluorescence emission signal indicates that the additional
thylakoid complex detected is not functional and reasons for this have to be investigated in
future experiments.
In cyanobacteria, the PSI biogenesis starts with the formation of the large, heterodimeric
PsaA/PsaB reaction centre. Subsequently, low molecular mass subunits are added to the core
scaffold, beginning with the extrinsic subunits of the stromal ridge (PsaC, PsaD, and PsaE),
which is involved in ferredoxin binding (Schöttler et al., 2011). Non-functionality of PSI
hybrids could be due to a poor structural interaction of the recombinant plant-type core with
3. Results and discussion
53
the low molecular mass cyanobacterial subunits, even if it has been shown that the 3D
conformation of the conserved PSI subunits is virtually identical in higher plants and
cyanobacteria (Amunts and Nelson, 2008). Either way, it is tempting to speculate that
introduction of the other 13 Arabidopsis subunits in the AB_opt Synechocystis mutant might
possibly lead to the accumulation of a functional plant-type PSI. In fact, a synthetic operon
encoding for the missing PSI mature plant proteins has already been constructed, to be
introduced into the replacement strain (data not shown). A remarkable feature of PSI complex
is that it contains an extremely high amount of non-protein components. Indeed, almost one
third of its total mass consists of different co-factors, such as chlorophylls, carotenoids,
phylloquinones and 4Fe-4S clusters. These co-factors are known to be fundamental for PSI
complex function, but also for its structural integrity. One explanation for PSI instability can
be that those co-factors are not properly associated with the apoproteins. The higher plant and
cyanobacterial PSI complexes show a high homology level also in the coordination sites for
the carriers of the electron transport chain chlorophylls and carotenes, that are conserved at
nearly identical positions and orientations (Amunts and Nelson, 2009). It can therefore be
almost certainly excluded that the observed lack of PSI function in the AB_opt Synechocystis
strain is caused by a defect in co-factors assembly. A more likely scenario is the lack of plant-
specific factors required for the PSI biogenesis in Synechocystis. In plants, indeed, gene
products have been identified by mutational analyses that may act as regulatory or scaffold
proteins in the assembly of PSI. The conserved chloroplast proteins Ycf3, Ycf4, and Pyg7-1
(Ycf37 in Synechocystis) - along with specific cyanobacterial proteins like BtpA and RubA -
appear to be involved in posttranslational steps of PSI assembly (Dühring et al., 2007).
Although these factors show a remarkable degree of sequence similarity in cyanobacteria and
chloroplasts, their inactivation has different consequences in the respective organisms (Chi et
al., 2012). Therefore, the lack of functionality of the tentative chimeric PSI accumulating in
the Synechocystis AB_opt strain might be due to the absence, in the host organism, of one or
more of the plant-specific forms of these factors. In order to investigate this, the first
necessary step is to determine the subunit composition of the complex indentified in the
AB_opt mutant that could be used as a genetic background to screen for proteins that are
needed for PSI functional assembly in Arabidopsis thaliana.
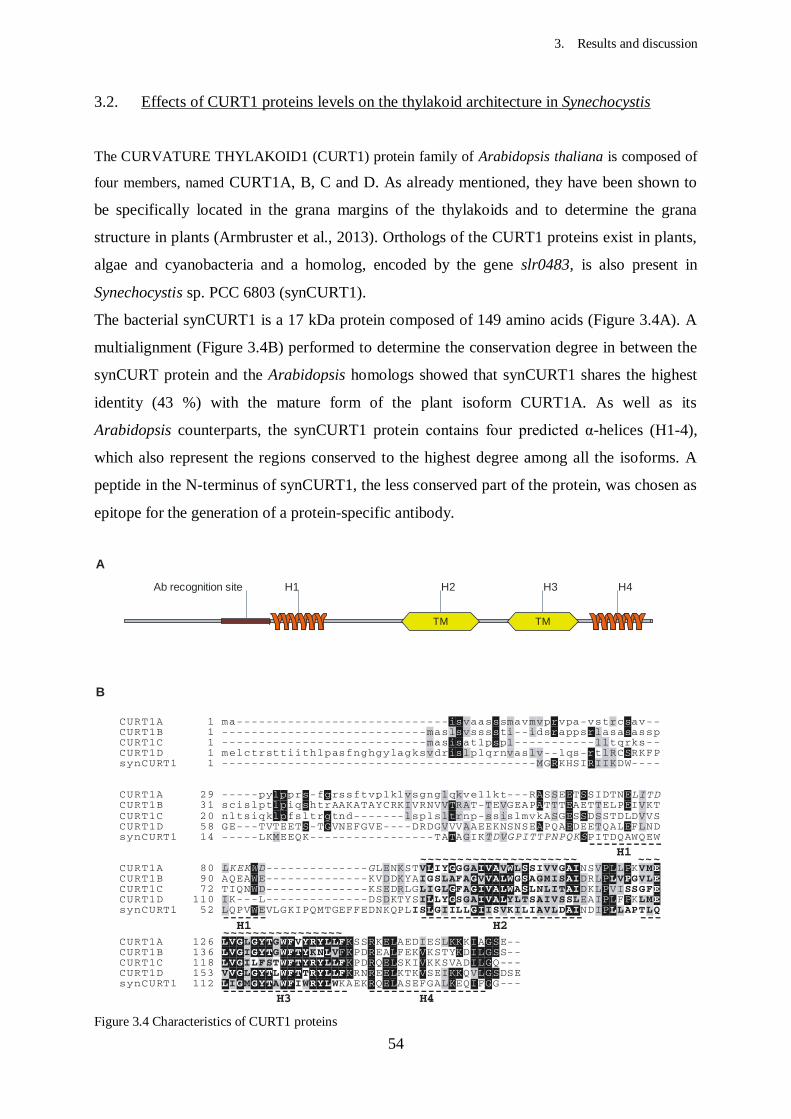
3. Results and discussion
54
3.2. Effects of CURT1 proteins levels on the thylakoid architecture in Synechocystis
The CURVATURE THYLAKOID1 (CURT1) protein family of Arabidopsis thaliana is composed of
four members, named CURT1A, B, C and D. As already mentioned, they have been shown to
be specifically located in the grana margins of the thylakoids and to determine the grana
structure in plants (Armbruster et al., 2013). Orthologs of the CURT1 proteins exist in plants,
algae and cyanobacteria and a homolog, encoded by the gene slr0483, is also present in
Synechocystis sp. PCC 6803 (synCURT1).
The bacterial synCURT1 is a 17 kDa protein composed of 149 amino acids (Figure 3.4A). A
multialignment (Figure 3.4B) performed to determine the conservation degree in between the
synCURT protein and the Arabidopsis homologs showed that synCURT1 shares the highest
identity (43 %) with the mature form of the plant isoform CURT1A. As well as its
Arabidopsis counterparts, the synCURT1 protein contains four predicted α-helices (H1-4),
which also represent the regions conserved to the highest degree among all the isoforms. A
peptide in the N-terminus of synCURT1, the less conserved part of the protein, was chosen as
epitope for the generation of a protein-specific antibody.
CURT1A 1 ma-----------------------------isvaasssmavmvprvpa-vstrcsav--CURT1B 1 ----------------------------maslsvssssti--idsrappsrlasasasspCURT1C 1 ----------------------------masisatlpspl-----------lltqrks--CURT1D 1 melctrsttiithlpasfnghgylagksvdrislplqrnvaslv--lqs-rtlRCSRKFPsynCURT1 1 -------------------------------------------MGRKHSIRIIKDW----
CURT1A 29 -----pylpprs-fgrssftvplklvsgnglqkvellkt---RASSEETSSIDTNELITDCURT1B 31 scislptlpiqshtrAAKATAYCRKIVRNVVTRAT-TEVGEAPATTTEAETTELPEIVKT
CURT1C 20 nltsiqklpfsltrgtnd-------lsplsltrnp-ssislmvkASGESSDSSTDLDVVSCURT1D 58 GE---TVTEETS-TGVNEFGVE----DRDGVVVAAEEKNSNSEAPQAEDEETQALEFLNDsynCURT1 14 -----LKMEEQK-----------------TATAGIKTDVGPITTPNPQKSPITDQAWQEW
CURT1A 80 LKEKWD--------------GLENKSTVLIYGGGAIVAVWLSSIVVGAINSVPLLPKVMECURT1B 90 AQEAWE--------------KVDDKYAIGSLAFAGVVALWGSAGMISAIDRLPLVPGVLECURT1C 72 TIQNWD--------------KSEDRLGLIGLGFAGIVALWASLNLITAIDKLPVISSGFECURT1D 110 IK---L--------------DSDKTYSILLYGSGAIVALYLTSAIVSSLEAIPLFPKLMEsynCURT1 52 LQPVWEVLGKIPQMTGEFFEDNKQPLISLGIILLGIISVKILIAVLDAINDIPLLAPTLQ
CURT1A 126 LVGLGYTGWFVYRYLLFKSSRKELAEDIESLKKKIAGSE--CURT1B 136 LVGIGYTGWFTYKNLVFKPDREALFEKVKSTYKDILGSS--CURT1C 118 LVGILFSTWFTYRYLLFKPDRQELSKIVKKSVADILGQ---CURT1D 153 VVGLGYTLWFTTRYLLFKRNREELKTKVSEIKKQVLGSDSEsynCURT1 112 LIGMGYTAWFIWRYLWKAEKRQELASEFGALKEQIFGG---
----------
------ ---------------------- ---
----------------- ----------------
H1
H2H1
H3 H4
~~~~~~ ~~~~~~ ~ ~~~~~~ ~~
~~~~~~ ~~~~~~~ ~~~
~ ~~
PPP4 Synechocystis
149 aa
H3H2Ab recognition site H1 H4
TMTM
A
B
Figure 3.4 Characteristics of CURT1 proteins
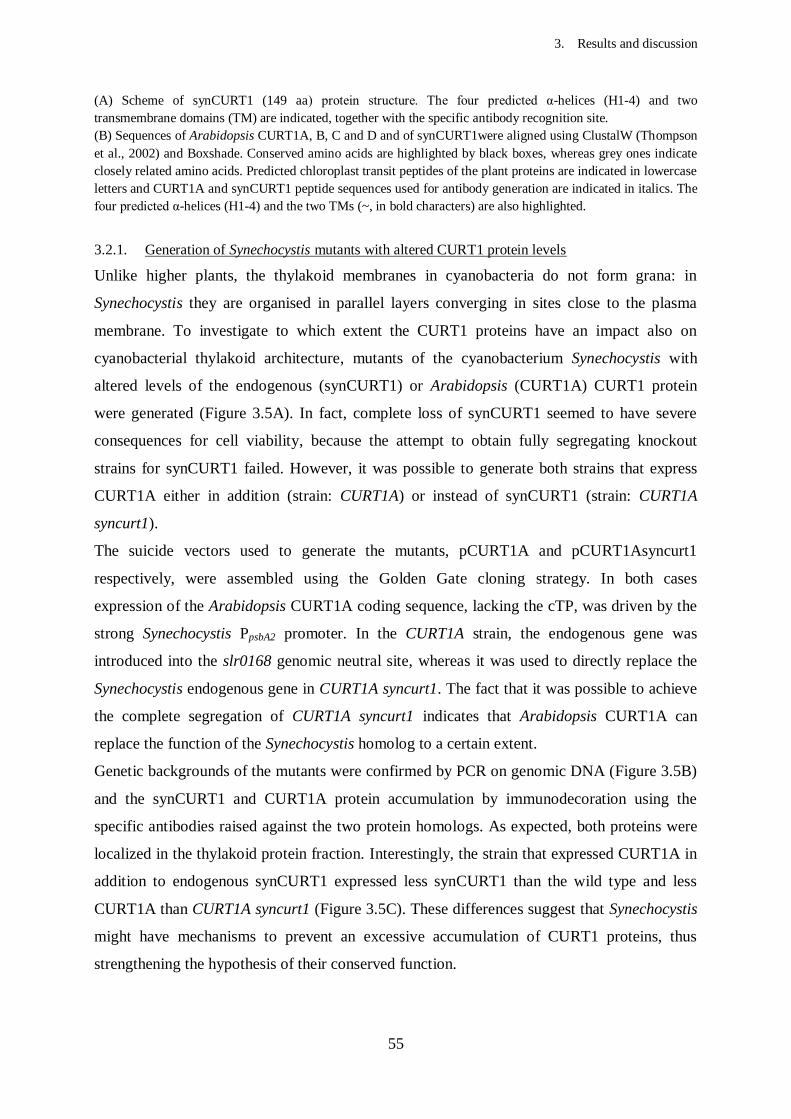
3. Results and discussion
55
(A) Scheme of synCURT1 (149 aa) protein structure. The four predicted α-helices (H1-4) and two
transmembrane domains (TM) are indicated, together with the specific antibody recognition site.
(B) Sequences of Arabidopsis CURT1A, B, C and D and of synCURT1were aligned using ClustalW (Thompson
et al., 2002) and Boxshade. Conserved amino acids are highlighted by black boxes, whereas grey ones indicate
closely related amino acids. Predicted chloroplast transit peptides of the plant proteins are indicated in lowercase
letters and CURT1A and synCURT1 peptide sequences used for antibody generation are indicated in italics. The
four predicted α-helices (H1-4) and the two TMs (~, in bold characters) are also highlighted.
3.2.1. Generation of Synechocystis mutants with altered CURT1 protein levels
Unlike higher plants, the thylakoid membranes in cyanobacteria do not form grana: in
Synechocystis they are organised in parallel layers converging in sites close to the plasma
membrane. To investigate to which extent the CURT1 proteins have an impact also on
cyanobacterial thylakoid architecture, mutants of the cyanobacterium Synechocystis with
altered levels of the endogenous (synCURT1) or Arabidopsis (CURT1A) CURT1 protein
were generated (Figure 3.5A). In fact, complete loss of synCURT1 seemed to have severe
consequences for cell viability, because the attempt to obtain fully segregating knockout
strains for synCURT1 failed. However, it was possible to generate both strains that express
CURT1A either in addition (strain: CURT1A) or instead of synCURT1 (strain: CURT1A
syncurt1).
The suicide vectors used to generate the mutants, pCURT1A and pCURT1Asyncurt1
respectively, were assembled using the Golden Gate cloning strategy. In both cases
expression of the Arabidopsis CURT1A coding sequence, lacking the cTP, was driven by the
strong Synechocystis PpsbA2 promoter. In the CURT1A strain, the endogenous gene was
introduced into the slr0168 genomic neutral site, whereas it was used to directly replace the
Synechocystis endogenous gene in CURT1A syncurt1. The fact that it was possible to achieve
the complete segregation of CURT1A syncurt1 indicates that Arabidopsis CURT1A can
replace the function of the Synechocystis homolog to a certain extent.
Genetic backgrounds of the mutants were confirmed by PCR on genomic DNA (Figure 3.5B)
and the synCURT1 and CURT1A protein accumulation by immunodecoration using the
specific antibodies raised against the two protein homologs. As expected, both proteins were
localized in the thylakoid protein fraction. Interestingly, the strain that expressed CURT1A in
addition to endogenous synCURT1 expressed less synCURT1 than the wild type and less
CURT1A than CURT1A syncurt1 (Figure 3.5C). These differences suggest that Synechocystis
might have mechanisms to prevent an excessive accumulation of CURT1 proteins, thus
strengthening the hypothesis of their conserved function.
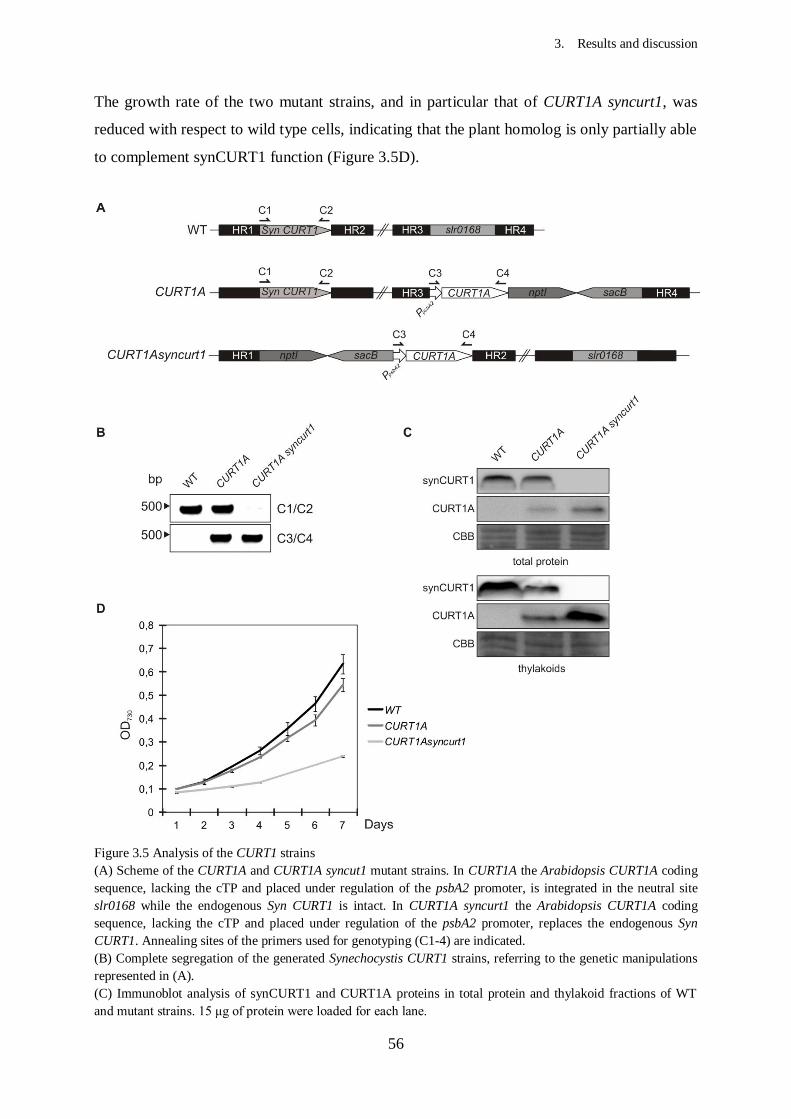
3. Results and discussion
56
The growth rate of the two mutant strains, and in particular that of CURT1A syncurt1, was
reduced with respect to wild type cells, indicating that the plant homolog is only partially able
to complement synCURT1 function (Figure 3.5D).
Figure 3.5 Analysis of the CURT1 strains (A) Scheme of the CURT1A and CURT1A syncut1 mutant strains. In CURT1A the Arabidopsis CURT1A coding
sequence, lacking the cTP and placed under regulation of the psbA2 promoter, is integrated in the neutral site
slr0168 while the endogenous Syn CURT1 is intact. In CURT1A syncurt1 the Arabidopsis CURT1A coding
sequence, lacking the cTP and placed under regulation of the psbA2 promoter, replaces the endogenous Syn
CURT1. Annealing sites of the primers used for genotyping (C1-4) are indicated. (B) Complete segregation of the generated Synechocystis CURT1 strains, referring to the genetic manipulations
represented in (A). (C) Immunoblot analysis of synCURT1 and CURT1A proteins in total protein and thylakoid fractions of WT
and mutant strains. 15 μg of protein were loaded for each lane.
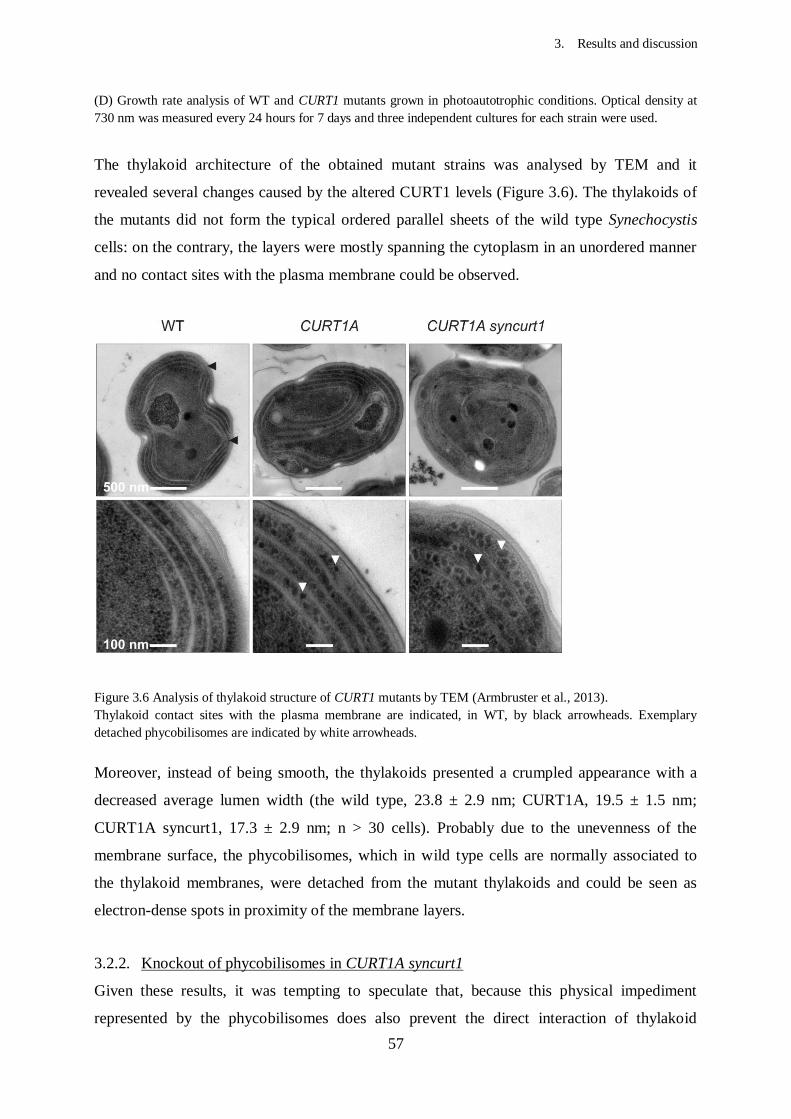
3. Results and discussion
57
(D) Growth rate analysis of WT and CURT1 mutants grown in photoautotrophic conditions. Optical density at
730 nm was measured every 24 hours for 7 days and three independent cultures for each strain were used.
The thylakoid architecture of the obtained mutant strains was analysed by TEM and it
revealed several changes caused by the altered CURT1 levels (Figure 3.6). The thylakoids of
the mutants did not form the typical ordered parallel sheets of the wild type Synechocystis
cells: on the contrary, the layers were mostly spanning the cytoplasm in an unordered manner
and no contact sites with the plasma membrane could be observed.
Figure 3.6 Analysis of thylakoid structure of CURT1 mutants by TEM (Armbruster et al., 2013).
Thylakoid contact sites with the plasma membrane are indicated, in WT, by black arrowheads. Exemplary
detached phycobilisomes are indicated by white arrowheads.
Moreover, instead of being smooth, the thylakoids presented a crumpled appearance with a
decreased average lumen width (the wild type, 23.8 ± 2.9 nm; CURT1A, 19.5 ± 1.5 nm;
CURT1A syncurt1, 17.3 ± 2.9 nm; n > 30 cells). Probably due to the unevenness of the
membrane surface, the phycobilisomes, which in wild type cells are normally associated to
the thylakoid membranes, were detached from the mutant thylakoids and could be seen as
electron-dense spots in proximity of the membrane layers.
3.2.2. Knockout of phycobilisomes in CURT1A syncurt1
Given these results, it was tempting to speculate that, because this physical impediment
represented by the phycobilisomes does also prevent the direct interaction of thylakoid
3. Results and discussion
58
membranes, overexpression of CURT1 might actually succeed in inducing grana formation in
Synechocystis strains without phycobilisomes. To verify this hypothesis, mutants were
generated in which the allophycocyanin (AP) α and β subunits, the main protein components
of the phycobilisomes core discs, were knocked out. ApcA, apcB and apcC constitute a
tricistronic operon in Synechocystis and their interruption was shown to lead to
phycobilisome-deficient mutants lacking assembled antenna complexes (Ajlani et al., 1995).
To generate the phycobilisome knockout mutants Δapc and CURT1A syncurt1Δapc, WT and
CURT1A syncurt1 were transformed with the pSMapc vector (Figure 3.6A). Homologous
recombination between the vector and the genome led to the replacement of the entire apcA
and apcB coding sequences with the SpecR positive selection cassette. Complete segregation
of the obtained Δapc and CURT1A syncurt1Δapc mutants was confirmed by PCR on genomic
DNA (Figure 3.6B) and by immunoblot analysis of synCURT1, CURT1A and AP α and β
proteins (Figure 3.6C). As previously reported (Ajlani and Vernotte, 1998), both mutant
strains showed a greenish-olive colour and grew at a slower rate with respect to the wild type
and these phenotypical traits were even stronger in the CURT1A syncurt1 genotypical
background.
Figure 3.6 Analysis of the phycobilisome mutant strains (A) Scheme of the Δapc gene manipulation. The Synechocystis apcAB operon is replaced by the SpecR selection
cassette in apc. In CURT1A syncurt1apc, the apcAB knockout is in the CURT1A syncurt1 mutant background.
Annealing sites of the primers used for genotyping (C5-8) are indicated.
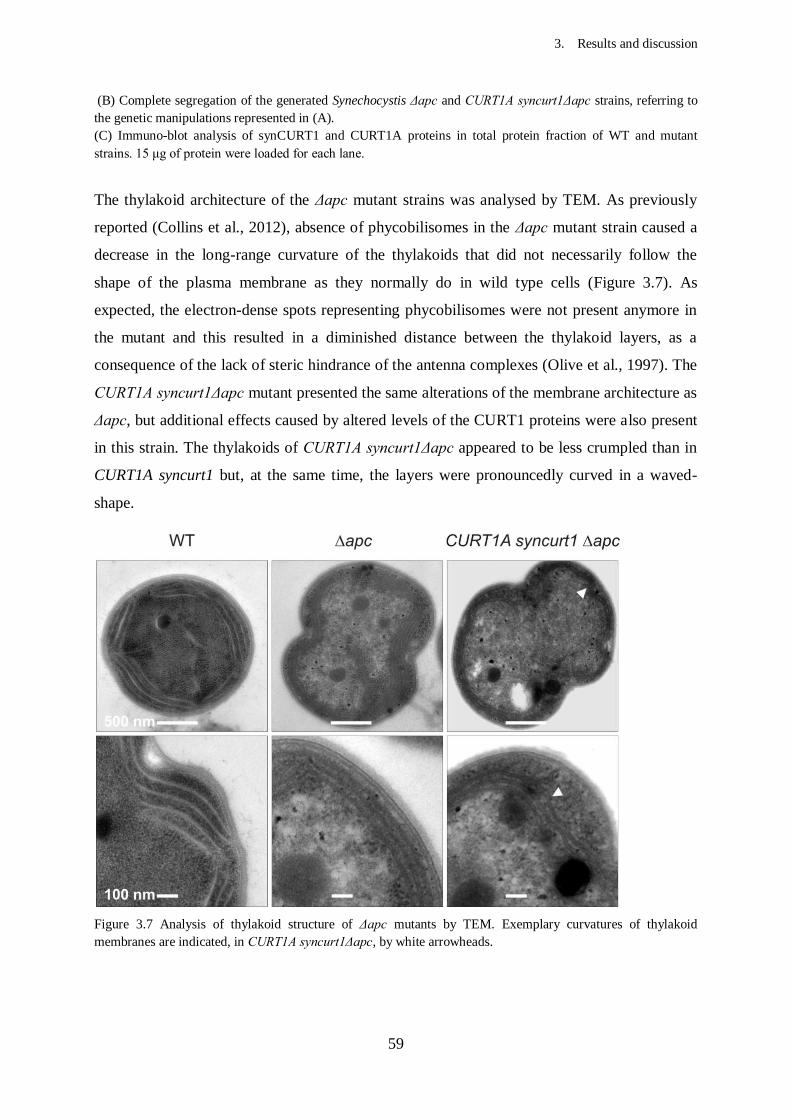
3. Results and discussion
59
(B) Complete segregation of the generated Synechocystis Δapc and CURT1A syncurt1Δapc strains, referring to
the genetic manipulations represented in (A). (C) Immuno-blot analysis of synCURT1 and CURT1A proteins in total protein fraction of WT and mutant
strains. 15 μg of protein were loaded for each lane.
The thylakoid architecture of the Δapc mutant strains was analysed by TEM. As previously
reported (Collins et al., 2012), absence of phycobilisomes in the Δapc mutant strain caused a
decrease in the long-range curvature of the thylakoids that did not necessarily follow the
shape of the plasma membrane as they normally do in wild type cells (Figure 3.7). As
expected, the electron-dense spots representing phycobilisomes were not present anymore in
the mutant and this resulted in a diminished distance between the thylakoid layers, as a
consequence of the lack of steric hindrance of the antenna complexes (Olive et al., 1997). The
CURT1A syncurt1Δapc mutant presented the same alterations of the membrane architecture as
Δapc, but additional effects caused by altered levels of the CURT1 proteins were also present
in this strain. The thylakoids of CURT1A syncurt1Δapc appeared to be less crumpled than in
CURT1A syncurt1 but, at the same time, the layers were pronouncedly curved in a waved-
shape.
Figure 3.7 Analysis of thylakoid structure of Δapc mutants by TEM. Exemplary curvatures of thylakoid
membranes are indicated, in CURT1A syncurt1Δapc, by white arrowheads.
3. Results and discussion
60
3.2.3. Discussion: Synechocystis and Arabidopsis CURT1 proteins have a conserved
function in determining the thylakoid architecture
Taken together, the results suggest that CURT1 proteins have also a role in determining the
architecture of thylakoid membranes in cyanobacteria, the evolutionary ancestors of plant
chloroplasts. Conservation of the protein function throughout evolution is also supported by
the fact that Arabidopsis CURT1A could partially replace Synechocystis CURT1.
Expression of Arabidopsis CURT1A in Synechocystis cells caused modifications in the
thylakoid structure, although it was not possible to unequivocally clarify, whether the reduced
levels of endogenous synCURT1 or the presence of the Arabidopsis protein itself were
responsible for them. In either case, the crumpled appearance of thylakoids in the analysed
mutants and the decrease in lumen width, determining an increased membrane curvature, led
to detachment of phycobilisomes.
When the steric hindrance of phycobilisomes was abolished in the CURT1A syncurt1Δapc
mutant thylakoid membranes resulted to be wave-shaped, with a smoother surface appearance
compared to the background genotype. Although no grana-like structures could be detected,
an increased membrane-bending ability could be observed when CURT1A was overexpressed
in replacement of synCURT1 in the absence of phycobilisomes.
To better dissect the effects on CURT1A accumulation in Synechocystis cells, comparisons
with the syncurt1 knockout mutant should be done, also regarding the phycobilisome
depletion.
3.3. Development of a single vector-based based strategy for marker-less gene replacement
in Synechocystis
3.3.1. Design of the strategy
In order to generate Synechocystis strains with one or all of the photosynthetic complexes
replaced by their higher plant counterparts, many gene manipulations would be needed. As
summarized in the introduction and shown in the previous experiments, marker-less gene
replacement can be the technique of choice to achieve such results. Irrespective of the
selection variant they rely on, marker-less gene replacement methods usually require the use
of two subsequent transformation events, each of them with a different vector.
In order to minimize cloning and transformation steps, an alternative strategy was developed
for marker-less gene replacement in Synechocystis, also using the nptI-sacB cartridge, in
which, although two subsequent genomic recombination events still occur, a single bacterial
3. Results and discussion
61
transformation event and a single vector are required (Viola et al., 2014). This is also the case
of double recombination strategies that rely on a first integration of the whole vector into the
target genomic sequence via single crossing-over, as in the case of allelic exchange (Lalioti
and Heath, 2001; Clerico et al., 2007). In this case, the second recombination, leading to the
excision of the integrated vector, generates two populations of bacteria, one that reverts to
wild type and one that keeps the desired mutation. Thus, screening of the population of the
second recombinants by PCR needs to be done. The strategy developed in this study
overcomes this step by leading to a final bacterial population exclusively composed of
mutants.
In this method, schematically depicted in Figure 3.8, two subsequent homologous
recombination events take place and two subsequent mutants, with knockout and replacement
of the target gene respectively, can be obtained by simply growing the transformed cells under
different selective conditions in a stepwise manner, without the need of a second
transformation. The first recombination event leads to the integration of the construct,
containing the DNA sequence to be introduced interrupted by the selection marker, into the
cyanobacterial genome via double crossing-over; the second recombination, a single crossing-
over, takes place in between direct repeats present in the integrated construct itself and causes
excision of the double selection cassette and reconstitution of the introduced DNA sequence.
In this way two subsequent mutants, with knockout and replacement of the target gene
respectively, can be obtained by simply growing the transformed cells under different
selective conditions in a stepwise manner. A double-recombination vector suited for this
strategy includes several essential elements: (1) a replication origin for E. coli that is not
functional in Synechocystis; (2) flanking sequences homologous to Synechocystis
chromosomal sites to allow stable integration of the construct in the target genome
(designated as HR1 and HR2); (3) the nptI-sacB double selection cassette, separating the two
portions of the sequence to be integrated, that allow both positive and negative selection of
the Synechocystis recombinants; (4) the exogenous gene of interest (GOI) to introduce, split in
two partially overlapping (shaded box) segments divided by the nptI-sacB cassette; (5) a
Synechocystis endogenous promoter to induce the expression of the introduced recombinant
gene(s).
When Synechocystis cells are transformed with such a vector, the initial recombination event
leads to the integration of the construct, containing the exogenous gene(s) to be introduced
interrupted by the nptI-sacB cassette, into the cyanobacterial genome (Figure 1, upper panel)
via double crossing-over between the two flanks of the construct, HR1 and HR2, and the

3. Results and discussion
62
corresponding homologous sequences present in the cyanobacterial genome. Strains that have
integrated the construct in this way contain the nptI-sacB cassette in the target locus and
therefore can grow in the presence of kanamycin, which is used for their positive selection,
but are sensitive to sucrose. Complete segregation of the first-round [“prim(ary)”]
recombinants leads to loss of the endogenous target gene and, moreover, the integrated GOI is
not functional because the nptI-sacB cassette interrupts its sequence.
Figure 3.8 Schematic depiction of the single-step double recombination strategy (Viola et al., 2014). The first
recombination step (upper panel), involving a double crossover between the homologous regions HR1 and HR2
of the vector and the genomic target sequence, leads to genomic integration of the construct. Note that the
integrated gene of interest (GOI) is split into two parts, 5’ and 3’, the sequences of which partially overlap
(shaded box). The 5’ and 3’ GOI segments are separated from each other by the nptI-sacB selection cassette,
which renders the first recombinant mutants resistant to kanamycin and sensitive to sucrose. After complete
segregation of the replacement under positive selection in the presence of kanamycin, which ensures the total
elimination of the endogenous target gene function, release of the selective pressure allows the second
recombination to take place (lower panel). In this step, a crossover involving the overlapping regions of the split
GOI leads to the excision of the nptI-sacB cassette. Negative selection on sucrose yields colonies that have lost
the entire sacB marker and carry the intact, functional GOI in place of the endogenous target gene.
3. Results and discussion
63
After complete segregation, the positive selective pressure is released and the mutants are
grown without selection in order to allow the second recombination event to occur (Figure 1,
lower panel), without any transformation step being required. The second recombination
event takes place via a single crossing-over in between direct internal repeated sequences
present in the integrated construct itself and causes excision of the double selection cassette,
restoring the integrity of the introduced gene(s). Mutants in which the second recombination
is incomplete can be efficiently counter-selected on sucrose, because only those recombinants
that have lost the whole nptI-sacB cassette will survive. As a consequence, in the population
generated by the second round of recombination [“sec(ondary) recombinants”], the target
gene is replaced by the transgenic DNA of choice and no selection marker remains in the
genome.
3.3.2. Confirmation of the strategy: introduction of the luciferase reporter system
To test the efficacy of the one-step double recombination strategy, glucose-tolerant WT
Synechocystis cells were transformed with the vector pDSlux (Figure 3.9A). The mutants
obtained after the first round of recombination, luxprim
, harboured an interrupted luxAB operon
inserted in the Synechocystis slr0168 ORF. This dicistronic operon is composed of the luxA
and luxB genes, and encodes the heterodimeric luciferase enzyme which, in presence of its
substrate analogue decanal, produces a luminescent product. In the mutants obtained after the
second recombination round, named luxsec
, excision of the double selection cassette led to the
reconstitution of the intact luxAB operon under the control of PpsbA2.
The frequencies of the first and second recombination events were calculated for the lux
mutants. Ten independent luxprim
strains obtained after the first recombination were selected
and allowed to undergo a second recombination.
Table 3.1 Frequency of the second recombination event in independent luxprim strains
#1 #2 #3 #4 #5 #6 #7 #8 #9 #10
luxsec 7x10
-6 5x10⁻⁷ 7x10
-6 4x10⁻⁶ 7x10
-6 1x10⁻⁷ 2x10
-6 2x10⁻⁵ 2x10
-5 2x10⁻⁵
The transformation frequency was 4x10⁻⁵
, which is comparable to the values reported in
literature (Zang et al., 2007). The frequency of the second recombination varied between
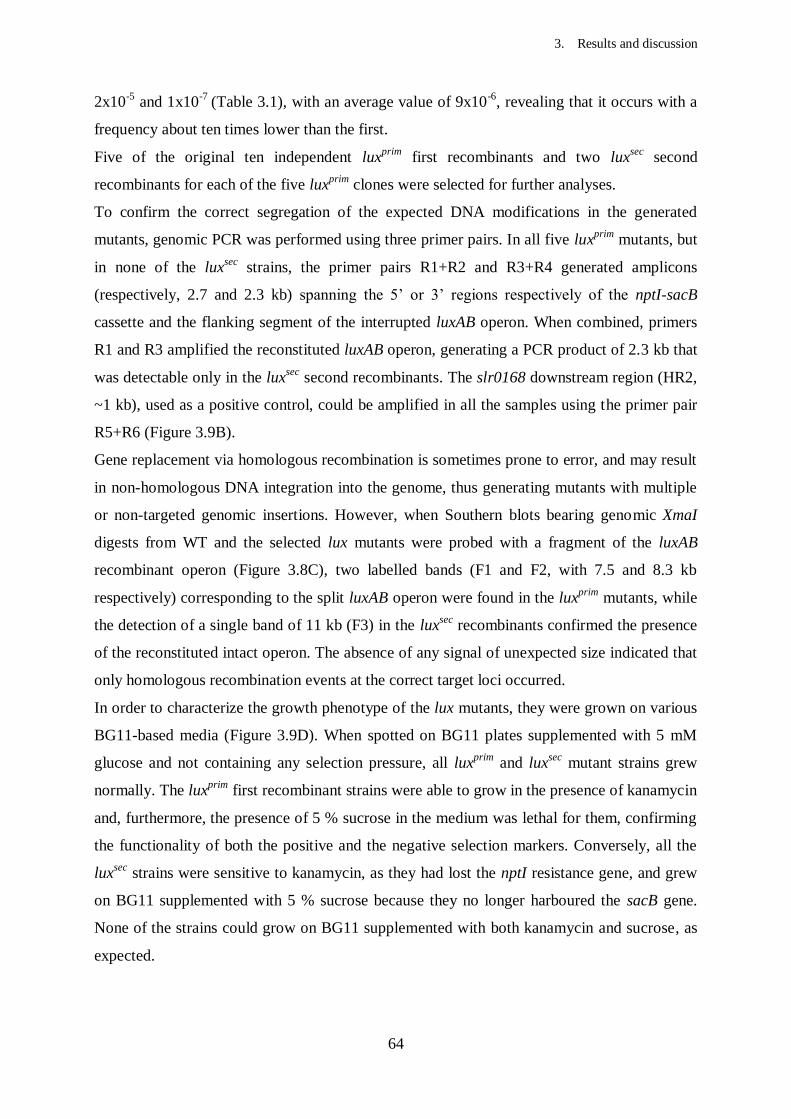
3. Results and discussion
64
2x10⁻⁵
and 1x10⁻⁷
(Table 3.1), with an average value of 9x10⁻⁶
, revealing that it occurs with a
frequency about ten times lower than the first.
Five of the original ten independent luxprim
first recombinants and two luxsec
second
recombinants for each of the five luxprim
clones were selected for further analyses.
To confirm the correct segregation of the expected DNA modifications in the generated
mutants, genomic PCR was performed using three primer pairs. In all five luxprim
mutants, but
in none of the luxsec
strains, the primer pairs R1+R2 and R3+R4 generated amplicons
(respectively, 2.7 and 2.3 kb) spanning the 5’ or 3’ regions respectively of the nptI-sacB
cassette and the flanking segment of the interrupted luxAB operon. When combined, primers
R1 and R3 amplified the reconstituted luxAB operon, generating a PCR product of 2.3 kb that
was detectable only in the luxsec
second recombinants. The slr0168 downstream region (HR2,
~1 kb), used as a positive control, could be amplified in all the samples using the primer pair
R5+R6 (Figure 3.9B).
Gene replacement via homologous recombination is sometimes prone to error, and may result
in non-homologous DNA integration into the genome, thus generating mutants with multiple
or non-targeted genomic insertions. However, when Southern blots bearing genomic XmaI
digests from WT and the selected lux mutants were probed with a fragment of the luxAB
recombinant operon (Figure 3.8C), two labelled bands (F1 and F2, with 7.5 and 8.3 kb
respectively) corresponding to the split luxAB operon were found in the luxprim
mutants, while
the detection of a single band of 11 kb (F3) in the luxsec
recombinants confirmed the presence
of the reconstituted intact operon. The absence of any signal of unexpected size indicated that
only homologous recombination events at the correct target loci occurred.
In order to characterize the growth phenotype of the lux mutants, they were grown on various
BG11-based media (Figure 3.9D). When spotted on BG11 plates supplemented with 5 mM
glucose and not containing any selection pressure, all luxprim
and luxsec
mutant strains grew
normally. The luxprim
first recombinant strains were able to grow in the presence of kanamycin
and, furthermore, the presence of 5 % sucrose in the medium was lethal for them, confirming
the functionality of both the positive and the negative selection markers. Conversely, all the
luxsec
strains were sensitive to kanamycin, as they had lost the nptI resistance gene, and grew
on BG11 supplemented with 5 % sucrose because they no longer harboured the sacB gene.
None of the strains could grow on BG11 supplemented with both kanamycin and sucrose, as
expected.
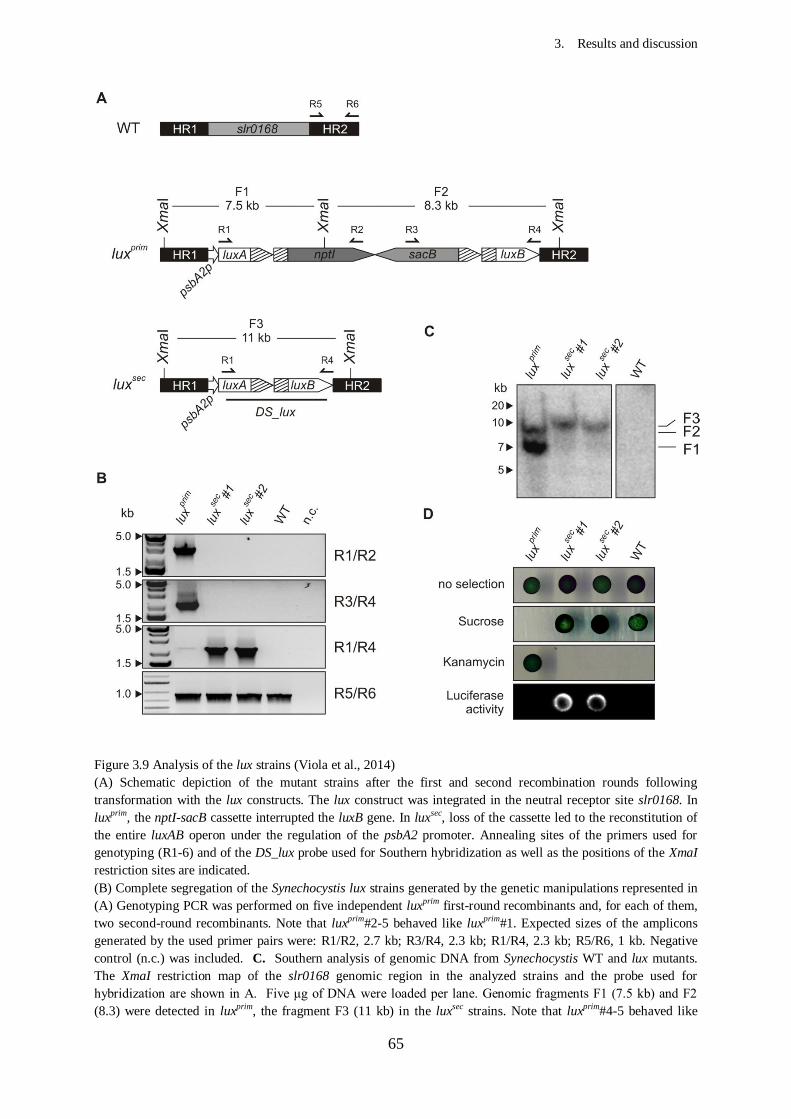
3. Results and discussion
65
Figure 3.9 Analysis of the lux strains (Viola et al., 2014) (A) Schematic depiction of the mutant strains after the first and second recombination rounds following
transformation with the lux constructs. The lux construct was integrated in the neutral receptor site slr0168. In
luxprim, the nptI-sacB cassette interrupted the luxB gene. In luxsec, loss of the cassette led to the reconstitution of
the entire luxAB operon under the regulation of the psbA2 promoter. Annealing sites of the primers used for
genotyping (R1-6) and of the DS_lux probe used for Southern hybridization as well as the positions of the XmaI
restriction sites are indicated. (B) Complete segregation of the Synechocystis lux strains generated by the genetic manipulations represented in
(A) Genotyping PCR was performed on five independent luxprim first-round recombinants and, for each of them,
two second-round recombinants. Note that luxprim#2-5 behaved like luxprim#1. Expected sizes of the amplicons
generated by the used primer pairs were: R1/R2, 2.7 kb; R3/R4, 2.3 kb; R1/R4, 2.3 kb; R5/R6, 1 kb. Negative
control (n.c.) was included. C. Southern analysis of genomic DNA from Synechocystis WT and lux mutants.
The XmaI restriction map of the slr0168 genomic region in the analyzed strains and the probe used for
hybridization are shown in A. Five μg of DNA were loaded per lane. Genomic fragments F1 (7.5 kb) and F2
(8.3) were detected in luxprim, the fragment F3 (11 kb) in the luxsec strains. Note that luxprim#4-5 behaved like
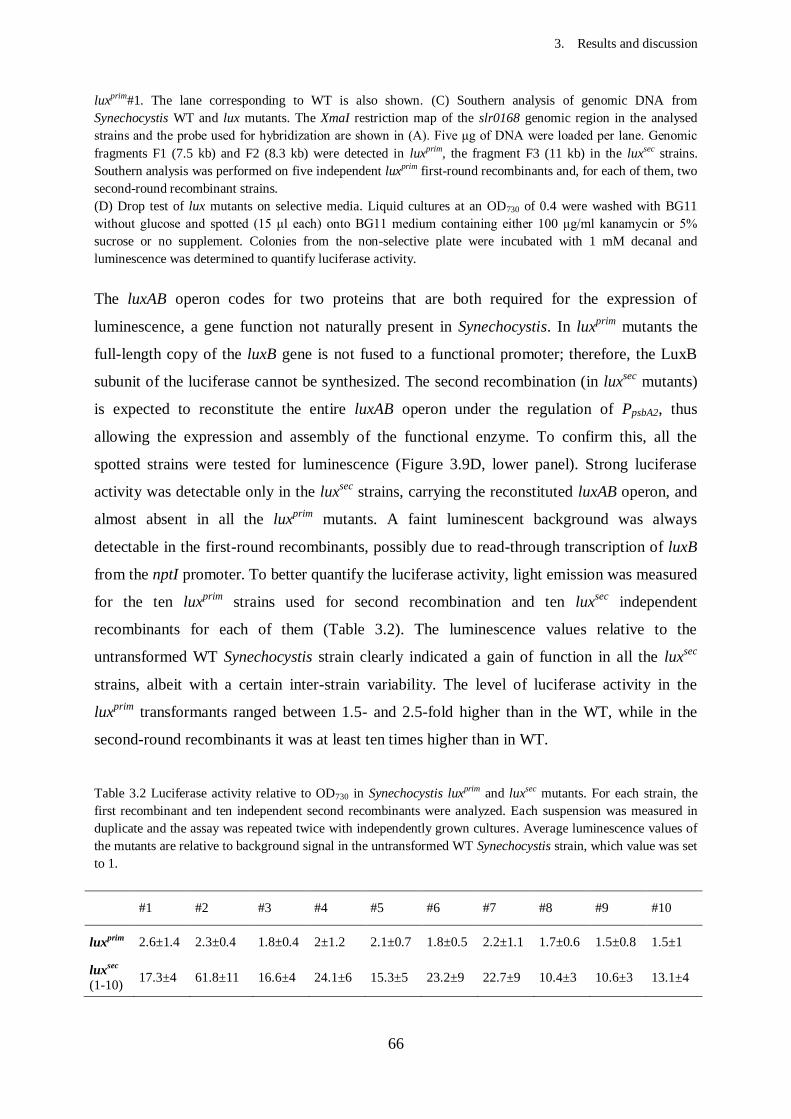
3. Results and discussion
66
luxprim#1. The lane corresponding to WT is also shown. (C) Southern analysis of genomic DNA from
Synechocystis WT and lux mutants. The XmaI restriction map of the slr0168 genomic region in the analysed
strains and the probe used for hybridization are shown in (A). Five μg of DNA were loaded per lane. Genomic
fragments F1 (7.5 kb) and F2 (8.3 kb) were detected in luxprim, the fragment F3 (11 kb) in the luxsec strains.
Southern analysis was performed on five independent luxprim first-round recombinants and, for each of them, two
second-round recombinant strains. (D) Drop test of lux mutants on selective media. Liquid cultures at an OD730 of 0.4 were washed with BG11
without glucose and spotted (15 μl each) onto BG11 medium containing either 100 μg/ml kanamycin or 5%
sucrose or no supplement. Colonies from the non-selective plate were incubated with 1 mM decanal and
luminescence was determined to quantify luciferase activity.
The luxAB operon codes for two proteins that are both required for the expression of
luminescence, a gene function not naturally present in Synechocystis. In luxprim
mutants the
full-length copy of the luxB gene is not fused to a functional promoter; therefore, the LuxB
subunit of the luciferase cannot be synthesized. The second recombination (in luxsec
mutants)
is expected to reconstitute the entire luxAB operon under the regulation of PpsbA2, thus
allowing the expression and assembly of the functional enzyme. To confirm this, all the
spotted strains were tested for luminescence (Figure 3.9D, lower panel). Strong luciferase
activity was detectable only in the luxsec
strains, carrying the reconstituted luxAB operon, and
almost absent in all the luxprim
mutants. A faint luminescent background was always
detectable in the first-round recombinants, possibly due to read-through transcription of luxB
from the nptI promoter. To better quantify the luciferase activity, light emission was measured
for the ten luxprim
strains used for second recombination and ten luxsec
independent
recombinants for each of them (Table 3.2). The luminescence values relative to the
untransformed WT Synechocystis strain clearly indicated a gain of function in all the luxsec
strains, albeit with a certain inter-strain variability. The level of luciferase activity in the
luxprim
transformants ranged between 1.5- and 2.5-fold higher than in the WT, while in the
second-round recombinants it was at least ten times higher than in WT.
Table 3.2 Luciferase activity relative to OD730 in Synechocystis luxprim and luxsec mutants. For each strain, the
first recombinant and ten independent second recombinants were analyzed. Each suspension was measured in
duplicate and the assay was repeated twice with independently grown cultures. Average luminescence values of
the mutants are relative to background signal in the untransformed WT Synechocystis strain, which value was set
to 1.
#1 #2 #3 #4 #5 #6 #7 #8 #9 #10
luxprim 2.6±1.4 2.3±0.4 1.8±0.4 2±1.2 2.1±0.7 1.8±0.5 2.2±1.1 1.7±0.6 1.5±0.8 1.5±1
luxsec
(1-10) 17.3±4 61.8±11 16.6±4 24.1±6 15.3±5 23.2±9 22.7±9 10.4±3 10.6±3 13.1±4
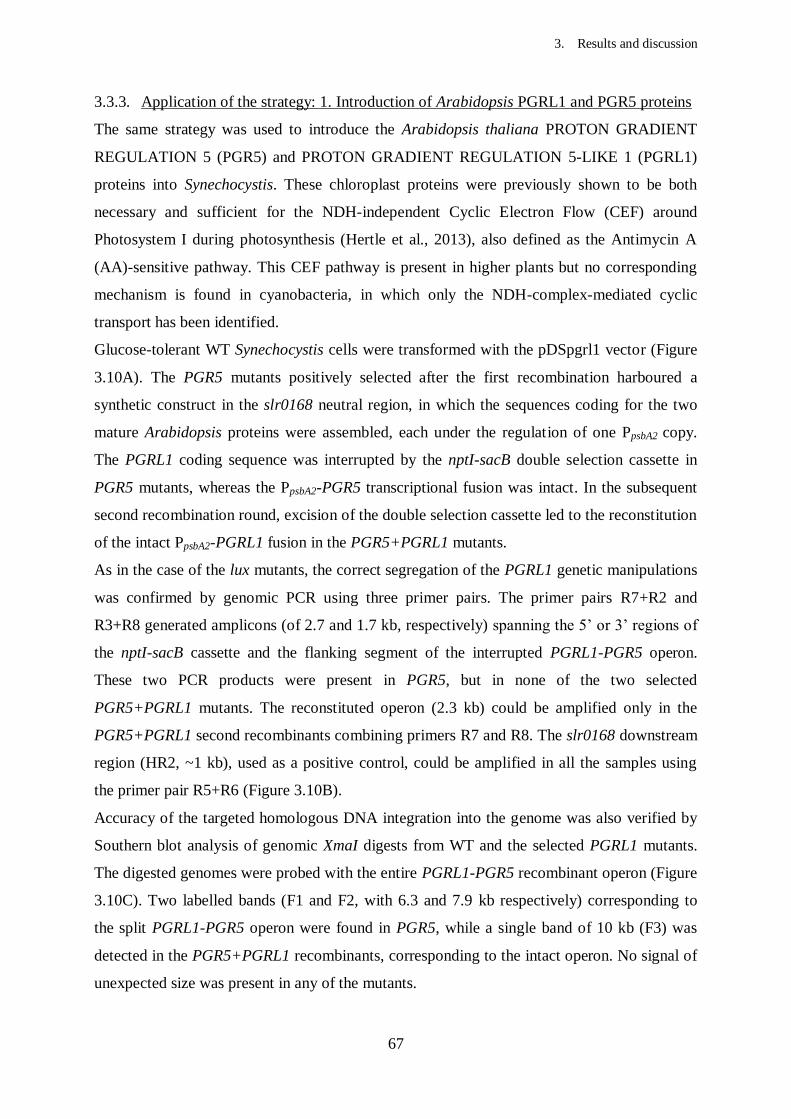
3. Results and discussion
67
3.3.3. Application of the strategy: 1. Introduction of Arabidopsis PGRL1 and PGR5 proteins
The same strategy was used to introduce the Arabidopsis thaliana PROTON GRADIENT
REGULATION 5 (PGR5) and PROTON GRADIENT REGULATION 5-LIKE 1 (PGRL1)
proteins into Synechocystis. These chloroplast proteins were previously shown to be both
necessary and sufficient for the NDH-independent Cyclic Electron Flow (CEF) around
Photosystem I during photosynthesis (Hertle et al., 2013), also defined as the Antimycin A
(AA)-sensitive pathway. This CEF pathway is present in higher plants but no corresponding
mechanism is found in cyanobacteria, in which only the NDH-complex-mediated cyclic
transport has been identified.
Glucose-tolerant WT Synechocystis cells were transformed with the pDSpgrl1 vector (Figure
3.10A). The PGR5 mutants positively selected after the first recombination harboured a
synthetic construct in the slr0168 neutral region, in which the sequences coding for the two
mature Arabidopsis proteins were assembled, each under the regulation of one PpsbA2 copy.
The PGRL1 coding sequence was interrupted by the nptI-sacB double selection cassette in
PGR5 mutants, whereas the PpsbA2-PGR5 transcriptional fusion was intact. In the subsequent
second recombination round, excision of the double selection cassette led to the reconstitution
of the intact PpsbA2-PGRL1 fusion in the PGR5+PGRL1 mutants.
As in the case of the lux mutants, the correct segregation of the PGRL1 genetic manipulations
was confirmed by genomic PCR using three primer pairs. The primer pairs R7+R2 and
R3+R8 generated amplicons (of 2.7 and 1.7 kb, respectively) spanning the 5’ or 3’ regions of
the nptI-sacB cassette and the flanking segment of the interrupted PGRL1-PGR5 operon.
These two PCR products were present in PGR5, but in none of the two selected
PGR5+PGRL1 mutants. The reconstituted operon (2.3 kb) could be amplified only in the
PGR5+PGRL1 second recombinants combining primers R7 and R8. The slr0168 downstream
region (HR2, ~1 kb), used as a positive control, could be amplified in all the samples using
the primer pair R5+R6 (Figure 3.10B).
Accuracy of the targeted homologous DNA integration into the genome was also verified by
Southern blot analysis of genomic XmaI digests from WT and the selected PGRL1 mutants.
The digested genomes were probed with the entire PGRL1-PGR5 recombinant operon (Figure
3.10C). Two labelled bands (F1 and F2, with 6.3 and 7.9 kb respectively) corresponding to
the split PGRL1-PGR5 operon were found in PGR5, while a single band of 10 kb (F3) was
detected in the PGR5+PGRL1 recombinants, corresponding to the intact operon. No signal of
unexpected size was present in any of the mutants.
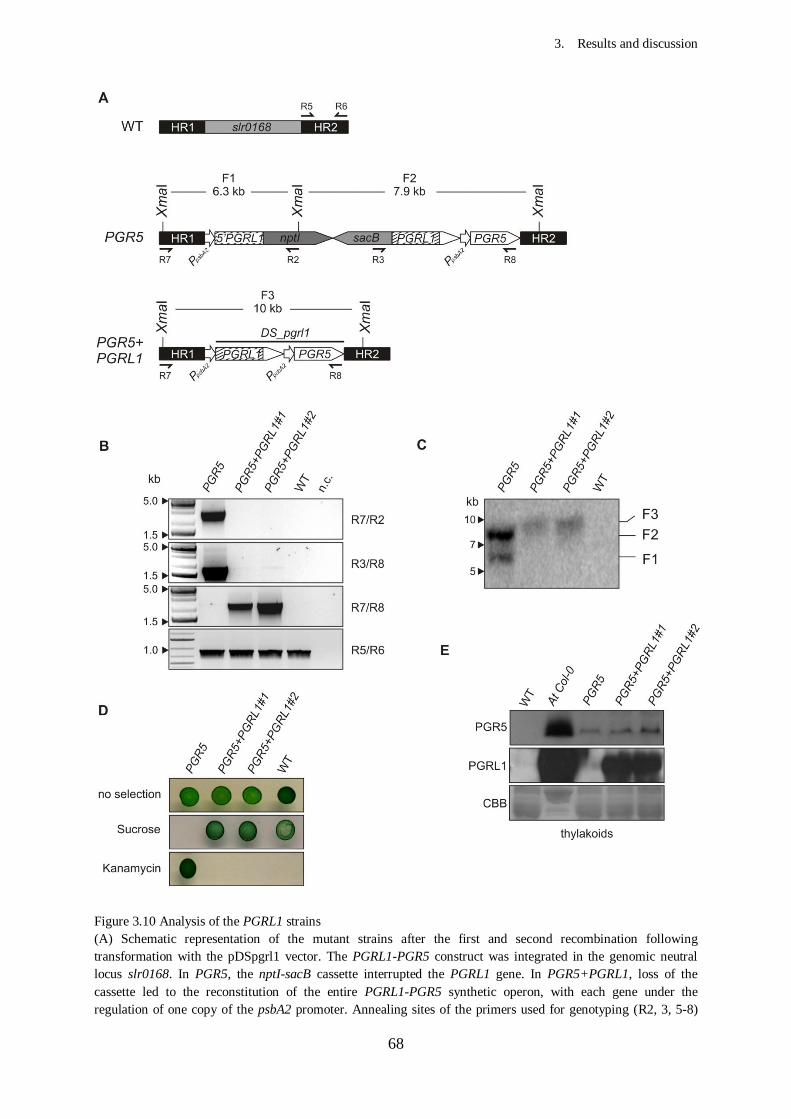
3. Results and discussion
68
Figure 3.10 Analysis of the PGRL1 strains (A) Schematic representation of the mutant strains after the first and second recombination following
transformation with the pDSpgrl1 vector. The PGRL1-PGR5 construct was integrated in the genomic neutral
locus slr0168. In PGR5, the nptI-sacB cassette interrupted the PGRL1 gene. In PGR5+PGRL1, loss of the
cassette led to the reconstitution of the entire PGRL1-PGR5 synthetic operon, with each gene under the
regulation of one copy of the psbA2 promoter. Annealing sites of the primers used for genotyping (R2, 3, 5-8)
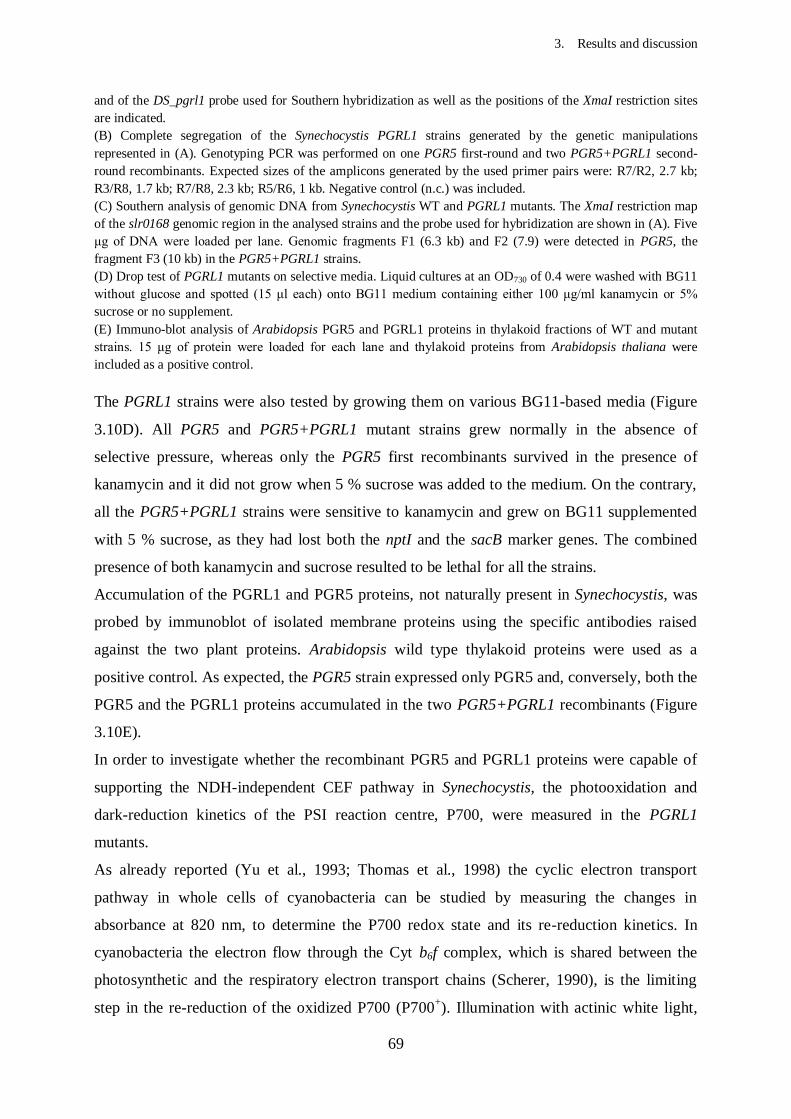
3. Results and discussion
69
and of the DS_pgrl1 probe used for Southern hybridization as well as the positions of the XmaI restriction sites
are indicated. (B) Complete segregation of the Synechocystis PGRL1 strains generated by the genetic manipulations
represented in (A). Genotyping PCR was performed on one PGR5 first-round and two PGR5+PGRL1 second-
round recombinants. Expected sizes of the amplicons generated by the used primer pairs were: R7/R2, 2.7 kb;
R3/R8, 1.7 kb; R7/R8, 2.3 kb; R5/R6, 1 kb. Negative control (n.c.) was included. (C) Southern analysis of genomic DNA from Synechocystis WT and PGRL1 mutants. The XmaI restriction map
of the slr0168 genomic region in the analysed strains and the probe used for hybridization are shown in (A). Five
μg of DNA were loaded per lane. Genomic fragments F1 (6.3 kb) and F2 (7.9) were detected in PGR5, the
fragment F3 (10 kb) in the PGR5+PGRL1 strains. (D) Drop test of PGRL1 mutants on selective media. Liquid cultures at an OD730 of 0.4 were washed with BG11
without glucose and spotted (15 μl each) onto BG11 medium containing either 100 μg/ml kanamycin or 5%
sucrose or no supplement. (E) Immuno-blot analysis of Arabidopsis PGR5 and PGRL1 proteins in thylakoid fractions of WT and mutant
strains. 15 μg of protein were loaded for each lane and thylakoid proteins from Arabidopsis thaliana were
included as a positive control.
The PGRL1 strains were also tested by growing them on various BG11-based media (Figure
3.10D). All PGR5 and PGR5+PGRL1 mutant strains grew normally in the absence of
selective pressure, whereas only the PGR5 first recombinants survived in the presence of
kanamycin and it did not grow when 5 % sucrose was added to the medium. On the contrary,
all the PGR5+PGRL1 strains were sensitive to kanamycin and grew on BG11 supplemented
with 5 % sucrose, as they had lost both the nptI and the sacB marker genes. The combined
presence of both kanamycin and sucrose resulted to be lethal for all the strains.
Accumulation of the PGRL1 and PGR5 proteins, not naturally present in Synechocystis, was
probed by immunoblot of isolated membrane proteins using the specific antibodies raised
against the two plant proteins. Arabidopsis wild type thylakoid proteins were used as a
positive control. As expected, the PGR5 strain expressed only PGR5 and, conversely, both the
PGR5 and the PGRL1 proteins accumulated in the two PGR5+PGRL1 recombinants (Figure
3.10E).
In order to investigate whether the recombinant PGR5 and PGRL1 proteins were capable of
supporting the NDH-independent CEF pathway in Synechocystis, the photooxidation and
dark-reduction kinetics of the PSI reaction centre, P700, were measured in the PGRL1
mutants.
As already reported (Yu et al., 1993; Thomas et al., 1998) the cyclic electron transport
pathway in whole cells of cyanobacteria can be studied by measuring the changes in
absorbance at 820 nm, to determine the P700 redox state and its re-reduction kinetics. In
cyanobacteria the electron flow through the Cyt b6f complex, which is shared between the
photosynthetic and the respiratory electron transport chains (Scherer, 1990), is the limiting
step in the re-reduction of the oxidized P700 (P700+). Illumination with actinic white light,
3. Results and discussion
70
exciting both PSII and PSI, causes the reduction of the plastoquinone pool and the depletion
of the proximal electron donor of PSI that gets oxidized. In subsequent darkness, P700+ gets
reduced by electrons coming from both the PSII-dependent linear electron flow and the NDH-
dependent cyclic electron flow.
Figure 3.11 Physiological characterization of the PGRL1 strains (A) and (B) P700 oxidation (P700 ox) traces of Synechocystis WT, PGR5 and PGR5+PGRL1 strains. The A820
was measured with a Dual-PAM-100 fluorometer, with and without addition of 25 μM DCMU or 25 μM
DBMIB. The traces are representative of two repetitions. Cell suspensions were adjusted to an OD730 (used as
indication of an equal amount of biomass) of 10 and dark-adapted for 10 min prior to measurements. Three
second after the onset of far red measuring light, white actinic light (30 µmol photons m-2 s-1) was supplied for 3
sec. The bars under each P700 trace represent the absence (dark bars) and presence (white bars) of actinic
illumination. The P700 oxidation signal is relative to the “zero” level at the onset of actinic illumination. In (A)
the P700 traces of the three analyzed strains for each inhibitor treatment are compared. The initial oxidation rate
is proportional to the efficiency with which excitation energy is delivered to P700. The re-reduction rate is
3. Results and discussion
71
proportional to the transfer to P700 of electrons deriving both from PSII and from the cyclic electron flow. A re-
reduction transient can be seen just after the onset of light when no inhibitors are added to the samples (black
arrow). In (B) the P700 traces of the three different inhibitor treatments for each analyzed strain are compared. (C) In vivo absorption spectra of Synechocystis WT, PGR5 and PGR5+PGRL1 strains. The peaks at 438 and 681
nm correspond to the maxima of Chl a absorption, the peak at 628 nm corresponds to the absorption maximum
of PC. The spectra were normalized to the absorbance at 730 nm.
(D) Steady-state fluorescence emission spectra at 77 K of cells of Synechocystis WT, PGR5 and PGR5+PGRL1
strains. Cell suspensions were adjusted to an OD730 of 0.5 and dark-adapted for 10 min prior to freezing.
Fluorescence emission spectra were measured with excitation at 435 nm and normalized to the PSII emission
peak at 695 nm. The curves are representative for two repetitions.
The different inputs of electrons to PSI can be selectively blocked using inhibitors (Maxwell
and Biggins, 1976; Herbert et al., 1992; Yu et al., 1993): input from PSII can be abolished
with the herbicide 3-(3,4-dichlorophenyl)-1,1-dimethylurea (DCMU), input from the
plastoquinone pool with the artificial quinone 2,5-dibromo-3-methyl-5-isopropyl-/7-
benzoquinone (DBMIB).
Absorbance at 820 nm in Synechocystis cell suspensions at an OD730 of 10, previously dark-
adapted for 10 min, was measured (Figure 3.11) and used as expression of the relative P700
oxidation level (P700+). In the wild type, exposure to white actinic light caused a rapid
oxidation of P700 which was then transiently re-reduced by electrons from PSII before
reaching the steady-state oxidation level (Figure 3.11A, black arrow). When illumination
ceased, the P700+ signal quickly fell back to the dark level thanks to electron input from PSII
and the CEF. In DCMU-treated WT cells the block of electron flow from PSII was testified
by the lack of the re-reduction transient after onset of illumination, the higher steady-state
level of the P700+ signal, as well as its slower re-reduction kinetics in the dark. These
observations were in accord with fact that, in presence of DCMU, CEF is the only pathway
responsible for the PSI reduction. WT treated with both DCMU and DBMIB showed an even
higher steady-state level of PSI oxidation. Indeed, DBMIB inhibits the electron transfer from
the plastoquinone pool to the cytochrome b6f complex, therefore blocking the flow of
electrons to PSI deriving from both the PSII and the CEF. In the untreated strain expressing
PGR5, and even more pronouncedly in those expressing both PGRL1 and PGR5, the P700+
signal was rising faster and to a higher level than in WT and the initial transient re-reduction
was greatly reduced. According to this, the electrons extracted from PSI by exciting light
appeared to be acquired by downstream acceptors in a more efficient way than in the wild
type, thus maintaining P700 in a more oxidized state.
In the PGR5 expressing strain, treatments with DCMU and with DCMU plus DBMIB led to
an increase of the P700+ steady-state level relative to the untreated samplesimilar to WT, but
to a lower extent, suggesting a reduction of the maximum PSI oxidation potential in the

3. Results and discussion
72
mutant strain. This reduction was even more marked in the mutant expressing both PGRL1
and PGR5. When comparing the P700 traces under the different treatments for each analyzed
genotype, a diminished difference between the steady-state and the maximal PSI oxidation
levels was observed in the PGR5 and, even more, in the PGR5+PGRL1 mutants (Figure
3.11B). To exclude that these differences were caused by altered amounts of PSI or pigments,
spectral analyses of PGR5 and PGR5+PGRL1 were performed. Neither the absorption spectra
nor the low-temperature fluorescence emission spectra of the mutants showed significant
differences with respect to the wild type (Figure 3.11C and D), suggesting that the drastic
changes in P700 properties in the mutant strains are actually caused by a functional
interaction of PGR5 and PGRL1 with PSI and with other components of the electron transport
chain in Synechocystis.
3.3.4. Application of the strategy: 2. The psaA gene
In the case of the PGRL1 mutants, the double recombination strategy was used to introduce in
Synechocystis two photosynthesis-related proteins from Arabidopsis that are not naturally
present in this organism, but the core photosynthetic components and functions are conserved
in the two organisms. To study the function of such photosynthetic orthologs, gene
replacement is normally employed. Therefore, the single-step strategy was used to replace the
Synechocystis psaA (Syn psaA) gene with the corresponding homolog from the green plant
Arabidopsis thaliana (At psaA). As already mentioned, the psaA gene is, in both
cyanobacteria and plants, part of the psaA/psaB operon which codes for PsaA and PsaB, the
core subunits of PSI (for a review, see Chitnis, 2001).
By transforming the glucose-tolerant WT Synechocystis strain with the vector pDSpsaA,
analogously to the experiments described above, knockout (psaAprim
) and replacement
(psaAsec
) mutants were subsequently obtained (Figure 3.12A). The knockout line psaAprim
was
generated with the first recombination event, in which the integrated construct replaced the
endogenous psaA gene. Only the psaA coding sequence was affected by the replacement,
whereas the surrounding genomic regions and all the endogenous regulatory elements
remained unchanged. In the psaAprim
mutant, the integrated At psaA gene was non-functional,
being split in two parts separated by the nptI-sacB cassette. As expected, the same severe
ΔpsaA mutant phenotype was observed in the psaAprim
strain that was turquoise-blue and
highly light sensitive. The blue phenotype of the first-round recombinant resulted from the
lack of Chl a, with the phycobilisome chromophore phycocyanin (PC) being the predominant
pigment present (Figure 3.12B). After complete segregation of the first replacement, the
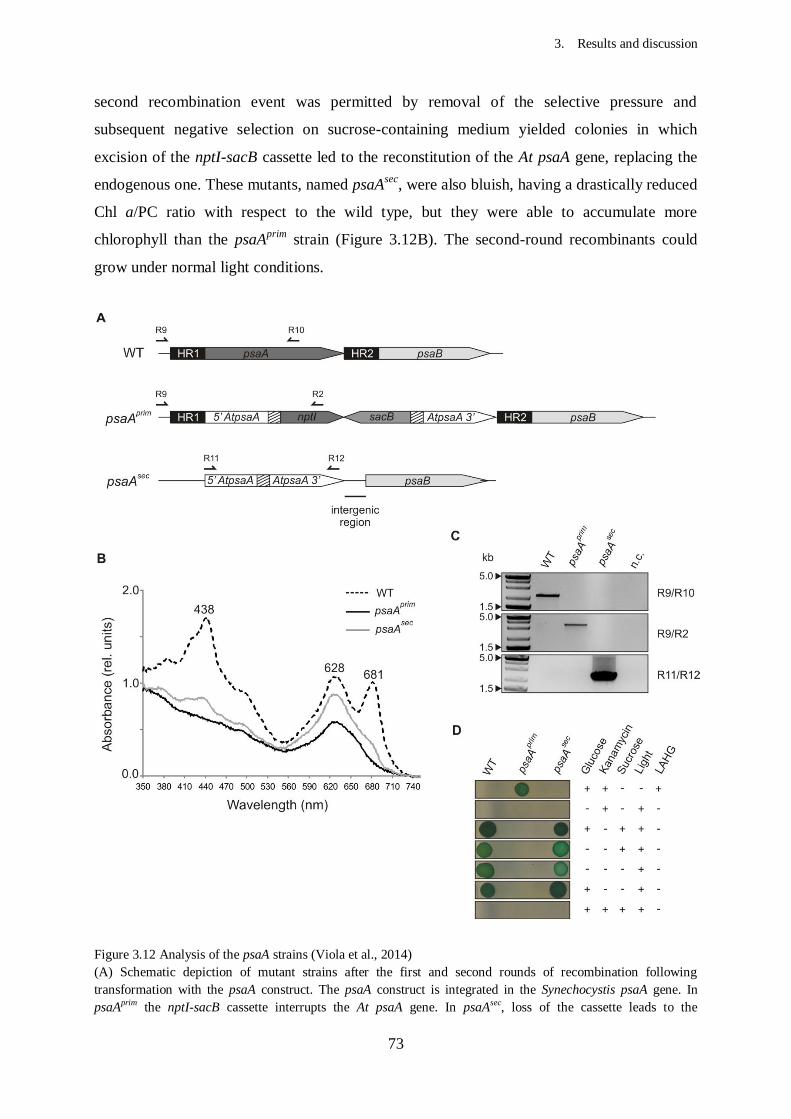
3. Results and discussion
73
second recombination event was permitted by removal of the selective pressure and
subsequent negative selection on sucrose-containing medium yielded colonies in which
excision of the nptI-sacB cassette led to the reconstitution of the At psaA gene, replacing the
endogenous one. These mutants, named psaAsec
, were also bluish, having a drastically reduced
Chl a/PC ratio with respect to the wild type, but they were able to accumulate more
chlorophyll than the psaAprim
strain (Figure 3.12B). The second-round recombinants could
grow under normal light conditions.
Figure 3.12 Analysis of the psaA strains (Viola et al., 2014) (A) Schematic depiction of mutant strains after the first and second rounds of recombination following
transformation with the psaA construct. The psaA construct is integrated in the Synechocystis psaA gene. In
psaAprim the nptI-sacB cassette interrupts the At psaA gene. In psaAsec
, loss of the cassette leads to the
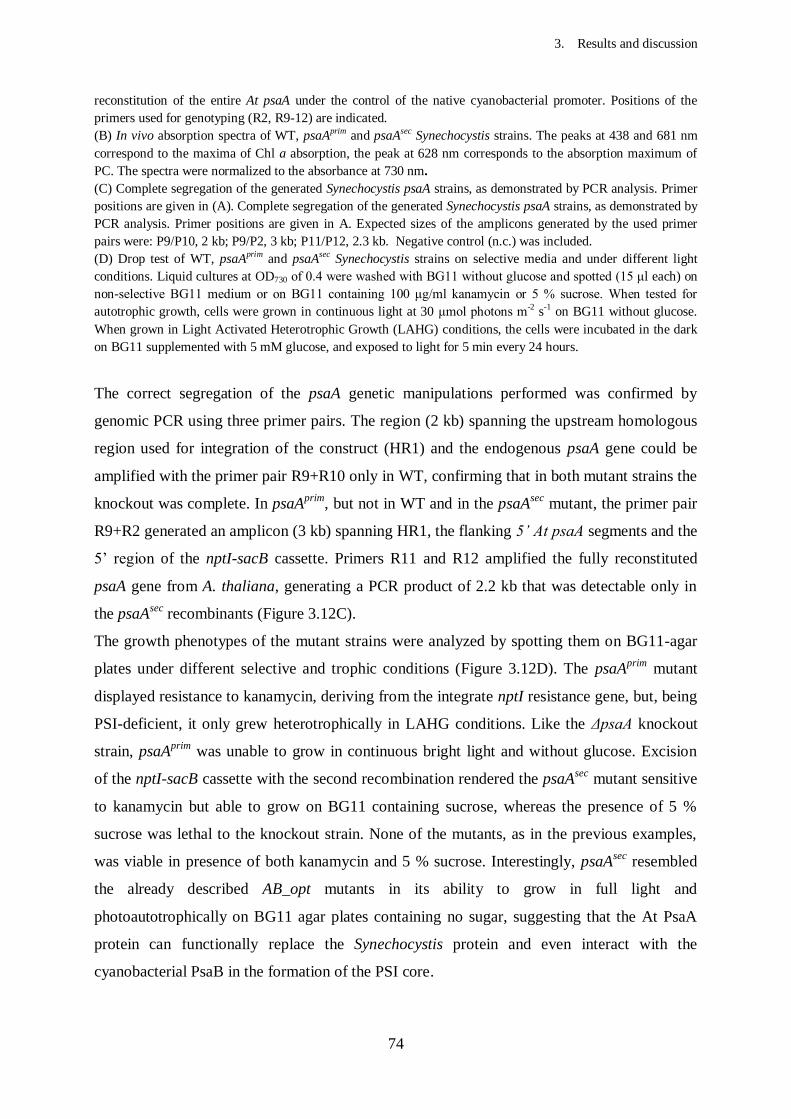
3. Results and discussion
74
reconstitution of the entire At psaA under the control of the native cyanobacterial promoter. Positions of the
primers used for genotyping (R2, R9-12) are indicated.
(B) In vivo absorption spectra of WT, psaAprim and psaAsec Synechocystis strains. The peaks at 438 and 681 nm
correspond to the maxima of Chl a absorption, the peak at 628 nm corresponds to the absorption maximum of
PC. The spectra were normalized to the absorbance at 730 nm.
(C) Complete segregation of the generated Synechocystis psaA strains, as demonstrated by PCR analysis. Primer
positions are given in (A). Complete segregation of the generated Synechocystis psaA strains, as demonstrated by
PCR analysis. Primer positions are given in A. Expected sizes of the amplicons generated by the used primer
pairs were: P9/P10, 2 kb; P9/P2, 3 kb; P11/P12, 2.3 kb. Negative control (n.c.) was included.
(D) Drop test of WT, psaAprim and psaAsec Synechocystis strains on selective media and under different light
conditions. Liquid cultures at OD730 of 0.4 were washed with BG11 without glucose and spotted (15 μl each) on
non-selective BG11 medium or on BG11 containing 100 μg/ml kanamycin or 5 % sucrose. When tested for
autotrophic growth, cells were grown in continuous light at 30 μmol photons m-2 s-1 on BG11 without glucose.
When grown in Light Activated Heterotrophic Growth (LAHG) conditions, the cells were incubated in the dark
on BG11 supplemented with 5 mM glucose, and exposed to light for 5 min every 24 hours.
The correct segregation of the psaA genetic manipulations performed was confirmed by
genomic PCR using three primer pairs. The region (2 kb) spanning the upstream homologous
region used for integration of the construct (HR1) and the endogenous psaA gene could be
amplified with the primer pair R9+R10 only in WT, confirming that in both mutant strains the
knockout was complete. In psaAprim
, but not in WT and in the psaAsec
mutant, the primer pair
R9+R2 generated an amplicon (3 kb) spanning HR1, the flanking 5’ At psaA segments and the
5’ region of the nptI-sacB cassette. Primers R11 and R12 amplified the fully reconstituted
psaA gene from A. thaliana, generating a PCR product of 2.2 kb that was detectable only in
the psaAsec
recombinants (Figure 3.12C).
The growth phenotypes of the mutant strains were analyzed by spotting them on BG11-agar
plates under different selective and trophic conditions (Figure 3.12D). The psaAprim
mutant
displayed resistance to kanamycin, deriving from the integrate nptI resistance gene, but, being
PSI-deficient, it only grew heterotrophically in LAHG conditions. Like the ΔpsaA knockout
strain, psaAprim
was unable to grow in continuous bright light and without glucose. Excision
of the nptI-sacB cassette with the second recombination rendered the psaAsec
mutant sensitive
to kanamycin but able to grow on BG11 containing sucrose, whereas the presence of 5 %
sucrose was lethal to the knockout strain. None of the mutants, as in the previous examples,
was viable in presence of both kanamycin and 5 % sucrose. Interestingly, psaAsec
resembled
the already described AB_opt mutants in its ability to grow in full light and
photoautotrophically on BG11 agar plates containing no sugar, suggesting that the At PsaA
protein can functionally replace the Synechocystis protein and even interact with the
cyanobacterial PsaB in the formation of the PSI core.
3. Results and discussion
75
3.3.5. Discussion: advantages of the single-step replacement strategy
Targeted gene and genome manipulation via homologous recombination in bacteria relies on
the use of marker genes. In marker-less gene replacement, a negative and a positive selection
marker are employed, in a process that normally involves two transformation steps with two
DNA suicide vectors. In this work, we developed an alternative strategy for marker-less gene
replacement in Synechocystis, based on the use of a single plasmid and a single transformation
step.
The technique was tested by inserting the luxAB operon from Vibrio fischeri into the neutral
receptor site slr0168. To this end the wild type strain was transformed with the vector pDSlux
and the transformation efficiency with this integration vector was in the range of 10-5
, while
the average frequency of the second recombination event was 10-6
(see Table 1). This ten-fold
difference could be due to the fact that the first recombination event involves a double
crossover between the genomic DNA and the plasmid vector, whereas the second
recombination presumably involves a single intra-genomic crossover (Clerico et al., 2007).
Thus, a difference in efficiency between these two recombination mechanisms could explain
the results obtained. In addition, other factors like length, position and relative concentration
of the homology regions might contribute to the difference in efficiency (Kufryk et al., 2002).
In comparison with standard procedures, the single-step marker-less gene replacement
strategy described here has several advantages. The requirement of only one vector for each
gene replacement makes the cloning procedure faster and more facile, especially when one
needs to sequentially replace many genes. Our single-step approach merely requires
alternative selective growth conditions in addition to the transformation step, although this
flexibility requires that the constructs must be assembled from numerous DNA fragments - six
(plus the vector backbone) in the case of pDSlux, for instance. However, the increased
complexity of the plasmid vectors required can easily be accommodated by using large-scale
modular cloning technologies like the Golden Gate (Engler et al., 2009), the Gibson (Gibson
et al., 2009) or the BioBrick (Shetty et al., 2008) assembly systems. Another issue that can
arise during gene manipulation concerns the cloning of genes that are toxic to E. coli. Also in
this regard, our strategy is advantageous, because the interruption of the GOI sequence by the
intervening nptI-sacB cassette inactivates it, thus avoiding the problem of toxicity. Only the
second recombination in the Synechocystis host cell reconstitutes both the gene sequence and
function. Also for studies of biological functions for which two genes are necessary, the
single-step gene replacement strategy can constitute a suitable experimental tool, as shown for
the luxAB operon. In the luxprim
mutants, interruption of this operon by the double selection
3. Results and discussion
76
cassette leads to impairment of the luciferase activity, as luxB cannot be transcribed and
therefore the heterodimeric enzyme cannot be assembled. Only after removal of the cassette
by the second recombination event is the integrity of the dicistronic luxAB and with it the
luciferase activity restored, as shown in Figure 3.9D and Table 3.2. Some background
luminescence was observed in the luxprim
recombinants, which could be due to read-through
transcription of luxB from the nptI promoter. Thus, by using only one vector and performing a
single transformation step it was possible to show that both luxA and luxB are necessary for
luciferase function, as previously described (Engebrecht et al., 1983; Foran et al., 1988).
These results confirm that, when our strategy is used to analyze a gain of function, the new
function can be expected to arise only in the second recombinants and not in the first mutant
strains, which can therefore serve as ideal controls.
When used to introduce in Synechocystis the plant-specific PGRL1 and PGR5 proteins,
responsible for the NDH-independent CEF pathway in Arabidopsis, the technique proved to
be useful in dissecting the proteins function. In Arabidopsis, the two thylakoid proteins
PGRL1 and PGR5 participate in shuttling electrons from PSI to the Cytochrome (Cyt) b6f
complex, forming a heterodimer (DalCorso et al., 2008; Hertle et al., 2013).
Cyanobacteria contain the NDH-dependent CEF pathway, but it is unclear whether they also
possess a true pendant of the PGRL1/PGR5-dependent pathway. This is because homologues
of PGRL1 have not yet been identified in cyanobacteria. However, inactivation of a
cyanobacterial gene with distant homology to PGR5 appears to perturb cyanobacterial AA-
sensitive CEF (Yeremenko et al., 2005). To dissect the function of the two plant proteins in
Synechocystis, mutants were generated expressing either PGR5 alone or PGRL1 and PGR5
together. Indeed, the PGR5 mutants accumulated PGR5 alone, the PGRL1 coding sequence
they harboured being disrupted by the nptI-sacB cassette, whereas reconstitution of the PpsbA2-
PGRL1 fusion led in the PGR5+PGRL1 mutant strain to the accumulation of both PGRL1
and PGR5. When analyzing the absorption and low-temperature fluorescence emission
spectra of the mutants, no significant differences with respect to the wild type could be
observed. Therefore, the pigments and PSI/PSII ratios seemed not to be affected by the
recombinant proteins. On the contrary, when measuring the P700 oxidation-reduction
kinetics, major changes were detected in, surprisingly, both PGR5 and PGR5+PGRL1
recombinants. The P700+-related absorbance at 820 nm was measured with or without the
addition of inhibitors blocking the electron transport at different. The PSI in the WT strain
became oxidized after exposure to actinic light and then transiently re-reduced by electrons
from PSII. This re-reduction did not take place after DCMU treatment, as expected.
3. Results and discussion
77
Moreover, DCMU treatment resulted in a higher oxidation level in light and in a slower re-
reduction rate after illumination was terminated, because electrons coming from the CEF
alone and not also from PSII were responsible for it. When using both DCMU and DBMIB,
also the re-reduction caused by CEF was prevented, the PSI oxidation level was even higher
and corresponded to the maximum PSI oxidation capacity. In the strain expressing PGR5 and,
even more pronouncedly, in the strain expressing both PGR5 and PGRL1, the maximum
P700+ signal in presence of inhibitors was markedly lower than in WT, albeit the unchanged
photosystem I levels. These results were compatible with the idea that PGRL1 and PGR5, the
latter even alone, prevented oxidation of PSI by reinjection of electrons into the electron
transport chain. The PGR5 and PGR5+PGRL1 recombinants, though, displayed a faster PSI
oxidation at the onset of light, with a greatly diminished re-reduction transient due to
electrons coming from PSII. Although a more detailed physiological characterization of the
mutants will be needed, it could be inferred from the showed results that PGR5 and PGRL1
are able to interact with the electron transport chain also in Synechocystis.
The single-step strategy was also employed to replace the psaA gene from Synechocystis with
the homolog from Arabidopsis thaliana, which resides in the plastid genome of the plant. The
PsaA subunit, together with PsaB, constitutes the dimeric core of PSI, and is highly conserved
among photosynthetic organisms from cyanobacteria to flowering plants (Amunts and Nelson,
2008). PsaA is an essential component of PSI and is necessary for its assembly, accumulation
and function, and therefore essential for photoautotrophic growth of both plants and
cyanobacteria. Knockout of the psaA gene is lethal to higher plants, while genetic inactivation
of the PSI reaction centre in Synechocystis generates mutants that are able to survive
heterotrophically under LAHG conditions, although they have a severe phenotype and are
unable to survive in the light. In the psaAsec
mutants, replacement of the endogenous psaA
gene with the Arabidopsis homolog led to a partial complementation of the psaAprim
knockout
phenotype (Figure 3.12D). Also in this case, using the single-step gene replacement strategy,
both the knockout and replacement lines were generated using a single vector and a single
transformation. In the case of essential genes like psaA the one-vector strategy confers an
additional advantage because mutants with severe phenotypes can be difficult to grow in
liquid cultures and therefore their transformation can be challenging. This alternative gene
replacement strategy makes it possible to obtain a second recombination event simply by
releasing the positive selective pressure on the segregated transformants and applying
negative selection in an alternating manner.
4. Conclusions
78
4. CONCLUSIONS
In this work we established a set of tools for the identification and functional characterization
of photosynthesis-related proteins from higher plants based on a cyanobacterial platform. For
this purpose, the prokaryote Synechocystis sp. PCC 6803 was chosen, as it serves as a well-
established model organism in photosynthesis research (Vermaas et al., 1986; Vermaas et al.,
1987; Carpenter et al., 1993; Dühring et al., 2007; Xu et al., 2011). Cyanobacteria derive from
the same ancestor as plant chloroplasts that evolved after a single endosymbiotic event
(Martin et al., 2002). During this event, a photosynthetic bacterium was integrated into an
ancestral eukaryotic cell, thus providing it with the complete photosynthetic machinery in the
shape of a new subcellular compartment, the future chloroplast. With the subsequent
evolution of land plants, the chloroplast gradually lost its genetic and physiological autonomy
(Whatley and Whatley, 1981; Kleine et al., 2009) and underwent a large number of
modifications in order to adapt to the new cellular (Pesaresi et al., 2007) as well as external
environment. Higher plants face environmental conditions that drastically differ from the low-
light, oxygen-depleted marine environment the prokaryotic photosynthetic machinery evolved
in. They are confronted with fluctuating light and an oxidative environment that they cannot
avert and, at the same time, with an inadequate evolutionary inheritance (Leister, 2012). As a
consequence, plants developed new regulatory and protective mechanisms to optimize their
photosynthetic efficiency and limit the damage caused by oxidative and light stress. Over the
time, higher plants evolved an extremely complex and fine-tuned photosynthetic apparatus
based on the interplay of numerous players that either derive from prokaryotic homolgs or
evolved independently in the eukaryotic cell (Leister, 2003; Timmis et al., 2004). Unrevealing
the details of such an intricate network is a major challenge for plant scientists, since the
available genetic and molecular tools seem not to keep pace with the increasing complexity of
the plant photosynthesis model that is being assembled.
The generation of a cyanobacterial platform for the analysis of photosynthesis-related proteins
from higher plants can constitute a versatile tool to dissect the molecular function of already
identified proteins as well as for the identification of new ones whose identity has so far been
elusive.

4. Conclusions
79
4.1. Dissecting the molecular function of known proteins: the CURT1 protein family and
PGRL1/PGR5-mediated CEF
The four members of the CURT1 protein family from Arabidopsis thaliana play an important
role in the process of thylakoid membrane curvature at the grana margins (Armbruster et al.,
2013). The resulting structural rearrangements represent an important adaptive mechanism to
variable light conditions (Andersson, 1986; Trissl and Wilhelm, 1993; Mustárdy and Garab,
2003; Dekker and Boekema, 2005; Kargul and Barber, 2008). Although the ability of these
proteins to bind membranes was demonstrated in vitro, the underlying mechanism is not clear
yet. The expression of the major Arabidopsis CURT1 variant, CURT1A, in Synechocystis in
addition (CURT1A) or in substitution for (CURT1A syncurt1) the endogenous synCURT1
homolog showed that the plant protein is able to induce thylakoid membrane curvature and to
influence thylakoid architecture also in cyanobacteria. Moreover, the Arabidopsis and the
Synechocystis homologs resulted to have a partially conserved function, for which a control of
their cellular amounts seems to be necessary. Although expression of CURT1A did not induce
the formation of grana stacks in the Synechocystis thylakoids, its membrane-bending
properties increased in the phycobilisome-less mutants (CURT1A syncurt1Δapc), suggesting
that physical constrains could be a main reason for the lack of grana formation. The generated
Synechocystis CURT1 mutants represent the starting point for further analyses of the
molecular function of CURT1. In the future, the introduction of different combinations of the
Arabidopsis CURT1 isoforms will allow to dissect their specific roles. Additionally, the
regulatory effects on the CURT1 function of posttranslational phosphorylation that has been
postulated in plants (Armbruster et al., 2013) can be investigated. Although still controversial,
phosphorylation of thylakoid proteins has been reported in cyanobacteria (Allen et al., 1985;
Allen et al., 1992). In Synechocystis, phosphorylation of the phycobilisome linker proteins has
been shown by Piven and colleagues (2005), but no PSII core phosphorylation occurs.
Expression of Arabidopsis chloroplast kinases in the Synechocystis CURT1 mutant strains
could help to elucidate the mechanisms that regulate the CURT1 activity in higher plants.
The PGR5 (Munekage et al., 2002) and PGRL1 (DalCorso et al., 2008; Hertle et al., 2013)
proteins account for the AA-sensitive cyclic electron flow (CEF) pathway in Arabidopsis
thaliana, which is partially redundant to the NDH-mediated CEF (Burrows et al., 1998). The
two proteins interact physically with each other, which allows for the re-injection of electrons
from reduced ferredoxin into the Q-cycle, with PGRL1 undergoing the reduction-oxidation
reactions. The current model proposed by Hertle and colleagues (2013) suggests that a
PGRL1/PGR5 dimer directly interacts with Fd and FNR in close proximity to the PSI
4. Conclusions
80
complex. However, the mode of interaction and the specific molecular function of PGR5 are
not fully understood yet. The current state of knowledge is that in cyanobacteria only the
NDH-mediated CEF pathway is present, although a protein similar to the N-terminus of
PGR5 has been characterized in Synechocystis (Yeremenko et al., 2005).
Synechocystis mutants expressing either PGR5 alone (PGR5) or PGR5 and PGRL1 together
(PGR5+PGRL1) were tested for a potential effect of the plant proteins on CEF around
cyanobacterial PSI. The P700 oxidation-reduction kinetics were indeed altered in the two
mutants, with a higher PSI oxidation level under physiological conditions but an overall
reduced maximal oxidation capacity when PSI re-reduction from LEF (using DCMU) or from
both LEF and CEF (using DCMU and DBMIB) were blocked. These preliminary results
strongly indicate that the PGR5 and PGRL1 proteins from Arabidopsis interact with the
photosynthetic electron transport chain of Synechocystis, but further analyses need to be
carried out to clarify the underlying molecular mechanisms. This approach opens up
interesting questions that will direct future investigations. For instance, PGR5 affects electron
flow in PGR5 mutants even in the absence of PGRL1, apparently by oxidizing PSI to a higher
extent than in the wild type: is PGR5 actually the protein, among the two, that first receives
electrons from Fd, as hypothesized? The maximal P700+ levels in PGR5 and PGR5+PGRL1
are reduced also in the presence of DBMIB: is the PQ pool the actual site of electron re-
injection and, if so, how can the observed phenotype in the Synechocystis mutants be
explained? Which are the missing plant-specific components or features required for the
correct function of the two introduced proteins? The newly introduced pathway competes
with the NDH complex that in cyanobacteria is shared between the CEF and the respiratory
pathway (Sandmann and Malkin, 1984), for the electrons deriving from PSI. Clearly, it cannot
be excluded that this competition also plays a role in the observed phenotype. This aspect
should be further investigated.
4.2. Generating a cyanobacterium with a plant-type photosynthetic machinery: replacement
of PSI
The glucose-tolerant Synechocystis wild type strain is able to grow heterotrophically in
darkness (Williams, 1988; Anderson and McIntosh, 1991), which makes it an excellent model
to study photosynthesis. The replacement of the bacterial photosynthetic apparatus with its
plant-specific counterpart could provide a useful platform to determine the composition of the
minimal functional photochemical apparatus. Moreover, this kind of platform might allow
4. Conclusions
81
identifying new plant-specific components involved in the regulation of photosynthesis that,
so far, escaped identification with the currently used screening approaches.
The substitution of PSI was chosen as an initial project to establish the Synechocystis
platform, because it is the evolutionarily most conserved photosynthetic complex but, at the
same time, the least characterized. To this end, mutants were generated (AB_opt) in which the
PsaA and PsaB core subunits of Synechocystis PSI got replaced by the respective homologs of
Arabidopsis. The characterization of these mutants showed that the plant proteins can only
partially replace the bacterial counterparts. The two Arabidopsis genes were correctly
transcribed and this partially rescued the phenotype of the PSI-less mutant (ΔpsaA). Although
the expression of the plant psaA-psaB genes restored the light-tolerance phenotype and led to
the accumulation of a partially assembled PSI complex, it was not possible to either detect the
mature proteins by immunodecoration or any PSI-specific maxima in fluorescence emission
spectra in the replacement mutant. It can be therefore presumed that the assembly of the
functional PSI complexe is impaired in one of the post-transcriptional steps. This can be seen
as a promising starting point to identify the reasons of the lack of functionality rather than a
failure of the strategy. The first working hypothesis is that At PsaA and At PsaB do not
properly interact with the other Synechocystis subunits of PSI. To clarify this, the putative PSI
complex accumulating in the AB_opt mutants has to be purified and its composition to be
determined. If the assembly of a chimeric PSI complex appears to be the limiting step, the
additional introduction of the residual PSI subunits from Arabidopsis would be the next logic
step. This is, indeed, the direction we are currently following and the characterization of the
planned mutant strain will help to answer these questions.
Some factors that are necessary for the assembly of plant-specific PSI and that are not
characterized or exert a slightly different function in cyanobacteria have previously been
described (for a review, see Schöttler et al., 2011). Their requirement for the assembly of the
introduced PSI could be tested by expressing them in the generated Synechocystis mutants.
Even more interestingly, with this approach new PSI assembly factors could be identified. A
library of Arabidopsis thaliana transcripts can, indeed, be introduced in the generated
Synechocystis mutants in order to identify the clones that are able to rescue the PSI-deficient
phenotype. The same approach could be applied in strains that show a replacement of
different components of the photosynthetic apparatus, thus providing a new screening tool for
novel photosynthesis-related proteins.

4. Conclusions
82
4.3. Improving the molecular tools for large-scale gene knockout and replacement in
Synechocystis
Synechocystis is naturally transformable and performs homologous recombination. To
generate multiple targeted deletions and/or replacements of its genes, marker-less
manipulation methods based on counter-selection are generally employed (Cai and Wolk,
1990; Matsuoka et al., 2001). Irrespectively of the markers used, the available methods are
usually based on two transformation steps with two different DNA plasmids, of which the
first generates the knock-out and the second one allows for the replacement of the target gene.
In this study, we developed an alternative marker-less gene deletion and replacement strategy
in Synechocystis sp. PCC 6803 which is based on a single transformation step exploiting the
ability of the cyanobacterium to undergo two subsequent genomic recombination events via
double and single crossing-over, by stepwise changes in the selective pressure applied. This
strategy presents some convenient properties that could be profitably exploited in large-scale
genomic manipulations, like during the generation of the here proposed cyanobacterial
platform. A practical advantage is that only one DNA vector, and with it only one
transformation step, is required for the stepwise generation of the knock-out and of the
replacement Synechocystis mutant. This aspect can become quite relevant when manipulating
a large number of genes.
When this single-vector strategy is used to analyse a gain of function mutation, the new
function is expected to occurr only in the second recombinants and not in the first mutant
strains, which can therefore serve as ideal controls. Moreover, in the case of two-gene
systems, the single-vector strategy can be used to prove that the gain of function actually
depends on the functional integrity of both system components, as shown in the case of the
luxAB reporter system.
Originally, this strategy has been conceived for the manipulation of essential photosynthetic
genes, like psaA, whose knock-out generates mutants with severe phenotypes that are difficult
to grow in liquid cultures and to manipulate and are therefore unsuitable for a second
transformation procedure. This specific gene replacement mechanism allows a second
recombination event simply by releasing the positive selection pressure on the segregated
transformants and instead applying negative selection. The disruption, in the DNA vector
employed, of the exogenous gene to introduce by the selection cassette allows obtaining, in
the first recombination step, the knockout of the target cyanobacterial gene. Moreover, this
disruption could prove itself useful when cloning genes that are toxic in Escherichia coli.
4. Conclusions
83
Taken together, the implementation of a double recombination event by a simple stepwise
change of growth conditions can be exploited to address various biological questions and
could also be employed for large-scale gene replacement approaches. Thanks to the tight
counter-selection against incomplete second-round recombinants and transformants bearing
multiple genomic integrations, the method could indeed be applied in semi-automated
systems.
In this work we established the basis for a new approach to study higher plant photosynthesis
that relies on the transfer of the plant photosynthetic machinery into the simplified context of
a unicellular prokaryote. Although the presented work only touches the surface of the
possibilities that are innate to this strategy and the presented results are clearly provisional,
encouraging hints of a future successful development are already present. Plant scientists need
to keep up with the increasing complexity of the biological processes they investigate by
developing new research tools. The here presented approach might just be one of such
possible alternatives to achieve this aim.
References
84
REFERENCES
Adir, N. (2005). Elucidation of the molecular structures of components of the phycobilisome: reconstructing a
giant. Photosynth Res 85, 15-32.
Ajlani, G., and Vernotte, C. (1998). Construction and characterization of a phycobiliprotein-less mutant of
Synechocystis sp. PCC 6803. Plant Mol Biol 37, 577-580.
Ajlani, G., Vernotte, C., DiMagno, L., and Haselkorn, R. (1995). Phycobilisome core mutants of
Synechocystis PCC 6803. Biochim Biophys Acta 1231, 189-196.
Albertsson, P.A., and Andreasson, E. (2004). The constant proportion of grana and stroma lamellae in plant
chloroplasts. Physiol Plant 121, 334-342.
Albus, C.A., Ruf, S., Schöttler, M.A., Lein, W., Kehr, J., and Bock, R. (2010). Y3IP1, a nucleus-encoded
thylakoid protein, cooperates with the plastid-encoded Ycf3 protein in photosystem I assembly of tobacco and
Arabidopsis. Plant Cell 22, 2838-2855.
Allen, J.F., Sanders, C.E., and Holmes, N.G. (1985). Correlation of membrane protein phosphorylation with
excitation energy distribution in the cyanobacterium Synechococcus 6301. FEBS J 193, 271-275.
Allen, J.F. (1992). Protein phosphorylation in regulation of photosynthesis. Biochim Biophys Acta 1098, 275-
335.
Allen, J.F., and Pfannschmidt, T. (2000). Balancing the two photosystems: photosynthetic electron transfer
governs transcription of reaction centre genes in chloroplasts. Philos Trans R Soc Lond B Biol Sci 355, 1351-
1359.
Allen, J.F., and Forsberg, J. (2001). Molecular recognition in thylakoid structure and function. Trends Plant
Sci 6, 317-326.
Allen, J.F., de Paula, W.B., Puthiyaveetil, S., and Nield, J. (2011). A structural phylogenetic map for
chloroplast photosynthesis. Trends Plant Sci 16, 645-655.
Amann, K., Lezhneva, L., Wanner, G., Herrmann, R.G., and Meurer, J. (2004). ACCUMULATION OF
PHOTOSYSTEM ONE1, a member of a novel gene family, is required for accumulation of [4Fe-4S] cluster-
containing chloroplast complexes and antenna proteins. Plant Cell 16, 3084-3097.
Amunts, A., and Nelson, N. (2008). Functional organization of a plant photosystem I: evolution of a highly
efficient photochemical machine. Plant Physiol Biochem 46, 228-237.
Amunts, A., and Nelson, N. (2009). Plant photosystem I design in the light of evolution. Structure 17, 637-650.
Amunts, A., Drory, O., and Nelson, N. (2007). The structure of a plant photosystem I supercomplex at 3.4 A
resolution. Nature 447, 58-63.
Andersen, B., Scheller, H.V., and Møller, B.L. (1992). The PSI-E subunit of photosystem I binds
ferredoxin:NADP+ oxidoreductase. FEBS Lett 311, 169-173.
Anderson, S.L., and McIntosh, L. (1991). Light-activated heterotrophic growth of the cyanobacterium
Synechocystis sp. strain PCC 6803: a blue-light-requiring process. J Bacteriol 173, 2761-2767.
References
85
Andersson, J.M. (1986). Photoregulation of the composition, function, and structure of thylakoid membranes.
Annu Rev Plant Physiol 37, 93-136.
Armbruster, U., Labs, M., Pribil, M., Viola, S., Xu, W., Scharfenberg, M., Hertle, A.P., Rojahn, U.,
Jensen, P.E., Rappaport, F., Joliot, P., Dormann, P., Wanner, G., and Leister, D. (2013). Arabidopsis
CURVATURE THYLAKOID1 proteins modify thylakoid architecture by inducing membrane curvature. Plant
Cell 25, 2661-2678.
Arnon, D.I., Allen, M.B., and Whatley, F.R. (1954). Photosynthesis by isolated chloroplasts. Nature 174, 394-
396.
Arnon, D.I., Tsujimoto, H.Y., and Tang, G.M. (1981). Oxygenic photoreduction of ferredoxin independently
of the membrane-bound iron-sulfur centers of photosystem I. Biochem Biophys Res Commun 99, 936-945.
Bendall, D.S., and Manasse, R.S. (1995). Cyclic photophosphorylation and electron transport. Biochim
Biophys Acta 1229, 23-38.
Boudreau, E., Takahashi, Y., Lemieux, C., Turmel, M., and Rochaix, J.D. (1997). The chloroplast ycf3 and
ycf4 open reading frames of Chlamydomonas reinhardtii are required for the accumulation of the photosystem I
complex. EMBO J 16, 6095-6104.
Buchanan, B.B., and Balmer, Y. (2005). Redox regulation: a broadening horizon. Annu Rev Plant Biol 56,
187-220.
Büchel, C., and Kühlbrandt, W. (2005). Structural differences in the inner part of photosystem II between
higher plants and cyanobacteria. Photosynth Res 85, 3-13.
Burrows, P.A., Sazanov, L.A., Svab, Z., Maliga, P., and Nixon, P.J. (1998). Identification of a functional
respiratory complex in chloroplasts through analysis of tobacco mutants containing disrupted plastid ndh genes.
EMBO J 17, 868-876.
Butler, P.J., and Kühlbrandt, W. (1988). Determination of the aggregate size in detergent solution of the light-
harvesting chlorophyll a/b-protein complex from chloroplast membranes. Proc Natl Acad Sci U S A 85, 3797-
3801.
Cai, Y.P., and Wolk, C.P. (1990). Use of a conditionally lethal gene in Anabaena sp strain PCC 7120 to select
for double recombinants and to entrap insertion sequences. J Bacteriol 172, 3138-3145.
Campbell, W.H., and Gowri, G. (1990). Codon usage in higher plants, green algae, and cyanobacteria. Plant
Physiol 92, 1-11.
Carmeli, I., Frolov, L., Carmeli, C., and Richter, S. (2007). Photovoltaic activity of photosystem I-based self-
assembled monolayer. J Am Chem Soc 129, 12352-12353.
Carpenter, S.D., Ohad, I., and Vermaas, W.F. (1993). Analysis of chimeric spinach/cyanobacterial CP43
mutants of Synechocystis sp. PCC 6803: the chlorophyll-protein CP43 affects the water-splitting system of
Photosystem II. Biochim Biophys Acta 1144, 204-212.
Cavalier-Smith, T., and Lee, J.J. (1985). Protozoa as hosts for endosymbioses and the conversion of symbionts
into organelles. J Protozool 32, 376-379.
Chen, M.C., Cheng, M.C., and Chen, S.C. (1993). Characterization of the promoter of rice plastid psaA-psaB-
rps14 operon and the DNA-specific binding proteins. Plant Cell Physiol 34, 577-584.
References
86
Chi, W., Ma, J., and Zhang, L. (2012). Regulatory factors for the assembly of thylakoid membrane protein
complexes. Philos Trans R Soc Lond B Biol Sci 367, 3420-3429.
Chitnis, P.R. (2001). Photosystem I: Function and physiology. Annu Rev Plant Physiol Plant Mol Biol 52, 593-
626.
Clerico, E.M., Ditty, J.L., and Golden, S.S. (2007). Specialized techniques for site-directed mutagenesis in
cyanobacteria. Methods Mol Biol 362, 155-171.
Collins, A.M., Liberton, M., Jones, H.D., Garcia, O.F., Pakrasi, H.B., and Timlin, J.A. (2012).
Photosynthetic pigment localization and thylakoid membrane morphology are altered in Synechocystis 6803
phycobilisome mutants. Plant Physiol 158, 1600-1609.
DalCorso, G., Pesaresi, P., Masiero, S., Aseeva, E., Schunemann, D., Finazzi, G., Joliot, P., Barbato, R.,
and Leister, D. (2008). A complex containing PGRL1 and PGR5 is involved in the switch between linear and
cyclic electron flow in Arabidopsis. Cell 132, 273-285.
Daum, B., and Kühlbrandt, W. (2011). Electron tomography of plant thylakoid membranes. J Exp Bot 62,
2393-2402.
Day, A., and Goldschmidt-Clermont, M. (2011). The chloroplast transformation toolbox: selectable markers
and marker removal. Plant Biotechnol J 9, 540-553.
Debus, R.J. (1992). The manganese and calcium ions of photosynthetic oxygen evolution. Biochim Biophys
Acta 1102, 269-352.
Dekker, J.P., and Boekema, E.J. (2005). Supramolecular organization of thylakoid membrane proteins in green
plants. Biochim Biophys Acta 1706, 12-39.
Depege, N., Bellafiore, S., and Rochaix, J.D. (2003). Role of chloroplast protein kinase Stt7 in LHCII
phosphorylation and state transition in Chlamydomonas. Science 299, 1572-1575.
Dolganov, N.A., Bhaya, D., and Grossman, A.R. (1995). Cyanobacterial protein with similarity to the
chlorophyll a/b binding proteins of higher plants: evolution and regulation. Proc Natl Acad Sci U S A 92, 636-
640.
Douglas, A.E., and Raven, J.A. (2003). Genomes at the interface between bacteria and organelles. Philos Trans
R Soc Lond B Biol Sci 358, 5-17; discussion 517-518.
Dühring, U., Ossenbühl, F., and Wilde, A. (2007). Late assembly steps and dynamics of the cyanobacterial
photosystem I. J Biol Chem 282, 10915-10921.
Endo, T., Mi, H., Shikanai, T., and Asada, K. (1997). Donation of electrons to plastoquinone by NAD(P)H
dehydrogenase and by ferredoxin-quinone reductase in spinach chloroplasts. Plant Cell Physiol 38, 1272-1277.
Engebrecht, J., Nealson, K., and Silverman, M. (1983). Bacterial bioluminescence: isolation and genetic
analysis of functions from Vibrio fischeri. Cell 32, 773-781.
Engler, C., Gruetzner, R., Kandzia, R., and Marillonnet, S. (2009). Golden gate shuffling: a one-pot DNA
shuffling method based on type IIs restriction enzymes. PLoS One 4, e5553.
References
87
Eriksson, J., Salih, G.F., Ghebramedhin, H., and Jansson, C. (2000). Deletion mutagenesis of the 5' psbA2
region in Synechocystis 6803: identification of a putative cis element involved in photoregulation. Mol Cell Biol
Res Commun 3, 292-298.
Ewart, G.D., and Smith, G.D. (1989). Purification and properties of soluble hydrogenase from the
cyanobacterium Anabaena cylindrica. Arch Biochem Biophys 268, 327-337.
Fischer, N., Hippler, M., Setif, P., Jacquot, J.P., and Rochaix, J.D. (1998). The PsaC subunit of photosystem
I provides an essential lysine residue for fast electron transfer to ferredoxin. EMBO J 17, 849-858.
Folea, I.M., Zhang, P., Aro, E.M., and Boekema, E.J. (2008). Domain organization of photosystem II in
membranes of the cyanobacterium Synechocystis PCC6803 investigated by electron microscopy. FEBS Lett 582,
1749-1754.
Foran, D.R., and Brown, W.M. (1988). Nucleotide sequence of the LuxA and LuxB genes of the
bioluminescent marine bacterium Vibrio fischeri. Nucleic Acids Res 16, 777.
Fouet, A., Arnaud, M., Klier, A., and Rapoport, G. (1984). Characterization of the precursor form of the
exocellular levansucrase from Bacillus subtilis. Biochem Biophys Res Commun 119, 795-800.
Foyer, C.H., Neukermans, J., Queval, G., Noctor, G., and Harbinson, J. (2012). Photosynthetic control of
electron transport and the regulation of gene expression. J Exp Bot 63, 1637-1661.
Fristedt, R., Willig, A., Granath, P., Crevecoeur, M., Rochaix, J.D., and Vener, A.V. (2009).
Phosphorylation of photosystem II controls functional macroscopic folding of photosynthetic membranes in
Arabidopsis. Plant Cell 21, 3950-3964.
Fujita, Y., Murakami, A., Ohki, K., and Hagiwara, N. (1988). Regulation of photosystem composition in
cyanobacterial photosynthetic system: evidence indicating that photosystem I formation is controlled in response
to electron transport state. Plant Cell Phys 29, 557-564.
Fukushima, A., Kusano, M., Nakamichi, N., Kobayashi, M., Hayashi, N., Sakakibara, H., Mizuno, T., and
Saito, K. (2009). Impact of clock-associated Arabidopsis pseudo-response regulators in metabolic coordination.
Proc Natl Acad Sci U S A 106, 7251-7256.
Funatsu, G., and Wittmann, H.G. (1972). Ribosomal proteins .33. Location of amino-acid replacements in
protein S12 isolated from Escherichia coli mutants resistant to streptomycin. J Mol Biol 68, 547-&.
Gan, C. (1989). Gene gun accelerates DNA-coated particles to transform intact cells. Scientist 3, 25.
Gay, P., Lecoq, D., Steinmetz, M., Ferrari, E., and Hoch, J.A. (1983). Cloning structural gene sacB, which
codes for exoenzyme levansucrase of Bacillus subtilis: expression of the gene in Escherichia coli. J Bacteriol
153, 1424-1431.
Gibson, D.G., Young, L., Chuang, R.Y., Venter, J.C., Hutchison, C.A., and Smith, H.O. (2009). Enzymatic
assembly of DNA molecules up to several hundred kilobases. Nature Methods 6, 343-U341.
Grossman, A.R., Karpowicz, S.J., Heinnickel, M., Dewez, D., Hamel, B., Dent, R., Niyogi, K.K., Johnson,
X., Alric, J., Wollman, F.A., Li, H., and Merchant, S.S. (2010). Phylogenomic analysis of the
Chlamydomonas genome unmasks proteins potentially involved in photosynthetic function and regulation.
Photosynth Res 106, 3-17.

References
88
Hankamer, B., Morris, E., Nield, J., Gerle, C., and Barber, J. (2001). Three-dimensional structure of the
photosystem II core dimer of higher plants determined by electron microscopy. J Struct Biol 135, 262-269.
Hanley, J., Setif, P., Bottin, H., and Lagoutte, B. (1996). Mutagenesis of photosystem I in the region of the
ferredoxin cross-linking site: modifications of positively charged amino acids. Biochemistry 35, 8563-8571.
He, Q.F., Schlich, T., Paulsen, H., and Vermaas, W. (1999). Expression of a higher plant light-harvesting
chlorophyll a/b-binding protein in Synechocystis sp PCC 6803. Eur J Biochem 263, 561-570.
Heathcote, P., Jones, M.R., and Fyfe, P.K. (2003). Type I photosynthetic reaction centres: structure and
function. Philos Trans R Soc Lond B Biol Sci 358, 231-243.
Herbert, S.K., Martin, R.E., and Fork, D.C. (1995). Light adaptation of cyclic electron transport through
Photosystem I in the cyanobacterium Synechococcus sp. PCC 7942. . Photosynth Res 46, 277-285.
Herbert, S.K., Samson, G., Fork, D.C., and Laudenbach, D.E. (1992). Characterization of damage to
photosystems I and II in a cyanobacterium lacking detectable iron superoxide dismutase activity. Proc Natl Acad
Sci U S A 89, 8716-8720.
Herranen, M., Tyystjarvi, T., and Aro, E.M. (2005). Regulation of photosystem I reaction center genes in
Synechocystis sp. strain PCC 6803 during light acclimation. Plant Cell Physiol 46, 1484-1493.
Herranen, M., Battchikova, N., Zhang, P., Graf, A., Sirpio, S., Paakkarinen, V., and Aro, E.M. (2004).
Towards functional proteomics of membrane protein complexes in Synechocystis sp. PCC 6803. Plant Physiol
134, 470-481.
Hertle, A.P., Blunder, T., Wunder, T., Pesaresi, P., Pribil, M., Armbruster, U., and Leister, D. (2013).
PGRL1 is the elusive ferredoxin-plastoquinone reductase in photosynthetic cyclic electron flow. Mol Cell 49,
511-523.
Hill, R., and Bendall, F. (1960). Crystallization of a photosynthetic reductase from a green plant. Nature 187,
417.
Hippler, M., Drepper, F., Haehnel, W., and Rochaix, J.D. (1998). The N-terminal domain of PsaF: precise
recognition site for binding and fast electron transfer from cytochrome c6 and plastocyanin to photosystem I of
Chlamydomonas reinhardtii. Proc Natl Acad Sci U S A 95, 7339-7344.
Hippler, M., Reichert, J., Sutter, M., Zak, E., Altschmied, L., Schroer, U., Herrmann, R.G., and Haehnel,
W. (1996). The plastocyanin binding domain of photosystem I. EMBO J 15, 6374-6384.
Holland, H.D. (2006). The oxygenation of the atmosphere and oceans. Philos Trans R Soc Lond B Biol Sci 361,
903-915.
Holzenburg, A., Bewley, M.C., Wilson, F.H., Nicholson, W.V., and Ford, R.C. (1993). Three-dimensional
structure of photosystem II. Nature 363, 470-472.
Howe, C.J., Barbrook, A.C., Koumandou, V.L., Nisbet, R.E., Symington, H.A., and Wightman, T.F.
(2003). Evolution of the chloroplast genome. Philos Trans R Soc Lond B Biol Sci 358, 99-106; discussion 106-
107.
Ihnatowicz, A., Pesaresi, P., Varotto, C., Richly, E., Schneider, A., Jahns, P., Salamini, F., and Leister, D.
(2004). Mutants for photosystem I subunit D of Arabidopsis thaliana: effects on photosynthesis, photosystem I
stability and expression of nuclear genes for chloroplast functions. Plant J 37, 839-852.
References
89
Jensen, P.E., Bassi, R., Boekema, E.J., Dekker, J.P., Jansson, S., Leister, D., Robinson, C., and Scheller,
H.V. (2007). Structure, function and regulation of plant photosystem I. Biochim Biophys Acta 1767, 335-352.
Joliot, P., and Johnson, G.N. (2011). Regulation of cyclic and linear electron flow in higher plants. Proc Natl
Acad Sci U S A 108, 13317-13322.
Jordan, P., Fromme, P., Witt, H.T., Klukas, O., Saenger, W., and Krauss, N. (2001). Three-dimensional
structure of cyanobacterial photosystem I at 2.5 A resolution. Nature 411, 909-917.
Kaneko, T., Sato, S., Kotani, H., Tanaka, A., Asamizu, E., Nakamura, Y., Miyajima, N., Hirosawa, M.,
Sugiura, M., Sasamoto, S., Kimura, T., Hosouchi, T., Matsuno, A., Muraki, A., Nakazaki, N., Naruo, K.,
Okumura, S., Shimpo, S., Takeuchi, C., Wada, T., Watanabe, A., Yamada, M., Yasuda, M., and Tabata,
S. (1996). Sequence analysis of the genome of the unicellular cyanobacterium Synechocystis sp. strain PCC6803.
II. Sequence determination of the entire genome and assignment of potential protein-coding regions
(supplement). DNA Res 3, 185-209.
Kargul, J., and Barber, J. (2008). Photosynthetic acclimation: structural reorganisation of light harvesting
antenna--role of redox-dependent phosphorylation of major and minor chlorophyll a/b binding proteins. FEBS J
275, 1056-1068.
Kargul, J., Turkina, M.V., Nield, J., Benson, S., Vener, A.V., and Barber, J. (2005). Light-harvesting
complex II protein CP29 binds to photosystem I of Chlamydomonas reinhardtii under State 2 conditions. FEBS J
272, 4797-4806.
Kerfeld, C.A., and Krogmann, D.W. (1998). Photosynthetic cytochromes c in cyanobacteria, algae, and plants.
Annu Rev Plant Physiol Plant Mol Biol 49, 397-425.
Kirsch, W., Seyer, P., and Herrmann, R.G. (1986). Nucleotide sequence of the clustered genes for two P700
chlorophyll a apoproteins of the photosystem I reaction center and the ribosomal protein S14 of the spinach
plastid chromosome. Current Genetics 10, 843-855.
Klaus, S.M., Huang, F.C., Golds, T.J., and Koop, H.U. (2004). Generation of marker-free plastid
transformants using a transiently cointegrated selection gene. Nat Biotechnol 22, 225-229.
Kleine, T., Maier, U.G., and Leister, D. (2009). DNA transfer from organelles to the nucleus: the idiosyncratic
genetics of endosymbiosis. Annu Rev Plant Biol 60, 115-138.
Komenda, J., Sobotka, R., and Nixon, P.J. (2012). Assembling and maintaining the Photosystem II complex in
chloroplasts and cyanobacteria. Curr Opin Plant Biol 15, 245-251.
Kouril, R., Zygadlo, A., Arteni, A.A., de Wit, C.D., Dekker, J.P., Jensen, P.E., Scheller, H.V., and
Boekema, E.J. (2005). Structural characterization of a complex of photosystem I and light-harvesting complex
II of Arabidopsis thaliana. Biochemistry 44, 10935-10940.
Krech, K., Ruf, S., Masduki, F.F., Thiele, W., Bednarczyk, D., Albus, C.A., Tiller, N., Hasse, C., Schöttler,
M.A., and Bock, R. (2012). The plastid genome-encoded Ycf4 protein functions as a nonessential assembly
factor for photosystem I in higher plants. Plant Physiol 159, 579-591.
Krysan, P.J., Young, J.C., and Sussman, M.R. (1999). T-DNA as an insertional mutagen in Arabidopsis. Plant
Cell 11, 2283-2290.
References
90
Kufryk, G.I., Sachet, M., Schmetterer, G., and Vermaas, W.F.J. (2002). Transformation of the
cyanobacterium Synechocystis sp PCC 6803 as a tool for genetic mapping: optimization of efficiency. FEMS
Microbiol Lett 206, 215-219.
Kunert, A., Hagemann, M., and Erdmann, N. (2000). Construction of promoter probe vectors for
Synechocystis sp PCC 6803 using the light-emitting reporter systems Gfp and LuxAB. J Microbiol Methods 41,
185-194.
Labarre, J., Chauvat, F., and Thuriaux, P. (1989). Insertional mutagenesis by random cloning of antibiotic-
resistance genes into the genome of the cyanobacterium Synechocystis strain PCC 6803. J Bacteriol 171, 3449-
3457.
Lalioti, M.D., and Heath, J.K. (2001). A new method for generating point mutations in bacterial artificial
chromosomes by homologous recombination in Escherichia coli. Nucl Acids Res 29.
Leister, D. (2003). Chloroplast research in the genomic age. Trends Genet 19, 47-56.
Leister, D. (2012). How can the light reactions of photosynthesis be improved in plants? Front Plant Sci 3, 199.
Lewin, R.A. (2002). Prochlorophyta - a matter of class distinctions. Photosynth Res 73, 59-61.
Lezhneva, L., and Meurer, J. (2004). The nuclear factor HCF145 affects chloroplast psaA-psaB-rps14
transcript abundance in Arabidopsis thaliana. Plant J 38, 740-753.
Lezhneva, L., Amann, K., and Meurer, J. (2004). The universally conserved HCF101 protein is involved in
assembly of [4Fe-4S]-cluster-containing complexes in Arabidopsis thaliana chloroplasts. Plant J 37, 174-185.
Liberton, M., Howard Berg, R., Heuser, J., Roth, R., and Pakrasi, H.B. (2006). Ultrastructure of the
membrane systems in the unicellular cyanobacterium Synechocystis sp. strain PCC 6803. Protoplasma 227, 129-
138.
Liu, H., Zhang, H., Niedzwiedzki, D.M., Prado, M., He, G., Gross, M.L., and Blankenship, R.E. (2013).
Phycobilisomes supply excitations to both photosystems in a megacomplex in cyanobacteria. Science 342, 1104-
1107.
Lunde, C., Jensen, P.E., Haldrup, A., Knoetzel, J., and Scheller, H.V. (2000). The PSI-H subunit of
photosystem I is essential for state transitions in plant photosynthesis. Nature 408, 613-615.
Mannan, R.M., Whitmarsh, J., Nyman, P., and Pakrasi, H.B. (1991). Directed mutagenesis of an iron-sulfur
protein of the photosystem I complex in the filamentous cyanobacterium Anabaena variabilis ATCC 29413.
Proc Natl Acad Sci U S A 88, 10168-10172.
Maple, J., and Møller, S.G. (2007). Mutagenesis in Arabidopsis. Methods Mol Biol 362, 197-206.
Martin, W. (2003). Gene transfer from organelles to the nucleus: frequent and in big chunks. Proc Natl Acad
Sci U S A 100, 8612-8614.
Martin, W., Rujan, T., Richly, E., Hansen, A., Cornelsen, S., Lins, T., Leister, D., Stoebe, B., Hasegawa,
M., and Penny, D. (2002). Evolutionary analysis of Arabidopsis, cyanobacterial, and chloroplast genomes
reveals plastid phylogeny and thousands of cyanobacterial genes in the nucleus. Proc Natl Acad Sci U S A 99,
12246-12251.
References
91
Matsuoka, M., Takahama, K., and Ogawa, T. (2001). Gene replacement in cyanobacteria mediated by a
dominant streptomycin-sensitive rps12 gene that allows selection of mutants free from drug resistance markers.
Microbiology 147, 2077-2087.
Maxwell, P.C., and Biggins, J. (1976). Role of cyclic electron transport in photosynthesis as measured by the
photoinduced turnover of P700 in vivo. Biochemistry 15, 3975-3981.
Meeks, J.C., Elhai, J., Thiel, T., Potts, M., Larimer, F., Lamerdin, J., Predki, P., and Atlas, R. (2001). An
overview of the genome of Nostoc punctiforme, a multicellular, symbiotic cyanobacterium. Photosynth Res 70,
85-106.
Mullineaux, C.W. (2005). Function and evolution of grana. Trends Plant Sci 10, 521-525.
Mullineaux, C.W. (2008). Phycobilisome-reaction centre interaction in cyanobacteria. Photosynth Res 95, 175-
182.
Munekage, Y., Hojo, M., Meurer, J., Endo, T., Tasaka, M., and Shikanai, T. (2002). PGR5 is involved in
cyclic electron flow around photosystem I and is essential for photoprotection in Arabidopsis. Cell 110, 361-371.
Murakami, A. (1997). Quantitative analysis of 77K fluorescence emission spectra in Synechocystis sp. PCC
6714 and Chlamydomonas reinhardtii with variable PS I/PS II stoichiometries. Photosynth Res 53, 141-148.
Murat, D., Byrne, M., and Komeili, A. (2012). Cell biology of prokaryotic organelles. Cold Spring Harb
Perspect Biol 2, a000422.
Mustárdy, L., and Garab, G. (2003). Granum revisited. A three-dimensional model-where things fall into
place. Trends Plant Sci 8, 117-122.
Mustárdy, L., Buttle, K., Steinbach, G., and Garab, G. (2008). The three-dimensional network of the
thylakoid membranes in plants: quasihelical model of the granum-stroma assembly. Plant Cell 20, 2552-2557.
Naver, H., Boudreau, E., and Rochaix, J.D. (2001). Functional studies of Ycf3: its role in assembly of
photosystem I and interactions with some of its subunits. Plant Cell 13, 2731-2745.
Nelson, N., and Ben-Shem, A. (2002). Photosystem I reaction center: past and future. Photosynth Res 73, 193-
206.
Nevo, R., Charuvi, D., Shimoni, E., Schwarz, R., Kaplan, A., Ohad, I., and Reich, Z. (2007). Thylakoid
membrane perforations and connectivity enable intracellular traffic in cyanobacteria. EMBO J 26, 1467-1473.
Nickelsen, J., and Rengstl, B. (2013). Photosystem II assembly: from cyanobacteria to plants. Annu Rev Plant
Biol 64, 609-635.
Nickelsen, J., Rengstl, B., Stengel, A., Schottkowski, M., Soll, J., and Ankele, E. (2010). Biogenesis of the
cyanobacterial thylakoid membrane system--an update. FEMS Microbiol Lett 315, 1-5.
Nixon, P.J., Rogner, M., and Diner, B.A. (1991). Expression of a higher-plant psba gene in Synechocystis 6803
yields a functional hybrid photosystem-II reaction center complex. Plant Cell 3, 383-395.
Niyogi, K.K., Li, X.P., Rosenberg, V., and Jung, H.S. (2005). Is PsbS the site of non-photochemical
quenching in photosynthesis? J Exp Bot 56, 375-382.
References
92
Ogawa, T. (1991). A gene homologous to the subunit-2 gene of NADH dehydrogenase is essential to inorganic
carbon transport of Synechocystis PCC6803. Proc Natl Acad Sci U S A 88, 4275-4279.
Oie, T., Maggiora, G.M., and Christoffersen, R.E. (1982). Structural characterization of a special-pair
chlorophyll dimer model of P700. Int J Quantum Chem 22, 157-171.
Olive, J., Ajlani, G., Astier, C., Recouvreour, M., and Vernotte, C. (1997). Ultrastructure and light adaptation
of phycobilisome mutants of Synechocystis PCC 6803. Biochim Biophys Acta - Bioenergetics 1319, 275-282.
Ossenbühl, F., Inaba-Sulpice, M., Meurer, J., Soll, J., and Eichacker, L.A. (2006). The Synechocystis sp
PCC 6803 oxa1 homolog is essential for membrane integration of reaction center precursor protein pD1. Plant
Cell 18, 2236-2246.
Ozawa, S., Onishi, T., and Takahashi, Y. (2010). Identification and characterization of an assembly
intermediate subcomplex of photosystem I in the green alga Chlamydomonas reinhardtii. J Biol Chem 285,
20072-20079.
Peredo, E.L., Les, D.H., King, U.M., and Benoit, L.K. (2012). Extreme conservation of the psaA/psaB
intercistronic spacer reveals a translational motif coincident with the evolution of land plants. J Mol Evol 75,
184-197.
Pesaresi, P., Schneider, A., Kleine, T., and Leister, D. (2007). Interorganellar communication. Curr Opin Plant
Biol 10, 600-606.
Pinto, F.L., Thapper, A., Sontheim, W., and Lindblad, P. (2009). Analysis of current and alternative phenol
based RNA extraction methodologies for cyanobacteria. BMC Mol Biol 10, 79.
Piven, I., Ajlani, G., and Sokolenko, A. (2005). Phycobilisome linker proteins are phosphorylated in
Synechocystis sp. PCC 6803. J Biol Chem 280, 21667-21672.
Powles, S.B. (1984). Photoinhibition of photosynthesis induced by visible light. Annu Rev Plant Physiol 35, 15-
44.
Rakhimberdieva, M.G., Boichenko, V.A., Karapetyan, N.V., and Stadnichuk, I.N. (2001). Interaction of
phycobilisomes with photosystem II dimers and photosystem I monomers and trimers in the cyanobacterium
Spirulina platensis. Biochemistry 40, 15780-15788.
Ried, J.L., and Collmer, A. (1987). An nptI-sacB-sacR cartridge for constructing directed, unmarked mutations
in gram-negative bacteria by marker exchange-eviction mutagenesis. Gene 57, 239-246.
Rippka, R., Deruelles, J., Waterbury, J.B., Herdman, M., and Stanier, R.Y. (1979). generic assignments,
strain histories and properties of pure cultures of cyanobacteria. J Gen Microbiol 111, 1-61.
Ruf, S., Kössel, H., and Bock, R. (1997). Targeted inactivation of a tobacco intron-containing open reading
frame reveals a novel chloroplast-encoded photosystem I-related gene. J Cell Biol 139, 95-102.
Sambrook, J., Fritsch, E.F., and Maniatis, T. (1989). Molecular Cloning: A Laboratory Manual (Cold Spring
Harbor Laboratory Press).
Sandmann, G., and Malkin, R. (1984). Light inhibition of respiration is due to a dual function of the
cytochrome b6f complex and the plastocyanin/cytochrome c553 pool in Aphanocapsa. Arch Biochem Biophys
234, 105-111.

References
93
Sato, S., Nakamura, Y., Kaneko, T., Asamizu, E., and Tabata, S. (1999). Complete structure of the
chloroplast genome of Arabidopsis thaliana. DNA Res 6, 283-290.
Schaffner, W., and Weissmann, C. (1973). A rapid, sensitive, and specific method for the determination of
protein in dilute solution. Anal Biochem 56, 502-514.
Schagger, H., and von Jagow, G. (1987). Tricine-sodium dodecyl sulfate-polyacrylamide gel electrophoresis
for the separation of proteins in the range from 1 to 100 kDa. Anal Biochem 166, 368-379.
Schagger, H., Aquila, H., and Von Jagow, G. (1988). Coomassie blue-sodium dodecyl sulfate-polyacrylamide
gel electrophoresis for direct visualization of polypeptides during electrophoresis. Anal Biochem 173, 201-205.
Scherer, S. (1990). Do photosynthetic and respiratory electron transport chains share redox proteins? Trends
Biochem Sci 15, 458-462.
Schöttler, M.A., Albus, C.A., and Bock, R. (2011). Photosystem I: its biogenesis and function in higher plants.
J Plant Physiol 168, 1452-1461.
Schwabe, T.M., and Kruip, J. (2000). Biogenesis and assembly of photosystem I. Indian J Biochem Biophys
37, 351-359.
Shapiro, A.L., Vinuela, E., and Maizel, J.V., Jr. (1967). Molecular weight estimation of polypeptide chains by
electrophoresis in SDS-polyacrylamide gels. Biochem Biophys Res Commun 28, 815-820.
Shen, G., Boussiba, S., and Vermaas, W.F. (1993). Synechocystis sp PCC 6803 strains lacking photosystem I
and phycobilisome function. Plant Cell 5, 1853-1863.
Shetty, R.P., Endy, D., and Knight, T.F., Jr. (2008). Engineering BioBrick vectors from BioBrick parts. J Biol
Eng 2, 5.
Shikanai, T. (2007). Cyclic electron transport around photosystem I: genetic approaches. Annu Rev Plant Biol
58, 199-217.
Shimoni, E., Rav-Hon, O., Ohad, I., Brumfeld, V., and Reich, Z. (2005). Three-dimensional organization of
higher-plant chloroplast thylakoid membranes revealed by electron tomography. Plant Cell 17, 2580-2586.
Smart, L.B., and McIntosh, L. (1993). Genetic inactivation of the psaB gene in Synechocystis sp. PCC 6803
disrupts assembly of photosystem I. Plant Mol Biol 21, 177-180.
Smart, L.B., Anderson, S.L., and Mcintosh, L. (1991). Targeted genetic inactivation of the photosystem I
reaction center in the cyanobacterium Synechocystis sp PCC 6803. EMBO J 10, 3289-3296.
Soll, J., and Schleiff, E. (2004). Protein import into chloroplasts. Nat Rev Mol Cell Biol 5, 198-208.
Steinmetz, M., Lecoq, D., Aymerich, S., Gonzytreboul, G., and Gay, P. (1985). The DNA sequence of the
gene for the secreted Bacillus subtilis enzyme levansucrase and its genetic control sites. Mol Gen Genet 200,
220-228.
Stöckel, J., Bennewitz, S., Hein, P., and Oelmüller, R. (2006). the evolutionarily conserved tetratrico peptide
repeat protein Pale Yellow Green7 is required for photosystem I accumulation in Arabidopsis and copurifies
with the complex. Plant Physiol 141, 870-878.
References
94
Tagawa, K., Tsujimoto, H.Y., and Arnon, D.I. (1963). Analysis of photosynthetic reactions by the use of
monochromatic light. Nature 199, 1247-1252.
Terasaki, N., Yamamoto, N., Tamada, K., Hattori, M., Hiraga, T., Tohri, A., Sato, I., Iwai, M., Taguchi,
S., Enami, I., Inoue, Y., Yamanoi, Y., Yonezawa, T., Mizuno, K., Murata, M., Nishihara, H., Yoneyama,
S., Minakata, M., Ohmori, T., Sakai, M., and Fujii, M. (2007). Bio-photosensor: Cyanobacterial photosystem
I coupled with transistor via molecular wire. Biochim Biophys Acta 1767, 653-659.
Thomas, D.J., Avenson, T.J., Thomas, J.B., and Herbert, S.K. (1998). A cyanobacterium lacking iron
superoxide dismutase is sensitized to oxidative stress induced with methyl viologen but is not sensitized to
oxidative stress induced with norflurazon. Plant Physiol 116, 1593-1602.
Thompson, J.D., Gibson, T.J., and Higgins, D.G. (2002). Multiple sequence alignment using ClustalW and
ClustalX. Curr Protoc Bioinformatics Chapter 2, Unit 2 3.
Tillett, D., and Neilan, B.A. (2000). Xanthogenate nucleic acid isolation from cultured and environmental
cyanobacteria. J Phycol 36, 251-258.
Timmis, J.N., Ayliffe, M.A., Huang, C.Y., and Martin, W. (2004). Endosymbiotic gene transfer: organelle
genomes forge eukaryotic chromosomes. Nat Rev Genet 5, 123-135.
Timms, A.R., Steingrimsdottir, H., Lehmann, A.R., and Bridges, B.A. (1992). Mutant sequences in the rpsL
gene of Escherichia coli B/r: mechanistic implications for spontaneous and ultraviolet light mutagenesis. Mol
Gen Genet 232, 89-96.
Trissl, H.W., and Wilhelm, C. (1993). Why do thylakoid membranes from higher plants form grana stacks?
Trends Biochem Sci 18, 415-419.
Vallejos, R.H., Ceccarelli, E., and Chan, R. (1984). Evidence for the existence of a thylakoid intrinsic protein
that binds ferredoxin-NADP+ oxidoreductase. J Biol Chem 259, 8048-8051.
van der Est, A., Bock, C., Golbeck, J., Brettel, K., Setif, P., and Stehlik, D. (1994). Electron transfer from the
acceptor A1 to the iron-sulfur centers in photosystem I as studied by transient EPR spectroscopy. Biochemistry
33, 11789-11797.
Vermaas, W. (1996). Molecular genetics of the cyanobacterium Synechocystis sp. PCC 6803: Principles and
possible biotechnology applications. J Appl Phycol 8, 263-273.
Vermaas, W.F.J., Williams, J.G.K., and Arntzen, C.J. (1987). Sequencing and modification of psbB, the gene
encoding the CP-47 protein of Photosystem II, in the cyanobacterium Synechocystis 6803. Plant Mol Biol 8, 317-
326.
Vermaas, W.F.J., Williams, J.G.K., Rutherford, A.W., Mathis, P., and Arntzen, C.J. (1986). Genetically
engineered mutant of the cyanobacterium Synechocystis 6803 lacks the photosystem II chlorophyll-binding
protein CP-47. Proc Natl Acad Sci U S A 83, 9474-9477.
Viola S., Rühle T., Leister D. A single vector-based strategy for marker-less gene replacement in Synechocystis
sp. PCC 6803. Submitted.
Wagner, D., Przybyla, D., Op den Camp, R., Kim, C., Landgraf, F., Lee, K.P., Würsch, M., Laloi, C.,
Nater, M., Hideg, E., and Apel, K. (2004). The genetic basis of singlet oxygen-induced stress responses of
Arabidopsis thaliana. Science 306, 1183-1185.
References
95
Whatley, J.M., and Whatley, F.R. (1981). Chloroplast Evolution. New Phytol 87, 233-&.
Wilde, A., Lunser, K., Ossenbühl, F., Nickelsen, J., and Börner, T. (2001). Characterization of the
cyanobacterial ycf37: mutation decreases the photosystem I content. Biochem J 357, 211-216.
Wilde, A., Härtel, H., Hübschmann, T., Hoffmann, P., Shestakov, S.V., and Börner, T. (1995). Inactivation
of a Synechocystis sp strain PCC 6803 gene with homology to conserved chloroplast open reading frame 184
increases the photosystem II-to-photosystem I ratio. Plant Cell 7, 649-658.
Williams, J.G.K. (1988). Construction of specific mutations in photosystem II photosynthetic reaction center by
genetic-engineering methods in Synechocystis 6803. Methods Enzymol 167, 766-778.
Wolk, C.P., Cai, Y.P., and Panoff, J.M. (1991). Use of a transposon with luciferase as a reporter to identify
environmentally responsive genes in a cyanobacterium. Proc Natl Acad Sci U S A 88, 5355-5359.
Woodson, J.D., and Chory, J. (2008). Coordination of gene expression between organellar and nuclear
genomes. Nat Rev Genet 9, 383-395.
Xu, W., Wang, Y.C., Taylor, E., Laujac, A., Gao, L.Y., Savikhin, S., and Chitnis, P.R. (2011). Mutational
analysis of photosystem I of Synechocystis sp PCC 6803: the role of four conserved aromatic residues in the j-
helix of PsaB. PLoS One 6.
Yao, D.C., Brune, D.C., and Vermaas, W.F. (2011). Lifetimes of photosystem I and II proteins in the
cyanobacterium Synechocystis sp. PCC 6803. FEBS Lett 586, 169-173.
Yeremenko, N., Jeanjean, R., Prommeenate, P., Krasikov, V., Nixon, P.J., Vermaas, W.F., Havaux, M.,
and Matthijs, H.C. (2005). Open reading frame ssr2016 is required for antimycin A-sensitive photosystem I-
driven cyclic electron flow in the cyanobacterium Synechocystis sp. PCC 6803. Plant Cell Physiol 46, 1433-
1436.
Yu, L., Zhao, J., Muhlenhoff, U., Bryant, D.A., and Golbeck, J.H. (1993). PsaE is required for in vivo cyclic
electron flow around photosystem I in the cyanobacterium Synechococcus sp. PCC 7002. Plant Physiol 103, 171-
180.
Zang, X.N., Liu, B., Liu, S.M., Arunakumara, K.K.I.U., and Zhang, X.C. (2007). Optimum conditions for
transformation of Synechocystis sp PCC 6803. J Microbiol 45, 241-245.

Acknowledgements
96
Acknowledgements
I would like to thank Prof. Dr. Dario Leister for giving me the opportunity and the funding to
accomplish my Ph.D. in his research group and for involving me in this inspiring project.
Thanks to Prof. Dr. Jörg Nickelsen for taking over the “Zweitgutachter”.
I would like to thank Dr. Thilo Rühle for the kind and useful supervision and the motivation,
support and good ideas he gave me throughout my entire Ph.D.
Thanks to all the people in the lab for the years spent together with the bad and good
moments, the failures and the successes.
Thanks to Anne for the years of friendship.
Thanks to all my old and new roomies Antoine, Michi, Julia, Nina, Julian, Tobi, Alina, Olga,
Antonin, Christoph and Samuel for making my life better day by day.
Thanks to Luca for being in all the previous categories.
Thanks to my friends at home, that are always there and always with me.
Thanks to Francesco, for the past, present and future time together.
A special thank to my mum and dad and to my great sisters, for everything.
Curriculum vitae
97
Curriculum vitae
Personal details
Name: Stefania Viola
Date of birth: 26.02.1985
Place of birth: Brescia (BS), Italy
Citizenship: Italian
Education
October 2004 – December 2007
Bachelor degree in Molecular Biology. Final grade: 110/110 with honor
Università degli studi di Padova (Padova, Italy)
October 2008 – July 2010
Master degree in Molecular Biology. Final grade: 110/110 with honor
Università degli studi di Padova (Padova, Italy)
Research experience
September 2007 – December 2007
Research project: “Cloning and expression in bacterial system of a new putative peroxidase of
Arabidopsis thaliana thylakoid membrane”
Supervisor: Dr. Elisabetta Bergantino, Università degli studi di Padova (Padova, Italy)
September 2009 – July 2010
Research project: “Further dissection of haem biosynthesis in Arabidopsis thaliana-
Ferrochelatase II characterization”
Supervisors: Prof. Dario Leister & Dr. Tatjana Kleine
Universitá degli Studi di Padova (Padova, Italy)
Thesis done at Ludwig Maximilians Universität (München, Germany) as a part of the
Erasmus program
Curriculum vitae
98
Publications
# Armbruster, U.*, Labs, M.*, Pribil, M.*, Viola, S.*, Xu, W., Scharfenberg, M., Hertle, A.P., Rojahn, U.,
Jensen, P.E., Rappaport, F., Joliot, P., Dormann, P., Wanner, G., and Leister, D. (2013). Arabidopsis
CURVATURE THYLAKOID1 proteins modify thylakoid architecture by inducing membrane curvature. Plant
Cell 25, 2661-2678.
# Viola S., Rühle T., Leister D. (2014). A single vector-based strategy for marker-less gene replacement in
Synechocystis sp. PCC 6803. Microb Cell Fact 13:4
* Authors contributed equally
# Publications related to this dissertation

Declaration / Eidesstatliche Erklärung
99
Declaration / Eidesstattliche Erkläring
Ich versichere hiermit an Eides statt, dass die vorgelegte Dissertation von mir selbständig und
ohne unerlaubte Hilfe angefertigt ist.
München, den
Stefania Viola