
VILNIUS / RIGA DECEMBER 3/4, 2018 HEALTHY INDOOR CLIMATE, DAYLIGHT AND...
68
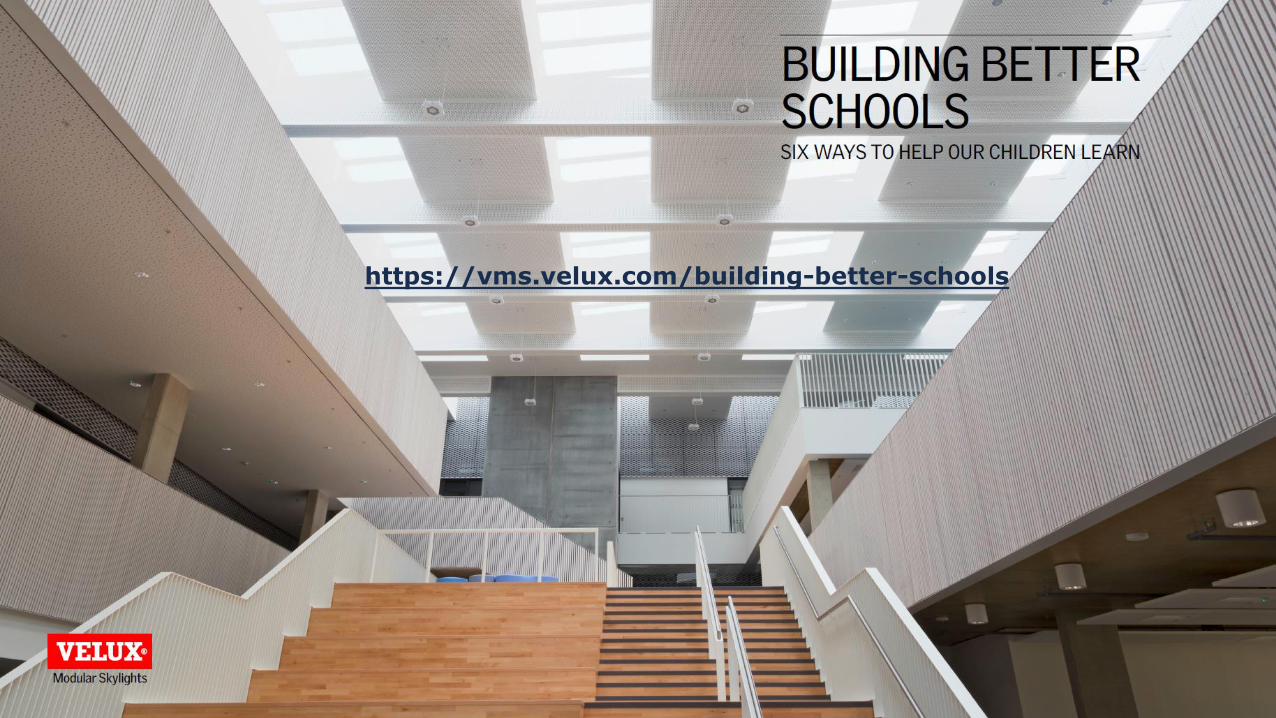
HEALTHY INDOOR CLIMATE, DAYLIGHT AND THE EUROPEAN HEALTHY HOMES BAROMETER J Christoffersen, PhD Senior Researcher Daylight Energy and Indoor Climate Group, VELUX A/S, Denmark VILNIUS / RIGA DECEMBER 3/4, 2018
Transcript of VILNIUS / RIGA DECEMBER 3/4, 2018 HEALTHY INDOOR CLIMATE, DAYLIGHT AND...
HEALTHY INDOOR CLIMATE, DAYLIGHT AND THE EUROPEAN HEALTHY HOMES BAROMETER
J Christoffersen, PhD Senior ResearcherDaylight Energy and Indoor Climate Group, VELUX A/S, Denmark
VILNIUS / RIGA
DECEMBER 3/4, 2018
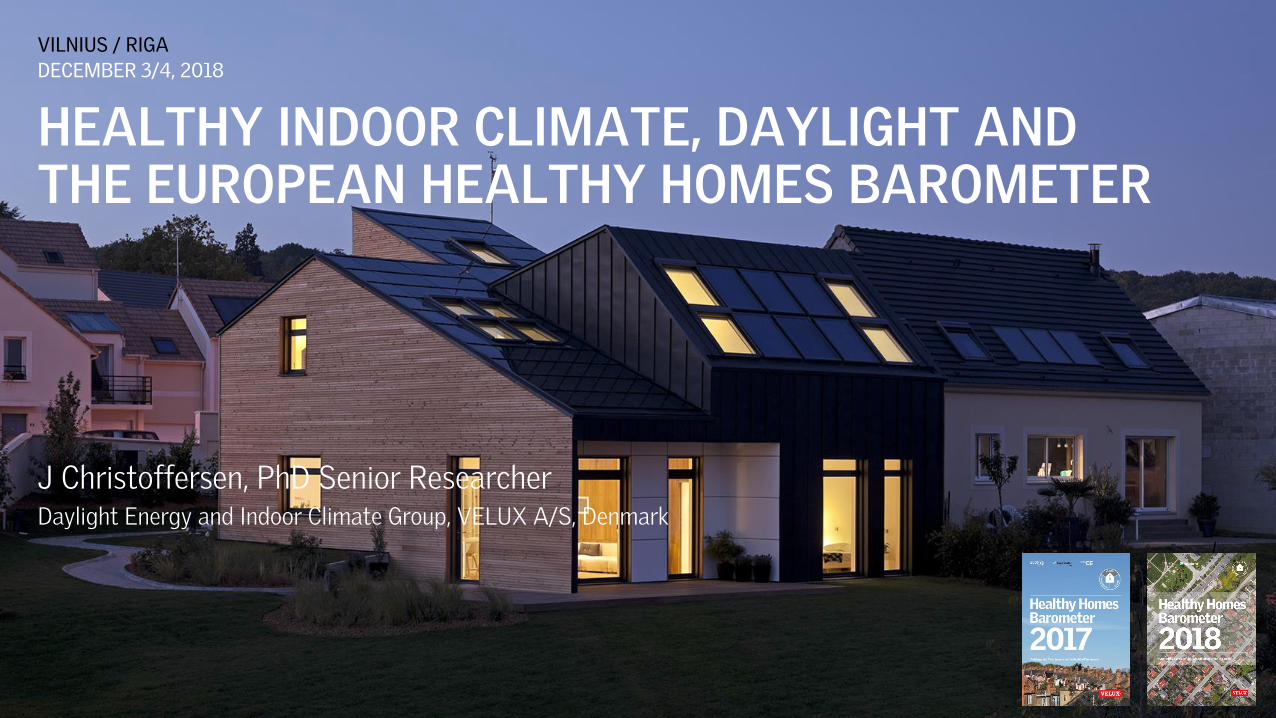
HOW TO CREATE HOMES FOR THE INDOOR GENERATION ?
2
of our time is spent indoor; our homes (2/3 of this time), at workplaces, schools, and other public spaces.
WHO Europe (2014)

Light grey, use
eyedropper to
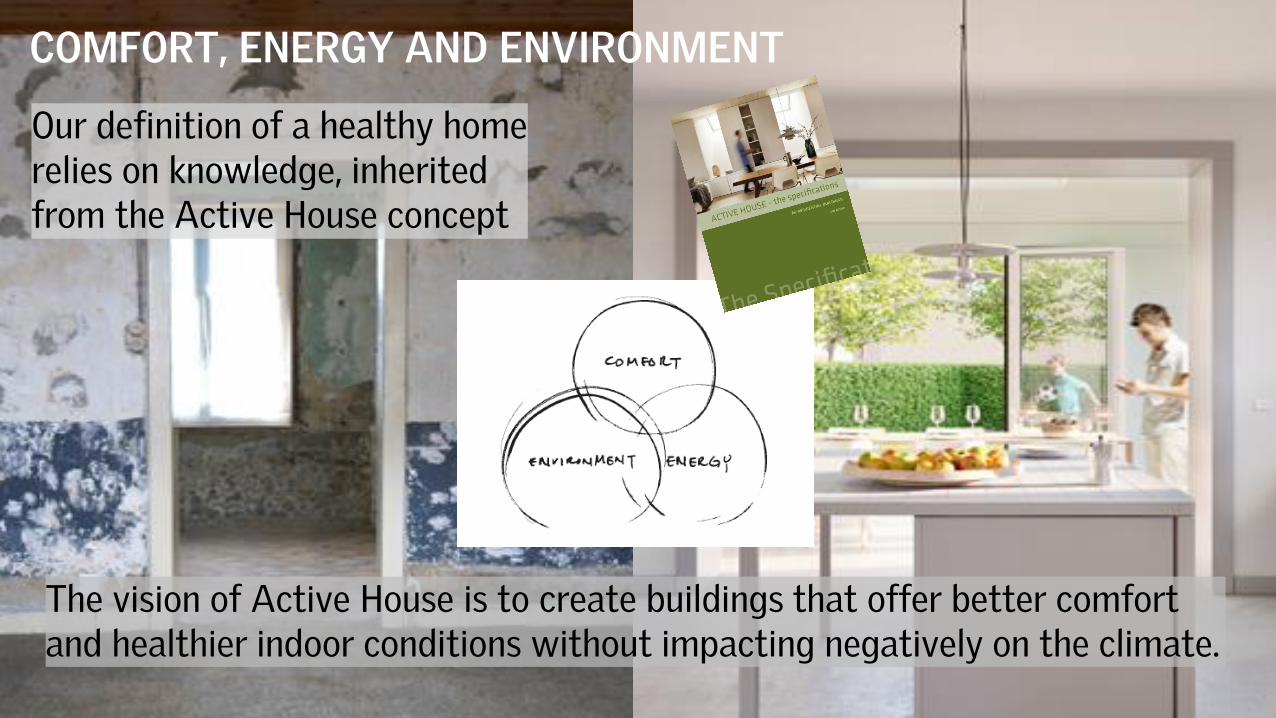
COMFORT, ENERGY AND ENVIRONMENT
Our definition of a healthy home relies on knowledge, inherited from the Active House concept
The vision of Active House is to create buildings that offer better comfort and healthier indoor conditions without impacting negatively on the climate.
5
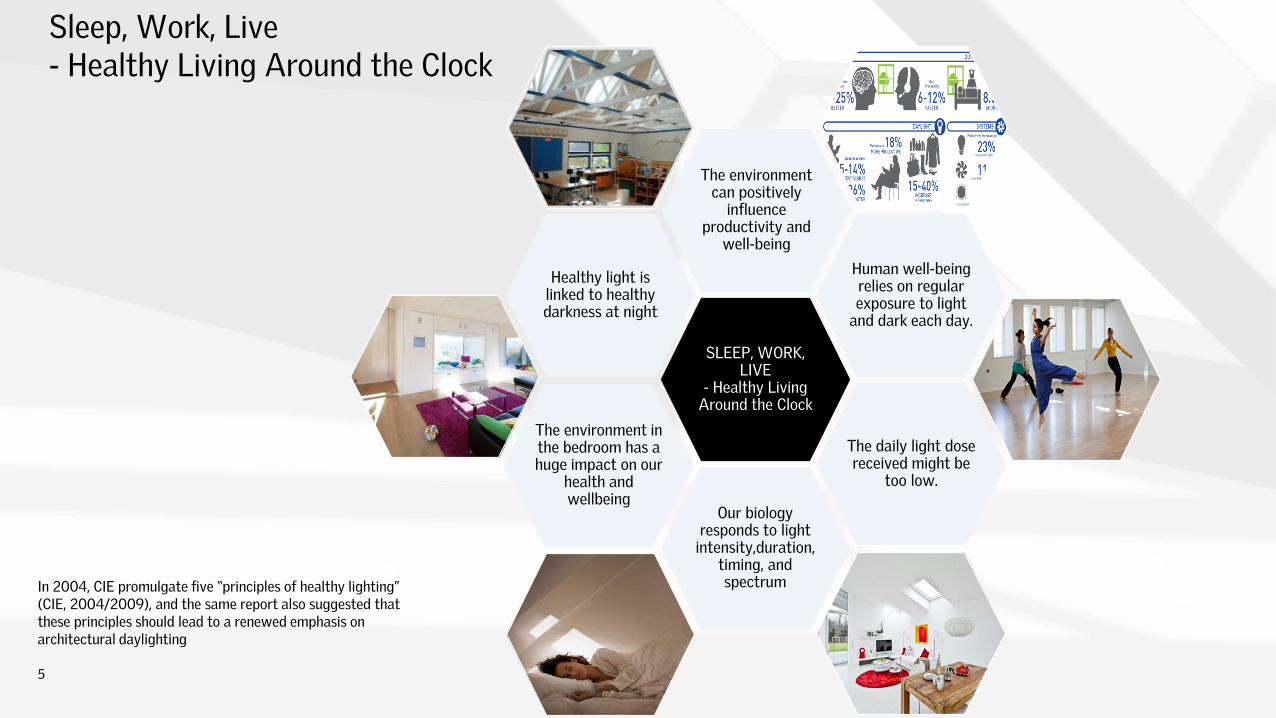
Sleep, Work, Live- Healthy Living Around the Clock
The environment in the bedroom has a huge impact on our
health and wellbeing
SLEEP, WORK, LIVE
- Healthy Living Around the Clock
Healthy light is linked to healthy darkness at night
Human well-being relies on regular exposure to light
and dark each day.
The daily light dose received might be
too low.
Our biology responds to light
intensity,duration, timing, and spectrum
The environment can positively
influence productivity and
well-being
In 2004, CIE promulgate five “principles of healthy lighting” (CIE, 2004/2009), and the same report also suggested that these principles should lead to a renewed emphasis on architectural daylighting
@ HOME
8
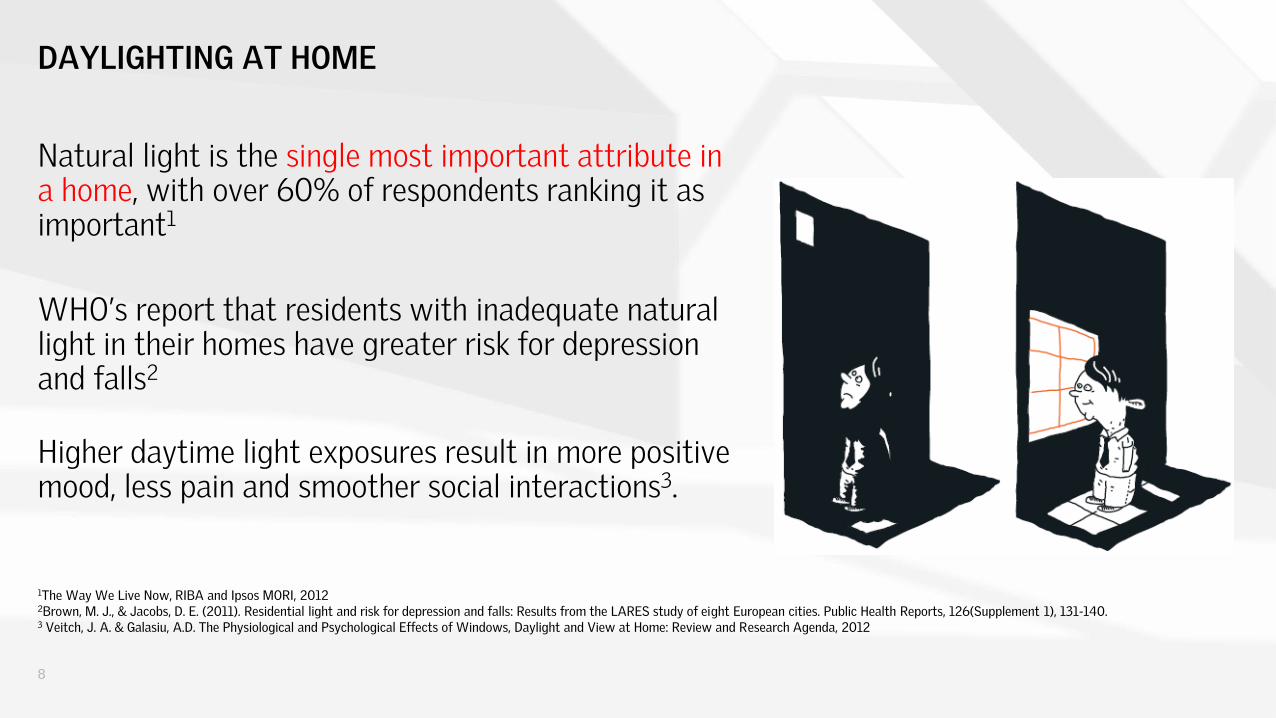
Natural light is the single most important attribute in a home, with over 60% of respondents ranking it as important1
WHO’s report that residents with inadequate natural light in their homes have greater risk for depression and falls2
Higher daytime light exposures result in more positive mood, less pain and smoother social interactions3.
1The Way We Live Now, RIBA and Ipsos MORI, 20122Brown, M. J., & Jacobs, D. E. (2011). Residential light and risk for depression and falls: Results from the LARES study of eight European cities. Public Health Reports, 126(Supplement 1), 131-140.3 Veitch, J. A. & Galasiu, A.D. The Physiological and Psychological Effects of Windows, Daylight and View at Home: Review and Research Agenda, 2012
DAYLIGHTING AT HOME
HEALTHY HOMES BAROMETER2015 2016 2017 2018
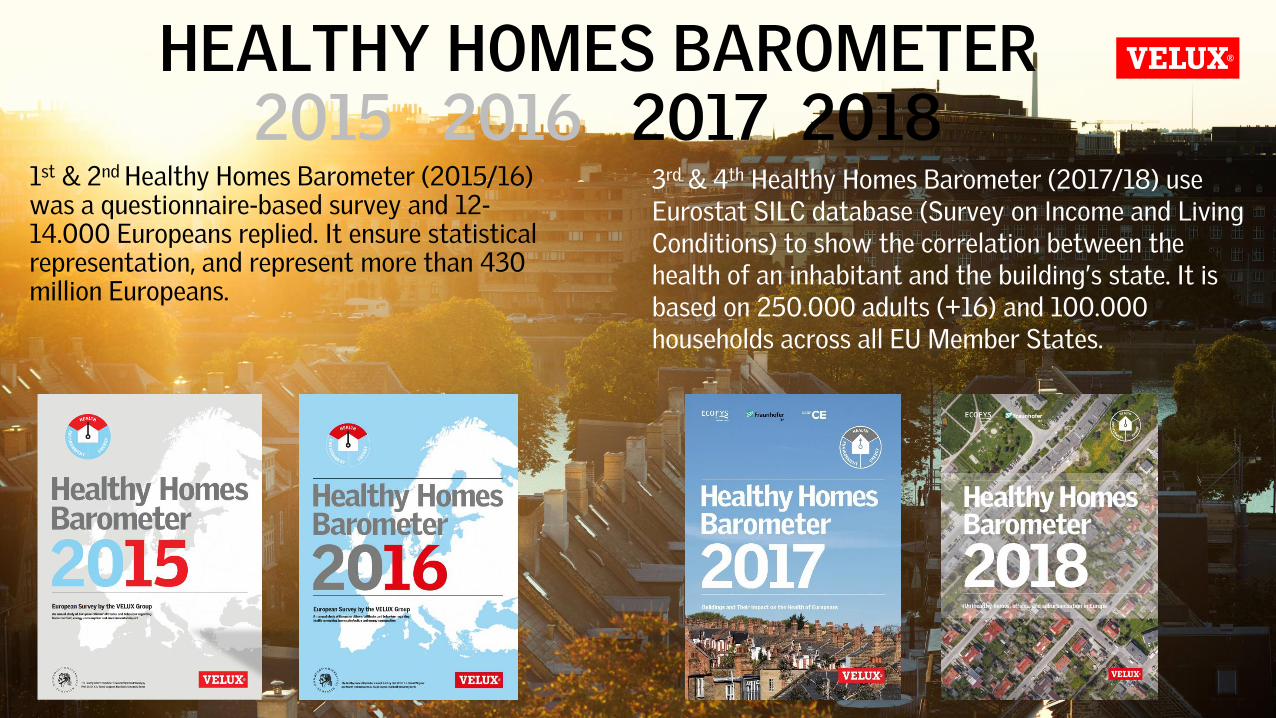
1st & 2nd Healthy Homes Barometer (2015/16) was a questionnaire-based survey and 12-14.000 Europeans replied. It ensure statistical representation, and represent more than 430 million Europeans.
3rd & 4th Healthy Homes Barometer (2017/18) use Eurostat SILC database (Survey on Income and Living Conditions) to show the correlation between the health of an inhabitant and the building’s state. It is based on 250.000 adults (+16) and 100.000 households across all EU Member States.
100%
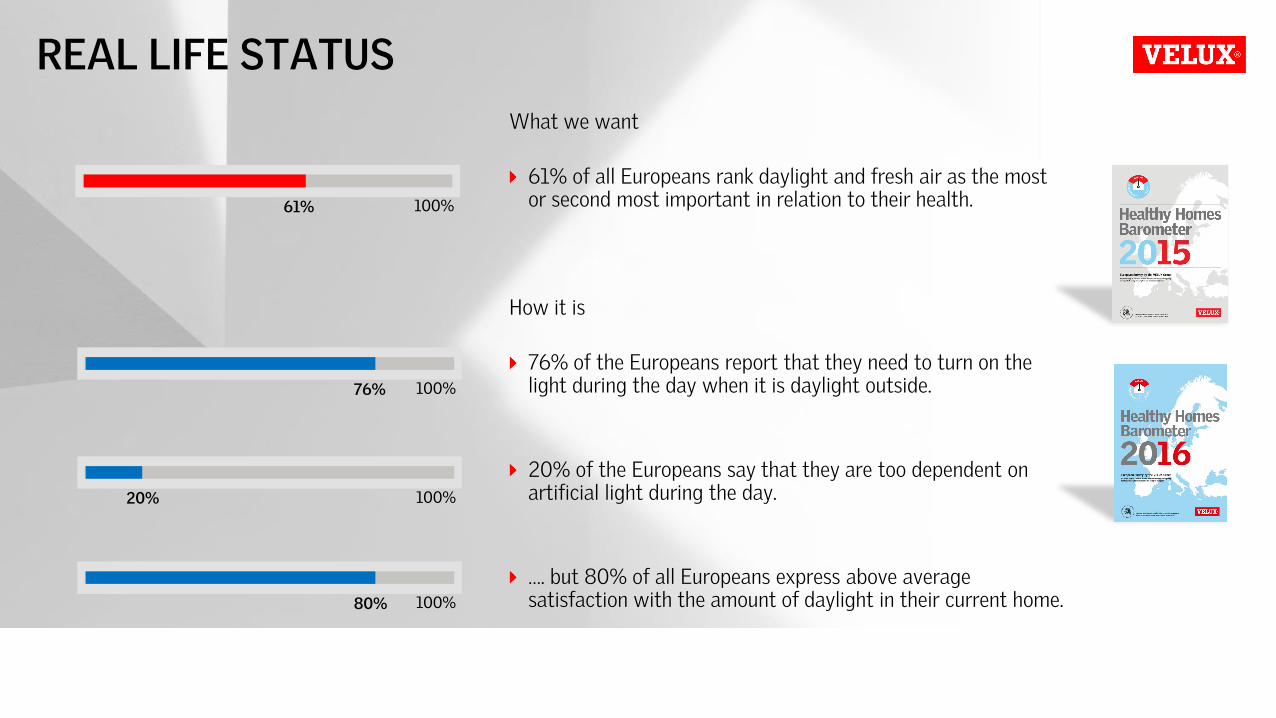
REAL LIFE STATUS
What we want
61% of all Europeans rank daylight and fresh air as the most or second most important in relation to their health.
How it is
76% of the Europeans report that they need to turn on the light during the day when it is daylight outside.
20% of the Europeans say that they are too dependent on artificial light during the day.
…. but 80% of all Europeans express above average satisfaction with the amount of daylight in their current home.
61%
100%76%
100%20%
100%80%
100%
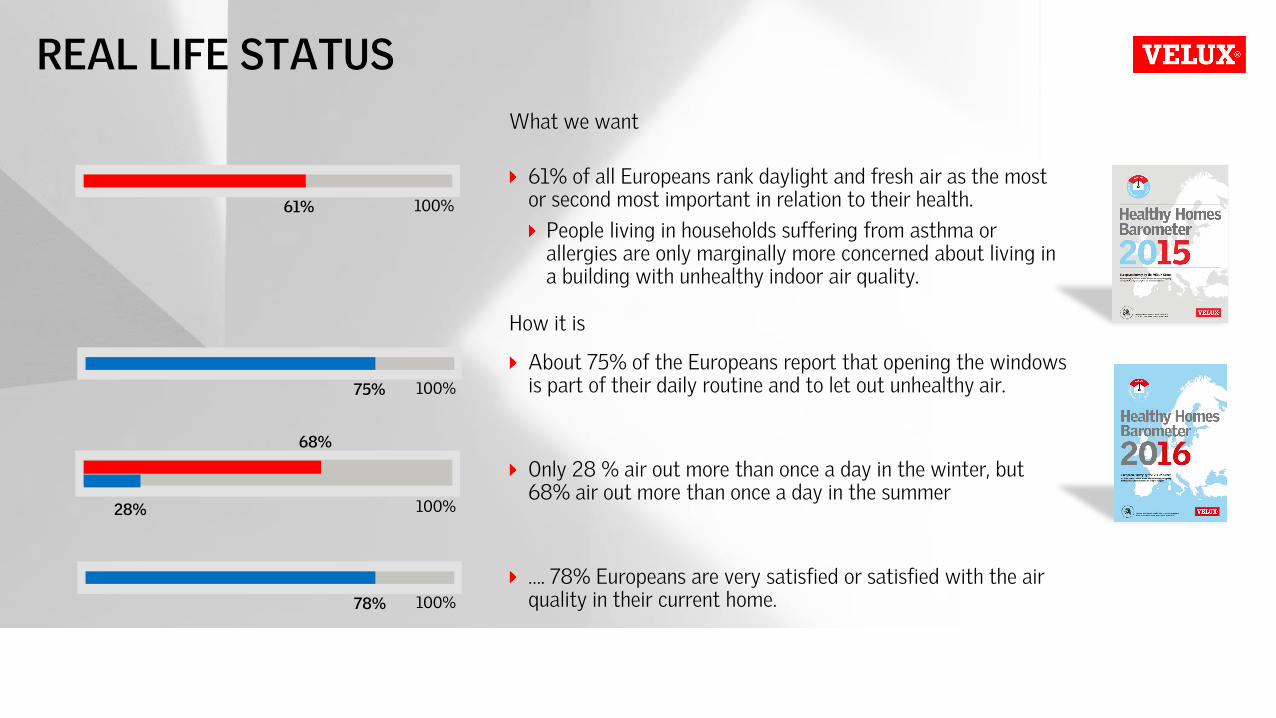
REAL LIFE STATUS
What we want
61% of all Europeans rank daylight and fresh air as the most or second most important in relation to their health.
People living in households suffering from asthma or allergies are only marginally more concerned about living in a building with unhealthy indoor air quality.
How it is
About 75% of the Europeans report that opening the windows is part of their daily routine and to let out unhealthy air.
Only 28 % air out more than once a day in the winter, but 68% air out more than once a day in the summer
…. 78% Europeans are very satisfied or satisfied with the air quality in their current home.
61%
100%75%
100%78%
100%28%
68%
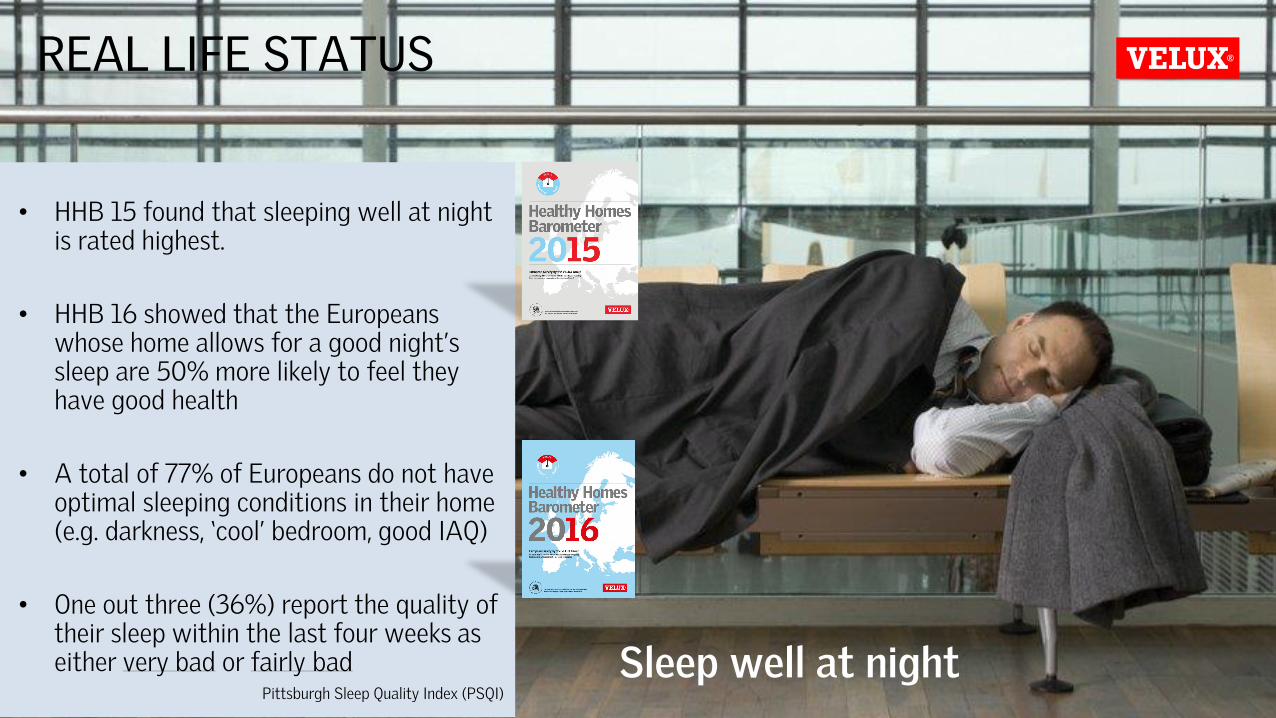
12 Sleep well at night
• HHB 15 found that sleeping well at nightis rated highest.
• HHB 16 showed that the Europeans whose home allows for a good night’s sleep are 50% more likely to feel they have good health
• A total of 77% of Europeans do not have optimal sleeping conditions in their home (e.g. darkness, ‘cool’ bedroom, good IAQ)
• One out three (36%) report the quality of their sleep within the last four weeks as either very bad or fairly bad
Pittsburgh Sleep Quality Index (PSQI)
REAL LIFE STATUS

HOW TO CREATE A ‘HEALTHY’ HOME
Five steps to a healthy home
Ensure good sleeping conditions; 72% of Europeans do not air out their bedrooms before going to sleep
Strive for comfortable indoor temperatures; 37% of Europeans value low energy costs over comfortable indoor temperatures
Let in fresh air; 59% of Europeans air out their homes less than the recommended two times a day (WHO Europe, 2009)
Let in daylight; 76% of Europeans compensate for insufficient access to daylight by turning on artificial light
Avoid humidity; 49% of Europeans do not place priority on avoiding too much humidity
100%72%
100%78%
100%37%
100%49%
100%59%
The Healthy Homes Barometer 2017 is the first report to use detailed statistical data from Eurostat SILC (Survey on Income and Living Conditions) to show the correlation between the health of an inhabitant and the building’s state.
This year’s study continue 2017 to further demonstrates just how important our suburban areas are to achieve a healthier building stock, as well as also offices and buildings where we spend our working days
THE HEALTHY HOMES BAROMETER 2017
15 VELUX COMPANY
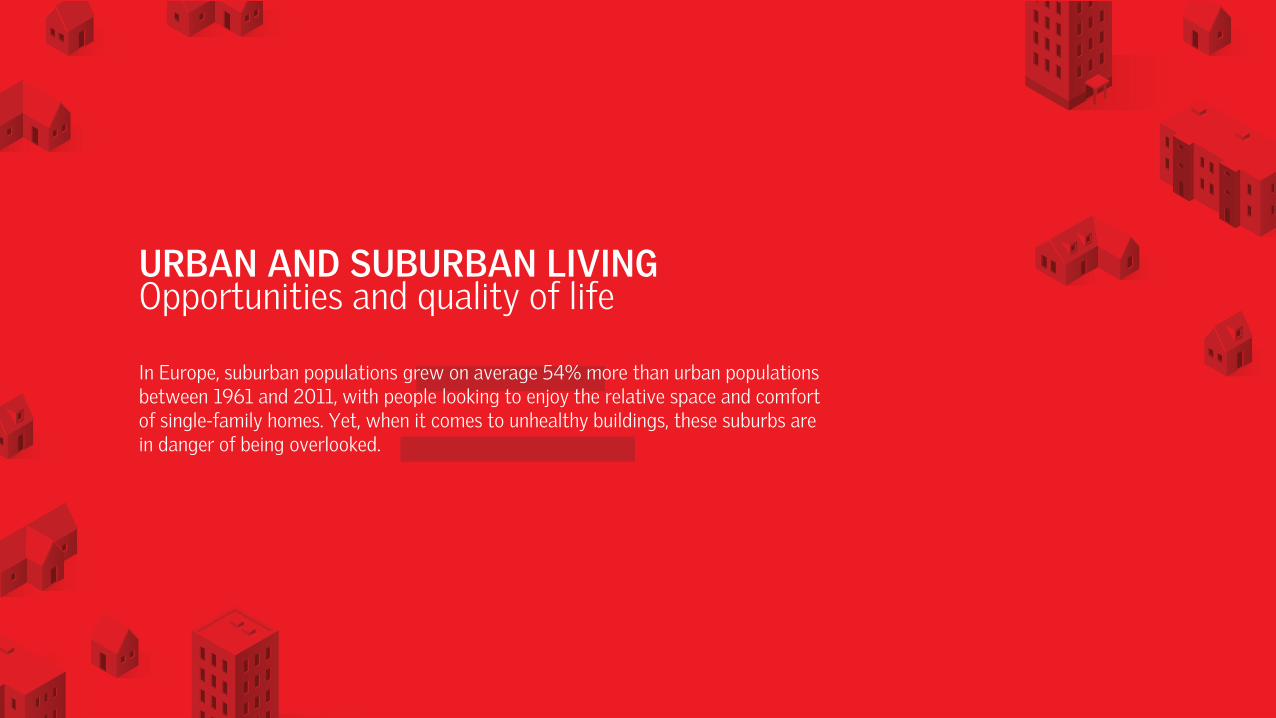
URBAN AND SUBURBAN LIVING
In Europe, suburban populations grew on average 54% more than urban populations between 1961 and 2011, with people looking to enjoy the relative space and comfortof single-family homes. Yet, when it comes to unhealthy buildings, these suburbs arein danger of being overlooked.
Opportunities and quality of life
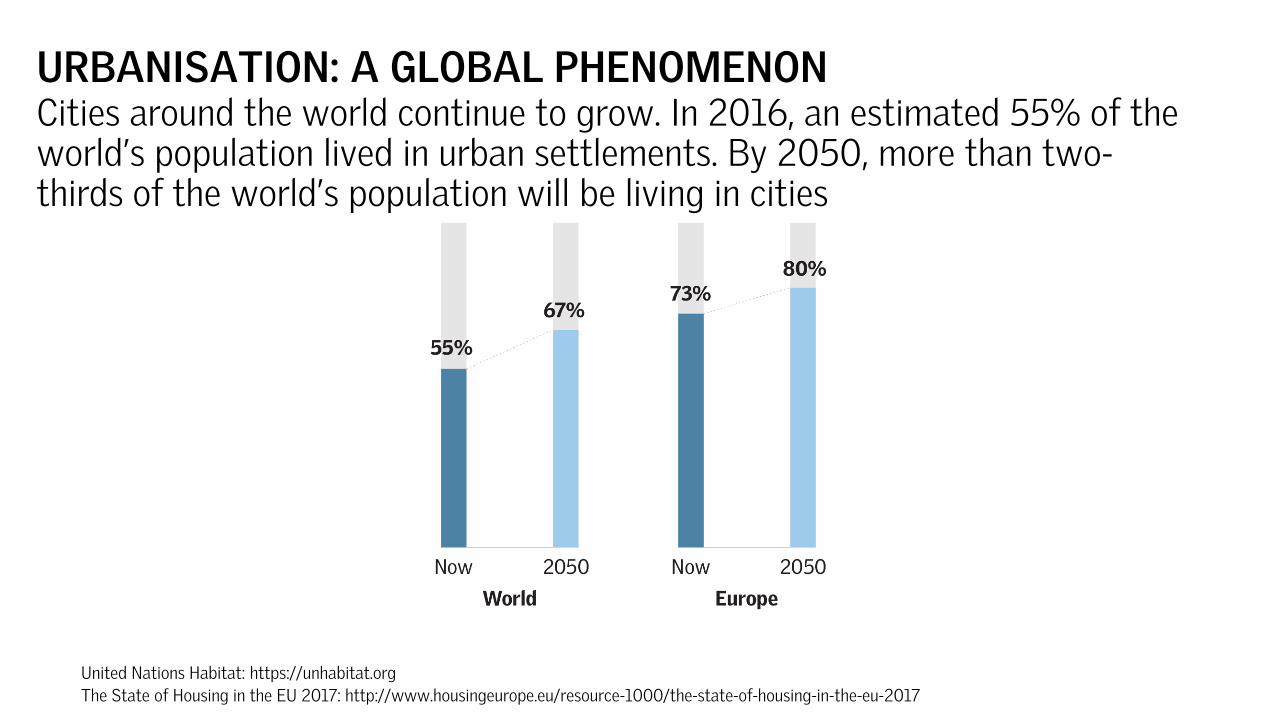
URBANISATION: A GLOBAL PHENOMENONCities around the world continue to grow. In 2016, an estimated 55% of the world’s population lived in urban settlements. By 2050, more than two-thirds of the world’s population will be living in cities
United Nations Habitat: https://unhabitat.org
The State of Housing in the EU 2017: http://www.housingeurope.eu/resource-1000/the-state-of-housing-in-the-eu-2017
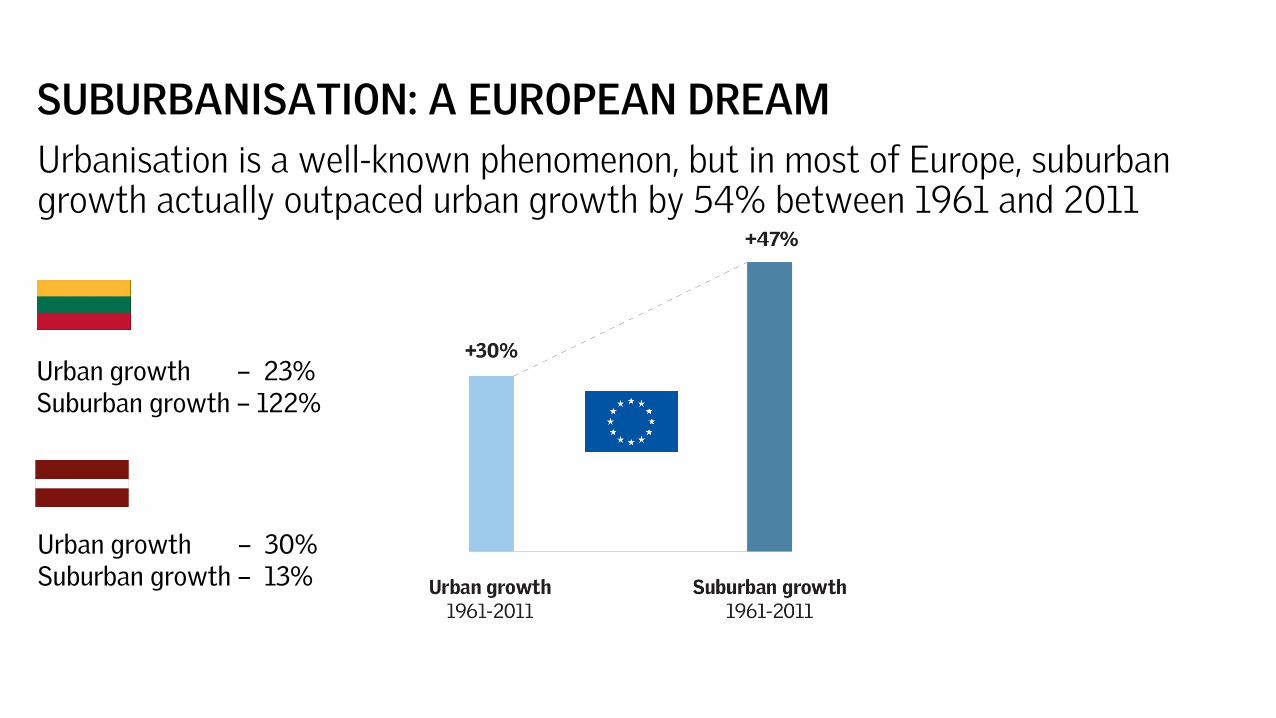
SUBURBANISATION: A EUROPEAN DREAM
Urbanisation is a well-known phenomenon, but in most of Europe, suburban growth actually outpaced urban growth by 54% between 1961 and 2011
Urban growth – 23%Suburban growth – 122%
Urban growth – 30%Suburban growth – 13%
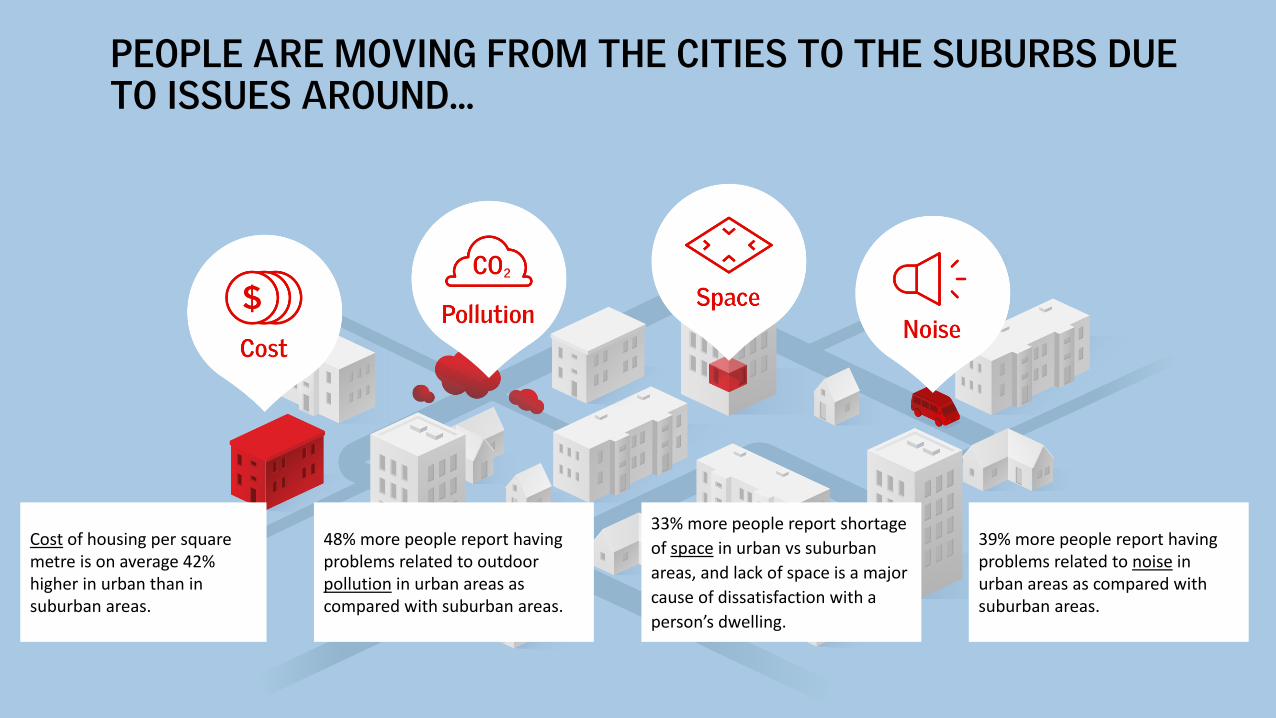
PEOPLE ARE MOVING FROM THE CITIES TO THE SUBURBS DUE TO ISSUES AROUND...
33% more people report shortage
of space in urban vs suburban
areas, and lack of space is a major
cause of dissatisfaction with a
person’s dwelling.
Cost of housing per square metre is on average 42% higher in urban than in suburban areas.
48% more people report having problems related to outdoor pollution in urban areas as compared with suburban areas.
39% more people report having problems related to noise in urban areas as compared with suburban areas.
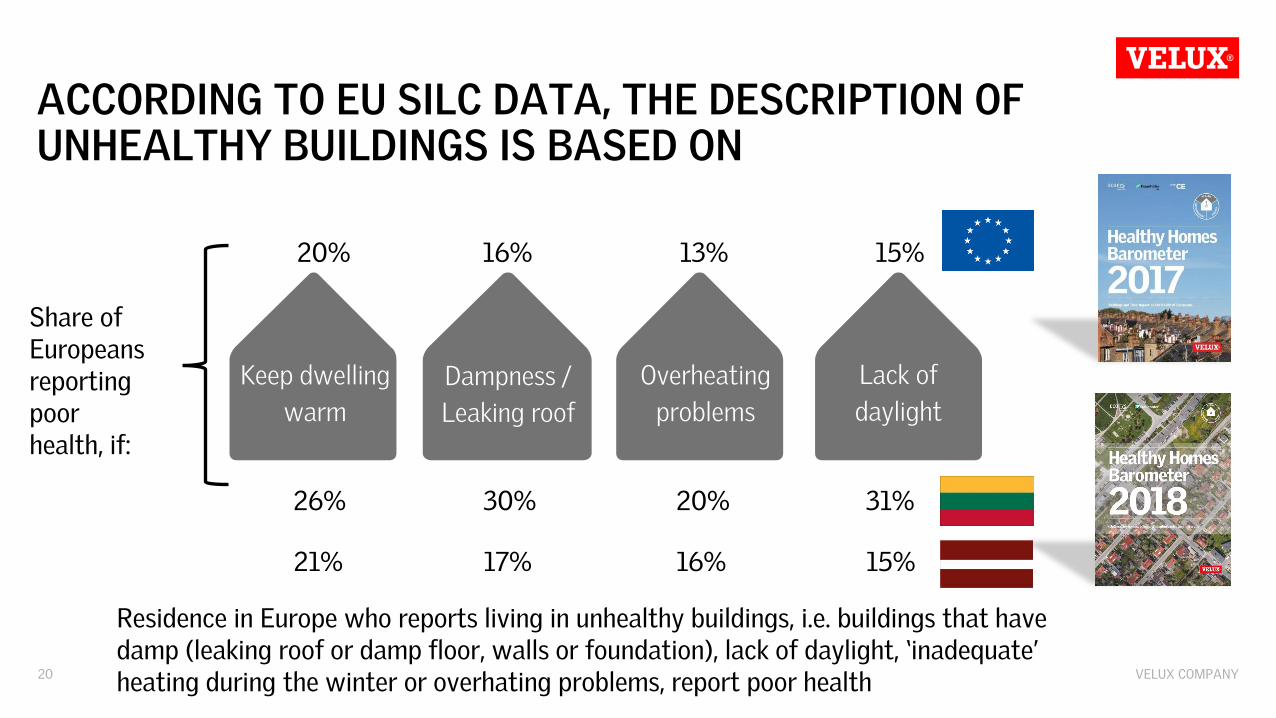
ACCORDING TO EU SILC DATA, THE DESCRIPTION OF UNHEALTHY BUILDINGS IS BASED ON
20 VELUX COMPANY
Keep dwelling
warm
Dampness /
Leaking roof
Overheating
problems
Lack of
daylight
16%
30%
15%
31%
13%
20%
20%
26%
Residence in Europe who reports living in unhealthy buildings, i.e. buildings that have damp (leaking roof or damp floor, walls or foundation), lack of daylight, ‘inadequate’ heating during the winter or overhating problems, report poor health
Share of Europeans reportingpoorhealth, if:
17% 15%16%21%
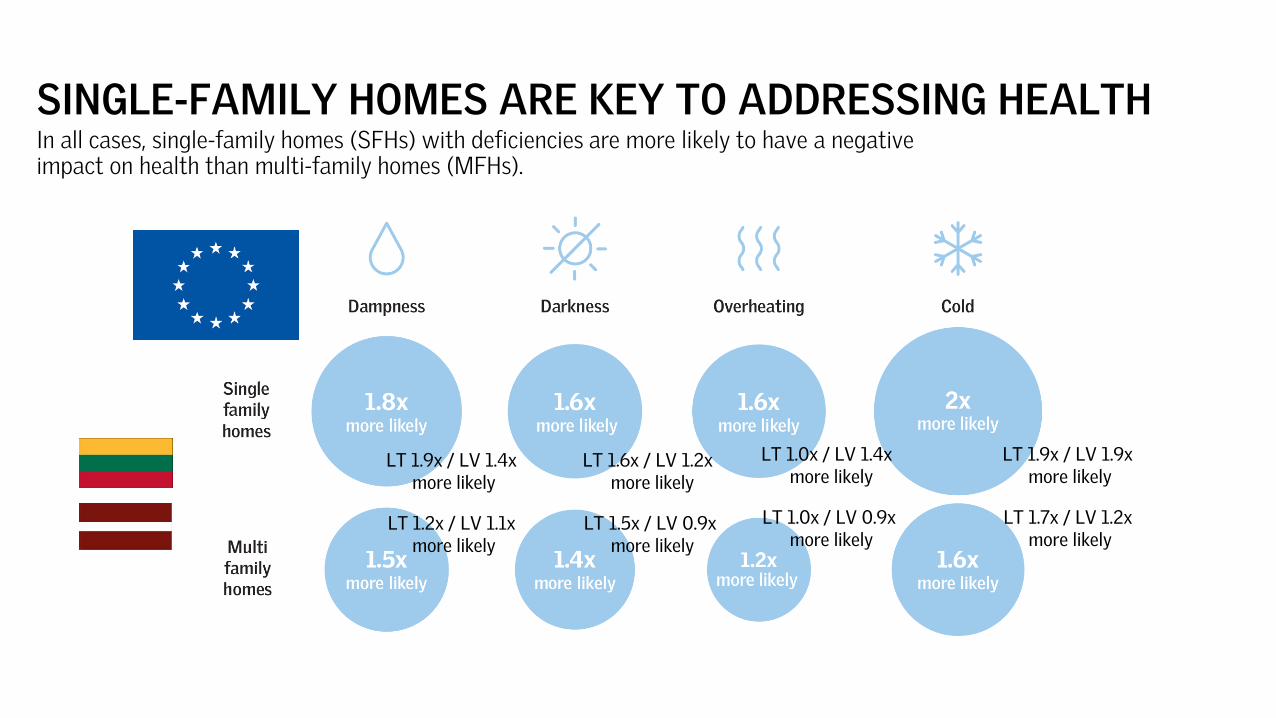
SINGLE-FAMILY HOMES ARE KEY TO ADDRESSING HEALTHIn all cases, single-family homes (SFHs) with deficiencies are more likely to have a negative impact on health than multi-family homes (MFHs).
LT 1.9x / LV 1.9x more likely
LT 1.7x / LV 1.2x more likely
LT 1.0x / LV 1.4x more likely
LT 1.0x / LV 0.9x more likely
LT 1.6x / LV 1.2x more likely
LT 1.5x / LV 0.9x more likely
LT 1.9x / LV 1.4x more likely
LT 1.2x / LV 1.1x more likely
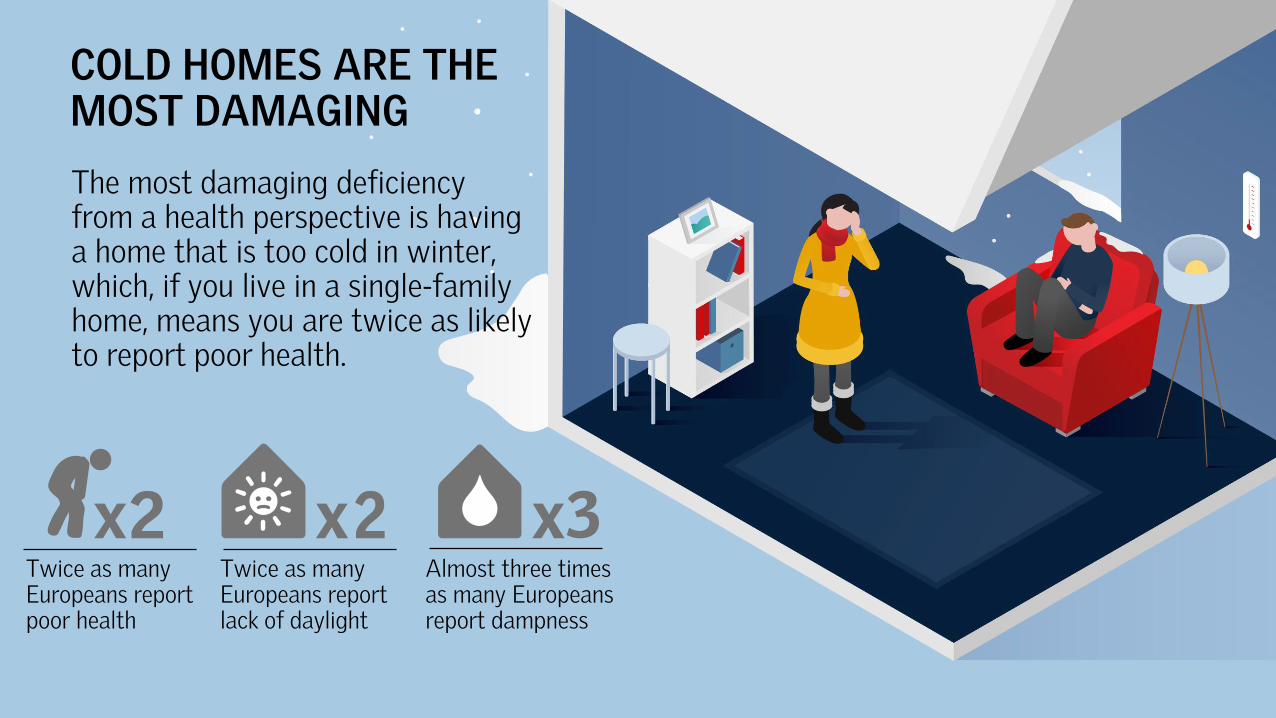
COLD HOMES ARE THE MOST DAMAGING
The most damaging deficiencyfrom a health perspective is havinga home that is too cold in winter, which, if you live in a single-familyhome, means you are twice as likelyto report poor health.
Twice as manyEuropeans reportlack of daylight
Almost three times as many Europeans report dampness
Twice as manyEuropeans reportpoor health
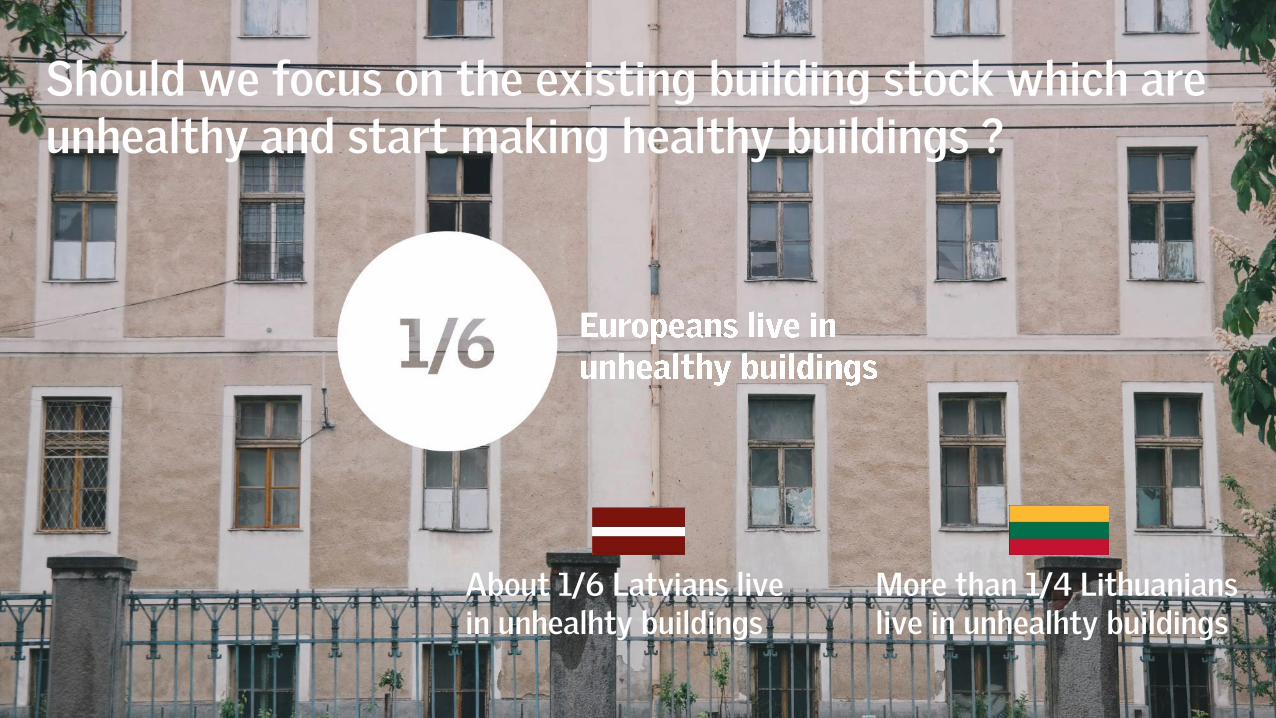
Should we focus on the existing building stock which are unhealthy and start making healthy buildings ?
About 1/6 Latvians live in unhealhty buildings
More than 1/4 Lithuanians live in unhealhty buildings
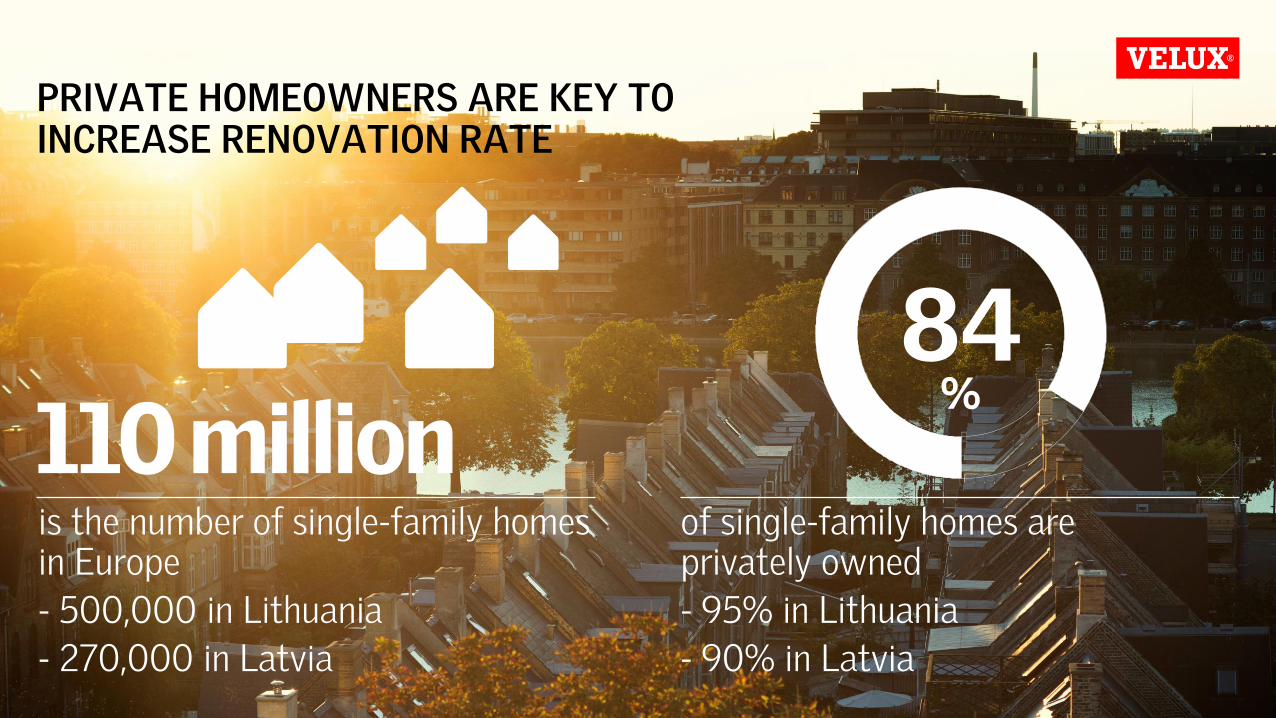
PRIVATE HOMEOWNERS ARE KEY TO INCREASE RENOVATION RATE
is the number of single-family homes in Europe
- 500,000 in Lithuania
- 270,000 in Latvia
of single-family homes areprivately owned
- 95% in Lithuania
- 90% in Latvia
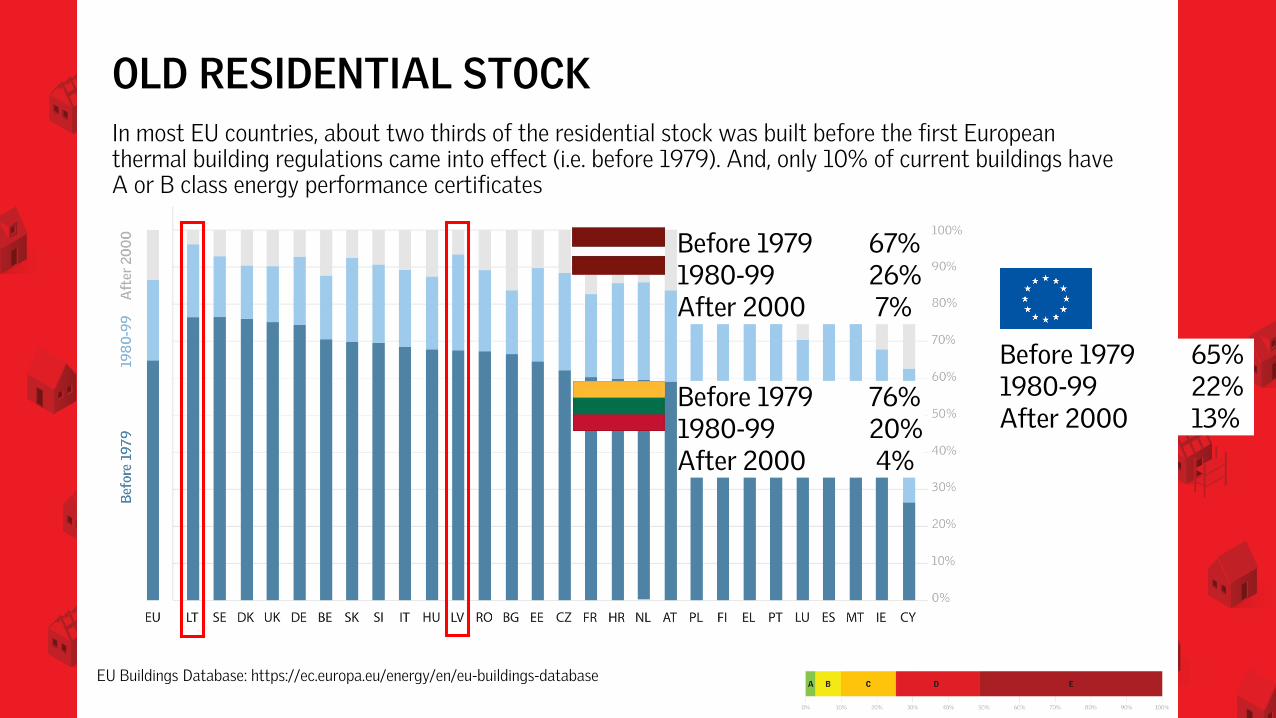
OLD RESIDENTIAL STOCKIn most EU countries, about two thirds of the residential stock was built before the first European thermal building regulations came into effect (i.e. before 1979). And, only 10% of current buildings have A or B class energy performance certificates
EU Buildings Database: https://ec.europa.eu/energy/en/eu-buildings-database
Before 1979 67%1980-99 26%After 2000 7%
Before 1979 76%1980-99 20%After 2000 4%
Before 1979 65%1980-99 22%After 2000 13%
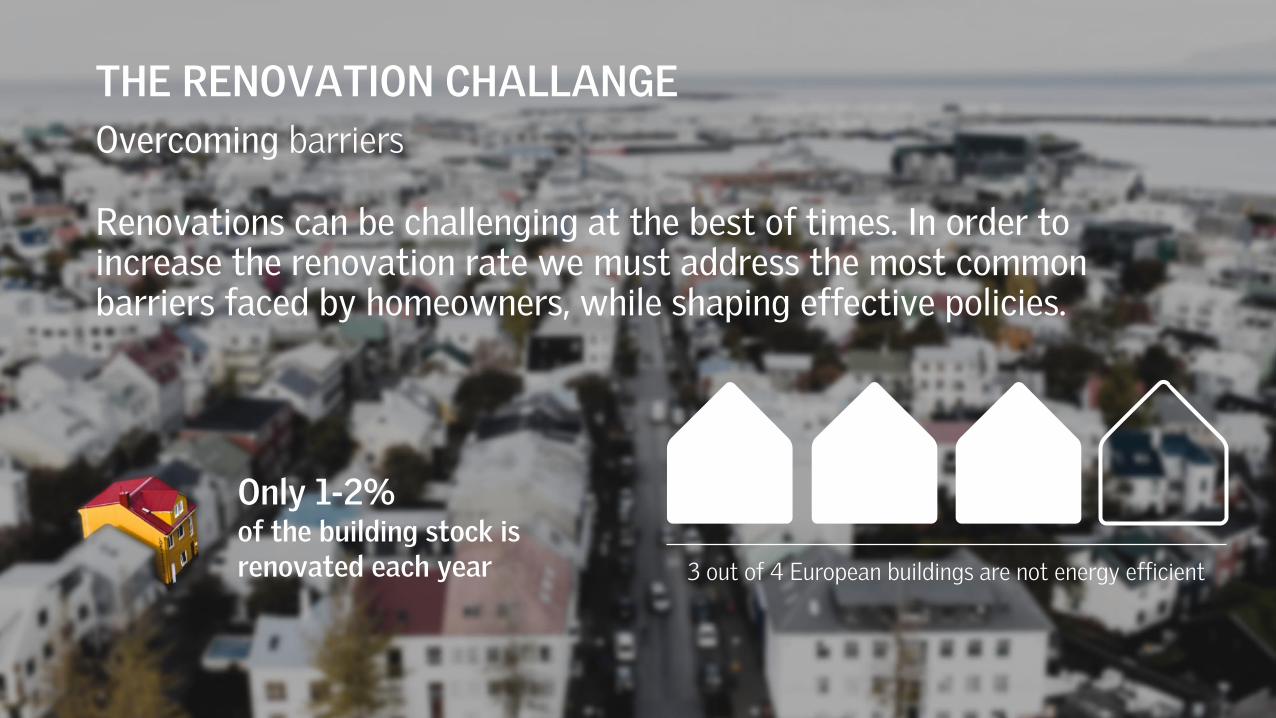
Only 1-2%of the building stock is renovated each year
THE RENOVATION CHALLANGE
Overcoming barriers
Renovations can be challenging at the best of times. In order to increase the renovation rate we must address the most common barriers faced by homeowners, while shaping effective policies.
3 out of 4 European buildings are not energy efficient
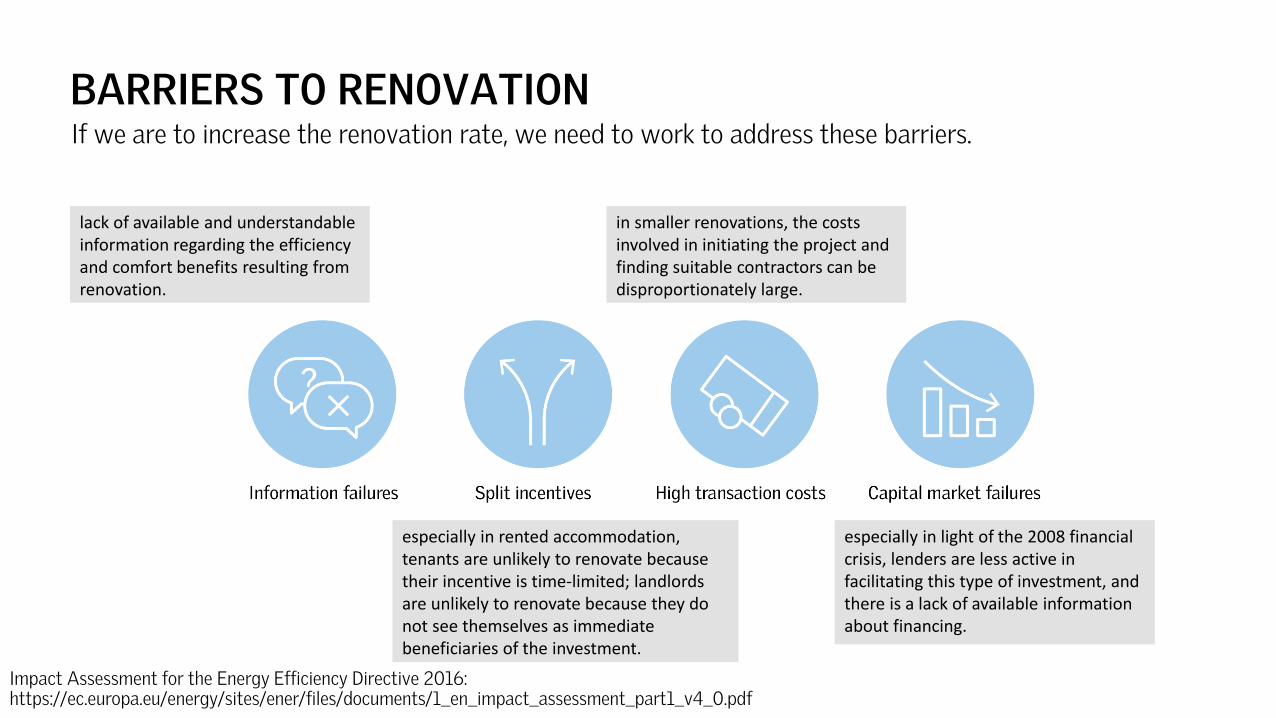
BARRIERS TO RENOVATIONIf we are to increase the renovation rate, we need to work to address these barriers.
Impact Assessment for the Energy Efficiency Directive 2016: https://ec.europa.eu/energy/sites/ener/files/documents/1_en_impact_assessment_part1_v4_0.pdf
lack of available and understandableinformation regarding the efficiency and comfort benefits resulting from renovation.
especially in rented accommodation, tenants are unlikely to renovate because their incentive is time-limited; landlords are unlikely to renovate because they do not see themselves as immediatebeneficiaries of the investment.
in smaller renovations, the costs involved in initiating the project and finding suitable contractors can be disproportionately large.
especially in light of the 2008 financial crisis, lenders are less active in facilitating this type of investment, and there is a lack of available information about financing.
SOCIAL AND AFFORDABLE HOUSINGRenovating for life
People with lower available income are more likely to be tenants thanhomeowners, or to live in social or municipal accommodation. Strategies thatcatalyse renovation in this sector are a win-win, with huge potential benefitsfor societies and individuals.
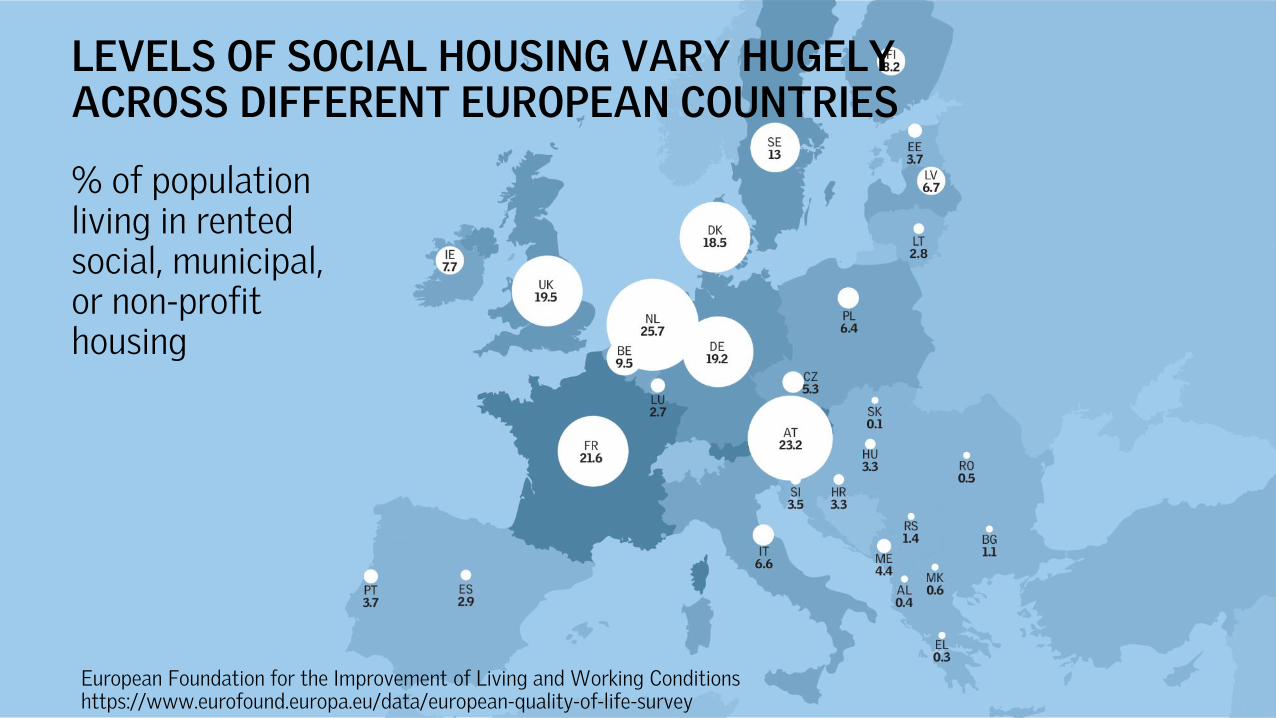
LEVELS OF SOCIAL HOUSING VARY HUGELYACROSS DIFFERENT EUROPEAN COUNTRIES
% of population living in rentedsocial, municipal, or non-profit housing
European Foundation for the Improvement of Living and Working Conditions https://www.eurofound.europa.eu/data/european-quality-of-life-survey
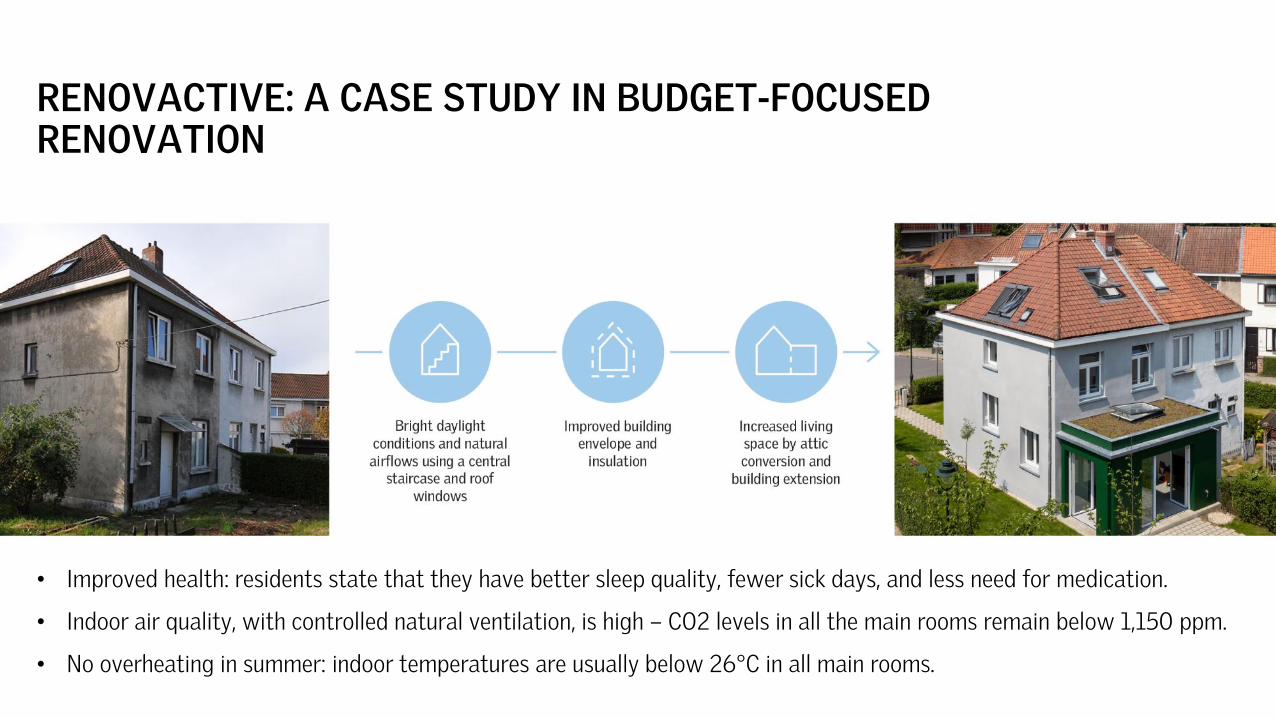
RENOVACTIVE: A CASE STUDY IN BUDGET-FOCUSEDRENOVATION
• Improved health: residents state that they have better sleep quality, fewer sick days, and less need for medication.
• Indoor air quality, with controlled natural ventilation, is high – CO2 levels in all the main rooms remain below 1,150 ppm.
• No overheating in summer: indoor temperatures are usually below 26°C in all main rooms.
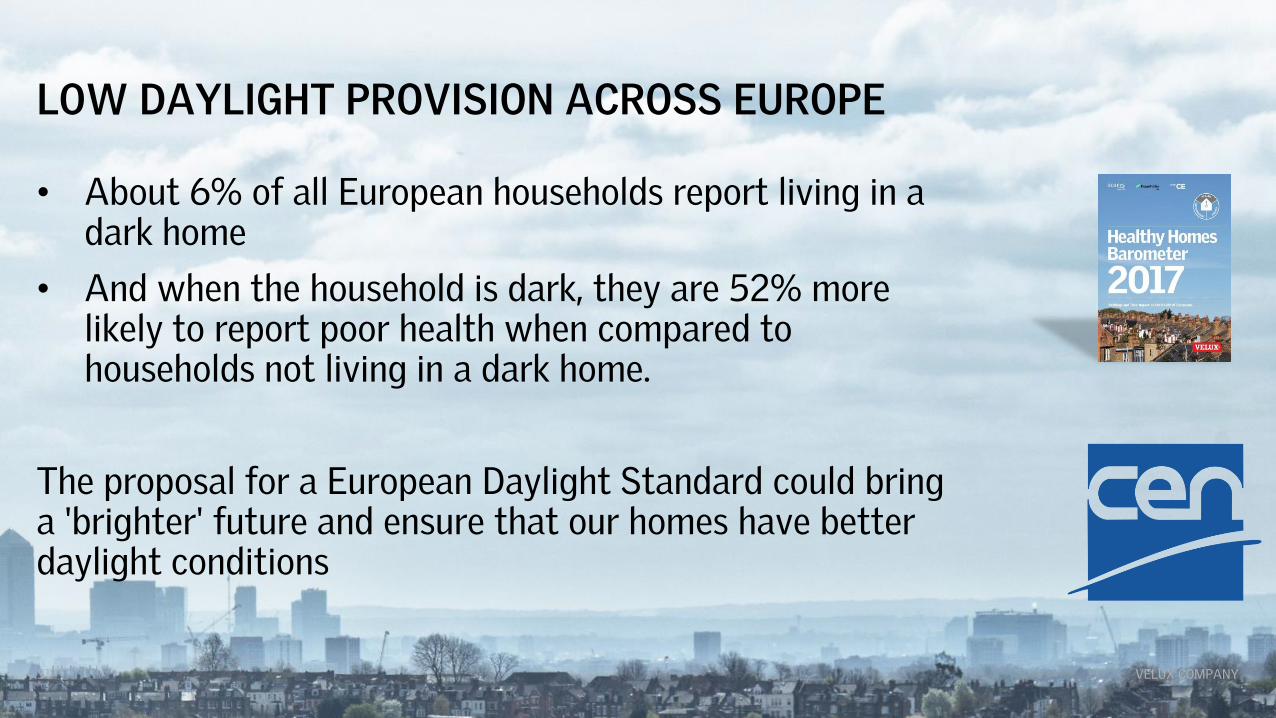
LOW DAYLIGHT PROVISION ACROSS EUROPE
31 VELUX COMPANY
• About 6% of all European households report living in a dark home
• And when the household is dark, they are 52% more likely to report poor health when compared to households not living in a dark home.
The proposal for a European Daylight Standard could bring a 'brighter' future and ensure that our homes have better daylight conditions
@ WORK, LEARNING …
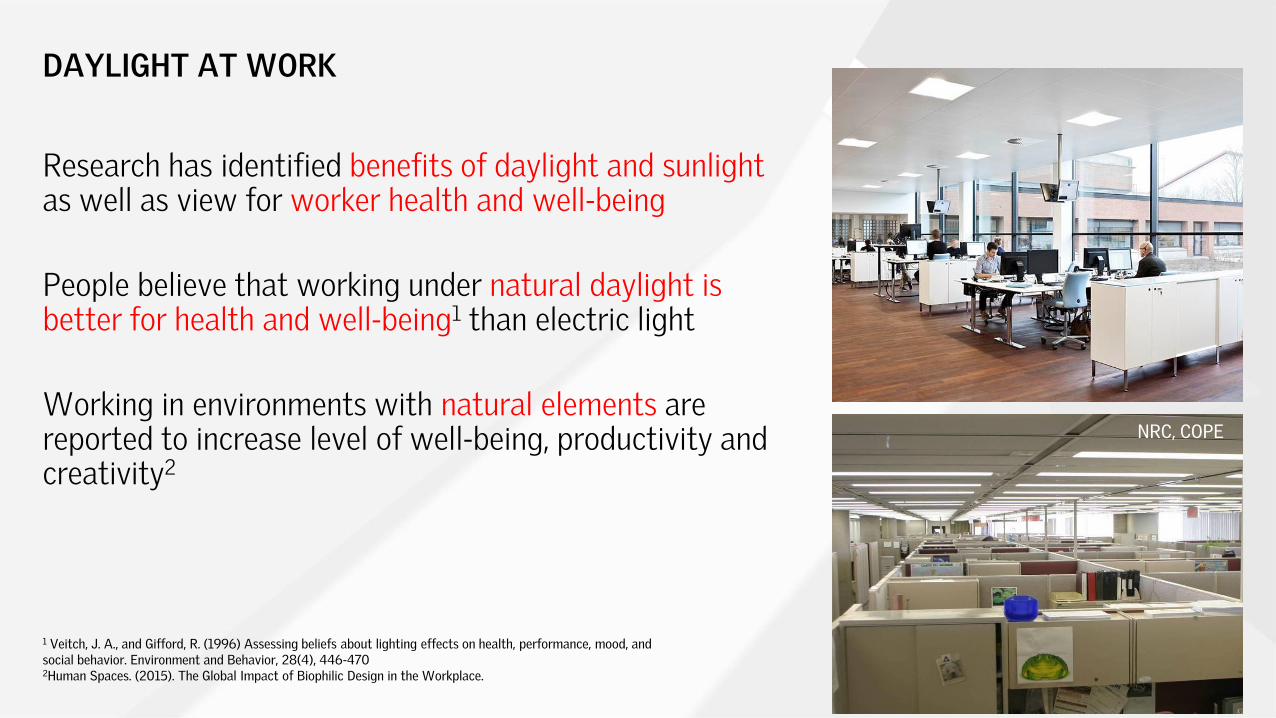
Research has identified benefits of daylight and sunlight as well as view for worker health and well-being
People believe that working under natural daylight is better for health and well-being1 than electric light
Working in environments with natural elements are reported to increase level of well-being, productivity and creativity2
DAYLIGHT AT WORK
NRC, COPE
1 Veitch, J. A., and Gifford, R. (1996) Assessing beliefs about lighting effects on health, performance, mood, and social behavior. Environment and Behavior, 28(4), 446-4702Human Spaces. (2015). The Global Impact of Biophilic Design in the Workplace.
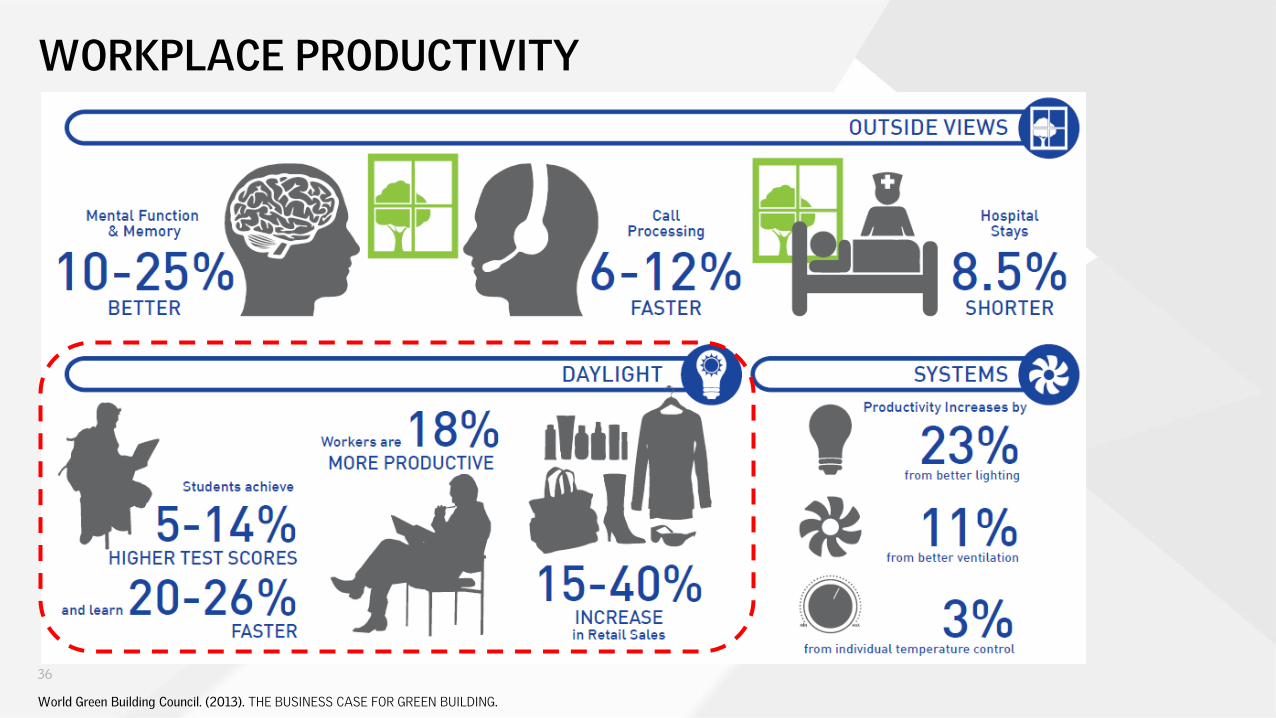
WORKPLACE PRODUCTIVITY
36
World Green Building Council. (2013). THE BUSINESS CASE FOR GREEN BUILDING.
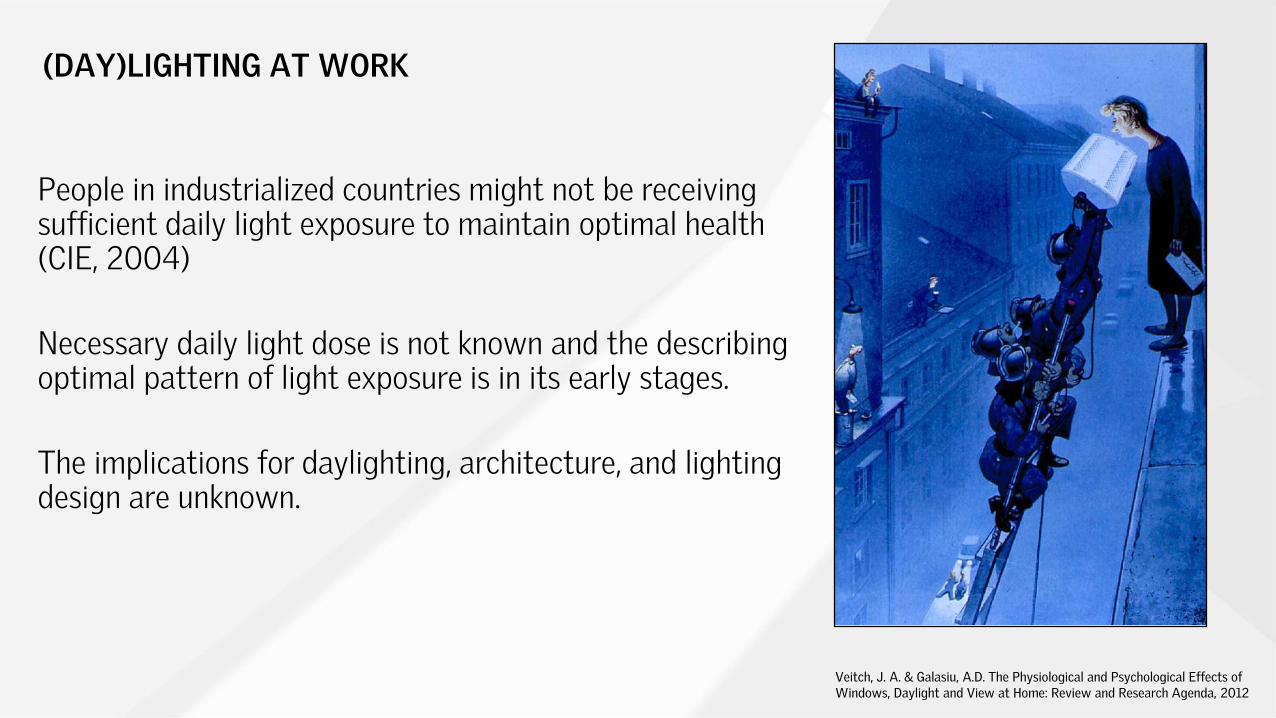
(DAY)LIGHTING AT WORK
Veitch, J. A. & Galasiu, A.D. The Physiological and Psychological Effects of Windows, Daylight and View at Home: Review and Research Agenda, 2012
People in industrialized countries might not be receiving sufficient daily light exposure to maintain optimal health (CIE, 2004)
Necessary daily light dose is not known and the describing optimal pattern of light exposure is in its early stages.
The implications for daylighting, architecture, and lighting design are unknown.
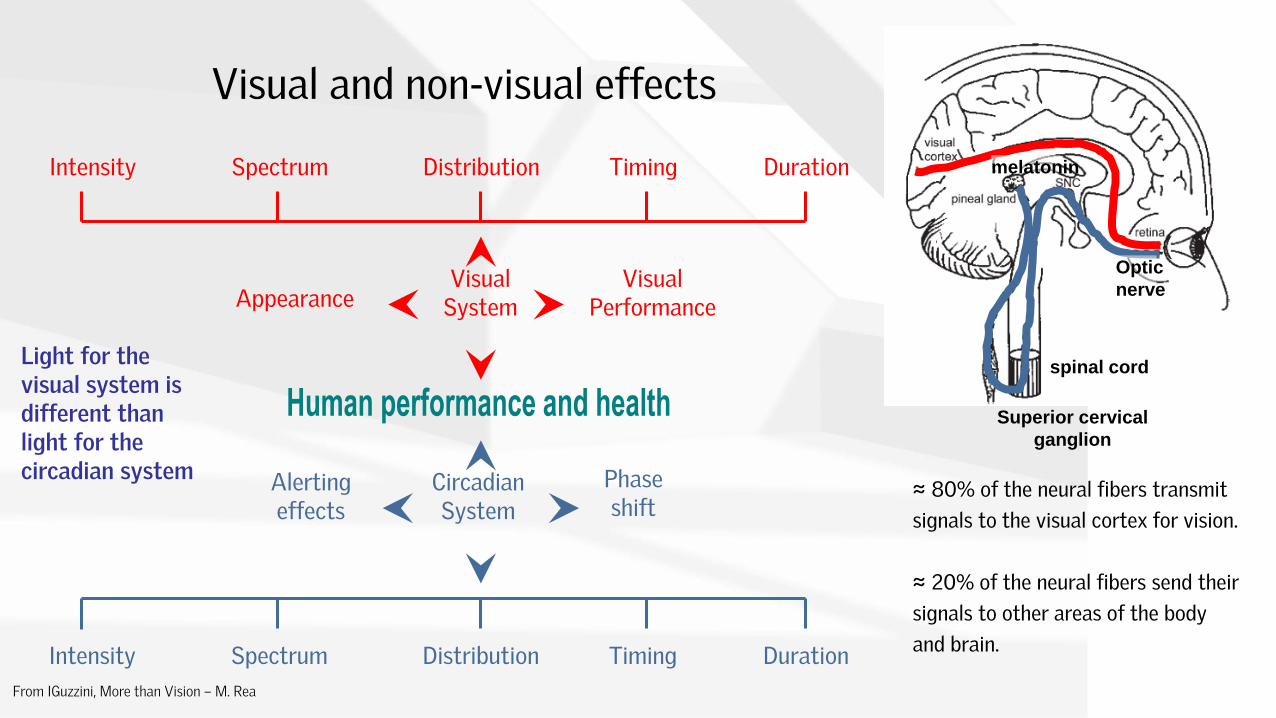
Visual and non-visual effects
From IGuzzini, More than Vision – M. Rea
Intensity Spectrum Distribution Timing Duration
VisualSystem
CircadianSystem
VisualPerformanceAppearance
Phaseshift
Alertingeffects
Intensity Spectrum Distribution Timing Duration
Light for the visual system is different than light for the circadian system
spinal cord
Superior cervical
ganglion
Optic
nerve
melatonin
≈ 80% of the neural fibers transmit
signals to the visual cortex for vision.
≈ 20% of the neural fibers send their
signals to other areas of the body
and brain.
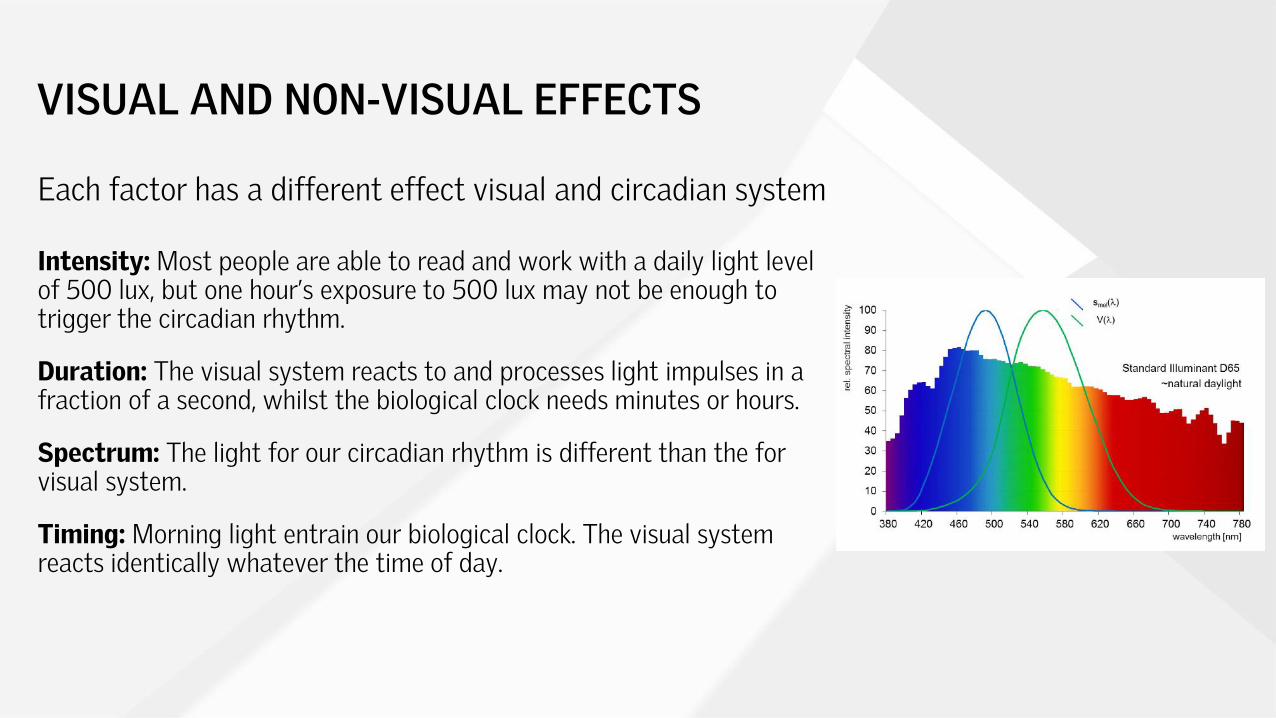
VISUAL AND NON-VISUAL EFFECTS
Each factor has a different effect visual and circadian system
Intensity: Most people are able to read and work with a daily light level of 500 lux, but one hour’s exposure to 500 lux may not be enough to trigger the circadian rhythm.
Duration: The visual system reacts to and processes light impulses in a fraction of a second, whilst the biological clock needs minutes or hours.
Spectrum: The light for our circadian rhythm is different than the for visual system.
Timing: Morning light entrain our biological clock. The visual system reacts identically whatever the time of day.

Daylight
View
Sunlight
Glare
41 Applies to all spaces (e.g workplaces and dwellings)
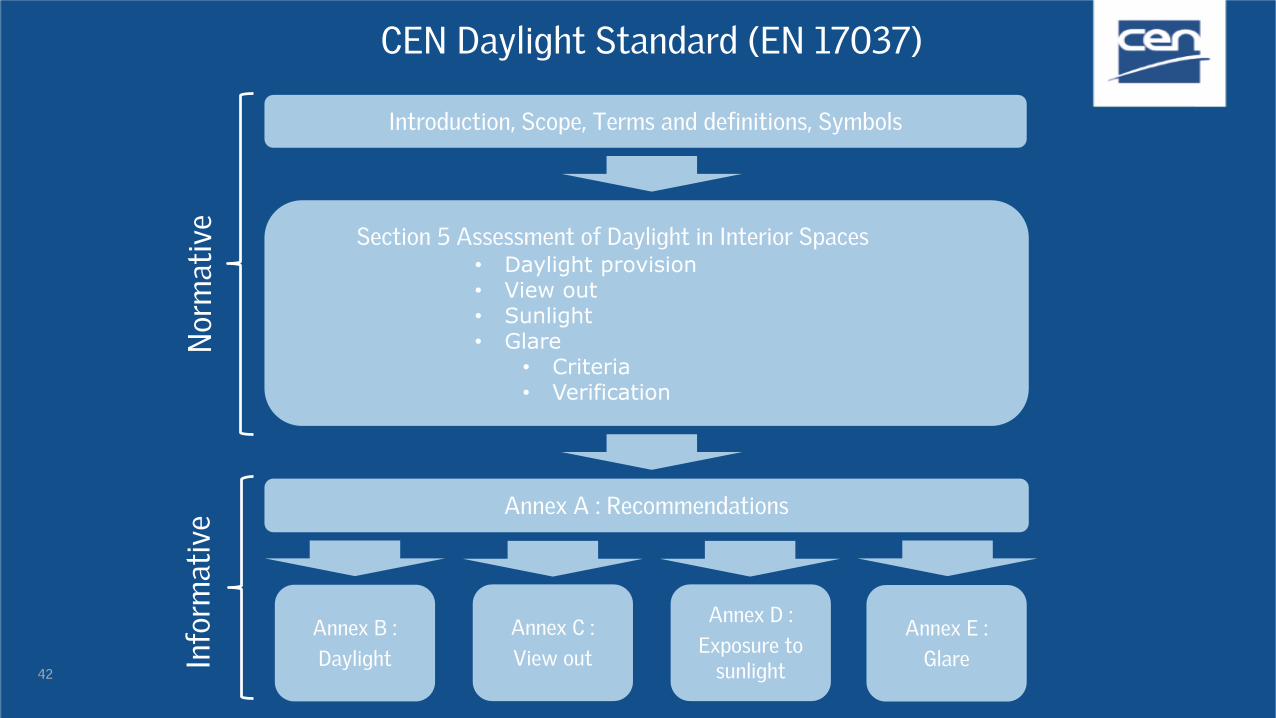
CEN Daylight Standard (EN 17037)
42
Introduction, Scope, Terms and definitions, Symbols
Section 5 Assessment of Daylight in Interior Spaces• Daylight provision• View out• Sunlight• Glare
• Criteria• Verification
Annex A : Recommendations
Annex B :
Daylight
Annex D :
Exposure to sunlight
Annex C :
View out
Annex E :
Glare
Nor
mat
ive
Info
rmat
ive
CEN Daylight Standard (EN 17037)
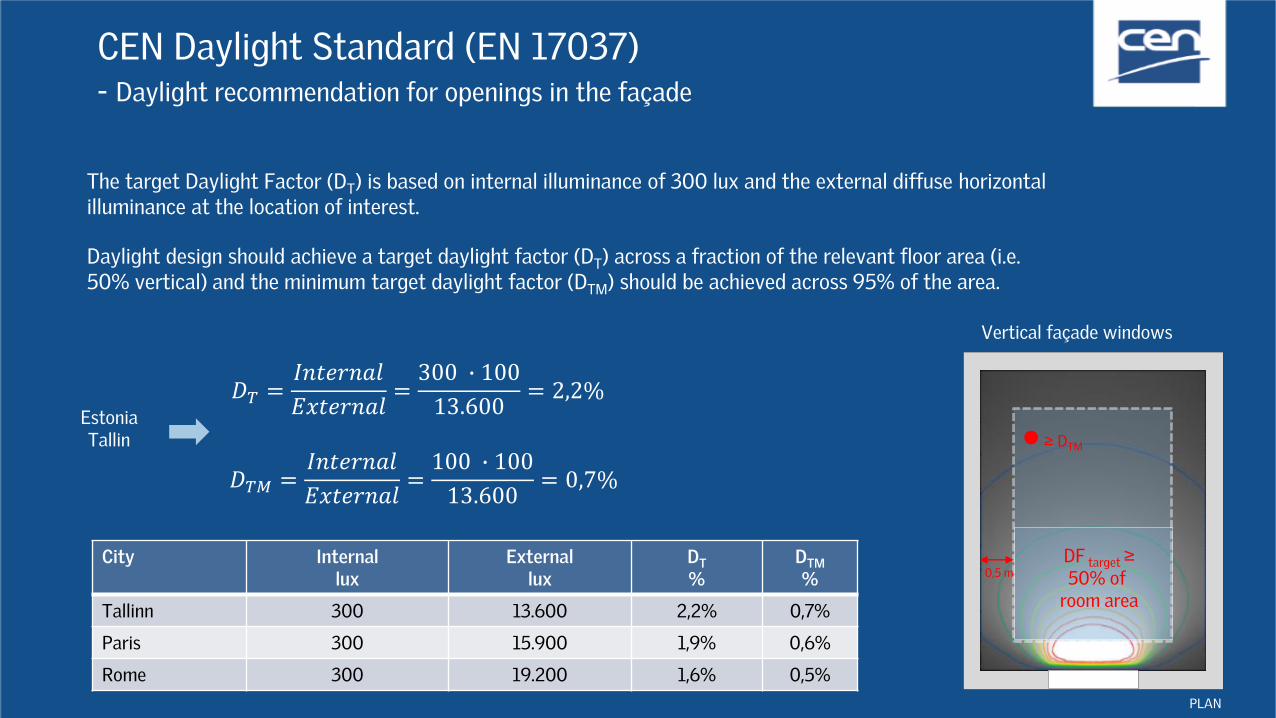
The target Daylight Factor (DT) is based on internal illuminance of 300 lux and the external diffuse horizontal illuminance at the location of interest.
Daylight design should achieve a target daylight factor (DT) across a fraction of the relevant floor area (i.e. 50% vertical) and the minimum target daylight factor (DTM) should be achieved across 95% of the area.
CEN Daylight Standard (EN 17037)- Daylight recommendation for openings in the façade
● ≥ DTM
DF target ≥50% of
room area
0,5 mCity Internal
luxExternal
luxDT
%DTM
%
Tallinn 300 13.600 2,2% 0,7%
Paris 300 15.900 1,9% 0,6%
Rome 300 19.200 1,6% 0,5%
𝐷𝑇 =𝐼𝑛𝑡𝑒𝑟𝑛𝑎𝑙
𝐸𝑥𝑡𝑒𝑟𝑛𝑎𝑙=300 ∙ 100
13.600= 2,2%
PLAN
𝐷𝑇𝑀 =𝐼𝑛𝑡𝑒𝑟𝑛𝑎𝑙
𝐸𝑥𝑡𝑒𝑟𝑛𝑎𝑙=100 ∙ 100
13.600= 0,7%
EstoniaTallin
Vertical façade windows
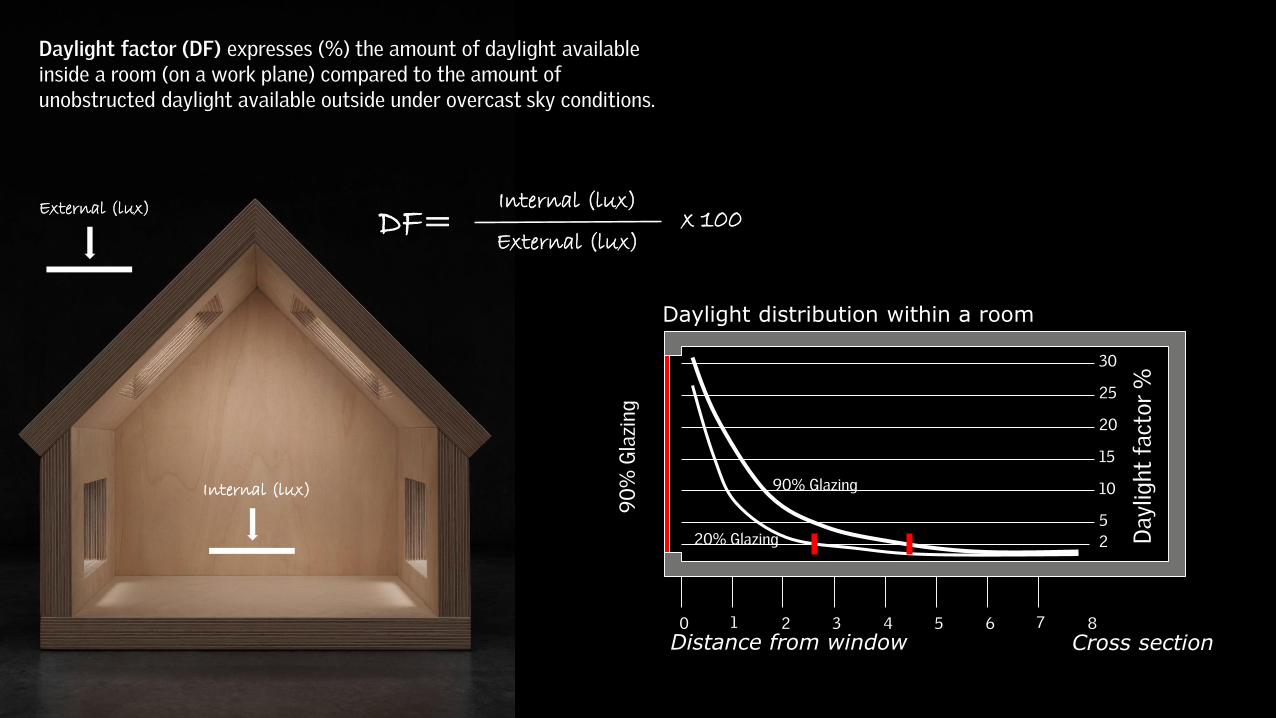
Daylight factor (DF) expresses (%) the amount of daylight available inside a room (on a work plane) compared to the amount of unobstructed daylight available outside under overcast sky conditions.
Internal (lux)
External (lux) Internal (lux)
External (lux)DF= x 100
90
% G
lazi
ng
2
90% Glazing
20% Glazing
10
15
20
25
30
5
Day
light
fact
or
%
Distance from window0 1 2 3 4 5 6 7 8
Cross section
Daylight distribution within a room
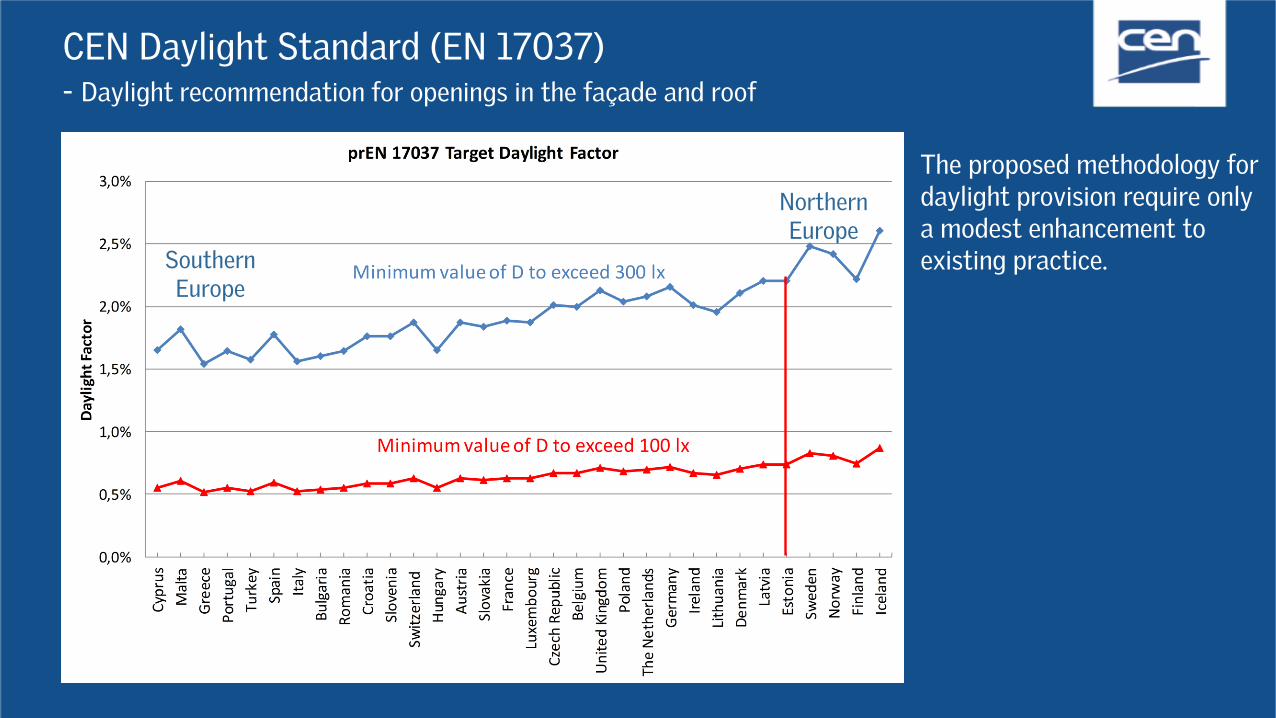
CEN Daylight Standard (EN 17037)- Daylight recommendation for openings in the façade and roof
Southern Europe
Northern Europe
The proposed methodology for daylight provision require only a modest enhancement to existing practice.
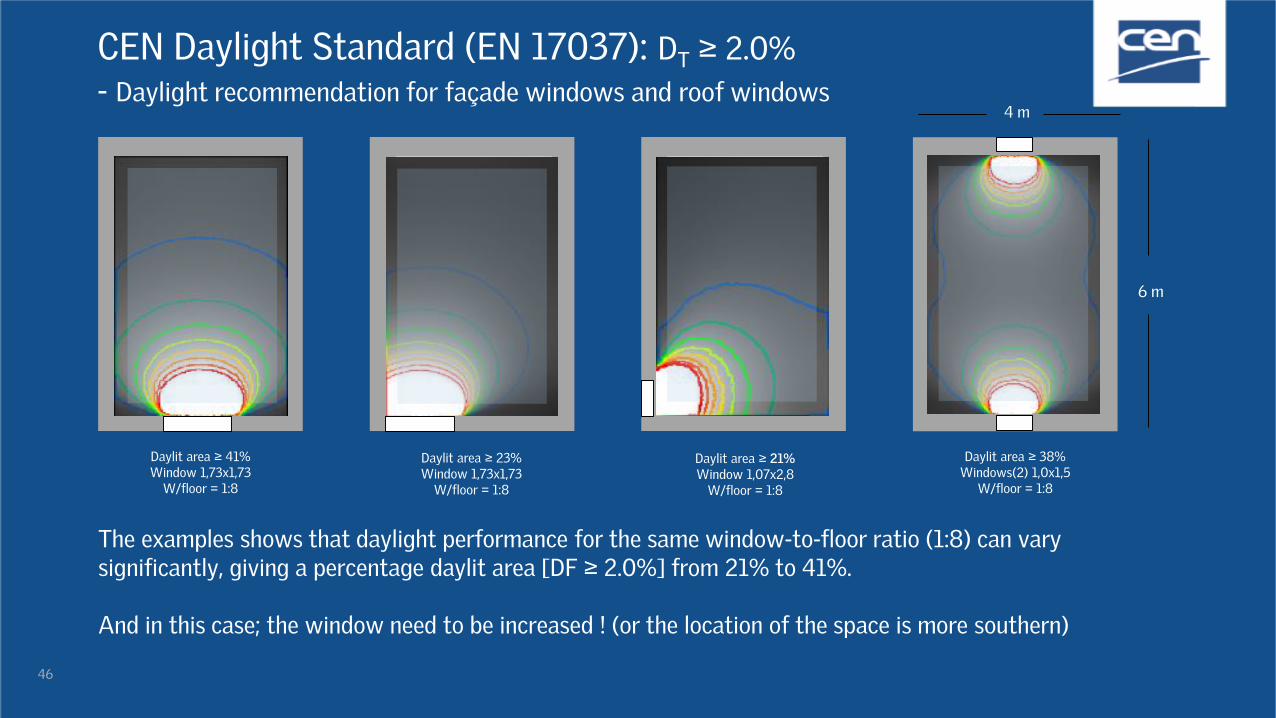
46
Daylit area ≥ 23%Window 1,73x1,73
W/floor = 1:8
Daylit area ≥ 41%Window 1,73x1,73
W/floor = 1:8
Daylit area ≥ 21%Window 1,07x2,8
W/floor = 1:8
Daylit area ≥ 38%Windows(2) 1,0x1,5
W/floor = 1:8
6 m
4 m
The examples shows that daylight performance for the same window-to-floor ratio (1:8) can vary significantly, giving a percentage daylit area [DF ≥ 2.0%] from 21% to 41%.
And in this case; the window need to be increased ! (or the location of the space is more southern)
CEN Daylight Standard (EN 17037): DT ≥ 2.0%
- Daylight recommendation for façade windows and roof windows
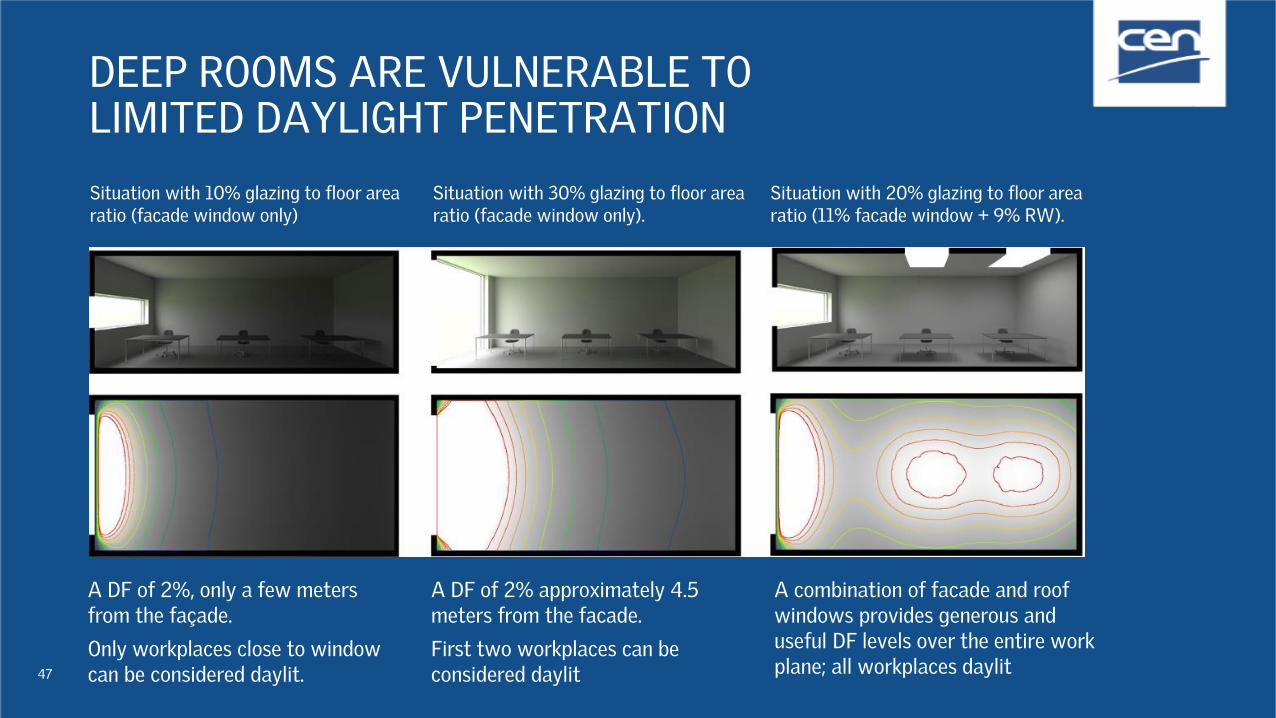
DEEP ROOMS ARE VULNERABLE TO LIMITED DAYLIGHT PENETRATION
47
A DF of 2%, only a few meters from the façade.
Only workplaces close to window can be considered daylit.
A DF of 2% approximately 4.5 meters from the facade.
First two workplaces can be considered daylit
A combination of facade and roof windows provides generous and useful DF levels over the entire work plane; all workplaces daylit
Situation with 10% glazing to floor area ratio (facade window only)
Situation with 30% glazing to floor area ratio (facade window only).
Situation with 20% glazing to floor area ratio (11% facade window + 9% RW).
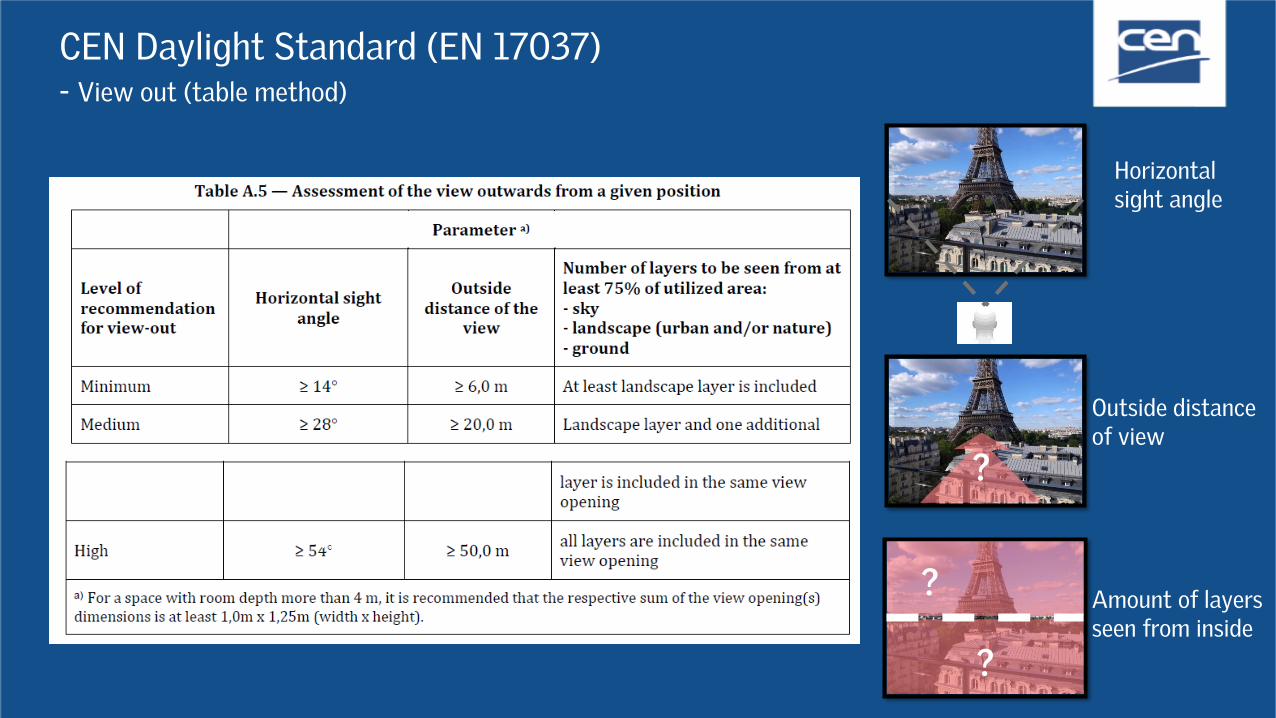
CEN Daylight Standard (EN 17037)- View out (table method)
??
?
?
Horizontalsight angle
Outside distanceof view
Amount of layersseen from inside
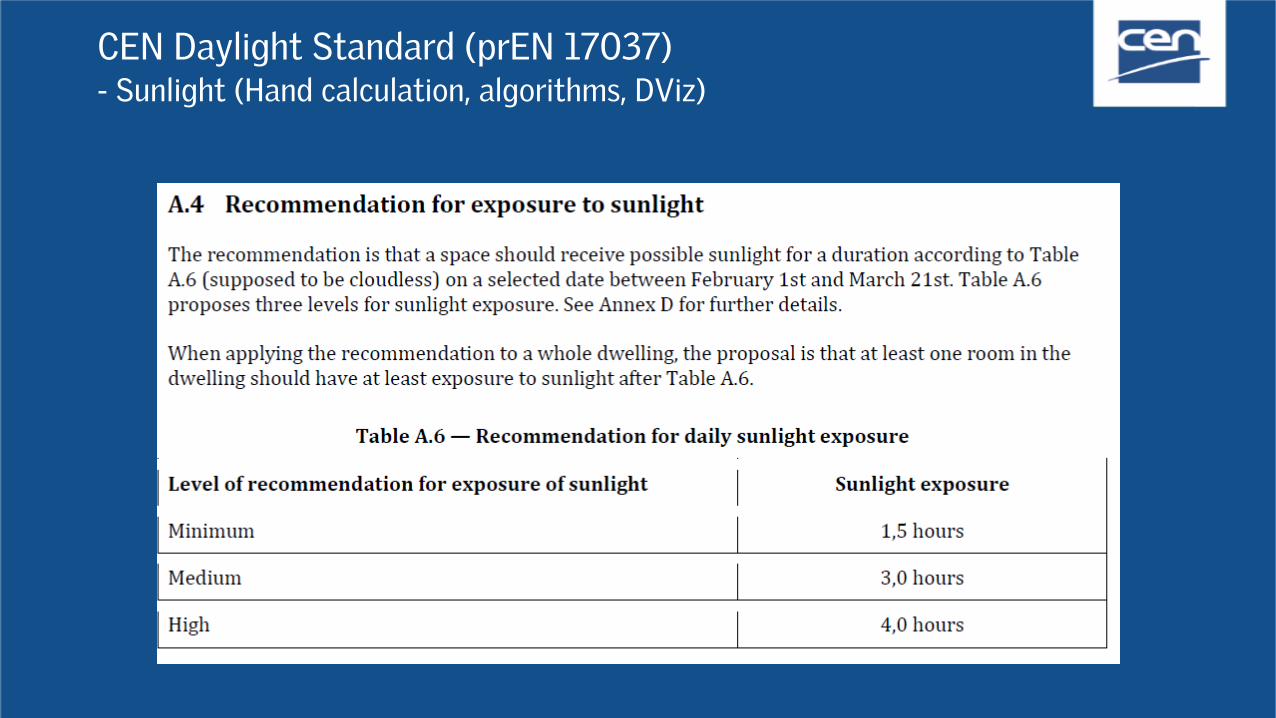
CEN Daylight Standard (prEN 17037)- Sunlight (Hand calculation, algorithms, DViz)
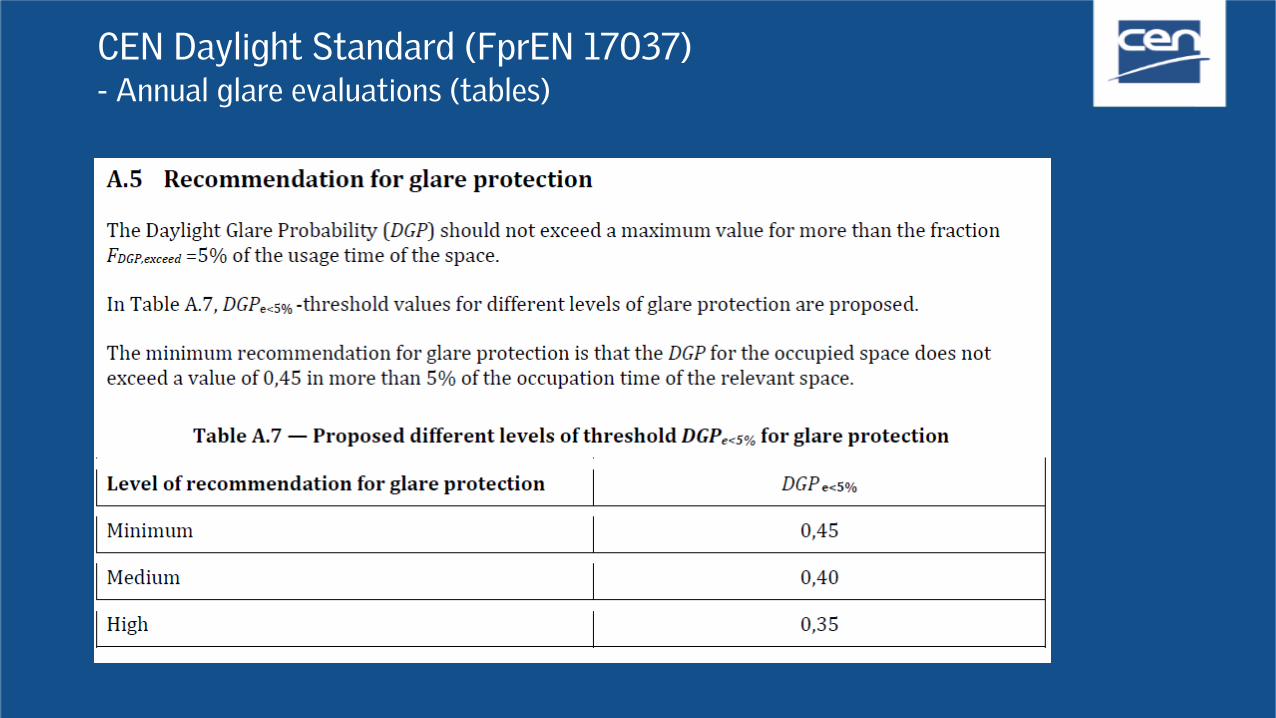
CEN Daylight Standard (FprEN 17037)- Annual glare evaluations (tables)
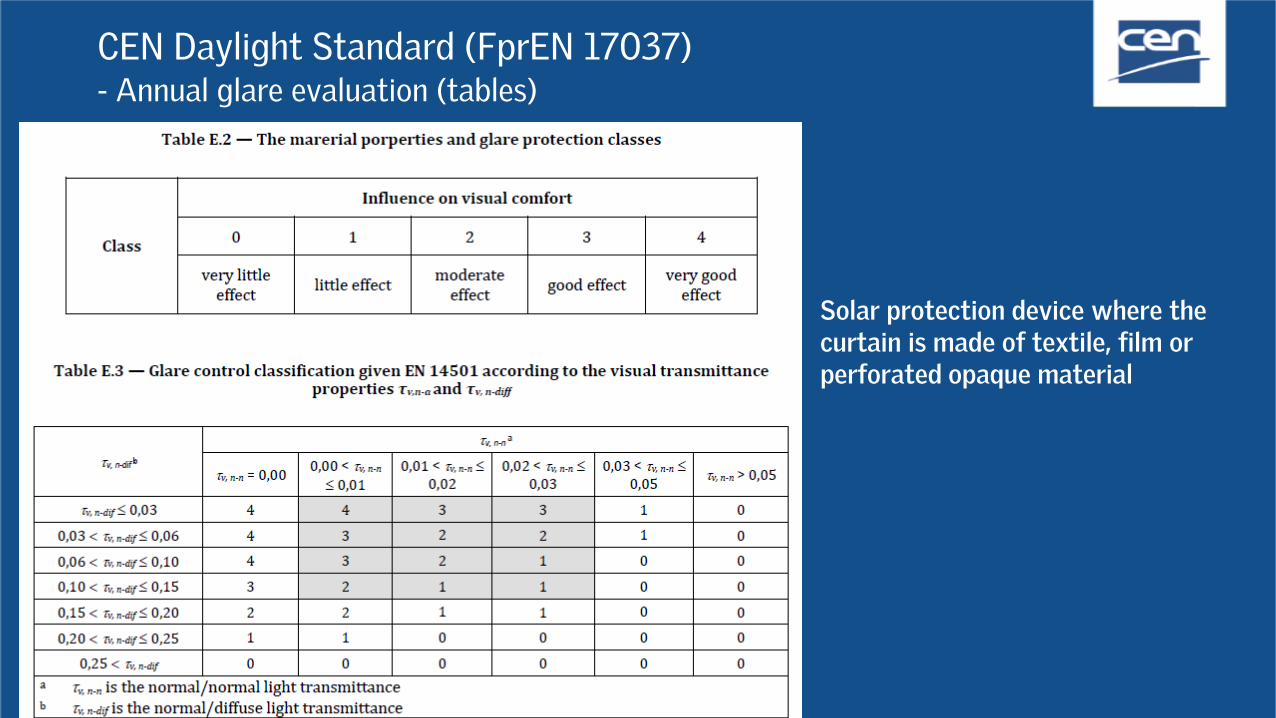
CEN Daylight Standard (FprEN 17037)- Annual glare evaluation (tables)
Solar protection device where the curtain is made of textile, film or perforated opaque material

CEN Daylight Standard (FprEN 17037)- Minimum recommendation for Annual Glare evaluation
Solar protection device where the curtain is made of textile, film or perforated opaque material
Towards North Towards South
VDP is View Direction parallel with facade
VDf is View Direction 45° towards facade
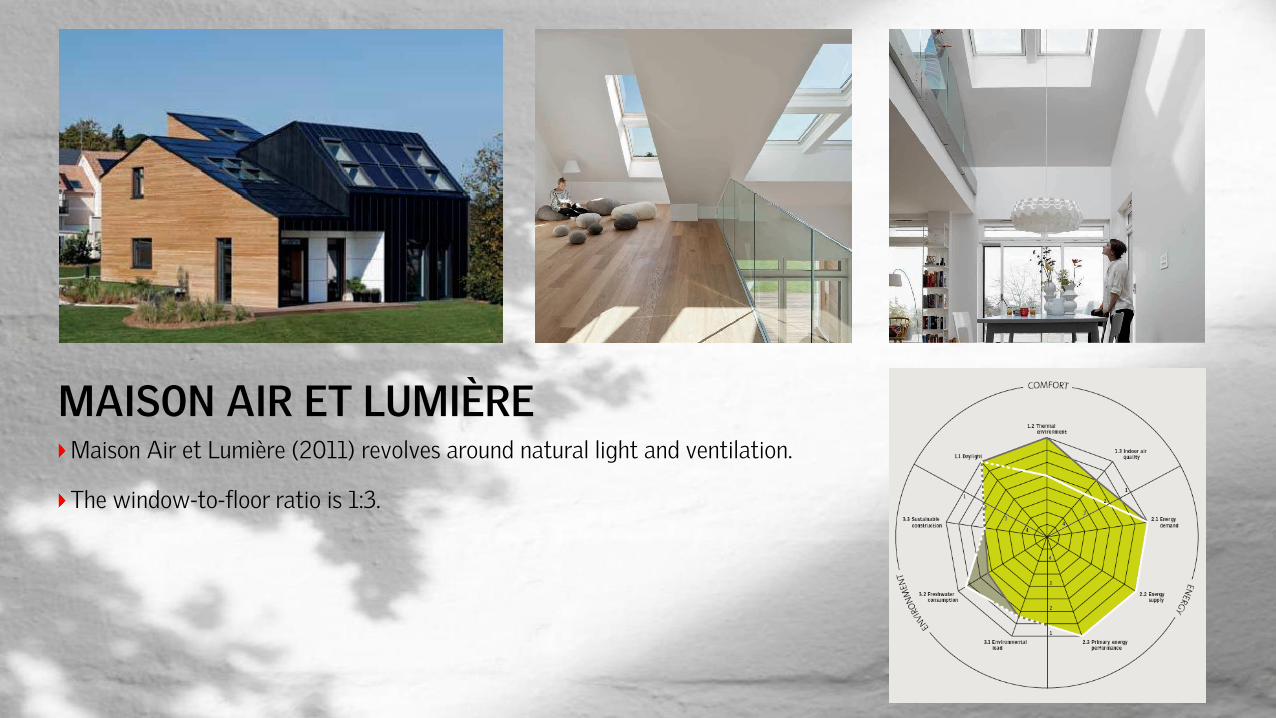
Maison Air et Lumière (2011) revolves around natural light and ventilation.
The window-to-floor ratio is 1:3.
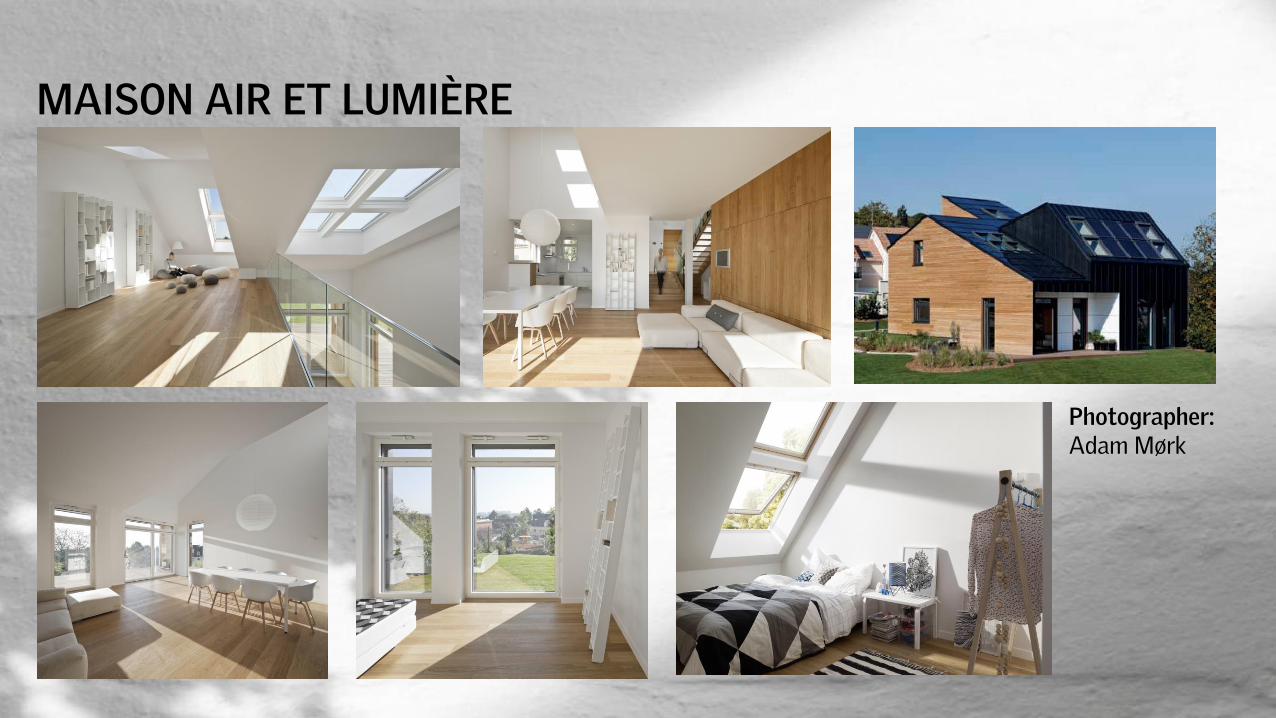
MAISON AIR ET LUMIÈRE
Light grey, use
eyedropper to
MAISON AIR ET LUMIÈRE
54
Photographer:Adam Mørk
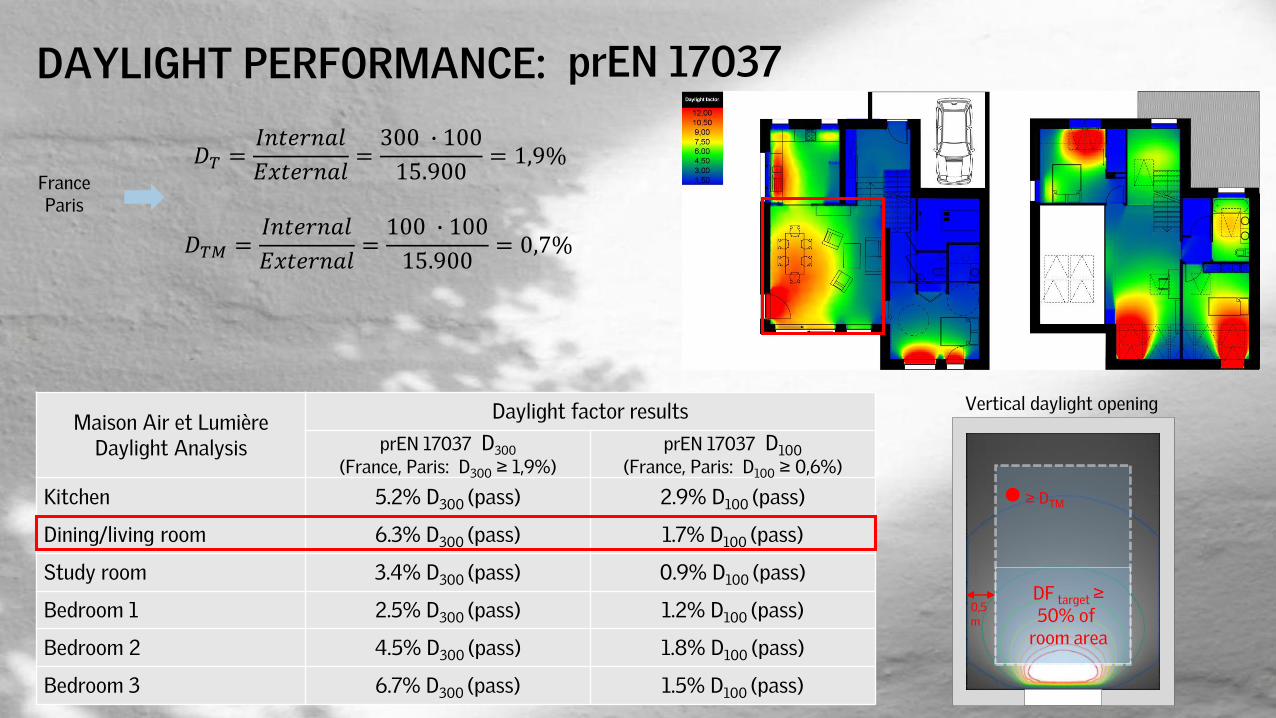
DAYLIGHT PERFORMANCE:
55
Maison Air et Lumière Daylight Analysis
Daylight factor results
prEN 17037 D300
(France, Paris: D300 ≥ 1,9%)prEN 17037 D100
(France, Paris: D100 ≥ 0,6%)
Kitchen 5.2% D300 (pass) 2.9% D100 (pass)
Dining/living room 6.3% D300 (pass) 1.7% D100 (pass)
Study room 3.4% D300 (pass) 0.9% D100 (pass)
Bedroom 1 2.5% D300 (pass) 1.2% D100 (pass)
Bedroom 2 4.5% D300 (pass) 1.8% D100 (pass)
Bedroom 3 6.7% D300 (pass) 1.5% D100 (pass)
● ≥ DTM
DF target ≥50% of
room area
0,5 m
Vertical daylight opening
𝐷𝑇 =𝐼𝑛𝑡𝑒𝑟𝑛𝑎𝑙
𝐸𝑥𝑡𝑒𝑟𝑛𝑎𝑙=300 ∙ 100
15.900= 1,9%
𝐷𝑇𝑀 =𝐼𝑛𝑡𝑒𝑟𝑛𝑎𝑙
𝐸𝑥𝑡𝑒𝑟𝑛𝑎𝑙=100 ∙ 100
15.900= 0,7%
FranceParis
prEN 17037
Daylight Visualizer – a free
professional tool for daylight
analysis
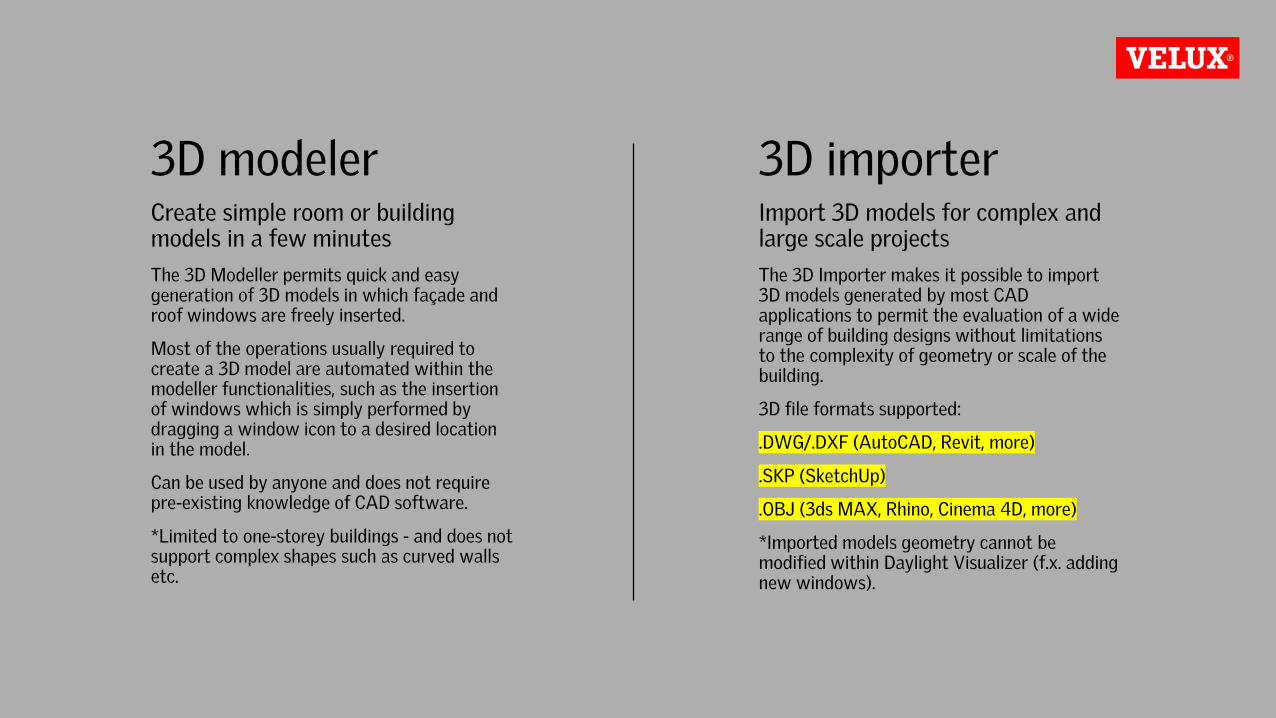
3D modelerCreate simple room or building models in a few minutes
The 3D Modeller permits quick and easy generation of 3D models in which façade and roof windows are freely inserted.
Most of the operations usually required to create a 3D model are automated within the modeller functionalities, such as the insertion of windows which is simply performed by dragging a window icon to a desired location in the model.
Can be used by anyone and does not require pre-existing knowledge of CAD software.
*Limited to one-storey buildings - and does not support complex shapes such as curved walls etc.
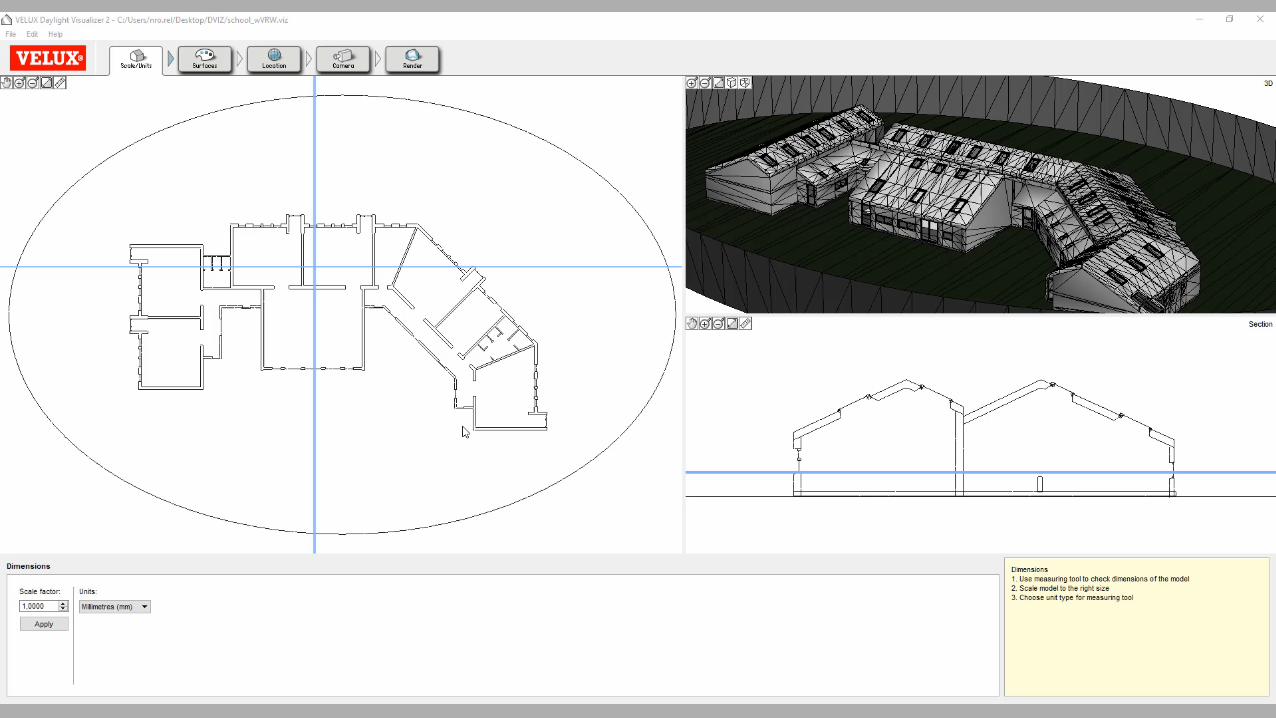
3D importerImport 3D models for complex and large scale projects
The 3D Importer makes it possible to import 3D models generated by most CAD applications to permit the evaluation of a wide range of building designs without limitations to the complexity of geometry or scale of the building.
3D file formats supported:
.DWG/.DXF (AutoCAD, Revit, more)
.SKP (SketchUp)
.OBJ (3ds MAX, Rhino, Cinema 4D, more)
*Imported models geometry cannot be modified within Daylight Visualizer (f.x. adding new windows).
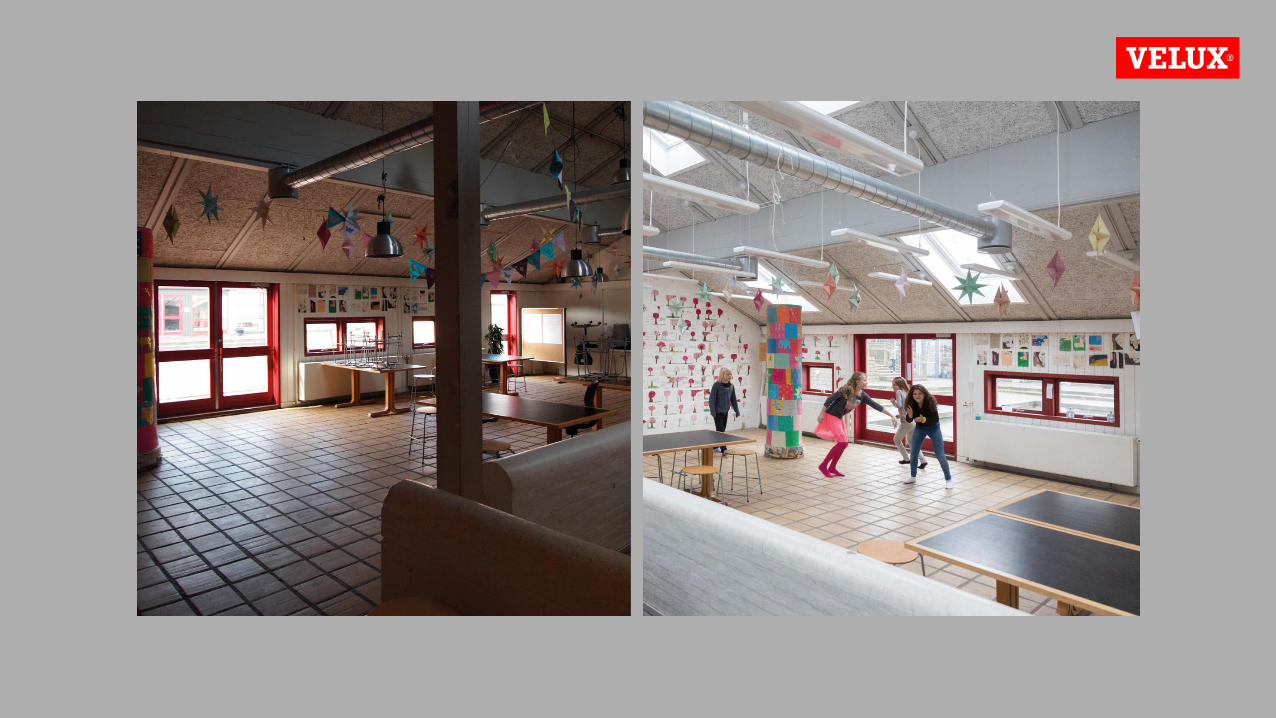
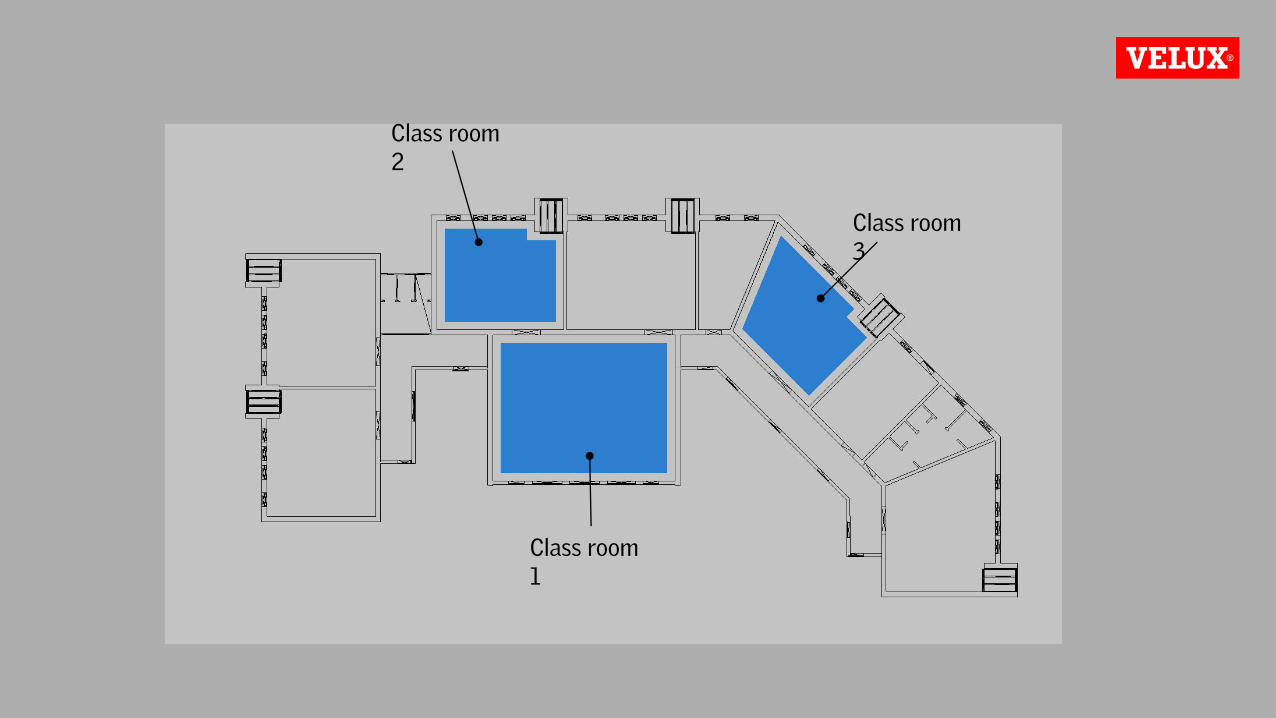
Class room1
Class room2
Class room3
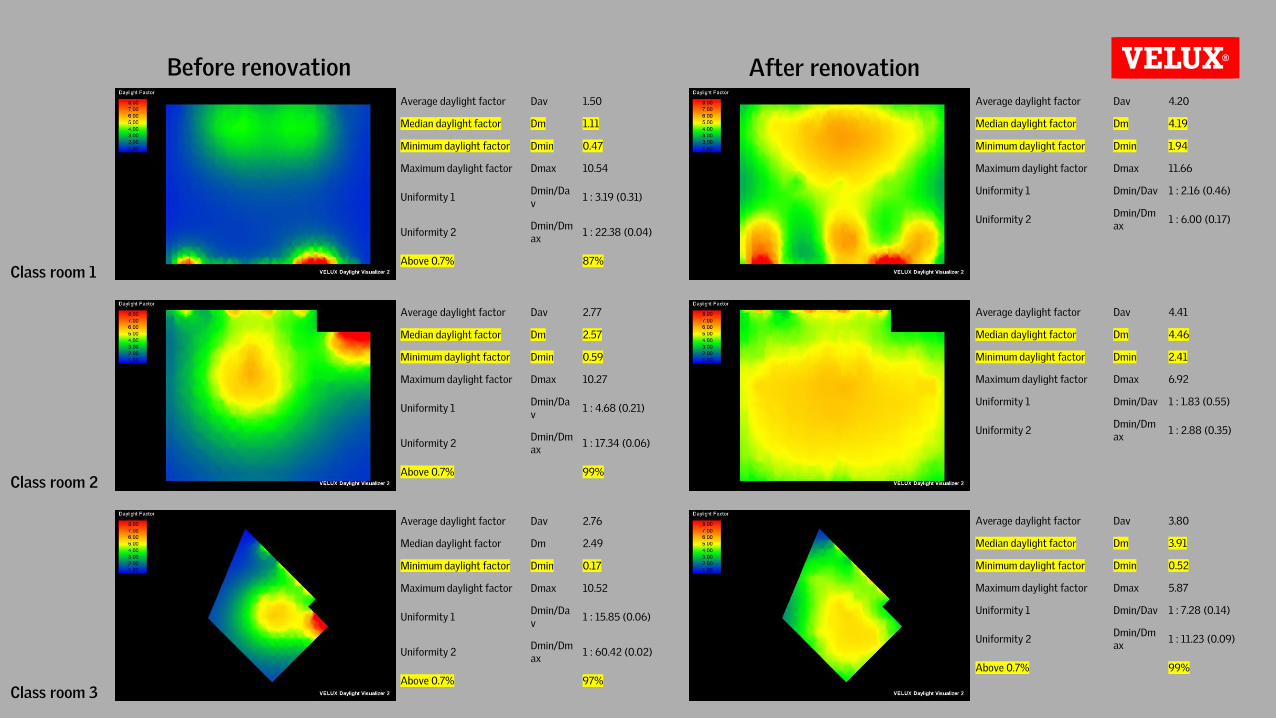
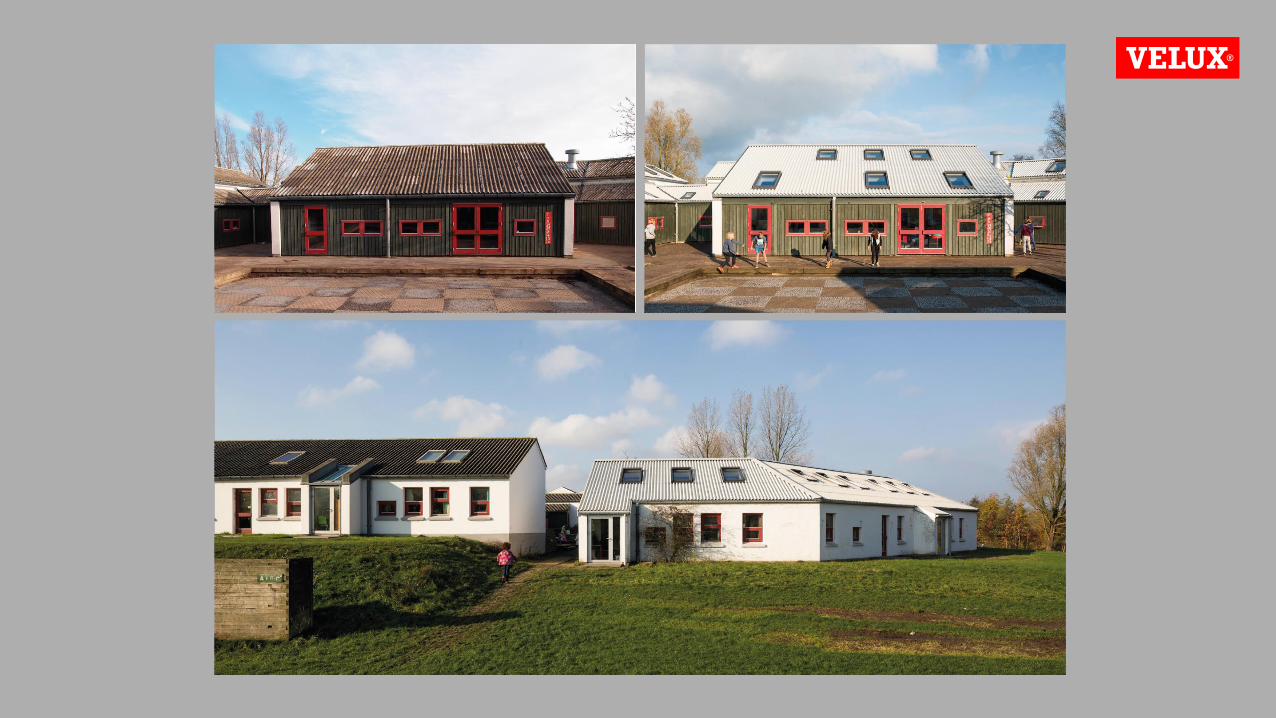
Before renovation After renovation
Class room 1
Class room 2
Class room 3
Average daylight factor Dav 4.20
Median daylight factor Dm 4.19
Minimum daylight factor Dmin 1.94
Maximum daylight factor Dmax 11.66
Uniformity 1 Dmin/Dav 1 : 2.16 (0.46)
Uniformity 2Dmin/Dmax
1 : 6.00 (0.17)
Average daylight factor Dav 4.41
Median daylight factor Dm 4.46
Minimum daylight factor Dmin 2.41
Maximum daylight factor Dmax 6.92
Uniformity 1 Dmin/Dav 1 : 1.83 (0.55)
Uniformity 2Dmin/Dmax
1 : 2.88 (0.35)
Average daylight factor Dav 3.80
Median daylight factor Dm 3.91
Minimum daylight factor Dmin 0.52
Maximum daylight factor Dmax 5.87
Uniformity 1 Dmin/Dav 1 : 7.28 (0.14)
Uniformity 2Dmin/Dmax
1 : 11.23 (0.09)
Above 0.7% 99%
Average daylight factor Dav 1.50
Median daylight factor Dm 1.11
Minimum daylight factor Dmin 0.47
Maximum daylight factor Dmax 10.54
Uniformity 1Dmin/Dav
1 : 3.19 (0.31)
Uniformity 2Dmin/Dmax
1 : 22.38 (0.04)
Above 0.7% 87%
Average daylight factor Dav 2.77
Median daylight factor Dm 2.57
Minimum daylight factor Dmin 0.59
Maximum daylight factor Dmax 10.27
Uniformity 1Dmin/Dav
1 : 4.68 (0.21)
Uniformity 2Dmin/Dmax
1 : 17.34 (0.06)
Above 0.7% 99%
Average daylight factor Dav 2.76
Median daylight factor Dm 2.49
Minimum daylight factor Dmin 0.17
Maximum daylight factor Dmax 10.52
Uniformity 1Dmin/Dav
1 : 15.85 (0.06)
Uniformity 2Dmin/Dmax
1 : 60.42 (0.02)
Above 0.7% 97%
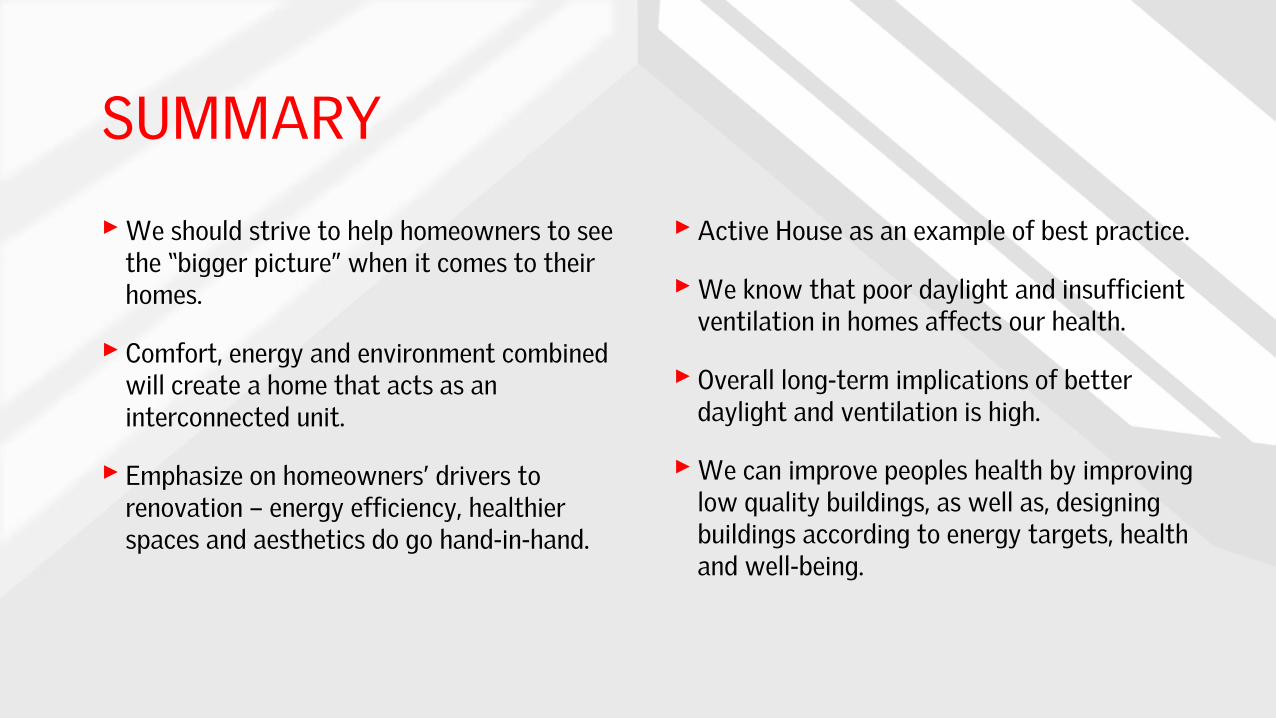
SUMMARY
‣We should strive to help homeowners to see the “bigger picture” when it comes to their homes.
‣ Comfort, energy and environment combined will create a home that acts as an interconnected unit.
‣ Emphasize on homeowners’ drivers to renovation – energy efficiency, healthier spaces and aesthetics do go hand-in-hand.
‣ Active House as an example of best practice.
‣We know that poor daylight and insufficient ventilation in homes affects our health.
‣ Overall long-term implications of better daylight and ventilation is high.
‣We can improve peoples health by improving low quality buildings, as well as, designing buildings according to energy targets, health and well-being.

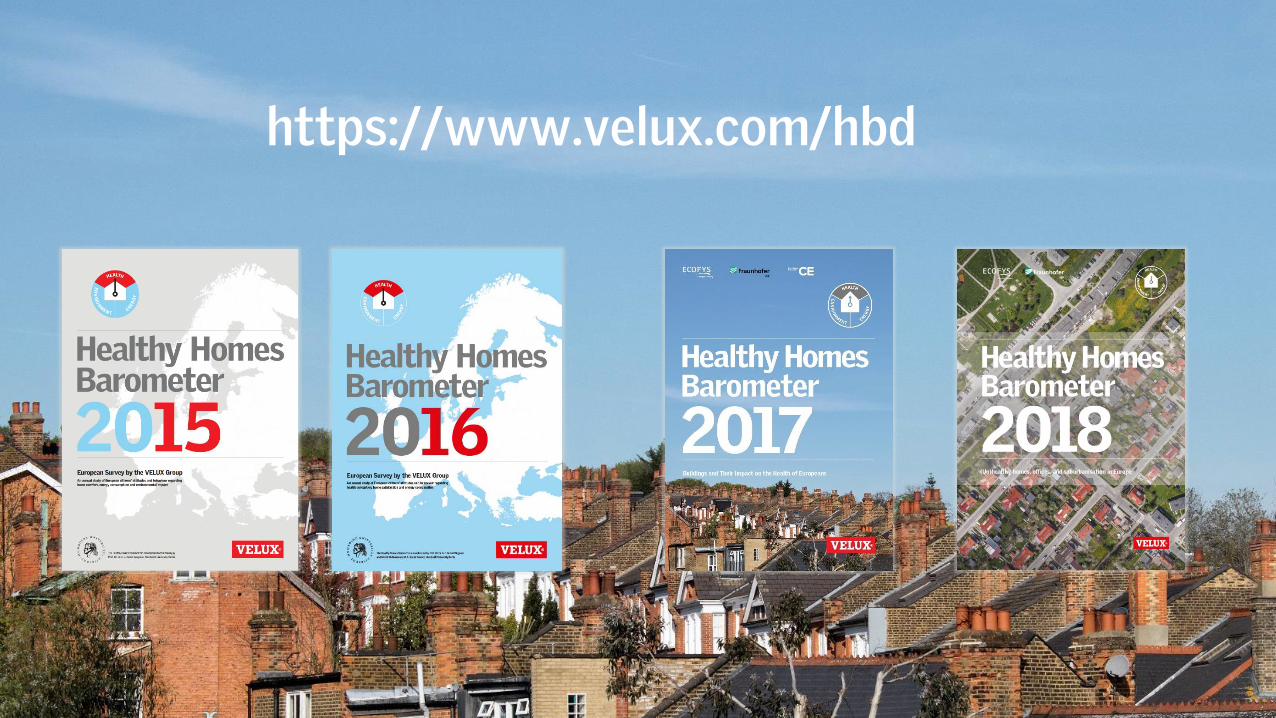
OTHER PLACES TO FIND INFORMATION
66
https://www.velux.com/hbd
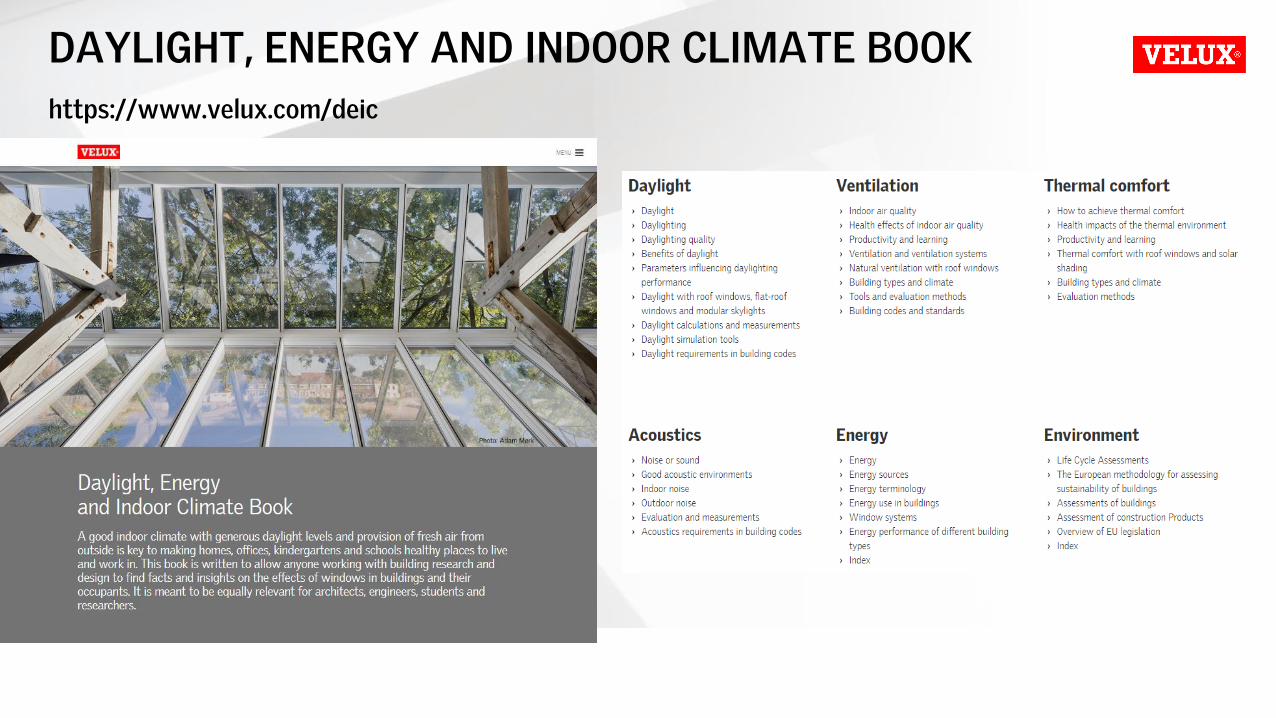
DAYLIGHT, ENERGY AND INDOOR CLIMATE BOOK
https://www.velux.com/deic
68
•
•
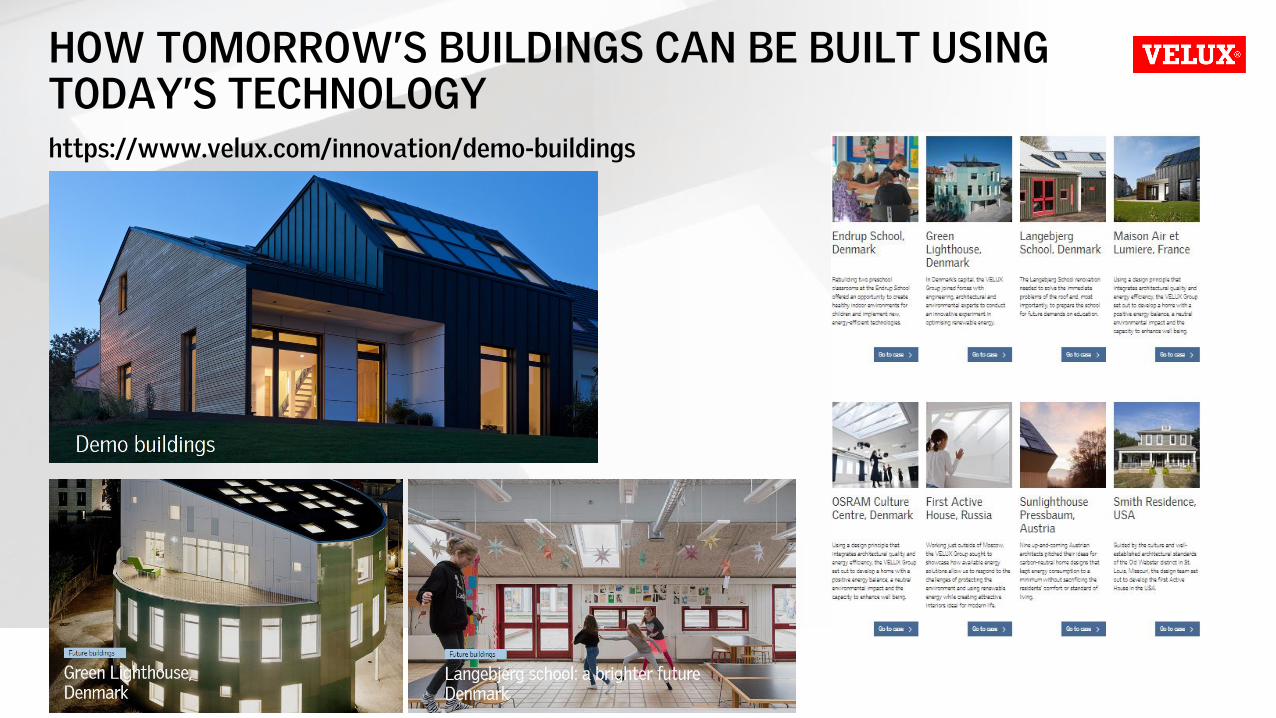
HOW TOMORROW’S BUILDINGS CAN BE BUILT USING TODAY’S TECHNOLOGYhttps://www.velux.com/innovation/demo-buildings
CONTACT INFO
FIND US HERE
pinterest.com/VELUXGroup/
linkedin.com/company/VELUX
youtube.com/user/VELUX
facebook.com/VELUX
twitter.com/VELUX
Jens Christoffersen & Nicolas Roy
[email protected] / [email protected]
VELUX Group