Villanova School of Business Economics Working Paper #30
33
The Rise of Supplemental Lending at the World Bank Erasmus Kersting and Christopher Kilby Villanova University August 20, 2016 World Bank projects sometimes receive supplemental loans months or years after initial project approval. The number of supplemental loans has surged after 2006, in some years accounting for 30% of all new loans. Supplemental loans can be sizeable yet come without the long approval and disbursement delays associated with new projects. In addition, they are more common for zero- interest IDA credits, making them a particularly valuable source of development finance. This paper explores the political economy of supplemental loans. We find nonpermanent United Nations Security Council membership is a strong determinant, supporting the hypothesis that fast- moving supplemental loans are particular useful for short-run incentives where time is of the essence. Keywords: World Bank; geopolitics of aid; UNSC JEL codes: F35, F53, O19 Contact information: [email protected]; [email protected] Villanova School of Business Economics Working Paper #30
Transcript of Villanova School of Business Economics Working Paper #30

The Rise of Supplemental Lending at the World Bank
Erasmus Kersting and Christopher Kilby
Villanova University
August 20, 2016
World Bank projects sometimes receive supplemental loans months or years after initial project approval. The number of supplemental loans has surged after 2006, in some years accounting for 30% of all new loans. Supplemental loans can be sizeable yet come without the long approval and disbursement delays associated with new projects. In addition, they are more common for zero-interest IDA credits, making them a particularly valuable source of development finance. This paper explores the political economy of supplemental loans. We find nonpermanent United Nations Security Council membership is a strong determinant, supporting the hypothesis that fast-moving supplemental loans are particular useful for short-run incentives where time is of the essence.
Keywords: World Bank; geopolitics of aid; UNSC
JEL codes: F35, F53, O19
Contact information:
[email protected]; [email protected]
Villanova School of Business Economics Working Paper #30

1. Introduction
World Bank development finance has evolved substantially in recent years. One important change
is a dramatic upswing in the use of supplemental loans that add resources to existing projects
months or years after initial approval. Also called additional financing, these loans can be
substantial in absolute terms (historically as large as US$1.25 billion) and on average add 84% to
the initial loan amount (since the year 2000). Supplemental lending also has become quite large
in aggregate. For comparison, consider another recent development finance trend that has attracted
a lot of attention, World Bank trust funds (OECD 2015). Eichenauer and Knack (2016, 3) report
US$22.5 billion in World Bank trust fund disbursement from 2002 to 2012. Over the same period,
the World Bank approved US$30.5 billion in supplemental loans. In addition, supplemental loans
are fast moving and predominantly International Development Association (IDA) credits—the
World Bank’s “soft window” zero-interest loans—making them a particularly valuable source of
development finance. These characteristics suggest that supplemental loans may have become an
important tool for furthering donors’ geopolitical interests in situations where a rapid response is
paramount.
Indeed, the key feature of supplemental loans is that they deliver resources much more
quickly than regular World Bank loans (World Bank 2004, para. 27). Preparation time, the period
between when World Bank staff begin working on a loan and when the loan is approved by the
World Bank’s Board of Executive Directors, is dramatically reduced. Kilby (2013B, 216)
estimates the typical preparation period for a supplemental loan at 112 days as compared to 669
days for other projects. After approval, supplemental loans disburse more quickly. While World
Bank investment projects typically follow a 6 year disbursement profile (with just 25% disbursed
by the three year mark following project approval (Kersting and Kilby 2016B, 157)), supplemental

2
loans piggyback on existing projects so that disbursement takes less time to scale up—typically
40% less time.1
Matching the speed of delivery of development assistance to the goals of that assistance is
critical for effectiveness—both development effectiveness and geopolitical effectiveness.
Focusing on the geopolitical, slow moving processes are mismatched for achieving goals in fluid
situations, for example incentivizing non-permanent United Nations Security Council (UNSC)
members or improving the re-election prospects of friendly incumbents. Kersting and Kilby
(2016B) provide an example of this in the context of electioneering. That research finds that World
Bank investment loan disbursement accelerates in the run-up to elections when the incumbent
government in the recipient country is aligned with the U.S. and decelerates in the run-up to
elections when the incumbent government is aligned against the U.S. For new commitments—
which can take years to translate into an actual flow of funds—countries aligned with the U.S. still
get more but there is no link to elections, presumably because the time it takes for influence over
regular loan commitments to translate into disbursement of funds is far too long to deliver
resources to use in a re-election effort.2 This argument suggests that short duration events—like
a two-year term on the UNSC—are more likely to impact supplemental loan commitments than
regular loan commitments.
In this paper, we explore these issues by separately examining supplemental and regular
World Bank loan commitments in the 2000-2015 period. We focus on this recent period for several
reasons. First as Figure 1 illustrates, the use of supplemental loans as a vehicle for lending
expanded dramatically in recent years (especially after 2006). Second, as supplemental lending
1 Specifically, we see a 40% reduction in the time to reach 50% disbursed when comparing regular loans to supplemental loans. 2 Note that analysis of commitments in Kersting and Kilby (2016B) examines regular commitments only, not supplemental commitments.

3
has expanded to become a significant share of World Bank activity, geopolitical considerations
appear to have increased. Using all available data at the country-year level (1947-2015), a
country’s odds of receiving a supplemental loan in years where it does not hold a non-permanent
seat on the UNSC were 11.9%; in years when it does, the odds were 12.0%. But restricting
attention to 2000-2015, these figures are 24.3% for non-members and 34.3% for members.3 Given
this dramatic difference in both the frequency of supplemental loans and the UNSC differential,
we focus on this more recent period.
Following much of the aid allocation literature, we estimate a two-part model–first a
selection model for whether or not an eligible country receives new loan commitments in a given
year (using a conditional logit estimator), then a conditional allocation model that explores the
determinants of commitment amount in the case the country does receive commitments that year
(using a fixed effects estimator). We examine a range of geopolitical variables commonly used in
the aid allocation literature, including non-permanent UNSC membership to capture short-term
interests.
As suggested by the bivariate relationship above, non-permanent UNSC membership is
associated with a higher probability of receiving supplemental loans and, conditional on receiving
some supplemental loans, more supplemental loan funding. We do not see similar results for
regular loans. These results are robust to other specifications (e.g., not using a two part model but
rather a Tobit or OLS with country fixed effects applied to the entire sample). The difference
between supplemental and regular lending results suggests that short-term interests are linked to
short-term lending instruments.
3 Based on years where countries were eligible to borrow (i.e., borrowing members in good standing) and had on-going projects that could receive supplements. A t-test for comparison of means (unpaired and not assuming equal variances) fails to reject the null hypothesis of equal means in the overall sample (p = 0.9253) but does reject the null for the 2000-2015 sample (p = 0.0412).

4
Developing a detailed picture of how donors continue to exert influence over rapidly
changing international financial institutions is important for understanding the evolving role of
geopolitics in global governance. Lending mechanisms differ with respect to the terms of lending,
the degree of conditionality, and the speed of resource delivery. These differences impact not only
development effectiveness but also geopolitical effectiveness.
The rest of this paper proceeds as follows. Section 2 first summarizes World Bank policy
regarding supplemental loans and then reviews the existing literature on the political economy of
World Bank lending. Section 3 describes the data including availability; statistics and graphs
describing supplemental World Bank loans; and specific descriptive statistics for the estimation
samples. Section 4 presents estimation results and Section 5 concludes.
2. Review of World Bank Policy and Previous Research
World Bank Policy
World Bank operational manuals spell out the conditions under which the World Bank can provide
additional financing. For Development Policy Lending (World Bank 2004, para. 27):
In exceptional cases, the [World] Bank may provide supplemental financing—a loan
additional to the loan provided for in the original Loan Agreement—in support of a
program under implementation. Supplemental financing may be provided for a
development policy operation for which an unanticipated gap in financing jeopardizes a
reform program that is otherwise proceeding on schedule and in compliance with the
agreed policy agenda. Supplemental financing is approved only when
(a) the program is being implemented in compliance with provisions of Loan Agreement;

5
(b) the borrower is unable to obtain sufficient funds from other lenders on reasonable terms
or in a reasonable time;
(c) the time available is too short to process a further freestanding [World] Bank loan; and
(d) the borrower is committed to the program and the implementing agencies have
demonstrated competence in carrying it out.
For Investment Projects (World Bank 2005):
The [World] Bank may provide additional financing…to finance (a) completion of the
original project activities in the event of an unanticipated financing gap or a cost overrun;
(b) activities that scale up a project’s impact and development effectiveness; or (c)
modified project activities included as part of project restructuring when the original loan
amount is insufficient to cover such activities.
2. The [World] Bank provides additional financing only when it is satisfied that (a)
implementation of the project, including substantial compliance with loan covenants, is
satisfactory, and (b) the additional loan is economically justified.
Additional financing takes the form of a separate loan, credit, or grant and requires formal
approval by the Board, which may waive the above conditions (e.g., satisfactory
implementation of the project). Project documents typically justify additional financing based
on expanded project scale, cost overruns, or financing gaps (which could be domestic or
international); some provide no justification at all.4
4 Based on a review of World Bank documents for a random sample of ten projects with supplemental loans.
6
Previous Research
To our knowledge, this is the first paper that studies supplemental World Bank loans in detail.
Having said that, the rapid growth of supplemental loan activity in recent years does parallel the
emergence of another form of lending at the World Bank: earmarked aid given by donors for
specific recipients and purposes, also known as trust funds. There are a number of very recent
studies examining the implications of this kind of trust fund or “multi-bi” lending (Eichenauer and
Hug 2016; Eichenauer and Knack 2016; Eichenauer and Reinsberg 2016; Reinsberg et al. 2015).
Eichenauer and Knack (2016) study the determinants of trust fund allocation across recipient
countries by type and sector. The authors’ focus is on evaluating the degree of policy- and poverty-
selectivity. Their main finding is that trust funds, though counted as a form of bilateral aid by the
Development Assistance Committee (DAC), in fact more closely resemble IDA loans in that they
are sensitive to recipient income and quality of governance. This finding stands in contrast to the
frequently made assertion that trust funds undermine the principles guiding IDA lending. The
authors consider potential geopolitical motives as one of their robustness checks and find that
countries that vote in line in the UN General Assembly with the three largest World Bank trust
fund donors (U.S., UK and Netherlands) receive more trust fund disbursements.
Although both trust funds and supplemental loans have become important forms of
development finance at the World Bank over roughly the same period of time, the key issues are
quite different. Trust funds start with explicit contributions by one or several donors, and the extent
of the World Bank’s discretion is, if anything, reduced due to the earmarks regarding the use of
funds. In contrast, supplemental loans represent additional funds tacked onto existing loans with
resources drawn from the regular International Bank for Reconstruction and Development (IBRD)
and IDA budgets, not from bespoke funds from individual donor countries. For trust funds the key

7
issue is a trade-off between control and burden sharing (Eichenauer and Hug 2016; Reinsberg et
al. 2015). In contrast, for supplemental loans the key issue is their speed which may make them
particularly useful geopolitical tools in fluid situations.
The literature on the geopolitics of World Bank lending is now quite extensive and focuses
largely on the U.S. In an early dissertation exploring U.S. influence in the World Bank, Akins
(1981) finds that loan commitments reflect U.S. bilateral aid and U.S. trade flows. A widely cited
study by Frey and Schneider (1986) confirms the importance of trade with the U.S. and several
other G7 countries. Frey and Schneider also find that former colonies/dominions of the U.S., the
U.K. and France receive more World Bank funding. Gwin (1997) lays out evidence from
numerous sources documenting the scope of U.S. government (especially executive branch)
influence over World Bank policies, practices, and lending decisions.5 Fleck and Kilby (2006)
explore how the avenues and goals of U.S. influence have varied across presidential
administrations. Morrison (2011) finds that IDA disbursements mirror U.S. bilateral aid
disbursements during the Cold War but not after.
A number of papers–notable Andersen et al. (2006)–explore links between alignment in
the UN and the allocation of World Bank funding, with particular emphasis on UN General
Assembly (UNGA) voting alignment with the U.S. and G7. This approach has been used to
examine loan allocation, disbursement (Kilby 2013A), enforcement of conditionality (Kilby
2009), whether governance quality impact the composition of lending (Winters 2010), and the role
of recipient accounting practices in lending decisions (Lamoreaux et al. 2014). Dreher et al. (2009)
and Vreeland and Dreher (2014) demonstrate the relevance of UNSC membership, finding that
World Bank borrowers get more loans per year while they serve as non-permanent members on
5 Daugirdas (2013) provides interesting evidence that the role of Congress has been consistently underestimated, however.

8
the UNSC. Kilby (2013B) provides a mechanism for this UNSC effect, namely a shorter
preparation period for projects of UNSC members. Dreher et al. (2013) and Kilby (2015)
document the downstream effects of preferential lending to UNSC members, finding a lower
probability of satisfactory outcomes for such projects. Kilby and Michaelowa (2016) report an
apparent bias in re-evaluations of projects by the Independent Evaluation Group that favors
nonpermanent UNSC members.
Kersting and Kilby (2016B) present evidence of World Bank electioneering favoring
incumbent governments aligned with the U.S. Kersting and Kilby (2016A) explore the domestic
politics behind the exercise of U.S. influence in the World Bank, finding that results from previous
studies are driven principally by years when the U.S. government was divided. This suggests that
the U.S. administration uses its influence in the World Bank as a substitute for bilateral aid when
its opportunity cost of the latter is high.
A number of researchers have explored the influence of bureaucratic interests within the
World Bank. Kaja and Werker (2010) uncover evidence of institutional bias, with higher levels
of IBRD lending to countries with serving on the World Bank’s executive board. Morrison (2013)
finds the same pattern for IDA prior to 1989 but not since. Geginat and Kraay (2012) test the
proposition that the World Bank engages in defensive lending with its highly concessional IDA
credits, increasing new loan disbursements when previous loans come due to avoid defaults on the
previous loans. Although a strong partial correlation exists between new disbursements and
repayment of old loans, this is largely explained by rare cases where countries fall into “non-
accrual status” (arrears of 60 days or more) which triggers an automatic suspension of
disbursement. Morrison (2011) also examines IDA data for evidence of defensive lending, noting
important changes over the previous two decades.

9
However, despite the dramatic expansion in the volume of supplemental World Bank loans,
the academic literature has not explored this topic nor are there major World Bank studies. We
turn now to a detailed presentation of the available data.
3. Data
Overview of data availability
We draw on two different versions of the World Bank Projects Database to analyze supplemental
loans. The main World Bank Project Database (henceforth “main database”) includes a flag for
supplemental loans (which have their own Project IDs and Loan Numbers).6 The main database
includes all World Bank lending operations since Bretton Woods. Detailed information on
disbursements and other financial transactions for more recent loans (from 1980s on) is available
via the “Financials” tab of the website (henceforth “financials database”). Project IDs for
supplemental loans have no separate entries in the financials database; instead all information
appears under the original Project ID but broken out by Loan Number. Mapping directly between
the two databases would require manual matching (by country, timing, amounts, and project name
or via project documents) because the main database variable for loan numbers is sparsely
populated (only 6 of 1151 supplemental active or closed IBRD/IDA-funded projects).
Based on this, we treat the two databases separately. For questions that do not involve
disbursements or project-level characteristics of the original loans, we use the main database
6 We take SUPPLEMENT equal to “Y” to indicate a supplemental loan (“N” and a few missing values (associated with regional projects) indicating non-supplemental loans). We recoded 50 apparently misclassified projects as non-supplemental. We identified these via data characteristics inconsistent with a supplemental loan: thirty-two were rated by the Independent Evaluation Group (indicating they were stand-alone projects, not supplements to an existing project); 14 others had their own entries in the financials database (ditto); and finally 4 were B-loans (commercial loans guaranteed by the World Bank; identified by project names beginning with the word “B-loan”). Results are not sensitive to this correction although the standard errors are slightly reduced in the conditional logit estimation (consistent with eliminating some noise from the data).

10
because of its complete coverage. For statistics like the size of supplemental loans relative to
original loans or information about disbursements, we use the financials database. The empirical
analysis aggregates to the country-year level (since this is appropriate for considering our political
economy questions) but we start with some descriptive information at the project level.
Some descriptive statistics and graphs
Here, we restrict our analysis to approved World Bank projects funded via IBRD/IDA
loans and credits.7 Our version of the main database is as of July 12, 2016 and covers 11,704
projects and 1151 supplemental loans approved between May 9, 1947 and June 29, 2016.
Narrowing the focus to our estimation period (2000-2015), the main database includes 4,041
projects and 772 supplemental loans so that approximately 19% of regular projects received
additional financing of this type. We can also break this down by funding source: 1529 IBRD-
funded projects and 149 supplemental IBRD loans (10% with additional financing); 2407 IDA-
funded projects and 614 supplemental IDA credits (26% with additional financing); and 104
projects with both IBRD and IDA regular loans (“blend” projects) and 7 supplemental blend loans
(7% with additional financing).8 Looking at loan amounts rather than number of loans,
supplemental lending is equivalent to 9.1% of regular lending, 5.9% for IBRD only projects, 15.2%
for IDA only projects, and 2.6% for blend projects. Investment lending accounts for 94% of
supplemental lending (by count or amount). In dollar terms, World Bank supplemental lending
totals US$41 billion over this period, US$16 billion from IBRD and US$25 billion from IDA.
Individual supplemental loans range from trivial (US$0.1 million) to massive (a US$1.25 billion
7 We examine the sample with approval dates, product line “IBRD/IDA,” and non-zero loan/credit/grant amounts. 8 Generally, IBRD supplements go to IBRD-funded projects and IDA supplements go to IDA-funded but we do see a handful of exceptions where we have data to map specific supplements to specific projects.

11
IBRD supplemental investment loan to Mexico and a US$750 million IDA supplemental
investment credit to India, both in 2010).
We can also look at supplemental financing by country (setting aside regional projects with
no individual country designation). There are 140 countries that received IBRD loans or IDA
credits/grants during the period from 2000 to 2015. The average number of projects per country
is 28, ranging from one project (6 countries) to 170 (India). The total amount of these loans by
country averages $3.2 billion, ranging from $9.5 million (Slovenia) to $49 billion (India).
Switching to supplemental loans, there are 108 countries that receive supplemental World Bank
funding. The average number of supplemental loans per country in this group is 7, ranging from
1 supplemental loan (13 countries) to 27 (Tanzania). The total amount of these supplemental loans
by country averages $365 million, ranging from $1.4 million (Belize) to $2.9 billion (India).
When the World Bank provides additional financing this way, is it typically a minor
addition to the original loan or more substantial? To calculate supplemental financing as a share
of the initial loan amount, we need to link supplemental loans directly with their original project.
For that, we turn to the financials database with its more limited coverage (2000-2012).
There are 3355 non-regional projects in the financials database, 476 (14%) of which have
additional financing. For those with supplemental loans, the average supplemental loan is 84% of
the original loan amount, ranging from 0.1% to 563%. Looking at IBRD lending, 95 projects with
IBRD loans received supplemental commitments, which averaged 102% of the original IBRD loan
amount and ranged from 12% to 728%. For IDA, 382 projects with IDA credits received
supplemental commitments, which averaged 82% of the original IDA credit amount and ranged
from 0.1% to 563%.9
9 Note that the IBRD and IDA project numbers total one more than the overall project number because of one project that received both IBRD and IDA supplements. Blend projects (those with both IBRD and IDA initial commitments)

12
The key takeaways are that supplemental financing is about one tenth of World Bank
regular project lending and has become an increasingly important tool for the World Bank to
respond rapidly to changing circumstances. It varies considerably between countries, can be quite
substantial in individual cases, and is particularly important for the allocation of IDA resources.
Estimation Samples
The analysis below uses a two-part model (Cameron and Trivedi 2005, 544-546) to
compare supplemental loan allocation to regular loan allocation. The first part of the model is a
selection equation (we use conditional logit as the primary model); the second part of the model is
conditional allocation (we use the fixed effects estimator). For this exercise, there are four relevant
samples: (1) supplemental loan selection; (2) regular loan selection; (3) supplemental loan
conditional allocation; and (4) regular loan conditional allocation. In all cases, we restrict samples
to years where the country was eligible to borrow, i.e., had not yet officially graduated from IBRD
borrowing and was in good standing (not in “non-accrual status” for arrears on repayment of other
loans). For supplemental loans, we impose the additional condition that there is at least one on-
going project that could receive a supplemental loan.
In the case of the supplemental loan selection equation, this implies 1963 country-years
(for 143 countries), 488 of which include supplemental loan commitments. Our conditional logit
specification drops 36 countries (350 observations) that never got a supplemental loan during this
period.10 Specifications that include UN voting alignment also drop Kosovo (8 observations, two
of which include supplemental loans), which is not a member of the UN. Finally, 46 data points
explain why the supplemental financing percentage maximum is lower in the overall figures than in the IBRD/IDA categories. There are 20 IDA projects that get IBRD supplemental loans and 5 IBRD projects that get IDA supplemental credits. These cases are categorized under their initial loan type (IDA for the first group, IBRD for the second). 10 Because of this limitation, we include a linear probability model in our robustness checks below.

13
drop due to missing GDP data, including 9 cases with supplemental loans; this eliminates another
3 countries. The final supplement selection sample is 1559 observations on 103 countries, of
which 477 country-years include supplemental loan commitments.
We see a similar pattern for the regular loan selection sample. We start with 2246 country-
years (for 149 countries), 1430 of which include regular loan commitments. The conditional logit
drops 30 countries (448 observations), 21 countries (318 observations) that always got a regular
loan and 9 countries (130 observations) that never got a regular loan during this time period.
Including UN voting alignment again kicks out Kosovo (12 observations, five of which include
regular loans). Missing GDP data cause 52 observations to drop, including 35 cases with regular
loans; this drops another 2 countries. Thus, the final regular loan selection sample consists of 1734
observations on 116 countries, 1072 of which include regular loan commitments.
The supplemental loan conditional allocation equation sample matches the selection
subsample with positive loan amounts (103 countries, 477 observations). The regular loan
conditional allocation equation sample is 1400 observations on 137 countries. This is larger than
the corresponding selection subsample (116 countries, 1072 observations) because the estimator
in the allocation equation does not require dropping observations for countries that received regular
loans every year during the sample period.11
Descriptive Statistics
Table 1 presents descriptive statistics for the selection equations. Note first that the sample
is smaller for supplemental loans (1559) than for regular loans (1734) since supplemental loans
are only possible if there is an on-going project while no such restriction applies to regular loans.
11 We return to this issue in the robustness section with three different approaches: 1) estimating a linear probability model for the selection equations (that also does not require dropping these observations/countries); 2) imposing the conditional logit sample restrictions on the conditional allocation equations; and 3) setting aside the two part model and estimating an unconditional allocation equation.

14
For the supplemental loan selection equation, the dependent variable (supplement) equals 1 if the
country received at least one supplemental loan that year, 0 otherwise. For this sample, 30.6% of
eligible country-years included a supplemental loan commitment. log Population averages 16 (9
million), ranging from 9.2 (10,000 in Tuvalu) to 21 (1.37 billion in China). log PPP GDP per
capita averages 8.3 (PPP US$ 3900), ranging from 6.2 (PPP US$ 493 in DRC) to 10 (PPP US$
22,145 in Chile). Average previous year’s alignment with the U.S. in UNGA voting (using roll
call votes on regular session resolutions that passed) is 0.30, ranging from a low of 0.13 to high of
0.85 on a 0 to 1 scale.12 Five percent of observations are country-years when a country held a non-
permanent seat on the UNSC the previous year, and 6.6% of observations are country-years where
the country was represented on the World Bank executive board the previous year.
[Table 1]
Regular loans are committed more frequently, as can be seen in the second panel of Table
1. In our sample period 61.8% of country-years contain commitments of new regular loans. There
are no important differences between the two samples in terms of the macro variable summary
statistics. However, the proportions of observations representing countries being non-permanent
UNSC members or represented on the World Bank executive board are smaller in the regular loan
sample with 3.7% and 4.2%, respectively.
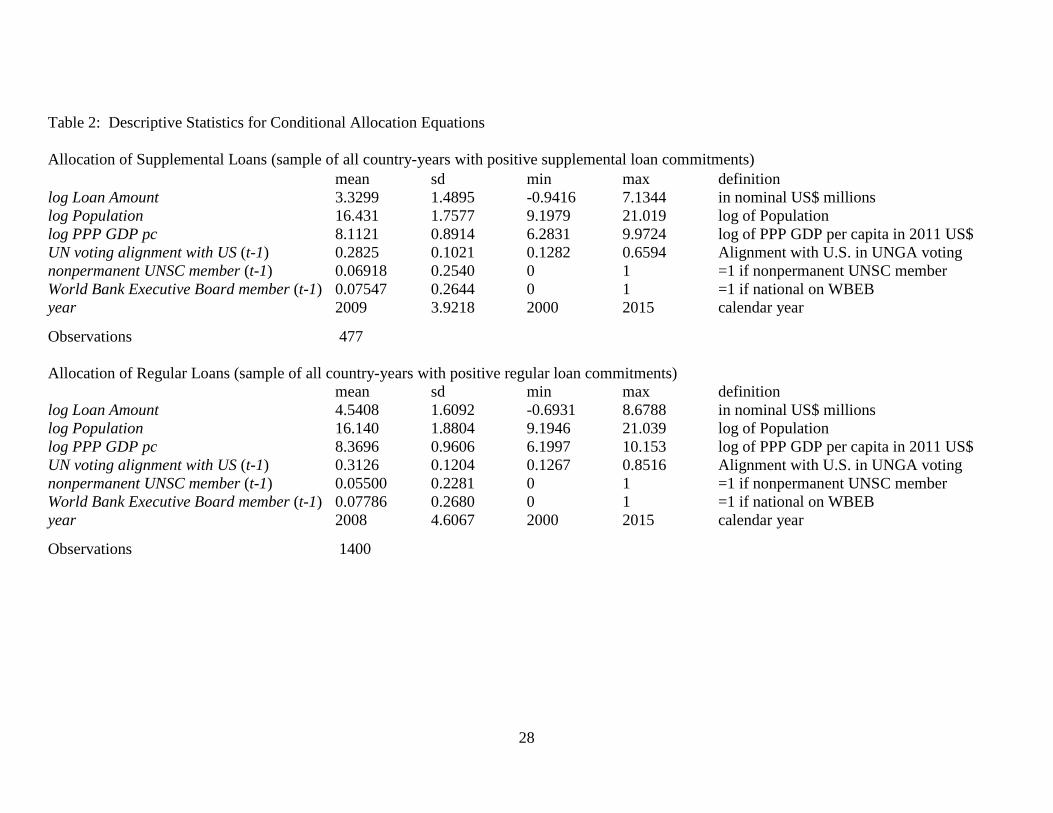
Table 2 presents the summary statistics for the conditional allocation samples. The logged
loan amount for supplemental loans averages at 3.33 ($27.9 million) and ranges from -0.94
($390,000 supplemental loan to Tanzania in 2003) to 7.13 ($1.254 billion of supplemental loans
to India in 2010). The incidence of country-year cells with nonpermanent UNSC membership in
12 We measure alignment as in Kilby (2009), assigning a value of 1 if both countries vote the same, 0 if one votes “yes” and the other “no,” and 0.5 if one is absent or abstains when the other votes. These values are then averaged across all votes in the session for an alignment value between 0 and 1. Because UNGA votes are overwhelmingly in November and December (often late December), we record them as measuring alignment in the subsequent year.

15
this sample is 6.9 percent, and 7.5 percent for World Bank executive board membership. Turning
to the sample of positive regular loan commitments, the most important differences lie in the
(logged) loan amount and the incidence of nonpermanent UNSC membership. The former
averages 4.54 ($93.8 million) and ranges from -0.69 ($500,000 to Timor-Leste in 2005) to 8.68
($5.9 billion to India in 2009). The latter is 5.5 percent, which is lower than the corresponding
value for the supplemental loan sample.
[Table 2]
4. Empirical Analysis
We start with a two-part model of supplemental loan allocation. The unit of observation is the
country/year with the sample restricted to cases where a country would be eligible to receive
additional financing, i.e., when it has IBRD- or IDA-funded projects already under implementation
and is eligible to borrow (e.g., not in non-accrual status). The two-part model consists of a
conditional logit estimation of a supplemental loan selection equation using the sample just
described and a country fixed effects estimation of an allocation model, conditional on selection
(i.e., using the sample with supplemental loan commitments). For comparison, we also report the
results from a two-part model of regular loan allocation.
Table 3 presents the conditional logit estimation results for the selection equation with
country fixed effects and year dummies. Column (1) corresponds to supplemental loans and
column (2) to regular loans. We use a relatively parsimonious specification in terms of control
variables since our model includes country fixed effects and year dummies and our sample only
spans 16 years. The inclusion of country fixed effects helps explain why neither population nor

16
income per capita are significant; within-country variation in population and income per capita
explain little about selection for supplemental loans over this short period of time.13
[Table 3]
Turning to the geopolitical variables, the only statistically significant coefficient in the
supplemental loan selection equation is non-permanent UNSC membership. Countries with
existing loans have a higher than normal probability of receiving a supplemental loan if they held
a seat on the UNSC in the previous year. Our estimation result corresponds to an increase in the
probability of receiving a supplemental loan by at least ten percentage points, which is consistent
with the difference in the raw data.14 UN voting alignment with the U.S. enters with a negative
but insignificant coefficient; in parallel specifications, voting alignment with any of the other G7
countries is also insignificant.15 Likewise, the estimated coefficient for membership on the World
Bank Executive Board is negative but small and far from significant. Specifications that include
only one geopolitical variable at a time produce similar results (in terms of sign, significance and
magnitude); UNSC membership alone impacts the probability of receiving a supplemental World
Bank loan.
Comparing these results with regular loan selection (column 2) highlights two differences.
First, regular loan selection is more sensitive to within-country variation in population (increasing
13 Dropping country fixed effects from the supplemental loan selection equation, log Population enters with a positive and significant coefficient and log PPP GDP pc with a negative and significant coefficient as need-based allocation would predict. Coefficient estimates for the geopolitical variables are unchanged in terms of sign, significance, and (roughly) size. 14 There are a number of ways to gauge the size of this marginal effect; all yield similar results. The fixed effects conditional logit results correspond to an odds ratios of 1.8. To calculate a probability differential as a marginal effect at the average value, we re-estimate the equation on the same sample as a logit that explicitly includes country dummies (13.7%), as a random effects logit (13.2%), as a probit that explicitly includes country dummies (13.1%), as a random effects probit (12.7%), and as a linear probability model with country fixed effects (11.5%). Average marginal effects cluster closer to ten percentage points: FE logit 10.9%; RE logit 11.5%; FE probit 10.5%; and RE probit 11.2%. 15 Results for UN voting are less consistent than for UNSC membership during this period, with the former depending on timing, which votes are considered, and whether we examine selection, conditional allocation or unconditional allocation. See for example Table 4 and robustness checks in Table 6.

17
with rising population but just missing significance with a p-value of 0.110) and income
(decreasing with rising PPP GDP per capita and significant with a p-value of 0.011). Second, in
this specification there is no evidence of UNSC membership or other geopolitical variables
impacting selection for regular loans. Parallel specifications that instead include voting alignment
with any of the other G7 countries produce similar results as do specifications that include only
one geopolitical variable at a time.
Table 4 presents the results from estimating the allocation equation. Recall that the
equation is a conditional one; we estimate the determinants of a country’s annual commitment
amount for the cases where the country does get a commitment.16 This causes the drop in the
number of observations (see also the discussion in the previous section). The estimation method is
ordinary least squares with country fixed effects, and columns 1 and 2 present the estimation results
with and columns 3 and 4 without logging the dependent variable, total loan amount (equivalently,
commitment amount). The results again suggest that supplemental lending (columns 1 and 3) is
fundamentally different from regular lending (columns 2 and 4). Two geopolitical variables impact
the amount of supplemental commitments. UN voting alignment with the U.S. now enters with a
sizable, positive and significant coefficient in columns 1 and 3, indicating that when countries vote
more like the U.S. and receive supplemental commitments, those commitments are larger than
normal. Supplemental commitments are also larger if the recipient country was a nonpermanent
UNSC member in the previous year, matching the pattern from the allocation equation. These
effects are sizable. The average within-country change in UN voting alignment in the sample is
0.15 and the maximum is 0.315 (Malawi); these changes correspond to 45% and 90% predicted
16 Note that our analysis is at the country/year level, not at the individual loan level. Thus, an increase in commitments could indicate more loans or larger loans. For our purposes the distinction is irrelevant but we attempt to pick our words carefully to avoid implying one or the other.

18
changes in the supplemental commitment amount, ceteris paribus. Nonpermanent membership on
the UNSC is associated with a 50% higher supplemental commitment amount, ceteris paribus. In
contrast, Executive Board membership does not appear to play a role in determining the
supplemental commitment level; the coefficient estimate is close to zero and far from statistical
significance.
[Table 4]
Results are the mirror image for regular loan commitments (columns 2 and 4). The
coefficient estimates for UN voting alignment and UNSC membership are much closer to zero and
far from statistical significance. In contrast, Executive Board membership appears to play an
important role in determining the magnitude of regular commitments (conditional on receiving
some). The point estimate indicates that the regular loans’ borrowers have a 30% or $177 million
higher annual commitment total (conditional on receiving a new regular loan or credit) when they
had direct representation on World Bank Executive Board the previous year as compared to when
they did not.
Taken together, the selection and allocation results allow some back-of-the-envelope
calculations in order to gauge the economic significance of our finding. Favoritism towards
temporary UNSC members takes two forms here, a higher probability of supplemental
commitments and larger supplement commitments. Our sample includes 1559 country-years, of
which 79 correspond to cases where countries were nonpermanent UNSC members the previous
year. This implies about 8 (10+% of 79) additional cases with supplemental commitments or $640
million in extra commitments (8 * $80 million, the average non-zero annual supplemental
commitment in our data). In addition, the allocation equation implies that UNSC members get
larger loans. The size of this premium is easiest to calculate from the linear specification using

19
Loan Amount (Table 4, column 3). The coefficient estimate on nonpermanent UNSC member is
98.3, indicating that supplemental commitments are $98.3 million higher when a country holds
one of the nonpermanent seats on the UNSC, ceteris paribus. Thirty-three observations fall in this
category, indicating an additional $3.24 billion (33 * $98.3 million) for countries on the UNSC.
Summing up, we arrive at about $3.9 billion in supplemental lending linked to the UNSC
membership status of the recipient country as compared to $37.7 billion in supplemental lending
for the full estimation sample.
Alternatively, one can simply employ OLS on the entire sample in order to generate an
estimate of the unconditional linear effect of UNSC membership on supplemental commitment
amounts. This coefficient turns out to be 34.54, and multiplied with the number of UNSC
observations (96) yields about $3.3 billion of additional commitments, which is lower but still
comparable to the number reported above. (We present the full estimation result as a robustness
check in the first column of Table 6 below.) Taking into account the two numbers, these
calculations suggest that favoritism toward nonpermanent UNSC members accounted for about
10% of all supplemental lending between 2000 and 2015.
The effect of UN voting alignment on supplemental loans proves less robust to changes in
specification, as the next section shows. For that reason we focus our analysis primarily on the
effects of UNSC membership.
Robustness Checks
Table 5 presents robustness checks for the selection equation. Instead of using a conditional logit,
we estimate linear probability models (columns 1 and 2) and probit specifications (columns 3 and
4). Odd numbered columns correspond to supplemental loans, even to regular loans. Column (1)
shows that the significant effect of temporary UNSC membership in the previous year remains,

20
and the magnitude is also close to the 10% marginal effect we obtained using logit, which explicitly
addresses the non-linear nature of estimating probabilities.17 Column (2) is also consistent with
the previous results, again showing no geopolitical effects in regular loan selection. Columns (3)
and (4) repeat the exercise using a probit estimator, reporting marginal effects. For supplemental
loan selection (Column 3), UNSC membership in the previous year increases the probability of a
supplemental commitment by 13%. We conclude that the choice of estimation method and related
sample variation do not drive our main finding that selection into supplemental commitments
depends on UNSC membership. Regular loan selection (Column 4) again shows no evidence of
geopolitical influence.
[Table 5]
Table 6 departs from the two-part model and instead estimates a single (unconditional)
allocation equation, including both cases where commitments are zero and where they are positive.
Again, odd-numbered columns are for supplemental loan commitments and even-numbered for
regular loan commitments. In columns (1) and (2), the dependent variable is the commitment
amount in millions (not logged) and estimation is via fixed effects. In columns (3) and (4), the
dependent variable is the log of 1 plus the commitment amount (to avoid log of zero) and
estimation is again via fixed effects. Columns (5) and (6) apply the Tobit estimator to the
commitment amount (levels) while columns (7) and (8) apply the Tobit estimator to the log of 1
plus the commitment amount. All specifications include year dummies and country fixed effects.18
17 The difference between the linear probability model (LPM) results and the logit or probit results is primarily driven by the sample. The LPM does not require dropping countries with no variation in the outcome variable. This accounts for the difference between the result reported here (full sample) and that in footnote 17 (which is limited to the logit sample for comparability). 18 While the Tobit estimator is biased and inconsistent with fixed effect due to the incidental parameters problem, Greene (2004, 144-145) demonstrates that in practice there is “essentially no bias in the slope estimators for the tobit model” and the bias in marginal effects “appears to be small if T is 5 or more,” a condition easily satisfied here. Nonetheless, standard errors are underestimated so that we should be cautious about statistical inference.

21
While estimation results are inconsistent across estimation methods for some explanatory variables
(logged population, logged GDP, alignment in UN voting, and World Bank Executive Board
membership), the UNSC results are remarkably stable in all four settings: Supplemental
commitments—but not regular commitments—are larger when the recipient country was a
nonpermanent UNSC member in the previous year.
[Table 6]
5. Conclusion
To quote Heraclitus, the only constant is change. This certainly applies to the World Bank. Recent
years have seen a rapid expansion in World Bank supplemental loan commitments that has added
tens of billions of dollars to existing projects, injecting extra cash with far less delay than through
the normal lending process. Supplemental lending is often in response to shortfalls in resources
needed to complete a project or to pressing crises—but it also depends to geopolitical factors.
When countries hold one of the nonpermanent seats on the UN Security Council they are more
likely to receive supplemental loan commitments and those commitments tend to be significantly
larger than the supplemental commitments they receive at other times. Of the $40 billion in
supplemental commitments during the period we study in this paper, our estimates suggest that
roughly 10% were driven by this geopolitical consideration.
Past research (Dreher et al. 2013; Kilby 2015) identifies the cost of such favoritism in terms
of worse project outcomes. Geopolitical influence that expands supplement lending adds another
dimension to this: Supplemental loans are approved and disburse more quickly and thus are likely
subject to less oversight. A particularly clear, though otherwise fairly typical example, comes
from a December 2008 supplemental loan to Mexico which added $401 million to an October
2008 regular loan for $300.75 million. The loan proposal states: “No conditions, except for the

22
standard requirement for a legal opinion will apply to this Supplemental Financing.” (World Bank
2008, 13) Thus, the speed of the preparation and disbursement of supplemental loans can translate
into less oversight than for regular loans.
The results presented in this paper provide a more nuanced understanding of the changing
nature of geopolitics in World Bank lending and help point to ways—direct and indirect—in which
geopolitical forces shape the development effectiveness of the institution. One clear message is
that the rise of new modalities of development finance provide openings for donors to exert
influence over multilateral aid to serve other goals.

23
References
Akins, Michael E. 1981. United States Control over World Bank Group Decision-Making. Unpublished doctoral dissertation. University of Pennsylvania, Philadelphia.
Andersen, Thomas Barnebeck, Henrik Hansen, and Thomas Markussen. 2006. “US politics and World Bank IDA-lending.” Journal of Development Studies 42(5):772-794.
Cameron, A. Colin, and Pravin K. Trivedi. 2005. Microeconometrics: Methods and Applications. Cambridge: Cambridge University Press.
Daugirdas, Kristina. 2013. “Congress underestimated: The case of the World Bank.” American Journal of International Law 107(3):517-562.
Dreher, Axel, Stephan Klasen, James Raymond Vreeland, and Eric Werker. 2013. “The costs of favoritism: Is politically-driven aid less effective?” Economic Development and Cultural Change 62:157-191.
Dreher, Axel, Jan-Egbert Sturm, and James Raymond Vreeland. 2009. “Development aid and international politics: Does membership on the UN Security Council influence World Bank decisions?” Journal of Development Economics 88:1-18.
Eichenauer, Vera, and Simon Hug. 2016. “The politics of special purpose trust funds.” Working Paper.
Eichenauer, Vera, and Stephen Knack. 2016. “Poverty and policy selectivity of World Bank trust funds.” World Bank Policy Research Working Paper #7731.
Eichenauer, Vera, and Bernhard Reinsberg. 2016. “What determines earmarked funding to international development organizations? Evidence from the new Multi-bi Aid Dataset.” AidData Working Paper #25.
Fleck, Robert K., and Christopher Kilby. 2006. “World Bank independence: A model and statistical analysis of U.S. influence.” Review of Development Economics 10(2):224-240.
Frey, Bruno, and Friedrich Schneider. 1986. “Competing models of international lending activity.” Journal of Development Economics 20, 225-245.
Geginat, Carolin, and Aart Kraay. 2012. “Does IDA engage in defensive lending?” Review of Economics and Institutions 3(2, article 3):1-24.
Greene, William. 2004. “Fixed effects and bias due to the incidental parameters problem in the Tobit model.” Econometric Reviews 23(2):125-147.
Gwin, Catherine. 1997. “US relations with the World Bank, 1945-92.” In Devesh Kapur, John P. Lewis, and Richard Webb (eds), The World Bank: Its First Half Century, Vol. 2, Washington: The Brookings Institute. Pages 243-274.
Kaja, Ashwin, and Eric Werker. 2010. “Corporate governance at the World Bank and the dilemma of global governance.” The World Bank Economic Review 24(2):171-198.

24
Kersting, Erasmus, and Christopher Kilby. 2016A. “Do domestic politics shape U.S. influence in the World Bank?” Villanova School of Business Economics Working Paper #28.
Kersting, Erasmus, and Christopher Kilby. 2016B. “With a little help from my friends: Global electioneering and World Bank lending.” Journal of Development Economics 121:153-165.
Kilby, Christopher. 2009. “The political economy of conditionality: An empirical analysis of World Bank loan disbursements.” Journal of Development Economics 89(1):51-61.
Kilby, Christopher. 2013A. “An empirical assessment of informal influence in the World Bank.” Economic Development and Cultural Change 61(2):431-464.
Kilby, Christopher. 2013B. “The political economy of project preparation: An empirical analysis of World Bank projects.” Journal of Development Economics 105:211-225.
Kilby, Christopher. 2015. “Assessing the impact of World Bank preparation on project outcomes.” Journal of Development Economics 115:111-123.
Kilby, Christopher, and Katharina Michaelowa. 2016. “What influences World Bank project evaluations?” Villanova School of Business Economics Working Paper #26.
Lamoreaux, Phillip T., Paul N. Michas, and Wendy L. Schultz. 2015. “Do accounting and audit quality affect World Bank lending?” The Accounting Review 90(2):703-738.
Morrison, Kevin M. 2011. “As the World Bank turns: IDA lending in the Cold War and after.” Business and Politics 13(2, article 2):1-27.
Morrison, Kevin M. 2013. “Membership no longer has its privileges: The declining influence of board members on IDA lending.” Review of International Organizations 8(2):291-312.
OECD. 2015. Multilateral Aid 2015: Better Partnerships for a Post-2015 World. Paris: OECD Publishing.
Reinsberg, Bernhard, Katharina Michaelowa, and Stephen Knack. 2015. “Which donors, which funds? The choice of multilateral funds by bilateral donors at the World Bank.” World Bank Policy Research Working Paper #7441.
Vreeland, James Raymond, and Axel Dreher. 2014. The Political Economy of the United Nations Security Council: Money and Influence. Cambridge: Cambridge University Press.
Winters, Matthew S. 2010. “Choosing to target: what types of countries get different types of World Bank projects.” World Politics 62(3):422-458.
World Bank. 2004. OP 8.60 – Development Policy Lending. http://go.worldbank.org/N3Y839UBH0
World Bank. 2005. OP 13.20 – Additional Financing for Investment Lending. http://go.worldbank.org/F0WIKCKD10

25
World Bank. 2008. Supplemental Financing Document for Proposed Supplemental Loan in the Amount of US$401 million to the United Mexican States for the Environmental Sustainability Development Policy Loan. Report No: 46484-MX.

26
Figure 1: # of Regular & Supplemental Loans, by approval year
010
020
030
0
1950 1960 1970 1980 1990 2000 2010
Regular Supplement
by approval yearNumber of Regular & Supplemental Loans

27
Table 1: Descriptive Statistics for Selection Equations
Selection for Supplemental Loans (sample of country-years with on-going projects and IBRD/IDA borrowing eligibility) mean sd min max definition supplement 0.3060 0.4610 0 1 =1 if any supplemental loans in year log Population 15.995 1.8471 9.1946 21.039 log of Population log PPP GDP pc 8.2666 0.9165 6.1997 10.005 log of PPP GDP per capita in 2011 US$ UN voting alignment with US (t-1) 0.3053 0.1129 0.1267 0.8516 Alignment with U.S. in UNGA voting nonpermanent UNSC member (t-1) 0.05067 0.2194 0 1 =1 if nonpermanent UNSC member World Bank Executive Board member (t-1) 0.06607 0.2485 0 1 =1 if national on WBEB year 2008 4.5779 2000 2015 calendar year
Observations 1559 Selection for Regular Loans (sample of all country-years with IBRD/IDA borrowing eligibility) mean sd min max definition non_supplement 0.6182 0.4860 0 1 =1 if any regular loans in year log Population 15.248 1.9573 9.1929 19.057 log of Population log PPP GDP pc 8.5963 0.9697 6.1997 10.362 log of PPP GDP per capita in 2011 US$ UN voting alignment with US (t-1) 0.3322 0.1338 0.1026 0.8516 Alignment with U.S. in UNGA voting nonpermanent UNSC member (t-1) 0.03749 0.1900 0 1 =1 if nonpermanent UNSC member World Bank Executive Board member (t-1) 0.04210 0.2009 0 1 =1 if national on WBEB year 2008 4.5838 2000 2015 calendar year
Observations 1734
28
Table 2: Descriptive Statistics for Conditional Allocation Equations Allocation of Supplemental Loans (sample of all country-years with positive supplemental loan commitments) mean sd min max definition log Loan Amount 3.3299 1.4895 -0.9416 7.1344 in nominal US$ millions log Population 16.431 1.7577 9.1979 21.019 log of Population log PPP GDP pc 8.1121 0.8914 6.2831 9.9724 log of PPP GDP per capita in 2011 US$ UN voting alignment with US (t-1) 0.2825 0.1021 0.1282 0.6594 Alignment with U.S. in UNGA voting nonpermanent UNSC member (t-1) 0.06918 0.2540 0 1 =1 if nonpermanent UNSC member World Bank Executive Board member (t-1) 0.07547 0.2644 0 1 =1 if national on WBEB year 2009 3.9218 2000 2015 calendar year
Observations 477 Allocation of Regular Loans (sample of all country-years with positive regular loan commitments) mean sd min max definition log Loan Amount 4.5408 1.6092 -0.6931 8.6788 in nominal US$ millions log Population 16.140 1.8804 9.1946 21.039 log of Population log PPP GDP pc 8.3696 0.9606 6.1997 10.153 log of PPP GDP per capita in 2011 US$ UN voting alignment with US (t-1) 0.3126 0.1204 0.1267 0.8516 Alignment with U.S. in UNGA voting nonpermanent UNSC member (t-1) 0.05500 0.2281 0 1 =1 if nonpermanent UNSC member World Bank Executive Board member (t-1) 0.07786 0.2680 0 1 =1 if national on WBEB year 2008 4.6067 2000 2015 calendar year
Observations 1400

29
Table 3: Selection for World Bank loans: Supplemental v. Regular (1) (2) log Population -1.127 1.847 (-0.82) (1.60) log PPP GDP pc 0.432 -1.592** (0.65) (-2.56) UN voting alignment with US (t-1) -1.827 -0.266 (-1.41) (-0.27) nonpermanent UNSC member (t-1) 0.613** 0.279 (2.04) (0.80) World Bank Executive Board member (t-1) -0.0489 0.0514 (-0.14) (0.13)
Observations 1559 1734
z-statistics in parentheses. * p<.1 ** p<.05 *** p<.01 All specifications are conditional logits (country fixed effects) with year dummies. Unit of observation is the country-year. (1) Dependent variable =1 if supplemental commitments. Sample restricted to cases with ongoing projects and where country is eligible to borrow. (2) Dependent variable = 1 if regular commitments. Sample restricted to cases where country is eligible to borrow.

30
Table 4: Conditional allocation of World Bank loans: Supplemental v. Regular (1) (2) (3) (4) log Population 0.481 -1.613*** 8.892 -334.9 (0.28) (-3.04) (0.09) (-1.41) log PPP GDP pc 1.001 0.270 111.6** 259.8* (1.45) (1.10) (2.59) (1.92) UN voting alignment with US (t-1) 3.016*** 0.0334 258.1** 145.3 (2.98) (0.07) (2.47) (1.21) nonpermanent UNSC member (t-1) 0.507** 0.0835 98.28** 12.20 (2.52) (0.88) (2.39) (0.20) World Bank Executive Board member (t-1) -0.0599 0.306*** -56.51 177.3*** (-0.30) (4.19) (-1.46) (2.63)
Observations 477 1400 477 1400
t-statistics in parentheses based on country-clustered standard errors. * p<.1 ** p<.05 *** p<.01
All specifications include country fixed effects and year dummies. Unit of observation is a country-year. The sample is restricted to cases with positive supplemental commitments in columns (1) and (3) and positive regular commitments in columns (2) and (4). (1) Dependent variable = log of supplemental commitments. (2) Dependent variable = log of regular commitments. (3) Dependent variable = supplemental commitments. (4) Dependent variable = regular commitments.

31
Table 5: Robustness checks for selection equation (1) (2) (3) (4) log Population 0.348* 0.268 -0.190 0.421 (1.77) (1.47) (-0.58) (1.38) log PPP GDP pc 0.212** -0.176* 0.0868 -0.363* (2.06) (-1.75) (0.62) (-1.92) UN voting alignment with US (t-1) -0.107 -0.0486 -0.326 -0.0468 (-0.64) (-0.30) (-1.29) (-0.19) nonpermanent UNSC member (t-1) 0.0893** 0.0325 0.131** 0.0586 (2.11) (0.82) (2.05) (0.74) World Bank Executive Board member (t-1) -0.0279 -0.00108 0.00565 -0.00336 (-0.52) (-0.03) (0.08) (-0.04)
Observations 1919 2162 1559 1734
t/z-statistics in parentheses based on country-clustered standard errors. * p<.1 ** p<.05 *** p<.01 All specifications include country fixed effects and year dummies. Unit of observation is a country-year. Probits report marginal effects. (1) Linear Probability Model with dependent variable = 1 if supplemental commitments. Sample restricted to cases with ongoing projects and where country is eligible to borrow. (2) Linear Probability Model with dependent variable = 1 if regular commitments Sample restricted to cases where country is eligible to borrow. (3) Probit with dependent variable = 1 if supplemental commitments. Sample restricted to cases with ongoing projects and where country is eligible to borrow. Reported values represent marginal effect on the unconditional probability of having a supplemental commitment. (4) Probit with dependent variable = 1 if regular commitments Sample restricted to cases where country is eligible to borrow. Reported values represent marginal effect on the unconditional probability of having a regular commitment.

32
Table 6: Robustness checks – Unconditional allocation equation (1) (2) (3) (4) (5) (6) (7) (8) log Population 60.85** -68.46 1.898** 0.657 -98.44 -26.92 -2.156 0.904 (2.08) (-0.43) (2.32) (0.71) (-0.66) (-0.12) (-0.66) (0.69) log PPP GDP pc 56.07*** 246.5*** 1.239*** -0.128 78.88 200.2 1.210 -0.494 (3.11) (2.64) (3.11) (-0.30) (1.36) (1.60) (0.86) (-0.71) UN voting alignment with US (t-1) 63.39** 73.82 0.705 -0.193 -10.19 93.07 -1.963 -0.241 (2.58) (0.91) (1.17) (-0.28) (-0.10) (0.68) (-0.78) (-0.22) nonpermanent UNSC member (t-1) 34.54** 14.49 0.494*** 0.243 85.43*** 23.72 1.301*** 0.297 (2.20) (0.30) (2.71) (1.36) (2.86) (0.41) (2.86) (1.23) World Bank Executive Board member (t-1) -20.54** 97.12* -0.178 0.134 -27.11 134.5** 0.0137 0.190 (-2.59) (1.95) (-0.85) (0.74) (-1.13) (2.10) (0.02) (0.68)
Observations 1919 2162 1919 2162 1919 2162 1919 2162
t/z-statistics in parentheses based on country-clustered standard errors. * p<.1 ** p<.05 *** p<.01. All specifications include country fixed effects and year dummies. Unit of observation is a country-year. (1) Dependent variable = supplemental commitments. Sample restricted to cases with ongoing projects and where country is eligible to borrow. (2) Dependent variable = regular commitments. Sample restricted to cases where country is eligible to borrow. (3) Dependent variable = log 1 + supplemental commitments. Sample restricted to cases with ongoing projects and where country is eligible to borrow. (4) Dependent variable = log 1 + regular commitments. Sample restricted to cases where country is eligible to borrow. (5) Tobit with dependent variable = supplemental commitments. Sample restricted to cases with ongoing projects and where country is eligible to borrow. (6) Tobit with dependent variable = regular commitments. Sample restricted to cases where country is eligible to borrow. (7) Tobit with dependent variable = log of 1 + supplemental commitments. Sample restricted to cases with ongoing projects and where country is eligible to borrow. (8) Tobit with dependent variable = log of 1 + regular commitments. Sample restricted to cases where country is eligible to borrow.