vijay B.C
52
Working Capital Management Page | 1 SYNOPSIS SI NO PARTICULARS PAGE NO 1 2 3 4 5 6 7 INTRODUCTION RESEARCH METHODOLOGY COMPANY PROFILE DATA ANALYSIS &INTERPERTATION SUGGESTIONS & RECOMMENDATION CONCLUSION BIBILOGRAPHY
-
Upload
manova-kumar -
Category
Documents
-
view
215 -
download
0
Transcript of vijay B.C
8/2/2019 vijay B.C
http://slidepdf.com/reader/full/vijay-bc 1/52
Working Capital Management
P a g e | 1
SYNOPSIS
SI NO PARTICULARS PAGE NO
1
2
3
4
5
6
7
INTRODUCTION
RESEARCH METHODOLOGY
COMPANY PROFILE
DATA ANALYSIS &INTERPERTATION
SUGGESTIONS & RECOMMENDATION
CONCLUSION
BIBILOGRAPHY
8/2/2019 vijay B.C
http://slidepdf.com/reader/full/vijay-bc 2/52
Working Capital Management
P a g e | 2
INTRODUCTION TO FINANCE
In our present day economy, finance is defined as the provision of money at the time when it
is required. Every enterprise, whether big, medium or small, needs finance to carry on its
operations and to achieve the targets. In fact, finance is so indispensable today that it is rightly
said to be lifeblood of an enterprise. Without adequate finance, no enterprise can possibly
accomplish its objectives. The Term finance, in our simple understanding finance is perceived as
equivalent to money. But finance is exactly not money it is the source of providing funds for a
particular activity. Finance is the study of funds and management.
DEFINITION
According to Guttmann and Douglas, Business Finance can be broadly defined as the
activity concerned with the planning, raising, controlling and administering the funds used in
business.
The General Areas of Finance are:
1. Business Finance
2. Public Finance
3. Private Finance
Business finance; Business finance refers to money and credit employed in business. It
involves procurement and utilization of funds so that business firms may be able to carry out
their operations effectively and efficiently.
Public finance; Public finance deals with the requirements, receipts and disbursements of
funds in the government institutions like states, local self governments and central government.
Private finance; Private finance is concerned with requirements, receipts and disbursements
of funds in case of an individual, a profit seeking business organization and a nonprofit
organization.
8/2/2019 vijay B.C
http://slidepdf.com/reader/full/vijay-bc 3/52
Working Capital Management
P a g e | 3
APPROACHES TO FINANCE FUNCTION
A number of approaches are associated with finance function but for the sake of convenience,
various approaches are divided into broad categories:
1. The Traditional Approach: The traditional approach to the finance function relates
the initial stages of its evolution during 1920s and 1930s when the term ‗ corporation
Finance ‗ was used to describe what is known in the academic world today as the ‗
financial management‘. According to this approach, the scope, of finance function was
confined to only procurement of funds needed by a business on most suitable terms.
2. The Modern Approach: The modern approach views finance function in broader
sense. It includes both rising of funds as well as their effective utilization under the
preview of finance. The finance function does not stop only by finding out sources of
raising enough funds; their proper utilization is also to be considered. The cost of rising
funds and the returns from their use should be compared.
MEANING OF FINANCIAL MANAGEMENT
Financial Management deals with the study of procuring funds and it‘s effective and judicious, interms of the overall objectives of the firm, and expectations of the providers of funds.
DEFINITION OF FINANCIAL MANAGEMENT
According to Solomon ―Financial Management is concerned with the efficient use of an
important economic resource namely capital funds‖
According to Phillipatus ― Financial Management is concerned with the management decisions
that result in the acquisition and financing of long term and short term credits of the firms‖
8/2/2019 vijay B.C
http://slidepdf.com/reader/full/vijay-bc 4/52
Working Capital Management
P a g e | 4
OBJECTIVES OF FINANCIAL MANAGEMENT
1. Profit Maximization: profit earning is the main aim of every economic activity. A
Business being an economic institution must earn profit to cover its cost and provide
funds for growth. No business can survive without earning profit. Profit is a measure of
efficiency of a business enterprise.
2. Wealth Maximization: Wealth Maximization is the appropriate objective of an
enterprise. Financial theory asserts that wealth maximization is the single substitute for
the stockholders utility. When the firm maximizes the stockholder‘s wealth, the
individual stockholder can use this wealth to maximize his individual utility.
AIMS OF FINANCIAL MANAGEMENT
Acquiring Sufficient Funds
Proper Utilization of Funds
Increasing Profitability
Maximum Firm‘s Value
SCOPE OR CONTENT OF FINANCIAL MANAGEMENT
Estimate Financial Requirements
Deciding Capital Structure
Selecting Pattern of Investment
Proper Cash Management
Implementing Financial Control
FUNCTIONAL AREAS OF FINANCIAL MANAGEMENT
Financial Analysis and Interpretation
Cost – Volume – Profit Analysis
Capital Budgeting
8/2/2019 vijay B.C
http://slidepdf.com/reader/full/vijay-bc 5/52
Working Capital Management
P a g e | 5
Working Capital Management
FINANCIAL DECISIONS
Financial decisions refer to decisions of concerning financial matters of a business firm. We can
classify these decisions into three major groups:
I. Investment Decisions: Investment decisions relates to the determination of total amount
of assets to be held in the firm, the composition of these assets and business risk
complexions of the firms as perceived by its investors. It is the most financial decision.
II. Financing Decisions: Once the firm has taken the investment decision and committed
itself to new investment, it must decide the best means of financing commitments. Since,
firms regularly make new investments; the needs for financing and financial decisions are
ongoing.
III. Dividend Decisions: The third major financial decision relates to the disbursement of
profits back to investors who supplied capital to the firm. The term dividend refers to the
part of the company which is distributed by it among its shareholders.
FACTORS INFLUENCING FINANCIAL DECISIONS
External Factors
State of economy
Structure of capital and money markets
Requirements of investors
Government policy
Taxation policy
Lending policy of financial institutions
Internal Factors;
Nature and size of business
Expected return, cost and risk
8/2/2019 vijay B.C
http://slidepdf.com/reader/full/vijay-bc 6/52
Working Capital Management
P a g e | 6
Compositions of assets
Structure of ownership
Trend of earnings
Liquidity position
Working capital requirements
Conditions of debit agreements
8/2/2019 vijay B.C
http://slidepdf.com/reader/full/vijay-bc 7/52
Working Capital Management
P a g e | 7
WORKING CAPITAL
INTRODUCTON:
Working Capital may be regarded as lifeblood of business and is an integral part of overall
Corporate Management. Its effective provision can do much to ensure the success of a business,
while its ineffective management can lead not only to loss of profits but also to the ultimate
downfall.
A study of working capital is of major importance to internal and external analysis because of its
close relationship with the current day to day operations of a business.
Working capital is the leading cause of a particular portion of the assets of a business which are
used in, or related to current operation, and represented at any one time by operating cycle of
such items as against receivables, inventories of raw materials, stores, work-in-progress and
finished goods, merchandise, notes or bills receivables and cash.
A managerial accounting strategy focusing on maintaining efficient levels of both components of
working capital, current assets and current liabilities, in respect to each other. Working capital
management ensures a company has sufficient cash flow in order to meet its short-term debt
obligation and operating expenses.
A few key performance ratio of a working capital system are the working capital ratio, inventory
turnover and the collection ratio. Ratio analysis will lead management to identify areas of focus
such as inventory management, cash management, accounts receivable and payable
management.
Related terms are:-
8/2/2019 vijay B.C
http://slidepdf.com/reader/full/vijay-bc 8/52
Working Capital Management
P a g e | 8
Cash flow
Current assets
Current liabilities
Days working capital
Inventory accounting
Inventory turnover
Ratio analysis
Working capital
Working capital turnover
Definition of working capital:
According to Shubin, ―working capital is the amount of funds necessary to cover the cost of
operating the enterprise‖.
According to Genestenberg, ―working capital means the current assets of a company that are
changed in the ordinary course of business from one form to another, for example, from cash to
inventories, to receivables, receivables into cash.
MEANING:
In general, Working Capital refers to the firms investments in current assets. In accounting,
working capital is the difference between the inflow and outflow of funds. In other words, it is
the ‗net cash inflow‘. It is defined as the excess of current assets over current liabilities and
provisions. In other words, it is the ‗net current assets or net working capital‘.
8/2/2019 vijay B.C
http://slidepdf.com/reader/full/vijay-bc 9/52
Working Capital Management
P a g e | 9
Working capital represents the total of all current assets. In other words, it is the ‗gross working
capital‘. It is also known as ‗circulating capital or current capital‘, for current assets are rotating
in nature. Where current liabilities and provisions exceed current assets, the difference is referred
to as negative working capital. Working capital is often referred to as ‗circulating capital‘. The
use of the term circulating capital instead of working capital indicates that its flow is circular in
nature. Working capital, as an accountant defines it is difference between current assets and
current liabilities.
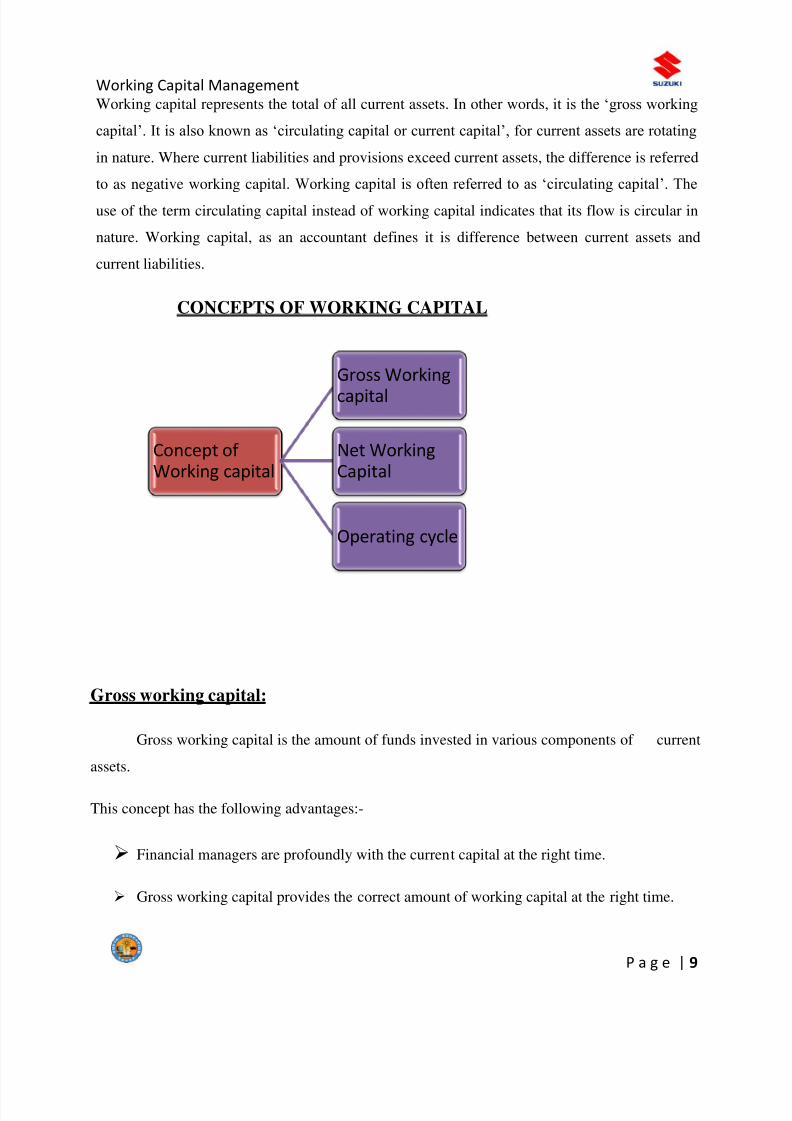
CONCEPTS OF WORKING CAPITAL
Gross working capital:
Gross working capital is the amount of funds invested in various components of current
assets.
This concept has the following advantages:-
Financial managers are profoundly with the current capital at the right time.
Gross working capital provides the correct amount of working capital at the right time.
Concept of Working capital
Gross Working
capital
Net WorkingCapital
Operating cycle
8/2/2019 vijay B.C
http://slidepdf.com/reader/full/vijay-bc 10/52
Working Capital Management
P a g e | 10
It enables a firm to realize the greatest return on its investment.
It helps in the fixation of various areas of financial responsibility.
It enables a firm to plan and control funds and to maximize the return on investment.
For these advantages, gross working capital has become a more acceptable concept in
financial management.
Net working capital:
The net working capital is the difference between current assets and current liabilities. The
concept of net working capital enables a firm to determine how much amount is left for
operational requirements.
Operating cycle:
It is the time duration required to convert sales, after the conversion of resources into inventories
into cash. The operating cycle of a manufacturing company involves three phases:
i. Acquisition of resources such as raw material, labor, power, and fuel etc.
ii. Manufacture of the products, which includes conversion of raw material into work-in-
progress into finished goods.
iii. Sale of the product either for cash or on credit. Credit sales create account receivable for
collection.
8/2/2019 vijay B.C
http://slidepdf.com/reader/full/vijay-bc 11/52
Working Capital Management
P a g e | 11
Factors determining working capital:
Nature of business\ industry
Demand of creditors
Cash requirements
Volume of sales seasonal fluctuations
Technology and manufacturing policy
Credit policy
Operating efficiency
Nature of business\ industry;
Working capital requirements of a firm are influenced by the nature of its business. The
composition of an assts is a function of the size of a business and the industry to which it belongs.
Small companies have smaller propositions of cash, receivables and inventory than large
corporations. This difference more marked in large corporations.
Demand of creditors;
Creditors are interested in the security of loans. They want their obligations to be sufficiently
covered. They want the amount of security in assets which are greater than the liability.
Cash requirements;
Cash is one of the current assets, which are essential for successful operations of the production
cycle. Cash should be adequate and properly utilized. It would be wasteful to hold excessive cash.
8/2/2019 vijay B.C
http://slidepdf.com/reader/full/vijay-bc 12/52
Working Capital Management
P a g e | 12
A minimum level of cash is always requires to keep the operations going.
Volume of sales;
This is the most important factor affecting the size and components of working capital. A firm
maintains current assets because they are needed to support the operational activities which result
in sales.
Seasonal fluctuations;
Seasonal fluctuations in sales affect the level of variable working capital. Often, the demand for
products may be of a seasonal nature.
Technology and Manufacturing Policy:
The manufacturing cycle/the inventory conversion cycle comprises of the purchase and
use of finished goods. Longer the manufacturing cycle, larger will be the firm‘s working capital
requirements. An extended manufacturing time span means a larger tie-up of funds in
inventories. Thus if there are alternative technologies of manufacturing a product, the
technological process with shortest manufacturing cycle may be chosen.
Credit Policy:
The credit policy of the firm affects the working capital by influencing the level of
debtors. The credit terms to be arranged to customers may depend upon the norms of the industry
to which the firm belongs.
Operating Efficiency:
The operation efficiency of the firm relates to the optimum utilization of resources at
minimum costs. The firm will be effectively contributing in keeping the working capital
investment at a lower level if it is efficient in controlling operating costs and utilizing current
8/2/2019 vijay B.C
http://slidepdf.com/reader/full/vijay-bc 13/52
Working Capital Management
P a g e | 13
assets. The use of working capital is improved and pace of cash conversion cycle is accelerated
with operating efficiency.
In SUZUKI LTD the determinants of working capital are nature of business, production policy,
market conditions and price level changes.
TYPES OF WORKING CAPITAL
Permanent working capital:
It means the minimum amount of investment in all current assets, which is regarded as
necessary at all times to carry on minimum level of business. The operating cycle is continuous
process and therefore the need for current assets is known as permanent working capital or fixed
working capital. The Tandon committee has named it as ―core current Assets‖
Temporary working capital:
This is called as the fluctuating or variable working capital. The amount of
working capital keeps on changing depending upon the changes in the production
and sales. The extra working capital required to support the changing production
and sales activities is known as temporary working capital.
Gross working capital:
It is the amount of funds invested in the various components of current assets.
Net working capital:
8/2/2019 vijay B.C
http://slidepdf.com/reader/full/vijay-bc 14/52
Working Capital Management
P a g e | 14
It is the difference between the current assets and the current liabilities. The concept of
net working capital enables the firm to determine the exact amount available at its disposal for
operational requirements.
Negative working capital:
When current liabilities exceed current assets, negative working capital emerges. Such a
situation occurs when a firm is nearing a crisis of some magnitude.
METHODS OF ESTIMATING WORKING CAPITAL:
There are two methods, which are usually followed in determining working capital
requirements. These are:-
1. Convential Method:
According to the conventional method, cash inflows and outflows are matched with each
other. Greater emphasis is laid on liquidity and greater importance is attached to current ratio,
liquidity ratio, etc; which pertain to the liquidity of a business.
2. Operating Cycle Method:
In order to understand what gives rise to differences for timing of cash flows, we should
first know the length of time, which is required to convert cash into resources, resources into the
final product, the final product into receivables and receivables back into cash. We should know,
in other words, the operating cycle of an enterprise.
There are four major components of the operating cycle of a manufacturing company.
These are:
The cycle starts with free capital in the form of cash and credit, followed by investment
in materials, man power and other services:
Production phase
Storage of the finished products terminating at the time-finished product is old:
8/2/2019 vijay B.C
http://slidepdf.com/reader/full/vijay-bc 15/52
Working Capital Management
P a g e | 15
Cash or accounts receivable collection period, which results in and ends at the point of,
dis-investment of the free capital originally committed.
ADEQUACY OF WORKING CAPITAL:
Working capital should be adequate for the following reasons:
It protects a business from the adverse effects of shrinkage in the values of current assets.
It is possible to pay all the current obligations promptly and to take advantage of cash
discounts.
It ensures to a greater extent the maintenance of a company‘s credit standing andprovides for such emergencies as strikes, floods, fire etc.
It permits the carrying of inventories at a level that would enable a business to serve
satisfactorily the needs of its customers.
It enables a company to operate its business more efficiently because there is no delay in
obtaining materials etc; because of credit difficulties.
INADEQUACY OF WORKING CAPITAL:
When working capital is inadequate, a company faces following problems:
It stagnates the growth and it becomes difficult for the firm to undertake profitable
projects for non-availability of working capital funds.
Difficulty in implementing operating plans and achieving the firm‘s profit targets.
Operating inefficient creep in when it becomes difficult even to meet day-to-day
commitments.
Fixed assets are not utilized efficiently thus the firm‘s profitability would deteriorate.
Paucity of working capital funds renders the firm unable to avail attractive credit
opportunities.
The firm loses its reputation when it is not in a position to honor its short term obligations
thereby leading to tight credit terms.
8/2/2019 vijay B.C
http://slidepdf.com/reader/full/vijay-bc 16/52
Working Capital Management
P a g e | 16
DISADVANTAGES OF WORKING CAPITAL:
Too much working capital is as dangerous as too little of it. Excessive working capital raises the
following problems:
Results in unnecessary accumulation of inventories. Thus chances of inventory
mishandling, waste, theft and losses increase.
Indication of deflective credit policy and slack collection period. Consequently, it results
in higher incidence of bad debts, adversely affecting profits,
Makes the management complacent which degenerates in to managerial inefficiency.
The tendencies of accumulating inventories to make speculative profit, which tends to
liberalize the dividend policy, make it difficult for the concern to cope in the future when
it is not able to make speculative
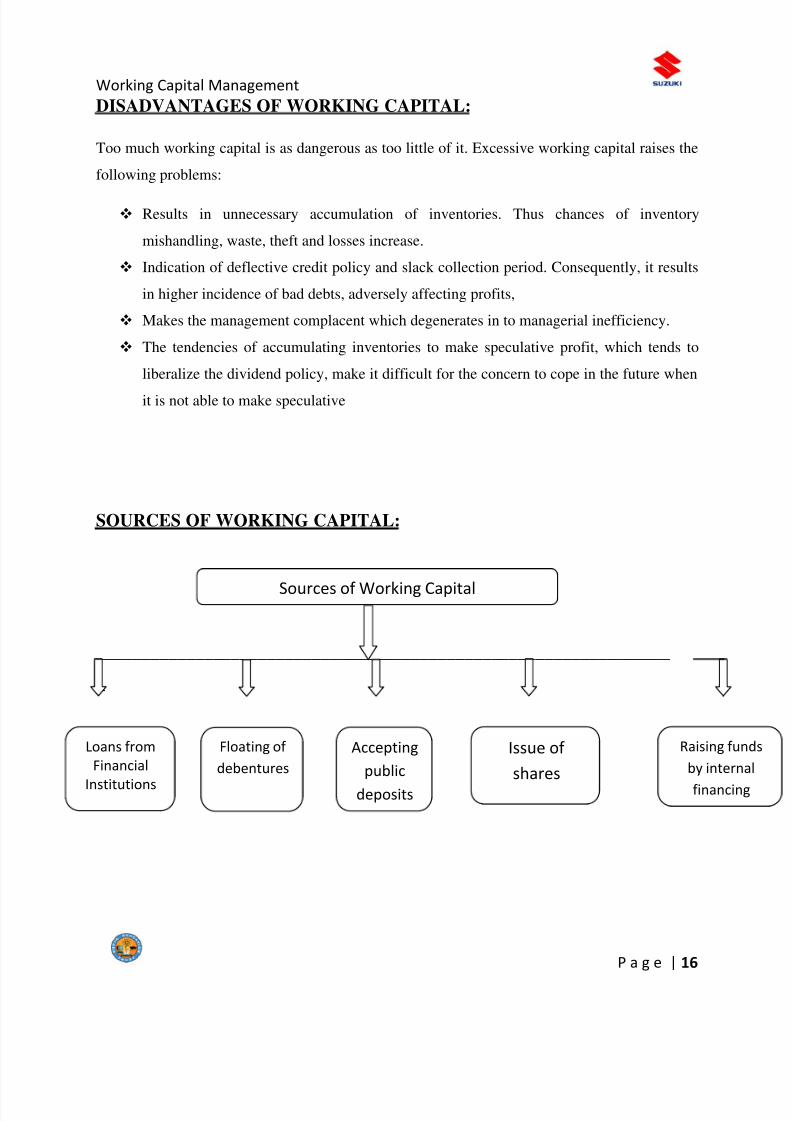
SOURCES OF WORKING CAPITAL:
________________________________________________________________
_
Sources of Working Capital
Loans from
Financial
Institutions
Floating of
debentures
Accepting
public
deposits
Issue of
shares
Raising fu
by intern
financin
8/2/2019 vijay B.C
http://slidepdf.com/reader/full/vijay-bc 17/52
Working Capital Management
P a g e | 17
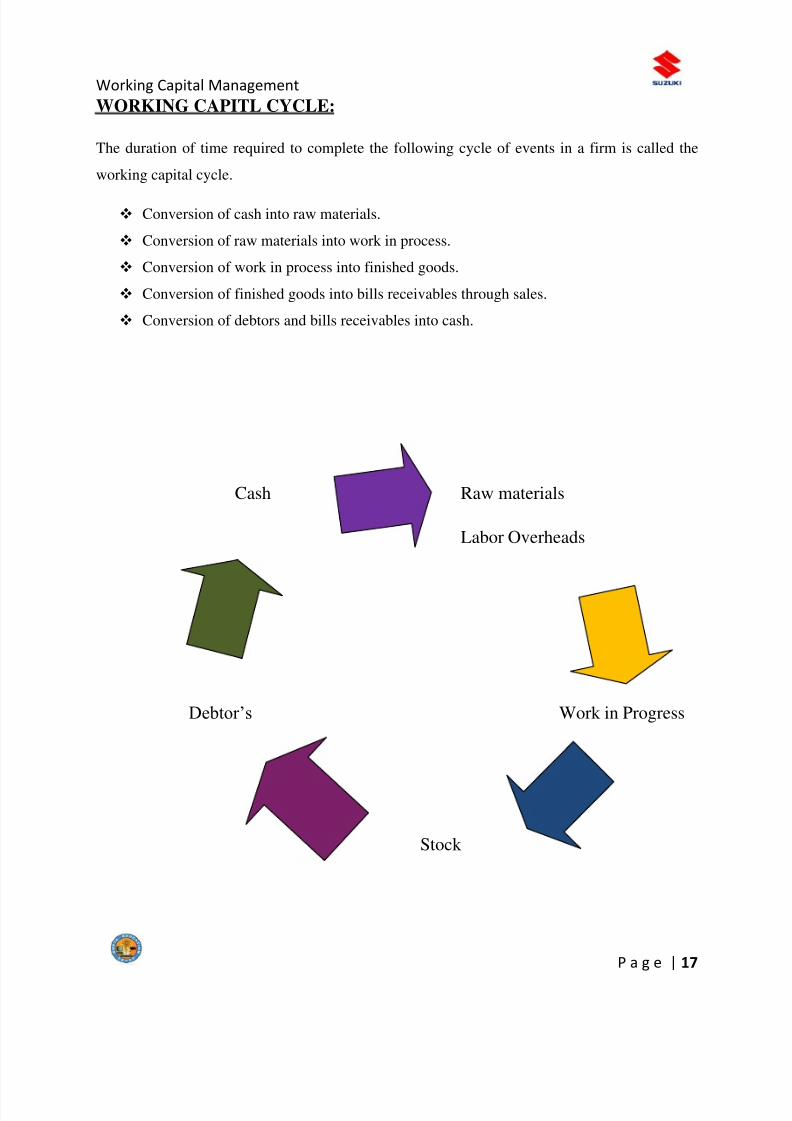
WORKING CAPITL CYCLE:
The duration of time required to complete the following cycle of events in a firm is called the
working capital cycle.
Conversion of cash into raw materials.
Conversion of raw materials into work in process.
Conversion of work in process into finished goods.
Conversion of finished goods into bills receivables through sales.
Conversion of debtors and bills receivables into cash.
Cash Raw materials
Labor Overheads
Debtor‘s Work in Progress
Stock
8/2/2019 vijay B.C
http://slidepdf.com/reader/full/vijay-bc 18/52
Working Capital Management
P a g e | 18
BANKS AS A SOURCE OF PROVIDING WORKING CAPITAL:
Banks are the main institutional sources of working capital finance in India after trade
credit.
Bank limits are based on the sales and production volumes and the current asset level.
Banks fix a MPBF in each case that may be different for peak level and normal non-peak
level.
Tandon Committee:
This committee has recommended the following methods of ascertain the permissible limit of
bank finance:
First method of lending-
Borrower‘s contribution-25% of the W.C.Gap
Bank borrowings -75% of the W.C.Gap
Second method of lending-
Borrower‘s contribution-25% of total current assets
Bank borrowings-balance of the W.C.Gap
Third method of lending-
Borrower‘s contribution-100% of core current assets and
25% of balance current assets.
Bank borrowings-balance of the W.C.Gap
8/2/2019 vijay B.C
http://slidepdf.com/reader/full/vijay-bc 19/52
Working Capital Management
P a g e | 19
Naik Committee:
According to this every SSI unit has to have a minimum of 205 limits from the bank
applicable up to a turnover of Rs 20 crores and a limit of Rs 4 crores.
WORKING CAPITAL FINANCING MIX
There are four basic approaches for determining the appropriate working capital financing
mix:
The conservative approach:-
Under this policy the firm holds relatively large proportion of total assets in the form of
current assets. This policy lowers expected profitability, assuming that current liabilities remain
constant. This policy also increases the firm‘s net working capital position resulting in a lower
risk, that the firm will encounter financial problems.
The Aggressive approach:
Under this policy, a firm holds relatively small proposition of its total assets in the form
of current assets and thus has relatively less net working capital consequently this policy yields
higher expected profit and higher risk.
The Moderate approach:
Under this policy, expected profitably and risk will fall between those by conservative
approach and aggressive approach.
8/2/2019 vijay B.C
http://slidepdf.com/reader/full/vijay-bc 20/52
Working Capital Management
P a g e | 20
The Hedging approach:
A firm can also follow a ‗Hedging Approach‘ or ‗Matching Approach‘ to meet its
working capital requirements. Under this approach maturity structure of firm‘s liability is made
to correspond exactly to life of assets. By attempting transactions of a simultaneous but opposite
nature, effort is made so that effect of due transaction counter balances the effect of the other
transaction. Under this approach, permanent current assets are financed with long-term debt and
equity, while fluctuating current assets are financed with short-term debts. Uncertainty
associated with the lives of individual assets makes hedging approach a difficult alternative to
implement.
It must be kept in view in choosing working capital investment policy, that no one combination
of short term and long term debt is necessarily optimal for all firms. Variability of sales and cash
flows should be considered as a primary factor in choosing a working capital investment policy.
RECOMMENDATIONS OF DEHEJA COMMITTEE
The Dehejia committee formally highlighted the deficiencies of the existing system of
bank lending based on cash credit system in 1968. The committee concluded that the diversion of
bank finance for the acquisition of the fixed and other non- current assets was made possible by
the banker‘s fixation of security under the cash credit lending system. The committee felt that,
while theoretically commercial banks lending was for short-term purpose, in actual practice, it
was not so. According to their report, a large part of bank lending was long-term in their
character, and was repayable on demand only in name.
The major weaknesses in the existing system of working capital finance as pointed out by
the Dehejia committee are listed below:
It is the borrower who decides how much he would borrow, the banker does not decide how
much he could lend and is, therefore, not in a position, to do credit planning.
8/2/2019 vijay B.C
http://slidepdf.com/reader/full/vijay-bc 21/52
Working Capital Management
P a g e | 21
The bank credit is treated as a first source of finance and not as a supplementary to the
other source of finance. The amount of credit extended is based on the amount of security
available, not on the levels of operations of the borrower. Security by itself does not ensure
safety to bank funds since all bad and sticky advances are secured advances; safety essentially
lies in the efficient follow-up of the borrower.
Although the monetary authorities were aware of this faulty system of bank lending, yet
it was in 1973, when demand for bank credit rose sharply in spite of stagnant production and
when a number of a banks had to freeze credit limits abruptly, owing to a serious unprecedented
price rise in 1974, the Reserve Bank of India constituted the ‗Tendon committee‘ to frame
guidelines for follow-up of bank credit.
Dehejia committee recommended that the total credit requirement of the borrower should be
segregated into hard-core and short term component. The hard-core component should represent
the minimum level of inventories that the industry was required to hold for maintaining a given
level of production. It should be put on a formal term loan basis subject to repayment schedule.
This committee was also of the opinion that generally a customer should be required to confine
his dealings to one bank only.
MANAGEMENT OF WORKING CAPITAL COMPONENTS:
Management of Cash
Management of Receivables
Management of Inventories
Management of Cash:
Cash Budget: A cash budget is a summary statement of the firm‘s expected cash inflows and
outflows over a projected time.
Managing the Cash Flows:
Accelerating cash collections.
Decentralized collections.
Lock-box system.
8/2/2019 vijay B.C
http://slidepdf.com/reader/full/vijay-bc 22/52
Working Capital Management
P a g e | 22
Management of Receivables/Books debts:
The investment in accounts receivables depends on volume of credit sales and collectionperiod. The same may be influenced through credit policy, it includes:
Collection terms
Credit terms
Credit standards.
Methods of monitoring book debts:
Average Collection period: The average number of days for which debtors remain
outstanding is called the Average Collection Period (ACP) and is computed as follows
ACP = Debtors*360/credit sales.
Aging Schedule: It breaks down receivables according to the length of time for which
they have been outstanding.
Collection Experience Matrix: The disaggregated data is used for analyzing collection
experience. The key is to relate receivables to sales of the same period.
When sales over a period are shown horizontally and associated receivables vertically in a
tabular form, a matrix is constructed known as collection experience matrix.
Management of Inventory:
The literary meaning of the word inventory is stock of goods. To the finance manager,
inventory connotes the value of raw materials consumables, spares, work-in-progress, finished
goods and scrap in which a company‘s funds have been invested.
8/2/2019 vijay B.C
http://slidepdf.com/reader/full/vijay-bc 23/52
Working Capital Management
P a g e | 23
Inventory Includes:
Raw Materials + Work – in-progress + Finished Goods.
Management of inventory involves two conflicting needs:
Maintaining a large size of inventory for efficient and smooth production and sales
operations.
Maintaining a minimum investment for efficient and smooth production and sales.
Determining and holding the optimum size of inventory forms the important feature of
inventory management.
Inventory Management Techniques:
How much should be ordered?
o Determining EOQ
When should it be ordered?
o Determining the RE-ORDER POINT
EOQ:
The economic order quantity is that inventory level which minimizes the total of ordering and
carrying costs.
The Ordering cost is the additional cost of placing and ordering the cost, which is considered
independent of the size of the order.
The Carrying cost, on the other hand is the cost of the physical storage of the inventory and the
particular cost of the money tied up in that inventory.
8/2/2019 vijay B.C
http://slidepdf.com/reader/full/vijay-bc 24/52
Working Capital Management
P a g e | 24
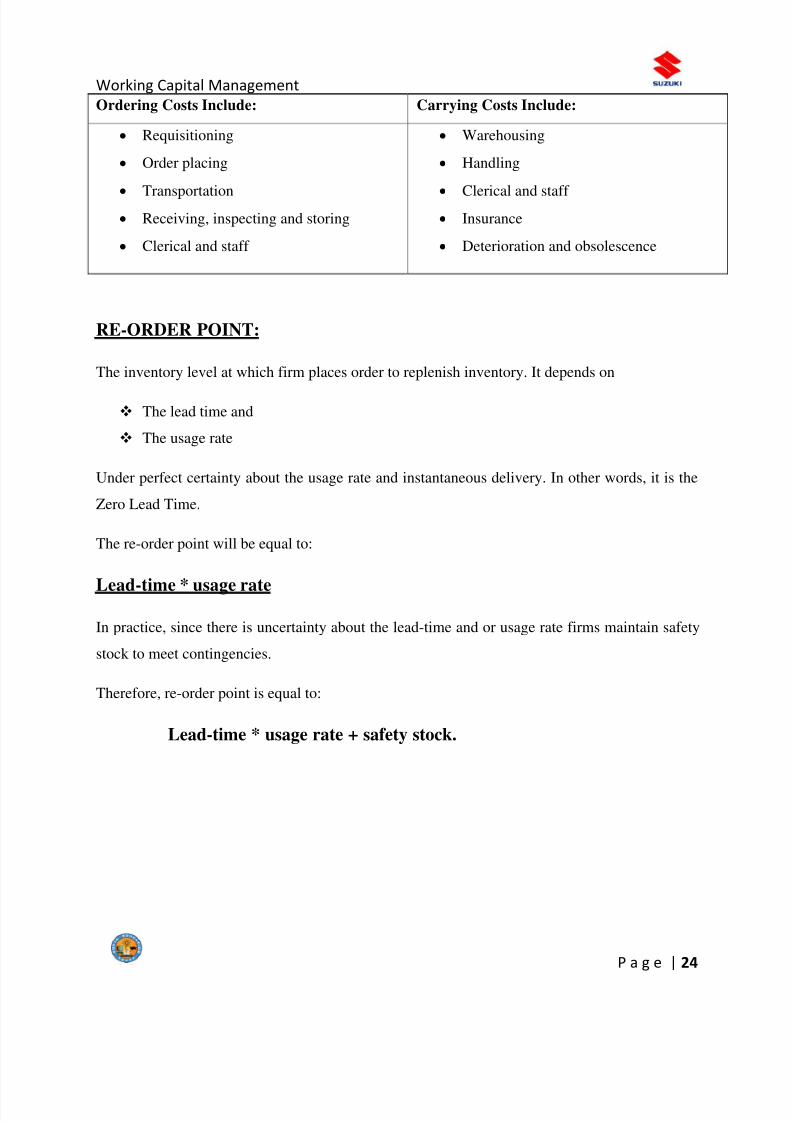
Ordering Costs Include: Carrying Costs Include:
Requisitioning
Order placing
Transportation
Receiving, inspecting and storing
Clerical and staff
Warehousing
Handling
Clerical and staff
Insurance
Deterioration and obsolescence
RE-ORDER POINT:
The inventory level at which firm places order to replenish inventory. It depends on
The lead time and
The usage rate
Under perfect certainty about the usage rate and instantaneous delivery. In other words, it is the
Zero Lead Time.
The re-order point will be equal to:
Lead-time * usage rate
In practice, since there is uncertainty about the lead-time and or usage rate firms maintain safety
stock to meet contingencies.
Therefore, re-order point is equal to:
Lead-time * usage rate + safety stock.
8/2/2019 vijay B.C
http://slidepdf.com/reader/full/vijay-bc 25/52
Working Capital Management
P a g e | 25
Research Design
INTRODUCTION:
The management of working capital management in today‘s contact is a challenging task.
It is an integral part of overall corporate management. A firm‘s profitability is determined by
how its working capital is managed. In relationship with current day-to-day operations, the
inadequacy and mismanagement of working capital are leading causes of business failure.
Working capital management has been looked upon as a driving tool to a finance manager.
STATEMENT OF THE PROBLEM:
Working capital is a very important resource for a manufacturing enterprise. While the
fixed assets provide infrastructure the current assets is used for the operations. The operating
profits arise out of the effective utilization of both resources but the optimization of profit largely
depends on the effective use of working capital.
The importance of the use of working capital is recognized throughout the world.
Manager dealing with cash, inventories, marketable securities, creditors and banks recognize the
optimization of each of these ingredients of working capital is the key to success in terms of
8/2/2019 vijay B.C
http://slidepdf.com/reader/full/vijay-bc 26/52
Working Capital Management
P a g e | 26
improved bottom line. An efficiency of organization can be measured in terms of the success of
working capital management
A study of working capital of any enterprise would therefore be welcome by both
enterprise and analyst. Researchers have developed many tools for evaluating the efficient
management of working capital. It is therefore proposed to study this interesting area with
special reference to SUZUKI LTD.
OBJECTIVES OF THE STUDY:
To study the working capital management per se.
To analyze the working capital management practices in SUZUKI LTD.
To study the impact of working capital on production, price and fund flow with reference
to SUZUKI LTD.
To give suggestions based on the finding of the study.
SCOPE OF THE STUDY:
The scope of the study encompasses management philosophy, strategy, policy of the
selected unit towards working capital. It also includes the management of receivables,
inventories and cash with the emphasis on the stock turnover and the like. Further, the last four
years working capital performance of the selected unit is studied.
METHODOLOGY OF RESEARCH PROJECT:
8/2/2019 vijay B.C
http://slidepdf.com/reader/full/vijay-bc 27/52
Working Capital Management
P a g e | 27
The project was compiled using available facts, figures, information and analysis by the
researcher leading to an analytical research. The information collected by its nature are of two
types which were the tools Viz.., primary & secondary source.
DATA COLLECTION:
Tools for data collection and analysis:
The unstructured questionnaire has designed and administered to illicit the primary data
from the finance manager. The data so collected is analyzed by using ratios for calculating and
comparison is done with the data of lost four financial years. The comparison reflects the
performance of the company in the last four years.
Sources of data collection:
Primary Data: A primary data is gathered through personal interview (interaction)
with key personal by framing unstructured questionnaire.
Secondary Data: Secondary data is obtained from internal sources like:
Published annual reports.
Website of SUZUKI LTD.
LIMITATIONS OF THE STUDY:
The findings of the study are based on the information retrieved by the select unit.
Time constraint factor of the official, which restricted the scope of study.
The information is availed from the statements, annual reports and records of the
company.
8/2/2019 vijay B.C
http://slidepdf.com/reader/full/vijay-bc 28/52
Working Capital Management
P a g e | 28
OPERATIONAL DEFINITIONS OF CERTAIN CONCEPTS:
Net working capital: Net Working Capital (NWC) is defined as the difference between
current assets and current liabilities.
Gross working capital: Gross Working Capital refer to the firm‘s investment in current
assets viz, cash, marketable securities, inventories of raw material, work-in-progress, finished
goods and receivables.
Current assets: Current Assets are defined as those assets which in the ordinary course of
business can be or will be converted into cash within one year without undergoing a diminutionin value or disrupting the operations of the firm.
Current liabilities: Current Liabilities which are intended at their inception to be paid in the
ordinary course f business, within a year out of the current assets or earnings of the concern. The
basic current liabilities are accounts payable, bills payable, bank overdraft and outstanding
expenses.
Working capital: It is the amount of funds, which is required to carry out day to dayoperations often enterprise. It is the portion f enterprise‘s total capital, which is employed in its
short-term operations.
Working capital turnover ratio: Working Capital Turnover Ratio is obtained by dividing
amount of net sales by an average amount of net working capital during the year.
Current asset turnover ratio: Current Asset Turnover Ratio is obtained by dividing cost
of goods sold by average current asset.
Inventory turnover ratio: Inventory Turnover Ratio is obtained by dividing cost of goods
sold by average inventory.
8/2/2019 vijay B.C
http://slidepdf.com/reader/full/vijay-bc 29/52
Working Capital Management
P a g e | 29
Receivables turnover ratio: Receivables Turnover Ratio is obtained by dividing total sales
by average receivables. Receivable includes sundry debtors, bills receivables and accounts and
claims receivable.
COMPANY PROFILE
Suzuki Motor Corporation is a Japanese multinational corporation headquartered in
Hamamatsu, Japan that specializes in manufacturing compact automobiles and 4x4 vehicles, a
8/2/2019 vijay B.C
http://slidepdf.com/reader/full/vijay-bc 30/52
Working Capital Management
P a g e | 30
full range of motorcycles, all-terrain vehicles (ATVs), outboard marine engines, wheelchairs and
a variety of other small internal combustion engines. Suzuki is Japan's 4th largest automobile
manufacturer after Toyota, Nissan and Honda, the 9th largest automobile manufacturer in the
world by production volume, employs over 45,000, has 35 main production facilities in 23
countries and 133 distributors in 192 countries According to statistics from the Japan
Automobile Manufacturers Association (JAMA), Suzuki is Japan's second-largest manufacturer
of small cars and trucks.
In 1909, Michio Suzuki (1887 – 1982) founded the Suzuki Loom Works in the small seacoast
village of Hamamatsu, Japan. Business boomed as Suzuki built weaving looms for Japan's giant
silk industry. In 1929, Michio Suzuki invented a new type of weaving machine, which was
exported overseas. Suzuki filed as many as 120 patents and utility model rights The Company‘sfirst 30 years focused on the development and production of these exceptionally complex
machines.
Despite the success of his looms, Suzuki realized his company had to diversify and he began to
look at other products. Based on consumer demand, he decided that building a small car would
be the most practical new venture. The project began in 1937, and within two years Suzuki had
completed several compact prototype cars.
These first Suzuki motor vehicles were powered by a then innovative, liquid-cooled, four-stroke,
four-cylinder engine. It featured a cast aluminum crankcase and gearbox and generated 13
horsepower (9.7 kW) from a displacement of less than 800cc.
With the onset of World War II, production plans for Suzuki's new vehicles were halted
when the government declared civilian passenger cars a "non-essential commodity." At the
conclusion of the war, Suzuki went back to producing looms. Loom production was given a
boost when the U.S. government approved the shipping of cotton to Japan. Suzuki's fortunes
brightened as orders began to increase from domestic textile manufacturers. But the joy was
short-lived as the cotton market collapsed in 1951.
8/2/2019 vijay B.C
http://slidepdf.com/reader/full/vijay-bc 31/52
Working Capital Management
P a g e | 31
Faced with this colossal challenge, Suzuki's thoughts went back to motor vehicles. After
the war, the Japanese had a great need for affordable, reliable personal transportation. A number
of firms began offering "clip-on" gas-powered engines that could be attached to the typical
bicycle. Suzuki's first two-wheel ingenuity came in the form of a motorized bicycle called, the
"Power Free." Designed to be inexpensive and simple to build and maintain, the 1952 Power
Free featured a 36 cc, one horsepower, two-stroke engine. The system was so ingenious that the
patent office of the new democratic government granted Suzuki a financial subsidy to continue
research in motorcycle engineering, and so was born Suzuki Motor Corporation.
By 1954, Suzuki was producing 6,000 motorcycles per month and had officially changed its
name to Suzuki Motor Co., Ltd. Following the success of its first motorcycles, Suzuki created an
even more successful automobile: the 1955 Suzuki Suzulight. Suzuki showcased its penchant forinnovation from the beginning. The Suzulight included front-wheel drive, four-wheel
independent suspension and rack-and-pinion steering — features not common on cars.
Historical timeline
1909: Suzuki Loom Works founded in Hamamatsu, Shizuoka Prefecture, by Mr. Michio
Suzuki.
1920: Reorganized, incorporated, and capitalized at 500,000 yen as Suzuki Loom
Manufacturing Co. with Michio Suzuki as president.
1952: "Power Free" motorized bicycle marketed.
8/2/2019 vijay B.C
http://slidepdf.com/reader/full/vijay-bc 32/52
Working Capital Management
P a g e | 32
1954: Company name changed to Suzuki Motor Co., Ltd.
1955: Lightweight car Suzuki Suzulight (360 cc, 2-stroke) front wheel drive, marketed
helping to usher in Japan's light-weight car age.
1961: Suzuki Loom Manufacturing Co. established by separating the loom machine
division from the motor works and lightweight truck "Suzulight Carry" marketed.
1962: Suzuki won the 50 cc class championship at the Isle of Man TT
1963: U.S. Suzuki Motor Corp., a direct sales subsidiary, opened in Los Angeles.
1965: "D55" (5.5 hp, 2-stroke) outboard motor marketed and makes early inroads
and Fronte 800 marketed.
1967: Thai Suzuki Motor Co., Ltd. established as a local assembly plant.
1968: Carry full-cab van marketed.
1970: T500 (TT Isle of Man) Frank White way
1970: LJ-Series (Jimny) 4×4 marketed.
1971: Ts185 Enduro marketed.
1971: GT750 motorcycle marketed.
1973: Suzuki Canada Ltd., opened in Ontario, Canada.
1974: P.T. Suzuki Indonesia Manufacturing established in Jakarta, Indonesia, entry into
medical equipment field by marketing the Suzuki Motor Chair Z600
motorized wheelchair, expansion into the housing field initiated with Suzuki Home
marketing two models of prefab "Mini-House" and three types of storage sheds.
1975: Antonio Suzuki Corp., a joint venture for knockdown production and sales,
established in Manila, the Philippines.
1976: GS-Series motorcycles marketed.
1977: LJ80 4×4 vehicle marketed and exports of GS1000H motorcycle began.
1979: Alto marketed.
1979: SC100 marketed in the UK.
1980: Suzuki Australia Pty. Ltd. established in Sydney, Australia and entry into general
purpose engine field by marketing three electric power generator models.
1981: Business ties with General Motors (U.S.) and Isuzu Motors, Ltd.(Japan) signed.
8/2/2019 vijay B.C
http://slidepdf.com/reader/full/vijay-bc 33/52
Working Capital Management
P a g e | 33
1982: 4×4 productions began at PAK Suzuki Motor Co., Ltd. in Karachi, Pakistan and
won maker championship for 7th consecutive year at the World Road Race Grand Prix
500.
1982: SC100 Discontinued in favour of Alto.
1983: Enters into a partnership with Maruti Udyog Ltd. to produce cars in India.
1983: Cultus /Swift 1.0-liter passenger car marketed and 4×4 production started at Maruti
Udyog Ltd. in Gurgaon, Haryana, India.
1984: Suzuki New Zealand Ltd. established in Wanganui, New Zealand and began export
of Chevrolet Sprint to the United States. Car production technical assistance contract
signed with China National Aerotechnology Import & Export Beijing Corporation.
Operation of Suzuki Motor GmbH Deutschland began in Heppenheim, Germany.
1985: SUZUKI of AMERICA AUTOMOTIVE CORP. established with the introduction
of the Samurai, and the GSX-R750 motorcycle with an oil-cooled engine marketed
and scooter production started at Avello S.A. of Spain. Agreement with Santana
Motors to produce Suzuki cars in their Linares factory in Andalusia, Spain.
1986: American Suzuki Motor Corp. is formed merging U.S. Suzuki Motor Corp and
Suzuki of America Automotive Corp.
1987: Cultus /Swift production began in Colombia and total aggregate car exports reached
2 million units.
1988: Escudo /Vitara 4×4 marketed and total aggregate car production reached 10 million
units..
1989: CAMI Automotive Inc. established and began operation in Ontario, Canada. Swift
GT/GLX and Sidekick sales begin in the United States.
1990: Corporate name changed to Suzuki Motor Corporation.
1991: Car production started in Korea through technical ties with Daewoo Shipbuilding
& Heavy Machinery Ltd and Cappuccino 2-seater marketed.
1993: Passenger car production/sales began at Suzuki Egypt S.A.E., opening ceremony
for new car production plant held at Magyar Suzuki Corp. in Esztergom, Hungary
and Wagon R passenger car marketed.
1994: Maruti Udyog Ltd. of India total aggregate car production reached 1 million units.
8/2/2019 vijay B.C
http://slidepdf.com/reader/full/vijay-bc 34/52
Working Capital Management
P a g e | 34
1995: Total aggregate motorcycle export reached 20 million units
1996: Start of production in Vietnam (Motorcycles and automobiles)
1997: Achieved 10 million cumulative automobile sales for overseas market and 4-
stroke outboard motors win the Innovation Award at The International Marine Trade
Exhibit and Conference (IMTEC) in Chicago.
1998: Suzuki and General Motors form strategic alliance and Chongqing Chang'an
Suzuki Automobile Co., Ltd. received official approval from the Chinese government for
production of passenger cars.
1999: Aggregate motorcycle production reaches 40 million units
and Jiangxi Changhe Suzuki Automobile Co., Ltd. receives official approval from the
Chinese government for production of commercial vehicles.
2000: The Company commemorates the 80th anniversary, aggregate car production
at Kosai Plant reaches 10 million units and Suzuki production starts at General Motors de
Argentina S.A.
2001: Aggregate Launch of Suzuki Liana/Aerio. worldwide sales of Jimny/SJ reaches 2
million units, production of Alto reaches 4 million units and Suzuki achieves "Zero-
Level" target of landfill waste
2002: Achieved 30 million cumulative automobile sales for worldwide market and
America's No.1 warranty: 100,000/7-year power train limited warranty.
2003: Suzuki is No.1 in Kei car sales for the 30th consecutive year and Twin, the
first hybrid Kei car in Japan, marketed.
2004: Aggregate domestic automobile sales reach 15 million units.
2005: Swift was awarded the 2006 RJC Car of the Year.
2006: New XL7 is marketed particularly to the North American market; and GM
divested, selling 92.36 million shares and reducing their stake to 3%.
2008: GM divested its remaining 3% stake in Suzuki.
2009: Suzuki introduces its first production pickup truck called the Equator. Volkswagen
AG and Suzuki reach a common understanding to establish a close long-term strategic
partnership.
2010: Volkswagen AG completed the purchase of 19.9% of Suzuki's outstanding shares.
8/2/2019 vijay B.C
http://slidepdf.com/reader/full/vijay-bc 35/52
Working Capital Management
P a g e | 35
2011: On 4 July Suzuki Motor chairman will come to Indonesia to announce Indonesia as
regional production base with investment up to $800 million over the next few years.
2012: In January, the company said it would build a new engine factory as the third
factory in Indonesia to fulfill the fast-growing Southeast Asian market. On a 1.3 million
square-metre site in an industrial park outside Jakarta, Suzuki has spent 10 billion yen
and might be would reach 30 billion yen.
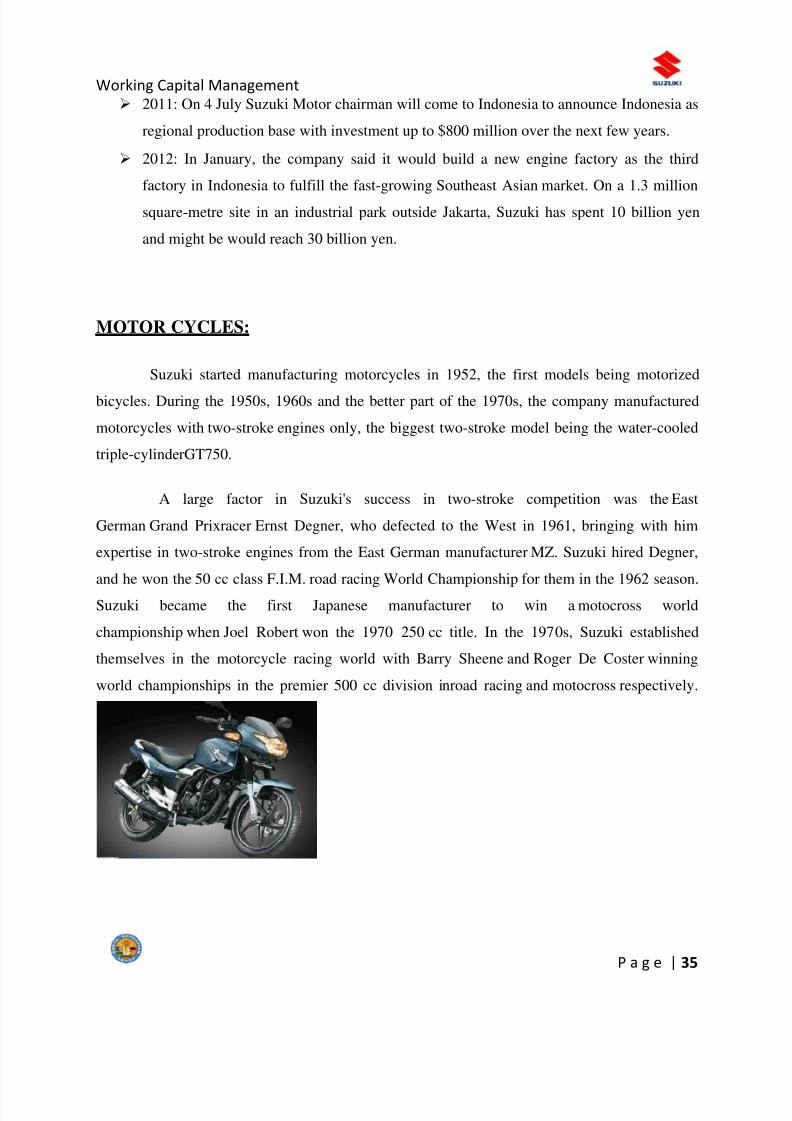
MOTOR CYCLES:
Suzuki started manufacturing motorcycles in 1952, the first models being motorized
bicycles. During the 1950s, 1960s and the better part of the 1970s, the company manufactured
motorcycles with two-stroke engines only, the biggest two-stroke model being the water-cooled
triple-cylinderGT750.
A large factor in Suzuki's success in two-stroke competition was the East
German Grand Prixracer Ernst Degner, who defected to the West in 1961, bringing with him
expertise in two-stroke engines from the East German manufacturer MZ. Suzuki hired Degner,
and he won the 50 cc class F.I.M. road racing World Championship for them in the 1962 season.
Suzuki became the first Japanese manufacturer to win a motocross world
championship when Joel Robert won the 1970 250 cc title. In the 1970s, Suzuki established
themselves in the motorcycle racing world with Barry Sheene and Roger De Coster winning
world championships in the premier 500 cc division inroad racing and motocross respectively.
8/2/2019 vijay B.C
http://slidepdf.com/reader/full/vijay-bc 36/52
Working Capital Management
P a g e | 36
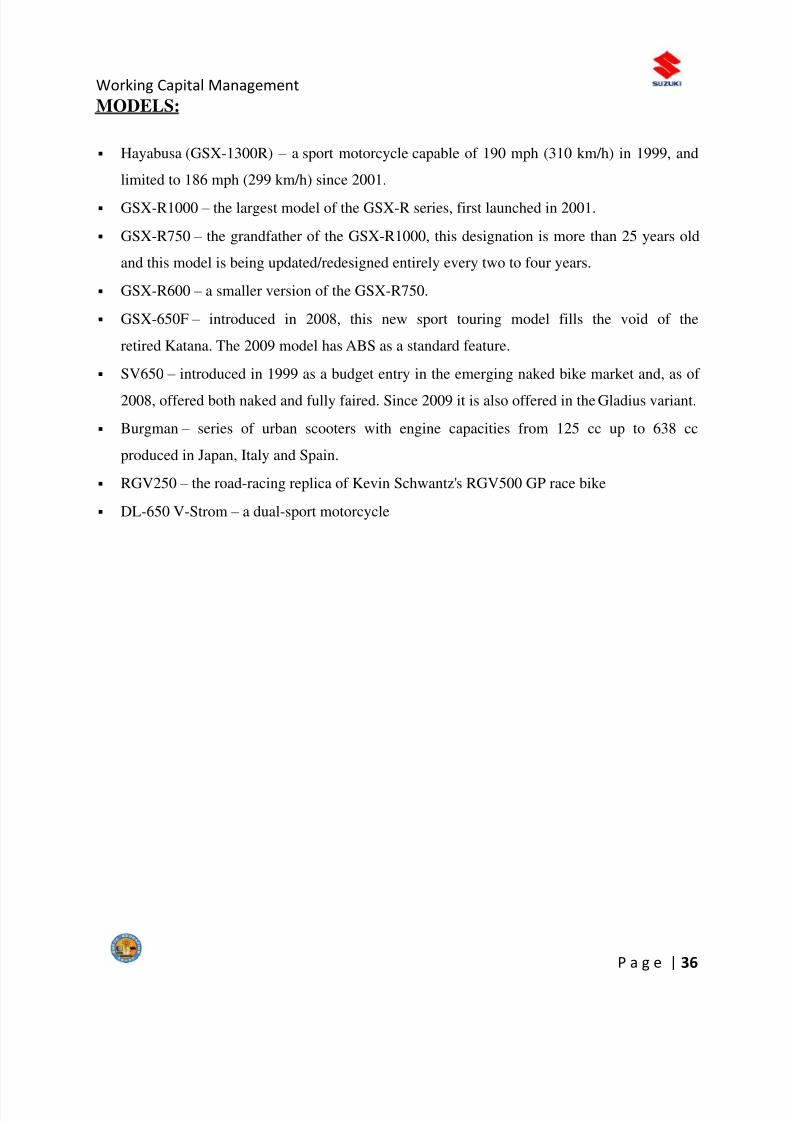
MODELS:
Hayabusa (GSX-1300R) – a sport motorcycle capable of 190 mph (310 km/h) in 1999, and
limited to 186 mph (299 km/h) since 2001.
GSX-R1000 – the largest model of the GSX-R series, first launched in 2001.
GSX-R750 – the grandfather of the GSX-R1000, this designation is more than 25 years old
and this model is being updated/redesigned entirely every two to four years.
GSX-R600 – a smaller version of the GSX-R750.
GSX-650F – introduced in 2008, this new sport touring model fills the void of the
retired Katana. The 2009 model has ABS as a standard feature.
SV650 – introduced in 1999 as a budget entry in the emerging naked bike market and, as of
2008, offered both naked and fully faired. Since 2009 it is also offered in the Gladius variant.
Burgman – series of urban scooters with engine capacities from 125 cc up to 638 cc
produced in Japan, Italy and Spain.
RGV250 – the road-racing replica of Kevin Schwantz's RGV500 GP race bike
DL-650 V-Strom – a dual-sport motorcycle
8/2/2019 vijay B.C
http://slidepdf.com/reader/full/vijay-bc 37/52
Working Capital Management
P a g e | 37
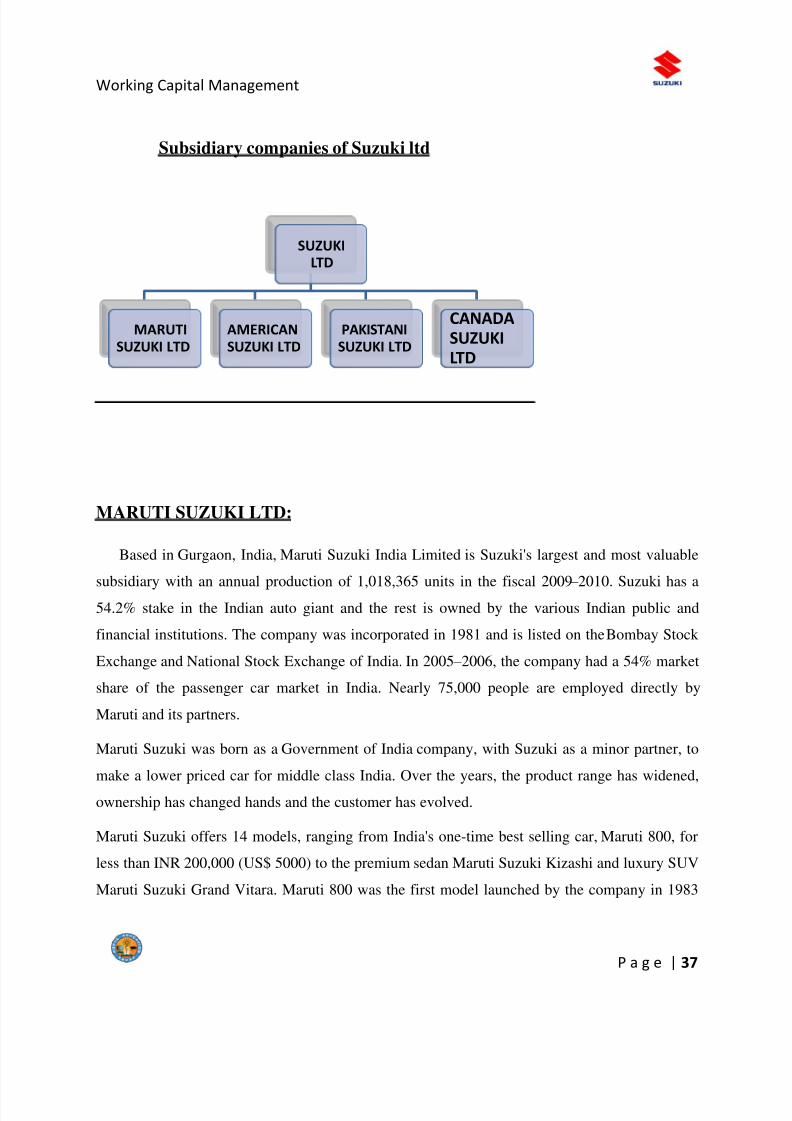
Subsidiary companies of Suzuki ltd
MARUTI SUZUKI LTD:
Based in Gurgaon, India, Maruti Suzuki India Limited is Suzuki's largest and most valuable
subsidiary with an annual production of 1,018,365 units in the fiscal 2009 – 2010. Suzuki has a54.2% stake in the Indian auto giant and the rest is owned by the various Indian public and
financial institutions. The company was incorporated in 1981 and is listed on the Bombay Stock
Exchange and National Stock Exchange of India. In 2005 – 2006, the company had a 54% market
share of the passenger car market in India. Nearly 75,000 people are employed directly by
Maruti and its partners.
Maruti Suzuki was born as a Government of India company, with Suzuki as a minor partner, to
make a lower priced car for middle class India. Over the years, the product range has widened,
ownership has changed hands and the customer has evolved.
Maruti Suzuki offers 14 models, ranging from India's one-time best selling car, Maruti 800, for
less than INR 200,000 (US$ 5000) to the premium sedan Maruti Suzuki Kizashi and luxury SUV
Maruti Suzuki Grand Vitara. Maruti 800 was the first model launched by the company in 1983
SUZUKI
LTD
MARUTI
SUZUKI LTD
AMERICAN
SUZUKI LTD
PAKISTANI
SUZUKI LTD
CANADA
SUZUKI
LTD
8/2/2019 vijay B.C
http://slidepdf.com/reader/full/vijay-bc 38/52
Working Capital Management
P a g e | 38
followed by mini-van Maruti Omni in 1984. Both models were huge success in their respective
categories because of the use of high-end technology and good fuel efficiency. Maruti Gypsy,
launched in 1985, came into widespread use with the Indian Army and Indian Police
Service becoming its primary customers. The short-lived Maruti 1000 too achieved moderate
success until it was replaced by Maruti Esteem in 1994, to counter increasing competition in the
medium-sedan category.
Maruti Zen, launched in 1993, was the company's second compact car model and also became
extremely popular in India because of its high performance. The company went on to launch
another compact car Maruti Wagon-R followed by Maruti Baleno in 1999. However, with
increasing competition from Tata, Hyundai, Honda and Daewoo Motors, Maruti was not able to
achieve the same success with Baleno as it had with its earlier models. So it replaced Maruti
Suzuki Baleno with the Suzuki SX4. Currently Suzuki SX4 is facing stiff competition from
the Honda City.
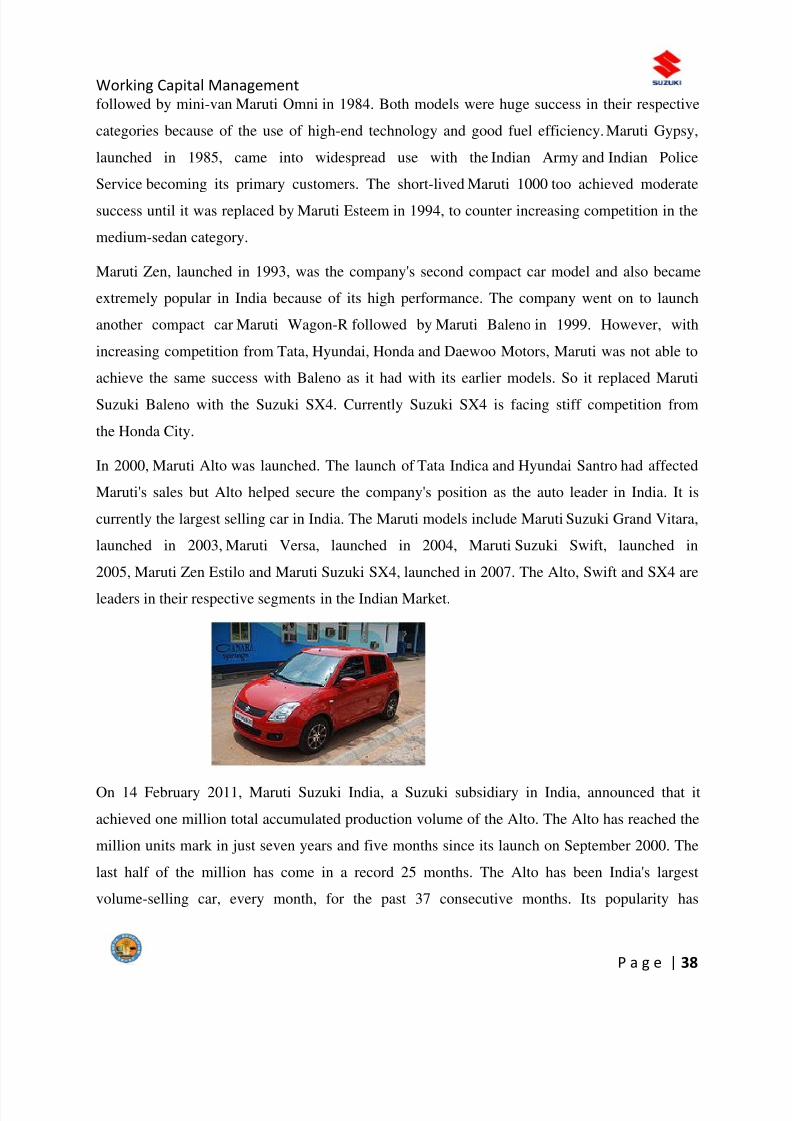
In 2000, Maruti Alto was launched. The launch of Tata Indica and Hyundai Santro had affected
Maruti's sales but Alto helped secure the company's position as the auto leader in India. It is
currently the largest selling car in India. The Maruti models include Maruti Suzuki Grand Vitara,
launched in 2003, Maruti Versa, launched in 2004, Maruti Suzuki Swift, launched in
2005, Maruti Zen Estilo and Maruti Suzuki SX4, launched in 2007. The Alto, Swift and SX4 are
leaders in their respective segments in the Indian Market.
On 14 February 2011, Maruti Suzuki India, a Suzuki subsidiary in India, announced that it
achieved one million total accumulated production volume of the Alto. The Alto has reached the
million units mark in just seven years and five months since its launch on September 2000. The
last half of the million has come in a record 25 months. The Alto has been India's largest
volume-selling car, every month, for the past 37 consecutive months. Its popularity has
8/2/2019 vijay B.C
http://slidepdf.com/reader/full/vijay-bc 39/52
Working Capital Management
P a g e | 39
continued to grow since its launch, with customers attracted to its low price with fuel efficiency.
With this the Alto became the third car in the Maruti Suzuki stable to cross the million units
mark. Previously, the Maruti 800 and the Omni had exceeded the million units mark. Besides its
success in India, over 152,000 Altos made at Maruti Suzuki were delivered internationally,
enjoying good outcomes in Algeria and Chile.
Maruti Exports Limited is the subsidiary of Maruti Udyog Limited with its major focus on
exports and it does not operate in the domestic Indian market. The first commercial consignment
of 480 cars was sent to Hungary. By sending a consignment of 571 cars to the same country,
Maruti crossed the benchmark of 3,000,000 cars. Since its inception export was one of the
aspects the government has been keen to encourage. Every political party expected Maruti to
earn foreign exchange. But compared to Hyundai Maruti Suzuki is poor on export front.
Other subsidiary companies of the Suzuki Motor Corporation, Japan in India are:
SUZUKI POWERTRAIN INDIA LIMITED: Manufacturers engines for cars
SUZUKI MOTORCYCLE INDIA PRIVATE LIMITED: Manufactures two wheelers under
brand name 'Suzuki'. Its two wheeler models launched in India are 'GS 150R, Intruder,
Hayabusa 1300 cc, 125 cc Access, 125 cc Motorcycle Zeus.
Sales and service network:
As of 31 March 2011 Maruti Suzuki has 933 dealerships across 666 towns and cities in all
states and union territories of India. It has 2,946 service stations (inclusive of dealer workshops
and Maruti Authorised Service Stations) in 1,395 towns and cities throughout India.[18] It has 30
Express Service Stations on 30 National Highways across 1,314 cities in India.
Service is a major revenue generator of the company. Most of the service stations are managed
on franchise basis, where Maruti Suzuki trains the local staff. Other automobile companies have
not been able to match this benchmark set by Maruti Suzuki. The Express Service stations help
many stranded vehicles on the highways by sending across their repair man to the vehicle.
Maruti Insurance:
Launched in 2002 Maruti Suzuki provides vehicle insurance to its customers with the help of the
National Insurance Company, Bajaj Allianz, New India Assurance and Royal Sundaram. The
8/2/2019 vijay B.C
http://slidepdf.com/reader/full/vijay-bc 40/52
Working Capital Management
P a g e | 40
service was set up the company with the inception of two subsidiaries Maruti Insurance
Distributors Services Pvt. Ltd and Maruti Insurance Brokers Pvt. Limited
This service started as a benefit or value addition to customers and was able to ramp up easily.
By December 2005 they were able to sell more than two million insurance policies since itsinception.
Maruti Exports:
Maruti Exports Limited is the subsidiary of Maruti Suzuki with its major focus on exports
and it does not operate in the domestic Indian market. The first commercial consignment of
480 cars were sent to Hungary. By sending a consignment of 571 cars to the same country
Maruti Suzuki crossed the benchmark of 300,000 cars. Since its inception export was one of
the aspects government was keen to encourage. [citation needed ] Every political party expected
Maruti Suzuki to earn foreign currency. Angola, Benin, Djibouti, Ethiopia, Europe, Kenya,
Morocco, Nepal, Sri Lanka, Uganda, Chile, Guatemala, Costa Rica and El Salvador are some
of the markets served by Maruti Exports.
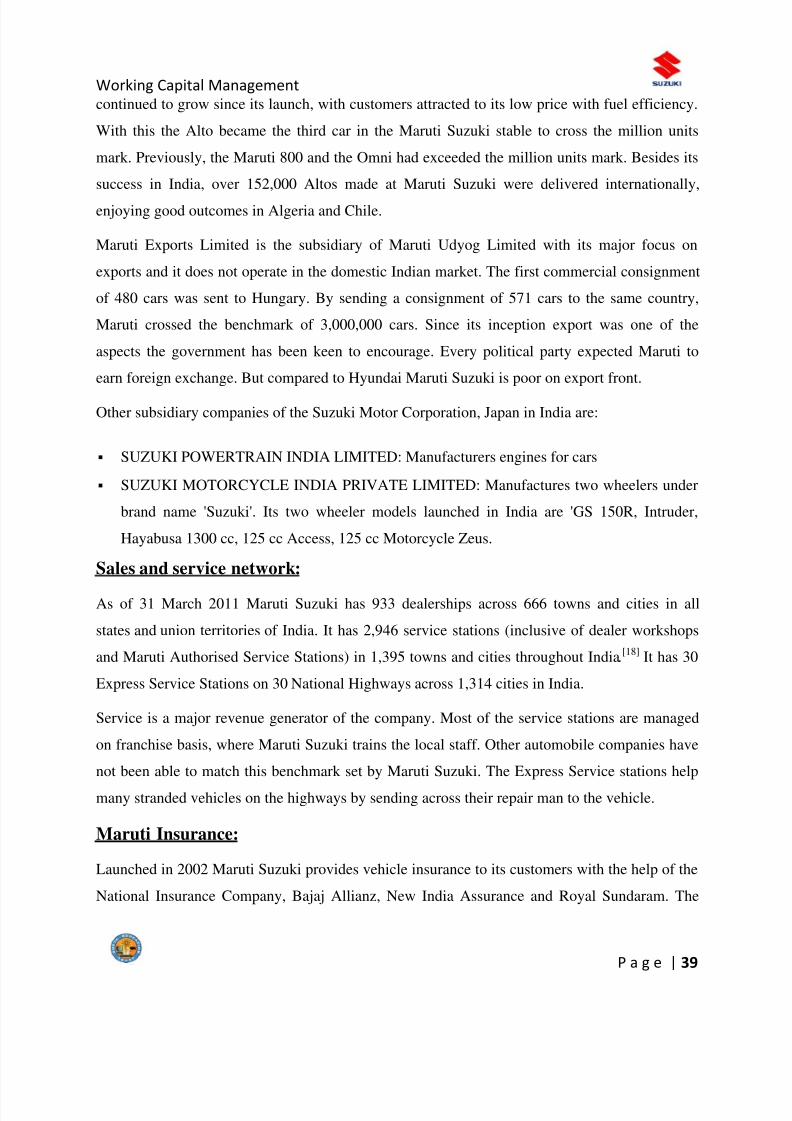
AMERICAN SUZUKI LTD:
American Suzuki headquarters is located in Brea, California. Through an agreement
with General Motors, Suzuki began selling a version of their Suzuki Cultus in the United States
as the Chevrolet Sprint in 1985. This model was initially sold as a 3-door hatchback and would
be Chevrolet‘s smallest model.
SUZUKI XL-7
8/2/2019 vijay B.C
http://slidepdf.com/reader/full/vijay-bc 41/52
Working Capital Management
P a g e | 41
The Samurai was also introduced in 1985 for the 1986 model year and was the first car
introduced to the United States by the newly created American Suzuki Corp. No other Japanese
company sold more cars in the United States in its first year than Suzuki. The Samurai was
available as aconvertible or hardtop and the company slogan was Never a Dull Moment . The
Samurai was successful until Consumer Reports alleged the Samurai of being susceptible to roll
over in a 1988 test. This led to a much publicized 1996 lawsuit, not settled until 2004.
In 1989, American Suzuki introduced the Swift which was the 2nd generation Suzuki Cultus.
The Swift was available as a GTi and GLX hatchback with a 4-door sedan following in 1990. A
new small SUV called the Sidekick was also introduced in 1989. 1991 saw the introduction of
the 4-door Suzuki Sidekick, the first 4-door mini-SUV in North America. The Swift and
Sidekick were cousins to GM's Geo Metro and Geo Tracker and were mostly produced
in Ingersoll, Ontario, Canada by Suzuki and GM's joint venture, CAMI. The Swift GT/GTi and
4-door models were imported from Japan. Negative evaluations from Consumer Reports of the
Suzuki Samurai led to some temporary setbacks at American Suzuki as annual sales in the
following years dropped to below 20,000 units.
In 1995, American Suzuki introduced the Esteem and redesigned the Swift. The Swift GT was
dropped and this version Swift was specific only to North America where it was built at CAMI.
These models were the first Suzuki vehicles to be marketed in North America with dual
front airbags. A station wagon version of the Esteem was introduced in 1996. Worldwide Suzuki
production reached more than 975,000 cars this year.
Also in 1996, American Suzuki released the 2-door SUV X-90 and a revised Sidekick
Sport model with dual airbags, a 120 hp (89 kW) 1.8 liter engine, 16 inch wheels and two-tone
paint. The Sidekick was replaced by the Vitara and the Grand Vitara for 1999. The Grand Vitara
would be Suzuki's first model with a V6-cylinder engine and available 4-wheel ABS brakes.
The Grand Vitara XL-7 was introduced in 2001 as a stretched version of the Grand Vitara. The
Grand Vitara XL-7 had a larger 2.7 liter V6-cylinder engine and 3-row seating. This would be
Suzuki's largest vehicle to date.
8/2/2019 vijay B.C
http://slidepdf.com/reader/full/vijay-bc 42/52
Working Capital Management
P a g e | 42
The Swift was dropped from the model lineup in 2001 and the Esteem was replaced in 2002 by
the new Aerio, which was offered as a 4-door sedan and 5-door crossover with 4-wheel-drive as
an option.
In 2004, General Motors and Suzuki jointly purchased the bankrupt Daewoo Motors renamingthe venture GMDAT. American Suzuki rebadged the compact Daewoo Nubira /Daewoo
Lacetti as Forenza and the mid-size Daewoo Magnus as the Verona. The Forenza gainedstation
wagon and hatchback body style in 2005, with the hatchback sold under the Reno name.
2006 was the first year American Suzuki sold more than 100,000 vehicles in the United States.
Suzuki redesigned the Grand Vitara in 2006 as well as introduced the all-new Suzuki
SX4 and Suzuki XL7 in 2007. The Suzuki SX4 is produced as a joint venture with Fiat and the
XL7 (notice the shortening of the name from Grand Vitara XL-7) was produced as a jointventure with GM at CAMI Automotive Inc. in Ingersoll. Suzuki put XL7 production on
indefinite hiatus in mid-2009 due to low demand and subsequently sold off its share of CAMI
back to GM later that year.
Despite a difficult domestic US automarket, Suzuki has been keeping pace with its 2007 sales
numbers including recording their best May ever in May 2008.
In 2009, Suzuki sales dropped 48.5%, after sales fell 17% in 2008. Suzuki did not import any
2010 model year street motorcycles into the US, with dealers instead relying on unsold stock
from the 2009 model year. New street motorcycle models to the US resumed for the 2011 model
year.
PAKISTANI SUZUKI LTD:
Following the terms of the Joint Venture Agreement between Suzuki Motor Corporation
of Japan (SMC) and Pakistan Automobile Corporation (PACO), Pak Suzuki Motor Company
Limited (PSMCL) was incorporated as a public limited company in August 1983.
The new company assumed the assets including production facilities of Awami Autos Limited.
PSMCL started commercial operations in January 1984 with the primary objective of passenger
cars, pick ups, vans and 4x4 vehicles.
8/2/2019 vijay B.C
http://slidepdf.com/reader/full/vijay-bc 43/52
Working Capital Management
P a g e | 43
The groundbreaking ceremony of the company‘s green field automobile plant at Bin Qasim was
performed by the then Prime Minister of Pakistan in early 1989.
On completion of first phase of this plant in early 1990, in-house assembly Suzuki engines
started. The new plant was completed in 1992, and Suzuki production was transferred to newplant – and three-box 1,300 cc Margalla car was also added to its range of production.
In September 1992 the company was privatized and placed directly under the Japanese
Management. At the time of privatization SMC increased its equity from 25% to 40%
subsequently; SMC progressively increased its equity to 73.09% by 31 December 2001.
The Bin Qasim Plant further expanded its production capacity to 50,000 vehicles per year in July
1994 and 300,000 vehicles had been manufactured at this plant by December 2003.Paksuzuki
currently exports its cars to countries like Bangladesh, Ghana, Nigeria & Maldives.
HISTORY OF PAKISTANI SUZUKI:
The firm was founded in 1983 as a joint venture between the government of Pakistan and Suzuki
Motor Japan, formalizing the arrangement by which Awami Auto Ltd. had produced the Suzuki
SS80 from 1982. Suzuki originally owned 25% of the stock, and have gradually increased their
holding; they now own 73.09%. Pak Suzuki is the market leader in Pakistan Automobile Market
by having more than 53% of Market Share. Having Market Share of more than 50% since its
inception, Pak Suzuki always strive to introduce new and innovative Products and Services. Its
recently launched Suzuki Swift Brand has helped Pak Suzuki increase their Market Share in
1300cc segment. Apart of giving automobile related services like Suzuki Finance and Suzuki
Insurance, Pak Suzuki also deals in Pak Suzuki Certified Used Cars
Most of cars by Suzuki Pakistan generally lack essential features which are standard in other
cars, such as airbags, rear windshield defogger and rear seat belts. As of 2006, the Pakistani-
assembled Suzuki Mehran is sold equipped with a CNG tank and is one of the few cars in the
world which still uses a carburetor-based engine.
However, despite all the shortcomings and serious quality criticisms, the Suzuki Cars are
Pakistan's highest selling cars due to the lack of alternatives available owing to the monopolistic
8/2/2019 vijay B.C
http://slidepdf.com/reader/full/vijay-bc 44/52
Working Capital Management
P a g e | 44
nature of Pakistan's auto industry and restrictions imposed on imports by the government of
Pakistan.
Model Range:
SS80: 1982- . A modified version of the Suzuki Alto SS40, with a 796 cc engine.
Suzuki Mehran (originally Alto): 1988 to date, renamed Mehran in 1992. A very basic
version of the Suzuki Alto CA71, with a 796 cc engine. Very minor changes in 1998 and
2004. As of 2010, the car still has a carburetor based engine.
Alto: 2000 to date. The Suzuki Alto HA12 chassis fitted with a 1982-1984 Suzuki SJ410
970 cc engine. As of 2010, the Paksuzuki Alto still has a carburetor based engine.
Cultus: 2000 to date. A basic version of Suzuki Cultus Generation 2 as produced in
Hungary from 1992 to 2003, with a 993 cc engine.
Liana: 2006 to date. The Suzuki liana sedan with 1.3- or 1.6-litre engines. Since 2007,
Pakistan is the only place left where the Liana is being made and sold.
Potohar: the Suzuki Samurai produced by Santana Motors from 1985 to 2003 with a
international 1982-1984 Suzuki SJ410 970 cc carburetor engine.
Bolan and Ravi: respectively the van and pick-up versions of the Suzuki Super
Carry with a late 1970s era carburetor based 796 cc engine.
Suzuki Swift: 2010 to date. The fifth generation Suzuki Swift has been launched by
Paksuzuki in 2010. The Pakistani Suzuki Swift is a variant of the international 2004-2010
Suzuki Swift 1.3.
CANADA SUZUKI LTD:
Suzuki Canada Ltd. operates as a dealer of Suzuki vehicles in Canada. It offers used andnew cars, and repair services. The company also provides accessories, including hood protectors,
rear bumper protection sheets and trunk spoilers, side body moldings, muffler extensions,
chrome trunk lid trims, envelope nets, multi roof racks, small and large roof boxes, dual spoke
aluminum wheels, wheel lock kits, locking gas and valve stem caps, leather and wood M/T shift
8/2/2019 vijay B.C
http://slidepdf.com/reader/full/vijay-bc 45/52
Working Capital Management
P a g e | 45
knobs, door sill guards, front floor tray mats, and cargo trays. In addition, it offers other
accessories, such as Suzuki security systems, chrome door lock knobs, clarion 6 disc CD
changers, and front nose and mini front nose masks; ski/snowboard and lockable ski/snowboard,
lockable bicycle, surf/sailboard, luggage, and mountain bike modules; and bumper corner
protection, window visor, front mud flap, rear mud flap, instrument panel cover, deluxe floor
mat, and graphic sets. Suzuki Canada is based in St. John's, Canada.
Suzuki Canada Inc. History:
1973 – 1 June, Suzuki Canada Ltd. was incorporated with offices at Downsview, Ontario.
Product lines included motorcycles, parts and accessories to Suzuki dealers throughout
Canada.
1974 – Vancouver branch office and warehouse inaugurated to service dealers in western
Canada.
1980 – Autumn – Suzuki Canada began its automotive sales with the marketing and sales of
four-wheel-LJ80 in eastern Canada. 1 November, the name of company changed from
Suzuki Canada Ltd. to Suzuki Canada Inc.
1982 – Introduction of a line of Suzuki all-terrain vehicles (ATVs) in Canada.
1983 – Introduction of a line of Suzuki outboard motors in western Canada. 1 February 1983
– Western Branch moved to enlarged facilities in Richmond, British Columbia.
1984 – Began the sales of 'Suzuki Forsa' (Suzuki Cultus) automobile.
1986 – A $600 million Suzuki-GM joint venture CAMI Automotive Inc. announced for the
manufacturing of vehicles. Production was set to begin in 1989 at Ingersoll, Ontario.
1987 – 25 January – Suzuki Canada Inc. moved to a new 110,000 sq ft (10,000 m2). head
office and warehouse facility at Richmond Hill, Ontario.
1988 – Autumn – Suzuki began selling the CAMI-built 2-door Suzuki Sidekick.
2009 – Autumn – Suzuki sold its participation in CAMI to GM
MISSION STATEMENT
8/2/2019 vijay B.C
http://slidepdf.com/reader/full/vijay-bc 46/52
Working Capital Management
P a g e | 46
The core philosophy of Suzuki is to provide ―value-packed product‖. Since the founding of
Suzuki Motor Corporation, the Organization‘s endeavour has always been to provide
―value-packed product‖ as one of the manufacturing philosophies.
Suzuki believes that ―value added product‖ come from the effort to carry out Product
development from customer‘s point of view. This policy has been in effect since
Company‘s inception and has helped the Organization to meet customer‘s needs. As a
result, Suzuki‘s Products have become well received throughout the World. Suzuki is fully
committed to create Products that meet customer‘s demand by utilizing its dynamic, long-
nurtured technological advantage coupled with its fresh and active human resources.
Develop products of superior value by focusing on the customers
Establish a refreshing and innovative company through teamwork
Strive for individual excellence through continuous improvement
8/2/2019 vijay B.C
http://slidepdf.com/reader/full/vijay-bc 47/52
Working Capital Management
P a g e | 47
ANALYSIS AND INTERPRETATION
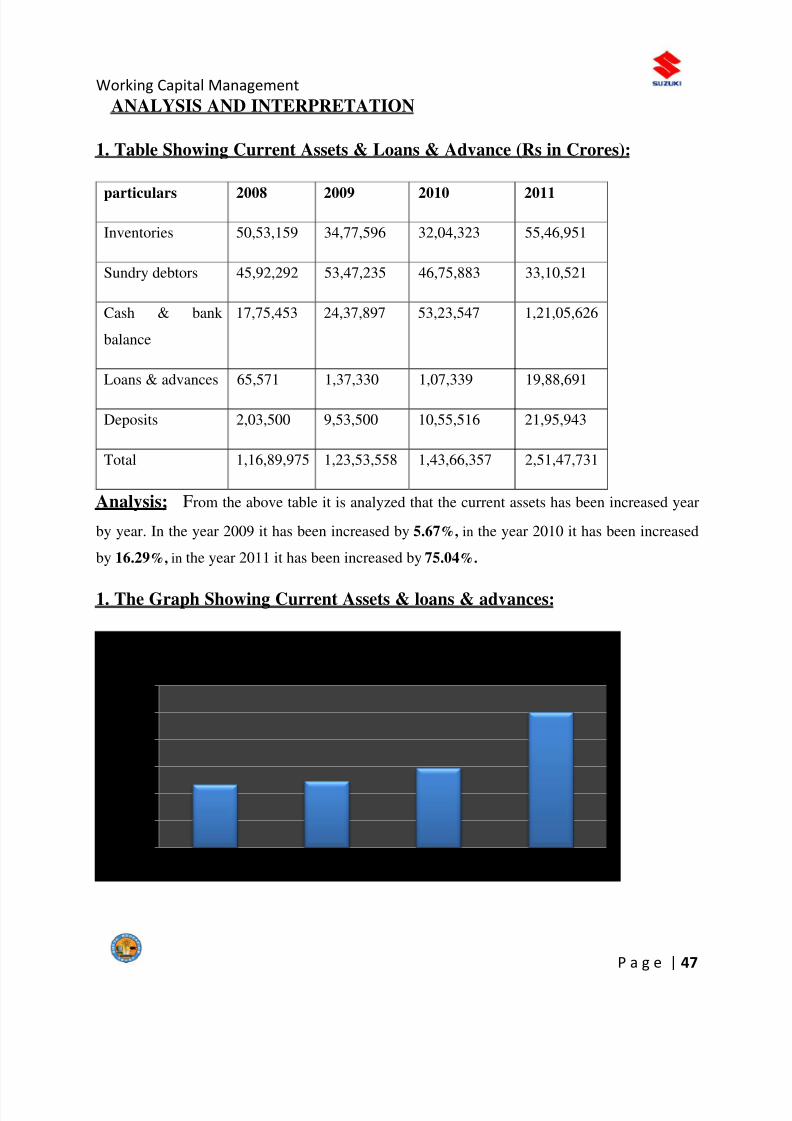
1. Table Showing Current Assets & Loans & Advance (Rs in Crores):
particulars 2008 2009 2010 2011
Inventories 50,53,159 34,77,596 32,04,323 55,46,951
Sundry debtors 45,92,292 53,47,235 46,75,883 33,10,521
Cash & bank
balance
17,75,453 24,37,897 53,23,547 1,21,05,626
Loans & advances 65,571 1,37,330 1,07,339 19,88,691
Deposits 2,03,500 9,53,500 10,55,516 21,95,943
Total 1,16,89,975 1,23,53,558 1,43,66,357 2,51,47,731
Analysis; From the above table it is analyzed that the current assets has been increased year
by year. In the year 2009 it has been increased by 5.67%, in the year 2010 it has been increased
by 16.29%, in the year 2011 it has been increased by 75.04%.
1. The Graph Showing Current Assets & loans & advances:
0
0.5
1
1.5
2
2.5
3
A m o u
n t i n c r o r e s
2008 2009 2010 2011
Total Current Assets & Loans & Advances
8/2/2019 vijay B.C
http://slidepdf.com/reader/full/vijay-bc 48/52
Working Capital Management
P a g e | 48
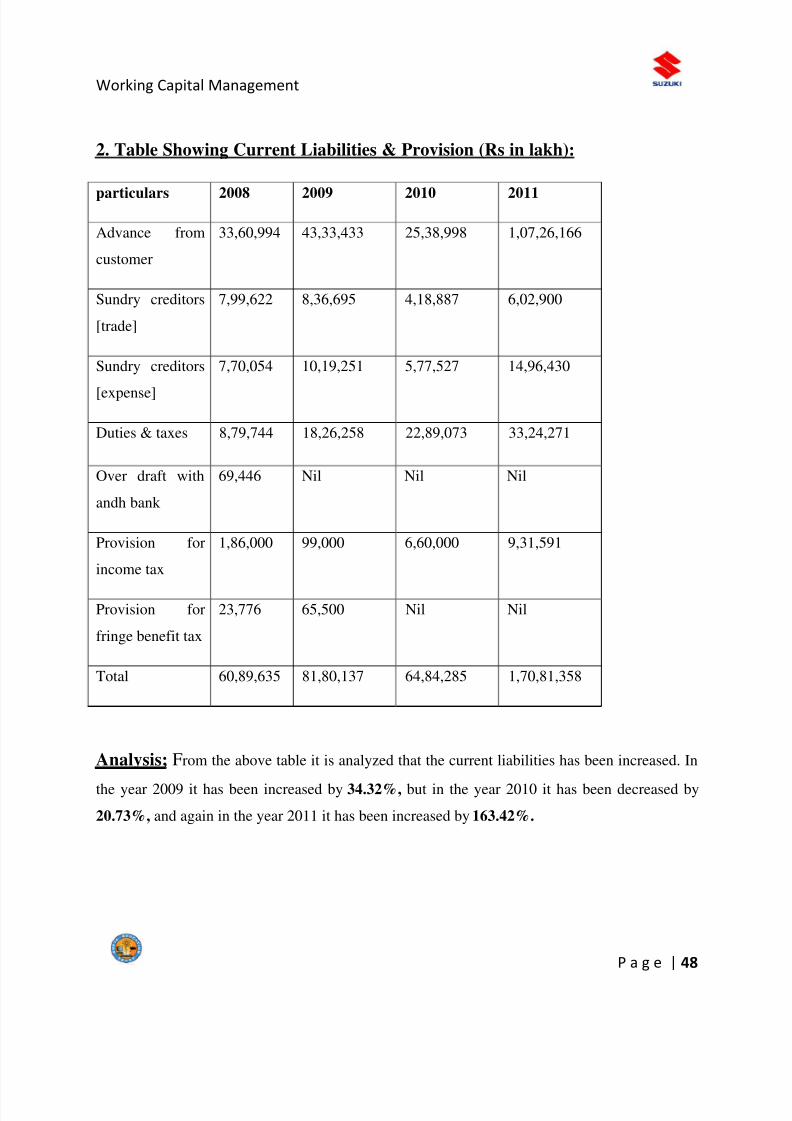
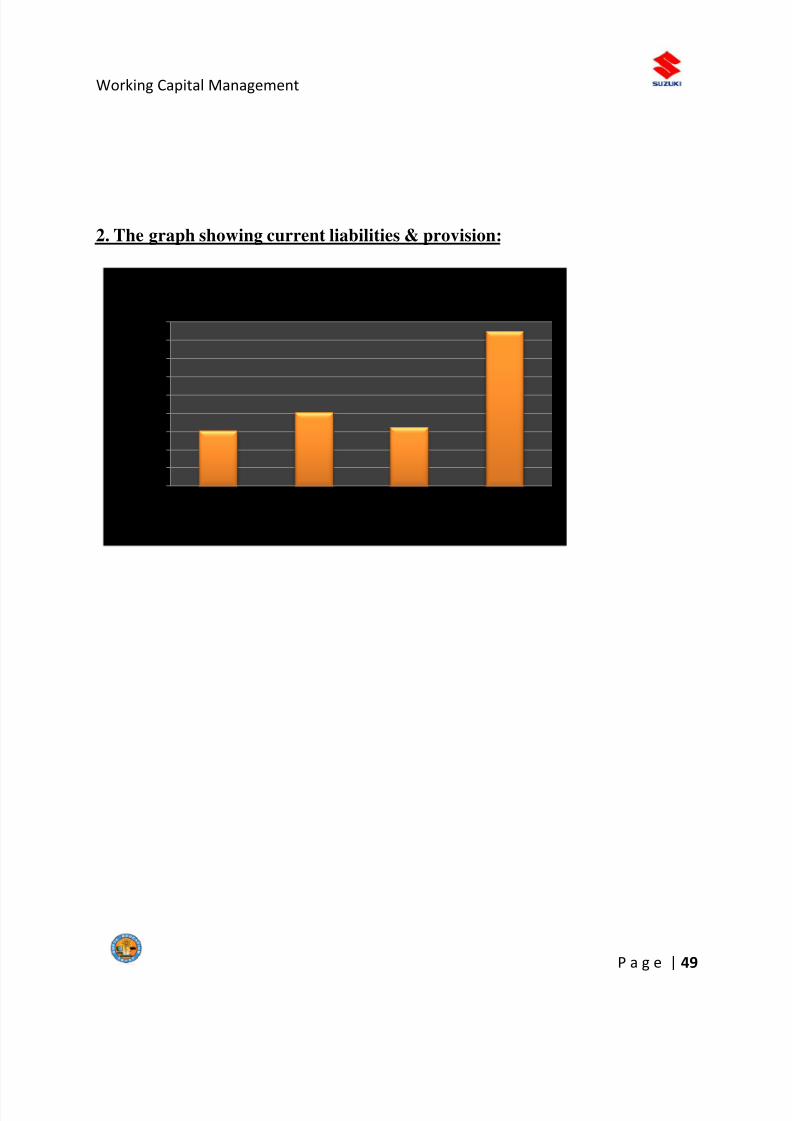
2. Table Showing Current Liabilities & Provision (Rs in lakh):
particulars 2008 2009 2010 2011
Advance from
customer
33,60,994 43,33,433 25,38,998 1,07,26,166
Sundry creditors
[trade]
7,99,622 8,36,695 4,18,887 6,02,900
Sundry creditors
[expense]
7,70,054 10,19,251 5,77,527 14,96,430
Duties & taxes 8,79,744 18,26,258 22,89,073 33,24,271
Over draft with
andh bank
69,446 Nil Nil Nil
Provision for
income tax
1,86,000 99,000 6,60,000 9,31,591
Provision for
fringe benefit tax
23,776 65,500 Nil Nil
Total 60,89,635 81,80,137 64,84,285 1,70,81,358
Analysis; From the above table it is analyzed that the current liabilities has been increased. In
the year 2009 it has been increased by 34.32%, but in the year 2010 it has been decreased by
20.73%, and again in the year 2011 it has been increased by 163.42%.
8/2/2019 vijay B.C
http://slidepdf.com/reader/full/vijay-bc 49/52
Working Capital Management
P a g e | 49
2. The graph showing current liabilities & provision:
0
20
40
60
80
100
120
140
160
180
1 2 3 4
a m o u n t i n
l a k h
years
Total Current Assets & Provision
8/2/2019 vijay B.C
http://slidepdf.com/reader/full/vijay-bc 50/52
Working Capital Management
P a g e | 50
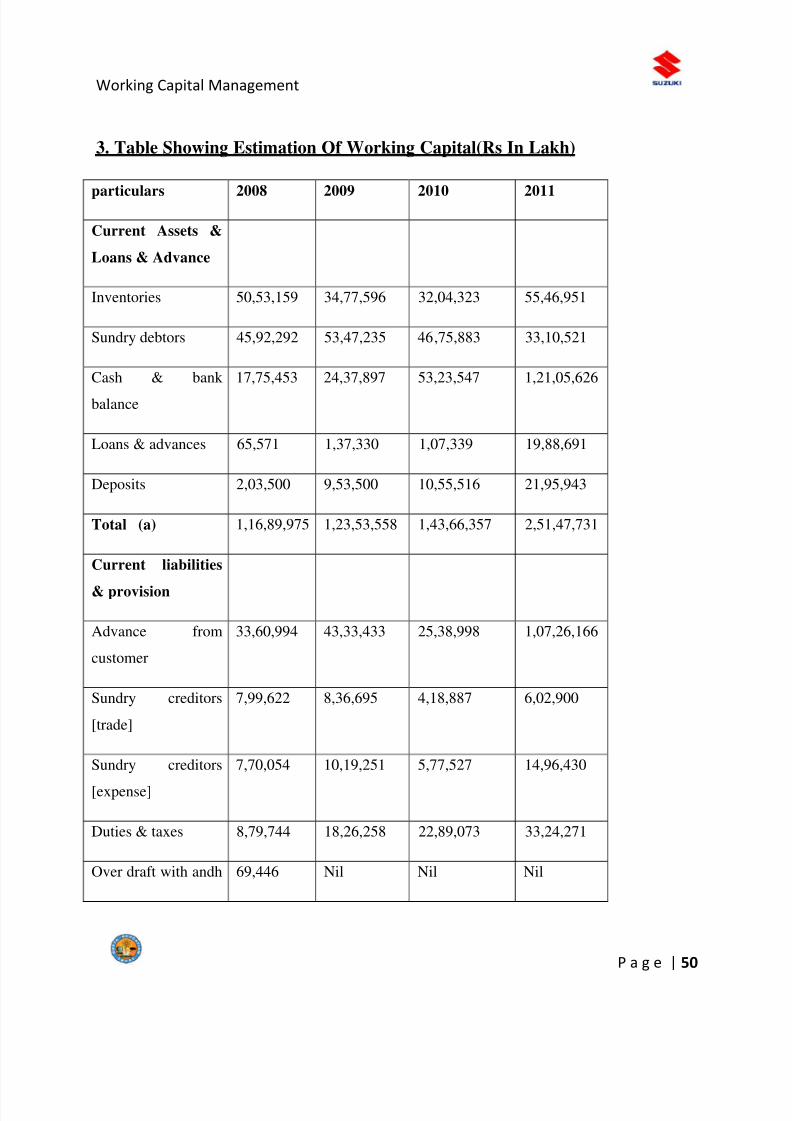
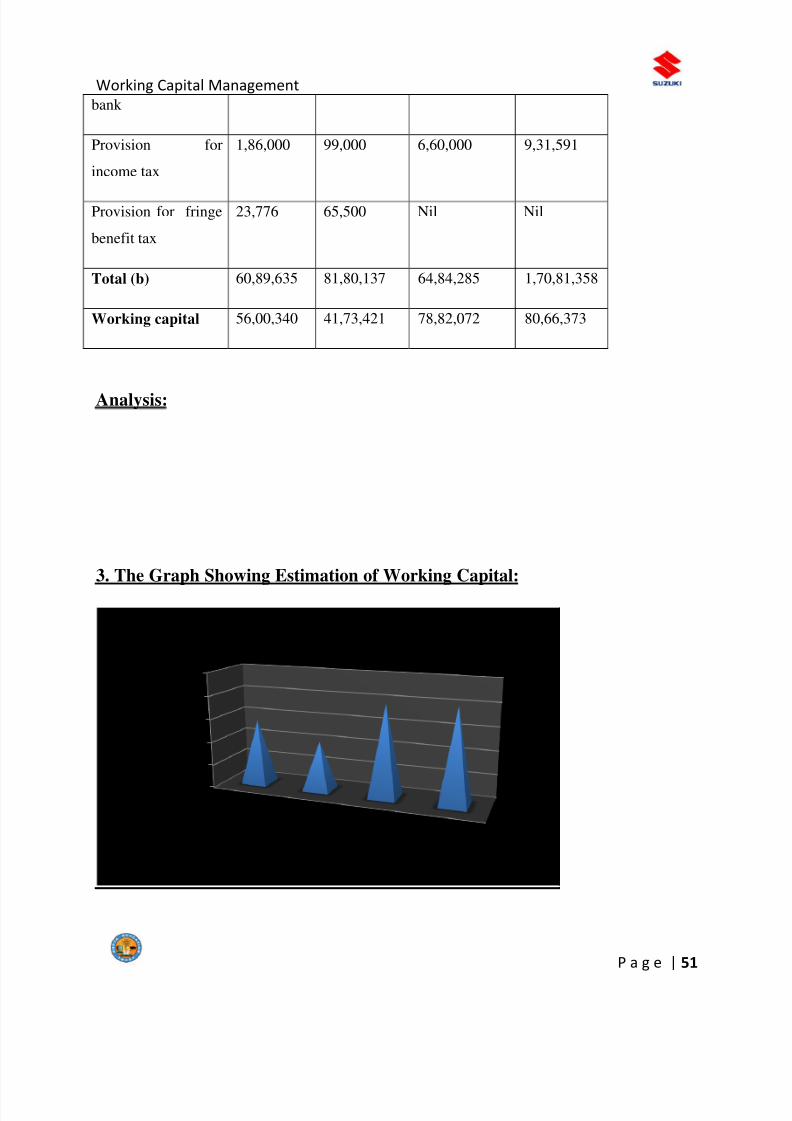
3. Table Showing Estimation Of Working Capital(Rs In Lakh)
particulars 2008 2009 2010 2011
Current Assets &
Loans & Advance
Inventories 50,53,159 34,77,596 32,04,323 55,46,951
Sundry debtors 45,92,292 53,47,235 46,75,883 33,10,521
Cash & bank
balance
17,75,453 24,37,897 53,23,547 1,21,05,626
Loans & advances 65,571 1,37,330 1,07,339 19,88,691
Deposits 2,03,500 9,53,500 10,55,516 21,95,943
Total (a) 1,16,89,975 1,23,53,558 1,43,66,357 2,51,47,731
Current liabilities
& provision
Advance from
customer
33,60,994 43,33,433 25,38,998 1,07,26,166
Sundry creditors
[trade]
7,99,622 8,36,695 4,18,887 6,02,900
Sundry creditors
[expense]
7,70,054 10,19,251 5,77,527 14,96,430
Duties & taxes 8,79,744 18,26,258 22,89,073 33,24,271
Over draft with andh 69,446 Nil Nil Nil
8/2/2019 vijay B.C
http://slidepdf.com/reader/full/vijay-bc 51/52
Working Capital Management
P a g e | 51
bank
Provision for
income tax
1,86,000 99,000 6,60,000 9,31,591
Provision for fringe
benefit tax
23,776 65,500 Nil Nil
Total (b) 60,89,635 81,80,137 64,84,285 1,70,81,358
Working capital 56,00,340 41,73,421 78,82,072 80,66,373
Analysis:
3. The Graph Showing Estimation of Working Capital:
0
20
40
60
80
100
12
34
A m o u n t i n l a k h
Years
working capital
8/2/2019 vijay B.C
http://slidepdf.com/reader/full/vijay-bc 52/52
Working Capital Management


![am Minted] - Vijay Solvex Limited - Vijay Solvex Limited ...](https://static.fdocuments.in/doc/165x107/61db5e41d41a4d48530af940/am-minted-vijay-solvex-limited-vijay-solvex-limited-.jpg)