PORTFOLIOresources.fahcsia.gov.au/budget/2012-13/FaHCSIA_PBS_2012... · Web viewThis statement...
366
PORTFOLIO BUDGET STATEMENTS 2012-13 BUDGET RELATED PAPER NO. 1.7 FAMILIES, HOUSING, COMMUNITY SERVICES AND INDIGENOUS AFFAIRS PORTFOLIO
Transcript of PORTFOLIOresources.fahcsia.gov.au/budget/2012-13/FaHCSIA_PBS_2012... · Web viewThis statement...

PORTFOLIO BUDGET STATEMENTS 2012-13BUDGET RELATED PAPER NO. 1.7
FAMILIES, HOUSING, COMMUNITY SERVICES AND INDIGENOUS AFFAIRS PORTFOLIO
BUDGET INITIATIVES AND EXPLANATIONS OFAPPROPRIATIONS SPECIFIED BY OUTCOMESAND PROGRAMS BY AGENCY

With the exception of the Commonwealth Coat of Arms and where otherwise noted all material presented in this document is provided under a Creative Commons Attribution 3.0 Australia (http://creativecommons.org/licenses/by/3.0/au/) licence.
The details of the relevant licence conditions are available on the Creative Commons website (accessible using the links provided) as is the full legal code for the CC BY 3.0 AU licence (http://creativecommons.org/licenses/by/3.0/au/legalcode).
The document must be attributed as the Department of Families, Housing, Community Services and Indigenous Affairs Portfolio Budget Statements 2012–13.
ISBN (print) 978-1-921975-43-1
(RTF) 978-1-921975-44-8
(PDF) 978-1-921975-45-5

Printed by CanPrint Communications Pty Ltd

MINISTER FOR FAMILES, COMMUNITY SERVICES AND INDIGENOUS AFFAIRS
MINISTER FOR DISABILITY REFORM
PARLIAMENT HOUSECANBERRA 2600
President of the SenateAustralian SenateParliament HouseCANBERRA ACT 2600
SpeakerHouse of RepresentativesParliament HouseCANBERRA ACT 2600
Dear Mr PresidentDear Mr Speaker
I hereby submit Portfolio Budget Statements in support of the 2012-13 Budget for the Families, Housing, Community Services and Indigenous Affairs portfolio.
These statements have been developed, and are submitted to the Parliament, as a statement on the outcomes for the portfolio.
I present these statements to provide accountability to the Parliament and, through it, the public.
Yours sincerely
The Hon. Jenny Macklin, MP

Abbreviations and conventions
The following notation may be used:
NEC/nec not elsewhere classified nil.. not zero, but rounded to zerona not applicable (unless otherwise specified)nfp not for publication$m $ million$b $ billion
Figures in tables and in the text may be rounded. Figures in text are generally rounded to one decimal place, whereas figures in tables are generally rounded to the nearest thousand. Discrepancies in tables between totals and sums of components are due to rounding.
Enquiries
Should you have any enquiries regarding this publication please contact the Branch Manager, Budget Development Branch, Department of Families, Housing, Community Services and Indigenous Affairs on (02) 6146 0152.
A copy of this document can be located on the Australian Government Budget website at www.budget.gov.au.

User Guideto the
Portfolio Budget Statements
vi

User GuideThe purpose of the 2012-13 Portfolio Budget Statements (PB Statements) is to inform Senators and Members of Parliament of the proposed allocation of resources to Government outcomes by agencies within the portfolio. Agencies receive resources from the annual appropriations acts, special appropriations (including standing appropriations and special accounts), and revenue from other sources.
A key role of the PB Statements is to facilitate the understanding of proposed annual appropriations in Appropriation Bills No. 1 and No. 2 2012-13 (or Appropriation Bill [Parliamentary Departments] No. 1 2012-13 for the parliamentary departments). In this sense the PB Statements are Budget related papers and are declared by the Appropriation Acts to be ‘relevant documents’ to the interpretation of the Acts according to section 15AB of the Acts Interpretation Act 1901.
The PB Statements provide information, explanation and justification to enable Parliament to understand the purpose of each outcome proposed in the Bills.
As required under section 12 of the Charter of Budget Honesty Act 1998, non-general government sector entities are not consolidated into the Commonwealth general government sector fiscal estimates and accordingly, these entities are not reported in the PB Statements.
vii

CONTENTS
Portfolio Overview 1
Families, Housing, Community Services and Indigenous Affairs Portfolio Overview 3
Agency Resources and Planned Performance 11
Families, Housing, Community Services and Indigenous Affairs 15
Aboriginal Hostels Limited 165
Australian Institute of Family Studies 189
Equal Opportunity for Women in the Workplace Agency 211
Indigenous Business Australia 235
Indigenous Land Corporation 267
Torres Strait Regional Authority 291
Glossary 317
Abbreviations 323
Index 325

Portfolio Overview

Families, Housing, Community Services And Indigenous Affairs Portfolio Overview
MINISTERS AND PORTFOLIO RESPONSIBILITIES
The Ministers and Parliamentary Secretary responsible for the portfolio and its agencies are:• the Hon. Jenny Macklin, MP, Minister for Families, Community Services
and Indigenous Affairs and Minister for Disability Reform• the Hon. Brendan O’Connor, MP, Minister for Housing and Minister for
Homelessness • the Hon. Julie Collins, MP, Minister for Community Services, Minister for
Indigenous Employment and Economic Development and Minister for the Status of Women
• Senator the Hon. Jan McLucas, Parliamentary Secretary for Disabilities and Carers.
The portfolio has 13 outcome statements. The Department of Families, Housing, Community Services and Indigenous Affairs (FaHCSIA) has seven. The Australian Institute of Family Studies has its own outcome statement. The Equal Opportunity for Women in the Workplace Agency has its own outcome statement and, in pursuing the achievement of this outcome also contributes to the achievement of FaHCSIA’s Women’s outcome statement. Aboriginal Hostels Limited, Indigenous Business Australia, the Indigenous Land Corporation and the Torres Strait Regional Authority each have their own outcome statements. In pursuing the achievement of their outcomes, they also contribute to the achievement of the FaHCSIA Indigenous outcome statement.
Department of Families, Housing, Community Services and Indigenous AffairsFaHCSIA is a key source of advice to the Australian Government on social policy and works in partnership with other government and non-government organisations to manage a diverse range of programs and services designed to support and improve the lives of Australians.FaHCSIA has whole-of-government policy coordination responsibilities in relation to Indigenous affairs and women.The Department is subject to the Financial Management and Accountability Act 1997 (FMA Act).Australian Institute of Family Studies
The Australian Institute of Family Studies (AIFS) is a statutory body established under the Family Law Act 1975. Its role is to conduct research
3

and communicate findings to policy-makers, service providers and the broader community about factors that affect family wellbeing.
Equal Opportunity for Women in the Workplace Agency
The Equal Opportunity for Women in the Workplace Agency (EOWA) is a statutory authority that administers the Equal Opportunity for Women in the Workplace Act 19991 and is subject to the FMA Act. The principal functions of EOWA are to promote employment for women on the basis of merit, promote equal opportunity and foster workplace consultation between employers and employees on these issues. EOWA contributes to portfolio goals by working with business to develop practices that improve women’s workforce participation in an environment free from discrimination.
Aboriginal Hostels Limited
Aboriginal Hostels Limited (AHL) is an Australian Government company subject to the Corporations Act 2001 and Commonwealth Authorities and Companies Act 1997 (CAC Act). AHL provides temporary accommodation to Aboriginal and Torres Strait Islander people through a national network. AHL contributes to the portfolio’s goals by helping Aboriginal and Torres Strait Islander people to improve their standard of living and achieve health, educational and employment-related goals.
Indigenous Business AustraliaIndigenous Business Australia (IBA) is a statutory authority established under the Aboriginal and Torres Strait Islander Act 2005 (ATSI Act) and is subject to the CAC Act. IBA creates opportunities for Aboriginal and Torres Strait Islander people and communities to build assets and wealth.IBA contributes to the portfolio’s goals by contributing to Indigenous economic development. To achieve this, IBA assists the Government in working with the private sector and local Indigenous people to encourage and foster Indigenous economic independence.Indigenous Land Corporation
The Indigenous Land Corporation (ILC) is a statutory authority established under the ATSI Act and is subject to the CAC Act. The ILC assists Aboriginal and Torres Strait Islander people to acquire and manage Indigenous-held land so as to provide economic, environmental, social and cultural benefits. The ILC contributes to the goals of the portfolio by assisting in the delivery of sustainable benefits from land acquisition and by providing land management assistance.
1 The Equal Opportunity for Women in the Workplace Bill 2012 is currently before the Parliament.
4

Portfolio Overview
Torres Strait Regional AuthorityThe Torres Strait Regional Authority (TSRA) is a statutory authority established by the ATSI Act and is subject to the CAC Act. TSRA formulates, implements and monitors the effectiveness of programs for Aboriginal and Torres Strait Islander people living in the Torres Strait and also advises the Minister for Families, Community Services and Indigenous Affairs about issues relevant to Aboriginal and Torres Strait Islander people living in the Torres Strait region.TSRA contributes to the goals of the portfolio by working to empower Aboriginal and Torres Strait Islander people living in the Torres Strait to determine their own affairs based on the ailan kastom (island custom) of the Torres Strait.Aboriginal Land Commissioner
The Aboriginal Land Commissioner is an independent statutory office holder under the Aboriginal Land Rights (Northern Territory) Act 1976 (ALRA Act) and is subject to the FMA Act. The principal function of the Commissioner is to conduct formal inquiries into applications for claims to traditional Aboriginal land in the Northern Territory and to provide recommendations to the Minister for Families, Community Services and Indigenous Affairs, for the grant of land where appropriate.
Coordinator General for Remote Indigenous Services
The Coordinator General for Remote Indigenous Services is a statutory office established under the Coordinator-General for Remote Indigenous Services Act 2009 and is subject to the FMA Act. The central functions of the Coordinator General are to monitor, assess, report, advise and drive the implementation of the Remote Service Delivery National Partnership Agreement, in each of the specified remote communities to a standard broadly comparable with that in non-Indigenous communities of similar size, location and needs elsewhere in Australia, and to monitor, assess, advise and drive progress towards achieving Closing the Gap targets in those same communities.
Executive Director of Township LeasingThe position of Executive Director, Township Leasing is a statutory office established under the ALRA Act to enter into leases of Aboriginal-held land in the Northern Territory on behalf of the Commonwealth, and to administer sub-leases and other rights and interests derived from such leases.
5

Portfolio Overview
A central function of the Executive Director is to enter into township leases and other types of land tenure on Aboriginal land in the Northern Territory following agreement between the Commonwealth and the respective Aboriginal Land Council and Land Trust. Registrar of Indigenous Corporations
The Registrar of Indigenous Corporations is an independent statutory office holder who administers the Corporations (Aboriginal and Torres Strait Islander) Act 2006 and is subject to the FMA Act. The Registrar of Indigenous Corporations registers and regulates Aboriginal and Torres Strait Islander corporations.
Northern Territory Land Councils
The Northern Land Council, the Central Land Council, the Anindilyakwa Land Council and the Tiwi Land Council are the four Northern Territory Land Councils established under the ALRA Act. The land councils are subject to the CAC Act. Each is an independent statutory body established to represent Aboriginal interests in a range of processes under the ALRA Act. The Central Land Council and Northern Land Council are Native Title Representative Bodies under the Native Title Act 1993.
Outback Stores Pty Ltd
Outback Stores Pty Ltd (OBS) is an Australian Government company subject to the Corporations Act 2001 and the CAC Act. OBS assists the health, employment and economy of remote Indigenous communities by managing quality, sustainable retail stores. OBS contributes to the portfolio’s goals by helping Aboriginal and Torres Strait Islander people to improve their standard of living and achieve health goals.
Social Security Appeals TribunalThe Social Security Appeals Tribunal (SSAT) is a statutory body under the Social Security (Administration) Act 1999, but is effectively part of the Department for the purposes of the FMA Act and the Public Service Act 1999. The SSAT conducts merit reviews of administrative decisions made under a number of enactments, in particular the social security law, family assistance law and child support law.The decisions that the SSAT reviews are made by officers of the Department of Human Services employed in Centrelink offices and in the Child Support Agency. The statutory objective of the SSAT is to provide a mechanism of review that is fair, just, economical, informal and quick. The SSAT contributes to the portfolio by ensuring that the decisions it reviews are consistent with the law and evidence. Wreck Bay Aboriginal Community Council
The Wreck Bay Aboriginal Community Council is an independent statutory body established by the Aboriginal Land Grant (Jervis Bay Territory) Act
6

Portfolio Overview
1986 and is subject to the CAC Act. The council holds title to land and provides services to the Aboriginal community of Jervis Bay.
7

Portfolio Overview
Figure 1: Families, Housing, Community Services and Indigenous Affairs portfolio structure and outcomes
Minister for Families, Community Services and Indigenous Affairs andMinister for Disability Reform
The Hon. Jenny Macklin, MP
Minister for Housing and Minister for HomelessnessThe Hon. Brendan O’Connor, MP
Minister for Community Services, Minister for Indigenous Employment and Economic Development and Minister for the Status of Women
The Hon. Julie Collins, MP
Parliamentary Secretary for Disabilities and CarersSenator the Hon. Jan McLucas
Department of Families, Housing, Community Services and Indigenous Affairs
Secretary: Mr Finn Pratt PSM
Outcome 1: Families and Children – Improved child development, safety and family functioning through support services for all Australians, payments for low and medium income families with children and child support policy.
Outcome 2: Housing – Access to affordable, safe housing through: payments and support services; and rental subsidies to low and moderate income households.
Outcome 3: Community Capability and the Vulnerable – Improved capacity for vulnerable people and communities to participate economically and socially and to manage life-transitions through payments, targeted support services and community capability building initiatives.
Outcome 4: Seniors – An adequate standard of living and improved capacity to productively manage resources and life-transitions for senior Australians through the delivery of payments, concessions and information services.
Outcome 5: Disability and Carers – An adequate standard of living, improved capacity to participate economically and socially and manage life-transitions for people with disability and/or mental illness and carers through payments, concessions, support and care services.
Outcome 6: Women – Improved gender equality through coordinated whole of government advice and support for women’s economic security, safety and status.
Outcome 7: Indigenous – Closing the gap in Indigenous disadvantage with improved wellbeing, capacity to participate economically and socially and to manage life-transitions for Indigenous Australians through Indigenous engagement, coordinated whole of government policy advice and targeted support services.
8

Portfolio Overview
Figure 1: Families, Housing, Community Services and Indigenous Affairs portfolio structure and outcomes (continued)
Families, Housing Community Services and Indigenous Affairs portfolioMinisters and Parliamentary Secretary
Aboriginal Hostels Limited Chief Executive Officer: Ms Joy SavageOutcome: Improved access to education, employment, health and other services for Aboriginal and Torres Strait Islander people travelling or relocating through the operation of temporary hostel accommodation services.
Australian Institute of Family Studies Director: Professor Alan HayesOutcome: To increase understanding of factors affecting how Australian families function by conducting research and communicating findings to policy-makers, service providers and the broader community.
Equal Opportunity for Women in the Workplace Agency Director: Ms Helen Conway
Outcome: Increased influence over Australian employers to achieve equality for women in the workplace through regulation and education on eliminating discrimination and promoting merit based opportunity.
Indigenous Business Australia Chief Executive Officer: Mr Christopher FryOutcome: Improved wealth acquisition to support the economic independence of Aboriginal and Torres Strait Islander peoples through commercial enterprise, asset acquisition, construction and access to concessional home and business loans.
Indigenous Land Corporation Chief Executive Officer: Mr David GalvinOutcome: Enhanced socio-economic development, maintenance of cultural identity and protection of the environment by Indigenous Australians through land acquisition and management.
Northern Territory Land CouncilsNorthern Land Council Central Land CouncilChief Executive Officer: Mr Kim Hill Director: Mr David Ross
Anindilyakwa Land Council Tiwi Land CouncilChief Executive Officer: Mr Mark Hewitt Chief Executive: Mr John S Hicks
Objective: Represent Aboriginal interests in various processes under the Aboriginal Land Rights (Northern Territory) Act 1976. The Central Land Council and Northern Land Council are Native Title Representative Bodies under the Native Title Act 1993.
Outback Stores Pty Ltd Chief Executive Officer: Mr Steve MooreObjective: To improve access to affordable, healthy food for Indigenous communities, particularly in remote areas, through providing food supply and store management and support services.
Social Security Appeals Tribunal Principal Member: Ms Jane MacdonnellObjective: Conduct merit reviews of administrative decisions made under a number of enactments, in particular the social security law, family assistance law and child support law.
Torres Strait Regional Authority Chief Executive Officer: Mr Wayne See KeeOutcome: Progress towards closing the gap for Torres Strait Islander and Aboriginal people living in the Torres Strait Region through development planning, coordination, sustainable resource management, and preservation and promotion of Indigenous culture.
Wreck Bay Aboriginal Community Council Chief Executive Officer: Mr Mal Hansen
Objective: Established by the Aboriginal Land Grant (Jervis Bay Territory) Act 1986 to hold title to land and provide council services to the Aboriginal Community of Jervis Bay.
9

Portfolio Overview
Portfolio resources
Table 1 shows the total new resources provided to the portfolio in the 2012–13 budget year, by agency.
Table 1: Portfolio resources 2012-13Receipts Total
Bill No. 1 Bill No. 2 Special$m $m $m $m $m
FaHCSIA1
Administered appropriations 1,660.4 35.0 80,841.1 152.1 82,688.6 Departmental appropriations 582.9 27.7 - 25.3 635.9 Total: 2,243.3 62.7 80,841.1 177.4 83,324.5 AIFSAdministered appropriations - - - - - Departmental appropriations 3.5 - - 7.0 10.5 Total: 3.5 - - 7.0 10.5 EOWAAdministered appropriations - - - - - Departmental appropriations 5.9 0.8 - 0.1 6.8 Total: 5.9 0.8 - 0.1 6.8 AHL2
Administered appropriations - - - - - Departmental appropriations 38.5 - - 17.3 55.8 Total: 38.5 - - 17.3 55.8
IBA2
Administered appropriations - - - - - Departmental appropriations 34.3 37.5 - 132.2 204.0 Total: 34.3 37.5 - 132.2 204.0 ILC2
Administered appropriations - - - - - Departmental appropriations 9.7 - - 55.8 65.5 Total: 9.7 - - 55.8 65.5 TSRA2
Administered appropriations - - - - - Departmental appropriations 45.7 - - 7.6 53.3 Total: 45.7 - - 7.6 53.3 Portfolio total 2,380.9 101.0 80,841.1 397.4 83,720.4 Less amounts transferred
w ithin portfolio - - - - - Resources available within portfolio: 83,720.4
1 Total resourcing does not include the balance of Special Accounts carried forw ard from 2011-12.2 Funding under Appropriation Bill (No. 1) 2012-13 for agencies under the CAC Act is appropriated to FaHCSIA and then paid to each agency.
Appropriation
10

Agency resources andplanned performance
Department of Families, Housing, Community Services and Indigenous Affairs 15
Aboriginal Hostels Limited 165
Australian Institute of Family Studies 189
Equal Opportunity for Women in the Workplace Agency 211
Indigenous Business Australia 235
Indigenous Land Corporation 267
Torres Strait Regional Authority 291
11

Department of Families, Housing, Community Services
and Indigenous Affairs
Agency Resources and Planned Performance

DEPARTMENT OF FAMILIES, HOUSING, COMMUNITY SERVICES AND INDIGENOUS AFFAIRS
Section 1: Agency overview and resources............................................................171.1 Strategic direction statement..........................................................................171.2 Agency resource statement...........................................................................251.3 Budget measures...........................................................................................28
Section 2: Outcomes and planned performance.....................................................372.1 Outcomes and performance information........................................................37
Section 3: Explanatory tables and budgeted financial statements......................1443.1 Explanatory tables.......................................................................................1443.2 Budgeted financial statements.....................................................................150
15

Department of Families, Housing, Community Services and Indigenous Affairs
Section 1: Agency overview and resources
1.1 Strategic direction statement
The Department of Families, Housing, Community Services and Indigenous Affairs (FaHCSIA) is the Australian Government’s primary agency in the development and implementation of social policy. FaHCSIA’s purpose is to improve the lives of Australians by creating opportunities for economic and social participation and building a stronger and fairer society.FaHCSIA’s outcomes reflect the seven core areas in which the Department seeks to assist people:
1. Families and Children2. Housing 3. Community Capability and the Vulnerable 4. Seniors 5. Disability and Carers6. Women 7. Indigenous.
The detailed outcome statements for the seven areas can be found in Section 2 of these Portfolio Budget Statements. FaHCSIA achieves its objectives by:• Payments to individuals – FaHCSIA makes direct payments to individuals
through the Department of Human Services and other agencies. Primary examples of these payments include the Age Pension, the Disability Support Pension (DSP) and the Family Tax Benefit (FTB).
• Working with the states and territories – FaHCSIA works with the states and territories to achieve outcomes in their areas of responsibility, including housing, disability services, tackling Indigenous disadvantage, concessions and the welfare of children.
• Funding community-based organisations – FaHCSIA funds community-based organisations to deliver a range of local services, including family relationship services, family support, community-based mental health services, early intervention support, emergency relief and supported employment for people with disability.
• Policy development, leadership, advice and coordination – FaHCSIA supports its Ministers in their policy roles by providing advice on social
17

policy, building the evidence base for decisions and action and in whole-of-government policy coordination for Indigenous affairs and for women.
Key priorities for 2012–13
The 2012–13 Budget continues to build on the Government’s key reforms for families, seniors, Indigenous Australians and people with disability and their carers. Major initiatives in the 2012–13 Budget include a substantial package of support for families including a new payment to families with children at school and increases in Family Tax Benefit, the launch of the National Disability Insurance Scheme, a new Remote Jobs and Communities Program and the Stronger Futures in the Northern Territory package.
Help for families with the costs of raising children
Major initiatives in the 2012–13 Budget build on significant improvements to family assistance delivered in previous years. Around 1.3 million low- and medium-income families with children at school will receive a new bonus payment of $410 a year for each primary school student and $820 a year for each high school student to help with school costs from 1 January 2013. This new payment will replace the Education Tax Refund, and will be provided up front twice a year in January and July so that families have the money when they need it. Around 80 per cent of eligible families will receive more assistance through the new payment. As part of the transition to the new payment, the Education Tax Refund for 2011–12 will be paid as a one-off lump-sum payment to all eligible families in June 2012. Families will also receive an increase in Family Tax Benefit Part A to help with cost of living pressures as part of the Benefits of the Boom package. The maximum rate of Family Tax Benefit Part A will increase by $300 a year for families with one child and by $600 a year for families with two or more children. The base rate of Family Tax Benefit Part A will increase by $100 a year for families with one child and by $200 a year for families with two or more children. Over 1.5 million families who are paid Family Tax Benefit Part A will receive an increase in their payments from 1 July 2013.This new assistance builds on the substantial increases to family payments for teenagers in school that started on 1 January 2012. The Government’s Paid Parental Leave scheme continues to support working parents to take more time off with their babies in the crucial early months. This year, the Government will expand the scheme through the introduction of two weeks Dad and Partner Pay, which will give fathers and partners the opportunity to bond with their child and encourage them to take on a greater role in caring for their child. As part of the Government’s reform of the tax-free threshold, the 2012–13 Budget introduces streamlined end-of-year reporting for low-income parents who no longer have to lodge a tax return. These parents will be able to
18

FaHCSIA Budget Statements
update their incomes with the Department of Human Services online, over the phone or in person to ensure that they receive their correct entitlements. The Government has also taken further steps to make sure the family payment system is focused on providing support to children at school or in study. For teenagers who have already completed secondary or equivalent education, the maximum age of eligibility for Family Tax Benefit Part A will be lowered from 21 to 17 years from 1 January 2013. For teenagers still in secondary or equivalent education, Family Tax Benefit Part A will still be available up to the end of the calendar year they turn 19.
Supporting people with disability, their families and carers
The Australian Government is committed to ensuring that people with disability are supported in all aspects of their lives so they can participate fully in the community. Continuing fundamental disability reform through a National Disability Insurance Scheme is a key priority for 2012–13. Since the release of the Productivity Commission’s report on the Inquiry into Disability Care and Support, FaHCSIA has been supporting the Australian Government in laying the foundations for a National Disability Insurance Scheme (NDIS). The current system is not delivering the kind of care and support that Australians expect for people with disability. An NDIS would insure all Australians for the cost of care and support in the event of significant permanent disability.
Through the 2012–13 Budget, the Australian Government is investing $1.0 billion in the first stage of an NDIS. In this significant social policy reform, from mid-2013 the first stage of an NDIS will be rolled out in selected communities across the country. The development and implementation of this first stage will test key features of an NDIS, including how to provide support on an individualised basis that gives a person with disability real choice and control, and how to manage disability care and support on the basis of insurance principles. About 20,000 Australians with disability, as well as their families and carers, will benefit from the first stage of the NDIS. The Australian Government is working with states and territories through the Select Council of Treasurers and Disability Reform Ministers to lay the necessary foundations for the scheme. Consistent with the vision set out by the Productivity Commission, the NDIS will: • provide eligible individuals with the support that is reasonable and
necessary to meet their needs• give individuals decision-making power, including being able to choose
their service provider• provide high-quality, evidence-based services that manage lifetime costs
of care• be simple to navigate and link to mainstream services

FaHCSIA Budget Statements
• recognise the essential support of families and carers and support them in that role
• facilitate each individual’s community participation, access to education and employment opportunities
• be managed on an insurance basis.This year’s Budget also includes a commitment of $59.6 million over four years to ensure that support continues for 20,000 workers with disability in supported employment. This funding provides ongoing funding certainty for Australian Disability Enterprises into the future. This Budget also includes funding to expand support for children with hearing and/or vision impairment in outer regional and remote Australia. This funding will be delivered through the Remote Hearing and Vision Services program and will provide greater access to qualified allied health and education services.These reforms build on the Government’s historic investment in delivering for people with disability and their carers. The National Disability Strategy and the National Carer Strategy were both launched in 2011. The National Disability Strategy sets out a 10-year policy roadmap for all governments to address the barriers faced by Australians with disability. The National Carer Strategy sets out a plan to provide carers with the same opportunities as other Australians to participate fully in work, family and community life. In 2012–13, FaHCSIA will continue to support the Government to coordinate these two key strategies. The Government’s election commitments for people with disability and their carers will continue to be rolled out. The Australian Government has allocated $60 million over four years to the Supported Accommodation Innovation Fund to build 150 innovative, community-based supported accommodation places for people with disability. Around 4,000 children with cerebral palsy, Down syndrome, Fragile X syndrome or greater vision or hearing impairment are now registered for vital early intervention support as a result of the Government’s Better Start for Children with Disability initiative. This builds on the success of the Helping Children with Autism initiative which started in 2008.In addition, the Government’s reforms to the Disability Support Pension (DSP) to support people with the capacity to participate in the workforce continue to be implemented. New assessment processes for the DSP started in September 2011, and impairment tables started on 1 January 2012. From 1 July 2012, two additional changes will commence. DSP recipients will be able to work up to 30 hours a week in open employment and, subject to the income test, still receive a pension. In addition, DSP recipients under the age of 35 who have some work capacity will develop participation plans for engaging in the community and work.FaHCSIA will also continue to expand the community-based mental health services announced in the 2011–12 Budget.

FaHCSIA Budget Statements
Closing the Gap on Indigenous disadvantage
The 2012–13 Budget delivers major investment for Indigenous Australians as part of the Australian Government’s commitment to Closing the Gap on Indigenous disadvantage. FaHCSIA provides whole–of-government coordination and policy advice and supports implementation of COAG’s National Indigenous Reform Agreement. This outlines the framework for Closing the Gap, including six ambitious Closing the Gap targets and seven inter-related areas for investment and change – known as the ‘building blocks’.FaHCSIA has contributed to the development of two significant cross-portfolio initiatives within the Closing the Gap framework: the Stronger Futures in the Northern Territory package and the Remote Jobs and Communities Program.The Northern Territory Emergency Response finishes this year. While progress has been made in improving Aboriginal people’s lives, the situation in the Northern Territory remains critical. After extensive consultation with Aboriginal people in the Northern Territory, the Australian Government has developed a 10-year commitment to build Stronger Futures in the Northern Territory, providing $3.4 billion over the next 10 years. This commitment includes funding for health and food security; getting children to school to get a decent education and supporting families to give children the best start in life; tackling alcohol abuse and keeping communities safe for vulnerable women and children; providing decent housing; increasing job opportunities and supporting people to get jobs; and support for the delivery of municipal and essential services in outstations and homelands. The 10-year funding package, combined with the proposed supporting legislation, will give people and communities the support they need to work in partnership with the Australian Government to build stronger futures. The Stronger Futures legislation will repeal the Northern Territory National Emergency Response Act 2007. The Australian Government is investing $1.5 billion over five years for a new Remote Jobs and Communities Program, to commence on 1 July 2013. It will work in partnership with communities to help people get and keep a job and to achieve sustainable community development. The Remote Jobs and Communities Program will see jobseekers assisted by a single provider with a permanent presence in their region, ensuring they are getting better support to get the skills needed to get a job. It will also ensure that people who are not working are participating in activities that contribute to developing strong and sustainable communities. A key priority for FaHCSIA will be to continue to work in partnership with the states and the Northern Territory to deliver on the commitments and milestones set out in the National Partnership Agreement on Remote Indigenous Housing. This provides an unprecedented investment of $5.5 billion over 10 years, from 2008–09 to 2017–18, for housing and housing-related infrastructure in remote Indigenous communities.

FaHCSIA Budget Statements
FaHCSIA will also deliver on the Government’s decision to provide $43.4 million to extend the Municipal and Essential Services Program for a further year to deliver power, water, sewerage and other essential services for approximately 38,000 people in about 350 remote Indigenous communities across Queensland, South Australia, Tasmania, Victoria and Western Australia.The Government is committed to acknowledging the status of Aboriginal and Torres Strait Islander peoples in the Australian Constitution. To support this commitment, it is funding a community awareness initiative to build and sustain public engagement and understanding of constitutional recognition of Aboriginal and Torres Strait Islander peoples.
Support for seniors
FaHCSIA continues to work to support the wellbeing of senior Australians. A key part of this support is the payment of the Age Pension and supplements, and the provision of concessions to those senior Australians who are unable to fully support themselves.FaHCSIA continues to implement the Government’s Secure and Sustainable Pension reforms. Since these reforms in 2009, pensions have increased by around $154 a fortnight for single pensioners and around $156 a fortnight for pensioner couples combined.A new National Partnership on Certain Concessions for Pensioners and Seniors Card holders is currently being negotiated, to commence from 1 July 2012. The partnership would contribute funds to states and territories towards the provision of certain concessions for all Pensioner Concession Card holders and public transport concessions for out-of-state Seniors Card holders.
Household Assistance Package
The introduction of the carbon price on 1 July 2012 as part of the Australian Government’s Clean Energy Future plan delivers support for jobs, competitiveness and Australia’s economic growth while reducing pollution. The Household Assistance Package will provide assistance through increased payments and tax cuts.
From May 2012, an initial household assistance payment will be automatically paid to eligible pensioners, allowees and Family Tax Benefit recipients. The payment is an adjustment to help with the impact of carbon pricing and will cover a period of nine to 18 months, depending on the type of payment, until household assistance becomes part of regular government payments at regular indexation points.
The introduction of the Government’s tax reform package from 1 July 2012 will increase the tax-free threshold from $6,000 to $18,200 and will assist low-income households by giving them more money through reduced tax.

FaHCSIA Budget Statements
In addition to these measures, low-income households that do not receive enough household assistance through tax cuts or other government payments may be eligible for an annual Low Income Supplement of $300.
The new Home Energy Saver Scheme will also support low-income households across Australia that experience difficulty in meeting and paying for their energy needs. Clients will be able to access the scheme from 2012–13. It will provide access to energy efficiency and financial management information and education, advice and advocacy, and will assist with the integration of financial management and energy efficiency services. Additional funding has been provided for the No Interest Loans Scheme, expanding support for a component of the financial literacy and microfinance projects funded in the 2011 Budget.
Other assistance is being provided through the Essential Medical Equipment Payment and the Remote Indigenous Energy Program.
Assisting vulnerable Australians
Through a range of programs, the Government continues to provide assistance to vulnerable individuals and families at risk of exclusion. FaHCSIA aims to build financial resilience and wellbeing for vulnerable people by providing crisis assistance, expert help with financial matters, money management information and education, microfinance products, income management and payments for individuals in special circumstances. Income management in Western Australia, which started in November 2008, is being continued in this Budget, as is the School Enrolment and Attendance program operating in Queensland. In 2012–13 FaHCSIA will continue to progress important gambling reforms, as announced by the Prime Minister on 21 January 2012. These reforms include legislation to support a pre-commitment system in all states and territories, dynamic warning requirements and Automated Teller Machine withdrawal limits.FaHCSIA will also pursue a number of non-legislative reforms, including sponsoring a large-scale trial of mandatory pre-commitment in the Australian Capital Territory, 50 new financial counselling positions to help problem gamblers, and funding for the Gambling Help Online website. Funding for these initiatives is provided in the 2012–13 Budget.The Government will support the establishment of a Federal Children’s Commissioner within the Australian Human Rights Commission during 2012–13. The Commissioner will focus on promoting the rights, wellbeing and development of children and young people in Australia.

FaHCSIA Budget Statements
Housing
FaHCSIA assists households on low and moderate incomes to access affordable and appropriate housing and supports people who are homeless or at risk of homelessness.
In December 2011, responsibility for affordable housing programs was transferred to FaHCSIA from the Department of Sustainability, Environment, Water, Population and Communities. Affordable housing includes three subprograms: the National Rental Affordability Scheme, the Housing Affordability Fund and the Building Better Regional Cities program. In 2012–13, FaHCSIA will continue to manage these subprograms to increase the supply of affordable housing and rental housing.
FaHCSIA has whole-of-government oversight of social and affordable housing policy at the Commonwealth level and works in partnership with states and territories to improve housing outcomes for Australians. The National Affordable Housing Agreement funds public and community housing delivered by the states and territories. Rent Assistance payments help eligible people to afford rental housing. FaHCSIA will continue to work with states and territories to finalise the delivery of the social and affordable housing dwellings being delivered through the Nation Building – Economic Stimulus Plan and the National Partnership Agreement on Social Housing.
Addressing homelessness is critical to reducing long-term disadvantage and remains a priority for the Government. FaHCSIA is responsible for a range of initiatives to address homelessness and leads whole-of-government efforts to achieve the Government's homelessness reduction targets. Much of this work is done in partnership with states and territories under the National Affordable Housing Agreement and National Partnership Agreement on Homelessness.
Women
The Equal Opportunity for Women in the Workplace Amendment Bill 2012 has been introduced into Parliament to remove barriers to women’s workforce participation and enhance gender equality in the workplace. In addition, the National Plan to Reduce Violence against Women and their Children 2010–2022 is being implemented in partnership with state and territory governments and the non-government sector.

FaHCSIA Budget Statements
1.2 Agency resource statement
Table 1.1 shows the total resources from all sources. The table summarises how resources will be applied by outcome and by administered and departmental classification.
Table 1.1: FaHCSIA Resource Statement – Budget Estimates for 2012-13 as at Budget May 2012
+ =
Ordinary annual services1
Departmental appropriationPrior year departmental appropriation2 79,459 - 79,459 88,588Departmental appropriation3 - 582,851 582,851 560,476s31 Relevant agency receipts4 - 25,284 25,284 30,094Total 79,459 608,135 687,594 679,158
Administered expensesOutcome 1 - 157,094 157,094 215,414Outcome 2 - 220,048 220,048 166,345Outcome 3 - 197,778 197,778 180,340Outcome 4 - 8,849 8,849 2,600Outcome 5 - 636,748 636,748 554,861Outcome 6 - 27,126 27,126 33,891Outcome 7 - 412,798 412,798 537,540Total - 1,660,441 1,660,441 1,690,991Non appropriated revenue - 21,763 21,763 35,360Payments to CAC Act bodies - 128,221 128,221 137,629Total Administered - 1,810,425 1,810,425 1,863,980
Total ordinary annual services A 79,459 2,418,560 2,498,019 2,543,138Other services5
Administered expensesSpecific payments to States,
ACT, NT and local governmentOutcome 2 - 35,000 35,000 30,000Total - 35,000 35,000 30,000
Departmental non- operatingEquity injections - 27,686 27,686 2,997Total - 27,686 27,686 2,997
Administered non- operatingPayments to CAC Act bodies -
non-operating - 37,540 37,540 33,170Total - 37,540 37,540 33,170
Total other services B - 100,226 100,226 66,167Total available annual
appropriations 79,459 2,518,786 2,598,245 2,609,305
Estimateof prior year
amountsavailable in
2012-13$'000
Proposedat Budget
2012-13$'000
Total estimate
2012-13$'000
Actualavailable
appropriation
2011-12$'000
(continued on next page)

FaHCSIA Budget Statements
Table 1.1: FaHCSIA Resource Statement – Budget Estimates for 2012-13 as at Budget May 2012 (continued)
+ =
Special appropriationsSpecial appropriations limited
by criteria/entitlementAboriginal Land Rights (Northern Territory) Act 1976 - 160,447 160,447 159,351Social Security (Administration) Act 1999
- 58,499,419 58,499,419 55,398,870
A New Tax System (Family Assistance)(Administration) Act 1999 - 20,728,868 20,728,868 20,852,105Northern Territory National Emergency Response Act 2007 - 12,271 12,271 19,498Paid Parental Leave Act 2010 - 1,440,072 1,440,072 1,373,565
Total special appropriations C - 80,841,077 80,841,077 77,803,389Total appropriations excluding
Special Accounts 79,459 83,359,863 83,439,322 80,412,694Special Accounts
Opening balance6 2,332,502 - 2,332,502 2,265,730Appropriation receipts7 - 160,247 160,247 159,151Non-appropriation receipts to Special Accounts - 130,342 130,342 142,484
Total Special Accounts D 2,332,502 290,589 2,623,091 2,567,365Total resourcing 2,411,961 83,650,452 86,062,413 82,980,059A+B+C+DLess appropriations drawn from
annual or special appropriations aboveand credited to special accountsand/or CAC Act bodies through annual appropriations - (326,008) (326,008) (329,950)
Total net resourcing for FaHCSIA 2,411,961 83,324,444 85,736,405 82,650,1091 Appropriation Bill (No.1) 2012–13.2 Estimated adjusted balance carried forward from previous year for annual appropriations.3 Includes an amount of $31.9m in 2012–13 for the Departmental Capital Budget (refer to Table 3.2.5 forfurther details). For accounting purposes this amount has been designated as 'contributions by owners'.4 s31 Relevant Agency receipts - estimate.5 Appropriation Bill (No.2) 2012–13.6 Estimated opening balance for special accounts. For further information on special accounts see Table 3.1.2.7 Appropriation receipts from FaHCSIA annual and special appropriations for 2012–13. Note: All figures are GST exclusive.
Estimateof prior year
amountsavailable in
2012-13$'000
Proposedat Budget
2012-13$'000
Total estimate
2012-13$'000
Actualavailable
appropriation
2011-12$'000
(continued on next page)

FaHCSIA Budget Statements
Table 1.1: FaHCSIA Resource Statement – Budget Estimates for 2012-13 as at Budget May 2012 (continued) Third party payments from and on behalf of other agencies
Department of Human Services has the authority to make the following payments to customers on behalf of FaHCSIA:
Special appropriations—A New Tax System (Family Assistance)(Administration) Act 1999 20,173,888 20,774,692Special appropriations—Social Security (Administration) Act 1999 58,452,239 55,373,183Special appropriations—Paid Parental Leave Act 2010 1,426,951 1,359,294Annual appropriations—Ex-Gratia and Act of Grace Payments 3,762 5,829
Department of Veterans' Affairs has the authority to make the following payments to customers on behalf of FaHCSIA:
Special appropriations—Social Security (Administration) Act 1999 59,479 59,933Payments made to other agencies for the provision of services:
Australian Taxation Office 597 608Department of Human Services 9,114 9,277Department of Veterans' Affairs 195 199
Payments made to CAC Act bodies within the portfolio:Aboriginal Hostels Limited 38,520 38,481Indigenous Business Australia 71,855 72,093Indigenous Land Corporation 9,706 9,771Torres Strait Regional Authority 45,680 50,454
Note: All figures are GST exclusive.
2012–13$'000
2011–12$'000

FaHCSIA Budget Statements
1.3 Budget measures
Budget measures relating to FaHCSIA are detailed in Budget Paper No. 2 and are summarised below.
Table 1.2: Agency 2012-13 Budget measuresProgram 2011–12 2012–13 2013–14 2014–15 2015–16
$'000 $'000 $'000 $'000 $'000Expense measuresOutcome 1 – Families and ChildrenNational Children's Commissioner – establishment1 1.1
Administered expenses - (500) (500) (500) (500) Departmental expenses - - - - -
Total - (500) (500) (500) (500) Glen Innes Open Door Youth Centre – contribution2 1.1
Administered expenses 80 - - - - Departmental expenses - - - - -
Total 80 - - - - Spreading the Benefits of the Boom – increasing the rate of Family Tax BenefitPart A 1.2
Administered expenses - - 602,722 615,308 625,751 Departmental expenses - 255 156 115 55
Total - 255 602,878 615,423 625,806 Family Tax Benefit Part A – change to age of eligibility 1.2
Administered expenses - (57,525) (112,132) (112,910) (114,970) Departmental expenses - 739 59 27 28
Total - (56,786) (112,073) (112,883) (114,942) Replacing the Education Tax Refund w ith a Schoolkids Bonus 1.2
Administered expenses 1,324,135 1,262,978 1,217,274 1,249,067 1,284,123 Departmental expenses - 1,062 723 408 202
Total 1,324,135 1,264,040 1,217,997 1,249,475 1,284,325 Tripling the tax free threshold – Family Tax Benefit and the Commonw ealth Seniors Health Card 1.2
Administered expenses - - - - - Departmental expenses - 467 299 121 122
Total - 467 299 121 122
Outcome 2 – HousingJulia Creek, Queensland – seniors housing and community services2 2.1
Administered expenses 4,714 - - - - Departmental expenses - - - - -
Total 4,714 - - - - (continued on next page)

FaHCSIA Budget Statements
Table 1.2: Agency 2012-13 Budget measures (continued)Program 2011–12 2012–13 2013–14 2014–15 2015–16
$'000 $'000 $'000 $'000 $'000
Outcome 3 – Community Capability and the VulnerableTackling Problem Gambling – extra support for problem gamblers and their families 3.1
Administered expenses - 4,230 6,354 6,552 6,710 Departmental expenses - 584 549 474 479
Total - 4,814 6,903 7,026 7,189 Tackling Problem Gambling – trial of mandatory pre-commitment technology in the Australian Capital Territory2,3 3.1
Administered expenses nfp nfp nfp nfp nfpDepartmental expenses nfp nfp nfp nfp nfp
Total nfp nfp nfp nfp nfpIncome Management - extension 3.1
Administered expenses - 4,952 - - - Departmental expenses - 1,014 - - -
Total - 5,966 - - - School Enrolment and Attendance in Queensland – continuation 3.1
Administered expenses - - - - - Departmental expenses - 150 151 - -
Total - 150 151 - - Community Investment Program – reduction 3.2
Administered expenses - (2,000) - - - Departmental expenses - - - - -
Total - (2,000) - - - Spreading the Benefits of the Boom – new income support supplement4 3.3
Administered expenses - 228 465 477 488 Departmental expenses - - - - -
Total - 228 465 477 488
Outcome 5 – Disability and Carers
Migration Health Requirement – reforms5 5.3Administered expenses - 50 114 229 388 Departmental expenses - - - - -
Total - 50 114 229 388 Australian Disability Enterprises Sector – additional funding 5.4
Administered expenses - 10,265 13,299 16,572 19,434 Departmental expenses - - - - -
Total - 10,265 13,299 16,572 19,434 Services and Support for People w ith Disability program – Job Capacity Assessment efficiencies 5.4
Administered expenses - (5,000) - - - Departmental expenses - - - - -
Total - (5,000) - - - National Disability Insurance Scheme – First Stage6 5.6
Administered expenses - 29,841 80,673 169,950 211,575 Departmental expenses - 28,613 58,482 111,302 119,429
Total - 58,454 139,155 281,252 331,004 (continued on next page)

FaHCSIA Budget Statements
Table 1.2: Agency 2012-13 Budget measures (continued)Program 2011–12 2012–13 2013–14 2014–15 2015–16
$'000 $'000 $'000 $'000 $'000
Outcome 7 – IndigenousRemote Jobs and Communities Program – establishment4,7 7.1
Administered expenses - - (176,999) (180,929) (184,549) Departmental expenses - - (13,840) (13,954) (14,091)
Total - - (190,839) (194,883) (198,640) Remote Jobs and Communities Program – establishment of the Community Development Fund 7.1
Administered expenses - - 38,672 48,782 50,000 Departmental expenses - - - - -
Total - - 38,672 48,782 50,000
Municipal and Essential Services – extension 7.2Administered expenses - 42,301 - - - Departmental expenses - 1,049 - - -
Total - 43,350 - - - Stronger Futures in the Northern Territory – municipal and essential services in the Northern Territory – extension8 7.2
Administered expenses - (20,000) nfp nfp nfpDepartmental expenses - - nfp nfp nfp
Total - (20,000) nfp nfp nfpStronger Futures in the Northern Territory – healthy homes8 7.2
Administered expenses - - nfp nfp nfpDepartmental expenses - 1,489 nfp nfp nfp
Total - 1,489 nfp nfp nfpStronger Futures in the Northern Territory – improving Indigenous housing in the Northern Territory8 7.2
Administered expenses - (22,400) nfp nfp nfpDepartmental expenses - - nfp nfp nfp
Total - (22,400) nfp nfp nfp Cape York Welfare Reform Trial – extension 7.4
Administered expenses - 3,417 3,478 - - Departmental expenses - 244 246 - -
Total - 3,661 3,724 - - Cultural Horsemanship Program for Indigenous Youth2,10 7.4
Administered expenses - - - - - Departmental expenses - - - - -
Total - - - - - Constitutional Recognition of Indigenous Australians – community support11 7.4
Administered expenses - - - - - Departmental expenses - - - - -
Total - - - - - (continued on next page)

FaHCSIA Budget Statements
Table 1.2: Agency 2012-13 Budget measures (continued)Program 2011–12 2012–13 2013–14 2014–15 2015–16
$'000 $'000 $'000 $'000 $'000
Outcome 7 – Indigenous (continued)Stronger Futures in the Northern Territory – remote engagement and coordination6,8 7.5
Administered expenses - 1,240 nfp nfp nfpDepartmental expenses - 25,440 nfp nfp nfp
Total - 26,680 nfp nfp nfpStronger Futures in the Northern Territory – community safety and justice8 7.5
Administered expenses - 80 nfp nfp nfpDepartmental expenses - 681 nfp nfp nfp
Total - 761 nfp nfp nfpStronger Futures in the Northern Territory – tackling alcohol abuse12 7.5
Administered expenses - nfp nfp nfp nfpDepartmental expenses - nfp nfp nfp nfp
Total - nfp nfp nfp nfp
Cross–OutcomeSocial and Community Services – Queensland pay equity regulation – back pay2,4
Outcome 1 1.1Administered expenses 900 900 771 - - Departmental expenses - - - - -
Outcome 2 2.1, 2.2Administered expenses 173 173 148 - - Departmental expenses - - - - -
Outcome 3 3.1, 3.2Administered expenses 652 652 558 - - Departmental expenses - - - - -
Outcome 5 5.1, 5.4Administered expenses 5.5, 5.7 1,801 1,801 1,543 - - Departmental expenses - - - - -
Outcome 6 6.1Administered expenses 1 1 1 - - Departmental expenses - - - - -
Total 3,527 3,527 3,021 - - Household Assistance Package – information2
Outcome 1 1.1Administered expenses 4,591 4,296 - - - Departmental expenses 33 126 - - -
Outcome 3 3.1, 3.2Administered expenses - 8,679 - - - Departmental expenses - - - - -
Outcome 4 5.1, 5.4Administered expenses 5.5, 5.7 6,678 6,249 - - - Departmental expenses 50 178 - - -
Outcome 5 6.1Administered expenses 2,643 2,473 - - - Departmental expenses 18 78 - - -
Total 14,013 22,079 - - - (continued on next page)

FaHCSIA Budget Statements
Table 1.2: Agency 2012-13 Budget measures (continued)Program 2011–12 2012–13 2013–14 2014–15 2015–16
$'000 $'000 $'000 $'000 $'000
Cross–Outcome (continued)Digital Productivity – remote hearing and vision services for children – additional funding13,14
Outcome 1 1.1Administered expenses - - - - - Departmental expenses - - - - -
Outcome 5 5.4Administered expenses - - - - - Departmental expenses - - - - -
Total - - - - -
Stronger Futures in the Northern Territory – child, youth, family and community w ellbeing8
Outcome 1 1.1Administered expenses - 11,933 nfp nfp nfpDepartmental expenses - 1,154 nfp nfp nfp
Outcome 7 7.5Administered expenses - 2,247 nfp nfp nfpDepartmental expenses - 140 nfp nfp nfp
Total - 15,474 nfp nfp nfpPortability of Australian Government Payments
Outcome 1 1.2Administered expenses - (6,679) (13,575) (13,853) (14,133) Departmental expenses - 229 105 - -
Outcome 4 4.1Administered expenses - (113) (223) (216) (215) Departmental expenses - 117 56 - -
Outcome 5 5.2, 5.3Administered expenses - (9,519) (20,461) (21,863) (23,386) Departmental expenses - 229 105 - -
Total - (15,736) (33,993) (35,932) (37,734) Fraud prevention and compliance – increased recovery of high value non-current customer debt15,16
Outcome 1 1.2Administered expenses - - - - - Departmental expenses - - - - -
Outcome 4 4.1Administered expenses - - - - - Departmental expenses - - - - -
Outcome 5 5.2Administered expenses - - - - - Departmental expenses - - - - -
Total - - - - - (continued on next page)

FaHCSIA Budget Statements
Table 1.2: Agency 2012-13 Budget measures (continued)Program 2011–12 2012–13 2013–14 2014–15 2015–16
$'000 $'000 $'000 $'000 $'000
Cross–Outcome (continued)Weekly income support payments to vunerable Australians – expansion15
Outcome 3 3.3Administered expenses - - - - - Departmental expenses - - - - -
Outcome 4 4.1Administered expenses - - - - - Departmental expenses - - - - -
Outcome 5 5.2, 5.3Administered expenses - - - - - Departmental expenses - - - - -
Total - - - - - Fraud prevention and compliance – increase in compliance review activity16
Outcome 3 3.3Administered expenses - - - - - Departmental expenses - 112 113 57 -
Outcome 4 4.1Administered expenses - (14,323) (16,863) (10,983) (2,580) Departmental expenses - 82 83 41 -
Outcome 5 5.2, 5.3Administered expenses - (11,867) (13,916) (8,124) (1,152) Departmental expenses - 68 68 35 -
Total - (25,928) (30,515) (18,974) (3,732) Fraud prevention and compliance – increased compliance for international risk16
Outcome 4Administered expenses 4.1 - (25,805) (29,364) (25,027) (18,819) Departmental expenses - 45 15 15 15
Outcome 5 5.2Administered expenses - (338) (541) (258) (256) Departmental expenses - - - - -
Total - (26,098) (29,890) (25,270) (19,060) Fraud prevention and compliance – accelerated real estate review cycle16
Outcome 4Administered expenses 4.1 - (2,012) (13,761) (16,103) (16,721) Departmental expenses - 333 358 360 365
Outcome 5 5.2, 5.3Administered expenses - (602) (4,110) (4,810) (4,994) Departmental expenses - 6 12 12 12
Total - (2,275) (17,501) (20,541) (21,338) (continued on next page)

FaHCSIA Budget Statements
Table 1.2: Agency 2012-13 Budget measures (continued)Program 2011–12 2012–13 2013–14 2014–15 2015–16
$'000 $'000 $'000 $'000 $'000
Cross–Outcome (continued)Community Development Employment Projects (CDEP) program – continuation of grandfathered w age arrangements
Outcome 4 4.1Administered expenses (9) (217) (201) (197) (199) Departmental expenses - - - - -
Outcome 5 5.2, 5.3Administered expenses (40) (910) (843) (825) (836) Departmental expenses - - - - -
Outcome 7 7.1Administered expenses - 10,725 41,414 39,953 39,764 Departmental expenses - - - - -
Total (49) 9,598 40,370 38,931 38,729 Living Longer. Living Better – residential care17
Outcome 4Administered expenses 4.1, 4.2 - - - 8,996 25,118 Departmental expenses - - - - -
Outcome 5 5.2Administered expenses - - - 170 485 Departmental expenses - - - - -
Total - - - 9,166 25,603 Means test exemptions for the Western Australian Country Fuel Card and the Cost of Living Rebate Scheme – extension
Outcome 4Administered expenses 4.1 - 5,259 5,405 5,576 5,778 Departmental expenses - 38 - - -
Outcome 5 5.2, 5.3Administered expenses - 336 342 350 358 Departmental expenses - 2 - - -
Total - 5,635 5,747 5,926 6,136 Fraud prevention and compliance – new compliance data sources16
Outcome 4Administered expenses 4.1 - (897) (2,251) (2,802) (2,908) Departmental expenses - - - - -
Outcome 5 5.2Administered expenses - (897) (2,251) (2,674) (2,640) Departmental expenses - - - - -
Total - (1,794) (4,502) (5,476) (5,548) (continued on next page)

FaHCSIA Budget Statements
Table 1.2: Agency 2012-13 Budget measures (continued)Program 2011–12 2012–13 2013–14 2014–15 2015–16
$'000 $'000 $'000 $'000 $'000
Cross–Outcome (continued)Australian Working Life Residency – strengthening requirements
Outcome 4Administered expenses 4.1 - - (3,960) (19,616) (32,625) Departmental expenses - 510 296 139 18
Outcome 5 5.2Administered expenses - - (2) (11) (21) Departmental expenses - 89 49 21 -
Total - 599 (3,617) (19,467) (32,628)
Total expense measuresAdministered 1,346,319 1,233,702 1,601,280 1,740,281 1,848,468 Departmental 101 65,323 48,085 99,173 106,634
Total 1,346,420 1,299,025 1,649,365 1,839,454 1,955,102
Capital measuresOutcome 5 - Disability and CarersNational Disability Insurance Scheme – First Stage 5.6
Administered capital - - - - - Departmental capital - 25,400 95,138 64,138 32,000
Total - 25,400 95,138 64,138 32,000 Outcome 7 - IndigenousStronger Futures in the Northern Territory – remote engagement and coordination8 7.5
Administered capital - - nfp nfp nfpDepartmental capital - 2,229 nfp nfp nfp
Total - 2,229 nfp nfp nfp
Total capital measuresAdministered - - - - - Departmental - 27,629 95,138 64,138 32,000
Total - 27,629 95,138 64,138 32,000 Prepared on a Government Financial Statistics (fiscal) basis
2 This measure is also reported in the 2011-12 FaHCSIA Portfolio Supplementary Additional Estimates Statements.
6 This measure also includes capital funding w hich is included in the capital section of this table.7 This funding is being transferred to the Department of Education, Employment and Workplace Relations
9 Funding for this measure is being transferred to the Department of Treasury for the Stronger Futures in the
as part of the Remote Jobs and Communities program.
Northern Territory National Partnership.
Territory Government regarding the new Stronger Futures in the Northern Territory National Partnership Agreement.
3 Funding for this measure is not for publication.
Paper No.2 under the Immigration and Citizenship Portfolio.
1 This measure is led by the Attorney General's Department. Further details can be found in Budget Paper No. 2
under the Attorney General's Portfolio.
4 This measure is led by the Department of Education, Employment and Workplace Relations. Further details can be
found in 2012-13 Budget Paper No.2 under the Education, Employment and Workplace Relations Portfolio. 5 This measure is led by the Department of Immigration and Citizenship. Further details can be found in 2012-13 Budget
10 The cost of this measure, $75,000 (administered) in 2011-12, w ill be met from existing resources.
8 Funding for this measure from 2013-14 onw ards w ill be f inalised follow ing negotiations w ith the Northern
(continued on next page)

FaHCSIA Budget Statements
Table 1.2: Agency 2012-13 Budget measures (continued)
12 This measure w as previously announced as part of the 2011-12 Mid-Year Economic and Fiscal Outlook.
11 The total cost of this measure, $10.0m over tw o years, w ill be met from w ithin existing resources.
under the Human Services Portfolio.
under the Health and Ageing Portfolio.
13 This measure has been previously reported in the 2011-12 FaHCSIA Portfolio Additional Estimates Statements.14 Funding for this measure has already been included in the forw ard estimates.
17 This measure is led by the Department of Health and Ageing. Further details can be found in 2012-13 Budget Paper No.2
15 This measure has no f iscal impact on FaHCSIA.
Funding for this measure w ill be f inalised follow ing negotiations w ith the Northern Territory Government in relation to the new Stronger Futures in the Northern Territory National Partnership Agreement.
16 This measure is led by the Department of Human Services. Further details can be found in 2012-13 Budget Paper No.2

FaHCSIA Budget Statements
Section 2: Outcomes and planned performance
2.1 Outcomes and performance information
Government outcomes are the intended results, impacts or consequences of actions by the Government on the Australian community. Commonwealth payments and programs are the primary vehicle by which government agencies achieve the intended results of their outcome statements. Agencies are required to identify the programs that contribute to government outcomes over the Budget and forward years.Each outcome is described below, together with its related programs, which specify the performance indicators and targets used to assess and monitor the performance of FaHCSIA in achieving government outcomes.
Outcome 1: Families and ChildrenImproved child development, safety and family functioning through support services for all Australians, payments for low and medium income families with children and child support policy.
Outcome 1 strategy
FaHCSIA's programs and payments for families deliver assistance to families as well as targeting vulnerable and at-risk families and children. There is a particular focus on supporting families during major transitions in their lives. Assistance provided includes support for both parents to be at home with their new baby; parenting (particularly during early childhood but also to support families with older children so they can finish school or training); and assistance with family relationship problems and separation.The Family Support Program provides a suite of services to support families to improve children's wellbeing, development and safety, and to enhance family functioning. The reformed Family Support Program, which came into effect from 1 July 2011, ensures that vulnerable children and families receive support.The payment of Family Tax Benefit (FTB) Part A reduces financial stress by providing a significant contribution to assist low- and medium-income families with the costs of raising children. FTB Part B assists with the costs incurred by single parents and families with one main income earner. The Government’s Household Assistance Package will help families adjust to the introduction of a carbon price through increases to government payments and tax cuts. From May 2012, an initial household assistance payment will be delivered to Family Tax Benefit recipients to cover the 12-month period from the introduction of the carbon price on 1 July 2012. From 1 July 2013, FTB recipients will receive ongoing household assistance with their regular payment.

FaHCSIA Budget Statements
From 1 January 2013, low- and medium-income families will receive a new bonus payment for each primary and high school student in school. This new payment will replace the Education Tax Refund, and will be provided up front twice a year in January and July to families with children in school and receiving Family Tax Benefit Part A and those over 16 receiving certain income support and veterans’ payments.From 1 July 2013, families will also receive an increase in Family Tax Benefit Part A to help with cost of living pressures as part of the Benefits of the Boom package. The maximum rate of Family Tax Benefit Part A will increase by $300 per year for families with one child and by $600 per year for families with two or more children. The base rate of Family Tax Benefit Part A will increase by $100 per year for families with one child and by $200 per year for families with two or more children. Over 1.5 million families who are paid Family Tax Benefit Part A will receive an increase in their payments from 1 July 2013.For teenagers who have already completed secondary or equivalent education, the maximum age of eligibility for Family Tax Benefit Part A will be lowered from 21 to 17 years from 1 January 2013. For teenagers still in secondary or equivalent education, FTB Part A will still be available up to the end of the calendar year they turn 19.This year the Australian Government will expand the Paid Parental Leave scheme to include a dedicated, two-week payment for fathers and partners – Dad and Partner Pay – from 1 January 2013. The Stronger Futures in the Northern Territory child, youth, family and community wellbeing’ package aims to strengthen services that support the safety and wellbeing of children, young people and their families in remote Indigenous communities in the Northern Territory. The package will encourage local Indigenous organisations to deliver services and provide opportunities for Indigenous employment. Further information on Stronger Futures in the Northern Territory is under Outcome 7.The National Framework for Protecting Australia’s Children 2009–20 and the National Plan to Reduce Violence against Women and their Children 2010–22, under Outcome 6, also contribute to the safety and wellbeing of families and children.
Outcome Expense Statement
Table 2.1 provides an overview of the total expenses for Outcome 1, by program.

FaHCSIA Budget Statements
Table 2.1: Budgeted Expenses for Outcome 1Outcome 1: Families and Children
Program 1.1: Family SupportAdministered expenses
Ordinary annual services (Appropriation Bill No. 1) 299,712 141,651Special Accounts 250 -
Departmental expensesDepartmental appropriation 1 59,702 56,827
Expenses not requiring appropriation in the Budget year 2 5,381 5,069
Total for Program 1.1 365,045 203,547Program 1.2: Family Tax BenefitAdministered expenses
Ordinary annual services (Appropriation Bill No. 1) 4,591 12,796Special Appropriations 19,898,720 19,877,194
Departmental expensesDepartmental appropriation 1 10,873 12,879
Expenses not requiring appropriation in the Budget year 2 980 1,149
Total for Program 1.2 19,915,164 19,904,018Program 1.3: Parent and Baby PaymentsAdministered expenses
Ordinary annual services (Appropriation Bill No. 1) 1,233 2,647Special Appropriations 2,330,286 2,351,512
Departmental expensesDepartmental appropriation 1 8,085 7,958
Expenses not requiring appropriation in the Budget year 2 729 710
Total for Program 1.3 2,340,333 2,362,827
Outcome 1 Totals by appropriation typeAdministered expenses
Ordinary annual services (Appropriation Bill No. 1) 305,536 157,094Special Appropriations 22,229,006 22,228,706Special Accounts 250 -
Departmental expensesDepartmental appropriation 1 78,660 77,664
Expenses not requiring appropriation in the Budget year 2 7,090 6,928
Total expenses for Outcome 1 22,620,542 22,470,392
2011–12 2012–13Average Staffing Level (number) 541 557
Note: Departmental appropriation splits and totals, by outcome and program, are indicativeestimates and may change in the course of the Budget year as government priorities change.1 Departmental appropriation combines 'Ordinary annual services (Appropriation Bill No. 1)' and 'Revenue from independent sources (s31)'.2 'Expenses not requiring appropriation in the Budget year' is made up of Depreciation, Amortisation and Makegood Expenses.
2011–12Estimated
actualexpenses
$'000
2012–13Estimatedexpenses
$'000

FaHCSIA Budget Statements
Contributions to Outcome 1: Families and Children
Program 1.1: Family Support
Program 1.1 Objective
The Family Support Program is a suite of services to support families, to improve children’s wellbeing, development and safety and to enhance family functioning. The reformed Family Support Program, which came into effect from 1 July 2011, provides increased support to vulnerable children and families, promotes collaboration, and reduces red tape for service providers. Program Component ObjectivesFamily and Children Services
To provide services to families, particularly those who are vulnerable, disadvantaged or live in disadvantaged communities, to improve family functioning and safety, and child wellbeing and development.Find and Connect Services
To improve the lives of Forgotten Australians and Former Child Migrants through the provision of records and family tracing and professional counselling services. Linked to: The policy responsibility for Family Law Services resides with the Attorney-General’s Department (AGD). For more information refer to AGD’s 2012–13 PB Statements.
Program 7.5: Stronger Futures in the Northern Territory.

FaHCSIA Budget Statements
Program 1.1 ExpensesThe increase in program expenses across the forward years reflects the impact of policy initiatives and, in particular, the introduction of the Stronger Futures in the Northern Territory child, youth, family, and community wellbeing package in 2012–13.
Table 2.1.1: Budgeted Expenses for Family Support
Annual administered expenses:Find and Connect Service 7,173 6,683 4,708 4,468 4,468Family Support1 292,539 134,968 215,751 217,336 221,560
Special Account Expenses:Other Services - Services for OtherEntities and Trust Moneys 250 - - - -
Program support 59,702 56,827 55,900 53,720 54,536Expenses not requiring appropriation in
the Budget year2 5,381 5,069 4,849 4,697 5,114Total program expenses 365,045 203,547 281,208 280,221 285,678
Note: Departmental appropriation splits and totals, by outcome and program, are indicativeestimates and may change in the course of the Budget year as government priorities change.1 Family Support includes the impact of Stronger Futures in the Northern Territory initiatives in
2012-13 only. The Stronger Futures in the Northern Territory initiative is a ten year commitment.
Estimates from 2013-14 onw ards w ill be f inalised follow ing negotiations w ith the Northern Territory
Government regarding the Stronger Futures NPA.2 'Expenses not requiring appropriation in the Budget year' is made up of Depreciation, Amortisation and Makegood Expenses.
2011–12Revisedbudget
$'000
2012–13Budget
$'000
2013–14Forw ard
year 1$'000
2014–15Forw ard
year 2$'000
2015–16Forw ard
year 3$'000
Program 1.1 DeliverablesFamily and Children Services Number of clients assisted
Family and Children Services Deliverables TargetsDeliverables 2011-12
Revised Budget
2012-13 Budget
2013-14 Forward
year 1
2014-15 Forward
year 2
2015-16 Forward
year 3
Number of clients assisted 750,000 755,000 755,000 755,000 755,000

FaHCSIA Budget Statements
Program 1.1 Key Performance Indicators Percentage of clients reporting improved child wellbeing and
development, safety and family functioning Percentage of clients with increased knowledge and skills related to child
wellbeing and development, safety or family functioning Percentage of clients satisfied with the assistance received Percentage of clients assisted from priority groups Percentage of service sites in disadvantaged or targeted communities2
Program 1.1 Key Performance IndicatorsKey Performance Indicators 2011-12
Revised budget
2012-13 Budget
target
2013-14 Forward
year 1
2014-15 Forward
year 2
2015-16 Forward
year 3
Percentage of clients reporting improved child wellbeing and development, safety and family functioning and community connectedness/social inclusion
70% 70% 70% 70% 70%
Percentage of clients satisfied with the assistance received3
80% 80% 80% 80% 80%
Percentage of clients assisted from priority groups
ATSI 8%CALD 9%
ATSI 9%CALD 10%
ATSI 10%CALD 11%
ATSI 11%CALD 12%
ATSI 12% CALD 13%
Percentage of service sites in the most disadvantaged or targeted communities
75% 75% 75% 75% 75%
Note: ATSI = Aboriginal and Torres Strait Islander persons.
CALD = Culturally and Linguistically Diverse background persons.
2 The wording of the KPI has been amended, as the previous wording reflected a restricted definition of the FSP’s intended coverage. The FSP provides increased support to families and children in all disadvantaged communities, regardless of the level of disadvantage.3 KPI targets have been included as all FSP service providers have to report percentages related to this KPI from July 2012.

FaHCSIA Budget Statements
Program 1.2: Family Tax Benefit
Program 1.2 Objective To make payments to assist low- and medium-income families with the direct and indirect costs of raising dependent children.Program Component Objectives
Family Tax Benefit Part A
To make payments to assist low- and medium-income families with the costs of raising dependent children. This supports better family functioning by improving the financial wellbeing of low- and medium-income families with children.Family Tax Benefit Part B
To make payments to assist low- and medium-income single parents, and partnered parents where one income is low, to enable families to exercise choices to balance labour force participation and child care responsibilities.Child Support Scheme
To ensure that children from separated families continue to receive financial support from their parents.Schoolkids Bonus
To deliver assistance to low- and medium-income families for their children’s education costs.To deliver assistance to families for school costs, in place of the current Education Tax Refund (ETR), for 2011–12, for families eligible on 8 May 2012. To enable payment to a person who is not entitled to a statutory payment on 8 May 2012 but would have been entitled to the current Education Tax Refund for 2011–12.Linked to: Personal benefits payments under this program will be delivered by the Department of Human Services (DHS). For more information refer to DHS’s 2012-13 PB Statements.

FaHCSIA Budget Statements
Program 1.2 ExpensesThe increase in program expenses across the forward years reflects projected changes in the economy, customer trends, indexation parameters and the impact of policy initiatives.The impact of policy initiatives includes the Household Assistance Package to assist households meet additional costs under a carbon price, increases in Family Tax Benefit Part A for families with teenagers in school, and the new Schoolkids Bonus.
Table 2.1.2: Budgeted Expenses for Family Tax Benefit
Annual administered expenses:Schoolkids Bonus - Communication Campaign - 8,500 3,500 - -Helping Households - Communication Campaign 4,591 4,296 - - -
Special Appropriations:A New Tax System (Family Assistance)(Administration)Act 1999
Family Tax Benefit Part A 13,970,791 14,081,376 14,939,641 15,312,742 15,672,742Family Tax Benefit Part B 4,603,794 4,541,340 4,721,569 4,871,853 4,984,592Schoolkids Bonus 1,324,135 1,254,478 1,213,774 1,249,067 1,284,123
Program support 10,873 12,879 12,257 11,183 11,732Expenses not requiring appropriation in
the Budget year 1 980 1,149 1,063 978 1,100
Total program expenses 19,915,164 19,904,018 20,891,804 21,445,823 21,954,289Note: Departmental appropriation splits and totals, by outcome and program, are indicativeestimates and may change in the course of the Budget year as government priorities change.1 'Expenses not requiring appropriation in the Budget year' is made up of Depreciation, Amortisation and Makegood Expenses.
2011–12Revisedbudget
$'000
2012–13Budget
$'000
2013–14Forw ard
year 1$'000
2014–15Forw ard
year 2$'000
2015–16Forw ard
year 3$'000

FaHCSIA Budget Statements
Program 1.2 Deliverables
Payments are made through the Department of Human Services to eligible claimants under the provisions of family assistance law.
The Child Support Scheme is administered by the Department of Human Services under the provisions of the Child Support legislation.

FaHCSIA Budget Statements
Program 1.2 Key Performance Indicators
Family Tax Benefit Part A Total number of eligible customers Proportion of all customers paid by instalment Proportion of all customers paid by lump sum Proportion and amount of administered outlays paid by instalment and
by lump sum Percentage of all customers who had a qualification debt raised Percentage of all customers who had a debt raised following
reconciliation Percentage of all customers who had a non-lodger debt raised Agreements are in place with the Department of Human Services Strategies are in place to ensure that requirements are fulfilled under the
agreement with the Department of Human Services4
Payment accuracy Percentage and number of families with children under 16 years of age
receiving FTB Part A Percentage and number of families in receipt of FTB Part A within income
test categories Percentage and number of children vaccinated to the highest level
appropriate for their age in the Australian community5
Family Tax Benefit Part B Total number of eligible customers Proportion of all customers paid by instalment Proportion of all customers paid by lump sum Proportion and amount of administered outlays paid by instalment and
by lump sum Percentage of all customers who had a qualification debt raised Percentage of all customers who had a debt raised following
reconciliation Percentage of all customers who had a non-lodger debt raised
4 From 1 July 2012, the service delivery arrangements with Centrelink and Medicare Australia were integrated into a signed agreement with DHS.5 Eligibility for Maternity Immunisation Allowance closes on 30 June 2012. However, eligible families can continue to claim the allowance for children immunised prior to 1 July 2012. From 1 July 2012, immunisation at ages one, two and five will be linked to FTB Part A.

FaHCSIA Budget Statements
Program 1.2 Key Performance Indicators (continued) Family Tax Benefit Part B (continued) Agreements are in place with the Department of Human Services Strategies are in place to ensure that requirements are fulfilled under the
agreement with the Department of Human Services 6
Payment accuracy Percentage and number of families with children under 16 years of age
receiving FTB Percentage and number of families in receipt of FTB Part B within income
test categoriesChild Support Scheme7
Number of cases Total value of annual assessments Total value of child support assessments raised using agency collect in
the past financial year and percentage collected Reduction of Family Tax Benefit as a result of the maintenance income
test Agreements are in place with the Department of Human Services Strategies are in place to ensure that requirements are fulfilled under the
agreement with the Department of Human ServicesSchoolkids Bonus Number of recipients Administered outlays
6 From 1 July 2012, the service delivery arrangements with Centrelink and Medicare Australia were integrated into a signed agreement with DHS.7 New key performance indicators have been added in relation to the Child Support Scheme for 2012–13.

FaHCSIA Budget Statements
Program 1.3: Parent and Baby Payments
Program 1.3 Objective To make payments to families to assist with the costs of a newborn or adopted child, extend the period that parents can be away from work to spend time with their child and encourage all families to fully immunise their children.Program Component Objectives
Paid Parental Leave scheme
To provide financial support for working parents of newborn or adopted children to facilitate time off work to care for their child, enhance maternal and child wellbeing, encourage women’s workforce participation and promote gender equity and work–life balance.Baby Bonus
To make payments to families to assist with the costs arising from the birth or adoption of a child.Maternity Immunisation Allowance8
To make payments to encourage families to fully immunise their natural and adopted children in accordance with Australian standards. (This supports improved child development and safety in all families by impeding the spread of infectious diseases within the Australian community.)Double Orphan Pension
To make non–means-tested payments to guardians or approved care organisations to assist in meeting the costs of dependent children who are double orphans.Linked to: Personal benefits payments under this program are to be delivered by DHS. For more information refer to DHS’s 2012–13 PB Statements.Immunisation is the responsibility of the Department of Health and Ageing (DHA). For information about this program, refer to DHA’s 2012–13 PB Statements.
8 Eligibility for Maternity Immunisation Allowance closes on 30 June 2012. However, eligible families can continue to claim the allowance for children immunised prior to 1 July 2012. From 1 July 2012, immunisation at ages one, two and five will be linked to FTB Part A.

FaHCSIA Budget Statements
Program 1.3 ExpensesThe increase in program expenses across the forward years reflects projected changes in the economy, customer trends, indexation parameters and the impact of policy initiatives.The increase in Paid Parental Leave (PPL) scheme expenses from 2012–13 reflects the provision for payments of Dad and Partner Pay from 1 January 2013, subject to the passage of legislation.The expense for PPL communications and evaluation includes funding for the evaluation of the PPL scheme, to be completed by 2014.The Single Income Family Supplement, part of the Government’s Clean Energy Future plan, starts on 1 July 2012. The Maternity Immunisation Allowance closes on 30 June 2012.
Table 2.1.3: Budgeted Expenses for Parental Payments and Care Incentives
Annual administered expenses:Paid Parental Leave -communication and evaluation 1,233 2,647 3,378 - -
Special Appropriations:A New Tax System (Family Assistance)(Administration)Act 1999
Baby Bonus 882,062 851,674 830,448 832,193 877,927Maternity Immunisation Allow ance 71,323 - - - -
Paid Parental Leave Act 2010Paid Parental Leave1 1,373,565 1,440,072 1,548,543 1,616,178 1,678,880
Social Security (Administration) Act 1999
Double Orphan Pension 3,336 3,535 3,708 3,871 4,057Single Income Family Supplement - 56,231 55,712 55,439 55,167
Program support 8,085 7,958 7,160 6,488 7,480Expenses not requiring appropriation in
the Budget year 2 729 710 621 567 701
Total program expenses 2,340,333 2,362,827 2,449,570 2,514,736 2,624,212Departmental appropriation splits and totals, by outcome and program, are indicativeestimates and may change in the course of the Budget year as government priorities change.1 Dad and Partner Pay is proposed to be paid under the Paid Parental Leave Act 2010 w hen amendments are passed.2 'Expenses not requiring appropriation in the Budget year' is made up of Depreciation, Amortisation and Makegood Expenses.
2011–12Revisedbudget
$'000
2012–13Budget
$'000
2013–14Forw ard
year 1$'000
2014–15Forw ard
year 2$'000
2015–16Forw ard
year 3$'000

FaHCSIA Budget Statements
Program 1.3 Deliverables Baby Bonus is paid through DHS to eligible parents under the provisions
of family assistance law Double Orphan Pension is paid through DHS to eligible families under the
provisions of social security law DHS either funds employers to provide Parental Leave Pay to eligible
employees, or provides Parental Leave Pay directly to eligible parents and other persons, according to the provisions of the Paid Parental Leave Act 2010. Dad and Partner Pay is proposed to be paid by DHS directly to eligible fathers and other partners in accordance with amended provisions of the Paid Parental Leave Act.

FaHCSIA Budget Statements
Program 1.3 Key Performance Indicators9 Parental Leave Pay (PLP) Percentage and number of mothers for whom PLP has been paid as a
proportion of all mothers in the same year Percentage and number of parents paid government-funded PLP by
employers Percentage and number of families who have taken the full 18 weeks of
PLPDad and Partner Pay (DAPP) Percentage and number of dads and other partners who have taken the
full two weeks of DAPPBaby Bonus Percentage and number of children for whom Baby Bonus is paid as a
proportion of all children born in the same year Number of recipients Administered outlays Payment accuracy Agreements are in place with all service delivery agencies Strategies are in place to ensure that requirements are fulfilled under
agreements with service delivery agencies
9 Eligibility for Maternity Immunisation Allowance closes on 30 June 2012. However, eligible families can continue to claim the allowance for children immunised prior to 1 July 2012. From 1 July 2012, immunisation at ages one, two and five will be linked to FTB Part A.

FaHCSIA Budget Statements
Outcome 2: HousingAccess to affordable, safe housing through: payments and support services; and rental subsidies to low and moderate income households.
Outcome 2 Strategy
Access to safe, stable and affordable housing, together with integrated access to other services, helps people to achieve more sustainable living arrangements and positive life transitions, contributes to their opportunities for social and economic participation and provides crucial help for vulnerable people, including those leaving child protection, domestic violence or health support services.FaHCSIA has whole-of-government oversight of social and affordable housing policy at the Commonwealth level and works in partnership with states and territories to improve housing outcomes for Australians. The states and territories are funded for public housing and community housing under the National Affordable Housing Agreement. Rent Assistance payments help to make rental housing costs more affordable for eligible people who receive income support or family payments. (Payments made under the Council of Australian Governments (COAG) National Agreements are made by the Department of the Treasury. Performance indicators in relation to COAG agreements can be found at www.federalfinancialrelations.gov.au.)FaHCSIA will continue to work with states and territories to finalise the delivery of social and affordable housing dwellings being delivered through the Nation Building – Economic Stimulus Plan and the National Partnership Agreement on Social Housing.FaHCSIA’s housing programs also assist in increasing the supply of affordable housing and rental housing available to households on low and moderate incomes. The Housing Affordability Fund (HAF) helps to reduce the costs of new homes for homebuyers by contributing to holding costs and infrastructure costs. The Building Better Regional Cities (BBRC) initiative will support some high-growth regional cities with investments in local infrastructure projects that will enable more affordable homes to be built. The National Rental Affordability Scheme (NRAS) offers financial incentives to the business sector and community organisations to build new dwellings for rent to low- and moderate-income households at rates that are at least 20 per cent below local market rates.FaHCSIA is also responsible for a range of initiatives to address homelessness and leads whole-of-government efforts to achieve the Government's homelessness reduction targets. Much of this work is done in partnership with states and territories under the National Affordable

FaHCSIA Budget Statements
Housing Agreement and the National Partnership Agreement on Homelessness.The Government is also working with the states and territories through the National Partnership Agreement Supporting National Mental Health Reform to help break the cycle of homelessness among people suffering from severe mental health conditions. A National Homelessness Research Agenda is helping to ensure that policy and services to reduce homelessness are underpinned by a strong evidence base. Projects are designed to inform policy and drive service-delivery improvements for homeless people and those at risk of homelessness and include:• Journeys Home: Longitudinal Study of Factors Affecting Housing Stability,
which will improve understanding of the diverse social, economic and personal factors that may lead to homelessness
• research partnerships established with the University of Queensland, Flinders University of South Australia and Swinburne University of Technology designed to improve understanding of the pathways into and out of homelessness
• sixteen research projects, involving a range of research institutions, which include service-provider perspectives.
Outcome Expense Statement
Table 2.2 provides an overview of the total expenses for Outcome 2, by program.

FaHCSIA Budget Statements
Table 2.2: Budgeted Expenses for Outcome 2Outcome 2: Housing
Program 2.1: Housing Assistance and HomelessnessPreventionAdministered expenses
Ordinary annual services (Appropriation Bill No. 1) 35,916 33,605Departmental expenses
Departmental appropriation 1 25,425 26,472Expenses not requiring appropriation in the Budget year 2 2,292 2,361
Total for Program 2.1 63,633 62,438
Program 2.2: Affordable HousingAdministered expenses
Ordinary annual services (Appropriation Bill No. 1) 135,316 186,443Other services (Appropriation Bill No. 2) 30,000 35,000
Departmental expensesDepartmental appropriation 1 2,386 6,078
Expenses not requiring appropriation in the Budget year 2 215 542
Total for Program 2.2 167,917 228,063
Outcome 2 Totals by appropriation type:Administered expenses
Ordinary annual services (Appropriation Bill No. 1) 171,232 220,048Other services (Appropriation Bill No. 2) 30,000 35,000
Departmental expensesDepartmental appropriation 1 27,811 32,550
Expenses not requiring appropriation in the Budget year 2 2,507 2,903
Total expenses for Outcome 2 231,550 290,501
2011-12 2012-13Average Staffing Level (number) 183 199
Note: Departmental appropriation splits and totals, by outcome and program, are indicativeestimates and may change in the course of the Budget year as government priorities change.1 Departmental Appropriation combines 'Ordinary annual services (Appropriation Bill No. 1)' and 'Revenue from independent sources (s31)'.2 'Expenses not requiring appropriation in the Budget year' is made up of Depreciation, Amortisation and Makegood Expenses.
2011–12Estimated
actualexpenses
$'000
2012–13Estimatedexpenses
$'000

FaHCSIA Budget Statements
Contributions to Outcome 2: Housing
Program 2.1: Housing Assistance and Homelessness Prevention
Program 2.1 Objective To provide rental subsidies for low- and moderate-income households, and to fund homelessness prevention initiatives to reduce the impact of homelessness.Program Component ObjectivesHomelessness Prevention
To provide funding to support innovative prevention and early intervention initiatives to reduce homelessness and its impact, particularly on families and young people.Rent Assistance
To make payments to low- and moderate-income Australians receiving income support or family payments to assist with the costs of renting private and community housing.Linked to: Payments under the National Affordable Housing Agreement, the National Partnership Agreement on Homelessness and the National Partnership Agreement on Remote Indigenous Housing are made by the Commonwealth Department of the Treasury. For information about those payments, refer to the Treasury’s 2012–13 PB Statements and Budget Paper No 3, Australia’s Federal Relations.
Rent Assistance paid with income support payments and Family Tax Benefit is delivered by DHS. For information about the delivery of Rent Assistance refer to DHS 2012–13 PB Statements.
Rent Assistance paid with Service Pension is delivered by the Department of Veterans’ Affairs (DVA). For Rent Assistance paid under the Veterans’ Entitlement Act 1986 refer to DVA’s 2012–13 PB Statements.

FaHCSIA Budget Statements
Program 2.1 ExpensesThe change in program expenses across the forward estimates reflects projected changes in indexation parameters and the impact of policy initiatives.
Table 2.2.1: Budgeted Expenses for Housing Assistance and Homelessness Prevention
Annual administered expenses:Housing Assistance andHomelessness Prevention 35,916 33,605 31,476 31,615 32,343
Program support 25,425 26,472 25,668 25,123 23,770Expenses not requiring appropriation in
the Budget year 1 2,292 2,361 2,227 2,197 2,229
Total program expenses 63,633 62,438 59,371 58,935 58,342Note: Departmental appropriation splits and totals, by outcome and program, are indicativeestimates and may change in the course of the Budget year as government priorities change.1 'Expenses not requiring appropriation in the Budget year' is made up of Depreciation, Amortisation and Makegood Expenses.
2011–12Revisedbudget
$'000
2012–13Budget
$'000
2013–14Forw ard
year 1$'000
2014–15Forw ard
year 2$'000
2015–16Forw ard
year 3$'000

FaHCSIA Budget Statements
Rent Assistance cash projections
Rent Assistance is not a discrete sum of money separately payable under the law but is a supplementary payment included in the calculation of the primary income support payment (e.g. Age Pension or Parenting Payment) or FTB.
The following table provides cash forecasts for the Rent Assistance component included in the primary income support payment or FTB.
Table 2.2.1.2: Cash Projections for Rent Assistance2011–12 2012–13
$ $ FAHCSIA: A New Tax System (Family Assistance) (Administration) Act 1999 Family Tax Benefit Part A 1,511,752 1,573,240FAHCSIA: Social Security (Administration) Act 1999 Age Pension 521,350 547,522 Bereavement Allow ance 78 82 Carer Payment 59,796 64,415 Disability Support Pension 563,426 572,734 Special Benefit 4,459 4,046 Widow B Pension 6 7 Wife Pension (Age) 1,167 1,021 Wife Pension (DSP) 1,457 1,161DEEWR: Social Security (Administration) Act 1999 Austudy 37,540 44,401 New start Allow ance 392,050 437,541 Parenting Payment (Single) 15,818 14,316 Parenting Payment (Partnered) 732 322 Partner Allow ance 203 104 Sickness Allow ance 5,612 5,344 Widow Allow ance 18,747 17,336 Youth Allow ance 191,020 210,991DEEWR: Abstudy (Student Assistance Act 1973) 12,821 13,772DVA: Veterans' Entitlements Act 1986 1 18,304 17,066Total cash forecasts - whole-of-government 3,356,338 3,525,4211 Rent Assistance is paid to eligible service pension and income support supplement recipients

FaHCSIA Budget Statements
Program 2.1 Deliverables
Homelessness Prevention Number of cases where individuals/families are assisted through
homelessness prevention servicesRent Assistance Rent Assistance payments are made through DHS to eligible claimants
under the provisions of social security law and family assistance law
Homelessness Prevention Deliverables TargetsDeliverables 2011-12
Revised target
2012-13 Budget
2013-14 Forward
year 1
2014-15 Forward
year 2
2015-16 Forward
year 3
Number of cases where individuals are assisted through homelessness prevention services
5,500 5,500 5,500 5,500
Numbers of cases where families are assisted through homelessness prevention services
400 400 400 400

FaHCSIA Budget Statements
Program 2.1 Key Performance IndicatorsHomelessness Prevention Proportion of clients reporting an improved situation after assistance
from homelessness prevention programsRent Assistance Proportion of Rent Assistance recipients in rental stress before and after
receiving Rent Assistance Proportion of Rent Assistance recipients paying enough rent to receive
the maximum rate of assistance Proportion of clients assisted who identify as Aboriginal or Torres Strait
Islander Average rent paid by Rent Assistance recipients by number of recipients,
primary payment type and income unit type Average Rent Assistance paid to Rent Assistance recipients by number of
recipients, primary payment type and income unit type Administered outlays Number of recipients

FaHCSIA Budget Statements
Program 2.2: Affordable Housing
Program 2.2 Objective To improve the supply of affordable housing available to low- and
moderate- income households. To improve the supply of affordable rental housing. To inform decision making by governments, the private sector and
individuals.Program Component ObjectivesNational Rental Affordability Scheme The National Rental Affordability Scheme (NRAS) offers financial incentives to the business sector and community organisations to build and rent dwellings to low- and moderate-income households, at a rate that is at least 20 per cent below market rates. The scheme aims to: increase the supply of new affordable rental housing reduce rental costs for low- and moderate-income households encourage large-scale investment and innovative affordable housing.The Australian Government is committed to stimulating the construction of up to 50,000 new, affordable rental dwellings. This will see a total of 35,000 dwellings delivered by 30 June 2014, with the remaining 15,000 dwellings delivered in 2015–16, providing affordable private rental properties for Australians and their families.Housing Affordability Fund
The Housing Affordability Fund (HAF) reduces the cost of new homes for homebuyers. The funding is directed towards two barriers to increasing the supply of affordable housing: the ‘holding’ costs incurred by developers as a result of long planning
and approval times infrastructure costs, such as water, sewerage, roads, open space and
community facilities.The HAF provides grants to state, territory and local governments to work in conjunction with the private sector to reduce housing-related infrastructure and planning costs, and to pass savings on to new home buyers. Two funding rounds have been conducted and program funding is now fully committed.

FaHCSIA Budget Statements
Program Component Objectives (continued)Building Better Regional Cities The Building Better Regional Cities (BBRC) program is a three-year commitment by the Australian Government to invest in local infrastructure projects that will support an increased number of affordable homes in high-growth regional cities. Grants are provided to local governments for local infrastructure projects that support new housing developments, including connecting roads, extensions to drains and sewers, and community infrastructure such as parks and community centres.
Program 2.2 ExpensesThe estimates for the Housing Affordability Fund show that it ceases in 2013–14.The NRAS provides a National Rental Incentive to the business sector and community organisations to build and rent dwellings to low- and moderate-income households at 20 per cent or more below market rent rates. The variation in program expenses across forward years is due to an adjustment to the implementation phasing of the existing scheme and the revision of the original budget assumptions. The incentive is delivered through either incentive payments or refundable tax offsets. The NRAS refundable tax offsets are delivered through the Australian Taxation Office and are not part of the FaHCSIA Budget. The change in expenses across the financial years reflects the projected take-up by investors.The Building Better Regional Cities Local Government Authority estimates present this initiative's three-year funding.
Table 2.2.2: Budgeted Expenses for Affordable Housing
Annual administered expenses:Housing Affordability Fund 107,911 101,250 - - -National Rental Affordability Scheme 27,405 85,193 124,230 137,981 162,266Building Better Regional Cities LGA 30,000 35,000 35,000 - -
Program Support 2,386 6,078 2,948 2,759 2,657Expenses not requiring appropriation in
the Budget year 1 215 542 256 241 249
Total program expenses 167,917 228,063 162,434 140,981 165,172
Note: Departmental Appropriation splits and totals, by outcome and program, are indicativeestimates and may change in the course of the Budget year as government priorities change.1 'Expenses not requiring appropriation in the Budget year' is made up of Depreciation, Amortisation and Makegood Expenses.
2011–12Revisedbudget
$'000
2012–13Budget
$'000
2013–14Forw ard
year 1$'000
2014–15Forw ard
year 2$'000
2015–16Forw ard
year 3$'000

FaHCSIA Budget Statements
Program 2.2 Deliverables
National Rental Affordability Scheme
Allocate incentives for the NRAS in accordance with statutory criteria so NRAS dwellings are made available at reduced rents for eligible low- and moderate-income households.Housing Affordability Fund
Effectively manage the HAF to support quality projects that help lower the cost of building new housing, improve supply and make housing more affordable.Building Better Regional Cities
Effectively manage the BBRC program to support quality projects that help lower the cost of building new housing, improve supply and make housing more affordable.
Affordable Housing Deliverables Targets
Deliverables2011-12 Revised Budget
$’000
2012-13 Budget
$’000
2013-14 Forward
year 1$’000
2014-15 Forward
year 2$’000
2015-16 Forward
year 3$’000
NRASAllocate incentives for the NRAS in accordance with statutory criteria so NRAS dwellings are made available at reduced rents for eligible low- and moderate-income households.
27,405 92,193 124,230 137,981 162,266
HAFEffectively manage the HAF to support quality projects that help lower the cost of building new housing, improve supply and make housing more affordable
107,911 111,250
BBRCEffectively manage the BBRC funding agreements to ensure the projects proceed in line with expectations on their delivery of infrastructure for housing supply.
30,000 35,000 35,000

FaHCSIA Budget Statements
Program 2.2 Key Performance Indicators Cumulatively deliver 35,000 affordable rental dwellings (in total) into the
NRAS by 30 June 2014 Cumulatively deliver 50,000 affordable rental dwellings (in total) into the
NRAS by 30 June 2016 Number of dwellings/lots that have been reduced in price and savings
have been passed to home buyers as a result of HAF projects Number of dwellings/lots that have been reduced in price and savings
have been passed to home buyers or rentals reduced in price and savings have been passed to renters as a result of BBRC
Number of dwellings/lots that have been brought forward as a consequence of the HAF
Number of dwellings/lots that have been brought forward as a consequence of the BBRC program

FaHCSIA Budget Statements
Outcome 3: Community Capability and the VulnerableImproved capacity for vulnerable people and communities to participate economically and socially and to manage life-transitions through payments, targeted support services and community capability building initiatives.
Outcome 3 Strategy
Community programs complement the income support system by providing services for those in greatest need.FaHCSIA provides funding to front-line community organisations to support vulnerable and disadvantaged Australians by providing crisis assistance, expert help with financial matters including financial counselling, information and education on money management, microfinance products, income management and payments for individuals in special circumstances.
This Budget includes additional funding for the new Home Energy Saver Scheme, which is part of the Government’s Clean Energy Future plan. The Home Energy Saver Scheme will support low-income households across Australia experiencing difficulty with meeting and paying for their energy needs. The scheme will provide access to energy efficiency and financial management information and education, advice and advocacy, and will assist with the integration of financial management and energy efficiency services.
As part of the Government’s Household Assistance Package, the Essential Medical Equipment Payment will be available to eligible Australians to cover the additional costs of running essential medical equipment or medically required heating and cooling that will arise from the introduction of a carbon pricing scheme. This $140 annual payment comes into effect from 1 July 2012.
Also as part of the Government’s Household Assistance Package, an annual Low Income Supplement of $300 will assist households that do not receive enough assistance through tax reform or other household assistance measures to meet their average expected cost impact from a carbon price.The Government will continue to pursue reforms to tackle problem gambling. In 2012, the Government aims to introduce legislation to support a pre-commitment system (including manufacturing and importation requirements for new machines), dynamic warning requirements and Automatic Teller Machine withdrawal limits.The Government has also announced non-legislative measures which are funded in this Budget, including:• undertaking of a large-scale trial of mandatory pre-commitment to be
conducted in the Australian Capital Territory

FaHCSIA Budget Statements
• commitment of funding to boost counselling services for problem gamblers. Fifty new financial counsellors will be provided through the Government’s financial counselling network to work with problem gamblers and their families
• an additional $300,000 towards enhancing, and expanding the reach of, Gambling Help Online
• a commitment to working with state and territory governments on strengthening self-exclusion arrangements and improving training for staff in gaming venues.
This Budget also continues income management in Western Australia, which has been funded since 2008.
Outcome Expense Statement
Table 2.3 provides an overview of the total expenses for Outcome 3, by program.

FaHCSIA Budget Statements
Table 2.3: Budgeted Expenses for Outcome 3Outcome 3: Community Capability and the Vulnerable
Program 3.1: Financial ManagementAdministered expenses
Ordinary annual services (Appropriation Bill No. 1) 133,824 137,963Departmental expenses
Departmental appropriation 1 30,364 37,520Expenses not requiring appropriation in the Budget year 2 2,737 3,347
Total for Program 3.1 166,925 178,830Program 3.2: Community InvestmentAdministered expenses
Ordinary annual services (Appropriation Bill No. 1) 46,814 41,325Departmental expenses
Departmental appropriation 1 21,642 20,398Expenses not requiring appropriation in the Budget year 2 1,951 1,820
Total for Program 3.2 70,407 63,543Program 3.3: Income Support for Vulnerable PeopleAdministered expenses
Special Appropriations 80,766 80,482Departmental expenses
Departmental appropriation 1 1,213 1,280Expenses not requiring appropriation in the Budget year 2 109 114
Total for Program 3.3 82,088 81,876Program 3.4: Support for People in Special CircumstancesAdministered expenses
Ordinary annual services (Appropriation Bill No. 1) 1,457 1,366Special Appropriations 4,199 4,763
Departmental expensesDepartmental appropriation 1 443 471
Expenses not requiring appropriation in the Budget year 2 40 42
Total for Program 3.4 6,139 6,642
2011–12Estimated
actualexpenses
$'000
2012–13Estimatedexpenses
$'000
(continued on next page)

FaHCSIA Budget Statements
Table 2.3: Budgeted expenses for Outcome 3 (continued)Outcome 3: Community Capability and the Vulnerable
Program 3.5: Supplementary Payments and Support forIncome Support RecipientsAdministered expenses
Ordinary annual services (Appropriation Bill No. 1) 8,637 17,124Special Appropriations 13,893 217,770
Departmental expensesDepartmental appropriation 1 1,462 2,060
Expenses not requiring appropriation in the Budget year 2 132 184
Total for Program 3.5 24,124 237,138
Outcome 3 Totals by appropriation type:Administered expenses
Ordinary annual services (Appropriation Bill No. 1) 190,732 197,778Special Appropriations 98,858 303,015
Departmental expensesDepartmental appropriation 1 55,124 61,729
Expenses not requiring appropriation in the Budget year 2 4,969 5,507
Total expenses for Outcome 3 349,683 568,029
2011–12 2012–13Average Staffing Level (number) 313 332
Note: Departmental appropriation splits and totals, by outcome and program, are indicative
estimates and may change in the course of the Budget year as government priorities change.1 Departmental appropriation combines 'Ordinary annual services (Appropriation Bill No. 1)' and 'Revenue from independent sources (s31)'.2 'Expenses not requiring appropriation in the Budget year' is made up of Depreciation, Amortisation and Makegood Expenses.
2011–12Estimated
actualexpenses
$'000
2012–13Estimatedexpenses
$'000

FaHCSIA Budget Statements
Contributions to Outcome 3: Community Capability and the Vulnerable
Program 3.1: Financial Management
Program 3.1 Objective To improve the financial knowledge, skills, capabilities and financial resilience of vulnerable individuals and families to alleviate the immediate impact of financial stress, and to progress initiatives in relation to problem gambling.Program component objectivesFinancial Management Information and AssistanceThe Financial Management Program (FMP) aims to build financial resilience and wellbeing for vulnerable people and those most at risk of financial and social exclusion and disadvantage.The services included under the program provide crisis support, budgeting and financial counselling, financial education, access to financial services and products, assistance with energy efficiency, and progression of the reforms on tackling problem gambling announced by the Government on 21 January 2012.Income Management
To help people have money available for life’s essentials such as food, rent and clothing and limit the expenditure of income support payments on excluded items, including alcohol and tobacco products, pornography and gambling activities.Linked to: DHS manages the service delivery for income management. For information about this program refer to DHS’s 2012–13 PB Statements.
Program 7.5: Stronger Futures in the Northern Territory.

FaHCSIA Budget Statements
Program 3.1 ExpensesThe change in program expenses across the forward years reflects projected changes in indexation parameters and the impact of policy initiatives.
Table 2.3.1: Budgeted Expenses for Financial Management
Annual administered expenses:Continuation of Income Management in WA 818 449 - - -Financial Management Information and Assistance 129,397 133,731 145,926 114,030 92,340Welfare Payments Reform 3,609 3,783 3,779 1,398 849
Program support 30,364 37,520 37,803 33,279 32,800Expenses not requiring appropriation in
the Budget year 1 2,737 3,347 3,279 2,910 3,076
Total program expenses 166,925 178,830 190,787 151,617 129,065Note: Departmental appropriation splits and totals, by outcome and program, are indicativeestimates and may change in the course of the Budget year as government priorities change.1 'Expenses not requiring appropriation in the Budget year' is made up of Depreciation, Amortisation and Makegood Expenses.
2011–12Revisedbudget
$'000
2012–13Budget
$'000
2013–14Forw ard
year 1$'000
2014–15Forw ard
year 2$'000
2015–16Forw ard
year 3$'000

FaHCSIA Budget Statements
Program 3.1 DeliverablesFinancial Management Information and Assistance Number of clients assisted through the Financial Management ProgramIncome Management Number of people on Income Management by measure
Program 3.1 Key Performance IndicatorsFinancial Management Information and Assistance Percentage and number of clients that have their immediate crisis needs
met Percentage and number of clients with increased money management
knowledge and skills Percentage and number of clients adhering to agreed financial
management strategies to manage life transitions Income Management Amount and percentage of income-managed funds spent on priority
needs10
Financial Management Key Performance IndicatorsKey Performance Indicators 2011-12
Revised Budget
2012-13 Budget
target
2013-14 Forward
year 1
2014-15 Forward
year 2
2015-16 Forward
year 3
Percentage and number of clients that have their immediate crisis needs met
CFC 88% 22,700
ER 95% 1,045,000
88% 22,700
95% 1,045,000
88% 22,700
95% 1,045,000
88% 22,700
95% 1,045,000
Percentage and number of clients with increased money management knowledge and skills
CFC 84% 27,345
MM 9,600 80%
84% 27,345
9,600 80%
84% 27,345 9,600 80%
84% 27,345
9,600 80%
Percentage and number of clients adhering to agreed financial management strategies to manage life transitions
18,770 93%
18,770 93%
18,770 93%
18,770 93%
Notes: CFC = Commonwealth Financial CounsellingER = Emergency ResponseMM = Money Management
10 This KPI pertains to expenditure at stores according to their main business activity. For example, a store such as a supermarket will primarily sell food, as this is its primary business; however the store will also sell other goods including non-excluded goods.

FaHCSIA Budget Statements
Program 3.2: Community Investment
Program 3.2 Objective To provide grants and ongoing funding to improve the responsiveness and integration of local community services to increase participation of vulnerable people in community life.
Program 3.2 ExpensesThe change in program expenses across the forward years reflects projected changes in indexation parameters and the impact of policy initiatives. These estimates reflect a movement of funds from Community Investment to the Northern Territory Futures Legislation package.
Table 2.3.2: Budgeted Expenses for Community Investment
Annual administered expenses:Community Investment 46,814 41,325 43,512 47,078 50,842
Program support 21,642 20,398 20,451 19,362 19,422Expenses not requiring appropriation in
the Budget year 1 1,951 1,820 1,774 1,693 1,821
Total program expenses 70,407 63,543 65,737 68,133 72,085Note: Departmental appropriation splits and totals, by outcome and program, are indicativeestimates and may change in the course of the Budget year as government priorities change.1 'Expenses not requiring appropriation in the Budget year' is made up of Depreciation, Amortisation and Makegood Expenses.
2011–12Revisedbudget
$'000
2012–13Budget
$'000
2013–14Forw ard
year 1$'000
2014–15Forw ard
year 2$'000
2015–16Forw ard
year 3$'000

FaHCSIA Budget Statements
Program 3.2 Deliverables
Number of individuals assisted through Volunteer Grants Number of individuals assisted through the Community Investment
Program11
Community Investment Deliverables TargetsDeliverables 2011–12
Revised budget
2012–13 Budget
2013–14 Forward
year 1
2014–15 Forward
year 2
2015–16 Forward
year 3
Number of individuals assisted through Volunteer Grants
195,000 195,000 195,000 195,000 195,000
Number of individuals assisted through the Community Investment Program
239,000 239,000 239,000 239,000 239,000
Program 3.2 Key Performance IndicatorsCommunity Investment Percentage and number of individuals who indicated they were satisfied
with the Community Support Service and Community Projects Percentage and number of individuals assisted from Indigenous and
culturally and linguistically diverse backgrounds12
11 Only includes individuals assisted through the Community Support Service and Community Projects.12 Only includes Community Support Service and Community Projects.

FaHCSIA Budget Statements
Program 3.3: Income Support for Vulnerable People
Program 3.3 Objective To make payments to financially assist eligible people in severe financial hardship who do not have any other means of support.Linked to: Personal benefits payments under this program are delivered by DHS. For more information refer to DHS’s 2012–13 PB Statements.
Program 3.3 ExpensesThe increase in program expenses across the forward years reflects projected changes in customer trends and indexation parameters and impact of policy initiatives. The impact of policy initiatives includes the Household Assistance Package to assist households meet additional costs under a carbon price.
Table 2.3.3: Budgeted Expenses for Income Support for Vulnerable People
Special Appropriations:Social Security (Administration) Act 1999
Special Benefit 80,766 80,482 89,804 95,856 102,434Program support 1,213 1,280 1,301 1,397 1,331Expenses not requiring appropriation in
the Budget year 1 109 114 113 122 125
Total program expenses 82,088 81,876 91,218 97,375 103,890Note: Departmental appropriation splits and totals, by outcome and program, are indicativeestimates and may change in the course of the Budget year as government priorities change.1 'Expenses not requiring appropriation in the Budget year' is made up of Depreciation, Amortisation and Makegood Expenses.
2011–12Revisedbudget
$'000
2012–13Budget
$'000
2013–14Forw ard
year 1$'000
2014–15Forw ard
year 2$'000
2015–16Forw ard
year 3$'000

FaHCSIA Budget Statements
Program 3.3 Deliverables
Payments are made through DHS to eligible claimants under the provisions of social security law
Program 3.3 Key Performance Indicators
Income Support for Vulnerable People (Special Benefit) Percentage and number of recipients on part rate due to the means test Number of recipients Administered outlays Duration on payment Payment accuracy Agreements are in place with all service providers Strategies are in place to ensure that requirements are fulfilled under
agreements with service delivery agencies

FaHCSIA Budget Statements
Program 3.4: Support for People in Special Circumstances
Program 3.4 Objective To make payments to financially assist eligible people in severe financial hardship who do not have any other means of support.To make payments to Australians in circumstances beyond their control to support them in overcoming those circumstances and maintaining their financial wellbeing.Program component objectivesBereavement Allowance
To make payments for up to 14 weeks to a recently widowed person following the death of their partner to enable them with expenses relating to their partner’s death and to help maintain an adequate standard of living during that time.Payments under Special Circumstances
Payments under Special Circumstances include Act of Grace payments made under section 33 of the FMA Act and ex gratia payments to individuals and families affected by disasters and other crises.Linked to: Personal benefits payments under this program are delivered by DHS. For more information refer to DHS’s 2012–13 PB Statements.

FaHCSIA Budget Statements
Program 3.4 ExpensesThe higher estimate for Payments under Special Circumstances for 2011–12 reflects an increase in the Act of Grace payments component due to an increase in demand.The increase in program expenses across the forward years reflects projected changes in the customer trends and indexation parameters for Bereavement Allowance.
Table 2.3.4: Budgeted Expenses for Support for People in Special Circumstances
Annual administered expenses:Payments under Special Circumstances 1,457 1,366 1,377 1,384 1,392
Special Appropriations:Social Security (Administration) Act 1999
Bereavement Allow ance 4,199 4,763 5,471 6,289 7,197Program support 443 471 501 495 511Expenses not requiring appropriation in
the Budget year 1 40 42 43 43 48
Total program expenses 6,139 6,642 7,392 8,211 9,148
Note: Departmental appropriation splits and totals, by outcome and program, are indicativeestimates and may change in the course of the Budget year as government priorities change.1 'Expenses not requiring appropriation in the Budget year' is made up of Depreciation, Amortisation and Makegood Expenses.
2011–12Revisedbudget
$'000
2012–13Budget
$'000
2013–14Forw ard
year 1$'000
2014–15Forw ard
year 2$'000
2015–16Forw ard
year 3$'000

FaHCSIA Budget Statements
Program 3.4 Deliverables
Bereavement Allowance Payments are made through DHS to eligible claimants under the
provisions of social security lawPayments under Special Circumstances Payments are made through DHS to eligible claimants under the
provisions of social security law and the FMA Act
Program 3.4 Key Performance Indicators
Bereavement Allowance Number of recipients Administered outlaysPayments under Special Circumstances Number of recipients Administered outlays

FaHCSIA Budget Statements
Program 3.5: Supplementary Payments and Support for Income Support Recipients
Program 3.5 Objective To make payments and subsidise services to certain income support recipients and low-income households to assist them financially and to help them continue to participate economically and socially.
Program Component ObjectivesReimbursement to Great Southern Rail for Concessional FaresTo reimburse Great Southern Rail for the provision of concessional fares on its services (the Indian Pacific, the Ghan and the Overland) to pensioners, certain veterans, holders of a Commonwealth Seniors Health Card and state and territory Seniors Card.Low Income SupplementTo assist low-income households that do not receive enough assistance through tax reform or other household assistance measures to meet their average expected cost impact from carbon pricing.Utilities AllowancePayments are made through DHS to eligible claimants under the provisions of social security law.Essential Medical Equipment PaymentTo make payments to eligible Australians who experience additional increases in home energy costs under a carbon price as a result of the need to operate essential medical equipment in their home, or additional heating or cooling, to manage their disability or medical condition.Linked to: Personal benefits payments under this program are delivered by DHS. For more information refer to DHS’s 2012–13 PB Statements.

FaHCSIA Budget Statements
Program 3.5 ExpensesThe increase in program expenses across the forward years reflects projected changes in customer trends and indexation parameters for the Utilities Allowance.Under the Clean Energy Future package two new payments – the Low Income Supplement and the Essential Medical Equipment Payment – will be paid from 1 July 2012.
Table 2.3.5: Budgeted Expenses for Supplementary Payments and Support for Income Support Recipients
Annual administered expenses:Reimbursement to Great SouthernRail for Concessional Fares 8,637 8,445 8,656 8,872 9,094Helping Households - Communication Campaign - 8,679 - - -
Special Appropriations:Social Security (Administration) Act 1999
Clean Energy Low Income Supplement - 188,160 187,870 187,595 187,333Essential Medical Equipment Payment - 15,318 15,743 16,166 16,601Utilities Allow ance 13,893 14,292 14,756 15,238 16,019
Program support 1,462 2,060 2,008 2,021 2,049Expenses not requiring appropriation in
the Budget year 1 132 184 174 177 192
Total program expenses 24,124 237,138 229,207 230,069 231,288
Note: Departmental appropriation splits and totals, by outcome and program, are indicativeestimates and may change in the course of the Budget year as government priorities change.1 'Expenses not requiring appropriation in the Budget year' is made up of Depreciation, Amortisation and Makegood Expenses.
2011–12Revisedbudget
$'000
2012–13Budget
$'000
2013–14Forw ard
year 1$'000
2014–15Forw ard
year 2$'000
2015–16Forw ard
year 3$'000

FaHCSIA Budget Statements
Program 3.5 Deliverables
Reimbursement to Great Southern Rail for Concessional Fares Great Southern Rail is under agreement to provide concessional fares on
its services to pensioners, certain veterans, holders of a Commonwealth Seniors Health Card, and state and territory Senior Card
Low Income Supplement Payments are made through DHS to eligible claimants under the
provisions of social security lawUtilities Allowance Payments are made through DHS to eligible claimants under the
provisions of social security lawEssential Medical Equipment Payment Payments will be made through DHS to eligible claimants under the
provisions of social security law
Program 3.5 Key Performance IndicatorsReimbursement to Great Southern Rail for Concessional Fares Administered outlays Number of recipients Number of journeysLow Income Supplement Administered outlays Number of recipientsUtilities Allowance Administered outlays Number of recipientsEssential Medical Equipment Payment Administered outlays Number of recipients

FaHCSIA Budget Statements
Outcome 4: SeniorsAn adequate standard of living and improved capacity to productively manage resources and life-transitions for senior Australians through the delivery of payments, concessions and information services.
Outcome 4 Strategy
FaHCSIA's key strategy under Outcome 4 is the payment of the Age Pension and supplements, and the provision of concessions, to senior Australians, who are unable to fully support themselves. Pension reforms introduced from 20 September 2009 continue to benefit many senior Australians and also affect Age Pension expenditure. The reforms include an increase to pension rates, a new pension supplement, and improved indexation and wage benchmarking arrangements. Since 20 September 2009, the maximum pension has increased by $154 a fortnight for single pensioners and $156 for pensioner couples combined on the maximum rate. The Government is providing assistance for pensioners ahead of the introduction of the carbon price from 1 July 2012. In May–June 2012, pensioners will receive an initial payment of $250 for singles and $190 for each eligible member of a couple. Permanent ongoing assistance will be provided to pensioners from 20 March 2013. Commonwealth Seniors Health Card holders who also receive the Seniors Supplement will receive the same level of assistance for the impact of the carbon price as pensioners.The Government has announced major reforms to the aged care system. The pension system will support these reforms by maintaining the means test exemption for accommodation bonds. Under the aged care reforms, people will be able to pay accommodation bonds in a wider range of circumstances, leading to increases in pension outlays in the longer term. The Government continues to assist senior Australians through the provision of concession cards, including the Pensioner Concession Card, the Health Care Card and the Commonwealth Seniors Health Card. These cards provide cardholders with access to Pharmaceutical Benefits Scheme prescription items and a lower Extended Medicare safety net threshold. Commonwealth Seniors Health Card holders are also entitled to receive the Seniors Supplement.The Government contributes some funding towards certain state-based concessions through the COAG National Partnership on Certain Concessions for Pensioners and Seniors Card Holders. A new national partnership agreement is currently being negotiated, to commence from 1 July 2012 for four years. The arrangement would continue to contribute funds toward certain specified concessions that the states and territories must provide to all Pensioner Concession Card holders. It also provides funding for states and territories to provide public transport concessions to out-of-state Seniors Card holders.

FaHCSIA Budget Statements
Outcome Expense Statement
Table 2.4 provides an overview of the total expenses for Outcome 4, by program.

FaHCSIA Budget Statements
Table 2.4: Budgeted Expenses for Outcome 4Outcome 4: Seniors
Program 4.1: Income Support for SeniorsAdministered expenses
Ordinary annual services (Appropriation Bill No. 1) 6,678 6,249Special Appropriations 34,816,043 36,777,008
Departmental expensesDepartmental appropriation 1 16,432 15,781
Expenses not requiring appropriation in the Budget year 2 1,481 1,408
Total for Program 4.1 34,840,634 36,800,446Program 4.2: Allowances, Concessions and Services for SeniorsAdministered expenses
Ordinary annual services (Appropriation Bill No. 1) 2,600 2,600Special Appropriations 255,878 234,977
Departmental expensesDepartmental appropriation 1 5,381 4,306
Expenses not requiring appropriation in the Budget year 2 485 384
Total for Program 4.2 264,344 242,267
Outcome 4 Totals by appropriation type:Administered expenses
Ordinary annual services (Appropriation Bill No. 1) 9,278 8,849Special Appropriations 35,071,921 37,011,985
Departmental expensesDepartmental appropriation 1 21,813 20,087
Expenses not requiring appropriation in the Budget year 2 1,966 1,792
Total expenses for Outcome 4 35,104,978 37,042,713
2011–12 2012–13Average Staffing Level (number) 153 157
Note: Departmental appropriation splits and totals, by outcome and program, are indicativeestimates and may change in the course of the Budget year as government priorities change.1 Departmental appropriation combines 'Ordinary annual services (Appropriation Bill No. 1)' and 'Revenue from independent sources (s31)'.2 'Expenses not requiring appropriation in the Budget year' is made up of Depreciation, Amortisation and Makegood Expenses.
2011–12Estimated
actualexpenses
$'000
2012–13Estimatedexpenses
$'000

FaHCSIA Budget Statements
Contributions to Outcome 4: Seniors
Program 4.1: Income Support for Seniors
Program 4.1 Objective To make payments to senior Australians to assist them financially in a manner that encourages them to productively manage resources and life transitions.Program component objectives
Age Pension
To make payments to senior Australians to assist them financially in a manner that encourages them to productively manage resources and life transitions.Widow B Pension
To make payments to widowed, divorced and separated women to assist them financially. (This payment was closed to new entrants from 20 March 1997.)Wife Pension (Age)
To make payments to female partners of Age Pension recipients, where those partners are not eligible in their own right for Age Pension, to assist them financially. (This payment was closed to new entrants from 1 July 1995.)Linked to: Personal benefits payments under this program are delivered by DHS and by DVA. For more information refer to each agency’s 2012–13 PB Statements.

FaHCSIA Budget Statements
Program 4.1 ExpensesThe variations in program expenses across the forward years reflect projected changes in the economy, customer trends, indexation parameters and the impact of policy initiatives.The Widow B Pension and Wife Pension (Age) programs are closed payments with no new claimants.The impact of policy initiatives includes the Household Assistance Package to assist households meet additional costs under a carbon price.
Table 2.4.1: Budgeted Expenses for Income Support for Seniors
Annual administered expenses:Helping Households - Communication Campaign 6,678 6,249 - - -
Special Appropriations:Social Security (Administration) Act 1999
Age Pension 34,675,633 36,647,928 38,904,106 41,630,658 44,753,829Widow B Pension 7,302 7,427 7,089 7,337 7,272Wife Pension (Age) 133,108 121,653 118,770 114,405 113,687
Program support 16,432 15,781 15,133 15,096 15,128Expenses not requiring
appropriation in the Budget year 1 1,481 1,408 1,313 1,320 1,419
Total program expenses 34,840,634 36,800,446 39,046,411 41,768,816 44,891,335Note: Departmental appropriation splits and totals, by outcome and program, are indicativeestimates and may change in the course of the Budget year as government priorities change.1 'Expenses not requiring appropriation in the Budget year' is made up of Depreciation, Amortisation and Makegood Expenses.
2011–12Revisedbudget
$'000
2012–13Budget
$'000
2013–14Forw ard
year 1$'000
2014–15Forw ard
year 2$'000
2015–16Forw ard
year 3$'000

FaHCSIA Budget Statements
Program 4.1 Deliverables
Payments are made through DHS to eligible claimants under the provisions of social security law
Program 4.1 Key Performance Indicators
Age Pension Number of recipients Administered outlays Percentage and number of recipients on part rate due to the means test Ratio of assessed income of pensioners to their total income Percentage and number of senior Australians who receive payment Percentage and number of recipients with employment income Percentage and number of new entrants with employment income Payment accuracy Agreements are in place with all service delivery agencies Strategies are in place to ensure that the requirements are fulfilled under
agreements with providersWidow B Pension Number of recipients Administered outlays Percentage and number of recipients on part rate due to the means testWife Pension (Age) Number of recipients Administered outlays Percentage and number of recipients on part rate due to the means test Ratio of current number of Wife Pension (Age) recipients to the number
of Wife Pension (Age) recipients at 1 July 1995

FaHCSIA Budget Statements
Program 4.2: Allowances, Concessions and Services for Seniors
Program 4.2 Objective To make payments and provide services to senior Australians to assist with household expenses, enabling them to maintain their standard of living and increase access to information and community resources.Program Component ObjectivesSeniors Supplement
To make payments to senior Australians to assist with household and other living expenses.Broadband for SeniorsTo maintain a network of 2,000 Internet kiosks in locations frequented by seniors tohelp seniors get online and stay connected with families, friends and communityactivities.Linked to: Personal benefits payments under this program are delivered by DHS and by DVA. For more information refer to each agency’s 2012–13 PB Statements.

FaHCSIA Budget Statements
Program 4.2 ExpensesThe increase in program expenses across the forward years reflects projected changes in the customer trends, indexation parameters and the impact of policy initiatives for the Seniors Supplement.The impact of policy initiatives includes the Household Assistance Package to assist households meet additional costs under a carbon price.
Table 2.4.2: Budgeted Expenses for Allowances, Concessions and Services for Seniors
Annual administered expenses:Broadband for Seniors 2,600 2,600 2,600 2,600 -
Special Appropriations:Social Security (Administration) Act 1999
Seniors Supplement 255,878 234,977 309,124 334,434 353,957Program support 5,381 4,306 4,221 3,997 3,748Expenses not requiring appropriation in
the Budget year 1 485 384 366 350 352
Total program expenses 264,344 242,267 316,311 341,381 358,057Note: Departmental appropriation splits and totals, by outcome and program, are indicativeestimates and may change in the course of the Budget year as government priorities change.1 'Expenses not requiring appropriation in the Budget year' is made up of Depreciation, Amortisation and Makegood Expenses.
2011–12Revisedbudget
$'000
2012–13Budget
$'000
2013–14Forw ard
year 1$'000
2014–15Forw ard
year 2$'000
2015–16Forw ard
year 3$'000

FaHCSIA Budget Statements
Program 4.2 Deliverables
Payments Payments are made through DHS to eligible claimants under the
provisions of social security lawBroadband for Seniors Number of kiosks established13
Program 4.2 Key Performance Indicators
Seniors Supplement Number of recipients Administered outlaysBroadband for Seniors Percentage of kiosk users reporting improved skills and confidence in
using computers and the Internet14
Percentage of kiosk users participating in training activities15
Percentage of Australian seniors satisfied with the quality of Broadband for Seniors training and support
13 This deliverable reflects a main objective of the Broadband for Seniors initiative.14 The KPI was amended to better reflect the data collected.15 See previous footnote.

FaHCSIA Budget Statements
Outcome 5: Disability and CarersAn adequate standard of living, improved capacity to participate economically and socially and manage life-transitions for people with disability and/or mental illness and carers through payments, concessions, support and care services.
Outcome 5 Strategy
Outcome 5 includes the provision of income support payments and allowances (including Disability Support Pension (DSP), Carer Payment and Carer Allowance) and support services for people with disability and their carers. These services include supported employment, advocacy, community mental health services, respite services, and services for children with autism spectrum disorder and other identified disabilities. Through the 2012–13 Budget, the Australian Government is investing $1 .0 billion in the first stage of a National Disability Insurance scheme (NDIS) in up to four locations across the country. From mid-2013, about 10,000 people with significant and permanent disabilities will start to receive needs assessments and support. From July 2014, the first stage will be expanded to include around 20,000 people.The locations for this first stage will be determined in consultation with the states and territories.As recommended by the Productivity Commission, an NDIS will provide reasonable and necessary support for eligible people with disability. This means that people will get the care and support they need to address the impact of their disability on their capacity to participate in social and economic life. People with disability will have more choice and control about the design and delivery of support to them. Support will be highly individualised but could include personal care and support, aids and equipment such as wheelchairs or communication aids, assistance with transport and one-off assistance such as training in the use of a new communication aid.A new NDIS Launch Transition Agency, funded by the Australian Government, will be established to run the delivery of care and support to people with disability, their families and carers in the select locations. The agency will also oversee the development of an information and communications technology system to capture data and client information for the first stage of an NDIS. In addition, funding will be available to assist the disability services sector and its workforce to transition to an NDIS. This funding will help to expand and train the workforce, ensure that organisations in the sector are well positioned to manage the transition, and that new forms of support are able to be developed to meet the needs of people with disability. The Australian Government will continue to work with the states and territories on the design, governance and funding arrangements for the

FaHCSIA Budget Statements
national roll-out of an NDIS through the Council of Australian Governments and the Select Council of Treasurers and Disability Ministers.
Disability Support Pension (DSP) is an income support payment for people who are unable to support themselves adequately through work due to a permanent physical, intellectual or psychiatric impairment. Over the last three budgets, a number of reforms aimed at helping people with disability to work wherever possible have overhauled key aspects of the DSP. From 3 September 2011, changes to the assessment of work capacity were implemented to ensure that more people with disability get help to find work. Revised Impairment Tables came into effect on 1 January 2012. The revised tables take account of contemporary medical and rehabilitation practices and international approaches to functional ability. These changes ensure that a person’s ability is considered when assessing their eligibility for DSP.From 1 July 2012, new participation requirements will be introduced for DSP recipients under age 35 with an assessed work capacity of eight or more hours a week. Also from 1 July 2012, all DSP recipients will be able to work up to 30 hours a week without affecting their DSP qualification. Subject to the income test, they will be able to receive a part pension in addition to their employment income.The Government‘s Carer Payment and Carer Allowance support carers of both adults and children. The annual $600 Carer Supplement may also be available to recipients of Carer Allowance for each person being cared for, and an additional $600 to those in receipt of Carer Payment or other eligible income support payment. Carers of children under age 16 receiving Carer Allowance may also receive the annual $1,000 Child Disability Assistance Payment for each eligible child. The Carer Adjustment Payment is an ex gratia payment to families not eligible for income support where, following a catastrophic event involving a child under age seven, the family is going through a period of significant adjustment as a result of the care needs of the child. The 2012–13 Budget commits additional funding to support Australian Disability Enterprises to 2015–16. These organisations will also be assisted to prepare for a new disability reform agenda through a 10-year Australian government vision for inclusive employment. The National Disability Strategy, endorsed by COAG in February 2011 and launched in March 2011, sets out a 10-year roadmap for all governments to address the barriers faced by Australians with disability and ensure that mainstream services and programs, including health care, housing, transport and education, address the needs of people with disability. The first year report to COAG on the National Disability Strategy and the first implementation plan, Laying the Groundwork 2011–2014, will be released in late 2012, following consultation with people with disability, their families and carers and representative organisations.

FaHCSIA Budget Statements
FaHCSIA is also continuing to work closely with state and territory governments on key priority areas under the National Disability Agreement. Through the National Carer Strategy, launched in August 2011, the Government is supporting carers to have opportunities to participate fully in work, family and community life.The Government’s election commitments for people with disability and their carers will continue to be rolled out. The Australian Government has allocated $60 million over four years to the Supported Accommodation Innovation Fund to build 150 innovative, community-based supported accommodation places for people with disability. Around 4,000 children with cerebral palsy, Down syndrome, Fragile X syndrome or greater vision or hearing impairment are now registered for vital early intervention support as a result of the Government’s Better Start for Children with Disability initiative. This builds on the success of the Helping Children with Autism initiative which started in 2008.Community-based mental health services seek to improve the capacity of individuals, families and carers affected by mental illness to participate in work and the community. In 2012–13, FaHCSIA will continue to expand services as announced in the 2011–12 Budget.
Outcome Expense Statement
Table 2.5 provides an overview of the total expenses for Outcome 5, by program.

FaHCSIA Budget Statements
Table 2.5: Budgeted Expenses for Outcome 5Outcome 5: Disability and Carers
Program 5.1: Targeted Community CareAdministered expenses
Ordinary annual services (Appropriation Bill No. 1) 152,657 183,884Departmental expenses
Departmental appropriation 1 12,502 17,529Expenses not requiring appropriation in the Budget year 2 1,127 1,564
Total for Program 5.1 166,286 202,977Program 5.2: Disability Support PensionAdministered expenses
Ordinary annual services (Appropriation Bill No. 1) 1,982 1,856Special Appropriations 14,503,973 14,846,680
Departmental expensesDepartmental appropriation 1 12,679 12,230
Expenses not requiring appropriation in the Budget year 2 1,143 1,091
Total for Program 5.2 14,519,777 14,861,857Program 5.3: Income Support for CarersAdministered expenses
Ordinary annual services (Appropriation Bill No. 1) 5,461 3,418Special Appropriations 5,720,782 6,277,973
Departmental expensesDepartmental appropriation 1 9,291 9,308
Expenses not requiring appropriation in the Budget year 2 838 830
Total for Program 5.3 5,736,372 6,291,529Program 5.4: Services and Support for People with Disability 3Administered expenses
Ordinary annual services (Appropriation Bill No. 1) 382,113 320,388Special Accounts 891 1,523
Departmental expensesDepartmental appropriation 1 43,596 35,457
Expenses not requiring appropriation in the Budget year 2 3,929 3,163
Total for Program 5.4 430,529 360,531
2011–12Estimated
actualexpenses
$'000
2012–13Estimatedexpenses
$'000
(continued on next page)

FaHCSIA Budget Statements
Table 2.5: Budgeted Expenses for Outcome 5 (continued)Outcome 5: Disability and Carers
Program 5.5: Support for CarersAdministered expenses
Ordinary annual services (Appropriation Bill No. 1) 12,648 12,127Departmental expenses
Departmental appropriation 1 8,908 8,601Expenses not requiring appropriation in the Budget year 2 803 767
Total for Program 5.5 22,359 21,495
Program 5.6: National Disability Insurance SchemeAdministered expenses
Ordinary annual services (Appropriation Bill No. 1) - 29,841Departmental expenses
Departmental appropriation 1 - 28,613Expenses not requiring appropriation in the Budget year 2 - 8,467
Total for Program 5.6 - 66,921
Program 5.7: Early Intervention Services for Children with DisabilityAdministered expenses
Ordinary annual services (Appropriation Bill No. 1) - 85,234Departmental expenses
Departmental appropriation 1 - 10,262Expenses not requiring appropriation in the Budget year 2 - 915
Total for Program 5.7 - 96,411
Outcome 5 Totals by appropriation type:Administered expenses
Ordinary annual services (Appropriation Bill No. 1) 554,861 636,748Special Appropriations 20,224,755 21,124,653Special Accounts 891 1,523
Departmental expensesDepartmental appropriation 1 86,976 122,000
Expenses not requiring appropriation in the Budget year 2 7,840 16,797
Total expenses for Outcome 5 20,875,323 21,901,721
2011–12 2012–13Average Staffing Level (number) 521 631
Note: Departmental appropriation splits and totals, by outcome and program, are indicativeestimates and may change in the course of the Budget year as government priorities change.1 Departmental appropriation combines 'Ordinary annual services (Appropriation Bill No. 1)' and 'Revenue from independent sources (s31)'.2 'Expenses not requiring appropriation in the Budget year' is made up of Depreciation, Amortisation and Makegood Expenses.3 From 2012-13, the appropriations for Helping Children w ith Autism Early Intervention and Better Start for Children w ith Disability are reported under Program 5.7 Early Intervention Services for Children w ith Disability.
2011–12Estimated
actualexpenses
$'000
2012–13Estimatedexpenses
$'000

FaHCSIA Budget Statements
Contributions to Outcome 5: Disability and Carers
Program 5.1 Targeted Community Care
Program 5.1 Objective To implement community mental health initiatives to assist people with mental illness and their families and carers.Program component objectivesMental Health
To implement community mental health initiatives to assist people with mental illness and their families and carers to manage the impact of mental illness.
Program 5.1 ExpensesThe increase in program expenses across the forward years reflects the expansion of community mental health initiatives funded in the 2011-12 Budget to assist people with severe mental illness and their families and carers.
Table 2.5.1: Budgeted Expenses for Targeted Community Care
Annual administered expenses:Mental Health 152,657 183,884 213,282 227,202 231,353
Program support 12,502 17,529 18,477 17,359 17,147Expenses not requiring appropriation in
the Budget year 1 1,127 1,564 1,603 1,518 1,608
Total program expenses 166,286 202,977 233,362 246,079 250,108Note: Departmental appropriation splits and totals, by outcome and program, are indicativeestimates and may change in the course of the Budget year as government priorities change.1 'Expenses not requiring appropriation in the Budget year' is made up of Depreciation, Amortisation and Makegood Expenses.
2011–12Revisedbudget
$'000
2012–13Budget
$'000
2013–14Forw ard
year 1$'000
2014–15Forw ard
year 2$'000
2015–16Forw ard
year 3$'000

FaHCSIA Budget Statements
Program 5.1 DeliverablesMental Health Number of clients, carers or family members whose lives are affected by
mental illness accessing support services
Targeted Community Care Deliverables Targets Deliverables 2011–12
Revised Budget
2012–13 Budget
2013–14 Forward
year 1
2014–15 Forward
year 2
2015–16 Forward
year 3
Mental HealthNumber of clients, carers or family members whose lives are affected by mental illness accessing support services16
60,000 63,000 68,000 71,000 72,000
16 Note: Deliverables targets have been amended to reflect the actual delivery of services in the 2010–11 financial year and the projected implementation of the 2011–12 Budget measures.

FaHCSIA Budget Statements
Program 5.1 Key Performance Indicators Percentage and number of registered mental health participants
maintaining progress against relevant goals Percentage and number of clients who report that they are satisfied that
the service they received was appropriate to their needs Percentage and number of clients from Indigenous backgrounds Percentage and number of clients from culturally and linguistically
diverse backgrounds
Mental Health Key Performance Indicators17
Key Performance Indicators 2011–12 Revised budget
2012–13 Budget
target
2013–14 Forward
year 1
2014–15 Forward
year 2
2015–16 Forward
year 3
Percentage and number of registered participants maintaining progress against relevant goals
60%36,000
60%37,800
60%40,800
60%42,600
60%43,200
Percentage and number of clients who report that they are satisfied that the service they received was appropriate to their needs
80%48,000
80%50,400
80%54.400
80%56,800
80%57,600
Percentage and number of clients from Indigenous backgrounds
7% 4,000
7%4,000
7% 5,000
7%, 5,000
7%, 5,000
Percentage and number of clients from culturally and linguistically diverse backgrounds
16% 10,000
16% 10,000
16% 11,000
16% 11,000
16% 11,000
17 KPI targets have been amended to reflect the actual delivery of services in the 2010-11 financial year and the projected implementation of the 2011–12 Budget measures. This information was not available when the original PBS targets were developed.

FaHCSIA Budget Statements
Program 5.2: Disability Support Pension
Program 5.2 Objective To make payments to eligible people with disability who are unable to support themselves to achieve financial independence.Linked to: Personal benefits payments under this program are delivered by DHS. For more information refer to DHS’s 2012-13 PB Statements
Program 5.2 ExpensesThe increase in program expenses across the forward years reflects projected changes in the economy, customer trends, indexation parameters and the impact of policy initiatives.The impact of policy initiatives includes the Household Assistance Package to assist households meet additional costs under a carbon price.
Table 2.5.2: Budgeted Expenses for Disability Support Pension
Annual administered expenses:Helping Households - Communication Campaign 1,982 1,856 - - -
Special Appropriations:Social Security (Administration) Act 1999
Disability Support Pension 14,503,973 14,846,680 15,383,451 16,126,482 16,945,478Program support 12,679 12,230 11,128 9,977 10,090Expenses not requiring appropriation
the Budget year 1 1,143 1,091 965 872 946
Total program expenses 14,519,777 14,861,857 15,395,544 16,137,331 16,956,514Note: Departmental appropriation splits and totals, by outcome and program, are indicativeestimates and may change in the course of the Budget year as government priorities change.1 'Expenses not requiring appropriation in the Budget year' is made up of Depreciation, Amortisation and Makegood Expenses.
2011–12Revisedbudget
$'000
2012–13Budget
$'000
2013–14Forw ard
year 1$'000
2014–15Forw ard
year 2$'000
2015–16Forw ard
year 3$'000

FaHCSIA Budget Statements
Program 5.2 Deliverables Payments are made through DHS to eligible claimants under the
provisions of social security law
Program 5.2 Key Performance IndicatorsDisability Support Pension (DSP) Duration on payment Percentage and number of recipients reporting employment income Percentage and number of recipients on part rate due to the means test Number of recipients Administered outlays Payment accuracy Agreements are in place with all service delivery agencies Strategies are in place to ensure that requirements are fulfilled under
agreements with service delivery agencies Percentage and number of estimated population of people with disability
who receive payment18
Percentage and number of DSP population as a proportion of the total Australian working-age population19
18 The result for this indicator is derived using the denominator from the Australian Bureau of Statistics Survey of Disability, Ageing and Carers (cat. no. 4430) and is the number of people with disability. Not all people with disability have a work limitation or rely on DSP.19 This result is a point in time count of DSP recipients aged 15 to 64 years and a point in time count of the Australian Bureau of Statistics data on the working age population aged 15 to 64 years.

FaHCSIA Budget Statements
Program 5.3: Income Support for Carers
Program 5.3 Objective To make payments and allowances to financially assist eligible carers of people with disability or a severe medical condition or of people who are frail aged.Program Component ObjectivesCarer Adjustment Payment – Ex gratia payments to unsuccessful applicants of Carer Payment (Child)To make one-off payments to families not eligible for income support where, following a catastrophic event involving a child under age seven, the family is going through a period of significant adjustment as a result of the care needs of the child. Carer PaymentTo make payments to financially assist carers whose caring responsibilities for people with disability, frailty because of age or a severe medical condition severely restrict their ability to undertake paid employment.The carer must personally provide constant care in the home of the care receiver, and meet an income and assets test. A person cannot receive Carer Payment and another income support payment at the same time.Care receivers are subject to a separate income and assets test.Carer Allowance (Adult)To make payments to financially assist carers who provide daily care and attention in a private home to a person with a disability or severe medical condition.Carer Allowance (Child)To make payments to financially assist carers who provide daily care and attention in a private home to a child under age 16 with disability or a severe medical condition.Carer Allowance is not taxable or income and assets tested, and it can be paid in addition to a social security income support payment. A carer who qualifies for Carer Payment (Child) automatically qualifies for Carer Allowance (Child).Carer SupplementTo make payments annually to eligible carers to provide additional financial security and alleviate financial pressures.A carer is qualified for the Carer Supplement if they receive a qualifying payment in respect of a period that includes 1 July.

FaHCSIA Budget Statements
Program Component Objectives (continued)Child Disability Assistance PaymentTo make payments annually to Carer Allowance (Child) recipients to help them purchase appropriate assistance for their family. A carer is qualified for the Child Disability Assistance Payment if they receive a qualifying payment in respect of a period that includes 1 July.Wife Pension (DSP)
To make payments to female partners of DSP recipients to assist them financially. This payment was closed to new entrants from 1 July 1995.
Linked to: Personal benefits payments under this program are delivered by DHS. For more information refer to DHS’s 2012-13 PB Statements.

FaHCSIA Budget Statements
Program 5.3 ExpensesThe increase in program expenses across the forward years reflects projected changes in the economy, customer trends, indexation parameters and the impact of policy and program initiatives. Wife Pension (DSP) is a closed payment with no new grants since 1 July 1995. Customers may, instead, qualify for other income support payments.The impact of policy initiatives includes the Household Assistance Package to assist households meet additional costs under a carbon price.
Table 2.5.3: Budget Expenses for Income Support for Carers
Annual administered expenses:Ex-Gratia Payments to Unsuccessful Applicants of Carer Payment (Child) 4,800 2,800 2,800 2,800 2,800Helping Households - Communication Campaign 661 618 - - -
Special Appropriations:Social Security (Administration) Act 1999
Carer Allow ance (Adult) 1,259,254 1,378,807 1,508,055 1,653,218 1,812,592Carer Allow ance (Child) 475,001 502,520 529,542 561,080 594,152Carer Payment 3,194,131 3,603,583 4,137,942 4,717,576 5,288,340Carer Supplement 480,586 505,959 539,030 575,034 611,813Child Disability Assistance Payment 163,780 166,923 171,785 176,937 182,328Wife Pension (DSP) 148,030 120,181 100,988 92,665 79,034
Program support 9,291 9,308 8,888 8,813 8,847Expenses not requiring appropriation in
the Budget year 1 838 830 771 771 830
Total program expenses 5,736,372 6,291,529 6,999,801 7,788,894 8,580,736Note: Departmental appropriation splits and totals, by outcome and program, are indicativeestimates and may change in the course of the Budget year as government priorities change.1 'Expenses not requiring appropriation in the Budget year' is made up of Depreciation, Amortisation and Makegood Expenses.
2011–12Revisedbudget
$'000
2012–13Budget
$'000
2013–14Forw ard
year 1$'000
2014–15Forw ard
year 2$'000
2015–16Forw ard
year 3$'000

FaHCSIA Budget Statements
Program 5.3 Deliverables
Ex gratia payments to unsuccessful applicants for Carer Payment (Child) (Carer Adjustment Payment) are paid under the provisions of the FMA Act
Payments are made through DHS to eligible claimants under the provisions of social security law

FaHCSIA Budget Statements
Program 5.3 Key Performance IndicatorsCarer Allowance (Adult and Child) Number of recipients Administered outlays Payment accuracy Agreements are in place with all service delivery agencies Strategies are in place to ensure that the requirements are fulfilled under
agreements with service delivery agencies Percentage and number of primary carers who are receiving payment 20
Carer Payment Number of recipients Administered outlays Payment accuracy Agreements are in place with all service delivery agencies Strategies are in place to ensure that the requirements are fulfilled under
agreements with service delivery agencies Percentage and number of primary carers who are receiving payment21 Percentage and number of recipients reporting employment income Percentage and number of recipients on part rate due to the means test Child Disability Assistance Payment Number of recipients Administered outlaysWife Pension (DSP) Number of recipients Administered outlays Percentage and number of recipients reporting employment income Percentage and number of recipients on part rate due to the means testWife Pension (DSP) (continued) Ratio of current number of Wife Pension (DSP) recipients to the number
of Wife Pension (DSP) recipients at 1 July 1995
20 This KPI relies on the definition of primary carer used by the Australian Bureau of Statistics Survey of Disability, Ageing and Carers (cat. no. 4430), and is the number of people who provided the most informal help needed by a person with disability. Eligibility for Carer Payment or Carer Allowance is not determined by the Australian Bureau of Statistics definition of a primary carer.21 See previous note.

FaHCSIA Budget Statements
Carer Supplement Number of recipients Administered outlays

FaHCSIA Budget Statements
Program 5.4: Services and Support for People with Disability
Program 5.4 Objective To provide supported employment and improve access to information, advocacy and services for people with disability so they can develop their capabilities and actively participate in community and economic life.Program Component ObjectivesServices for People with Disability
To provide social support and community-based care for people with disability, their carers and their families, to promote independence, self reliance and participation in the community. Deliverables and expenses for Helping Children with Autism – Early Intervention and the Better Start for Children with Disability initiative have moved to the new Program 5.7.Linked to: Disability employment services funded by the Department of Education, Employment and Workplace Relations (DEEWR). For more information refer to DEEWR’s 2012–13 PB Statements.

FaHCSIA Budget Statements
Program 5.4 ExpensesThe changes in program expenses across the forward years reflect projected changes in indexation parameters and the impact of policy initiatives. These initiatives include a 2010 election commitment that provides $60 million over four years to June 2014 for capital grants to community and other organisations for the construction of 150 new supported accommodation and respite places for people with disability.
Table 2.5.4: Budgeted Expenses for Services and Support for People with Disability
Annual administered expenses: 1
Services for People w ith Disability 325,943 320,388 335,485 318,737 335,476Helping Children w ith Autism EarlyIntervention 56,170 - - - -
Special Account expenses: National Disability Special Account 891 1,523 2,835 1,750 1,480
Program support 43,596 35,457 33,195 28,827 32,158Expenses not requiring appropriation in
the Budget year 2 3,929 3,163 2,880 2,521 3,016
Total program expenses 430,529 360,531 374,395 351,835 372,130Note: Departmental appropriation splits and totals, by outcome and program, are indicativeestimates and may change in the course of the Budget year as government priorities change.1 From 2012-13, the appropriations for Helping Children w ith Autism Early Intervention and Better Start for Children w ith Disability are reported under Program 5.7 Early Intervention Services for Children w ith Disability.2 'Expenses not requiring appropriation in the Budget year' is made up of Depreciation, Amortisation and Makegood Expenses.
2011–12Revisedbudget
$'000
2012–13Budget
$'000
2013–14Forw ard
year 1$'000
2014–15Forw ard
year 2$'000
2015–16Forw ard
year 3$'000

FaHCSIA Budget Statements
Program 5.4 Deliverables Number of supported employees assisted by supported employment
services Number of carers of people with severe or profound disability assisted
with short-term or immediate respite Number of clients receiving Outside School Hours Care for Teenagers
with Disability services Number of people with disability provided with direct advocacy support Number of new supported accommodation and respite places
Services and Support for People with Disability Deliverables Targets
Deliverables 2011–12 Revised Budget
2012–13 Budget
2013–14 Forward
year 1
2014–15 Forward
year 2
2015–16 Forward
year 3
Number of supported employees assisted by supported employment services
22,500 22,500 22,500 22,500
Number of carers of people with severe or profound disability assisted with short-term or immediate respite
5,500 5,500 5,500 5,500
Number of clients receiving Outside School Hours Care for Teenagers with Disability services
1,800 1,800 1,800 1,800
Number of people with disability provided with direct advocacy support
10,800 10,800 10,800 10,800
Number of new supported accommodation and respite places that were delivered
- - 150 -

FaHCSIA Budget Statements
Program 5.4 Key Performance Indicators Number of supported employees who achieve an employment outcome
(at least eight hours per week for at least 13 weeks from commencement in a supported employment place)
Percentage and number of individuals, parents and carers who report that they were assisted to access choices and options that enabled them to manage their needs
Percentage and number of supported employees/clients likely to have reduced reliance on income support payments (sufficient income to affect DSP)
Percentage and number of clients from Indigenous and culturally and linguistically diverse backgrounds
Percentage and number of clients reporting that the services received were appropriate to their needs as parents/carers
Number of new supported accommodation and respite places that were delivered

FaHCSIA Budget Statements
Program 5.5: Support for Carers
Program 5.5 Objective To provide peer support, respite and information services for carers to help them balance their care responsibilities with social participation and, in the case of young carers, complete their education.
Program 5.5 ExpensesThe increase in program expenses over the forward estimates reflects projected changes in indexation parameters.
Table 2.5.5: Budget Expenses for Support for Carers
Annual administered expenses:Support for Carers 12,648 12,127 11,873 12,064 12,281
Program support 8,908 8,601 8,552 8,660 8,598Expenses not requiring appropriation in
the Budget year 1 803 767 742 757 806
Total program expenses 22,359 21,495 21,167 21,481 21,685
Note: Departmental appropriation splits and totals, by outcome and program, are indicativeestimates and may change in the course of the Budget year as government priorities change.1 'Expenses not requiring appropriation in the Budget year' is made up of Depreciation, Amortisation and Makegood Expenses.
2011–12Revisedbudget
$'000
2012–13Budget
$'000
2013–14Forw ard
year 1$'000
2014–15Forw ard
year 2$'000
2015–16Forw ard
year 3$'000

FaHCSIA Budget Statements
Program 5.5 Deliverables Number of young carers at risk of not completing secondary education
assisted with respite services Number of parents and carers assisted by MyTime peer support
groups
Support for Carers Deliverables TargetsDeliverables 2011–12
Revised Budget
2012–13 Budget
2013–14 Forward
year 1
2014–15 Forward
year 2
2015–16 Forward
year 3
Number of young carers at risk of not completing secondary education assisted with respite services
3,500 3,500 3,500 3,500 3,500
Number of parents and carers assisted by MyTime peer support groups
3,000 3,000 3,000 3,000 3,000
Program 5.5 Key Performance IndicatorsSupport for Carers Percentage and number of clients from Indigenous and culturally and
linguistically diverse backgrounds Percentage of clients satisfied that the services they received were
appropriate to their needs as carers

FaHCSIA Budget Statements
Program 5.6: National Disability Insurance Scheme
Program 5.6 Objective To improve the wellbeing and social and economic participation of people with disability and their carers by building a National Disability Insurance Scheme that delivers care and support through an insurance approach.
Program 5.6 ExpensesThe increase in program expenses across the forward estimates reflects a gradual take-up of individually funded packages by eligible people with disability in selected locations. In particular, increased program expenses reflect an expansion in the number of people with disability receiving support, from 10,000 people in 2013–14 to 20,000 people in 2014–15 and 2015–16.
Table 2.5.6: Budgeted Expenses for National Disability Insurance Scheme
Annual administered expenses:National Disability Insurance Scheme - 29,841 80,673 169,950 211,575
Program support 1 - 28,613 58,482 111,302 119,429Expenses not requiring appropriation in
the Budget year 2 - 8,467 40,179 61,559 63,759
Total program expenses - 66,921 179,334 342,811 394,763
Note: Departmental appropriation splits and totals, by outcome and program, are indicativeestimates and may change in the course of the Budget year as government priorities change.1 Program support includes funding for the National Disability Launch Transition Agency.2 'Expenses not requiring appropriation in the Budget year' is made up of Depreciation, Amortisation and Makegood Expenses.
2011–12Revisedbudget
$'000
2012–13Budget
$'000
2013–14Forw ard
year 1$'000
2014–15Forw ard
year 2$'000
2015–16Forw ard
year 3$'000

FaHCSIA Budget Statements
Program 5.6 Deliverables National Disability Insurance Scheme Eligible people in first stage locations with disability are provided with
reasonable and necessary care and support A National Disability Launch Transition Agency is established to prepare
for the first stage of an NDIS An information and communications technology (ICT) system is
established to collect data for the first stage to support an insurance approach and ensure accountability of funds
Support is provided to the disability sector to prepare for the first stage of the NDIS, including implementing:
- An NDIS Practical Design Fund that funds demonstration projects to informtransition to an NDIS
Qualitative Deliverables
Preparations for the first stageEstablishment of a National Disability Launch Transition AgencyDelivery of $10 million in demonstration projects to inform transition to an NDISNational Disability Launch Transition AgencyEstablishment of a National Disability Launch Transition AgencyICT systemEstablishment of an ICT system that supports the first stage of an NDISThe ICT system has the capacity to collect data to support the insurance approach and ensure accountability of funds
NDIS Deliverables Targets Deliverables 2011–12
Revised Budget
2012–13 Budget
2013–14 Forward
year 1
2014–15 Forward
year 2
2015–16 Forward
year 3
Number of people provided with care and support
- 10,000 20,000 20,000
Number of regional offices established
- 2 4 4

FaHCSIA Budget Statements
Program 5.6 Key Performance Indicators Eligible people with disability in launch sites are provided with reasonable
and necessary care and support The establishment of a National Disability Launch Transition Agency in
preparation for the first stage of an NDIS Timely and effective policy advice is provided on the implementation of
an NDIS An evidence base is developed to inform an insurance approach to
disability care and support Support is provided to the disability sector to prepare for the first stage
of an NDIS
Qualitative Key Performance Indicators
A National Disability Launch Transition Agency is established in preparation for the first stage of the NDISTimely and effective policy advice is provided on the implementation of an NDISAn effective ICT system is established to support the data collection required for an insurance approachSupport is provided to the disability sector to prepare for the first stage of an NDIS

FaHCSIA Budget Statements
Program 5.7: Early Intervention Services for Children with Disability
Program 5.7 Objective To provide access to early intervention services and support for children with disability, their parents, carers and families to help eligible children achieve their potential.Program Component ObjectivesHelping Children with Autism package
Early Intervention services – to provide access to early intervention services for eligible children to assist them achieve their potential.Education and support for parents, carers and families – to provide information and support to parents, carers and families to help them enable eligible children with disability to achieve their potential.Autism Specific Early Learning and Care Centres – to provide early learning programs and specific support to children with Autism Spectrum Disorder (ASD) in a long day-care setting.Better Start for Children with Disability
Early Intervention services – to provide access to early intervention services for eligible children to assist them achieve their potential.Education and support for parents, carers and families – to provide information and support to parents, carers and families to help them enable eligible children with disability to achieve their potential.

FaHCSIA Budget Statements
Program 5.7 ExpensesThe changes in program expenses across the forward years reflect the maturing service use patterns in Better Start for Children with Disability and an increase in the prevalence of autism, in line with international experience.
Table 2.5.7: Budgeted Expenses for Early Intervention Services for Children with Disability
Annual administered expenses: 1
Helping Children w ith Autism EarlyIntervention - 60,234 61,001 61,693 62,500Better Start for Children w ith Disability - 25,000 26,286 24,924 25,229
Program support - 10,262 8,636 7,833 9,349Expenses not requiring appropriation in
the Budget year 2 - 915 749 685 877
Total program expenses - 96,411 96,672 95,135 97,955
Note: Departmental appropriation splits and totals, by outcome and program, are indicativeestimates and may change in the course of the Budget year as government priorities change.1 The 2011-12 appropriations for Helping Children w ith Autism Early Intervention and Better Start for Children w ith Disability are reported under Program 5.4 Services and Support for People w ith Disability2 'Expenses not requiring appropriation in the Budget year' is made up of Depreciation, Amortisation and Makegood Expenses.
2011–12Revisedbudget
$'000
2012–13Budget
$'000
2013–14Forw ard
year 1$'000
2014–15Forw ard
year 2$'000
2015–16Forw ard
year 3$'000
Program 5.7 Deliverables Eligible children with disability have access to early intervention services Parents, carers and families of eligible children have access to
information and support
Program 5.7 Key Performance Indicators Number of eligible children with disability receiving early intervention
services Percentage and number of eligible children with disability from
Indigenous and culturally and linguistically diverse backgrounds receiving early intervention services
Number of parents/carers who access information and support services

FaHCSIA Budget Statements
Outcome 6: WomenImproved gender equality through coordinated whole of government advice and support for women’s economic security, safety and status.
Outcome 6 Strategy
The Office for Women works with other portfolios across government to advance gender equality and improve the status and wellbeing of women in Australia. It delivers programs and provides policy advice across three priority areas:• reducing violence against women• improving economic outcomes for women• ensuring women’s equal place in society.Equality benefits women and men, as well as their families and communities. Progress towards equality prevents women from falling into poverty and improves outcomes for the most vulnerable women and their families.Violence against women is one of the most serious causes and consequences of continued inequality and one of the key risk factors for women slipping into poverty and disadvantage. Through the National Plan to Reduce Violence against Women and their Children (February 2011), the Australian Government is working with the states and territories to focus on primary prevention, building the evidence base and improving services for victims and their families. The Office for Women also administers the Support for Victims of Trafficking Program.Improving women's economic outcomes is key to achieving equality between women and men in Australia. It will also significantly boost Australia's productivity. Reforms to the Equal Opportunity for Women in the Workplace Act 1999, announced in March 2011 and introduced into Parliament in March 2012, will support improved workforce participation for women and gender equality in Australian workplaces.
The Office for Women also undertakes a range of other work through the Gender Equality Program, including:• building women’s capacity to take on leadership responsibilities and
improve the gender balance on government boards and bodies• supporting women and women’s organisations to engage actively with
government • encouraging a gender-based analysis of important policy decisions across
government

FaHCSIA Budget Statements
• representing government at national and international forums, such as the United Nations, to promote equality, women’s empowerment and women’s leadership.
Outcome Expense Statement
Table 2.6 provides an overview of the total expenses for Outcome 6, by program.
Table 2.6: Budgeted Expenses for Outcome 6Outcome 6: Women
Program 6.1: Gender Equality for WomenAdministered expenses
Ordinary annual services (Appropriation Bill No. 1) 33,892 27,126Departmental expenses
Departmental appropriation 1 16,030 15,714Expenses not requiring appropriation in the Budget year 2 1,445 1,402
Total for Program 6.1 51,367 44,242Outcome 6 Totals by appropriation type:Administered expenses
Ordinary annual services (Appropriation Bill No. 1) 33,892 27,126Departmental expenses
Departmental appropriation 1 16,030 15,714Expenses not requiring appropriation in the Budget year 2 1,445 1,402
Total expenses for Outcome 6 51,367 44,242
2011–12 2012–13Average Staffing Level (number) 98 95
estimates and may change in the course of the Budget year as government priorities change.1 Departmental Appropriation combines 'Ordinary annual services (Appropriation Bill No. 1)' and 'Revenue from independent sources (s31)'.2 'Expenses not requiring appropriation in the Budget year' is made up of Depreciation, Amortisation and Makegood Expenses.
Note: Departmental appropriation splits and totals, by outcome and program, are indicative
2011–12Estimated
actualexpenses
$'000
2012–13Estimatedexpenses
$'000

FaHCSIA Budget Statements
Contributions to Outcome 6: WomenProgram 6.1: Gender Equality for Women
Program 6.1 Objective To implement strategies in priority areas to achieve gender equality. The priority areas include reducing violence against women, improving economic outcomes for women, and ensuring women’s equal place in society.Program component objectivesGender Equality for WomenTo implement strategies in priority areas to achieve gender equality.Other Services – Services for other Government and Non-Government Bodies (Special Account)To manage expenditure in connection with services performed on behalf of other governments and bodies that are not agencies subject to the FMA Act, including the COAG Select Council on Women's Issues.22
22 In September 2011, the COAG Select Council on Women’s Issues replaced the former Commonwealth, State, Territory and New Zealand Ministers’ Conference on the Status of Women following a COAG review of its ministerial council system.

FaHCSIA Budget Statements
Program 6.1 ExpensesThe changes in program expenses across the forward years reflect projected changes in indexation parameters and the impact of policy initiatives. The increase in estimates in 2013–14 reflects the effect of the National Plan to Reduce Violence Against Women and their Children 2010–2022 introduced in 2010–11 Additional Estimates. The high relative funding in 2011–12 is due to a movement of funds previously approved from 2010–11.
Table 2.6.1: Budget Expenses for Gender Equality for Women
Annual administered expenses:Gender Equality for Women 33,892 27,126 31,785 29,747 30,383
Program support 16,030 15,714 15,983 15,768 15,724Expenses not requiring appropriation in
the Budget year 1 1,445 1,402 1,387 1,379 1,475
Total program expenses 51,367 44,242 49,155 46,894 47,582Note: Departmental appropriation splits and totals, by outcome and program, are indicativeestimates and may change in the course of the Budget year as government priorities change.1 'Expenses not requiring appropriation in the Budget year' is made up of Depreciation, Amortisation and Makegood Expenses.
2011–12Revisedbudget
$'000
2012–13Budget
$'000
2013–14Forw ard
year 1$'000
2014–15Forw ard
year 2$'000
2015–16Forw ard
year 3$'000

FaHCSIA Budget Statements
Program 6.1 Deliverables Number of contacts for 1800RESPECT – the National Sexual
Assault, Domestic Family Violence Counselling Service (telephone and online)23
Gender Equality for Women Deliverables TargetsDeliverable 2011–12
Revised Budget
2012–13 Budget
2013–14 Forward
year 1
2014–15 Forward
year 2
2015–16 Forward
year 3
Number of contacts for 1800RESPECT - the National Sexual Assault, Domestic Family Violence Counselling Service (telephone and online)
20,000 20,000 20,000 20,000 20,000
Program 6.1 Key Performance IndicatorsGender Equality for Women Percentage and number of women representatives on Australian
government boards Assessment by stakeholders of the contribution of the Office for Women
to national debates affecting gender equality Percentage and number of contacts for 1800RESPECT – the National
Sexual Assault, Domestic Family Violence Counselling Service (telephone and online) – who are women24
23 The Helpline Program ceased to operate on 30 September 2010. The new service, 1800RESPECT, commenced operations on 1 October 2010.24 1800RESPECT counts ‘contacts’ rather than individual incoming telephone calls. Contacts include returned calls, emails responded to and interactive online counselling sessions.

FaHCSIA Budget Statements
Outcome 7: IndigenousClosing the gap in Indigenous disadvantage with improved wellbeing, capacity to participate economically and socially and to manage life-transitions for Indigenous Australians through Indigenous engagement, coordinated whole of government policy advice and targeted support services.
Outcome 7 Strategy
FaHCSIA is the lead agency in the Australian Government for Indigenous affairs, and coordinates the Australian Government’s contribution to the Closing the Gap strategy agreed by the Council of Australian Governments (COAG) in 2008.It has direct responsibility for Indigenous policy and programs in the areas of remote housing and support for essential services; land rights and support for Indigenous people’s participation in the native title system; community development; leadership development and capacity building; engagement with Indigenous Australians; and building positive relationships between Indigenous and other Australians.FaHCSIA’s work across all of its outcomes has a major impact on Aboriginal and Torres Strait Islander people in areas such as:• financial, family and housing support: ensuring that new and existing
child, family and individual support payments and services are sensitive to the needs of Indigenous people and ensuring that Indigenous people can access a range of healthy housing options, as well as essential services in remote areas
• encouraging self reliance and participation: tackling violence, working with communities to find solutions to alcohol abuse, ensuring that welfare payments promote participation, and helping Indigenous people to use land, housing and other assets to build economic independence
• building capacity and resilience: providing leadership skills to individuals and promoting good governance in organisations and communities so they can work to build better and more self-sufficient futures.
COAG’s National Indigenous Reform Agreement provides the framework for Closing the Gap on Indigenous disadvantage. The agreement sets out six ambitious targets to close the gap: in life expectancy, infant mortality, pre-school education, education, and employment; and identifies seven inter-related ‘building blocks’ which are a focus for investment and effort: Early Childhood, Schooling, Health, Healthy Homes, Economic Participation, Safe Communities, and Governance and Leadership. FaHCSIA coordinates policy development for Closing the Gap across the Australian Government, including through coordination of the Single Indigenous Budget Submission and through evaluating the impacts of existing Indigenous programs and policies. It promotes cooperation among Commonwealth agencies that are partners in Closing the Gap. These

FaHCSIA Budget Statements
agencies – including FaHCSIA, the Department of Education, Employment and Workplace Relations, the Department of Health and Ageing, the Department of Human Services and the Attorney-General’s Department – meet regularly to coordinate their contributions to the National Indigenous Reform Agreement. Multilateral engagement is facilitated through the Working Group on Indigenous Reform, which includes representatives from the states and territories and reports directly to COAG.The challenges of Closing the Gap are greatest in remote regions and much of FaHCSIA’s Indigenous-specific expenditure is focused in these areas. The Department also has a key role in ensuring that services delivered through mainstream programs and national partnership agreements are accessible to Indigenous Australians across Australia. The National Urban and Regional Service Delivery Strategy for Indigenous Australians, agreed by COAG in July 2009, is coordinated by FaHCSIA and addresses the disadvantage experienced by many Indigenous Australians living in urban and regional areas. Of the seven Indigenous-specific national partnership agreements, FaHCSIA is leading the implementation of three:• Remote Indigenous Housing, with a commitment of $5.5 billion to 2018 to
build and upgrade houses in remote Indigenous communities• Remote Service Delivery, which is coordinating services in 29 priority
locations to 2015• Closing the Gap in the Northern Territory, which has been working to
improve services, safety and economic opportunities in Indigenous communities in the Northern Territory. This agreement will cease on 30 June 2012 and will be replaced by the proposed Stronger Futures in the Northern Territory National Partnership Agreement. Negotiations are under way with the Northern Territory Government to agree this new national partnership agreement.
The Department’s extensive on-the-ground network engages with Indigenous people through offices across Australia and through staff living and working in many remote communities, including locally employed Indigenous Engagement Officers. The network consults with people and communities, provides tailored solutions to local issues, and promotes take-up of services across government, both Indigenous-specific and mainstream. The FaHCSIA 2012–13 Budget for Outcome 7 reflects the Government’s commitment to work within its overall fiscal strategy to strengthen existing Closing the Gap initiatives. It improves outcomes for Indigenous people in the Northern Territory where disadvantage is greatest and where the Closing the Gap in the Northern Territory National Partnership Agreement and the Northern Territory Emergency Response legislation are due to expire. FaHCSIA is contributing to two significant cross-portfolio measures: the Stronger Futures in the Northern Territory package and the Remote Jobs and Communities Program.

FaHCSIA Budget Statements
Over the last four years, efforts to close the gap in the Northern Territory have resulted in real progress in areas such as health, housing, safer communities and the availability of healthy food. There is, however, much more to be done. This Budget delivers on the need for comprehensive and long-term investment to underpin Closing the Gap in the Northern Territory. The Stronger Futures package is a 10-year commitment to help Indigenous people living in the Northern Territory live strong and independent lives. It builds on existing initiatives and responds to urgent needs and issues identified by Indigenous people in consultations last year.The new Remote Jobs and Communities Program will provide a more integrated and flexible approach to employment and participation services for people living in remote areas of Australia. It will help people get the skills needed to find and keep a job, and participate in activities that contribute to the strength and sustainability of their community.The Australian Government is providing $43.4 million in the 2012–13 Budget to support the continuation of basic municipal and essential services to approximately 38,000 people in approximately 350 remote Indigenous communities across Queensland, South Australia, Tasmania, Victoria and Western Australia. These services include power, water and sewerage services; garbage collection and disposal; internal road maintenance; landscaping and dust control; animal and environmental health programs; and organisational governance. The Commonwealth and state and territory governments recently agreed to work together to progress genuine reform in this critical area. The Cape York Welfare Reform project is working with four communities in far north Queensland to trial new approaches to the provision of welfare and to strengthen social responsibility, economic opportunities, education and housing. The trial will be extended for 12 months to 31 December 2013 to enable important elements to continue while the trial’s outcomes are being evaluated. The Commonwealth is seeking a commitment from the Queensland Government to continue funding for Cape York Welfare Reform activities. FaHCSIA‘s activities also help to foster stronger relationships between Indigenous and non-Indigenous Australians, based on mutual respect. On 19 January 2012, the Australian Government received advice from an expert panel on how constitutional recognition of Aboriginal and Torres Strait Islander peoples might be achieved. The Australian Government is providing $10 million to continue to build community awareness and support for this signature reform so that a proposal can be put to the Australian people at a future referendum.
Outcome Expense Statement
Table 2.7 provides an overview of the total expenses for Outcome 7, by program.

FaHCSIA Budget Statements
Table 2.7: Budgeted Expenses for Outcome 7Outcome 7: Indigenous
Program 7.1: Economic Development and ParticipationAdministered expenses
Ordinary annual services (Appropriation Bill No. 1) 1 249,110 182,062Departmental expenses
Departmental appropriation 3 47,100 29,165Expenses not requiring appropriation in the Budget year 4 4,245 2,602
Total for Program 7.1 300,455 213,829Program 7.2: Indigenous Housing and InfrastructureAdministered expenses
Ordinary annual services (Appropriation Bill No. 1) 2 106,855 66,965Special Accounts 1,156 -
Departmental expensesDepartmental appropriation 3 34,217 32,262
Expenses not requiring appropriation in the Budget year 4 3,084 2,878
Total for Program 7.2 145,312 102,105Program 7.3: Native Title and Land RightsAdministered expenses
Ordinary annual services (Appropriation Bill No. 1) 84,258 86,869Departmental expenses
Departmental appropriation 3 7,129 7,067Expenses not requiring appropriation in the Budget year 4 643 631
Total for Program 7.3 92,030 94,567Program 7.4: Indigenous Capability and DevelopmentAdministered expenses
Ordinary annual services (Appropriation Bill No. 1) 74,968 70,920Special Appropriations 159,351 160,447Special Accounts 232,566 229,990
Departmental expensesDepartmental appropriation 3 97,491 106,088
Expenses not requiring appropriation in the Budget year 4 8,787 9,463
Total for Program 7.4 573,163 576,908
2011–12Estimated
actualexpenses
$'000
2012–13Estimatedexpenses
$'000
(continued on next page

FaHCSIA Budget Statements
Table 2.7: Budgeted Expenses for Outcome 7 (continued)Outcome 7: Indigenous
Program 7.5: Stronger Futures in the Northern TerritoryAdministered expenses
Ordinary annual services (Appropriation Bill No. 1) 22,349 5,982Special Appropriations 19,498 12,271
Departmental expensesDepartmental appropriation 3 90,831 71,208
Expenses not requiring appropriation in the Budget year 4 8,187 6,352
Total for Program 7.5 140,865 95,813Outcome 7 Totals by appropriation type:Administered expenses
Ordinary annual services (Appropriation Bill No. 1) 537,540 412,798Special Appropriations 178,849 172,718Special Accounts 233,722 229,990
Departmental expensesDepartmental appropriation 3 276,768 245,790
Expenses not requiring appropriation in the Budget year 4 24,946 21,926
Total expenses for Outcome 7 1,251,825 1,083,222
2011–12 2012–13Average Staffing Level (number) 945 945
Note: Departmental appropriation splits and totals, by outcome and program, are indicativeestimates and may change in the course of the Budget year as government priorities change.1 The change in 2012-13 is primarily due to movements associated w ith the new Remote Jobs and Communities program.2 The reduction of funding for 2012-13 is primarily due to the transfer of funds from FaHCSIA to the Department of the Treasury for the Stronger Futures in the Northern Territory National Partnership.3 Departmental appropriation combines 'Ordinary annual services (Appropriation Bill No. 1)' and 'Revenue from independent sources (s31)'.4 'Expenses not requiring appropriation in the Budget year' is made up of Depreciation, Amortisation and Makegood Expenses.
2011–12Estimated
actualexpenses
$'000
2012–13Estimatedexpenses
$'000

FaHCSIA Budget Statements
Contributions to Outcome 7: Indigenous
Program 7.1: Economic Development and Participation
Program 7.1 Objective To improve the capacity of Indigenous Australians to participate in the economy.Program component objectivesCommunity Development Employment Projects (CDEP) Program
To strengthen Indigenous communities and support Indigenous people in remote areas through community development and participation opportunities that develop skills, improve capacity, work readiness and employability and link with local priorities.Linked to: The Community Development Employment Projects (CDEP) Program works in tandem with Job Services Australia and the Indigenous Employment Program. Payments under the National Partnership Agreement on Indigenous Economic Participation are made by the Treasury.For further information on this program, refer to DEEWR’s 2012–13 PB Statements.Also linked to: Program 7.5, Stronger Futures in the Northern Territory.

FaHCSIA Budget Statements
Program 7.1 ExpensesThe changes in program expenses across the forward years are driven by projected changes in indexation parameters and the impact of policy initiatives. The change in 2012–13 is primarily due to movements associated with the new Remote Jobs and Communities package.
Table 2.7.1: Budgeted Expenses for Economic Development and Participation
Annual administered expenses:Community DevelopmentEmployment Projects Program 249,110 182,062 80,086 88,735 89,764
Program support 47,100 29,165 14,521 15,251 15,157Expenses not requiring appropriation in
the Budget year 1 4,245 2,602 1,260 1,334 1,421
Total program expenses 300,455 213,829 95,867 105,320 106,342
Note: Departmental appropriation splits and totals, by outcome and program, are indicativeestimates and may change in the course of the Budget year as government priorities change.1 'Expenses not requiring appropriation in the Budget year' is made up of Depreciation, Amortisation and Makegood Expenses.
2011–12Revisedbudget
$'000
2012–13Budget
$'000
2013–14Forw ard
year 1$'000
2014–15Forw ard
year 2$'000
2015–16Forw ard
year 3$'000

FaHCSIA Budget Statements
Program 7.1 Deliverables
Number of Community Development Projects Number of Work Readiness Services
Program 7.1 Key Performance Indicators Percentage of the Community Action Plans that are progressing on
schedule to meet community development goals for CDEP by 30 June 2013
Percentage and number of CDEP participants who have commenced non-accredited training
Percentage and number of CDEP participants who have commenced and completed accredited training
Percentage and number of CDEP participants who commenced work experience and remained in continued work experience for 13 weeks or more
Percentage and number of CDEP participants who commenced off-CDEP employment
Percentage and number of CDEP participants who commenced off-CDEP employment and who remained in continued employment for 13 weeks or more
Economic Development and Participation Key Performance IndicatorsKey Performance Indicators 2011–12
Revised Budget
2012–13 Budget
target
2013–14 Forward
year 1
2014–15 Forward
year 2
2015–16 Forward
year 3
Percentage of the Community Action Plans that are progressing on schedule to meet community development goals for CDEP by 30 June 2013
- 85% - - -

FaHCSIA Budget Statements
Program 7.2: Indigenous Housing and Infrastructure
Program 7.2 Objective To improve the quality and supply of Indigenous housing and infrastructure in remote communities.Program Component Objectives
Remote Indigenous Housing
To deliver programs and projects that support the National Partnership Agreement on Remote Indigenous Housing, as part of the $5.5 billion commitment, including the Remote Indigenous Energy Program, the Army Aboriginal Community Assistance Program, and other housing and infrastructure projects. In addition, funding is provided for delivery of some municipal and essential services to Indigenous communities under existing arrangements pending the implementation of revised arrangements for roles, responsibilities and funding across governments as agreed under the National Partnership Agreement on Remote Indigenous Housing. Indigenous Boarding Hostels Partnerships To provide funding to establish student accommodation for Indigenous young people from remote areas.Linked to: Payments under the National Partnership Agreement on Remote Indigenous Housing, the National Partnership Agreement on Homelessness, the National Partnership Agreement on Social Housing and the National Affordable Housing Agreement are made by the Treasury. For information about those payments, refer to the Treasury’s 2012–13 PB Statements and Budget Paper No. 3, Australia’s Federal Relations.Also linked to: The Stronger Futures in the Northern Territory National Partnership Agreement – negotiations are under way with the Northern Territory Government for this agreement and it is expected to commence on 1 July 2012.

FaHCSIA Budget Statements
Program 7.2 ExpensesThe changes in program expenses across the forward years reflect projected changes in indexation parameters and the completion of projects under the Indigenous Boarding Hostels Partnership and Remote Indigenous Housing Program. Changes also reflect government decisions, in particular the additional funding provided through the Remote Indigenous Energy Program, which forms part of the Clean Energy Future plan and the extension of the funding for the Municipal and Essential Services Program for an additional year while the Commonwealth, the states and the Northern Territory work towards clearer roles and responsibilities for funding and delivery of municipal and essential services and infrastructure.The reduction of funding for 2012–13 is primarily due to the transfer of funds from FaHCSIA to the Department of the Treasury for the Stronger Futures in the Northern Territory National Partnership.
Table 2.7.2: Budgeted Expenses for Indigenous Housing and Infrastructure
Annual administered expenses:Remote Indigenous Housing1 101,855 66,965 77,233 77,596 80,456Indigenous Boarding Hostels Partnerships 5,000 - - - -
Special Account expenses: Other Services - Services for OtherEntities and Trust Moneys 1,156 - - - -
Program support 34,217 32,262 32,289 32,112 31,975Expenses not requiring appropriation in
the Budget year 2 3,084 2,878 2,801 2,808 2,998
Total program expenses 145,312 102,105 112,323 112,516 115,429Note: Departmental appropriation splits and totals, by outcome and program, are indicativeestimates and may change in the course of the Budget year as government priorities change.1 Remote Indigenous Housing includes the impact of Stronger Futures in the Northern Territory initiatives in 2012-13 only. The Stronger Futures in the Northern Territory initiative is a ten year commitment. Estimates from 2013-14 onw ards w ill be f inalised follow ing negotiations w ith the Northern Territory Government regarding the Stronger Futures NPA.2 'Expenses not requiring appropriation in the Budget year' is made up of Depreciation, Amortisation and Makegood Expenses.
2011–12Revisedbudget
$'000
2012–13Budget
$'000
2013–14Forw ard
year 1$'000
2014–15Forw ard
year 2$'000
2015–16Forw ard
year 3$'000

FaHCSIA Budget Statements
Program 7.2 Deliverables Number of hostel beds for Indigenous students made available to a
hostel operator by 30 June 2012 Number of hostel beds for Indigenous mothers made available to a hostel
operator by 30 June 2012 Number of communities receiving municipal and essential services
funded by the Commonwealth Number of renewable energy systems installed25
National Programs and Projects Deliverables Targets 2011–12 2012–13 2013–14 2014–15 2015–16
Revised Budget Forward Forward ForwardDeliverables budget year 1 year 2 year 3
Number of hostel beds for Indigenous students made available to a hostel operator by 30 June 2012
120 - - - -
Number of hostel beds for Indigenous mothers made available to a hostel operator by 30 June 2012
16 - - - -
Number of renewable energy systems installed
- up to 5 - - -
COAGThis program also contributes to the objectives of the National Partnership Agreement on Remote Indigenous Housing and the Stronger Futures in the Northern Territory National Partnership Agreement being negotiated at the time of this publication.
25 Although the Remote Indigenous Energy program was announced as part of the 2011–12 Budget, service delivery does not start until 2012–13.

FaHCSIA Budget Statements
Program 7.2 Key Performance Indicators Percentage and number of programs and projects that met specified
project objectives by 30 June 201326
Percentage and number of new hostel construction projects for Indigenous students that met specified project objectives by 30 June 2012
Percentage and number of new hostel construction projects for Indigenous mothers that met specified project objectives by 30 June 2012
26 Additional KPI added to track performance of other programs and projects funded through this appropriation.

FaHCSIA Budget Statements
Program 7.3: Native Title and Land Rights
Program 7.3 Objective To support Indigenous rights to land recognised or provided through Commonwealth land rights legislation and facilitate the representation and assistance of native title claimants and holders in the pursuit and exercise of native title rights.Program Component Objectives
Native TitleTo provide representation and assistance for native title holders and claimants in their efforts to gain formal recognition of native title rights and in the exercise of those rights, through a network of funded native title representative bodies and native title service providers. The formal recognition and exercise of native title rights can contribute to closing the gap for affected communities by facilitating greater economic and social participation.Land Rights
To support Indigenous rights to land recognised or provided for through Commonwealth land rights legislation.Linked to: For other Commonwealth expenditure on the native title system, see Attorney-General’s Department’s 2012–13 PB Statements.

FaHCSIA Budget Statements
Program 7.3 ExpensesThe increase in program expenses across the forward years reflects projected changes in indexation parameters and the impact of policy initiatives.
Table 2.7.3: Budgeted Expenses for Native Title and Land Rights
Annual administered expenses:Native Title and Land Rights 84,258 86,869 88,510 90,191 91,904
Program support 7,129 7,067 7,603 7,155 6,691Expenses not requiring appropriation in
the Budget year 1 643 631 660 626 627
Total program expenses 92,030 94,567 96,773 97,972 99,222Note: Departmental appropriation splits and totals, by outcome and program, are indicativeestimates and may change in the course of the Budget year as government priorities change.1 'Expenses not requiring appropriation in the Budget year' is made up of Depreciation, Amortisation and Makegood Expenses.
2011–12Revisedbudget
$'000
2012–13Budget
$'000
2013–14Forw ard
year 1$'000
2014–15Forw ard
year 2$'000
2015–16Forw ard
year 3$'000
Program 7.3 Deliverables
Deliverables cannot be forecast over the forward years as services under this program are demand driven, and completion rates are determined in a complex interaction with other stakeholders, often with conflicting interests
Program 7.3 Key Performance IndicatorsNative Title Proportion of native title claims progressed Proportion of native title claims concluded Number of future act agreements progressed and concluded

FaHCSIA Budget Statements
Program 7.4: Indigenous Capability and Development
Program 7.4 Objective To provide support for individuals, families and communities to improve wellbeing, capability and governance.Program Component ObjectivesAboriginal and Torres Strait Islander Land AccountTo provide a secure and ongoing source of funds to the Indigenous Land Corporation in perpetuity to provide economic, environmental, social and cultural benefits for Aboriginal people and Torres Strait Islanders by assisting in the acquisition and management of land. From 1 July 2010, the Indigenous Land Corporation was provided a minimum guaranteed annual payment of $45 million indexed each year by the consumer price index.Aboriginals Benefit Account (Special Appropriation)To administer statutory royalty equivalent monies calculated from royalties paid to Government from mining on Aboriginal land in the Northern Territory under the Aboriginal Land Rights (Northern Territory) Act 1976, consistent with the FMA Act. The Aboriginals Benefit Account (ABA) funds are held in trust and distributed for the benefit of Aboriginal people living in the Northern Territory. Funds are distributed to the four Northern Territory land councils for administrative purposes; to royalty associations for areas affected by mining; to the Office of Township Leasing for administration costs and rental payments associated with township leases; as grants for the benefit of Aboriginal people living in the Northern Territory; and to meet expenses associated with administering the ABA.Support for Constitutional Recognition for Indigenous Australians To provide funding to build public awareness and community support for the recognition of Aboriginal and Torres Strait Islander peoples in the Constitution. Reconciliation Australia will be funded to lead the community awareness initiative. Guided by a reference group of several former Expert Panel members and business and community groups, it will support community groups and activities aimed at increasing public awareness and support for constitutional recognition. Flexible FundingTo address priority needs through flexible funding for strategic investments, including community projects in Remote Service Delivery National Partnership Agreement priority communities and elsewhere.Breaking the Cycle of Alcohol and Drug Abuse in Indigenous Communities ActivityUnder the Breaking the Cycle of Alcohol and Drug Abuse in Indigenous Communities Activity, the Government has committed $20 million over three years (2011–12 to 2013-14) to assist a number of communities in remote, regional or urban areas address alcohol and substance misuse

FaHCSIA Budget Statements
issues through the development and implementation of Alcohol and Substance Abuse Management Plans.

FaHCSIA Budget Statements
Program Component Objectives (continued)Indigenous Capability and DevelopmentTo deliver services that support Indigenous individuals, families and communities to improve their wellbeing and engagement with government, with a focus on leadership, capacity building and promoting Indigenous culture and knowledge, and to provide funding for independent organisations that deliver similar functions.Ranger AgreementTo make payments to the Northern Land Council as a form of rental to ensure access to the Ranger Project area for the purposes of mining.Registrar of Indigenous CorporationsTo register, regulate and provide services that address the specific needs of Aboriginal and Torres Strait Islander corporations in improving their corporate governance.Linked to: The Indigenous Land Corporation ‘Agency overview and resources’ and ‘Outcomes and planned performance’ sections in these PB Statements.Also linked to: Program 7.5: Stronger Futures in the Northern Territory; and the Department of Health and Ageing’s Program 8.1: Aboriginal and Torres Strait Islander Health. For more information refer to DHA’s 2012–13 PB Statements.
Program 7.4 ExpensesThe changes in program expenses across the forward years reflect projected changes in indexation parameters and the impact of policy initiatives. The major policy initiatives affecting program estimates relate to funding for Reconciliation Australia, Breaking the Cycle of Alcohol and Drug Abuse in Indigenous Communities Activity.Variations in Aboriginals Benefit Account royalty equivalent revenue across the forward years are subject to the taxable profits recorded by individual mines and world market resource prices.Funding for the Indigenous Communities Strategic Investment program includes appropriations for the extension of the Cape York Welfare Reform Trial, which is funded to the end of December 2013, as well as the Remote Service Delivery Flexible Funding Pool, which is funded to 2012–13.

FaHCSIA Budget Statements
Table 2.7.4: Budgeted Expenses for Indigenous Capability and Development
Annual administered expenses:Breaking the Cycle of Drug and Alcohol Abuse in Indigenous Communities 5,435 6,569 6,686 - -Indigenous Capability and Development 51,104 47,553 47,045 47,125 48,021Indigenous Healing Foundation 8,034 4,857 - - -Reconciliation Australia 3,600 3,600 - - -National Aboriginal and Torres Strait Islander Representative Body 6,795 8,341 4,911 - -
Special Appropriations:Aboriginal Land Rights (Northern Territory) Act 1976
Aboriginals Benefit AccountSpecial Appropriation 159,151 160,247 160,888 167,230 178,398Ranger Agreement 200 200 200 200 200
Special Account expenses: Aboriginals Benefit AccountSpecial Account 150,323 169,393 169,179 165,885 170,527Aboriginal and Torres Strait IslanderLand Account 51,334 47,648 49,029 50,304 51,561Indigenous Communities StrategicInvestment Program Special Account 330 - - - -Indigenous Remote Service DeliverySpecial Account 30,059 12,418 - - -Other Services - Services for OtherEntities and Trust Moneys 520 531 1,072 - -
Program support 97,491 106,088 113,433 104,247 105,785Expenses not requiring appropriation in
the Budget year 1 8,787 9,463 9,839 9,113 9,920
Total program expenses 573,163 576,908 562,282 544,104 564,412Note: Departmental appropriation splits and totals, by outcome and program, are indicativeestimates and may change in the course of the budget year as government priorities change.1 'Expenses not requiring appropriation in the Budget year' is made up of Depreciation, Amortisation and Makegood Expenses.
2011–12Revisedbudget
$'000
2012–13Budget
$'000
2013–14Forw ard
year 1$'000
2014–15Forw ard
year 2$'000
2015–16Forw ard
year 3$'000

FaHCSIA Budget Statements
Program 7.4 Deliverables
Indigenous Capability and Development Number of Indigenous people who participated in supported leadership
activities Number of Indigenous leadership development activities Flexible Funding Number of flexible funding projects Registrar of Indigenous Corporations Number of participants in corporate governance capacity development
programs
Indigenous Capability and Development Deliverables TargetsDeliverables 2011–12
Revised Budget
2012–13 Budget
2013–14 Forward year 1
2014–15 Forward year 2
2015–16 Forward year 3
Number of Indigenous people who participated in supported leadership activities
800 800 800 800 -

FaHCSIA Budget Statements
Program 7.4: Key Performance IndicatorsIndigenous Capability and Development Percentage and number of participants in Indigenous leadership
programs who reported that they benefited from increased knowledge, skills and capabilities gained from their participation
Flexible Funding Percentage and number of flexible funding projects that have met
specified project objectivesRegistrar of Indigenous Corporations Percentage and number of Aboriginal and Torres Strait Islander
corporations that are compliant with reporting requirements under the Corporations (Aboriginal and Torres Strait Islander) Act 2006
Percentage and number of participants in corporate governance capacity development programs who have reported a significant increase in corporate governance knowledge and skills
Percentage and number of clients satisfied that the services provided met their needs
Breaking the Cycle Activity27
Number and type of services delivered to support Alcohol and Substance Abuse Plans
Number of clients accessing these services
27 These KPIs were not included in the 2011–12 PB Statements as this is a new initiative.

FaHCSIA Budget Statements
Program 7.5: Stronger Futures in the Northern Territory
Program 7.5 ObjectiveTo provide whole-of-government policy coordination and implement targeted measures to increase the wellbeing and safety of communities, including women and children, and improve engagement and development.In recognition of the new 10-year funding commitment for the Northern Territory, Program 7.5 has been renamed from Closing the Gap in the Northern Territory to Stronger Futures in the Northern Territory.Program Component ObjectivesFood Security To promote food security for Aboriginal communities in the Northern Territory and enhance the contribution that community stores make to this. Tackling Alcohol Abuse To contribute to the safety of women and children, reduce violence and associated alcohol and substance abuse and promote personal responsibility and community norms.Governance and Engagement To strengthen engagement and governance capacity of government, community members and organisations in the Northern Territory.Leasing on Indigenous Land in the Northern Territory
Payment of rent for the last year of the five-year leases will be made after the leases expire in August 2012. Rent will be paid for areas of land subject to a lease under section 31 of the Northern Territory National Emergency Response Act 2007 up until 17 August 2012.FaHCSIA, in partnership with other Australian Government agencies and the Northern Territory Government, will deliver the Stronger Futures in the Northern Territory package through a new 10-year Stronger Futures in the Northern Territory National Partnership Agreement. Transitional arrangements for the finalisation of the Closing the Gap in the Northern Territory National Partnership Agreement will be incorporated into this new agreement. An evaluation strategy for the Stronger Futures in the Northern Territory National Partnership Agreement will be developed in partnership with the Northern Territory Government as part of the negotiation of the new agreement.Linked to: Program 1.1: Family Support. Welfare reform is delivered under Program 3.1: Financial Management.

FaHCSIA Budget Statements
Linked to: (continued)Program 7.1: Economic Development and ParticipationPolicy for Indigenous housing and municipal and essential services in the Northern Territory is managed under Program 7.2: Indigenous Housing and Infrastructure.Program 7.4: Indigenous Capability and Development.Health, education and some elements of community safety are managed by DHA, DEEWR and AGD.Payments made directly to the Northern Territory Government under the Stronger Futures in the Northern Territory National Partnership Agreement will be made by the Treasury through the COAG Reform Special Account. For information about these payments, refer to the Treasury’s 2012–13 PB Statements and Budget Paper No.3, Australia’s Federal Relations.

FaHCSIA Budget Statements
Program 7.5 Expenses
The amount of rental and other payments associated with the five year leases over Aboriginal land under the Northern Territory Emergency Response is expected to be agreed by 30 June 2012. However, final payments will be made after the leases expire on 17 August 2012.
Table 2.7.5: Budgeted Expenses for Stronger Futures in the Northern Territory
Annual administered expenses:Northern Territory Emergency Response 22,349 - - - -Northern Territory Stronger Futures1 - 5,982 5,411 5,087 5,030
Special Appropriations:Northern Territory National Emergency Response Act 2007
Lease Payments to TraditionalOw ners of Land 19,498 12,271 - - -
Program support 90,831 71,208 42,921 35,454 33,327Expenses not requiring appropriation in
the Budget year 2 8,187 6,352 3,723 3,100 3,125
Total program expenses 140,865 95,813 52,055 43,641 41,482Note: Departmental appropriation splits and totals, by outcome and program, are indicativeestimates and may change in the course of the Budget year as government priorities change.1 The Stronger Futures in the Northern Territory initiative is a ten year commitment. The 2012-13 estimates for the Budget measures provide certainty over funds in the coming year. Estimates from 2013-14 onw ards w ill be f inalised follow ing negotiations w ith the Northern Territory Government regarding the Stronger Futures NPA.2 'Expenses not requiring appropriation in the Budget year' is made up of Depreciation, Amortisation and Makegood Expenses.
2011–12Revisedbudget
$'000
2012–13Budget
$'000
2013–14Forw ard
year 1$'000
2014–15Forw ard
year 2$'000
2015–16Forw ard
year 3$'000

FaHCSIA Budget Statements
Program 7.5 Deliverables Deliverables will be developed upon agreement of the Stronger Futures
in the Northern Territory National Partnership Agreement
Program 7.5 Key Performance IndicatorsStronger Futures in the Northern TerritoryKey performance indicators will be developed upon agreement of the Stronger Futures in the Northern Territory National Partnership Agreement

FaHCSIA Budget Statements
Section 3: Explanatory tables and budgeted financial statements
Section 3 presents explanatory tables and budgeted financial statements that provide a comprehensive snapshot of agency finances for the 2012–13 budget year. It explains how budget plans are incorporated into the financial statements and provides further details of the reconciliation between appropriations and program expenses, movements in administered funds, special accounts and government Indigenous expenditure.
3.1 Explanatory tables
3.1.1 Movement of administered funds between years
Administered funds can be provided for a specified period, for example under annual Appropriation Acts. Funds not used in the specified period with the agreement of the Finance Minister may be moved to a future year. Table 3.1.1 shows the movement of administered funds approved between years.

FaHCSIA Budget Statements
Table 3.1.1: Movement of administered funds between years1
2011–12 2012–13 2013–14 2014–15 2015–16$'000 $'000 $'000 $'000 $'000
Outcome 1:Program 1.1 Family Support 85,000 (85,000) - - - Providing a continuous level of service delivery to support families and improve children’s w ellbeing
Outcome 2:Program 2.2 Affordable Housing - (7,000) - - - This movement of funds from 2012-13 to 2022-23 is to better align expenditure w ith the expected delivery of dw ellings
Outcome 3:Program 3.1 Financial Management 9,700 (9,700) - - - To improve the financial resilience of vulnerable individuals
Outcome 5: 2
Program 5.4 Services and Support for People w ith Disability (19,310) - - - - Trends in client usage of services require movement of funds into outyears
Program 5.7 Early Intervention Services for Children w ith Disability - (9,138) (5,226) 9,168 9,473 Trends in client usage of services require movement of funds into outyears
Total Movement ofAdministered Funds 75,390 (110,838) (5,226) 9,168 9,473 1 Figures displayed as a negative (-) represent a decrease in funds and a positive reflect an increase in funds.2 The 2011-12 appropriations for Helping Children w ith Autism Early Intervention and Better Start for Children w ith Disability are reported under Program 5.4 Services and Support for People w ith Disability

FaHCSIA Budget Statements
3.1.2 Special Accounts
Special accounts provide a means to set aside and record amounts used for specified purposes. Special accounts can be created by a Finance Minister’s Determination under the FMA Act or under separate enabling legislation. Table 3.1.2 shows the expected additions (receipts) and reductions (payments) for each special account used by FaHCSIA.
Table 3.1.2: Estimates of special account flows and balancesOpening Closingbalance Receipts Payments Adjustments balance
2012–13 2012–13 2012–13 2012–13 2012–132011–12 2011–12 2011–12 2011–12 2011–12
Outcome $'000 $'000 $'000 $'000 $'000Outcome 1Financial Management and Accountability Act 1997(s. 20)
Social Security - Services for Other Entities and Trust Moneys (A) 1.1 - - - - -
- 250 (250) - -Outcome 5Financial Management and Accountability Act 1997(s. 20)
National Disability Special Account (A) 5.4 7,185 1,000 (1,523) - 6,662
7,167 909 (891) - 7,185Outcome 6Financial Management and Accountability Act 1997(s. 20)
Other Services - Services for Other Entities and Trust Moneys (A) 6.1 10 - - - 10
10 - - - 10Outcome 7Financial Management and Accountability Act 1997(s. 20)
Other Services - Services for Other Entities and Trust Moneys (A) 7.2 - - - - -
226 930 (1,156) - -(continued on next page)

FaHCSIA Budget Statements
Table 3.1.2: Estimates of special account flows and balances (continued)Opening Closingbalance Receipts Payments Adjustments balance
2012–13 2012–13 2012–13 2012–13 2012–132011–12 2011–12 2011–12 2011–12 2011–12
Outcome $'000 $'000 $'000 $'000 $'000Outcome 7 (Continued)Aboriginal and Torres Strait Islander Act 2005
Aboriginal and Torres Strait Islander Land Account (A) 7.4 1,884,502 94,648 (47,648) - 1,931,502
1,836,247 99,589 (51,334) - 1,884,502
Aboriginal and Land Rights (Northern Territory) Act 1976
Aboriginals Benefit Account(A) 7.4 439,271 182,410 (169,393) - 452,288
408,276 181,318 (150,323) - 439,271Corporations (Aboriginal and Torres Strait Islander) Act 2006
Aboriginal and Torres Strait Islander Corporations Unclaimed MoneyAccount (A) 7.4 585 - - - 585
351 234 - - 585Financial Management and Accountability Act 1997(s. 20)
Indigenous Communities Strategic Investment Program Special Account (A) 7.4 - - - - -
- 330 (330) - -Indigenous Remote Service Delivery Special Account (A) 7.4 418 12,000 (12,418) - -
12,922 17,555 (30,059) - 418Other Services - Services for Other Entities and Trust Moneys (A) 7.4 531 531 (531) - 531
531 520 (520) - 531Total Special Accounts
2012–13 Budget estimate 2,332,502 290,589 (231,513) - 2,391,578
Total Special Accounts2011–12 estimate actual 2,265,730 301,635 (234,863) - 2,332,502
(A) = Administered(D) = Departmental

FaHCSIA Budget Statements
3.1.3 Australian Government Indigenous Expenditure
The Australian Government Indigenous Expenditure report provides a breakdown of estimated Indigenous expenditure administered by portfolio. Table 3.1.3 shows the estimated Indigenous expenditure administered by FaHCSIA in 2011–12 and 2012–13 by appropriation and outcome. The reduction in Indigenous expenditure in 2012–13 is primarily due to the movement of funds to other portfolios as part of the Stronger Futures in the Northern Territory and Remote Jobs and Communities programs.
Table 3.1.3 : Australian Government Indigenous ExpenditureOther Total Program
Bill Special TotalNo. 1 Approp Approp$'000 $'000 $'000 $'000 $'000
FaHCSIAOutcome 1
Families and ChildrenAdministered 2012–13 39,305 - 39,305 - 39,305 1.1Administered 2011–12 45,901 - 45,901 - 45,901 1.1Departmental 2012–13 - - - - - 1.1Departmental 2011–12 2,277 - 2,277 - 2,277 1.1
Total Outcome 2012–13 39,305 - 39,305 - 39,305Total Outcome 2011–12 48,178 - 48,178 - 48,178
Outcome 3Community Capability and the Vulnerable
Administered 2012–13 13,109 - 13,109 - 13,109 3.1Administered 2011–12 14,657 - 14,657 - 14,657 3.1Departmental 2012–13 28 - 28 - 28 3.1Departmental 2011–12 35 - 35 - 35 3.1
Total Outcome 2012–13 13,137 - 13,137 - 13,137Total Outcome 2011–12 14,692 - 14,692 - 14,692Outcome 5
Disability and CarersAdministered 2012–13 14,181 - 14,181 - 14,181 5.4Administered 2011–12 13,903 - 13,903 - 13,903 5.4Departmental 2012–13 140 - 140 - 140 5.4Departmental 2011–12 139 - 139 - 139 5.4
Total Outcome 2012–13 14,321 - 14,321 - 14,321Total Outcome 2011–12 14,042 - 14,042 - 14,042
Appropriations
(continued on next page)

FaHCSIA Budget Statements
Table 3.1.3: Australian Government Indigenous Expenditure (continued)Other Total Program
Bill Special TotalNo. 1 Approp Approp$'000 $'000 $'000 $'000 $'000
Outcome 7Indigenous
Administered 2012–13 182,062 - 182,062 - 182,062 7.1Administered 2011–12 249,110 - 249,110 - 249,110 7.1Departmental 2012–13 27,817 - 27,817 3,950 31,767 7.1Departmental 2011–12 44,584 - 44,584 6,761 51,345 7.1Administered 2012–13 66,965 - 66,965 - 66,965 7.2Administered 2011–12 106,855 - 106,855 1,156 108,011 7.2Departmental 2012–13 30,771 - 30,771 4,369 35,140 7.2Departmental 2011–12 32,389 - 32,389 4,912 37,301 7.2Administered 2012–13 86,869 - 86,869 - 86,869 7.3Administered 2011–12 84,258 - 84,258 - 84,258 7.3Departmental 2012–13 6,741 - 6,741 957 7,698 7.3Departmental 2011–12 6,749 - 6,749 1,023 7,772 7.3Administered 2012–13 70,920 160,447 231,367 229,990 461,357 7.4Administered 2011–12 74,968 159,351 234,319 232,566 466,885 7.4Departmental 2012–13 101,174 - 101,174 14,377 115,551 7.4Departmental 2011–12 92,271 - 92,271 14,007 106,278 7.4Administered 2012–13 5,982 12,271 18,253 - 18,253 7.5Administered 2011–12 22,349 19,498 41,847 - 41,847 7.5Departmental 2012–13 67,917 - 67,917 9,643 77,560 7.5Departmental 2011–12 85,978 - 85,978 13,040 99,018 7.5
Total Outcome 2012–13 647,218 172,718 819,936 263,286 1,083,222Total Outcome 2011–12 799,511 178,849 978,360 273,465 1,251,825
Total Administered 2012–13 479,393 172,718 652,111 229,990 882,101Total Administered 2011–12 612,001 178,849 790,850 233,722 1,024,572
Total Departmental 2012–13 234,588 - 234,588 33,296 267,884Total Departmental 2011–12 264,422 - 264,422 39,743 304,165
Total AGIE 2012–13 713,981 172,718 886,699 263,286 1,149,985Total AGIE 2011–12 876,423 178,849 1,055,272 273,465 1,328,737
Appropriations

FaHCSIA Budget Statements
3.2 Budgeted financial statements
3.2.1 Differences in agency resourcing and financial statements
Table 3.2.1 recognises the full year revenue for 2012-13 on the basis of accrual accounting principles.
3.2.2 Analysis of budgeted financial statements
Departmental
Income and expenses
FaHCSIA is budgeting for an operating deficit of $57.3 million for 2012–13. This is the result of the revised net cash funding arrangements introduced under Operation Sunlight, whereby asset replacement is now funded through a capital appropriation rather than the departmental operating appropriation. After allowing for depreciation expenses, the reconciliation table at the bottom of Table 3.2.1 shows that the operating result is a small approved deficit attributable to FaHCSIA due to fluctuations in the bond rates. Total operating revenue for 2012–13 is estimated at $575.5 million, comprising a net increase in government appropriations of $17.2 million to a total of $550.3 million, offset by a decrease in own source revenue of $4.8 million to a total of $25.3 million. The net increase in revenue of $12.4 million is primarily due to funding through government decisions and measures.Total expenses for 2012–13 are estimated to be $632.8 million. The net increase in expenses of $10.6 million is primarily attributable to the increase in employee benefits and supplier expenses as a result of Government decisions and measures.Balance sheet
The Department’s net asset position is expected to increase by $2.3 million. This is due to the impact of the operating loss of $57.3 million and offset by an increase in contributed equity from the capital appropriations of $59.6 million.Administered
Income and expenses
FaHCSIA will administer the collection of non-taxation revenue estimated at $152.5 million in 2012–13, a decrease of $25.7 million from the 2011–12 estimated revenues. The decrease is due to reduced returns from investments and receipts to special accounts.

FaHCSIA Budget Statements
FaHCSIA will administer programs totalling $82,736.0 million in expenses in 2012–13. The increase of $2886.2 million principally reflects customer trends, indexation of income support payments and measures.Balance sheet
Total assets administered on behalf of the Government are expected to increase by $854.2 million to $6,310.2 million. This is primarily due to an increase of $757.7 million in receivables and $97.4 million in investments.Total liabilities administered on behalf of the Government are expected to increase by $865.2 million to $9,214.4 million, which is driven by the increase in the personal benefits payable.

FaHCSIA Budget Statements
3.2.3 Budgeted financial statements tables
Table 3.2.1: Comprehensive income statement (showing net cost of services)(for the period ended 30 June)
Estimated Budget Forw ard Forw ard Forw ardactual estimate estimate estimate estimate
2011–12 2012–13 2013–14 2014–15 2015–16$'000 $'000 $'000 $'000 $'000
EXPENSESEmployee benefits 352,078 360,599 353,443 370,308 377,656Supplier 187,320 190,471 181,402 182,599 186,792Depreciation and amortisation 55,763 57,255 83,637 102,338 107,834Write-dow n and impairment of assets 2,295 - - - -Other 24,770 24,464 24,614 24,771 24,993Total expenses 622,226 632,789 643,096 680,016 697,275
LESS: OWN-SOURCE INCOMEOwn-source revenueSale of goods and rendering of services 21,153 17,429 17,429 17,429 17,429Other revenue 6,565 6,565 6,565 6,565 6,565Total own-source revenue 27,718 23,994 23,994 23,994 23,994
GainsSale of assets 1,086 - - - -Other gains 1,290 1,290 1,290 1,290 1,290Total gains 2,376 1,290 1,290 1,290 1,290Total own-source income 30,094 25,284 25,284 25,284 25,284
Net cost of (contribution by) services 592,132 607,505 617,812 654,732 671,991
Revenue from Government 533,088 550,250 534,175 552,394 564,157
Surplus (Deficit) attributable tothe Australian Government (59,044) (57,255) (83,637) (102,338) (107,834)
Total comprehensive income (loss) attributable to the Australian Government (59,044) (57,255) (83,637) (102,338) (107,834)
(continued on next page)

FaHCSIA Budget Statements
Table 3.2.1 Comprehensive income statement (showing net cost of services)(for the period ended 30 June) (continued)Note: Impact of Net Cash Appropriation Arrangements
2011–12 2012–13 2013–14 2014–15 2015–16$'000 $'000 $'000 $'000 $'000
Total Comprehensive Income(loss) less depreciation/amortisationexpenses previously funded throughrevenue appropriations (3,281) - - - -
plus depreciation/amortisation expensespreviously funded through revenueappropriations1 (55,763) (57,255) (83,637) (102,338) (107,834)
Total Comprehensive Income(loss) - as per the Statement of Comprehensive Income (59,044) (57,255) (83,637) (102,338) (107,834)
Prepared on an Australian Accounting Standards basis.1 From 2010-11, the Government introduced net cash appropriation arrangements w here Bill 1 revenue appropriations for the depreciation/amortisation expenses of FMA Act agencies w ere replaced w ith a separate capital budget (the Departmental Capital Budget, or DCB) provided through Bill 1 equity appropriations. For information regarding DCBs, please refer to Table 3.2.5 Departmental Capital Budget Statement.

FaHCSIA Budget Statements
Table 3.2.2: Budgeted departmental balance sheet (as at 30 June)Estimated Budget Forw ard Forw ard Forw ard
actual estimate estimate estimate estimate2011–12 2012–13 2013–14 2014–15 2015–16
$'000 $'000 $'000 $'000 $'000ASSETSFinancial assets
Cash and cash equivalents 8,936 8,936 8,936 8,936 8,936Trade and other receivables 70,523 72,529 70,844 74,815 76,546
Total financial assets 79,459 81,465 79,780 83,751 85,482Non-financial assets
Land and buildings 166,415 151,142 134,932 120,926 105,949Infrastructure, plant and equipment 26,930 29,023 27,175 26,777 25,099Intangibles 54,734 70,257 119,582 118,970 82,385Other 6,459 6,459 6,459 6,459 6,459
Total non-financial assets 254,538 256,881 288,148 273,132 219,892
Total assets 333,997 338,346 367,928 356,883 305,374LIABILITIESPayables
Suppliers 11,695 11,695 11,695 11,695 11,695Other 32,658 32,658 32,658 32,658 32,658
Total payables 44,353 44,353 44,353 44,353 44,353Provisions
Employees 82,901 84,907 83,222 87,193 88,924Other 2,256 2,256 2,256 2,256 2,256
Total provisions 85,157 87,163 85,478 89,449 91,180Total liabilities 129,510 131,516 129,831 133,802 135,533Net assets 204,487 206,830 238,097 223,081 169,841
EQUITY*Parent entity interest
Contributed equity 170,573 230,171 345,075 432,397 486,991Reserves 59,057 59,057 59,057 59,057 59,057Retained surpluses
(accumulated deficit) (25,143) (82,398) (166,035) (268,373) (376,207)Total parent entity interest 204,487 206,830 238,097 223,081 169,841
Total Equity 204,487 206,830 238,097 223,081 169,841Prepared on an Australian Accounting Standards basis.*Note: 'equity' is the residual interest in assets after deduction of liabilities.

FaHCSIA Budget Statements
Table 3.2.3: Departmental statement of changes in equity – summary of movement (Budget year 2012-13)
Retained Asset Other Contributed Totalearnings revaluation reserves equity/ equity
reserve capital$'000 $'000 $'000 $'000 $'000
Opening balance as at 1 July 2012Balance carried forw ard from
previous period (25,143) 59,057 - 170,573 204,487Adjusted opening balance (25,143) 59,057 - 170,573 204,487
Comprehensive incomeSurplus (deficit) for the period (57,255) - - - (57,255)
Total comprehensive income (57,255) - - - (57,255)of which:
Attributable to the Australian Government (57,255) - - - (57,255)
Transactions with ownersContributions by owners
Equity Injection - Appropriation - - - 27,686 27,686Departmental Capital Budget (DCBs) - - - 31,912 31,912
Subtotal transactions with owners - - - 59,598 59,598Estimated closing balance
as at 30 June 2013 (82,398) 59,057 - 230,171 206,830Closing balance attributable to the
Australian Government (82,398) 59,057 - 230,171 206,830Prepared on an Australian Accounting Standards basis.

FaHCSIA Budget Statements
Table 3.2.4: Budgeted departmental statement of cash flows (for the period ended 30 June)
Estimated Budget Forw ard Forw ard Forw ardactual estimate estimate estimate estimate
2011–12 2012–13 2013–14 2014–15 2015–16$'000 $'000 $'000 $'000 $'000
OPERATING ACTIVITIESCash received
Goods and services 21,153 17,429 17,429 17,429 17,429Appropriations 542,217 548,244 535,860 548,423 562,426Other 6,565 6,565 6,565 6,565 6,565
Total cash received 569,935 572,238 559,854 572,417 586,420Cash used
Employees 351,737 358,593 355,128 366,337 375,925Suppliers 186,030 189,181 180,112 181,309 185,502Other 22,255 24,464 24,614 24,771 24,993
Total cash used 560,022 572,238 559,854 572,417 586,420Net cash from (used by)
operating activities 9,913 - - - -INVESTING ACTIVITIESCash received
Proceeds from sales of property,plant and equipment 1,086 - - - -
Total cash received 1,086 - - - -Cash used
Purchase of property, plant and equipment 41,258 59,598 114,904 87,322 54,594
Total cash used 41,258 59,598 114,904 87,322 54,594Net cash from (used by)
investing activities (40,172) (59,598) (114,904) (87,322) (54,594)FINANCING ACTIVITIESCash received
Appropriations - contributed equity 30,259 59,598 114,904 87,322 54,594Total cash received 30,259 59,598 114,904 87,322 54,594
Net cash from (used by) financing activities 30,259 59,598 114,904 87,322 54,594
Net increase (decrease)in cash held - - - - -Cash and cash equivalents at the
beginning of the reporting period 8,936 8,936 8,936 8,936 8,936Cash and cash equivalents at the
end of the reporting period 8,936 8,936 8,936 8,936 8,936Prepared on an Australian Accounting Standards basis.

FaHCSIA Budget Statements
Table 3.2.5: Departmental capital budget statementEstimated Budget Forw ard Forw ard Forw ard
actual estimate estimate estimate estimate
2011–12 2012–13 2013–14 2014–15 2015–16$'000 $'000 $'000 $'000 $'000
NEW CAPITAL APPROPRIATIONSCapital Budget - Bill 1 (DCB) 27,262 31,912 19,709 23,004 22,594Equity Injections - Bill 2 2,997 27,686 95,195 64,318 32,000
Total new capital appropriations 30,259 59,598 114,904 87,322 54,594
Provided for:Purchase of non-financial assets 30,259 59,598 114,904 87,322 54,594
Total Items 30,259 59,598 114,904 87,322 54,594
PURCHASE OF NON-FINANCIAL ASSETSFunded by capital appropriations1 2,997 27,686 95,195 64,318 32,000Funded by capital appropriations - DCB2 27,262 31,912 19,709 23,004 22,594Funded internally from
departmental resources3 10,999 - - - -TOTAL 41,258 59,598 114,904 87,322 54,594RECONCILIATION OF CASH
USED TO ACQUIRE ASSETSTO ASSET MOVEMENT TABLE
Total purchases 41,258 59,598 114,904 87,322 54,594 Total cash used to
acquire assets 41,258 59,598 114,904 87,322 54,594 Prepared on an Australian Accounting Standards basis.1 Includes both current and prior Bill 2/4 appropriations.2 Does not include annual f inance lease costs. Include purchase from current and previous
years Departmental Capital Budgets.3 Includes annual and prior year appropriations, s31 relevant agency receipts, and proceeds from the sale of assets.

FaHCSIA Budget Statements
Table 3.2.6: Statement of Asset Movements (2012-13)Other
Infrastructure, Intangibles Other Total
Land Buildingsplant &
equipment$'000 $'000 $'000 $'000 $'000 $'000
As at 1 July 2012Gross book value 19,842 224,593 55,682 136,324 6,459 442,900
Accumulated depreciation/amortisation - (78,020) (28,752) (81,590) - (188,362)Opening net book balance 19,842 146,573 26,930 54,734 6,459 254,538
CAPITAL ASSET ADDITIONSEstimated expenditure on
new or replacement assetsBy purchase - appropriation equity 1 - - 1,425 26,261 - 27,686By purchase - appropriation ordinary annual services 2 - 8,410 9,789 13,713 - 31,912
Total additions - 8,410 11,214 39,974 - 59,598
Other movementsDepreciation/amortisation expense - (23,683) (9,121) (24,451) - (57,255)As at 30 June 2013Gross book value 19,842 233,003 66,896 176,298 6,459 502,498Accumulated depreciation/amortisation - (101,703) (37,873) (106,041) - (245,617)Closing net book balance 19,842 131,300 29,023 70,257 6,459 256,881Prepared on an Australian Accounting Standards basis.1 'Appropriation equity' refers to equity injections or Administered Assets and Liabilities appropriations provided through Appropriation Bill (No. 2) 2012-13.2 'Appropriation ordinary annual services' refers to funding provided through Appropriation Bill (No. 1) 2012-13 for depreciation/amortisation expenses, Departmental Capital Budgets or other operational expenses.

FaHCSIA Budget Statements
Table 3.2.7: Schedule of budgeted income and expenses administered on behalf of Government (for the period ended 30 June)
Estimated Budget Forw ard Forw ard Forw ardactual estimate estimate estimate estimate
2011–12 2012–13 2013–14 2014–15 2015–16$'000 $'000 $'000 $'000 $'000
EXPENSES ADMINISTERED ONBEHALF OF GOVERNMENTGrants 1,829,769 1,607,118 1,566,795 1,626,478 1,714,047Subsidies 36,042 93,638 132,886 146,853 171,360Personal benefits 77,702,045 80,736,605 85,394,388 90,307,519 95,686,706Suppliers 122,429 132,160 155,916 117,697 84,709Other 159,516 166,484 138,963 128,294 129,449
Total expenses administeredon behalf of Government 79,849,801 82,736,005 87,388,948 92,326,841 97,786,271
LESS:OWN-SOURCE INCOMEOwn-source revenueNon-taxation revenue
Interest 121,756 116,811 118,877 121,518 124,667Other sources of non-taxation
revenues 56,488 35,694 20,054 15,352 12,630Total non-taxation 178,244 152,505 138,931 136,870 137,297Total own-source revenues
administered on behalf of Government 178,244 152,505 138,931 136,870 137,297
Total own-sourced incomeadministered on behalf of Government 178,244 152,505 138,931 136,870 137,297
Net Cost of services 79,671,557 82,583,500 87,250,017 92,189,971 97,648,974Surplus (Deficit) (79,671,557) (82,583,500) (87,250,017) (92,189,971) (97,648,974)
Total comprehensiveincome (loss) (79,671,557) (82,583,500) (87,250,017) (92,189,971) (97,648,974)
Prepared on an Australian Accounting Standards basis.

FaHCSIA Budget Statements
Table 3.2.8: Schedule of budgeted assets and liabilities administered on behalf of Government (as at 30 June)
Estimated Budget Forw ard Forw ard Forw ardactual estimate estimate estimate estimate
2011–12 2012–13 2013–14 2014–15 2015–16$'000 $'000 $'000 $'000 $'000
ASSETSFinancial assets
Cash and cash equivalents 32,750 31,807 29,600 28,015 26,694Receivables 1,283,956 2,041,654 2,030,847 2,153,463 2,263,170Investments 3,980,758 4,078,156 4,176,764 4,286,044 4,403,412
Total financial assets 5,297,464 6,151,617 6,237,211 6,467,522 6,693,276Non-financial assets
Prepayments - Personal Benefits 149,740 149,740 149,740 149,740 149,740Land and buildings 260 260 260 260 260Other 8,599 8,599 8,599 8,599 8,599
Total non-financial assets 158,599 158,599 158,599 158,599 158,599Total assets administered
on behalf of Government 5,456,063 6,310,216 6,395,810 6,626,121 6,851,875LIABILITIESProvisions
Personal benefits provision 6,239,770 6,142,280 6,042,215 6,059,811 6,113,137Total provisions 6,239,770 6,142,280 6,042,215 6,059,811 6,113,137
PayablesSuppliers 18,465 18,465 18,465 18,465 18,465Subsidies 6,538 81,653 122,947 139,848 164,230Personal benefits payable 2,075,869 2,963,625 3,080,672 3,209,172 3,292,768Grants 8,531 8,333 12,683 21,348 26,272
Total payables 2,109,403 3,072,076 3,234,767 3,388,833 3,501,735Total liabilities administered
on behalf of Government 8,349,173 9,214,356 9,276,982 9,448,644 9,614,872
Net assets/(liabilities) (2,893,110) (2,904,140) (2,881,172) (2,822,523) (2,762,997)Prepared on an Australian Accounting Standards basis.

FaHCSIA Budget Statements
Table 3.2.9: Schedule of budgeted administered cash flows(for the period ended 30 June)
Estimated Budget Forw ard Forw ard Forw ardactual estimate estimate estimate estimate
2011–12 2012–13 2013–14 2014–15 2015–16$'000 $'000 $'000 $'000 $'000
OPERATING ACTIVITIESCash received
Net GST received 152,797 152,797 152,797 152,797 152,797
Other 77,295 43,094 35,254 30,552 27,830Total cash received 230,092 195,891 188,051 183,349 180,627Cash used
Grant payments 1,820,494 1,607,316 1,562,445 1,617,813 1,709,123Subsidies paid 29,504 18,523 91,592 129,952 146,978Personal benefits 77,644,579 80,181,181 85,611,952 90,397,809 95,780,360Suppliers 136,540 145,451 163,724 135,536 102,548Net GST paid 152,797 152,797 152,797 152,797 152,797Other 148,547 153,193 131,155 110,455 111,610
Total cash used 79,932,461 82,258,461 87,713,665 92,544,362 98,003,416Net cash from (used
by) operating activities (79,702,369) (82,062,570) (87,525,614) (92,361,013) (97,822,789)INVESTING ACTIVITIESCash received
Investments 4,156,054 4,156,054 4,156,054 4,156,054 4,156,054Interest 121,756 116,811 118,877 121,518 124,667
Total cash received 4,277,810 4,272,865 4,274,931 4,277,572 4,280,721Cash used
Investments 4,268,315 4,261,252 4,270,262 4,280,934 4,289,022Total cash used 4,268,315 4,261,252 4,270,262 4,280,934 4,289,022Net cash from (used
by) investing activities 9,495 11,613 4,669 (3,362) (8,301)Net increase or (decrease)
in cash held (79,692,874) (82,050,957) (87,520,945) (92,364,375) (97,831,090)Cash and cash equivalents at beginning of reporting period
24,634 32,750 31,807 29,600 28,015
Cash from Official Public Account for:
- Appropriations 79,773,981 82,176,278 87,607,531 92,424,029 97,895,767Cash to Official Public Account for:
- Appropriations (72,991) (126,264) (88,793) (61,239) (65,998)
Cash and cash equivalents at end of reporting period 32,750 31,807 29,600 28,015 26,694
Prepared on an Australian Accounting Standards basis.

FaHCSIA Budget Statements
Table 3.2.10: Statement of Administered Asset Movements (2012–13)Total
Land Buildings$'000 $'000 $'000
As at 1 July 2012Gross book value 80 340 420Accumulated depreciation/amortisation - (160) (160)Opening net book balance 80 180 260As at 30 June 2013Gross book value 80 340 420Accumulated depreciation/amortisation - (160) (160)Closing net book balance 80 180 260Prepared on an Australian Accounting Standards basis.

FaHCSIA Budget Statements
3.2.3 Notes to the financial statements
Accounting policies
Budgeted statements of income and expenditure, assets and liabilities and cash flows have been included for the financial years 2011–12 to 2015–16. These statements are prepared in accordance with the requirements of the Government’s financial budget and reporting framework.
Amounts in these statements are rounded to the nearest thousand dollars.
Reporting Entities
FaHCSIA’s budgeted financial statements include: • the Department (FaHCSIA core) • the Social Security Appeals Tribunal • the Aboriginals Benefit Account • the Aboriginal and Torres Strait Islander Land Account.Departmental and Administered Items
Departmental revenues, expenses, assets and liabilities are those which are controlled by FaHCSIA. Departmental expenses include employee and supplier expenses and other administrative costs which are incurred by FaHCSIA in providing its goods and services.
Administered items are revenues, expenses, assets and liabilities which are managed by FaHCSIA on behalf of the Australian Government, according to set government directions. Administered expenses include subsidies, grants and personal benefit payments.
The distinction between departmental and administered funding enables an assessment of the administrative efficiency of the department in managing government programmes.
Asset Valuation
All assets are initially recorded at cost. Property, plant and equipment and other infrastructure assets are periodically revalued at their fair value.
Commentary – Financial Statements
Intangibles (Departmental)
Intangibles represent the amount of computer software currently recorded by FaHCSIA. Intangible assets are recorded at cost.

FaHCSIA Budget Statements
Employee provisions (Departmental)
Employee provisions consist of accrued leave entitlements, accrued salary and wages and superannuation payments that are owed to employees at the end of the financial year.
Receivables (Administered)
Administered receivables represent amounts owing to the Australian Government for overpayments to benefit recipients. The figure presented in the financial statements is net of provisions recognised for bad and doubtful debts.
Investments (Administered)
Administered investments primarily represent the investments in the Aboriginal and Torres Strait Islander Land Account.
Non Financial Assets – Other (Administered)
Other non-financial assets item relates to estimated administered prepayments at the end of the financial year.
Personal benefits payable (Administered)
Personal benefits payable relates to special appropriation amounts recognised as payables due to the timing of pay days to benefit recipients at the end of the financial year.

Aboriginal Hostels Limited
Agency Resources andPlanned Performance

169

ABORIGINAL HOSTELS LIMITED
Section 1: Agency overview and resources...............................................1691.1 Strategic direction statement.............................................................1691.2 Agency resource statement..............................................................1701.3 Budget measures..............................................................................171
Section 2: Outcomes and planned performance........................................1722.1 Outcomes and performance information...........................................172
Section 3: Explanatory tables and budgeted financial statements...........1773.1 Explanatory tables............................................................................1773.2 Budgeted financial statements..........................................................178
170

Aboriginal Hostels Limited
Section 1: Agency overview and resources
Aboriginal Hostels Limited’s (AHL) outcome is to improve access to education, employment, health, and other services for Aboriginal and Torres Strait Islander people travelling or relocating, through the operation of temporary hostel accommodation services.
1.1 Strategic direction statement
Aboriginal Hostels Limited's primary objective is the provision of safe, comfortable, culturally appropriate and affordable accommodation for the many Indigenous Australians who must live away from home in order to access services and economic opportunity.
The AHL national network of accommodation facilities provides more than 1,870 beds every night for Indigenous people and AHL also assists community organisations to provide a further 647 beds.
The Board of Directors of AHL and the Executive continue to refocus its strategic objectives on:• Improving organisational capacity and business directions in line with the
Government's policy of 'Closing the Gap';• Improvements to the AHL corporate governance framework; and• A public commitment to performance in relation to key areas of the
business, accountability and performance reporting.

1.2 Agency resource statement
Table 1.1 shows the total resources from all sources. The table summarises how resources will be applied by outcome and by administered and departmental classification.
Table 1.1: CAC Act Body Aboriginal Hostels Limited Resource StatementBudget Estimates for 2012- 13 as at Budget May 2012
Proposed Total Actualat Budget = estimate available
appropriation
2012-13 2012-13 2011-12Source $'000 $'000 $'000Opening balance/Reserves at bank 5,845 5,845 28,957REVENUE FROM GOVERNMENTOrdinary annual services¹
Outcome 1 38,520 38,520 38,481Total ordinary annual services 38,520 38,520 38,481
Other services²Non-operating - - - - Total other services - - - Total annual appropriations 38,520 38,520 38,481
Payments from related entities3
Amounts from the portfolio department - - - Amounts from other agencies
Victorian Dept of Human Services 204 204 204NT Government 2,100 2,100 1,965DEEWR (Wadeye) - - 1,569Dept of Health & Ageing - - 2,300Indigenous Youth Mobility Program 1,937 1,937 2,970
Total 4,241 4,241 9,008
Total funds from Government 42,761 42,761 47,489
FUNDS FROM OTHER SOURCESInterest - - 525Royalties - - - Sale of goods and services 12,830 12,830 11,584Other 264 264 330Total 13,094 13,094 12,439
Total net resourcing for agency 61,700 61,700 88,885
All figures are GST exclusive Aboriginal Hostels Limited (AHL) is not directly appropriated as it is a CAC Act body. Apporiations are made to FMA Agency FaHCSIA which are then paid to AHL and are considered 'departmental' for all purposes.1 Appropriation Bill (No.1) 2012-132 Appropriation Bill (No.2) 2012-13. There are no non-operating funds for 2012-13.3 Funding provided by a Government body that is not specified within the annual appropriation bills as a payment to the CAC Act body.

AHL Budget Statements
1.3 Budget measures
The AHL has no budget measures.
173

AHL Budget Statements
Section 2: Outcomes and planned performance
2.1 Outcomes and performance informationGovernment outcomes are the intended results, impacts or consequences of actions by government on the Australian Community. Commonwealth programs are the primary vehicle by which government agencies achieve the intended results of their outcome statements. Agencies are required to identify the programs which contribute to government outcomes over the Budget and forward years.
Each outcome is described below together with its related programs, specifying the performance indicators and targets used to assess and monitor at the performance of Aboriginal Hostels Limited in achieving government outcomes.
Outcome 1: Aboriginal Hostels Limited
Improved access to education, employment, health and other services for Aboriginal and Torres Strait Islander people travelling or relocating through the operation of temporary hostel accommodation services.
Outcome 1 Strategy
Outcome Expense Statement
The AHL Board will continue to focus on three main themes.
These include:• Facilitate 'wrap-around' services to lead to independent living• Develop partnerships with the Public and Private sector• Provide pathways to education, training and employmentTable 2.1 provides an overview of the total expenses for outcome 1 by program.
174

AHL Budget Statements
Contributions to Outcome 1
Program 1.1: Company owned and operated hostels
Program 1.1: ObjectiveTo provide temporary accommodation at Company-operated hostels that assist Indigenous Australians who must live away from home to access services and economic opportunity.
Program 1.2: Community operated hostels
Program 1.2: ObjectiveTo provide temporary accommodation at Community-operated hostels that assist Indigenous Australians who must live away from home to access services and economic opportunity.
Table 2.1 Budgeted Expenses for Outcome 1 CACOutcome 1: Improved access to education, employment, 2011-12 2012-13health and other services for Aboriginal and Torres Strait Estimated EstimatedIslander people travelling or relocating through the actual expensesoperation of temporary hostel accommodation services. expenses
$'000 $'000Program 1.1: Company Operated HostelsRevenue from Government
Ordinary annual services (Appropriation Bill No. 1) 31,981 33,617Revenues from other independent sources 21,447 17,335
Total for Program 1.1 53,428 50,952Program 1.2: Community Operated HostelsRevenue from Government
Ordinary annual services (Appropriation Bill No. 1) 6,500 4,903Revenues from other independent sources - -
Total for Program 1.2 6,500 4,903Outcome 1 Totals by resource type 59,928 55,855Revenue from Government
Ordinary annual services (Appropriation Bill No. 1) 38,481 38,520Revenues from other independent sources 21,447 17,335
Total expenses for Outcome 1 77,867 55,8552011-12 2012-13
Average Staffing Level (number) 472 439
175

AHL Budget Statements
Table 2.2 Program ExpensesProgram Expenses 1.1 Budgeted expenses for Company Operated Hostels
2011-12 2012-13 2013-14 2014-15 2015-16Revised Budget Forw ard Forw ard Forw ardbudget year 1 year 2 year 3
('000) $'000 $'000 $'000 $'000 $'000Annual departmental expenses:
Departmental item 71,367 50,953 48,008 48,234 48,570Total program expenses 71,367 50,953 48,008 48,234 48,570
Program Expenses 1.2 Budgeted expenses for Community Operated Hostels
2011-12 2012-13 2013-14 2014-15 2015-16Revised Budget Forw ard Forw ard Forw ardbudget year 1 year 2 year 3
('000) $'000 $'000 $'000 $'000 $'000Annual departmental expenses:
Departmental item 6,500 4,903 6,258 6,301 6,357Total program expenses 6,500 4,903 6,258 6,301 6,357
176

AHL Budget Statements
Program DeliverablesProgram 1.1 Deliverables - Company Operated Hostels
Average number of guest per night (occupancy percentage)Number of actual guest nightsPercentage of residents satisf ied w ith accommodation
Company Operated Hostels deliverables targets
Program 1.1 Deliverables - Company Operated Hostels2011-12 2012-13 2013-14 2014-15 2015-16Revised Budget Forw ard Forw ard Forw ard
Deliverables budget year 1 year 2 year 3
Deliverables 70 70 70 70 70
Number of actual guest nights 1655 1342 1342 1342 1342
Percentage of residents satisf ied w ith 75 75 75 75 75accommodation
Program 1.2 Deliverables - Community Operated HostelsNumber of beds
Community Operated Hostels deliverables targets
Program 1.2 Deliverables - Community Operated Hostels2011-12 2012-13 2013-14 2014-15 2015-16Revised Budget Forw ard Forw ard Forw ard
Deliverables budget year 1 year 2 year 3Number of beds 905 905 905 905 905
177

AHL Budget Statements
Program Key Performance Indicators
Program 1.1 key performance indicatorsAverage operating cost per personAverage revenue per person
Company Operated Hostels key performance indicator targets2011-12 2012-13 2013-14 2014-15 2015-16Revised Budget Forw ard Forw ard Forw ard
Key Performance Indicators budget year 1 year 2 year 3Average operating cost per person $36 $59 $59 $59 $59
Average revenue per person $7 $24 $24 $24 $24
Program 1.2 key performance indicatorsAverage occupancy level as a percentage of beds.Percentage of residents satisf ied w ith accommodation provided.
Community Operated Hostels key performance indicator targets2011-12 2012-13 2013-14 2014-15 2015-16Revised Budget Forw ard Forw ard Forw ard
Key Performance Indicators budget year 1 year 2 year 3Average occupancy level as a percentage 70 70 70 70 70of beds.
Percentage of residents satisf ied w ith 75 75 75 75 75accommodation provided.
178

AHL Budget Statements
Section 3: Explanatory tables and budgeted financial statements
Section 3 presents explanatory tables and budgeted financial statements which provide a comprehensive snapshot of agency finances for the 2012 13 budget year. It explains how budget plans are incorporated into the financial statements and provides further details of the reconciliation between appropriations and program expenses, movements in administered funds, special accounts and government indigenous expenditure.
3.1 Explanatory tables
3.1.1 Movement of administered funds between yearsAHL does not receive administered funds for 2012-13.3.1.2 Special accountsAHL does not have a special account for 2012-13.3.1.3 Australian Government Indigenous ExpenditureOutcome Other Total Program
Bill Special TotalNo. 1 approp approp$'000 $'000 $'000 $'000 $'000
Aboriginal Hostels LtdOutcome 1Departmental 2012-13 33,617 - 33,617 17,336 50,953 1.1
4,903 - 4,903 - 4,903 1.2Departmental 2011-12 31,981 - 31,981 39,386 71,367 1.1
6,500 - 6,500 - 6,500 1.2Total outcome 2012-13 38,520 - 38,520 17,336 55,856 Total outcome 2011-12 38,481 - 38,481 39,386 77,867
Total departmental 2012-13 38,520 - 38,520 17,336 55,856 Total departmental 2011-12 38,481 - 38,481 39,386 77,867
Total AGIE 2012-13 38,520 - 38,520 17,336 55,856 Total AGIE 2011-12 38,481 - 38,481 39,386 77,867
Appropriations
179

AHL Budget Statements
3.2 Budgeted financial statements
3.2.1 Differences in agency resourcing and financial statements
There are no significant differences between the resource information presented in the Budget Papers and Portfolio Budget Statements (PB Statements) as a result of differences between Australian Accounting Standards (AAS) and Government Finance Statistics (GFS). Furthermore, there are no differences which arise because of related entity transactions.
3.2.2 Analysis of budgeted financial statements
An analysis of the primary causes of movements from the financial statements published in the 2011-12 Portfolio Budget Statements is provided below.
Budgeted departmental income statement
This statement provides a picture of the expected financial results for AHL by identifying full accrual expense and revenues, which highlights whether AHL is operating at a sustainable level.Total RevenueOperating income from Government has increased by $0.039 million in 2011–12 as a result of indexation. The accommodation charges have been revised to ensure the provision of quality sustainable services from AHL.Other Grants reflects the funding expected to be received from DEEWR through the Indigenous Youth Mobility Program (IYMP) until 31 December 2012. The current contract with DEEWR for the delivery of the Indigenous Youth Mobility Program (IYMP) in seven locations (Darwin, Alice Springs, Port Augusta, Adelaide, Dubbo, Coffs Harbour and Hobart) is due to end on 31 December 2012 (in 2011–12 $2.970 million and in 2012–13 $1.937 million). AHL is about to commence discussions with DEEWR in regard to contracts for service delivery in 2013.Funding from Department of Health and Ageing ceased 30 November 2011 when Hetti Perkins Aged Care Home in Northern Territory was sold to a private entity (in 2011–12 $2.300 million and zero in 2012-13).In 2011–12 AHL also received one-off project funding from DEEWR for the construction of Secondary Education Boarding Facility in Wadeye, Northern Territory (in 2011–12 $1.569 million and zero in 2012–13).As a result, there is a reduction in total other income from 2012–13, and there is no capital works planned.Total ExpensesSalaries and employee benefits — these have been decreased by $1.679
180

AHL Budget Statements
million as a result of the sale of Hetti Perkins Aged Home, and the IYMP program coming to an end on 31 December 2012.Suppliers — these have decreased by $14.717 million primarily due to completing one off projects funded by DEEWR for the construction of Wadeye Secondary Education Boarding Facility, and from FaHCSIA for the construction of the Indigenous Mothers Accommodation Facility in Northern Territory. These one-off construction costs are reflected in 2011-12 only as both projects will be completed during 2011-12.Depreciation and Amortisation — depreciation of $5.118 million in 2011-12 is based on expected actual expenses. Depreciation for 2012-13 and forward years is based on an asset review.Grants — this item represents the community hostels grants to approved organisations to operate hostels.The current contract with DEEWR for the delivery of the Indigenous Youth Mobility Program (IYMP) in seven locations (Darwin, Alice Springs, Port Augusta, Adelaide, Dubbo, Coffs Harbour and Hobart) is due to end on 31 December 2012. As a result, there is a reduction in both total income and expenditure from 2012-13.Budgeted departmental balance sheet
This statement shows the financial position of AHL. It helps AHL to track the management of assets and liabilities.
The major variations between estimated actuals for 2011-12 and the budget for 2012-13 in the Balance Sheet are as follows:• the increase in the cash balance is a result of a reduction of purchase of
non-current assets and a reduction of expenses in not subsiding Hetti Perkins Aged Care Home in Northern Territory.
• the decrease in receivables is due to unwinding of the prepayment for the Hetti Perkins Aged Care Home and improvement in AHL’s debt collection method.
• liabilities have decreased due to improved payment methods as a result of centralising the payments function and introduction of on-line procurement function.
Budgeted departmental statement of cash flows
Budgeted cash flows, as reflected in the statement of cash flows, provide important information on the extent and nature of cash flows by categorising them into expected cash flows from operating activities, investing activities and financing activities.
The major variations between estimated actuals for 2011–12 and budget for 2012–13 in the Statement of Cash Flows are as follows:• the decrease in total cash to be received from operating activities in
2012-13 is linked to the decrease in Indigenous Youth Mobility Program
181

AHL Budget Statements
funding as the program is due to end on 31 December 2012, ceasing of project funding from DEEWR (completion of project funding) and Department of Health and Ageing (sale of Hetti Perkins Aged Care Home).
• the decrease in total cash used for operating activities is due to the payments of one-off construction project expenditure 2011-12.
• the decrease in total cash used for investing activities is due to the reduction of asset purchases 2012-13.
182

AHL Budget Statements
3.2.3 Budgeted financial statements tables
Table 3.2.1 Comprehensive Income Statement (Showing Net Cost of Services for the period ended 30 June)
Estimated Budget Forw ard Forw ard Forw ardactual estimate estimate estimate estimate
2011-12 2012-13 2013-14 2014-15 2015-16$'000 $'000 $'000 $'000 $'000
EXPENSESEmployee benefits 31,770 30,091 27,622 27,750 28,110 Suppliers 32,650 17,933 17,194 17,341 18,401 Grants 6,500 4,903 6,258 6,301 6,357 Depreciation and amortisation 5,118 2,929 3,192 3,143 2,059 Finance costs - - - - - Write-dow n and impairment of assets - - - - - Losses from asset sales 1,829 - - - - Other expenses - - - - - Total expenses 77,867 55,856 54,266 54,535 54,927
LESS: OWN-SOURCE INCOMEOwn-source revenueSale of goods and rendering of services 11,584 12,830 12,937 12,937 12,937 Fees and f ines - - - - - Interest 525 - 40 76 110 Dividends - - - - - Rental income - - - - - Royalties - - - - - Other 9,338 4,505 2,633 2,698 2,765 Total own-source revenue 21,447 17,335 15,610 15,711 15,812
GainsSale of assets - - - - - Other - - - - - Total gains - - - - - Total own-source income 21,447 17,335 15,610 15,711 15,812
Net cost of (contribution by)services 77,867 55,856 54,266 54,535 54,927
Revenue from Government 38,481 38,520 38,658 38,825 39,116 * * * *Surplus (Deficit) attributable to
the Australian Government (17,939) (1) 2 1 1
OTHER COMPREHENSIVE INCOMEChanges in asset revaluation surplus - - - - - Total other comprehensive income - - - - - Total comprehensive income (loss) (17,939) (1) 2 1 1
Total comprehensive income (loss) attributable to the Australian (17,939) (1) 2 1 1 Government
Prepared on Australian Accounting Standards basis.
183

AHL Budget Statements
Table 3.2.2: Budgeted departmental balance sheet (as at 30 June) Estimated Budget Forw ard Forw ard Forw ard
actual estimate estimate estimate estimate2011-12 2012-13 2013-14 2014-15 2015-16
$'000 $'000 $'000 $'000 $'000ASSETSFinancial assets
Cash and cash equivalents 5,845 7,568 9,637 11,673 12,667Trade and other receivables 3,959 2,661 2,233 1,800 1,367
Total financial assets 9,804 10,229 11,870 13,473 14,034Non-financial assets
Land and buildings 80,092 79,175 78,221 77,267 76,313Property, plant and equipment 2,537 2,598 1,926 1,303 1,705Intangibles 223 152 81 10 - Other non-financial assets 119 118 127 136 145
Total non-financial assets 82,971 82,043 80,355 78,716 78,163Assets held for sale - - - - -
Total assets 92,775 92,272 92,225 92,189 92,197LIABILITIESPayables
Suppliers 1,177 717 711 717 767Other payables 596 553 510 467 424
Total payables 1,773 1,270 1,221 1,184 1,191Provisions
Employee provisions 4,177 4,177 4,177 4,177 4,177Total provisions 4,177 4,177 4,177 4,177 4,177
Total liabilities 5,950 5,447 5,398 5,361 5,368Net assets 86,825 86,825 86,827 86,828 86,829EQUITY*Parent entity interest
Contributed equity 88,081 88,081 88,081 88,081 88,081Retained surplus
(accumulated deficit) -1,256 -1,256 -1,254 -1,253 -1,252Total parent entity interest 86,825 86,825 86,827 86,828 86,829Total Equity 86,825 86,825 86,827 86,828 86,829
184

AHL Budget Statements
Table 3.2.3: Departmental statement of changes in equity – summary of movement (Budget year 2012–13)
Retained Asset Other Contributed Totalearnings revaluation reserves equity/ equity
reserve capital$'000 $'000 $'000 $'000 $'000
Opening balance as at 1 July 2012Balance carried forw ard from
previous period -1,256 - - 88,081 86,825
Comprehensive incomeSurplus (deficit) for the period -1 - - - 1-
Estimated closing balanceas at 30 June 2013 -1,257 - - 88,081 86,824
Closing balance attributable to the Australian Government -1,257 - - 88,081 86,824
Prepared on Australian Accounting Standards basis.
185

AHL Budget Statements
Table 3.2.4: Budgeted departmental statement of cash flow s (for the period ended 30 June)
Estimated Budget Forw ard Forw ard Forw ardactual estimate estimate estimate estimate
2011-12 2012-13 2013-14 2014-15 2015-16$'000 $'000 $'000 $'000 $'000
OPERATING ACTIVITIESCash received
Appropriations 38,481 38,520 38,658 38,825 39,116Sale of goods and rendering of services 11,363 12,978 12,933 12,937 12,937Interest 525 - 40 76 110Net GST received 3,294 3,000 3,000 3,000 - Other 9,445 5,221 2,633 2,698 2,765
Total cash received 63,108 59,719 57,264 57,536 54,928Cash used
Employees 31,099 30,091 27,622 27,751 28,110Suppliers 35,649 21,392 20,201 20,334 18,353Net GST paid - - - - - Other 6,509 4,903 6,258 6,301 6,357
Total cash used 73,257 56,386 54,081 54,386 52,820Net cash from (used by)
operating activities -10,149 3,333 3,183 3,150 2,108INVESTING ACTIVITIESCash received
Proceeds from sales of property,plant and equipment -888 433 433 433 433
Other - - - - - Total cash received -888 433 433 433 433Cash used
Purchase of property, plant and equipment 12,577 577 578 578 578
Other - - - - - Total cash used 12,577 577 578 578 578Net cash from (used by)
investing activities -13,465 -144 -145 -145 -145
FINANCING ACTIVITIESCash received
Contributed equity - - - - - Other 502 -1,466 -969 -969 -969
Total cash received 502 -1,466 -969 -969 -969
Cash usedOther - - - - -
Total cash used 502 -1,466 -969 -969 -969Net cash from (used by)
financing activities 502 -1,466 -969 -969 -969Net increase (decrease)
in cash held -23,112 1,723 2,069 2,036 994Cash and cash equivalents at the
beginning of the reporting period 28,957 5,845 7,568 9,637 11,673Cash and cash equivalents at the
end of the reporting period 5,845 7,568 9,637 11,673 12,667
186

AHL Budget Statements
Table 3.2.5: Departmental capital budget statementFor the financial years 2011-12 and 2012-13, AHL did not receive equityinjection – Bill 2 Appropriations.
187

AHL Budget Statements
Table 3.2.6: Statement of Asset Movements (2012‑ 13)Asset Category (as appropriate)
Land Buildings Other property, Heritage Computer Totalplant and and cultural software and
equipment intangibles$'000 $'000 $'000 $'000 $'000 $'000
As at 1 J uly 2012
Gross book value 5,198 106,693 6,684 139 290 119,004Accumulated depreciation/amortisation
and impairment - (30,873) (3,072) (20) (67) (34,032)Opening net book balance 5,198 75,820 3,612 119 223 84,972
Other movementsAssets held for sale or in a disposal
group held for saleDepreciation/amortisation expense - (1,843) (1,014) (1) (71) (2,929)OtherTotal other movements - (1,843) (1,014) (1) (71) (2,929)
As at 30 J une 2013Gross book value 5,198 106,693 6,684 139 290 119,004Accumulated depreciation/amortisation
and impairment - (32,716) (4,086) (21) (138) (36,961)Closing net book balance 5,198 73,977 2,598 118 152 82,043
188

AHL Budget Statements
3.2.7 Notes to the financial statements
The financial statements have been prepared in accordance with Australian Equivalent of International Financial Reporting Standards (AEIFRS) and other authoritative pronouncements of the Australian Accounting Standards Board and the Corporations Act 2001.
The financial statements are prepared on an accrual basis and in accordance with historical cost convention.
The accounting policies adopted that underpin these statements are consistent with those applied in 2011-12.
Reference should be made to AHL’s Annual Report 2010-11 for detailed disclosure of AHL’s accounting policies.
189

Australian Institute of Family Studies
Agency Resources and Planned Performance

AUSTRALIAN INSTITUTE OF FAMILY STUDIES
Section 1: Agency overview and resources..........................................................1931.1 Strategic direction statement........................................................................1931.2 Agency resource statement.........................................................................1951.3 Budget measures.........................................................................................196
Section 2: Outcomes and planned performance...................................................1972.1 Outcomes and performance information......................................................197
Section 3: Explanatory tables and budgeted financial statements......................2023.1 Explanatory tables.......................................................................................2023.2 Budgeted financial statements.....................................................................203
193

Australian Institute of Family Studies
Section 1: Agency overview and resources
1.1 Strategic direction statement
The Australian Institute of Family Studies (AIFS) is the Australian Government’s key research body in the area of family wellbeing. It was established in 1980 under the Family Law Act 1975 and its role is to conduct research and communicate findings to policy-makers, service providers and the community about factors affecting family wellbeing. AIFS’ work provides an evidence base for developing policy and practice related to the wellbeing of families in Australia. AIFS undertakes a range of research activities and ensures the quality of its work through:• rigorous ethical standards and oversight by an ethics committee• benchmarking against international standards• subjecting research design, methodology and results to peer review. Its work includes research projects involving a range of data collection and analytic methods (such as quantitative, qualitative and mixed methods), as well as undertaking longitudinal studies and analyses of major national datasets, such as the ABS census, and completing literature reviews and submissions to government inquiries.AIFS’ activities underpin policy development in areas such as:• tracking family change, functioning and wellbeing in an increasingly
diverse Australian society• understanding the drivers of the social and economic participation of
families• providing information to support national efforts to promote the safety of
children and families• advancing the design and delivery of services to support and strengthen
families. The 2012–13 financial year marks the start of the Institute’s new forward planning triennium, guided by AIFS Research Directions 2012–2015 and AIFS Strategic Directions 2012–2015. Throughout this financial year, much of AIFS’ work will again be undertaken on behalf of other agencies seeking information to inform specific policy decisions affecting families, and their communities, in Australia.Communicating research findings will continue to be an integral part of AIFS’ work. Key stakeholders seeking this information include the Australian Government; state, territory and local governments; providers of services to families and children; researchers and policy makers; and the broader Australian community.
195

Key activities 2012–13
Longitudinal studies – particularly Growing up in Australia: the Longitudinal Study of Australian Children, the Stronger Families in Australia study, the Australian Temperament Project and the Longitudinal Study of Separated Families – will continue to be a focus for AIFS. These studies are the key components of an evidence base to inform policy development and analysis undertaken within AIFS and by other researchers.Three of the clearinghouses previously operated by AIFS have been streamlined into a new information exchange: the Child Family Community Australia information exchange, which sits alongside two other clearinghouses: the Australian Centre for the Study of Sexual Assault and the Closing the Gap Clearinghouse. These are important vehicles for disseminating sector-specific research and data, and will continue to communicate research findings to policymakers and child/family welfare practitioners.In July 2012, the biennial AIFS Conference will provide a national forum for stimulating ideas and debate about research findings, policy priorities and topical issues important to the wellbeing of families in Australia. This event, along with the AIFS Seminar Series and the biennial Longitudinal Study of Australian Children Conference, provides a platform for world-class speakers to share their knowledge on matters affecting family wellbeing. These activities reach a broad audience in Australia and beyond.This year, AIFS will continue to build relationships with organisations that also have a stake in research, policy and practice which affect family wellbeing. These relationships help to efficiently build research capability and communications reach, for the benefit of the Australian Government and the Australian community. Finally, the Institute will maintain high standards in relation to its research and corporate governance through adherence to the standards set by the National Statement on Ethical Conduct in Human Research, through use of peer reviewing of projects and publications, and involvement of its Advisory Council, as well as through the work of the Risk Assessment and Audit Committee.
196

AIFS Budget Statements
1.2 Agency resource statement
Table 1.1 shows the total resources from all sources. The table summarises how resources will be applied by outcome and by administered and departmental classification.
Table 1.1: AIFS Resource Statement – Budget Estimates for 2012–13 as at Budget May 2012
Estimateof prior
year amountsavailable in
2012-13$'000
+
Proposedat Budget
2012-13$'000
=
Totalestimate
2012-13$'000
Actualavailable
appropriation
2011-12$'000
Ordinary annual services1
Departmental appropriationPrior year departmental appropriation2 3,785 - 3,785 3,972Departmental appropriation3 - 3,538 3,538 3,717s31 Relevant agency receipts4 - 6,977 6,977 6,216Total 3,785 10,515 14,300 13,905
Total ordinary annual services A 3,785 10,515 14,300 13,905Other services - - - - - Total other services B - - - - Total available annual
appropriations 3,785 10,515 14,300 13,905 Special appropriationsTotal special appropriations C - - - - Total appropriations excluding
Special Accounts 3,785 10,515 14,300 13,905Special AccountsTotal Special Account D - - - - Total resourcingA+B+C+D 3,785 10,515 14,300 13,905Total net resourcing for AIFS 3,785 10,515 14,300 13,905Note: All figures are GST exclusive.1 Appropriation Bill (No.1) 2012-13.2 Estimated adjusted balance carried forward from previous year.3 Includes an amount of $0.1m in 2012-13 for the Departmental Capital Budget (refer to table 3.2.5 forfurther details). For accounting purposes this amount has been designated as 'contributions by owners'.4 s31 Relevant Agency receipts - estimate.
197

AIFS Budget Statements
1.3 Budget measures
AIFS does not have any budget measures.
198

AIFS Budget Statements
Section 2: Outcomes and planned performance
2.1 Outcomes and performance information
Government outcomes are the intended results, impacts or consequences of actions by the Government on the Australian community. Commonwealth programs are the primary vehicle by which government agencies achieve the intended results of their outcome statements. Agencies are required to identify the programs which contribute to government outcomes over the Budget and forward years.Each outcome is described below together with its related programs, specifying the performance indicators and targets used to assess and monitor the performance of the Australian Institute of Family Studies in achieving government outcomes.
Outcome 1
To increase understanding of factors affecting how Australian families function by conducting research and communicating findings to policy-makers, service providers and the broader community.
Outcome 1 Strategy
The Institute continues to have a single planned outcome. AIFS has two strategies to meet this outcome: AIFS undertakes high-quality, impartial research that is relevant to good policy and practice
AIFS disseminates its findings to policy makers, community service providers, the research community and the Australian community.
In 2012–13, AIFS’ resources will be directed towards: • continuing to develop the evidence base to inform policy development
and good practice, including:– major longitudinal studies – short- and medium-term research projects, submissions and reports– program evaluations – literature reviews.
• continuing to communicate research findings to four targeted groups: – policy makers: to inform the development and review of policies and
programs affecting families
199

AIFS Budget Statements
– service providers: to improve professional practice that supports families
– researchers: to encourage further research on issues affecting the wellbeing of Australian families
– the Australian community: to raise understanding and knowledge of family functioning.
A significant element of this strategy continues to be the delivery of the Institute’s national information exchange services, which include:• the Child Family Community Australia information exchange • the Australian Centre for the Study of Sexual Assault • the Closing the Gap Clearinghouse, which is focused on improving
understanding and outcomes for Indigenous families (delivered in partnership with the Australian Institute of Health and Welfare).
The major external factors that may affect the capacity of the Institute to achieve its outcome are its ability to absorb the potential impact of the efficiency dividend and the potential reduction in the capacity of other government agencies to commission research from the Institute. However, AIFS will maintain its responsiveness to changing policy priorities within budget constraints.
Outcome Expense Statement
Table 2.1 provides an overview of the total expenses for Outcome 1, by program.
200

AIFS Budget Statements
Table 2.1: Budgeted Expenses for Outcome 12011-12
Estimatedactual
expenses$'000
2012-13Estimatedexpenses
$'000Program 1.1: Australian Institute of Family StudiesDepartmental expenses
Departmental appropriation 1 9,620 10,421Expenses not requiring appropriation in the Budget year 2 336 375
Total for Program 1.1 9,956 10,796
Outcome 1 Totals by appropriation typeDepartmental expenses
Departmental appropriation 1 9,620 10,421Expenses not requiring appropriation in the Budget year 2 336 375
Total expenses for Outcome 1 9,956 10,796 2011-12 2012-13
Average Staffing Level (number) 66 70
1 Departmental Appropriation combines "Ordinary annual services (Appropriation Bill No. 1)" and "Revenue from independent sources (s31)".2 Expenses not requiring appropriation in the Budget year is made up of Depreciation Expense, Amortisation Expense and Audit Fees.
201

AIFS Budget Statements
Contributions to Outcome 1
Program 1.1: Australian Institute of Family Studies
Program ObjectivesTo increase understanding of factors affecting how Australian families function by conducting research and communicating findings to policy-makers, service providers and the broader community, AIFS will manage its resources to: undertake high-quality, impartial research relating to the wellbeing of
families in Australia share the information and transfer the knowledge to identified target
audiences develop and value relationships with organisations that have a stake in
research, policy and practice influencing the wellbeing of families build organisational capability, culture, and a workforce that fosters the
delivery of high-quality research on family wellbeing
Program 1.1 Deliverables Research outputs, including research projects involving a range of data collection and analytical methods (including qualitative, quantitative and mixed methods), as well as undertaking longitudinal studies and analyses of major datasets such as the ABS census, and completing literature reviews and submissions to government inquiries.Communication activities, including: information exchange and clearinghouse activities publications such as Family Matters journal, research reports and papers,
articles in journals, and books published elsewhere conferences, seminars and forums hosted by AIFS websites and electronic publishing presentations by AIFS staff at conferences and forums related to the
wellbeing of families in Australia library helpdesk, bibliographic and other advisory services.
202

AIFS Budget Statements
Australian Institute of Family Studies Deliverables Targets Deliverables 1,2
2011-12RevisedBudget
2012-13Budget
2013-14Forw ard
year 1
2014-15Forw ard
year 2
2015-16Forw ard
year 3
Number of research outputs and publications 85 90 100 100 100Number of conferences, seminars, forums 10 10 10 10 10Number of presentations given by AIFS 80 100 80 100 80Number of Library helpdesk inquiry responses 3 440 400 400 400 400Number of bibliography records generated 1,200 1,200 1,200 1,200 1,200
1 The number of parliamentary inquiries/submissions citing AIFS research has been discontinued as it reflects the number of inquiries into issues related to families rather than the value of the Institute’s research.2 The number of websites and sub-sites has been removed following the amalgamation of a number of clearinghouses to streamline dissemination activity.3 The number of library helpdesk inquiries will continue to reduce, as people are increasingly able to source material directly through websites and require less helpdesk support.
203

AIFS Budget Statements
Program 1.1 Key Performance Indicators Research Strategynumber of commissioning bodies number of research projects number of longitudinal studies Communication Strategynumber of copies of publications distributed and downloaded total attendance at conferences, seminars and forums hosted number of media mentions – online, print, television, radioWorkforce Objectivequalifications and professional expertise of AIFS employees
Australian Institute of Family Studies Key Performance IndicatorsKey Performance Indicators 2011-12
RevisedBudget
2012-13Budgettarget
2013-14Forw ard
year 1
2014-15Forw ard
year 2
2015-16Forw ard
year 3
Number of commissioning bodies 20 20 20 20 20Number of research projects 1 42 42 42 42 42Number of longitudinal studies 2 5 5 5 5 5Number of publications distributed & dow nloaded (in millions) 1.75 1.8 1.8 1.8 1.8Total attendance at AIFS conferences, seminars and forums 550 750 550 750 550Number of media mentions 2300 2800 2300 2800 2300Percentage of research personnel w ith post-graduate qualif ications 3 59% 55% 55% 55% 55%1 This KP I has been adjusted to more accurately reflect the full range of research projects undertaken by AIFS.2 Longitudinal studies have been included as a significant contributor to a strong evidence base for policy-makers and practitioners.3 This KP I replaces the number of staff involved in representation on external bodies because post-graduate qualification is a more reliable indicator of the qualification and expertise of AIFS personnel.
204

AIFS Budget Statements
Section 3: Explanatory tables and budgeted financial statements
Section 3 presents explanatory tables and budgeted financial statements, which provide a comprehensive snapshot of agency finances for the 2012-13 budget year. It explains how budget plans are incorporated into the financial statements and provides further details of the reconciliation between appropriations and program expenses, movements in administered funds, special accounts and government Indigenous expenditure.
3.1 Explanatory tables
3.1.1 Movement of administered funds between yearsAIFS does not receive administered funds.3.1.2 Special accountsAIFS does not have a special account.3.1.3 Australian Government Indigenous ExpenditureAIFS does not have any Indigenous-specific expenditure.
205

AIFS Budget Statements
3.2 Budgeted financial statements
3.2.1 Differences in agency resourcing and financial statementsThe agency resource statement (Table 1.1) provides a consolidated view of all the resources available to the agency in 2012–13. This includes equity injections and appropriation receivable that is yet to be drawn down to cover payables and provisions on the balance sheet. The income statement (Table 3.2.1) shows only the operating appropriation provided in 2012–13.
3.2.2 Analysis of budgeted financial statementsIncome statement
AIFS is budgeting for a break-even position in 2012–13 and the forward years after adjusting for depreciation and amortisation expenses.The deficits are attributable to the depreciation costs for 2012–13 and forward years.Total expenses for AIFS for 2012–13 are expected to be $10.8 million, compared to $10 million in 2011–12.Balance sheetAIFS’ overall net asset position continues to enable it to maintain an adequate level of working capital. The net cash appropriation arrangements will reduce the net asset balance in the long term, depending on the level of department capital budget compared to the depreciation costs. Provisions for employee entitlements amounting to $2 million represent accruing leave entitlements for employees. Other liabilities relate mainly to lease payable and the lease incentive received from the landlord at the beginning of the lease term, recognised as a liability and amortised over the life of the lease (totalling approximately $0.6 million) and unearned revenue of approximately $1.3 million.Infrastructure, plant and equipment are not expected to change significantly over the reporting period. AIFS has budgeted for replacement of some desktop and laptop computers.Statement of cash flowsAIFS continues to have a level of cash reserves sufficient to maintain its operations.
206

AIFS Budget Statements
Table 3.2.1 Comprehensive income statement (showing net cost of services) (for the period ended 30 June)
Estimatedactual
Budgetestimate
Forw ardestimate
Forw ardestimate
Forw ardestimate
2011-12$'000
2012-13$'000
2013-14$'000
2014-15$'000
2015-16$'000
EXPENSESEmployee benefits 7,225 7,984 8,143 8,386 8,634 Suppliers 2,419 2,461 2,195 2,469 2,190 Depreciation and amortisation 312 351 344 364 396 Total expenses 9,956 10,796 10,682 11,219 11,220 LESS: OWN-SOURCE INCOMEOwn-source revenueSale of goods and rendering of services 5,993 6,970 6,842 7,337 7,272 Royalties 80 - - - - Other 35 35 35 35 35 Total own-source revenue 6,108 7,005 6,877 7,372 7,307 GainsOther 24 24 24 24 24 Total gains 24 24 24 24 24 Total own-source income 6,132 7,029 6,901 7,396 7,331 Net cost of (contribution by)
services 3,824 3,767 3,781 3,823 3,889 Revenue from Government 3,512 3,416 3,437 3,459 3,493 * * * *Surplus (Deficit) attributable to
the Australian Government (312) (351) (344) (364) (396) OTHER COMPREHENSIVE INCOMETotal other comprehensive income - - - - - Total comprehensive income (loss) - - - - -
Total comprehensive income (loss) attributable to the Australian Government (312) (351) (344) (364) (396)
Note: Impact of Net Cash Apppropriation Arrangements2011-12
$'0002012-13
$'0002013-14
$'0002014-15
$'0002015-16
$'000Total Comprehensive Income
(loss) less depreciation/amortisationexpenses previously funded throughrevenue appropriations. - - - - -
plus depreciation/amortisation expensespreviously funded through revenueappropriations1 (312) (351) (344) (364) (396)
Total Comprehensive Income (loss) - as per the Statement ofComprehensive Income (312) (351) (344) (364) (396)
1 From 2010-11, the Government introduced net cash appropriation arrangements where Bill 1 revenue appropriations for the depreciation/amortisation expenses of FMA Act agencies were replaced with a separate capital budget (the Departmental Capital Budget, or DCB) provided through Bill 1 equity appropriations. For information regarding DCBs, please refer to Table 3.2.5 Departmental Capital Budget Statement.Prepared on Australian Accounting Standards basis.
207

AIFS Budget Statements
Table 3.2.2: Budgeted departmental balance sheet (as at 30 June) Estimated Budget Forw ard Forw ard Forw ard
actual estimate estimate estimate estimate2011-12 2012-13 2013-14 2014-15 2015-16
$'000 $'000 $'000 $'000 $'000ASSETSFinancial assets
Cash and cash equivalents 222 184 69 52 50Trade and other receivables 4,102 4,124 4,304 4,338 4,263Other f inancial assets 176 197 202 208 214
Total financial assets 4,500 4,505 4,575 4,598 4,527Non-financial assets
Property, plant and equipment 1,321 1,090 928 751 547Intangibles 14 16 16 16 14Other non-f inancial assets 121 123 110 124 110
Total non-financial assets 1,456 1,229 1,054 891 671Total assets 5,956 5,734 5,629 5,489 5,198LIABILITIESPayables
Suppliers 352 378 366 391 480Other payables 2,244 1,944 1,693 1,374 1,018
Total payables 2,596 2,322 2,059 1,765 1,498Interest bearing liabilitiesProvisions
Employee provisions 1,738 2,019 2,339 2,670 2,852Total provisions 1,738 2,019 2,339 2,670 2,852Total liabilities 4,334 4,341 4,398 4,435 4,350Net assets 1,622 1,393 1,231 1,054 848
EQUITY*Parent entity interest
Contributed equity 1,844 1,966 2,148 2,335 2,525Retained surplus
(accumulated deficit) (222) (573) (917) (1,281) (1,677)Total parent entity interest 1,622 1,393 1,231 1,054 848Total Equity 1,622 1,393 1,231 1,054 848* 'Equity' is the residual interest in assets after deduction of liabilities.Prepared on Australian Accounting Standards basis.
208

AIFS Budget Statements
Table 3.2.3: Departmental statement of changes in equity – summary of movement (Budget year 2012–13)
Retainedearnings
$'000
Assetrevaluation
reserve$'000
Otherreserves
$'000
Contributedequity/capital$'000
Totalequity
$'000
Opening balance as at 1 July 2012Balance carried forw ard from
previous period (222) - - 1,844 1,622Adjusted opening balance (222) - - 1,844 1,622Comprehensive income
Surplus (def icit) for the period (351) - - - (351)
Total comprehensive income (351) - - - (351) of w hich:
Attributable to the Australian Government (351) - - - (351)
Transactions w ith ownersContributions by owners
Equity Injection - - - - -Equity Injection - Appropriation - - - - -Departmental Capital Budget (DCBs) - - - 122 122
Sub-total transactions with owners - - - 122 122Estimated closing balance
as at 30 June 2013 (573) - - 1,966 1,393Closing balance attributable to the
Australian Government (573) - - 1,966 1,393Prepared on Australian Accounting Standards basis.
209

AIFS Budget Statements
Table 3.2.4: Budgeted departmental statement of cash flows(for the period ended 30 June)
Estimatedactual
Budgetestimate
Forw ardestimate
Forw ardestimate
Forw ardestimate
2011-12$'000
2012-13$'000
2013-14$'000
2014-15$'000
2015-16$'000
OPERATING ACTIVITIESCash received
Appropriations 3,700 3,425 3,264 3,447 3,573Sale of goods and rendering of services 6,216 6,977 6,889 7,369 7,319
Total cash received 9,916 10,402 10,153 10,816 10,892Cash used
Employees 7,241 7,703 7,823 8,054 8,451Suppliers 2,308 2,326 2,019 2,339 1,975Net GST paid 400 411 426 440 468
Total cash used 9,949 10,440 10,268 10,833 10,894Net cash from (used by)
operating activities (33) (38) (115) (17) (2) INVESTING ACTIVITIESCash received
Other - - - - - Total cash received - - - - - Cash used
Purchase of property, plant 335 122 182 187 190and equipment
Total cash used 335 122 182 187 190Net cash from (used by)
investing activities (335) (122) (182) (187) (190) FINANCING ACTIVITIESCash received
Contributed equity 205 122 182 187 190Total cash received 205 122 182 187 190
Cash usedOther - - - - -
Total cash used - - - - - Net cash from (used by)
financing activities 205 122 182 187 190Net increase (decrease)
in cash held (163) (38) (115) (17) (2) Cash and cash equivalents at the
beginning of the reporting period 385 222 184 69 52Cash and cash equivalents at the
end of the reporting period 222 184 69 52 50Prepared on Australian Accounting Standards basis.
210
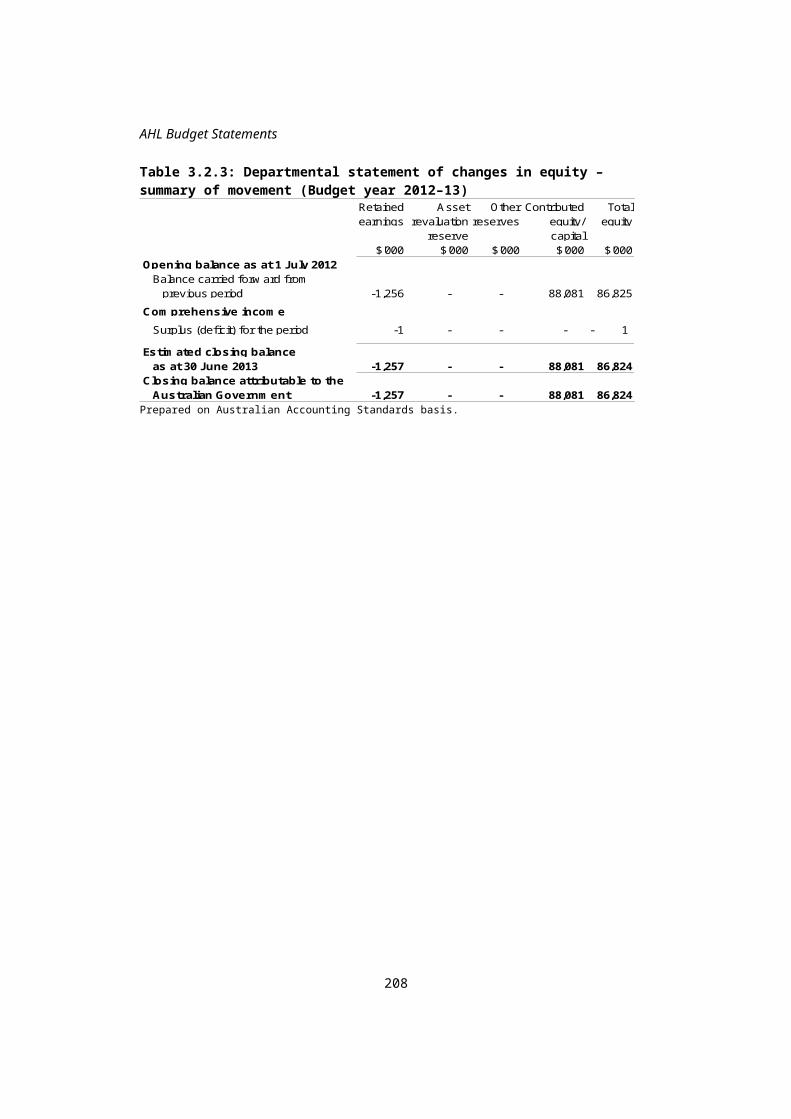
AIFS Budget Statements
Table 3.2.5: Departmental capital budget statementEstimated
actualBudget
estimateForw ardestimate
Forw ardestimate
Forw ardestimate
2011-12$'000
2012-13$'000
2013-14$'000
2014-15$'000
2015-16$'000
NEW CAPITAL APPROPRIATIONSCapital budget - Bill 1 (DCB) 205 122 182 187 190
Total new capital appropriations 205 122 182 187 190
Provided for:Purchase of non-financial assets 205 122 182 187 190
Total Items 205 122 182 187 190 PURCHASE OF NON-FINANCIAL
ASSETSFunded by capital appropriations 1 - - - - -Funded by capital appropriation - DCB 2 205 122 182 187 190 Funded internally from
departmental resources 3 130 - - - - TOTAL 335 122 182 187 190
RECONCILIATION OF CASHUSED TO ACQUIRE ASSETSTO ASSET MOVEMENT TABLE
Total purchases 335 122 182 187 190 Total cash used to
acquire assets 335 122 182 187 190 1 Includes both current and prior Bill 2/4/6 appropriations and special capital appropriations2 Does not include annual finance lease costs. Includes purchases from current and previous
years' Departmental Capital Budgets (DCBs).3 Includes the following sources of funding: - current and prior year Bill 1/3/5 appropriations (excluding amounts from the DCB). - donations and contributions - gifts - internally developed assets - s31 relevant agency receipts (for FMA agencies only) - proceeds from the sale of assetsPrepared on Australian Accounting Standards basis.
211

AIFS Budget Statements
Table 3.2.6: Statement of asset movements (2012–13) Other property, Computer Total
plant and software andequipment intangibles
$'000 $'000 $'000As at 1 July 2012Gross book value 1,913 121 2,034 Accumulated depreciation/amortisation
and impairment (592) (107) (699)Opening net book balance 1,321 14 1,335
CAPITAL ASSET ADDITIONSEstimated expenditure on
new or replacement assetsBy purchase - appropriation equity 1 112 10 122 Total additions 112 10 122
Other movements Depreciation/amortisation expense (343) (8) (351)Total other movements (343) (8) (351)
As at 30 June 2013Gross book value 2,025 131 2,156 Accumulated depreciation/amortisation
and impairment (935) (115) (1,050)Closing net book balance 1,090 16 1,106
1 "Appropriation equity" refers to equity injections or Administered Assets and Liabilities appropriations provided through Appropriation Bill (No.2) 2012-13, including CDABs.
Prepared on Australian Accounting Standards basis.
212

Equal Opportunity for Women in the Workplace
Agency
Agency Resources and Planned Performance

EQUAL OPPORTUNITY FOR WOMEN IN THE WORKPLACE AGENCY
Section 1: Agency overview and resources..........................................................2151.1 Strategic direction statement........................................................................2151.2 Agency resource statement.........................................................................2171.3 Budget measures.........................................................................................218
Section 2: Outcomes and planned performance...................................................2192.1 Outcomes and performance information......................................................219
Section 3: Explanatory tables and budgeted financial statements......................2253.1 Explanatory tables.......................................................................................2253.2 Budgeted financial statements.....................................................................226
215
Department abbreviation Budget Statements

Equal Opportunity for Women in the Workplace Agency
Section 1: Agency overview and resources
The planned outcome of the Equal Opportunity for Women in the Workplace Agency is equality of opportunity in employment for women.
1.1 Strategic direction statement
The Equal Opportunity for Women in the Workplace Agency (EOWA) is chartered through the Equal Opportunity for Women in the Workplace Act 1999 (EOWW Act) with both regulatory and educative functions and responsibilities. EOWA’s stated outcome is equality of opportunity in employment for women.It is EOWA’s objective that every working woman in Australia should have the same opportunities as her male counterparts.The EOWW Act covers private sector organisations with more than 100 employees. The EOWW Act currently requires relevant employers to develop a workplace program aimed at eliminating discrimination against women and to report annually to the agency on the program.
Throughout 2012–13 EOWA will work closely with approximately 9,000 employers to improve awareness and understanding about the issues impacting women’s workforce participation. EOWA will focus on report assessment, training, research and communications to deliver increased awareness of equal opportunity initiatives including paid maternity leave, reducing the gender pay gap, advancing merit-based opportunity and improving the quality of flexible working arrangements. The Equal Opportunity for Women in the Workplace Amendment Bill 2012 (Bill) was introduced into Parliament on 1 March 2012. The Bill changes the name of the Act to the Workplace Gender Equality Act 2012 (WGE Act) and the name of the agency to the Workplace Gender Equality Agency. The WGE Act will strengthen the agency’s focus on gender equality, highlighting equal remuneration between women and men and caring responsibilities as key dimensions in achieving equal outcomes in the workplace. Subject to the Bill receiving Royal Assent, the agency will focus on implementing the new legislation and assisting employers to make the transition to the new arrangements. It will also promote public debate and awareness of the benefits of gender equality in the workplace, conduct leading edge research, profile best practice and provide guidance and practical solutions.
217

EOWA’s Research team provides up-to-date statistics and fact sheets on relevant workplace gender equality issues to assist reporting organisations and stakeholders. The team is also responsible for conducting and commissioning research projects on key equal opportunity issues in the workplace (for example, the Census of Women in Leadership), in line with EOWA’s vision.
218

EOWA Budget Statements
1.2 Agency resource statement
Table 1.1 shows the total resources from all sources. The table summarises how resources will be applied by outcome and by administered and departmental classification.
Table 1.1: EOWA Resource Statement – Budget Estimates for 2012–13 as at Budget May 2012
Estimate Proposed Total Actualof prior + at Budget = estimate available
year amounts appropriation available in
2012-13 2012-13 2012-13 2011-12$'000 $'000 $'000 $'000
Ordinary annual services1
Departmental appropriationPrior year departmental appropriation2 1,680 - 1,680 1,680Departmental appropriation3 - 5,943 5,943 5,320s31 Relevant agency receipts4 - 100 100 410Total 1,680 6,043 7,723 7,410
Total ordinary annual services A 1,680 6,043 7,723 7,410Departmental non- operating
Equity injections - 830 830 780Total - 830 830 780
Total other services B - 830 830 780
Total resourcingA+B+C+D 1,680 6,873 8,553 8,190Less appropriations drawn from
annual or special appropriations aboveand credited to special accountsand/or CAC Act bodies through annual appropriations - - - -
Total net resourcing for EOWA 1,680 6,873 8,553 8,190(a)
1 Appropriation Bill (No.1) 2012-132 Estimated adjusted balance carried forward from previous year3 Includes an amount of $0.9m in 2012–13 for the Departmental Capital Budget (refer to table 3.2.5 forfurther details). For accounting purposes this amount has been designated as ‘contributions by owners’.4 s31 Relevant Agency receipts - estimate
(b) Reader note: All figures are GST exclusive.

EOWA Budget Statements
Third party payments from and on behalf of other agencies2012-13 2011-12
$'000 $'000Payments made to other agencies for the provision of services
Department of Families, Housing, Community Services and Indigenous Affairs 360 130
1.3 Budget measures
EOWA has no measures in the 2012–13 Budget.
220

EOWA Budget Statements
Section 2: Outcomes and planned performance
2.1 Outcomes and performance information
Government outcomes are the intended results, impacts or consequences of actions by the Government on the Australian community. Commonwealth programs are the primary vehicle by which government agencies achieve the intended results of their outcome statements. Agencies are required to identify the programs which contribute to Government outcomes over the Budget and forward years.Each outcome is described below together with its related programs, specifying the performance indicators and targets used to assess and monitor the performance of the Equal Opportunity for Women in the Workplace Agency in achieving Government outcomes.
Outcome 1
Increased influence over Australian employers to achieve equality for women in the workplace through regulation and education on eliminating discrimination and promoting merit based opportunity.
Outcome 1 Strategy
EOWA will work closely with private sector employers to improve awareness, understanding and action on issues, to achieve equality for women in the workplace and increase women’s workforce participation.Subject to the amendment Bill receiving Royal Assent, the Agency will focus on implementing the new legislation and assisting employers to make the transition to the new arrangements. It will also promote public debate and awareness of the benefits of gender equality in the workplace, conduct leading-edge research, profile best practice and provide guidance and practical solutions.

EOWA Budget Statements
Outcome Expense Statement
Table 2.1 provides an overview of the total expenses for Outcome 1, by program.
Table 2.1: Budgeted Expenses for Outcome 1Outcome 1: Increased influence over Australian employers to 2011-12 2012-13achieve equality for women in the workplace through Estimated Estimatedregulation and education on eliminating discrimination and actual expensespromoting merit based opportunity. expenses
$'000 $'000Program 1.1: Equality of Opportunity in Employment of WomenDepartmental expenses
Departmental appropriation 1 5,736 5,130Expenses not requiring appropriation in the Budget year 2 374 483
Total for Program 1.1 6,110 5,613
Outcome 1 Totals by appropriation typeDepartmental expenses
Departmental appropriation 1 5,736 5,130Expenses not requiring appropriation in the Budget year 2 374 483
Total expenses for Outcome 1 6,110 5,6132011-12 2012-13
Average Staffing Level (number) 3 28 36
1 Departmental Appropriation combines "Ordinary annual services (Appropriation Bill No. 1)" and "Revenue from independent sources (s31)".2 Expenses not requiring appropriation in the Budget year is made up of Depreciation Expense & Amortisation Expense.3 The increase in staff numbers relates to the increased scope and responsibilities of the Agency under the Equal Opportunity for Women in the Workplace Bill 2012.Note: Departmental appropriation splits and totals are indicative estimates and may change in the course of the budget year as government priorities change.
222

EOWA Budget Statements
Contributions to Outcome 1
Program 1.1: Equality of Opportunity in Employment for Women
Program 1.1 ObjectiveIncreased influence over Australian employers to achieve equality for women in the workplace through regulation and education on eliminating discrimination and promoting merit-based opportunity.

EOWA Budget Statements
Program 1.1 ExpensesThe program expenses reflect the announcement of the Government’s reform package aimed at strengthening the EOWW Act and requiring the Agency to focus on gender equality, highlighting pay equity and caring and unpaid responsibilities as key dimensions in achieving equal outcomes in the workplace.
Table 2.2: Program Expenses2011-12 2012-13 2013-14 2014-15 2015-16Revised Budget Forw ard Forw ard Forw ardbudget year 1 year 2 year 3
$'000 $'000 $'000 $'000 $'000
Program support 5,736 5,130 5,287 5,309 5,370Expenses not requiring appropriation in
the Budget year 1 374 483 442 442 442Total program expenses 6,110 5,613 5,729 5,751 5,812
1 Expenses not requiring appropriation in the Budget year is made up of Depreciation Expense & Amortisation Expense.
224

EOWA Budget Statements
Program 1.1 Deliverables
Increase in women in management Increase in paid maternity leave
Equality of Opportunity in Employment for Women Deliverables Targets2011-12 2012-13 2013-14 2014-15 2015-16Revised Budget Forw ard Forw ard Forw ard
Deliverables budget year 1 year 2 year 3Overall Budget ($'000) 5,736 5,130 5,287 5,309 5,370 Increase in w omen in management 35% 35.5% - - -Increase in paid maternity leave 55% 55% - - -

EOWA Budget Statements
Program 1.1 Key Performance Indicators
Workshop attendees agree or strongly agree that workshops are informative and valuable
Increase in women in management Increase in paid maternity leave
Equality of Opportunity in Employment for Women Key Performance Indicators2011-12 2012-13 2013-14 2014-15 2015-16
Key Performance Revised Budget Forw ard Forw ard Forw ardIndicators budget target year 1 year 2 year 3
Workshop Attendees agree or strongly 95% 95% - - -agree that w orkshops are informative andvaluableIncrease in w omen in management 35% 35.5% - - -Increase in paid maternity leave 55% 55% - - -
226

EOWA Budget Statements
Section 3: Explanatory tables and budgeted financial statements
Section 3 presents explanatory tables and budgeted financial statements which provide a comprehensive snapshot of agency finances for the 2012–13 budget year. It explains how budget plans are incorporated into the financial statements and provides further details of the reconciliation between appropriations and program expenses, movements in administered funds, special accounts and government indigenous expenditure.
3.1 Explanatory tables
3.1.1 Movement of administered funds between yearsEOWA does not have any administered expenses.
3.1.2 Special accountsEOWA does not have any special accounts.
3.1.3 Australian Government Indigenous ExpenditureEOWA does not have any indigenous-specific expenditure.

EOWA Budget Statements
3.2 Budgeted financial statements
3.2.1 Differences in agency resourcing and financial statements
EOWA has no differences in agency resourcing and financial statements.
3.2.2 Analysis of budgeted financial statements
Income and expenses
Employee benefits have increased due to the increase in staff numbers. This is due to the announcement of the Government’s reform package aimed at strengthening the EOWW Act and requiring the agency to focus on gender equality, highlighting pay equity and caring and unpaid responsibilities as key dimensions in achieving equal outcomes in the workplace. Own-source revenue will decrease year on year. This is primarily due to the fact that the agency will not be charging for workshops relating to the proposed reforms because this has been funded in the agency’s appropriations.
228

EOWA Budget Statements
3.2.3 Budgeted financial statements tables
Table 3.2.1 Comprehensive income statement (showing net cost of services)(for the period ended 30 June)
Estimated Budget Forw ard Forw ard Forw ardactual estimate estimate estimate estimate
2011-12 2012-13 2013-14 2014-15 2015-16$'000 $'000 $'000 $'000 $'000
EXPENSESEmployee benefits 3,555 3,771 3,751 3,735 3,703 Suppliers 2,181 1,359 1,536 1,574 1,667 Depreciation and amortisation * 374 483 442 442 442 Total expenses 6,110 5,613 5,729 5,751 5,812 LESS: OWN-SOURCE INCOMEOwn-source revenueSale of goods and rendering of services 366 100 150 150 150 Other 44 - - - - Total own-source income 410 100 150 150 150
Net cost of services 5,700 5,513 5,579 5,601 5,662
Revenue from Government 5,326 5,030 5,137 5,159 5,220 * * * *Deficit attributable to
the Australian Government * (374) (483) (442) (442) (442)
Total comprehensive loss attributable to the Australian Government * (374) (483) (442) (442) (442)
Note: Impact of Net Cash Apppropriation Arrangements2011-12 2012-13 2013-14 2014-15 2015-16
$'000 $'000 $'000 $'000 $'000Total Comprehensive Income
(loss) less depreciation/amortisationexpenses previously funded throughrevenue appropriations. - - - - -
plus depreciation/amortisation expensespreviously funded through revenueappropriations1 374 483 442 442 442
Total Comprehensive Income (loss) - as per the Statement ofComprehensive Income (374) (483) (442) (442) (442)
* From 2010-11, the Government introduced net cash appropriation arrangements w here Bill 1 revenue appropriations for the depreciation/amortisation expenses of FMA Act agencies w ere replaced w ith a separate capital budget (the Departmental Capital Budget, or DCB) provided through Bill 1 equity appropriations. For information regarding DCBs, please refer to Table 3.2.5 Departmental Capital Budget Statement.Prepared on Australian Accounting Standards basis.

EOWA Budget Statements
Table 3.2.2: Budgeted departmental balance sheet(as at 30 June)
Estimated Budget Forw ard Forw ard Forw ardactual estimate estimate estimate estimate
2011-12 2012-13 2013-14 2014-15 2015-16$'000 $'000 $'000 $'000 $'000
ASSETSFinancial assets
Cash and cash equivalents 663 731 742 1,006 1,006Trade and other receivables 1,672 1,654 1,642 1,378 1,378
Total financial assets 2,335 2,385 2,384 2,384 2,384Non-financial assets
Land and buildings 67 439 336 233 130Property, plant and equipment 1 1 1 - - Intangibles 666 1,504 1,166 828 489Other non-financial assets 5 5 5 5 5
Total non-financial assets 739 1,949 1,508 1,066 624Total assets 3,074 4,334 3,892 3,450 3,008LIABILITIESPayables
Suppliers 190 190 190 190 190Other payables 61 61 61 61 61
Total payables 251 251 251 251 251Provisions
Employee provisions 312 312 312 312 312Total provisions 312 312 312 312 312Total liabilities 563 563 563 563 563Net assets 2,511 3,771 3,329 2,887 2,445
EQUITY*Parent entity interest
Contributed equity 1,834 3,577 3,577 3,577 3,577Reserves 40 40 40 40 40Retained surplus 637 154 (288) (730) (1,172)
(accumulated deficit)Total parent entity interest 2,511 3,771 3,329 2,887 2,445
Total Equity 2,511 3,771 3,329 2,887 2,445* 'Equity' is the residual interest in assets after deduction of liabilities.Prepared on Australian Accounting Standards basis.
230

EOWA Budget Statements
Table 3.2.3: Departmental statement of changes in equity — summary of movement (Budget year 2011–12)
Retained Asset Other Contributed Totalearnings revaluation reserves equity/ equity
reserve capital$'000 $'000 $'000 $'000 $'000
Opening balance as at 1 July 2012Balance carried forw ard from 637 40 - 1,834 2,511
previous periodAdjusted opening balance 637 40 - 1,834 2,511
Deficit for the period (483) - - - (483)
Total comprehensive income 154 40 - 1,834 2,028Transactions with owners
Contributions by ownersEquity Injection - Appropriation - - - 830 830Departmental Capital Budget (DCBs) - - - 913 913
Sub-total transactions with owners - - - 1,743 1,743
Estimated closing balanceas at 30 June 2013 154 40 - 3,577 3,771
Prepared on Australian Accounting Standards basis.

EOWA Budget Statements
Table 3.2.4: Budgeted departmental statement of cash flows(for the period ended 30 June)
Estimated Budget Forw ard Forw ard Forw ardactual estimate estimate estimate estimate
2011-12 2012-13 2013-14 2014-15 2015-16$'000 $'000 $'000 $'000 $'000
OPERATING ACTIVITIESCash received
Appropriations 5,676 5,052 5,149 5,423 5,220Sale of goods and rendering of services 366 100 150 150 150Other 44 - - - -
Total cash received 6,086 5,152 5,299 5,573 5,370Cash used
Employees 3,555 3,771 3,751 3,735 3,703Suppliers 2,181 1,359 1,536 1,574 1,667Other 47 - - - -
Total cash used 5,783 5,130 5,287 5,309 5,370
Net cash from operating activities 303 22 12 264 -INVESTING ACTIVITIESCash used
Purchase of property, plant - 1,743 780 - -and equipment
Total cash used - 1,743 780 - -Net cash from investing activities - (1,743) (780) - -
FINANCING ACTIVITIESCash received
Contributed equity - 1,743 780 - -Total cash received - 1,743 780 - -Net cash from
financing activities - 1,743 780 - -Net increase
in cash held 302 68 11 264 -Cash and cash equivalents at the
beginning of the reporting period 361 663 731 742 1,006Cash and cash equivalents at the
end of the reporting period 663 731 742 1,006 1,006Prepared on Australian Accounting Standards basis.
232

EOWA Budget Statements
Table 3.2.5: Departmental capital budget statementEstimated Budget Forw ard Forw ard Forw ard
actual estimate estimate estimate estimate2011-12 2012-13 2013-14 2014-15 2015-16
$'000 $'000 $'000 $'000 $'000NEW CAPITAL APPROPRIATIONS
Capital budget - Bill 1 (DCB) - 913 - - - Equity injections - Bill 2 830 780 - -
Total new capital appropriations - 1,743 780 - -
Provided for:Purchase of non-financial assets - 1,743 780 - -
Total Items - 1,743 780 - - PURCHASE OF NON-FINANCIAL
ASSETSFunded by capital appropriations 1 - 830 780 - - Funded by capital appropriation - DCB 2 - 913 - - - Funded internally from
TOTAL - 1,743 780 - -
RECONCILIATION OF CASHUSED TO ACQUIRE ASSETSTO ASSET MOVEMENT TABLE
Total purchases - 1,743 780 - - Total cash used to
acquire assets - 1,743 780 - -
1 Includes both current and prior Bill 2/4/6 appropriations and special capital appropriations2 Does not include annual finance lease costs. Include purchase from current and previous
years' Departmental Capital Budgets (DCBs).Prepared on Australian Accounting Standards basis.

EOWA Budget Statements
Table 3.2.6: Statement of asset movements (2012-13)
Buildings Other property, Computer Other Totalplant and software and
equipment intangibles$'000 $'000 $'000 $'000 $'000
As at 1 J uly 2012Gross book value 696 21 2,827 5 3,549Accumulated depreciation/amortisation
and impairment (629) (20) (2,161) - (2,810)Opening net book balance 67 1 666 5 739CAPITAL ASSET ADDITIONSEstimated expenditure on
new or replacement assetsBy purchase - appropriation equity 1 - - 830 - 830By purchase - appropriation ordinary
annual services 2 620 1 292 - 913Total additions 620 1 1,122 - 1,743Other movementsDepreciation/amortisation expense (144) (1) (338) - (483)Other (104) - 54 - (50)Total other movements (248) (1) (284) - (533)As at 30 J une 2013Gross book value 1,212 22 4,003 5 5,242Accumulated depreciation/amortisation
and impairment (773) (21) (2,499) - (3,293)Closing net book balance 439 1 1,504 5 1,9491 "Appropriation equity" refers to equity injections or Administered Assets and Liabilities appropriations provided throughAppropriation Bill (No.2) 2012-13, including CDABs.2 "Appropriation ordinary annual services" refers to funding provided through Appropriation Bill (No.1) 2012-13 for depreciation / amortisation expenses, DCBs or other operational expenses.3 Net proceeds may be returned to the OPA.
Prepared on Australian Accounting Standards basis.
234

EOWA Budget Statements
3.2.4 Notes to the financial statements
Accounting policy
The agency budget statements have been prepared on an accrual accounting basis, having regard to the Statement of Accounting Concepts, and in accordance with:• The Finance Minister’s Orders• Australian Accounting Standards and Interpretations issued by the
Australian Accounting Standards Board (AASB).Departmental items
Departmental assets, liabilities, revenues and expenses are those items that are controlled by EOWA that are used by EOWA in producing its outputs and include:• Intangible assets, plant and equipment used in providing goods and
services• Liabilities for employee entitlements • Revenue and appropriations or independent sources in payments for
outputs • Employee, supplier and depreciation expenses incurred in providing
agency outputs.

Indigenous Business Australia
Agency Resources and Planned Performance

INDIGENOUS BUSINESS AUSTRALIA
Section 1: Agency overview and resources..........................................................2391.1 Strategic direction statement........................................................................2391.2 Agency resource statement.........................................................................2411.3 Budget measures.........................................................................................242
Section 2: Outcomes and planned performance...................................................2442.1 Outcomes and performance information......................................................244
Section 3: Explanatory tables and budgeted financial statements......................2543.1 Explanatory tables.......................................................................................2543.2 Budgeted financial statements.....................................................................256
239

Indigenous Business Australia
Section 1: Agency overview and resources
The planned outcome of Indigenous Business Australia (IBA) is stimulating the economic advancement of Aboriginal and Torres Strait Islander peoples.
1.1 Strategic direction statement
IBA’s vision is for a nation in which the First Australians are economically independent and an integral part of the economy. Under its legislation, the Aboriginal and Torres Strait Islander Act 2005, IBA’s purpose is to:
• assist and enhance Aboriginal and Torres Strait Islander self management and economic self-sufficiency
• advance the commercial and economic interest of Aboriginal and Torres Strait Islanders by accumulating and using a substantial capital base for the benefit of the Aboriginal and Torres Strait Islander peoples.
To achieve its purpose, IBA has established four key strategic objectives, under which its specific strategies and performance indicators are grouped:
• Accumulating an asset base for the benefit of Indigenous Australians. IBA implements an investment strategy aimed at a balanced portfolio generating returns for further investments and economic benefits for Indigenous Australians. These benefits include cash for further investments, improving employment opportunities and using the assets as the basis for developing small business opportunities. Initiatives are also implemented to support and develop the capacity of Indigenous joint venture partners
• Facilitating Indigenous Australians’ ownership of sustainable small business. IBA provides: services and support arrangements which enable potential entrepreneurs to build awareness and business skills prior to entering into business; concessional business loans to eligible customers; assistance with business mentoring to customers after entering into business and intensive loan and customers aftercare. IBA also facilitates access to other business support services and mainstream finance where appropriate
• Bridging the gap in home ownership through concessional home loans and assistance with ongoing loan management and other aspects of home ownership. These services are provided for aspiring Indigenous home owners who cannot access bank loans. IBA also promotes awareness and informed choice of home ownership options and facilitates access to mainstream finance where appropriate
• Promoting and encouraging economic independence for Indigenous Australians. IBA maximises the opportunities for Indigenous employment
241

and training through its activities, undertakes or contributes to initiatives that support the development of Indigenous commercial capacity, and brokers partnerships with the private sector, Indigenous organisations and government to deliver support and services that promote Indigenous economic development.
242

IBA Budget Statements
1.2 Agency resource statement
Table 1.1 shows the total resources from all sources. The table summarises how resources will be applied by outcome and by administered and departmental classification
Table 1.1: IBA Resource Statement—Budget Estimates for 2012–13 as at Budget May 2012
Estimate Proposed Total Actualof prior + at Budget = estimate available
year amounts appropriation available in
2012-13 2012-13 2012-13 2011-12Source $'000 $'000 $'000 $'000REVENUE FROM GOVERNMENTOrdinary Annual Services¹Outcome 1 Indigenous Business Australia - 34,315 34,315 38,923Total ordinary annual services - 34,315 34,315 38,923Other services²Non-Operating - 37,540 37,540 33,170Total other services - 37,540 37,540 33,170Total Annual Appropriations - 71,855 71,855 72,093Total Funds from Government - 71,855 71,855 72,093FUNDS FROM OTHER SOURCESInterest - 55,624 55,624 55,241Dividends - 201 201 183Sale of goods and services - 60,465 60,465 56,002Rents - 14,719 14,719 14,050Unwind Concessional Loan Discount - - - 2,527Other - 1,191 1,191 1,196Total - 132,200 132,200 129,199Total net resourcing for IBA - 204,055 204,055 201,292
All figures are GST exclusive.1 Appropriation Bill (No.1) 2012-132 Appropriation Bill (No.2) 2012-13
Note: Indigenous Business Australia is not directly appropriated as it is a CAC Act body. Appropriations are made to FMA agency FaHCSIA which are then paid to IBA and are considered 'departmental' for all purposes.

IBA Budget Statements
1.3 Budget measures Budget measures relating to IBA are detailed in Budget Paper No. 2 and are summarised below.
244

IBA Budget Statements
Table 1.2 IBA 2012–13 Budget measuresProgram 2011–12 2012–13 2013–14 2014–15 2015–16
$'000 $'000 $'000 $'000 $'000Revenue measuresOutcome 1Consolidation of the Indigenous Home Ow nership Programs1
Other Portfolios 1.2Administered revenue - - - - - Departmental revenue - (1,727) 299 628 836
Total - (1,727) 299 628 836
Total revenue measuresAdministered - - - - - Departmental - (1,727) 299 628 836
Total - (1,727) 299 628 836
Expense measuresOutcome 1Consolidation of the Indigenous Home Ow nership Programs1 1.2
Administered expenses - - - - - Departmental expenses - 31,719 6,720 6,524 6,907
Total - 31,719 6,720 6,524 6,907
Total expense measuresAdministered - - - - - Departmental - 31,719 6,720 6,524 6,907
Total - 31,719 6,720 6,524 6,907
Capital measuresOutcome 1Consolidation of the Indigenous Home Ow nership Programs1
Other Portfolios 1.2Administered capital - - - - - Departmental capital - - - - -
Total - - - - -
Total capital measuresAdministered - - - - - Departmental - - - - -
Total - - - - - Prepared on a Government Financial Statistics (f iscal) basis
1 Previous funding for HOIL grants w ill be redirected as capital for funding concessional loans.

IBA Budget Statements
Section 2: Outcomes and program performance
2.1 Outcomes and performance information
Government outcomes are the intended results, impacts or consequences of actions by the Government on the Australian community. Commonwealth programs are the primary vehicle by which government agencies achieve the intended results of their outcome statements. Agencies are required to identify the programs that contribute to government outcomes over the Budget and forward years.IBA’s outcome is described below together with its related programs, specifying the performance indicators and targets used to assess and monitor the performance of IBA in achieving government outcomes.
Outcome 1Improved wealth acquisition to support the economic independence of Aboriginal and Torres Strait Islander peoples through commercial enterprise, asset acquisition, construction and access to concessional home and business loans.
Outcome 1 Strategy
IBA utilises a suite of commercially focused Indigenous economic development programs to enhance Indigenous economic self-sufficiency. IBA delivers flexible and concessional interest rate loan products and aftercare support to improve Indigenous home ownership in towns and cities and on Indigenous-held land. IBA also provides concessional interest rate business loans and business support to increase Indigenous ownership of small- to medium-sized enterprises. For larger investment projects, IBA brings together private sector partners with Indigenous individuals and groups, co-investing in joint venture projects that provide both commercial returns and a direct transfer of business skills and acumen to Indigenous partners. IBA offers a holistic approach to Indigenous economic and commercial development which includes close engagement with private sector operators who share the vision of encouraging Indigenous participation in the mainstream economy.
Outcome 1 Expense Statement
Table 2.1 provides an overview of the total expenses for Outcome 1, by program.
246

IBA Budget Statements
Table 2.1: Budgeted Expenses for Outcome 1Outcome 1: 2011-12 2012-13
Estimated Estimatedactual expenses
expenses $'000 $'000
Program 1.1: Equities and Investments Departmental expenses
Ordinary annual services (Appropriation Bill No. 1) - - Revenues from other independent sources 74,248 79,835
Subtotal for Program 1.1 74,248 79,835
Program 1.2: Indigenous Home Ownership Departmental expenses
Ordinary annual services (Appropriation Bill No. 1) 15,150 10,726Revenues from other independent sources 39,611 41,117Expenses not requiring Appropriation in the Budget year (20,890) 22,026
Subtotal for Program 1.2 33,871 73,869
Program 1.3: Business Development and Assistance
Departmental expenses Ordinary annual services (Appropriation Bill No. 1) 23,773 23,589Revenues from other independent sources 6,315 3,688Expenses not requiring Appropriation in the Budget year 3,973 4,997
Subtotal for Program 1.3 34,061 32,274
Outcome 1 totals by appropriation type: Departmental expenses
Ordinary annual services (Appropriation Bill No. 1) 38,923 34,315Revenues from other independent sources 120,174 124,640Expenses not requiring Appropriation in the Budget year (16,917) 27,023
Total expenses for Outcome 1 142,180 185,978
2011-12 2012-13
Average Staffing Level (number) 215 217

IBA Budget Statements
Contributions to Outcome 1
Program 1.1: Equity and Investments
Program ObjectiveIBA Investments’ objective is to assist and develop Indigenous Australians to achieve economic independence through direct investment and participation in commercial and joint venture business enterprises.
Program 1.1 ExpensesProgram 1.1 will not receive government funding, but will cover its operating expenses through prudent management of the investment portfolio.
Table 2.1.1: Budgeted Expenses for Equity and Investments
248

IBA Budget Statements
2011-12 2012-13 2013-14 2014-15 2015-16
Revised Budget Forward Forward Forward
budget
year 1 year 2 year 3Program expenses ('000) $'000 $'000 $'000 $'000 $'000
Total departmental expenses 74,248 79,835 86,711 86,934 87,344
Total program expenses 74,248 79,835 86,711 86,934 87,344
Program 1.1 DeliverablesA profitable and sustainable investment portfolio that enables our Indigenous partners to participate in the mainstream economy.
Program 1.1 Key Performance Indicators• Return on Investment• Number of new co-investments made during the budget year• Distribution to Indigenous co-investors• Proportion of Indigenous jobs supported by the investment portfolio
Equity and Investments Key Performance Indicators Targets 2011–12 2012–13 2013–14 2014–15 2015–16Key Performance Revised Budget Forward Forward ForwardIndicators budget year 1 year 2 year 3
Return on Investment1 8% 8% 8.5% 9% 9%
Number of new co-investments made during the budget year 5 5 5 5 5
Distribution to Indigenous co-investors2 5% 5% 5% 5% 5%
Proportion of Indigenous jobs supported by investment portfolio 3 20% 20% 22.5% 22.5% 25%
Notes:
1. Total after-tax return generated by the investment portfolio, expressed as a percentage of the average value of the investment portfolio during the budget year (“Portfolio Value”). It excludes IBA’s financial investments and the interest earned thereon.
2. Total distribution to Indigenous co-investors in the year, expressed as a percentage of Indigenous co-investors’ share of Portfolio Value averaged across the year.
3. Total number of Indigenous people employed by employing investment portfolio entities, expressed as a percentage of total workforce, measured quarterly and averaged across those quarters to account for fluctuations in staffing levels intra-year.

IBA Budget Statements
Program 1.2: Indigenous Home Ownership
250

IBA Budget Statements
Program 1.2 ObjectiveProgram 1.2 aims to facilitate Indigenous Australians into home ownership by addressing barriers such as lower incomes and savings, credit impairment and limited experience with loan repayments. The Program is focused on first home buyers who have difficulty obtaining home loan finance from mainstream commercial lenders. The program also helps Indigenous people in remote Indigenous communities, where there is appropriate tenure for home ownership, overcome additional barriers, such as a lack of access to financial institutions and services, higher construction costs, the absence of established residential property markets and newly created land tenure arrangements. The program’s success is assessed in terms of increasing the percentage of Indigenous Australians who are home owners.Program 1.2 ExpensesBudgeted departmental expenses include the administrative costs for delivering the program, including activities involved in facilitated home ownership opportunities in remote and Indigenous communities, as well as legal, administrative and operating costs associated with undertaking lending and managing IBA’s loan portfolios. The increase in departmental costs in budget year is attributable to increase in lending capital due to the integration of programs (see 3.2.2) and resultant impact of the increase in fair value write down of the incremental loans written.
Table 2.1.2: Budgeted Expenses for Indigenous Home Ownership2011-12 2012-13 2013-14 2014-15 2015-16Revised Budget Forward Forward Forwardbudget year 1 year 2 year 3
Program expenses ('000) $'000 $'000 $'000 $'000 $'000
Total departmental expenses 33,871 73,869 47,106 51,841 53,879Total program expenses 33,871 73,869 47,106 51,841 53,879

IBA Budget Statements
Program 1.2 DeliverablesThe key program deliverable is the provision of home loans and related assistance to Indigenous people and the effective management of the loan portfolio.
Indigenous Home Ownership Program Deliverables Targets 2011–12 2012–13 2013–14 2014–15 2015–16Key Performance Revised Budget Forward Forward ForwardIndicators budget year 1 year 2 year 3Number of new Home Loans 400 645 600 560 560
Aggregate loans in the portfolio 3,670 4,095 4,370 4,590 4,950
Program 1.2 Key Performance IndicatorsThe key performance indicators measure the success of the program in targeting lending and assistance to customers as appropriate to their circumstances and need and the facilitation of home ownership in remote Indigenous communities.
Indigenous Home Ownership Key Performance Indicators Targets 2011–12 2012–13 2013–14 2014–15 2015–16Key Performance Revised Budget Forward Forward ForwardIndicators budget year 1 year 2 year 3
Number of loans to applicants who have an adjusted combined gross annual income of not more than 125% of IBA's Income Amount
80% of loans
85% of loans
85% of loans
85% of loans
85% of loans
Number of loans to applicants who are first home buyers
85% of loans
90% of loans
90% of loans
90% of loans
90% of loans
Number of remote indigenous communities in which IBA is actively facilitating home ownership opportunities 8 10 12 12 12
252

IBA Budget Statements
Program 1.3: Business Development and Assistance

IBA Budget Statements
Program 1.3 ObjectiveIBA works with Indigenous Australians to assist them to succeed in business. The focus is on the sustainable viability of the business, as distinct from simply getting into business.This objective is achieved primarily through the provision of affordable business loans and support services to assist customers to successfully establish business. Support services include assistance with business growth, consolidation, planning for succession or exiting their business, or to improve their management skills which improve prospects for long-term success.Program 1.3 ExpensesProgram expenses are expected to remain relatively constant for the foreseeable future.
Table 2.1.3: Budgeted Expenses for Business Development and Assistance2011-12 2012-13 2013-14 2014-15 2015-16Revised Budget Forward Forward Forwardbudget year 1 year 2 year 3
Program expenses ('000) $'000 $'000 $'000 $'000 $'000
Total departmental expenses 34,061 32,274 29,135 29,669 30,429Total program expenses 34,061 32,274 29,135 29,669 30,429
254

IBA Budget Statements
Program 1.3 DeliverablesThe target for this program is to increase the number of Indigenous Australians who succeed in business. The success of this outcome can be assessed through the deliverables in the table below.
Business Development and Assistance Deliverables Targets 2011–12 2012–13 2013–14 2014–15 2015–16Key Performance Revised Budget Forward Forward ForwardIndicators budget year 1 year 2 year 3Number of new loans approved 75 75 80 85 90
Number of businesses or prospective businesses provided with business advice or support 480 485 490 495 500
Number of participants that attended into business workshops 900 750 750 750 750
Number of Strategic Economic Development Initiatives 15 15 15 15 15Number of Business Development Initiatives 25 25 25 25 25
Number of jobs created/supported through new IBA loan funding 220 230 240 245 250Number of active loans in the portfolio 290 300 310 315 320
Program 1.3 Key Performance IndicatorsIBA has an integrated suite of products: business loans, business support and economic development initiatives (EDIs). Business loans provide clients with affordable finance. Business support assists clients to plan their proposed business and assess its viability, and to access business management training and mentoring in the critical first year of being in business. EDIs support projects that overcome barriers to Indigenous people owning and operating successful businesses; facilitate the development of business-related skills, knowledge, information and assistance; and research economic opportunities.
Business Development and Assistance Key Performance Indicators Targets 2011–12 2012–13 2013–14 2014–15 2015–16Key Performance Revised Budget Forward Forward ForwardIndicators budget year 1 year 2 year 3
Percentage of Loan Accounts that were successfully finalised through loan repayment 65% 70% 70% 75% 80%Percentage of Loan Clients still in business 12 months after commencing business 85% 85% 85% 85% 85%Percentage of Loan Clients still in business 2 years after commencing business 75% 75% 75% 75% 75%Percentage of Loan Clients still in business 3 years after commencing business 65% 65% 65% 65% 65%

IBA Budget Statements
Section 3: Explanatory tables and budgeted financial statements
Section 3 presents explanatory tables and budgeted financial statements that provide a comprehensive snapshot of agency finances for the 2012–13 budget year. It explains how budget plans are incorporated into the financial statements and provides further details of the reconciliation between appropriations and program expenses, movements in administered funds, special accounts and government Indigenous expenditure.
3.1 Explanatory tables
3.1.1 Movement of administered funds between years
IBA has no administered funds.
3.1.2 Special accounts
IBA has no special accounts.
256

IBA Budget Statements
3.1.3 Indigenous Business Australia, Australian Government Indigenous Expenditure
Table 3.1.3: Australian Government Indigenous ExpenditureOutcome Other Total Program
Bill Bill Special TotalNo. 1 No. 2 approp approp$'000 $'000 $'000 $'000 $'000 $'000
Indigenous Business AustraliaOutcome 1Departmental 2012-13 34,315 37,540 - 71,855 132,200 204,055 AllDepartmental 2011-12 38,923 33,170 - 72,093 129,199 201,292 AllTotal Outcome 2012-13 34,315 37,540 - 71,855 132,200 204,055 AllTotal Outcome 2011-12 38,923 33,170 - 72,093 129,199 201,292 All
Total AGIE 2012-13 34,315 37,540 - 71,855 132,200 204,055 AllTotal AGIE 2011-12 38,923 33,170 - 72,093 129,199 201,292 All
Appropriations

IBA Budget Statements
3.2 Budgeted financial statements
3.2.1 Differences in agency resourcing and financial statements
There are no differences between IBA’s agency resourcing and financial statements.
3.2.2 Analysis of budgeted financial statements
An analysis of the primary causes of movements in the budgeted financial statements is provided below. The 2011–12 estimated actual results are used as the comparative year in the analysis.IBA budgets are prepared on a consolidated basis for the agency and its 37 subsidiaries. On consolidation, assets, liabilities, income and expenditure of all subsidiaries flow through to individual line items in the consolidated budget.The Government agreed to consolidate the Home Ownership on Indigenous Land (HOIL) Program with the Home Ownership Program (HOP), creating an integrated home loan capital program. Accumulated HOIL capital and grants appropriations amounting to $68.3 million will be transferred into the integrated program in 2012–13. In addition, future capital receipts of $19.5 million per annum under the HOIL Program, and the excess of future revenue receipts of $4.7 million for targeted HOIL expenditure over actual expenditure will also be transferred to capital for the integrated program. It is expected that as a result an additional $85 million would be lent under the new program, and an additional 275 loans will be achieved in 2012–13.Budgeted agency income statementIBA is budgeting for an operating surplus of $26.7 million in 2011–12 and an estimated deficit of $20.2 million in 2012–13. The operating deficit for budget year 2012–13 is primarily driven by high levels of valuation losses on the loan portfolio. IBA loans have concessional interest rates and, in line with international accounting standards, the portfolio balances are effectively written-down in IBA’s book to reflect a truer market value. The impact of increasing new loan approvals for 2012–13 from $100 million to $185 million would have an effect of sharply increasing the loan valuation discount under AASB 139 from $25.5 million to $57.4 million for the year. The consequent increased write down during the year will result a net deficit of $20.2 million in 2012–13.Budgeted agency balance sheetBudgeted net assets as at 30 June 2013 of $1,060 million represents an increase of $17 million over the net assets of $1,043 million as at 30 June 2012. The main drivers are:• continuing capital injections from government of $37.5 million
258

IBA Budget Statements
• offset by the estimated operating deficit of $20.2 million.

IBA Budget Statements
Statement of cash flowsNet lending activity is expected to increase from $50 million in 2011–12 to $172 million in 2012–13 with the additional lending resulting from the integration of the HOIL Program and HOP in 2012–13. Statement of changes in equityTotal equity is expected to increase by $17 million to $1,060 million as at 30 June 2013, with the additional equity injection of $37.5 million from the Commonwealth offset by the budget year deficit of $20.2 million.
260

IBA Budget Statements
3.2.3 Budgeted financial statements tables
Table 3.2.1 comprehensive income statement (showing net cost of services)(for the period ended 30 June)
Estimated Budget Forward Forward Forwardactual estimate estimate estimate estimate
2011-12 2012-13 2013-14 2014-15 2015-16$'000 $'000 $'000 $'000 $'000
EXPENSESEmployee benefits 44,925 46,214 47,198 47,837 48,677Supplier expenses 56,554 60,547 59,954 60,510 60,903Grants 9,293 10,000 10,500 10,500 10,500Depreciation and amortisation 5,215 5,368 5,525 5,520 5,516Finance costs 1,066 922 922 922 922Write-down and impairment of assets 8,212 4,500 5,000 5,260 5,260Concessional Loan Discount 15,900 57,412 32,838 36,879 38,859Other expenses 1,015 1,015 1,015 1,015 1,015Total expenses 142,180 185,978 162,952 168,443 171,652LESS: OWN-SOURCE INCOMEOwn-source revenueSale of goods and rendering of services 59,474 60,465 60,451 60,451 60,451Interest 55,241 55,624 58,625 62,528 68,282Dividends 183 201 201 201 201Rental income 14,050 14,719 14,719 14,719 14,719Other 716 702 692 692 692Total own-source revenue 129,664 131,711 134,688 138,591 144,345GainsConcessional Loan Discount 2,527 - - - - Other 480 489 257 250 250Total gains 3,007 489 257 250 250Total own-source income 132,671 132,200 134,945 138,841 144,595
Net cost of services 9,509 53,778 28,007 29,602 27,057Revenue from Government 38,923 34,315 34,343 35,103 35,686Share of operating surplus ofassociates using the equity method 1,436 1,427 1,427 1,427 1,427
Surplus (Deficit) before income taxon continuing operations 30,850 (18,036) 7,763 6,928 10,056Income tax expense 1,393 1,028 1,028 1,028 1,028Surplus (Deficit) after income taxon continuing operations 29,457 (19,064) 6,735 5,900 9,028Surplus attributable to the non-controlling interests 2,786 1,089 1,089 1,089 1,089
Surplus (Deficit) attributable to the Australian Government 26,671 (20,153) 5,646 4,811 7,939Prepared on Australian Accounting Standards basis.

IBA Budget Statements
Table 3.2.2: Budgeted departmental balance sheet (as at 30 June)Estimated Budget Forward Forward Forward
actual estimate estimate estimate estimate2011-12 2012-13 2013-14 2014-15 2015-16
$'000 $'000 $'000 $'000 $'000ASSETSFinancial assetsCash and cash equivalents 112,092 62,905 59,374 49,090 39,291Trade and other receivables 522,071 631,969 675,736 726,487 779,247Investments accounted for under the equity method 39,354 40,354 41,354 42,354 43,354Other investments 199,504 154,504 154,504 154,504 154,504Total financial assets 873,021 889,732 930,968 972,435 1,016,396Non-financial assetsLand and buildings 47,517 47,502 48,667 48,432 48,398Property, plant and equipment 24,011 24,586 25,424 26,267 27,113Investment property 121,777 121,777 121,777 121,777 121,777Intangibles 6,669 6,794 6,419 6,044 5,769Tax assets 1,271 1,271 1,271 1,271 1,271Inventories 2,115 2,115 2,115 2,115 2,115Other non financial assets 822 822 822 822 822Total non-financial assets 204,182 204,867 206,495 206,728 207,265Total assets 1,077,203 1,094,599 1,137,463 1,179,163 1,223,661LIABILITIESPayablesSuppliers 6,374 6,374 6,374 6,374 6,374Other payables 4,893 4,893 4,893 4,893 4,893Total payables 11,267 11,267 11,267 11,267 11,267Interest bearing liabilitiesLoans 12,324 12,324 12,324 12,324 12,324Total interest bearing liabilities 12,324 12,324 12,324 12,324 12,324ProvisionsEmployee provisions 6,174 6,574 6,974 7,374 7,774Other provisions 4,120 4,120 4,120 4,120 4,120Total provisions 10,294 10,694 11,094 11,494 11,894Total liabilities 33,885 34,285 34,685 35,085 35,485Net assets 1,043,318 1,060,314 1,102,778 1,144,078 1,188,176
(continued on next page)
262

IBA Budget Statements
Table 3.2.2: Budgeted departmental balance sheet (as at 30 June) (continued)
Estimated Budget Forward Forward Forwardactual estimate estimate estimate estimate
2011-12 2012-13 2013-14 2014-15 2015-16$'000 $'000 $'000 $'000 $'000
EQUITY*Parent entity interestContributed equity 785,014 822,554 859,764 896,644 933,194Reserves 24,453 24,453 24,453 24,453 24,453Retained surplus(accumulated deficit) 207,135 186,982 192,628 197,439 205,378Total parent entity interest 1,016,602 1,033,989 1,076,845 1,118,536 1,163,025
Attributed to Non-Controlling InterestContributed equity 16,980 16,980 16,980 16,980 16,980Reserves 6,302 6,302 6,302 6,302 6,302Retained surplus (accumulated deficit) 3,434 3,043 2,651 2,260 1,869Total non-controlling interest 26,716 26,325 25,933 25,542 25,151Total Equity 1,043,318 1,060,314 1,102,778 1,144,078 1,188,176* ‘Equity’ is the residual interest in assets after deduction of liabilities.Prepared on Australian Accounting Standards basis.

IBA Budget Statements
Table 3.2.3: Departmental statement of changes in equity – summary of movement (Budget year 2012–13)
Retained Asset Contributed Totalearnings revaluation equity/ equity
reserve capital$'000 $'000 $'000 $'000
Opening balance as at 1 July 2012Balance carried forward from previous period 210,569 30,755 801,994 1,043,318Opening balance adjustment - - - - Adjusted opening balance 210,569 30,755 801,994 1,043,318
Comprehensive incomeComprehensive income recognised directly in equity - - - - Gain/loss on revaluation of property - - - - Sub-total income and expense - - - -
Surplus (deficit) for the period (19,064) - - (19,064)
Total comprehensive income recognised directly in equity
(19,064) - - (19,064)
of which:Attributable to the Australian Government (20,153) - - (20,153)Attributable to non-controlling interest* 1,089 - - 1,089
Transactions with ownersDistributions to ownersReturns on capital:Dividends (1,480) - - (1,480)Contributions by ownersEquity injection - Appropriation - - 37,540 37,540Other - - - - Restructuring - - - - Sub-total transactions with owners (1,480) - 37,540 36,060
Transfers between equity components - - - -
Estimated closing balance as at 30 June 2013 190,025 30,755 839,534 1,060,314Less: non-controlling interests 3,043 6,302 16,980 26,325
Closing balance attributable to the Australian Government 186,982 24,453 822,554 1,033,989
Prepared on Australian Accounting Standards basis.
264

IBA Budget Statements
Table 3.2.4: Budgeted departmental statement of cash flows (for the period ended 30 June)
Estimated Budget Forward Forward Forwardactual estimate estimate estimate estimate
2011-12 2012-13 2013-14 2014-15 2015-16$'000 $'000 $'000 $'000 $'000
OPERATING ACTIVITIESCash receivedAppropriations 38,923 34,315 34,343 35,103 35,686Sale of goods and rendering of services 56,002 60,465 60,451 60,451 60,451Interest 55,241 55,624 58,625 62,528 68,282Dividends 183 201 201 201 201Other 17,773 15,910 15,668 15,661 15,661Total cash received 168,122 166,515 169,288 173,944 180,281
Cash usedEmployees 44,525 45,814 46,798 47,437 48,277Suppliers 55,883 60,120 59,528 60,083 60,475Grants 9,293 10,000 10,500 10,500 10,500Net GST paid 1,393 1,028 1,028 1,028 1,028Other 2,081 1,937 1,937 1,937 1,937Total cash used 113,175 118,899 119,791 120,985 122,217Net cash from (used by)operating activities 54,947 47,616 49,497 52,959 58,064
INVESTING ACTIVITIESCash receivedInvestments - 45,000 - - - Other- repayment of loans 67,250 64,555 67,555 73,710 75,350Total cash received 67,250 109,555 67,555 73,710 75,350
Cash usedPurchase of property, plant and equipment 7,986 6,053 7,153 5,753 6,053Investments 13,825 - - - - Other - loans / advances 117,262 236,365 149,160 166,600 172,230Total cash used 139,073 242,418 156,313 172,353 178,283Net cash from (used by) investing activities (71,823) (132,863) (88,758) (98,643) (102,933)
(continued on next page)

IBA Budget Statements
Table 3.2.4: Budgeted departmental statement of cash flows (for the period ended 30 June) (continued)
Estimated Budget Forward Forward Forwardactual estimate estimate estimate estimate
2011-12 2012-13 2013-14 2014-15 2015-16$'000 $'000 $'000 $'000 $'000
FINANCING ACTIVITIESCash receivedContributed equity 33,170 37,540 37,210 36,880 36,550New borrowing 386 - - - - Total cash received 33,556 37,540 37,210 36,880 36,550
Cash usedDividends paid 2,902 1,480 1,480 1,480 1,480Total cash used 2,902 1,480 1,480 1,480 1,480Net cash from (used by) financing activities 30,654 36,060 35,730 35,400 35,070Net increase (decrease)in cash held 13,778 (49,187) (3,531) (10,284) (9,799)Cash and cash equivalents at thebeginning of the reporting period 98,314 112,092 62,905 59,374 49,090Cash and cash equivalents at the end of the reporting period 112,092 62,905 59,374 49,090 39,291Prepared on Australian Accounting Standards basis.
266

IBA Budget Statements
Table 3.2.5: Departmental capital budget statementEstimated Budget Forward Forward Forward
actual estimate estimate estimate estimate2011-12 2012-13 2013-14 2014-15 2015-16
$'000 $'000 $'000 $'000 $'000
NEW CAPITAL APPROPRIATIONSEquity injections - Bill 2 33,170 37,540 37,210 36,880 36,550 Total new capital appropriations 33,170 37,540 37,210 36,880 36,550
Provided for:Loan expenditure 33,170 37,540 37,210 36,880 36,550 Total Items 33,170 37,540 37,210 36,880 36,550 PURCHASE OF NON-FINANCIAL ASSETSFunded internally fromDepartmental resources 7,986 6,053 7,153 5,753 6,053 Total 7,986 6,053 7,153 5,753 6,053
RECONCILIATION OF CASHUSED TO ACQUIRE ASSETSTO ASSET MOVEMENT TABLETotal purchases 7,986 6,053 7,153 5,753 6,053 Total cash used to
acquire assets 7,986 6,053 7,153 5,753 6,053 Prepared on Australian Accounting Standards basis.

IBA Budget Statements
Table 3.2.6: Statement of asset movements (2012–13) Buildings Other property, Investment Computer Total
plant and property software andequipment intangibles
$'000 $'000 $'000 $'000 $'000As at 1 July 2012Gross book value 59,503 39,876 121,777 13,777 234,933Accumulated depreciation/amortisation and impairment (11,986) (15,865) - (7,108) (34,959)Opening net book balance 47,517 24,011 121,777 6,669 199,974CAPITAL ASSET ADDITIONSEstimated expenditure onnew or replacement assetsBy purchase - appropriation equity 1By purchase - appropriation ordinary
annual services 2By purchase - donated fundsBy purchase - other 2,597 2,956 - 500 6,053By finance leaseAssets received as gifts/donationsFrom acquisition of entities or operations(including restructuring)Total additions 2,597 2,956 - 500 6,053Other movementsAssets held for sale or in a disposal group held for saleDepreciation/amortisation expense (2,612) (2,381) - (375) (5,368)Disposals 3From disposal of entities or operations(including restructuring)OtherAs at 30 June 2013Gross book value 62,100 42,832 121,777 14,277 240,986Accumulated depreciation/amortisationand impairment (14,598) (18,246) - (7,483) (40,327)Closing net book balance 47,502 24,586 121,777 6,794 200,659
1 "Appropriation equity" refers to equity injections or Administered Assets and Liabilities appropriations provided through
Appropriation Bill (No.2) 2012-13, including CDABs.2 "Appropriation ordinary annual services" refers to funding provided through Appropriation Bill (No.1) 2012-13 for
depreciation / amortisation expenses, DCBs or other operational expenses.3 Net proceeds may be returned to the OPA.
Prepared on Australian Accounting Standards basis.
268

IBA Budget Statements
3.2.4 Notes to the financial statements
The budgeted financial statements have been prepared in accordance with the requirements of the Finance Minister’s Orders issued by the Minister for Finance and Deregulation. The statements have been prepared:• on an accrual accounting basis• in compliance with Australian Accounting Standards and Australian
Equivalents to International Financial Reporting Standards (AEIFRS) and other authoritative pronouncements of the Australian Accounting Standards Boards and the Consensus Views of the Urgent Issues Group.
Revenue from government
Represents appropriation from government to Indigenous Business Australia for the delivery of IBA‘s three programs in pursuit of its single outcome. Increases in the ordinary annual appropriations are a result of new measures and variations explained in Section 2. Expenses – depreciation and amortisation
Property, plant and equipment assets are written-off to their estimated residual values over their estimated useful lives using, in all cases, the straight-line method of depreciation.Depreciation/amortisation rates (useful lives) and methods are reviewed at each balance date and necessary adjustments are recognised in the current, or current and future reporting periods, as appropriate. Concessional Loan discountIBA continues to designate its loan portfolio at fair value through profit and loss per paragraph 11A of AASB 139, which provides for contracts with embedded derivatives, such as prepayment options, to be designated at fair value through profit and loss. The variation in the loan portfolio under fair value basis is written directly to the income statement. Financial assets – receivables
This includes loans and advances made by IBA to clients in the delivery of its outputs, in addition to amounts owing to IBA for delivery of goods and services, and dividends owed to IBA from subsidiaries, associates and investments. Loans receivable are carried at fair value under AASB 139.Assets – non-financialExcept for any re-valued assets, reported value of plant and equipment represents the purchase price paid less depreciation incurred.Land and building held for investment are carried at fair value.

Indigenous Land Corporation
Agency Resources and Planned Performance

Indigenous Land CorporationSection 1: Agency overview and resources..........................................................2711.1 Strategic direction statement........................................................................2711.2 Agency resource statement.........................................................................2721.3 Budget measures.........................................................................................273
Section 2: Outcomes and planned performance...................................................2742.1 Outcomes and performance information......................................................274
Section 3: Explanatory tables and budgeted financial statements......................2813.1 Explanatory tables.......................................................................................2813.2 Budgeted financial statements.....................................................................282
273

Indigenous Land Corporation
Section 1: Agency overview and resources
1.1 Strategic direction statement
The Indigenous Land Corporation (ILC) is an independent Australian Government statutory authority established to provide economic, environmental, social and cultural benefits for Aboriginal people and Torres Strait Islanders by assisting with acquisition and management of land. The ILC was established on 1 June 1995, and is governed by the Aboriginal and Torres Strait Islander Act 2005 (ATSI Act). The ATSI Act provides that the ILC has two functions: land acquisition and land management. The ILC’s functions are to be exercised “in addition to, not instead of” the functions conferred on other agencies (section 191F(3)).
The ILC has three priorities for the achievement of Indigenous benefits through acquiring and managing land:• access to and protection of cultural and environmental values• socio-economic development• access to education.The ILC’s primary source of income is an annual payment of $45 million indexed from the Aboriginal and Torres Strait Islander Land Account (Land Account) pursuant to section 193C (3) of the ATSI Act. The Land Account is administered by the Department of Families, Housing, Community Services and Indigenous Affairs (FaHCSIA). The Board is the ILC’s primary decision-making body and sets out the ILC’s strategic direction, policies and strategies in the National Indigenous Land Strategy 2007–12 (to be revised during 2012–13). The Board oversees governance of the ILC’s administration, considers land acquisition and land management proposals, and monitors performance. The ILC provides assistance with land acquisition and land management through calling for applications from Indigenous organisations and landholders, and initiating projects to respond to opportunities to deliver significant Indigenous benefits. Key strategic priorities for the ILC will continue to be the achievement of training and employment outcomes and collaboration with other government agencies, industry, peak Indigenous organisations and the non-government sector. These collaborations bring additional expertise, funding and resources to achieve a more significant impact.
275

The ILC is committed to monitoring and evaluating its Land Acquisition and Land Management Program to ensure benefits are being achieved and progress is made towards achieving its outcome. The ILC has evaluation and benefits frameworks that guide it in monitoring its performance and informing its strategic planning.
276

ILC Budget Statements
1.2 Agency resource statement
Table 1.1 shows the total resources from all sources. The table summarises how resources will be applied by outcome and by administered and departmental classification.
Table 1.1: ILC Resource Statement – Budget Estimates for 2012–13 as at Budget May 2012
Estimate Proposed Total Actualof prior + at Budget = estimate available
year amounts appropriation available in
2012-13 2012-13 2012-13 2011-12Source $'000 $'000 $'000 $'000Opening balance/Reserves at bank 30,223 - 30,223 -
REVENUE FROM GOVERNMENTOrdinary annual services¹
Outcome 1 - 9,706 9,706 9,771
Total ordinary annual services - 9,706 9,706 9,771
Special Accounts (portfolio agency)Aboriginal and Torres Strait Islander Land Account2 - 47,648 47,648 51,334Total Special Account - 47,648 47,648 51,334
Total funds from Government - 57,354 57,354 61,105FUNDS FROM OTHER SOURCES
Interest - 32,200 32,200 35,632Other - 4,106 4,106 5,082Total - 36,306 36,306 40,714
Total net resourcing for agency 30,223 93,660 123,883 101,819All figures are GST exclusiveCRF - Consolidated Revenue FundThe ILC is not directly appropriated as it is a CAC Act body. Appropriations are made to FaHCSIA which are then paid to Body ILC and are considered 'departmental' for all purposes. 1 Appropriation Bill (No.1) 2012-132 A CAC Act body may receive payment from a special account held by an FMA Act agency. The CAC Actbody does not hold the special account itself and therefore does not have a balance carried forward fromearlier years.
Third party payments from and on behalf of other agencies2012-13 2011-12
$'000 $'000Receipts received from other agencies for the provision of services 9,706 9,771
(disclosed above within Departmental section 31)
9,706 9,771All figures are GST exclusive

ILC Budget Statements
1.3 Budget measures
The ILC has no budget measures.

ILC Budget Statements
Section 2: Outcomes and planned performance
2.1 Outcomes and performance information
Government outcomes are the intended results, impacts or consequences of actions by the Government on the Australian community. Commonwealth programs are the primary vehicle by which government agencies achieve the intended results of their outcome statements. Agencies are required to identify the programs which contribute to government outcomes over the Budget and forward years.
Each outcome is described below together with its related programs, specifying the performance indicators and targets used to assess and monitor the performance of Indigenous Land Corporation in achieving government outcomes.
Outcome 1
Enhanced socio-economic development, maintenance of cultural identity and protection of the environment by Indigenous Australians through land acquisition and management.
Outcome 1 strategy
The statutory purpose of the ILC is to assist Indigenous people to acquire and manage land to achieve economic, environmental, social and cultural benefits.
The National Indigenous Land Strategy 2007–12 describes that the ILC will assist with the acquisition and management of land-based projects that achieve the following priorities.
Provide access to and protection and maintenance of land with cultural and environmental values
The ILC recognises the importance of land to Indigenous peoples’ cultural identity. Indigenous people can apply for assistance with land acquisition and management of land with cultural and environmental significance, and to protect and maintain the cultural and environmental values of land.
Deliver socio-economic outcomes for Indigenous people
The ILC assists projects that deliver social and economic outcomes for Indigenous Australians. Priority is given to projects that provide sustainable employment and training that leads to employment. The ILC believes that

ILC Budget Statements
sustainable employment creates benefits for Indigenous people, including increased standards of living, income and improved health and wellbeing.
In 2012–13 the ILC will call for applications that achieve these outcomes, including assisting Indigenous landholders to develop viable businesses and sustainably manage their land. In addition, the ILC will continue to operate employment and training projects on agricultural and tourism businesses to host Indigenous trainees and transition them to employment.
Provide Indigenous youth access to education
The ILC believes that education is crucial to overcoming Indigenous disadvantage and collaborates with responsible agencies, including DEEWR and FaHCSIA, to establish projects that assist young Indigenous people, especially in remote and regional Australia, to access education. In 2012–13, the ILC will continue to collaborate with other agencies to acquire land, and/or establish student hostels on Indigenous-held land, to assist Indigenous students to gain access to education.
Aligning with government priorities
In pursuing achievements against these priorities, the ILC seeks to build a secure and sustainable land base now and for future generations. Achievements will also contribute to the following Closing the Gap targets: halving the gap in employment outcomes between Indigenous and non-Indigenous Australians within a decade; and halving the gap for Indigenous students in Year 12 attainment or equivalent attainment rates by 2020.Indigenous-owned or -controlled land is included in the report Overcoming Indigenous Disadvantage (2011) as an indicator of economic participation and development and of the social and cultural relationship between Indigenous people and their land. In 2010, Indigenous-owned or -controlled land comprised 16 per cent of the area of Australia (excluding native title lands). Approximately 4.7 per cent of Indigenous-held land in Australia has been acquired by the ILC.The ILC will continue to make important contributions to the Indigenous Economic Development Strategy through the creation of Indigenous enterprises and the implementation of its training to employment model in its agricultural and tourism businesses.
Outcome Expense Statement
Table 2.1 provides an overview of the total expenses for Outcome 1, by program.

ILC Budget Statements
Table 2.1: Budgeted Expenses for Outcome 12011-12 2012-13
Estimated Estimatedactual expenses
expenses$'000 $'000
Program 1.1: Assistance in the acquisition and management of an Indigenous land baseRevenue from Government
Ordinary annual services (Appropriation Bill No. 1) 9,771 9,706Payment from related entities 29,800 28,200Special Accounts 51,334 47,648
Revenues from other independent sources 10,914 8,106
Total for Program 1.1 101,819 93,660
Outcome 1 Totals by resource typeRevenue from Government
Ordinary annual services (Appropriation Bill No. 1) 9,771 9,706Payment from related entities 29,800 28,200Special Accounts 51,334 47,648
Revenues from other independent sources 10,914 8,106
Total expenses for Outcome 1 101,819 93,6602011-12 2012-13
Average Staffing Level (number) 215 215
Outcome 1: Enhanced socio-economic development, maintenance of cultural identity and protection of the environment by Indigenous Australians through land acquisition and management)

ILC Budget Statements
Contributions to Outcome 1
Program 1.1: Acquisition and Management of an Indigenous Land Base
Program Objective
To assist Indigenous people to acquire and manage land to achieve economic, environmental, social and cultural benefits.Program Component ObjectivesCultural and environmental heritage protectionTo acquire and grant land to Indigenous organisations for the purposes of environmental heritage protection and maintenance of cultureTo provide land management assistance to Indigenous landholders to support them in protecting and maintaining cultural and environmental heritageSocio-economic developmentTo acquire and grant land to Indigenous organisations to enable Indigenous people to achieve training, employment and social outcomesTo operate agricultural and tourism businesses that train Indigenous people and assist them to transition to secure jobsEducationTo collaborate with other agencies to acquire land, and/or establish student hostels on Indigenous-held land, to assist secondary students to gain access to education

ILC Budget Statements
Program expenses
The ILC’s primary source of income is an annual payment of $45 million indexed from the Land Account pursuant to s193C (3) of the ATSI Act.
2011-12 2012-13 2013-14 2014-15 2015-16Revised Budget Forw ard Forw ard Forw ardbudget year 1 year 2 year 3
$'000 $'000 $'000 $'000 $'000Special Account Expenses:
Aboriginal and Torres Strait Islander Land Account 51,334 47,648 49,029 50,304 51,562Annual departmental expenses:
Departmental item CDEP Job Packages 9,771 9,706 9,683 9,658 9,658Departmental item Other 23,070 16,661 16,366 16,872 12,230
Total program expenses 84,175 74,015 75,078 76,834 73,450

ILC Budget Statements
Program 1.1 Deliverables
The ILC assists Indigenous corporations to acquire land, and Indigenous landholders to manage and use their land, to achieve benefits for Indigenous people
Indigenous Land Corporation Deliverables Targets2011-12 2012-13 2013-14 2014-15 2015-16Revised Budget Forw ard Forw ard Forw ard
Deliverables budget year 1 year 2 year 3Properties acquired for socio-economic development and cultural and environmental heritage protection
6 6 6 6 6
Properties granted 10 10 10 10 10
Employment and training projects implemented on ILC agricultural and tourism businesses
11 11 11 11 11
Properties acquired and/or secondary student hostels established
2* 1 - - -
Regional land management projects implemented
15 15 15 15 15
Property-based, property planning land management projects assisted
30 30 30 30 30
*Change due to delays in determining suitable locations for future hostels

ILC Budget Statements
Program 1.1 Key Performance IndicatorsParticipation in training and employment are the key indicators used for measuring progress in achieving socio-economic development. To recognise its relative contribution to the benefits delivered, the ILC counts those people it directly employs and hosts on its businesses separately from those jobs it has enabled through acquisition of land or land management assistance.To measure progress in achieving access to education, a KPI that specifically relates to the construction of hostels in regional Australia will be used.Indigenous organisations apply to the ILC for assistance in protecting the cultural and environmental values of land. This is measured through the proportion of ILC’s total projects, rather than a target number of properties.
Indigenous Land Corporation Key Performance Indicators 2011-12 2012-13 2013-14 2014-15 2015-16
Key Performance Revised Budget Forw ard Forw ard Forw ardIndicators budget target year 1 year 2 year 3
Total number of Indigenous staff employed directly through ILC agricultural and tourism businesses
281 341 391 441 450
Total number of Indigenous trainees hosted through ILC agricultural and tourism businesses
205* 250 260 280 300
Total number of Indigenous employment outcomes enabled through ILC land acquisition and land management projects
300 300 300 300 300
Total number of Indigenous training outcomes enabled through ILC land acquisition and land management projects
800** 800 800 800 800
Increase in the number of Indigenous youth in regional Australia accessing education through hostels established by the ILC and other agencies
30*** 180 240 240 240
Total number of Indigenous-held properties w ith improved land management 100 100 100 100 100
Proportion of ILC-assisted projects that protected cultural and environmental heritage values or maintained culture.
25% 25% 25% 25% 25%
Proportion of projects that w ere collaborative w ith and leveraged funding from other agencies
66% 66% 66% 66% 66%
* Revised as business at Mossman Gorge not fully operational until 2012-13.**Target raised in line w ith current performance and ability to achieve beyond the previous target of 600*** Revised dow n due to delays in determining suitable locations for hostels

ILC Budget Statements
Section 3: Explanatory tables and budgeted financial statements
Section 3 presents explanatory tables and budgeted financial statements which provide a comprehensive snapshot of agency finances for the 2012–13 budget year. It explains how budget plans are incorporated into the financial statements and provides further details of the reconciliation between appropriations and program expenses, movements in administered funds, special accounts and government indigenous expenditure.
3.1 Explanatory tables
3.1.1 Movement of administered funds between years
ILC has no administered funds in the 2012–13 Budget.
3.1.2 Special accounts
ILC has no special accounts in the 2012–13 Budget.
3.1.3 Australian Government Indigenous Expenditure
Table 3.1.3: Australian Government Indigenous ExpenditureOutcome Other Total Program
Bill Bill Special TotalNo. 1 No. 2 approp approp$'000 $'000 $'000 $'000 $'000 $'000
Indigenous Land CorporationOutcome 1
Administered 2012-13 - - - - - -Administered 2011-12 - - - - - -Departmental 2012-13 9,706 - - - 83,954 93,660 1.1Departmental 2011-12 9,771 - - - 92,048 101,819 1.1Total outcome 2012-13 9,706 - - - 83,954 93,660Total outcome 2011-12 9,771 - - - 92,048 101,819
Total AGIE 2012-13 9,706 - - - 83,954 93,660Total AGIE 2011-12 9,771 - - - 92,048 101,819
Appropriations
Enhanced socio-economic development, maintenance of cultural identity and protection of the environment by Indigenous Australians through land acquisition and management.

ILC Budget Statements
3.2 Budgeted financial statements
3.2.1 Differences in agency resourcing and financial statements
ILC has no differences in agency resourcing and financial statements.
3.2.2 Analysis of budgeted financial statements
The ILC’s primary source of income is an annual payment of $45 million indexed from the Land Account pursuant to section 193C (3) of the ATSI Act. Estimated payments from the Land Account from 2012–13 forward have been provided by FaHCSIA, which is responsible for the administration of the Land Account. The total resources for the ILC’s Outcome include the income from the Land Account, and represent the funds available to ILC to carry out its legislated functions.Under its legislation, ILC has the flexibility to invest funds and to roll over funds not expended in previous years.Under section 191H of the ATSI Act, ILC has the specific power to invest moneys of ILC. In addition, section 193K of the ATSI Act specifically exempts ILC from section 18(3) of the Commonwealth Authorities and Companies Act 1997 (CAC Act). This section deals with allowable investments. Earnings on these investments are represented in the Budgeted Departmental Comprehensive Income Statement.Under its legislation, ILC acquires land for the specific purpose of granting an interest in that land to an Aboriginal or Torres Strait Islander corporation. ILC capitalises the land on purchase and makes an immediate provision for the grant equivalent to the purchase price. In the Budgeted Departmental Comprehensive Income Statement, the expenses associated with the purchase and grant of the land are recognised in the period in which the land is purchased. Expenses associated with land management projects are recognised in the period in which the expenditure is incurred.ILC also holds properties for granting that have significant livestock on them. In accordance with Australian Accounting Standards, ILC values the livestock on a market-to-market basis. Accordingly, the change in market value in any given period is recognised in the Budgeted Departmental Comprehensive Income Statement.

ILC Budget Statements
3.2.3 Budgeted financial statements tables
Table 3.2.1 Comprehensive income statement (showing net cost of services)(for the period ended 30 June)
Estimated Budget Forw ard Forw ard Forw ardactual estimate estimate estimate estimate
2011-12 2012-13 2013-14 2014-15 2015-16$'000 $'000 $'000 $'000 $'000
EXPENSESEmployee benefits 12,190 13,043 13,695 14,585 15,116 Suppliers 57,128 50,502 50,913 51,779 49,359 Depreciation and amortisation 1,500 1,500 1,500 1,500 1,500 Finance costs 13,357 8,970 8,970 8,970 7,475 Total expenses 84,175 74,015 75,078 76,834 73,450 LESS: OWN-SOURCE INCOMEOwn-source revenueInterest 35,632 32,200 35,020 35,122 38,534 Other 56,416 51,754 53,135 57,304 55,317 Total own-source revenue 92,048 83,954 88,155 92,426 93,851 GainsSale of assets - - - - - Total gains - - - - - Total own-source income 92,048 83,954 88,155 92,426 93,851 Net cost of (contribution by) 7,873 9,939 13,077 15,592 20,401
servicesRevenue from Government 9,771 9,706 9,683 9,658 9,658 * * * *Surplus (Deficit) attributable to 17,644 19,645 22,760 25,250 30,059
the Australian GovernmentOTHER COMPREHENSIVE INCOMEChanges in asset revaluation surplus - - - - -
Total other comprehensive income - - - - - Total comprehensive income (loss) 17,644 19,645 22,760 25,250 30,059 Total comprehensive income (loss) 17,644 19,645 22,760 25,250 30,059
attributable to the Australian Government
Prepared on Australian Accounting Standards basis.

ILC Budget Statements
Table 3.2.2: Budgeted departmental balance sheet (as at 30 June)Estimated Budget Forw ard Forw ard Forw ard
actual estimate estimate estimate estimate2011-12 2012-13 2013-14 2014-15 2015-16
$'000 $'000 $'000 $'000 $'000ASSETSFinancial assets
Cash and cash equivalents 5,151 21,596 13,336 4,464 4,989Trade and other receivables 310,262 338,462 369,482 403,604 295,138Other investments 25,000 - - - - Other financial assets 582 582 582 582 582
Total financial assets 340,995 360,640 383,400 408,650 300,709Non-financial assets
Property, plant and equipment 86,889 86,889 86,889 86,889 86,889Intangibles 189 189 189 189 189Biological assets 35,691 35,691 35,691 35,691 35,691Inventories 145,542 145,542 145,542 145,542 145,542Tax assetsOther non-financial assets 13,121 13,121 13,121 13,121 13,121
Total non-financial assets 281,432 281,432 281,432 281,432 281,432Total assets 622,427 642,072 664,832 690,082 582,141LIABILITIESPayables
Suppliers 21,144 21,144 21,144 21,144 21,144Other payables 22,800 22,800 22,800 22,800 22,800
Total payables 43,944 43,944 43,944 43,944 43,944Interest bearing liabilities
Loans 138,000 138,000 138,000 138,000 - Total interest bearing liabilities 138,000 138,000 138,000 138,000 - Provisions
Employee provisions 3,105 3,105 3,105 3,105 3,105Other provisions 126,174 126,174 126,174 126,174 126,174
Total provisions 129,279 129,279 129,279 129,279 129,279Total liabilities 311,223 311,223 311,223 311,223 173,223Net assets 311,204 330,849 353,609 378,859 408,918
EQUITY*Parent entity interest
Reserves 3,490 3,490 3,490 3,490 3,490Retained surplus 307,714 327,359 350,119 375,369 405,428
(accumulated deficit)Total parent entity interest 311,204 330,849 353,609 378,859 408,918Total Equity 311,204 330,849 353,609 378,859 408,918* Note "Equity" is the residual interest in assets after the deduction of liabilitiesPrepared on Australian Accounting Standards basis.

ILC Budget Statements
Table 3.2.3: Departmental statement of changes in equity – summary of movement (Budget year 2012–13)
Retained Asset Other Contributed Totalearnings revaluation reserves equity/ equity
reserve capital$'000 $'000 $'000 $'000 $'000
Opening balance as at 1 July 2012Balance carried forw ard from 307,714 3,490 - - 311,204
previous periodAdjustment for changes in - - - - -
accounting policiesAdjusted opening balance 307,714 3,490 - - 311,204
Comprehensive incomeOther comprehensive income - - - - -
Surplus (deficit) for the period 19,645 - - - 19,645
Total comprehensive income 19,645 - - - 19,645of w hich:
Attributable to the Australian Government 19,645 - - - 19,645Attributable to non-controlling interest* - - - - -
Transfers betw een equitycomponents - - - - -
Estimated closing balanceas at 30 June 2013 327,359 3,490 - - 330,849Less: non-controlling interests * - - - - -
Closing balance attributable to the Australian Government 327,359 3,490 - - 330,849
Prepared on Australian Accounting Standards basis.

ILC Budget Statements
Table 3.2.4: Budgeted departmental statement of cash flows(for the period ended 30 June)
Estimated Budget Forw ard Forw ard Forw ardactual estimate estimate estimate estimate
2011-12 2012-13 2013-14 2014-15 2015-16$'000 $'000 $'000 $'000 $'000
OPERATING ACTIVITIESCash received
Appropriations 9,771 9,706 9,683 9,659 9,658Revenue from Land Account 51,334 47,648 49,029 50,304 51,562Interest 5,832 4,000 4,000 1,000 131,876Net GST received 5,060 4,640 4,681 4,477 4,560Other 7,183 4,517 4,517 7,700 4,131
Total cash received 79,180 70,510 71,909 73,140 201,787Cash used
Employees 12,190 13,043 13,695 14,585 15,116Suppliers 62,841 55,552 56,004 56,957 54,295Borrow ing costs 14,877 8,970 8,970 8,970 7,475
Total cash used 89,908 77,565 78,669 80,512 76,886Net cash from (used by)
operating activities (10,728) (7,055) (6,760) (7,372) 124,901INVESTING ACTIVITIESCash received
Investments - 25,000 - - -Other 44,824 - - - 15,124
Total cash received 44,824 25,000 - - 15,124Cash used
Purchase of property, plant 1,500 1,500 1,500 1,500 1,500and equipment
Total cash used 1,500 1,500 1,500 1,500 1,500Net cash from (used by)
investing activities 43,324 23,500 (1,500) (1,500) 13,624FINANCING ACTIVITIESCash used
Repayments of borrow ings 81,000 - - - 138,000Total cash used 81,000 - - - 138,000Net cash from (used by) (81,000) - - - (138,000)
financing activitiesNet increase (decrease)
in cash held (48,404) 16,445 (8,260) (8,872) 525Cash and cash equivalents at the 53,555 5,151 21,596 13,336 4,464
beginning of the reporting periodCash and cash equivalents at the 5,151 21,596 13,336 4,464 4,989
end of the reporting periodPrepared on Australian Accounting Standards Basis.

ILC Budget Statements
Table 3.2.5: Departmental capital budget statementEstimated Budget Forw ard Forw ard Forw ard
actual estimate estimate estimate estimate2011-12 2012-13 2013-14 2014-15 2015-16
$'000 $'000 $'000 $'000 $'000
PURCHASE OF NON-FINANCIALASSETSFunded internally from
departmental resources 1 1,500 1,500 1,500 1,500 1,500TOTAL 1,500 1,500 1,500 1,500 1,500
RECONCILIATION OF CASHUSED TO ACQUIRE ASSETSTO ASSET MOVEMENT TABLE
Total purchases 1,500 1,500 1,500 1,500 1,500less additions by finance lease - - - - -
Total cash used to 1,500 1,500 1,500 1,500 1,500acquire assets
1 Includes the follow ing sources of funding: - current and prior year Bill 1/3/5 appropriations (excluding amounts from the DCB). - donations and contributions - gifts - internally developed assets - s31 relevant agency receipts (for FMA agencies only) - proceeds from the sale of assetsPrepared on Australian Accounting Standards Basis.

ILC Budget Statements
Table 3.2.6: Statement of asset movements (2012-13)Other property, Computer Total
plant and software andequipment intangibles
$'000 $'000 $'000As at 1 J uly 2012Gross book value 105,797 653 106,450Accumulated depreciation/amortisation
and impairment (18,908) (464) (19,372)Opening net book balance 86,889 189 87,078CAPITAL ASSET ADDITIONSEstimated expenditure on
new or replacement assetsBy purchase - other 1,500 - 1,500Total additions 1,500 - 1,500Other movementsDepreciation/amortisation expense (1,500) - (1,500)Disposals - - -Total other movements (1,500) - (1,500)As at 30 J une 2013Gross book value 107,297 653 107,950Accumulated depreciation/amortisation
and impairment (20,408) (464) (20,872)Closing net book balance 86,889 189 87,078Prepared on Australian Accounting Standards basis.

ILC Budget Statements
3.2.4 Notes to the financial statements
Departmental financial statements and schedule of administered activity
ILC has no administered items.Asset valuationFrom 1 July 2005, in accordance with Australian Equivalents of International Financial Reporting Standards, government agencies and authorities are required to use fair value basis to measure property, plant and equipment.
Summary of significant accounting policies
Basis of accountingThe budgeted financial statements are a special purpose financial report.RoundingThe budgeted financial statements have been rounded to the nearest thousand dollars.Principles of consolidationThe consolidated budgeted financial statements are those of the economic entity, comprising ILC (the parent entity) and its wholly-owned subsidiaries other than Voyages Indigenous Tourism Australia Pty Ltd that has been classified as a Public Non-Financial Corporation and is not a General Government Sector body.InvestmentsInvestments are recorded at their current cash-based valuation at reporting date. Section 193K of the Aboriginal and Torres Strait Islander Act 2005 states that the investment restrictions in section 18(3) of the Commonwealth Authorities and Companies Act 1997 do not apply to ILC.Inventory held for distributionInventory held for distribution represents properties purchased for the purpose of transfer to appropriate organisations in line with the objectives of ILC and properties transferred to ILC as a result of the Aboriginal and Torres Strait Islander Commission Amendment Act 2004. Land purchases (including the related plant, equipment and livestock, acquisition and holding costs) are capitalised on purchase and classified as inventory. A provision is raised in the Budgeted Departmental Comprehensive Income Statement for the full cost of land purchases (excluding livestock) representing the sacrifice of future benefits embodied in the assets.Biological assetsLivestock held for trading purposes is classified as biological assets. Livestock is valued at market value as at reporting date.

ILC Budget Statements
Recognition of incomeReceipts from the Land Account are recognised at the time ILC becomes entitled to receive the revenue and have been classified for the purpose of this report as Revenues from Land Account.Economic dependencyILC is dependent on an annual payment from the Land Account in accordance with section 193C of the Aboriginal and Torres Strait Islander Act 2005.


Torres Strait Regional Authority
Agency Resources and Planned Performance

TORRES STRAIT REGIONAL AUTHORITY
Section 1: Agency overview and resources 2951.1 Strategic direction statement 2951.2 Agency resource statement 2971.3 Budget measures 298
Section 2: Outcomes and program performance2992.1 Outcomes and performance information 299
Section 3: Explanatory tables and budgeted financial statements 3083.1 Explanatory tables 3083.2 Budgeted financial statements 309
299

Torres Strait Regional Authority
Section 1: Agency overview and resources
The planned outcome of the Torres Strait Regional Authority (TSRA) is:• Progress towards closing the gap for Torres Strait Islander and Aboriginal
people living in the Torres Strait Region through development planning, coordination, sustainable resource management, and preservation and promotion of Indigenous culture.
1.1 Strategic direction statement
The TSRA is a Commonwealth statutory authority which was established in 1994 under the Aboriginal and Torres Strait Islander Commission Act 1989, now known as the Aboriginal and Torres Strait Islander Act 2005. It is the peak Commonwealth representative body for Torres Strait Islander and Aboriginal people living in the Torres Strait.The TSRA also performs separate functions under the Native Title Act 1993 as the Native Title Representative Body for the Torres Strait Region.The TSRA is required under section 142D of the Aboriginal and Torres Strait Islander Act 2005 to formulate and implement a plan to guide the progress of the Torres Strait region. This plan, known as the Torres Strait Development Plan, is updated every four years to be consistent with the term of the TSRA Board.In 2008–09 the TSRA finalised the Torres Strait Development Plan 2009–13, the fourth development plan since the establishment of the TSRA. The plan outlines seven new or revised TSRA program components (Economic Development; Culture, Art and Heritage; Native Title; Environmental Management; Governance and Leadership; Healthy Communities; Safe Communities), each of which has a number of desired outcomes and associated benefits.The Development Plan and its program components have been informed and driven by the Torres Strait and Northern Peninsula Area Regional Plan 2009–29 and the goals and aspirations of the residents of the Torres Strait. The new TSRA vision, which is shared by both the Regional Plan and the Development Plan, is:• ‘Empowering our people, in our decision, in our culture, for our future’• ‘Ngalpun yangu kaaba woeydhay, a ngalpun muruygaw danalagan
mabaygal kunakan palayk, bathayngaka’ (KALA LAGAU YA)• ‘Buaigiz kelar obaiswerare, merbi mir apuge mena obakedi, muige merbi
areribi tonarge, ko merbi keub kerkerem’ (MERIAM MIR)
301

• ‘Ngalpan moebaygal thoepoeriwoeyamoeyn, ngalpan ya kuduthoeraynu, ngalpan igililmaypa, sepa setha wara goeygil sey boey wagel’ (KALA KAWAU YA).
The Development Plan has also been designed to align with the COAG Building Blocks and to contribute to the Indigenous-specific outcomes of the national partnership agreements as outlined in the National Indigenous Reform Agreement.A key area of externally focused activity for the TSRA in 2012–13 will be continuing to drive the regional planning processes, including improving the integration of service delivery between governments at all levels working in the region. The TSRA will also dedicate considerable time to engaging with local stakeholders, informing them of the new Development Plan and associated changes, and supporting their adaptation to the new environment.The Torres Strait Ranger Project will continue to expand over the coming year. This dedicated ranger project will play a central role in the TSRA’s Environmental Management Program component, as it will be used to deliver a variety of land and sea management activities identified in the Land and Sea Management Strategy, the Regional Investment Strategy for the Torres Strait, and the Marine Turtle and Dugong Management Plan for each of the participating communities.The TSRA will work closely with primary health care stakeholders to enhance the efficacy and effectiveness of National Health Reforms in 2012–13. Through its Healthy Communities program, the TSRA will also monitor and provide strategic policy advice regarding health service delivery in the region and contribute to ensuring that health services and systems are equal to national standards.The Major Infrastructure Program, begun in 1998 as a bilateral commitment with the Queensland Government to deliver essential and sustainable environmental health infrastructure in the Torres Strait region, has also been extended into Stage 5. Key deliverables include water supply and reticulation; sanitation and wastewater; community roads and drainage; serviced housing lots; and asset sustainability, requiring matching funding from the Queensland Government.
302

TSRA Budget Statements
1.2 Agency resource statement
Table 1.1 shows the total resources from all sources. The table summarises how resources will be applied by outcome and by administered and departmental classification.
Table 1.1: Torres Strait Regional Authority Resource StatementBudget Estimates for 2012- 13 as at Budget May 2012
Estimate Proposed Total Actualof prior + at Budget = estimate available
year amounts appropriation available in
2012-13 2012-13 2012-13 2011-12Source $'000 $'000 $'000 $'000Opening balance/Reserves at bank 18,916 - 18,916 -
REVENUE FROM GOVERNMENTOrdinary annual services¹Outcome 1 - 45,680 45,680 50,454
Total ordinary annual services 45,680 64,596 50,454 Total funds from Government 45,680 64,596 50,454 FUNDS FROM OTHER SOURCES
Interest - 800 800 800 Other - 6,823 6,823 6,263 Total 7,623 7,623 7,063
Total net resourcing for agency 18,916 53,303 72,219 57,517
All figures are GST exclusive
1 Appropriation Bill (No.1) 2012-13
Torres Strait Regional Authority is not directly appropriated as it is a CAC Act Body. Appropriations are made to FMA Agency FaHCSIA which are then paid to Torres Strait Regional Authority and are considered "Departmental" for all purposes.
303

TSRA Budget Statements
1.3 Budget measures
Table 1.2 TSRA 2012–13 Budget measuresProgram 2011–12 2012–13 2013–14 2014–15 2015–16
$'000 $'000 $'000 $'000 $'000Expense measuresOutcome 1Torres Strait Major Infrastructure Program Stage 5 1.1
Administered expenses - - - - - Departmental expenses - 2,800 7,600 7,400 3,400
Total - 2,800 7,600 7,400 3,400
Community Development Employment Projects (CDEP) program – continuation of grandfathered w age arrangements1 1.1
Administered expenses - - - - - Departmental expenses - 5,429 4,939 4,764 4,742
Total - 5,429 4,939 4,764 4,742 Total expense measures
Administered - - - - - Departmental - 8,229 12,539 12,164 8,142
Total - 8,229 12,539 12,164 8,142 Prepared on a Government Financial Statistics (f iscal) basis
1 This measure is led by the Department of Families, Housing, Community Services and Indigenous Affairs.
304

TSRA Budget Statements
Section 2: Outcomes and program performance
2.1 Outcomes and performance information
Government outcomes are the intended results, impacts or consequences of actions by the government on the Australian community. Commonwealth programs are the primary vehicle by which government agencies achieve the intended results of their outcome statements. Agencies are required to identify the programs that contribute to government outcomes over the Budget and forward years.
Each outcome is described below together with its related programs, specifying the performance indicators and targets used to assess and monitor the performance of the Torres Strait Regional Authority in achieving government outcomes.
Outcome 1Progress towards closing the gap for Torres Strait Islander and Aboriginal people living in the Torres Strait Region through development planning, coordination, sustainable resource management, and preservation and promotion of Indigenous culture.
Outcome 1 Strategy
The TSRA is focused on the delivery of outcomes and realisation of measurable benefits. The program components contribute to the achievement of the goals of the Torres Strait and Northern Peninsula Area Regional Plan 2009–29 and to closing the gap in Indigenous disadvantage.The Development Plan is an action plan with a focus on delivering outcomes and benefits for the Indigenous people of the Torres Strait region. This and subsequent development plans will contribute to achieving the outcome statement for the TSRA.The Development Plan contains both short and long term objectives, some of which will not be achieved fully within the four-year life of the Plan. The phasing of objectives reflects the Australian Government’s long-term goals of generational change and impact.The Program 1 Objective is delivered through seven component programs which are derived from the Torres Strait Development Plan 2009–2013. These are:• Economic Development• Culture, Art and Heritage• Native Title• Environmental Management
305

TSRA Budget Statements
• Governance and Leadership• Healthy Communities• Safe Communities.
Outcome 1 expense statement
Table 2.1 provides an overview of the total expenses for Outcome 1, by program.
Table 2.1 Budgeted Expenses for Outcome 1 Outcome 1: Progress towards closing the gap for Torres 2011-12 2012-13Strait Islander and Aboriginal people living in the Torres Estimated EstimatedStrait Region through development planning, actual expensescoordination, sustainable resource management, and expensespreservation and promotion of Indigenous culture. $'000 $'000
Program 1.1: Torres Strait Regional DevelopmentRevenue from Government
Ordinary annual services (Appropriation Bill No. 1) 50,454 45,680 Revenues from other independent sources 7,063 7,623
Total for Program 1.1 57,517 53,303
Outcome 1 Totals by resource typeRevenue from Government
Ordinary annual services (Appropriation Bill No. 1) 50,454 45,680 Revenues from other independent sources 7,063 7,623
Total expenses for Outcome 1 57,517 53,303 2011-12 2012-13
Average Staffing Level (number) 107 129 .
306

TSRA Budget Statements
Contributions to Outcome 1
Program 1.1: Torres Strait Regional Development
Program 1.1 ObjectiveIn November 2008, the Torres Strait Regional Authority Board endorsed the following Outcome statement: ‘Progress towards closing the gap for Torres Strait Islander and Aboriginal people living in the Torres Strait Region through development planning, coordination, sustainable resource management, and preservation and promotion of Indigenous culture.’
Program 1.1 ExpensesThe variation in expenses in 2012 reflects the change in policy initiatives associated with the Remote Jobs and Communities Program and the effect of indexation.Funding provided to TSRA, via funding agreements from independent sources, that remain unspent at the end of the 2011-2012 financial year, will be expensed during the 2012-2013 financial year.
Table 2.2 Budgeted expenses for Torres Strait Regional Development2011-12 2012-13 2013-14 2014-15 2015-16Revised Budget Forw ard Forw ard Forw ardbudget year 1 year 2 year 3
$'000 $'000 $'000 $'000 $'000Program support 57,358 53,303 56,453 56,575 54,448 Total program expenses 57,358 53,303 56,453 56,575 54,448
307

TSRA Budget Statements
Program 1.1 component objectivesEconomic Development program component objectiveThe TSRA will take the lead as a ‘Whole of Region Economic Development Solution Broker’. In this role, the TSRA will work in partnership with other government and non-government organisations and individual communities to advance this regional goal and ensure the efficient use of resources. It will aim to: stimulate economic development across the region advance business skills and align training initiatives with regional
employment opportunities advance Indigenous ownership and management of industries and
enterprises.Culture, Art and Heritage program component objectiveThe TSRA will form a Culture, Art and Heritage Program to support the regional outcomes. The aims of the program are to: protect culturally significant sites and artefacts to ensure their longevity revitalise traditional cultural practices (art, dance, language, and
storytelling) among communities.Native Title program component objectiveTo provide high-quality and culturally appropriate professional services to native title holders and claimants in the Torres Strait Region, to facilitate the securing of legal recognition of native title to land and waters in the Torres Strait and thereby improve opportunities for improved economic, cultural and social participation for Torres Strait Islander and Aboriginal people living in the region.This program component will: protect and manage native title rights build the capacity of native title Prescribed Bodies Corporate.Environmental Management program component objectiveThe TSRA will play a mix of leading and supporting roles in a number of environmental management initiatives within the Torres Strait. The primary aims of the program are to: achieve sustainable management of natural resources contribute to the reduction of the ecological and carbon footprint of
Torres Strait and Northern Peninsula area residents.
308

TSRA Budget Statements
Program 1.1 component objectives (continued)
Governance and Leadership program component objectiveTo help maintain and improve the leadership and governance skills of current and future leaders of the Torres Strait to support development planning and coordination of integrated government service delivery in the Torres Strait Region.This program component will: involve Indigenous leaders in legislative processes, policies and priorities
in terms of setting direction for integrated planning and service delivery involve Indigenous leaders in monitoring progress towards reaching
regional goals and outcomes develop the capacity of current and future leaders across the region and
support effective communication between the community and organisations involved in the region.
Healthy Communities program component objectiveThe TSRA’s Healthy Communities Program aims to: monitor and provide strategic policy advice regarding health service
delivery in the region and contribute to ensuring that health service levels are equal to the national standard
improve the health of Indigenous people living in the region through proactive healthy living initiatives
increase Indigenous home ownership.Safe Communities program component objectiveThe TSRA will contribute to the safety of communities by: contributing to the development of standards for the provision of all
mainstream social services and facilities, including emergency response services, through engagement with responsible agencies
undertaking a policy advocacy, monitoring and supporting role with respect to mainstream services, advocating and acting as a solution broker on behalf of communities and the region, using integrated service delivery forums
providing direct funding and resource support for some social support services, and infrastructure, facilities and equipment, that contribute to improved safety and accessibility for communities and families (the TSRA will not provide mainstream social or community services).
309

TSRA Budget Statements
Program 1.1 DeliverablesOver the past year, the TSRA has undertaken a coordination role in bringing together key government agencies to work in partnership towards integrated planning and improved service delivery. The results of those consultations have been refined by elected representatives of TSRA and local government councils into a regional vision and goals statement, the Torres Strait and Northern Peninsular Area Regional Plan 2009–2029. The Regional Plan provides regional goals to guide the strategic policy of all government service providers.The TSRA is addressing these goals through an integrated portfolio of seven programs as set out in our current 2009–2013 Development Plan.The program outcomes are all congruent with TSRA’s outcome statement. Performance indicators have been identified to show whether progress is being made in achieving outcomes and benefits. The benefits are measurable and meaningful improvements that result from outcomes. Deliverables for each program component as at the publication date of these PB Statements are:Economic Development program component Increased number of Torres Strait Islander and Aboriginal individuals in
employment Increased number of approved TSRA loans Increase in the annual total catch of marine resources (finfish and Kaiar
(tropical rock lobster)) by Torres Strait Islander and Aboriginal people Increase in the participation of Torres Strait Islander and Aboriginal
people in industry trainingCulture, Art and Heritage program component Increased number of professionally active Torres Strait Islander and
Aboriginal artists and active art centres in the region Increased capacity and capability to facilitate cultural initiatives and
projects Increased profile of Torres Strait Islander and Aboriginal arts and culture Increased community involvement in the preservation of cultural heritage
310

TSRA Budget Statements
Program 1.1 Deliverables (continued)Native Title program component Provide legal, policy and advocacy support for Prescribed Bodies
Corporate Support native title activities, including determination of claims and
provision of legal advice and support Negotiate and execute Indigenous Land Use Agreements and other
statutory agreements and provide legal advice and support in relation to future Acts
Environmental Management program component Support to Indigenous participation and ownership of the marine
resources of the Torres Strait Implement horticulture, biodiversity and pest species management
activities Implement the Indigenous Land and Sea Ranger Program Support to sustainable community-based turtle and dugong management
and research Coordinate the implementation of the Torres Strait Climate Change
Strategy Coordinate and support research and information sharing Governance and Leadership program component Integrated Service Delivery - Implementation Governance and Leadership Capacity Building Support to Indigenous Broadcasting Enhanced Support for Women in Leadership Support to Prescribed Bodies Corporate Support to the 2012 TSRA Board Election Support TSRA Governance Committees Healthy Communities program component Contribute funding to community, market garden and horticulture
initiatives Engage with food suppliers/retailers to explore improved healthy food
options Monitor and provide strategic policy advice to support health sector
reforms Provide funding contributions to health promotion and education
initiatives Funding contributions towards sport and recreation minor infrastructure
311

TSRA Budget Statements
Funding contributions to essential services and infrastructure to support healthy living environments
312

TSRA Budget Statements
Program 1.1 Deliverables (continued)Safe Communities program component Continue to provide funding for proactive and reactive social service
providers in the region Assist in the development of standards for provision of services and
facilities for safe and healthy communities Assist social and emergency service providers with funding for capacity
building and training initiatives Funding contributions to services and facilities that improve community
accessibility and safety Monitoring and advocating for effective land and sea communications
systems
313

TSRA Budget Statements
Program 1.1 key performance indicators Number of CDEP participants who have moved into employment Number of CDEP participants who have received accredited training Measured change in Business Funding and Housing Loan outcomes Measured change in Industry Training outcomes Number of Indigenous artists and cultural practitioners supported Measured change in the number of professionally active Aboriginal Torres
Strait Islander artists and active art centres in the region. Number of native title determinations, native title compliant land and sea
outcomes, and number of future act notifications facilitated in the Torres Strait
Number of Indigenous Land Use Agreements finalised Number of communities participating in natural resource management
activities Number of ranger groups in place to assist communities to carry out
land, sea and cultural resource management activities Number of sustainable land use plans developed Level of legislative compliance and measured change in capacity of
Prescribed Bodies Corporate in the region Measured change in regional communications capacity Measured change in outcomes from social support services active in the
Torres Strait
314

TSRA Budget Statements
Section 3: Explanatory tables and budgeted financial statements
Section 3 presents explanatory tables and budgeted financial statements that provide a comprehensive snapshot of agency finances for the 2012–13 budget year. It explains how budget plans are incorporated into the financial statements and provides further details of the reconciliation between appropriations and program expenses, movements in administered funds, special accounts and government Indigenous expenditure.
3.1 Explanatory tables
3.1.1 Movement of administered funds between years
The TSRA does not have any administered funds.
3.1.2 Special accounts
The TSRA does not have any special accounts.
3.1.3 Australian Government Indigenous expenditure
Table 3.1.3: Australian Government Indigenous Expenditure (AGIE)
Outcome Other Total ProgramBill Total
No. 1 approp$'000 $'000 $'000 $'000
Torres Strait Regional AuthorityOutcome 1Departmental 2012-13 45,680 45,680 7,623 53,303 1.1Departmental 2011-12 50,454 50,454 7,063 57,517 1.1Total outcome 2012-13 45,680 45,680 7,623 53,303 Total outcome 2011-12 50,454 50,454 7,063 57,517
Total departmental 2012-13 45,680 45,680 7,623 53,303 Total departmental 2011-12 50,454 50,454 7,063 57,517
Total AGIE 2012-13 45,680 45,680 7,623 53,303 Total AGIE 2011-12 50,454 50,454 7,063 57,517
Appropriations
315

TSRA Budget Statements
3.2 Budgeted financial statements
3.2.1 Differences in agency resourcing and financial statements
There are no differences between TSRA’s Portfolio Budget Statements and the Commonwealth’s Budget Management System.
3.2.2 Analysis of budgeted financial statements
Budgeted comprehensive income statement
This statement provides a picture of the expected financial results for the TSRA by identifying full accrual expenses and revenues, which highlights whether the TSRA is operating at a sustainable level. TSRA is forecasting income of $53.3 million and expenditure of $53.3 million resulting in a breakeven result for the 2012–13 fiscal year.Budgeted departmental balance sheet
This statement shows the financial position of the TSRA. It helps decision-makers to track the management of assets, liabilities and equity. TSRA’s forecast balance sheet for the fiscal year ending June 2013 shows TSRA with total assets of $61.32 million and liabilities of $9.2 million, resulting in a net asset position of $52.12 million.Budgeted departmental statement of cash flows
The budgeted cash flows, as reflected in the statement of cash flows, provide important information on the extent and nature of cash flows by categorising them into expected cash flows from operating activities, investing activities and financing activities.Predicted departmental cash flows have been adjusted to reflect the anticipated impact on cash after taking into account the forecast movements in the balance sheet and comprehensive income statement. The agency is forecasting a favourable cash position of $15.92 million for the fiscal year ending June 2013. The favourable cash position is due to the timing across fiscal years between receipt of income and program expenditure commitments.
316

TSRA Budget Statements
3.2.3 Budgeted financial statements tables
Table 3.2.1 Comprehensive Income Statement (Showing Net Cost of Services)for the period ended 30 June
Estimated Budget Forw ard Forw ard Forw ardactual estimate estimate estimate estimate
2011-12 2012-13 2013-14 2014-15 2015-16$'000 $'000 $'000 $'000 $'000
EXPENSESEmployee benefits 10,043 10,500 7,170 7,249 8,805 Suppliers 6,371 7,616 8,526 8,622 8,680 Grants 40,094 34,287 39,857 39,804 36,072 Depreciation and amortisation 850 900 900 900 891 Total expenses 57,358 53,303 56,453 56,575 54,448
LESS: OWN-SOURCE INCOMEOw n-source revenueInterest 800 800 800 800 800 Other 6,263 6,823 5,585 5,585 7,085 Total own-source revenue 7,063 7,623 6,385 6,385 7,885
Total own-source income 7,063 7,623 6,385 6,385 7,885
Net cost of (contribution by)services 50,295 45,680 50,068 50,190 46,563
Revenue from Government 50,454 45,680 50,068 50,190 46,563
Surplus (Deficit) attributable to the Australian Government 159 - - - -
Total comprehensive income (loss) attributable to the Australian Government 159 - - - -
Prepared on Australian Accounting Standards basis.
317

TSRA Budget Statements
Table 3.2.2: Budgeted departmental balance sheet (as at 30 June)
Estimated Budget Forw ard Forw ard Forw ardactual estimate estimate estimate estimate
2011-12 2012-13 2013-14 2014-15 2015-16$'000 $'000 $'000 $'000 $'000
ASSETSFinancial assets
Cash and cash equivalents 18,916 15,916 14,416 12,916 11,407 Trade and other receivables 11,117 11,117 11,117 11,117 11,117
Total financial assets 30,033 27,033 25,533 24,033 22,524 Non-financial assets
Land and buildings 29,525 32,450 33,900 35,200 36,507 Property, plant and equipment 1,724 1,799 1,849 2,049 2,251 Other non-f inancial assets 41 41 41 41 41
Total non-financial assets 31,290 34,290 35,790 37,290 38,799 Total assets 61,323 61,323 61,323 61,323 61,323 LIABILITIESPayables
Suppliers 1,449 1,449 1,449 1,449 1,449 Grants 236 236 236 236 236 Other payables 4,891 4,891 4,891 4,891 4,891
Total payables 6,576 6,576 6,576 6,576 6,576 Provisions
Employee provisions 2,628 2,628 2,628 2,628 2,628 Total provisions 2,628 2,628 2,628 2,628 2,628 Total liabilities 9,204 9,204 9,204 9,204 9,204 Net assets 52,119 52,119 52,119 52,119 52,119 EQUITY*Parent entity interest
Contributed equity 32 32 32 32 32 Reserves 12,534 12,534 12,534 12,534 12,534 Retained surplus 39,553 39,553 39,553 39,553 39,553
Total parent entity interest 52,119 52,119 52,119 52,119 52,119 Total Equity 52,119 52,119 52,119 52,119 52,119
‘Equity’ is the residual interest in assets after deducting liabilitiesPrepared on Australian Accounting Standards basis.
318

TSRA Budget Statements
Retained Asset Other Contributed Totalearnings revaluation reserves equity/ equity
reserve capital$'000 $'000 $'000 $'000 $'000
Opening balance as at 1 July 2012Balance carried forw ard from
previous period 39,553 12,534 - 32 52,119 Adjusted opening balance 39,553 12,534 - 32 52,119 Comprehensive income
Surplus (deficit) for the period - - - - -
Total comprehensive income - - - - - Estimated closing balance
as at 30 June 2013 39,553 12,534 - 32 52,119 Closing balance attributable to the
Australian Government 39,553 12,534 - 32 52,119
Table 3.2.3: Departmental statement of changes in equity — summary of movement (Budget year 2012-13)
Prepared on Australian Accounting Standards basis.
319

TSRA Budget Statements
Table 3.2.4: Budgeted departmental statement of cash flows (for the period ended 30 June)
Estimated Budget Forw ard Forw ard Forw ardactual estimate estimate estimate estimate
2011-12 2012-13 2013-14 2014-15 2015-16$'000 $'000 $'000 $'000 $'000
OPERATING ACTIVITIESCash received
Appropriations 50,454 45,680 50,068 50,190 46,563 Interest 800 800 800 800 800 Other 6,263 6,823 5,585 5,585 7,085
Total cash received 57,517 53,303 56,453 56,575 54,448 Cash used
Employees 10,043 10,500 7,170 7,249 8,805 Suppliers 6,371 7,616 8,526 8,622 8,680 Other 40,094 34,287 39,857 39,804 36,072
Total cash used 56,508 52,403 55,553 55,675 53,557 Net cash from (used by)
operating activities 1,009 900 900 900 891 INVESTING ACTIVITIESCash used
Purchase of property, plant and equipment 3,150 3,900 2,400 2,400 2,400
Total cash used 3,150 3,900 2,400 2,400 2,400 Net cash from (used by)
investing activities (3,150) (3,900) (2,400) (2,400) (2,400) Net increase (decrease)
in cash held (2,141) (3,000) (1,500) (1,500) (1,509) Cash and cash equivalents at the
beginning of the reporting period 21,057 18,916 15,916 14,416 12,916 Cash and cash equivalents at the
end of the reporting period 18,916 15,916 14,416 12,916 11,407
Prepared on Australian Accounting Standards basis.
320

TSRA Budget Statements
Table 3.2.5 Departmental Capital Budget Statement
Estimated Budget Forw ard Forw ard Forw ardactual estimate estimate estimate estimate
2011-12 2012-13 2013-14 2014-15 2015-16$'000 $'000 $'000 $'000 $'000
PURCHASE OF NON-FINANCIALASSETSFunded internally from
departmental resources 1 3,150 3,900 2,400 2,400 2,400 TOTAL 3,150 3,900 2,400 2,400 2,400
RECONCILIATION OF CASHUSED TO ACQUIRE ASSETSTO ASSET MOVEMENT TABLE
Total purchases 3,150 3,900 2,400 2,400 2,400 Total cash used to
acquire assets 3,150 3,900 2,400 2,400 2,400
1 Includes the follow ing sources of funding:
- current and prior year Bill 1/3/5 appropriations (excluding amounts from the DCB).
Prepared on Australian Accounting Standards basis.
321

TSRA Budget Statements
Table 3.2.6: Statement of Asset Movements (2012-13)
Asset Category Land Buildings Other property, Heritage Total
plant and and culturalequipment
$'000 $'000 $'000 $'000 $'000As at 1 J uly 2012Gross book value 9,185 20,964 2,844 41 33,034 Accumulated depreciation/amortisation
and impairment - (624) (1,120) - (1,744) Opening net book balance 9,185 20,340 1,724 41 31,290 CAPITAL ASSET ADDITIONSEstimated expenditure on
new or replacement assetsBy purchase - appropriation ordinary
annual services 1 - 3,575 325 - 3,900 Total additions - 3,575 325 - 3,900 Other movementsDepreciation/amortisation expense - (650) (250) - (900) Total other movements - (650) (250) - (900) As at 30 J une 2013Gross book value 9,185 24,539 3,169 41 36,934 Accumulated depreciation/amortisation
and impairment - (1,274) (1,370) - (2,644) Closing net book balance 9,185 23,265 1,799 41 34,290
Estimated operating expenditure in income statement for heritage and cultural assets
Operations and Maintenance 3 Preservation and Conservation 2 Total operating expenditure on heritage and cultural assets 5
1 "Appropriation ordinary annual services" refers to funding provided through Appropriation Bill (No.1) 2012-13 for depreciation / amortisation expenses, DCBs or other operational expenses.
Prepared on Australian Accounting Standards basis.
322

TSRA Budget Statements
3.2.4 Notes to the financial statements
Basis of accounting
The budgeted financial statements have been prepared in accordance with the requirements of the Finance Minister’s Orders issued by the Minister for Finance and Deregulation. Amounts in these statements are rounded to the nearest thousand dollars.Departmental financial statements and schedule to administered activity
Under the Australian Government’s financial budget and reporting framework, transactions that agencies control (departmental transactions) are separately budgeted for and reported on from transactions agencies do not have control over (administered transactions). This ensures that agencies are only held fully accountable for the transactions over which they have control.Departmental items are those assets, liabilities, revenues and expenses in relation to an agency or authority that are controlled by the agency. Departmental expenses include employee and supplier expenses and other administrative costs, which are incurred by the agency in providing its goods and services.TSRA has no administered items.Revenue from government – ordinary annual appropriations
Revenue from government represents amounts appropriated to fund the TSRA’s seven program components, actioned in order to deliver the agency’s stated outcome.Expenses – depreciation
Property, plant and equipment assets are written-off to their estimated residual values over their estimated useful lives, using in all cases the straight-line method of depreciation.Asset valuation
All assets are initially recorded at cost. Property, plant and equipment and other infrastructure assets are periodically revalued at their fair value.Financial assets – cash
This includes notes and coins held and deposits at call.Financial assets – receivables
This includes loans and advances made by the TSRA to clients in the delivery of its programs, in addition to amounts owing to the TSRA for delivery of goods and services. Loans receivable are measured at amortised cost using the effective interest method less impairment.
323

Glossaryaccrual accounting System of accounting in which items are
brought to account and included in the financial statements as they are earned or incurred, rather than as they are received or paid.
accumulated depreciation
The aggregate depreciation recorded for a particular depreciating asset.
Additional Estimates Where amounts appropriated at Budget time are insufficient, Parliament may appropriate more funds to portfolios through the Additional Estimates Acts.
administered funds Usually, the funds or expenses an agency manages on behalf of the Government.
administered items Appropriation that consists of funding managed on behalf of the Commonwealth. This funding is not at the discretion of the agency, and any unspent appropriation is returned to the Consolidated Revenue Fund (CRF) at the end of the financial year. An administered item is a component of an administered program. It may be a measure but will not constitute a program in its own right.
annual appropriation Two appropriation Bills are introduced into Parliament in May and comprise the Budget. Further Bills are introduced later in the financial year as part of the additional estimates. Parliamentary departments have their own appropriations.
appropriation An amount of public money parliament authorises for spending (i.e. funds to be withdrawn from the CRF). Parliament makes laws for appropriating money under the Annual Appropriation Acts and under special appropriations, with spending restricted to the purposes specified in the Appropriation Acts.
Appropriation Bill (No. 1)
This Bill proposes spending from the CRF for the ordinary annual services of Government. Once the Bill is passed by Parliament and given Royal Assent, it becomes the Appropriation Act (No. 1).
325

Appropriation Bill (No. 2)
This Bill proposes spending from the CRF for purposes other than the ordinary annual services of Government. Under existing arrangements between the two Houses of Parliament (the ‘Compact’), this Bill includes appropriation funding of administered expenses for new outcomes, for payments to the states and territories, and for departmental or administered capital. Funding for extensions to existing programs can be included in Appropriation Bill (No. 1). Once the Bill is passed by Parliament and given Royal Assent, it becomes the Appropriation Act (No. 2).
Appropriation Bills (Nos 3 and 4)
If an amount provided in Appropriation Acts (No. 1 or 2) is not enough to meet approved expenditure to be paid in a financial year, supplementary appropriation may be sought in Appropriation Bills (No. 3 or 4). Once these Bills are passed by Parliament and given Royal Assent, they become the Appropriation Acts (Nos 3 and 4). However, they are also commonly referred to as the Additional Estimates Bills.
assets Future economic benefits controlled by an entity as a result of past transactions or other past events.
average staffing level The average number of employees receiving salary/wages (or compensation in lieu of salary/wages) over a financial year, with adjustments for casual and part-time employees to show the full-time equivalent.
capital expenditure Expenditure by an agency on capital projects, for example purchasing a building.
Commonwealth Authorities and Companies Act 1997(CAC Act)
Sets out the financial management, accountability and audit obligations on Commonwealth statutory authorities and companies in which the Commonwealth has at least a direct controlling interest.
Consolidated Revenue Fund (CRF)
The principal operating fund from which money is drawn to pay for the activities of the Government. Section 81 of the Australian Constitution provides that all revenue raised or monies received by the Executive Government forms one consolidated revenue fund from which appropriations are made for the purposes of the Australian Government.
326

Glossary
cross-portfolio Budget measure
A Budget measure that affects programs administered in a number of portfolios.
departmental items Resources (assets, liabilities, revenues and expenses) that agency Chief Executive Officers control directly. This includes outsourced activities funded and controlled by the agency. Examples of departmental items include agency running costs, accrued employee entitlements and net appropriations. A departmental item is a component of a departmental program.
depreciation Apportionment of an asset’s capital value as an expense over its estimated useful life to take account of normal usage, obsolescence or the passage of time.
employment income Income that is earned, derived or received from remunerative work undertaken by an employee in an employer–employee relationship or through self-employment.
equity or net assets Residual interest in the assets of an entity after deduction of its liabilities.
estimates An agency’s expected revenues, expenses, assets, liabilities and cash flows. They are prepared for each output in the Budget, in consultation with the Department of Finance and Deregulation. (See also Forward Estimates and Additional Estimates).
expenses Total value of all of the resources consumed in producing goods and services or the loss of future economic benefits in the form of reductions in assets or increases in liabilities of an entity.
fair value The amount for which an asset could be exchanged or a liability settled between knowledgeable and willing parties in an arm’s length transaction.
Financial Management and Accountability Act 1997(FMA Act)
The principal legislation governing the proper use and management of public money and public property, and other Commonwealth resources. FMA Regulations and FMA Orders are made pursuant to the Act.
Forward Estimates The financial statement estimate for the three out years after the budget year.
327

Glossary
grants Non-reciprocal transfers of economic resources, in which the payer agency does not receive approximately equal value in return.
key performanceindicators
Qualitative and quantitative measures of an output that provide a guide on performance where direct causal links are not obvious and changes in performance are difficult to measure directly.
measure A new policy or savings decision of the Government with financial impacts on the Government’s underlying cash balance, fiscal balance, operating balance, headline cash balance, net debt or net worth.
Mid Year Economic and Fiscal Outlook
Provides an update of the Government’s budget estimates by examining expenses and revenues year to date, as well as provisions for new decisions that have been taken since the Budget. The report provides updated information to allow the assessment of the Government’s fiscal performance against the fiscal strategy set out in its current fiscal strategy statement.
operating result Equals revenue less expenses.outcome The intended result, consequence or impact of
government actions on the Australian community.
outcome statement Articulates the intended results, activities and target group of an Australian Government agency. An outcome statement serves three main purposes within the financial framework:• to explain and control the purposes for
which annual appropriations are approved by the Parliament for use by agencies
• to provide a basis for annual budgeting, including (financial) reporting against the use of appropriated funds
• to measure and assess agency and program (non-financial) performance in contributing to government policy objectives.
outputs The goods and services produced by agencies on behalf of Government for external organisations or individuals. Outputs also include goods and services for other areas of government external to the agency.
328

Glossary
payment accuracy The FaHCSIA measure of the proportion of current year outlays paid accurately, for use in the financial statements and annual report. The base figure is calculated as the gross value of the fortnightly variation amounts (the amount payments are either increased or reduced by) divided by total fortnightly amounts paid to sampled customers subtracted from 100% to give payment accuracy. This figure is a point in time estimate, so it does not count mispayment for prior periods where the customer is paid accurately at the time of review, but includes all variations regardless of fault. The estimate is weighted by the size of the mispayment; for example, a $0.05 upward variation will not affect the total as much as a $450.00 cancellation.
performance information
Evidence about performance that is collected and used systematically. Evidence may relate to appropriateness, effectiveness and efficiency. It may be about outcomes, factors that affect outcomes, and what can be done to improve them.
portfolio A Minister’s area of responsibility as a member of Cabinet. A portfolio consists of one or more Departments of State (Portfolio Departments) and agencies with similar general objectives and outcomes.
price The amount the government or community pays for the delivery of agreed outputs.
primary carer Defined by the Australian Bureau of Statistics (ABS cat no. 4430.0, p. 77) as a person who provides the most informal assistance, in terms of help or supervision, to a person with one or more disabilities. The assistance has to be ongoing, or likely to be ongoing, for at least six months and be provided for one or more of the core activities (communication, mobility and self-care).
program An activity that delivers benefits, services or transfer payments to individuals, industry and/or the community as a whole, with the aim of achieving the intended result specified in an outcome statement.
329

Glossary
receipts The total or gross amount received by the Commonwealth. Each receipt item is either revenue, an offset within outlays, or financing transactions. Receipts include taxes, interest, charges for goods and services, borrowings and Government Business Enterprise dividends received.
revenue Total value of resources earned or received to cover the production of goods and services, or increases in future economic benefits in the form of increases in assets or reductions in liabilities of an entity.
Senate Legislation Committee
A body of Senators that examines the use of government funding. Its purpose is to question government officials about the estimates and activities of their respective agencies.
special accounts Balances existing within the CRF that are supported by standing appropriations (FMA Act ss. 20 and 21). Special accounts allow money in the CRF to be acknowledged as set aside (hypothecated) for a particular purpose. Amounts credited to a special account may only be spent for the purposes of the special account. Special accounts can only be established by a written determination of the Finance Minister (FMA Act, s. 20) or through an Act of Parliament (referred to in s. 21 of the FMA Act).
special appropriation (including standing appropriations)
An amount of money appropriated by a particular Act of Parliament for a specific purpose and number of years. For special appropriations, the authority to withdraw funds from the CRF does not generally cease at the end of the financial year.Standing appropriations are a subcategory consisting of ongoing special appropriations; the amount appropriated will depend on circumstances specified in the legislation.
330

ABBREVIATIONS
AASB Australian Accounting Standards BoardABA Aboriginals Benefit AccountAEIFRS Australian Equivalent of International Financial
Reporting StandardsAGD Attorney-General’s DepartmentAGIE Australian Government Indigenous expenditureAHL Aboriginal Hostels LimitedAIFS Australian Institute of Family StudiesALRA Act Aboriginal Land Rights (Northern Territory) Act 1976AMP Alcohol Management PlanASD Autism Spectrum DisorderATSI Act Aboriginal and Torres Strait Islander Act 2005BBRG Building Better Regional CitiesCAC Act Commonwealth Authorities and Companies Act 1997CEO Chief Executive OfficerCDEP Community Development Employment ProjectsCOAG Council of Australian GovernmentsDAPP Dad and Partner PayDEEWR Department of Education, Employment and
Workplace RelationsDHA Department of Health and AgeingDHS Department of Human ServicesDSP Disability Support PensionDVA Department of Veterans’ AffairsEDIs economic development initiativesEOWA Equal Opportunity for Women in the Workplace
AgencyEOWW Act Equal Opportunity for Women in the Workplace Act
1999FaHCSIA Department of Families, Housing, Community
Services and Indigenous AffairsFMA Act Financial Management and Accountability Act 1997
331

Abbreviations
FMP Financial Management ProgramFTB Family Tax BenefitHAF Housing Affordability FundHOIL Home Ownership on Indigenous LandHOP Home Ownership ProgramIBA Indigenous Business AustraliaICT information and communications technologyILC Indigenous Land CorporationNDIS National Disability Insurance SchemeNRAS National Rental Affordability SchemeOBS Outback Stores Pty LtdOECD Organisation for Economic Cooperation and
DevelopmentPPL Paid Parental LeavePPV Provisional Partner VisaSPP Special Purpose PaymentSSAT Social Security Appeals TribunalTSRA Torres Strait Regional AuthorityWGE Act Workplace Gender Equality Act 2012
332

INDEXAboriginal Hostels Limited, 165-188
agency resource statement, 170Australian Government
Indigenousexpenditure, 177
balance sheet, 182budget measures, 171capital budget statement, 185financial statements, 181-186income statement, 181Outcome 1—Aboriginal Hostels
Limited, 172-176Program 1.1—Company
operated hostels, 173-176Program 1.2—Community
operated hostels, 173-176
statement of asset movements, 186
statement of cash flows, 184statement of changes in equity,
183strategic direction in 2012–13,
169Aboriginal Land Commissioner, 135acronyms, 323-324Australian Institute of Family Studies,
189-210agency resource statement, 195balance sheet, 205budget measures, 196capital budget statement, 208financial statements, 204--209income statement, 204Outcome 1, 197-201Program 1.1—Australian Institute of
Family Studies, 199-201statement of asset movements,
209statement of cash flows, 207
statement of changes in equity, 206
strategic direction in 2012–13,193-194
agency resource statementsAIFS, 195AHL, 170EOWA, 217FaHCSIA, 25-27IBA, 241ILC, 272TSRA, 296-297
Australian Government IndigenousexpenditureAIFS, 202AHL, 177EOWA, 225FaHCSIA, 148-149IBA, 255ILC, 281TSRA, 308
budget measuresAIFS, 196AHL, 171EOWA, 218FaHCSIA, 28-36IBA, 242ILC, 273TSRA, 298
Department of Families, Housing, Community Services and Indigenous Affairs, 13administered cash flows, 161administered funds, movement
between years, 145administered income and expenses, agency resource statement, 25-
27Australian Government
Indigenousexpenditure, 148-149
333

balance sheet, 154budget measures, 28-36capital budget statement, 157financial statements, 144-164income statement, 152-153Outcome 1—Families and
Children,37-51
Outcome 2—Housing, 52-63Outcome 3—Community
Capability and the Vulnerable,64-79
Outcome 4—Seniors, 80-88Outcome 5—Disability and
Carers,89-115
Outcome 6—Women, 116-120Outcome 7—Indigenous, 121-
143Program 1.1—Family Support,
40-42Program 1.2—Family Tax
Benefit,43-47
Program 1.3—Parental Paymentsand Care Incentives, 48-51Program 2.1—Housing
Assistanceand Homelessness Prevention, 55-59
Program 2.2—Affordable Housing,
60-63Program 3.1—Financial
Management, 67-69Program 3.2—Community
Investment, 70-71Program 3.3—Income Support
forVulnerable People, 72-73
Program 3.4—Support for People in
Special Circumstances, 74-76
Program 3.5—SupplementaryPayments and Support for Income Support Recipients,77-79
Program 4.1—Income Support for
Seniors, 83-85Program 4.2—Allowances,
Concessions and Services forSeniors, 86-88
Program 5.1—Targeted Community
Care, 94-96Program 5.2—Disability Support
Pension, 97-98Program 5.3—Income Support
forCarers, 99-104
Program 5.4—Services and Support
for People with Disability, 105-108
Program 5.5—Support for Carers,
109-110Program 5.6—National Disability
Insurance Scheme, 111-113Program 5.7—Early Intervention
Services for Children withDisability, 114-115
Program 6.1—Gender Equality,118-120
Program 7.1—EconomicDevelopment and Participation,126-128
Program 7.2—Indigenous Housing
and Infrastructure, 129-132Program 7.3—Native Title and
Land Rights, 133-134Program 7.4—Indigenous
Capability and Development,135-139
334

Program 7.5—Stronger Futures in
the Northern Territory, 140-143
special accounts, 146-147statement of administered asset
movements, 162statement of asset movements,
158statement of cash flows, 156statement of changes in equity,
155strategic direction in 2012–13,
17-24
Equal Opportunity for Women in the
Workplace Agency, 211-233agency resource statement, 217balance sheet, 228budget measures, 218capital budget statement, 231financial statements, 225-233income statement, 227Outcome 1—Equality of
Opportunity in Employment forWomen, 219-224
Program 1.1—Equality ofOpportunity in Employment forWomen, 221-224
statement of asset movements, 232
statement of cash flows, 230statement of changes in equity,
229strategic direction in 2012–13,
215-216Executive Director of Township
Leasing, 5
financial statements. See also individual
agencies
AIFS, 202-209AHL, 177-187EOWA, 225-233FaHCSIA, 144-164IBA, 254-256ILC, 281-290TSRA, 308-316
glossary, 317-322
Indigenous Business Australia, 3, 4, 8,
27, 23-266agency resource statement, 241Australian Government
Indigenous expenditure, 255
balance sheet, 259-260budget measures, 242-243capital budget statement, 264financial statements, 256-266income statement, 258Outcome 1, 244-253Program 1.1—Equity and
Investments, 245-247Program 1.2—Homes Ownership
Program, 248-250Program 1.3—Business
Development and Assistance,
251-253statement of asset movements,
265statement of cash flows, 262-
263statement of changes in equity,
261strategic direction in 2012-13,
239-240Indigenous Land Corporation (ILC),
3-4, 8, 27, 135-136, 266-290agency resource statement, 272Australian Government
Indigenousexpenditure, 281
335

Abbreviations
balance sheet, 284budget measures, 273capital budget statement, 287financial statements, 282-290income statement, 283Outcome 1, 274-280Program 1—Acquisition and
management of an Indigenous land base, 276-280
statement of asset movements, 288
statement of cash flows, 286statement of changes in equity,
285strategic direction in 2012–13,
271
Northern Territory land councils, 5-6,
8, 135
Outback Stores Limited, 6, 8Portfolio Ministers and portfolio
responsibilities, 3-9overview, 3-6resources, 9
Registrar of Indigenous Corporations,
5, 136
Social Security Appeals Tribunal, 6, 8,
136, 138-139special accounts
FaHCSIA, 146-147
Torres Strait Regional Authority,3-5, 8, 27, 291-316agency resource statement,
296-297Australian GovernmentIndigenous expenditure, 308
balance sheet, 311
budget measures, 298capital budget statement, 314financial statements, 309-316income statement, 310Outcome 1, 299-307Program 1.1—Torres Strait
RegionalDevelopment, 300-307
statement of asset movements, 315
statement of cash flows, 313statement of changes in equity,
312strategic direction in 2012–13,
295-296
Wreck Bay Aboriginal Community Council, 6, 8
336