· Web viewThey're current volume weighted average prices. They represent all sales in that month,...
296
1 AMERICAN STATISTICAL ASSOCIATION COMMITTEE ON ENERGY STATISTICS + + + PUBLIC MEETING + + + THURSDAY, APRIL 10, 1997 + + + The Committee met in the Clark Room, Holiday Inn Capitol at 550 C Street, S.W., Washington, D.C., at 9:00 a.m., G. Campbell Watkins, Chairman, presiding. PRESENT: G. CAMPBELL WATKINS, Chairman DAVID R. BELLHOUSE CHARLES W. BISCHOFF BRENDA G. COX CAROL A. GOTWAY CRAWFORD CALVIN KENT GRETA M. LJUNG DANIEL A. RELLES NEAL R. GROSS COURT REPORTERS AND TRANSCRIBERS 1323 RHODE ISLAND AVE., N.W. (202) 234-4433 WASHINGTON, D.C. 20005-3701 (202) 234-4433 1 1 2 3 4 5 6 7 8 9 10 11 12 13 14 15 16 17 18 19 20 21 2 3 4 5 6
Transcript of · Web viewThey're current volume weighted average prices. They represent all sales in that month,...

1
AMERICAN STATISTICAL ASSOCIATION
COMMITTEE ON ENERGY STATISTICS
+ + +
PUBLIC MEETING
+ + +
THURSDAY, APRIL 10, 1997
+ + +
The Committee met in the Clark Room,
Holiday Inn Capitol at 550 C Street, S.W.,
Washington, D.C., at 9:00 a.m., G. Campbell Watkins,
Chairman, presiding.
PRESENT:
G. CAMPBELL WATKINS, Chairman
DAVID R. BELLHOUSE
CHARLES W. BISCHOFF
BRENDA G. COX
CAROL A. GOTWAY CRAWFORD
CALVIN KENT
GRETA M. LJUNG
DANIEL A. RELLES
BRADLEY O. SKARPNESS
NEAL R. GROSSCOURT REPORTERS AND TRANSCRIBERS
1323 RHODE ISLAND AVE., N.W.(202) 234-4433 WASHINGTON, D.C. 20005-3701 (202) 234-4433
1
1
2
3
4
5
6
7
8
9
10
11
12
13
14
15
16
17
18
19
20
21
222
3456

2
PRESENT (Continued):
ROY WHITMORE
NEAL R. GROSSCOURT REPORTERS AND TRANSCRIBERS
1323 RHODE ISLAND AVE., N.W.(202) 234-4433 WASHINGTON, D.C. 20005-3701 (202) 234-4433
1
1
2
2
3456

3
C O N T E N T S
PAGE
Opening Remarks, Lynda Carlson 10Update on 1997 Residential Energy Consumption
Survey, Mike Laurence 16
The Use of a Variant of Poisson Sampling:
Paula Weir 58, 85David Bellhouse 72Roy Whitmore 79
Presentation by Administrator Jay Hakes 112
Results of Customer Satisfaction Survey,Colleen Blessing 138
Annual Energy Outlook/Short-term EnergyOutlook Comparisons:
Art Andersen 184George Lady 191Dan Relles 199
NEMS, an Overview:
Susan Shaw 223Charles Bischoff 226
Annual Energy Outlook Forecast Evaluation:
Scott Sitzer 243Calvin Kent 249
NEAL R. GROSSCOURT REPORTERS AND TRANSCRIBERS
1323 RHODE ISLAND AVE., N.W.(202) 234-4433 WASHINGTON, D.C. 20005-3701 (202) 234-4433
1
1
2
345678910111213141516171819202122232425262728293031323334
2
3456
4
P R O C E E D I N G S
(9:06 a.m.)
CHAIRMAN WATKINS: Good morning. My
name is Campbell Watkins. I'd like to bring this
meeting to order, so to speak.
The meeting is being held under the
provision of the Federal Advisory Committee Act, and
I should emphasize this is an American Statistical
Association committee. It is not an Energy
Information Administration committee. It
periodically provides advice to the EIA.
The meeting, as we can see, is open to
the public. Public comments are welcome. You will
see in the provisions on the program that we set
aside time for comments at the end of each session by
the public, as well as by the Committee, and also
written comments are welcome and can be sent either
to the ASA or to the EIA.
If there are comments to be made, it is
necessary that each member of the public do stand and
state their name, affiliation. The reporter would
also very much appreciate it if you would speak into
NEAL R. GROSSCOURT REPORTERS AND TRANSCRIBERS
1323 RHODE ISLAND AVE., N.W.(202) 234-4433 WASHINGTON, D.C. 20005-3701 (202) 234-4433
1
1
2
3
4
5
6
7
8
9
10
11
12
13
14
15
16
17
18
19
20
21
222
3456
5
the microphone.
I want to introduce the Committee
members or have them introduce themselves, but before
I do that, I would like to mention three new
Committee members. We lost four last year. We have
three replacements.
Firstly, Carol Gotway Crawford, who is
with the Center for Disease Control and Prevention.
You may think that's a rather odd affiliation for
this Committee, but maybe after you've thought about
it you'll think it's highly appropriate. But what
her interests are are in spatial statistics, and in
that way she to some extent brings to the Committee
some of the skills that Michael Hohn had last year,
and she's also in statistical modeling, experimental
design, and stoichastic simulation.
Our other new Committee member who's
able to attend this meeting is Roy Whitmore, who is,
among his sins, associate editor of the Environmental
and Ecological Statistics journal, and he has
particular research interest in statistical sampling,
design analysis, and environmental statistics.
NEAL R. GROSSCOURT REPORTERS AND TRANSCRIBERS
1323 RHODE ISLAND AVE., N.W.(202) 234-4433 WASHINGTON, D.C. 20005-3701 (202) 234-4433
1
1
2
3
4
5
6
7
8
9
10
11
12
13
14
15
16
17
18
19
20
21
222
3456

6
Now, unfortunately, our third new
Committee member, Michelle Foss, is sick and unable
to be here. So I will introduce her the next time
that she's at the meeting, but she is, in particular,
a specialist in energy economics, and we'll look
forward to her participating in the next meeting.
However, she has sent me one or two comments on some
of the material we presented here.
What I would like to do now is just to
have each of the Committee members, maybe starting
with you, David, identify themselves, and we'll just
go around the table, and then I'd like to invite
those in our audience to introduce themselves, as
well.
MR. BELLHOUSE: I'm David Bellhouse.
Anything else?
CHAIRMAN WATKINS: University of Western
Ontario.
MR. BELLHOUSE: University of Western
Ontario in Canada.
(Laughter.)
MR. WHITMORE: Roy Whitmore, Research
NEAL R. GROSSCOURT REPORTERS AND TRANSCRIBERS
1323 RHODE ISLAND AVE., N.W.(202) 234-4433 WASHINGTON, D.C. 20005-3701 (202) 234-4433
1
1
2
3
4
5
6
7
8
9
10
11
12
13
14
15
16
17
18
19
20
21
222
3456

7
Triangle Institute in North Carolina.
MS. COX: Brenda Cox, Mathematical
Policy Research across the street.
MR. BISCHOFF: Chuck Bischoff, State
University of New York at Binghamton, Binghamton, New
York.
MS. CRAWFORD: Carol Crawford, Centers
for Disease Control and Prevention, Atlanta.
MR. RELLES: I'm Dan Relles from the
Rand Corporation in Santa Monica, California.
MS. WEIR: I'm Paula Weir. I'm not on
the Committee, but from EIA.
MR. SKARPNESS: Bradley Skarpness,
Battelle, Columbus, Ohio.
MR. KENT: Cal Kent, Marshall
University, Huntington, West Virginia.
MS. LJUNG: Greta Ljung, IIPLR, Boston,
and MIT.
MR. WEINIG: Bill Weinig with EPIA.
MS. MILLER: Renee Miller, EIA.
MS. CARLSON: Lynda Carlson (inaudible).
CHAIRMAN WATKINS: Could we please have
NEAL R. GROSSCOURT REPORTERS AND TRANSCRIBERS
1323 RHODE ISLAND AVE., N.W.(202) 234-4433 WASHINGTON, D.C. 20005-3701 (202) 234-4433
1
1
2
3
4
5
6
7
8
9
10
11
12
13
14
15
16
17
18
19
20
21
222
3456

8
the people in the audience identify themselves and
their affiliation, and if you could please use the
microphone.
MR. KILGORE: I'm Cal Kilgore from EIA.
MR. GRAPE: Howdy, you all. I'm Steve
Grape. I'm with the Energy Information
Administration's Dallas field office.
MR. MANICKE: Bob Manicke, EIA.
MS. HEPPNER: Tammy Heppner, EIA.
MR. BRAUN: I'm Tom Braun, EIA.
MR. FREDERICK: Howards Bridger
Frederick, EIA.
MS. WARE-MARTIN: Antoinette Ware-
Martin, EIA.
MS. KLEMMER: Katheryn Klemmer, Bureau
of Labor Statistics.
MR. FRENCH: Dwight French, EIA.
MR. COFFEY: Jerry Coffey, Statistical
Policy, OMB.
CHAIRMAN WATKINS: Thank you.
A couple of announcements before we get
into the program. There will be a luncheon for the
NEAL R. GROSSCOURT REPORTERS AND TRANSCRIBERS
1323 RHODE ISLAND AVE., N.W.(202) 234-4433 WASHINGTON, D.C. 20005-3701 (202) 234-4433
1
1
2
3
4
5
6
7
8
9
10
11
12
13
14
15
16
17
18
19
20
21
222
3456

9
Committee and invited guests in the Lewis Room at --
I think it's 11:45, Renee, or has that changed now?
MS. MILLER: Right, 11:45.
CHAIRMAN WATKINS: Yeah, 11:45.
Breakfast tomorrow will be in the Lewis
Room, where it was today, and the time for that, I
guess, is eight o'clock tomorrow for breakfast.
I should mention also that we had
regrets from Samprit Chatterjee and John Grace that
they were not able to attend this meeting, in
addition to Michelle Foss.
You'll note that we do have some changes
in the arrangements this morning. Jay Hakes will be
with us later on, and so the current version of the
agenda is the one that you have in these.
Does everybody have a copy of this,
Renee?
MS. MILLER: Yes.
CHAIRMAN WATKINS: Rather than the one
that you picked up on the desk on the way in.
MS. MILLER: It's the one on recycled
paper.
NEAL R. GROSSCOURT REPORTERS AND TRANSCRIBERS
1323 RHODE ISLAND AVE., N.W.(202) 234-4433 WASHINGTON, D.C. 20005-3701 (202) 234-4433
1
1
2
3
4
5
6
7
8
9
10
11
12
13
14
15
16
17
18
19
20
21
222
3456

10
CHAIRMAN WATKINS: Now, what I would
like to do now is, as you know, Yvonne Bishop retired
after our last meeting, not because of it, I hope,
but she retired, and Lynda Carlson has taken over
from her. So I'd like to hand over the podium to
you, Linda, to start the main meeting.
MS. CARLSON: I think my official title
here is designated federal official, and I want you
all to know how very honored and pleased I am to be
able to work directly with the Committee.
In my previous position, which was
Director of the Energy End Use and Integrated
Statistics Division in EIA, we've had a very long and
productive history of working with the Committee,
both in normal meetings like this and during crisis
situations. Sometimes we were hit with some of our
surveys with hurricanes and other disasters, and the
Committee was able to help us in various phone
conferences, and we have been extremely grateful, and
I hope that that kind of interaction will be able to
continue for all of EIA.
This advice that we received is
NEAL R. GROSSCOURT REPORTERS AND TRANSCRIBERS
1323 RHODE ISLAND AVE., N.W.(202) 234-4433 WASHINGTON, D.C. 20005-3701 (202) 234-4433
1
1
2
3
4
5
6
7
8
9
10
11
12
13
14
15
16
17
18
19
20
21
222
3456

11
especially important to EIA as we go through an
interesting period of transition both in the products
that we are producing and the areas we have to be
dealing with. As you'll find out today and tomorrow,
we're going through big changes in electricity and
natural gas and in the way we -- our processes, both
the technologies we use.
Cal Kilgore is here. He's probably in
the forefront in pushing EIA onto the Web and CD-ROMs
and always pushing us into the frontier, and you'll
see major changes taking place in EIA along the way,
as well as the implementation of how we do our
business within EIA.
We are making big changes in the way we
do our computer processing. We have a pilot underway
right now on how we're going to be doing our editing,
central editing of the data. That's still very much
in transition.
Another transition is taking place right
now, as well, with respect to the Committee. For the
last ten years the Committee has been very lucky and
EIA has been very lucky in having Renee Miller as our
NEAL R. GROSSCOURT REPORTERS AND TRANSCRIBERS
1323 RHODE ISLAND AVE., N.W.(202) 234-4433 WASHINGTON, D.C. 20005-3701 (202) 234-4433
1
1
2
3
4
5
6
7
8
9
10
11
12
13
14
15
16
17
18
19
20
21
222
3456

12
liaison, our shepherd, our bugger, our diplomat.
She's been a diplomat within EIA, and she is moving
on now to help us handle other problems and other
areas, and we're very lucky with that, and you're
also very lucky in that Bill Weinig is going to
become our next diplomat and aider and abettor and
working between the Committee and EIA, and I think it
will be a very productive relationship.
I'd like to turn now a bit to some of
the comments that we have. You've provided us a
series of comments from the last meeting, and we'd
like to do a little follow-up on that before we get
started with the formal meeting.
The first comment, and at the last
meeting you were very interested in Michael
Laurence's presentation on the RECS and the BLAISE
system we were undertaking, and what Michael is going
to be doing today is an update of where we are and
the successes and failures we've had to date on that.
I'm really excited about that because I was very much
involved in the development of it, and it's
interesting to really see it happen.
NEAL R. GROSSCOURT REPORTERS AND TRANSCRIBERS
1323 RHODE ISLAND AVE., N.W.(202) 234-4433 WASHINGTON, D.C. 20005-3701 (202) 234-4433
1
1
2
3
4
5
6
7
8
9
10
11
12
13
14
15
16
17
18
19
20
21
222
3456

13
Also, in the last meeting the Committee
had a series of comments on the modeling impacts of
EIA's modeling of motor gasoline, both as it relates
to the model specification and approach. Renee will
be handing out a paper addressing our responses to
those questions, and if there is any further follow-
up, we will be happy to deal with that as well. This
is a work in progress still.
We have some extra copies of these for
the audience as well.
The Committee also reviewed an article
that appears in the issues in midterm analysis and
forecasting entitled "Potential Impacts of Technology
Process on U.S. Markets." Andy and Cal were the
discussants on that.
Andy Kydes was sorry he was not able to
personally come and answer some of those questions.
He had to be out of town for a meeting. He
essentially said that the Committee noted -- and we
also agreed -- that it would be preferable to have
technologies represented in every sector, and he
indicted that he was sympathetic to that, but the
NEAL R. GROSSCOURT REPORTERS AND TRANSCRIBERS
1323 RHODE ISLAND AVE., N.W.(202) 234-4433 WASHINGTON, D.C. 20005-3701 (202) 234-4433
1
1
2
3
4
5
6
7
8
9
10
11
12
13
14
15
16
17
18
19
20
21
222
3456

14
model could get very large if we started to do that,
and we were going to try and develop some kind of
bridge between our structure and that of fossil
energies.
What we have been doing since that is
EIA has undertaken an effort to improve the oil and
gas supply modules by working with FE, Fossil Energy
-- that's a part of DOE -- contractor experts in
improving the parameters and representation in EIA's
model, and in fact, the funding is coming from Fossil
Energy for that. The results will be available not
in the AEO of '98. They won't be done in time, but
will be available for the '99 Annual Energy Outlook.
If you do want an update on the progress
on that, we can get it.
EIA has also undertaken an internally
funded activity to improve the technology
representation in the industrial NEMS module. The
work is in the early stages and will, again, not be
ready for FY '98, but should be ready for FY '99, and
again, from what I do understand, they will be
building in the new MECS data, which has more
NEAL R. GROSSCOURT REPORTERS AND TRANSCRIBERS
1323 RHODE ISLAND AVE., N.W.(202) 234-4433 WASHINGTON, D.C. 20005-3701 (202) 234-4433
1
1
2
3
4
5
6
7
8
9
10
11
12
13
14
15
16
17
18
19
20
21
222
3456

15
technologies into that.
There was also a discussion of the
discount rates used in the reference case, and Andy
had agreed last meeting that he needed to look at it
more carefully, and I am going to read the following
comment from Andy.
He said, "We have looked more closely at
the discount rates. The reference case discount
rates still stimulate history in the residential and
commercial markets. However, for these markets, we
find that a 15 percent interest rate seems to
reasonably represent the cost of money in these two
sectors, and the remainder represents other personal
preferences and institutional obstacles."
We have been asked, in addition -- EIA
has been asked to use the 15 percent by the Office of
Policy in the department for work we are now
undertaking on the big climate change initiative
being undertaken for the Vice President as well.
We think that as a first approximation
15 percent is probably, to quote Andy, "not bad,"
since that represents an economic life of around five
NEAL R. GROSSCOURT REPORTERS AND TRANSCRIBERS
1323 RHODE ISLAND AVE., N.W.(202) 234-4433 WASHINGTON, D.C. 20005-3701 (202) 234-4433
1
1
2
3
4
5
6
7
8
9
10
11
12
13
14
15
16
17
18
19
20
21
222
3456

16
years.
If you are interested in more updates on
this, I think what will probably arrange is some kind
of E-mail interaction between you and Andy directly.
Business reengineering was the next area
you wanted an update. The Committee raised a
question about data needs and collecting the right
data, not just developing measures for what is
currently collected.
At the meeting EIA apparently pointed
out that data needs was a separate issue, and a
separate group was working on this. I am, in fact, a
member of that committee, as are representatives for
all parts of EIA. It is most definitely a very
difficult issue, and we're very much grappling with
it, and we really do not have an answer yet on that.
Thank you.
CHAIRMAN WATKINS: Thank you, Lynda.
Can we now go ahead with the first
session? And I'll leave it to you, Mike.
MR. LAURENCE: Thank you.
Good morning. I'm Michael Laurence with
NEAL R. GROSSCOURT REPORTERS AND TRANSCRIBERS
1323 RHODE ISLAND AVE., N.W.(202) 234-4433 WASHINGTON, D.C. 20005-3701 (202) 234-4433
1
1
2
3
4
5
6
7
8
9
10
11
12
13
14
15
16
17
18
19
20
21
222
3456

17
EMEU. I'm very happy to be invited back to speak to
the Committee again about RECS going CAPI and our
experiences with it.
We were really very, very pleased with
the enthusiasm and the reaction to the demonstration
that I did. I was really very surprised and very
pleased that so much enthusiasm for, you know, our
efforts and how well it was working.
When I last spoke with you, we had just
started a pilot study using BLAISE CAPI for the 1997
RECS. The point of the pilot study was to make sure
that the new computerized CAPI instrument, indeed,
did work in the field, that the new case management
system that we had developed for the RECS, indeed,
did work in the field before we actually went to
full-scale data collection in the spring of 1997.
First, let me define my terms again.
RECS is the residential energy consumption survey.
This is the only survey that collects national level
data of energy consumption and expenditures in
residential households. In fact, it's a
constellation of surveys. The one that we're using
NEAL R. GROSSCOURT REPORTERS AND TRANSCRIBERS
1323 RHODE ISLAND AVE., N.W.(202) 234-4433 WASHINGTON, D.C. 20005-3701 (202) 234-4433
1
1
2
3
4
5
6
7
8
9
10
11
12
13
14
15
16
17
18
19
20
21
222
3456
18
CAPI on is the household interview in which we
collect data about household characteristics and data
on what fuels are used in household and what
equipment is used in the household.
The second part of the RECS are fuel
supplier surveys in which we collect actual
expenditures data and actual fuel consumption data
from utility companies for the households in the
household interview phase, and it is very, very
important that we collect good quality data in the
household portion of the interview, which then
transfers into identifying the household for the
utility company and being able to make sense of
aggregate consumption and expenditures data to
regression analyses and the like, to be able to break
it down and have it all make sense.
CAPI stands for computer-assisted
personal interviewing. We're all familiar with that.
And BLAISE, and again, I'll repeat,
BLAISE is not an affectation. BLAISE is a survey
management data collection and analytic system that
was developed by Statistics Netherlands. Originally
NEAL R. GROSSCOURT REPORTERS AND TRANSCRIBERS
1323 RHODE ISLAND AVE., N.W.(202) 234-4433 WASHINGTON, D.C. 20005-3701 (202) 234-4433
1
1
2
3
4
5
6
7
8
9
10
11
12
13
14
15
16
17
18
19
20
21
222
3456

19
it was programmed from Pascal and, I guess, in
someone's sense a whimsy, decided to name it after
his first name, Blaise Pascal. Thus, worldwide we
refer to it with the Dutch inflection BLAISE.
Principally it's a system that's in very
widespread use in Europe. Only recently has it come
to the United States, and EIA is only the really
second major user of it, and in fact, we've
encouraged our contractor, Westat, in its use, and
they, I guess, would be characterized as soon to be
the largest user of it. They are really enthusiastic
about it and really very pleased with the work we've
done and their experience with the RECS and BLAISE.
The next slide.
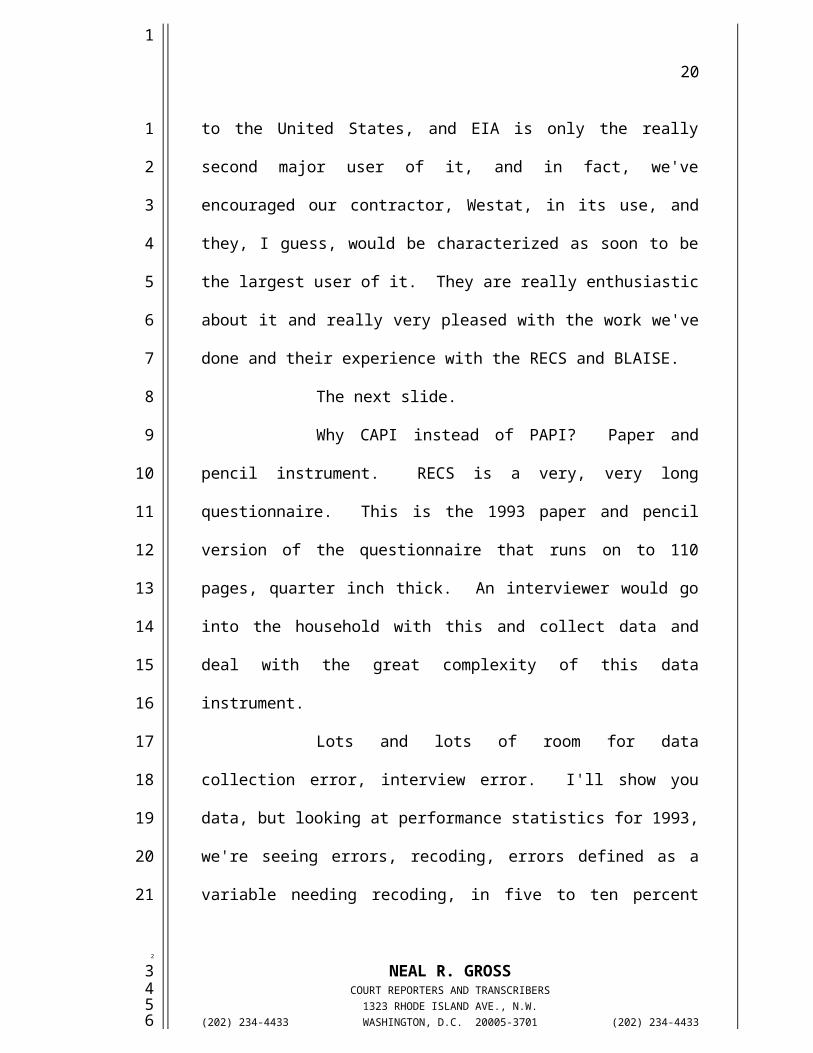
Why CAPI instead of PAPI? Paper and
pencil instrument. RECS is a very, very long
questionnaire. This is the 1993 paper and pencil
version of the questionnaire that runs on to 110
pages, quarter inch thick. An interviewer would go
into the household with this and collect data and
deal with the great complexity of this data
instrument.
NEAL R. GROSSCOURT REPORTERS AND TRANSCRIBERS
1323 RHODE ISLAND AVE., N.W.(202) 234-4433 WASHINGTON, D.C. 20005-3701 (202) 234-4433
1
1
2
3
4
5
6
7
8
9
10
11
12
13
14
15
16
17
18
19
20
21
222
3456
20
Lots and lots of room for data
collection error, interview error. I'll show you
data, but looking at performance statistics for 1993,
we're seeing errors, recoding, errors defined as a
variable needing recoding, in five to ten percent
range and sometimes dramatically higher.
The second reason is the length of time
that it takes to collect the data and then at the end
of the field period convert that data into a usable
SAS data set. For the 1993 RECS, it took seven
months between the last interview and a preliminary
SAS data set arriving at EIA.
The results of the pilot study. The
pilot study was really a case of very good new and
some bad news. Okay. The point of doing the pilot
study was, as I mentioned, to allow us to take the
new systems, case management system, the BLAISE
household interview, get it out in the field with 100
cases or so in a number of households that were
quasi-representative of what we would bump into when
we went into full-scale RECS.
The bad news was -- and, you know, what
NEAL R. GROSSCOURT REPORTERS AND TRANSCRIBERS
1323 RHODE ISLAND AVE., N.W.(202) 234-4433 WASHINGTON, D.C. 20005-3701 (202) 234-4433
1
1
2
3
4
5
6
7
8
9
10
11
12
13
14
15
16
17
18
19
20
21
222
3456

21
we were looking for was to make all the mistakes in
the pilot study. Inevitably when you apply a new
methodology or begin a brand new survey, it's a mess.
Everything goes wrong, and it's a very traumatic
thing to have to go through the first few weeks or so
to straighten out all the problems and really get
things up and running successfully.
The bad news is we experienced no real
problems. This thing, you know, went incredibly
smoothly. The household interview never froze up.
The case management system went marvelously. There
were no major problems with how the interview was
constructed and programmed. So we were very pleased
with that, of course, and therefore, you know, we
characterize it a great success, and we did learn a
lot in terms of how to refine the instrument in the
case management systems, things that we have applied
into the instrument and the system as we go into the
main data collection period this spring.
There was a dramatic reduction in data
recording errors. In the CAPI they were approaching
near negligible levels. I say near negligible
NEAL R. GROSSCOURT REPORTERS AND TRANSCRIBERS
1323 RHODE ISLAND AVE., N.W.(202) 234-4433 WASHINGTON, D.C. 20005-3701 (202) 234-4433
1
1
2
3
4
5
6
7
8
9
10
11
12
13
14
15
16
17
18
19
20
21
222
3456

22
levels. The levels were such that as you look at the
data set that we received, it's not -- there is no
missing data. You know, there's not apparently lots
of odd ball answers that keypunchers type in that
make no sense to anyone. It's just a remarkably
clean data set.
The time between the end of data
collection and the delivery of a SAS data set to us
was reduced from seven months to eight days. It
really did work, as I'll describe to you in more
detail.
BLAISE and its Cameleon subsystem that
takes a BLAISE data set and at the press of a key
converts it into a SAS data set that can be readily
used for immediate analysis really does work. It's
dramatic. I mean it's simply amazing. I mean I
still sputter, you know, about how effective it is,
and when I received this data set and disk in the
mail eight days after the end of the field period, I
was just absolutely ecstatic, as was Lynda and others
in EMEU.
Okay. Now I want to first talk about
NEAL R. GROSSCOURT REPORTERS AND TRANSCRIBERS
1323 RHODE ISLAND AVE., N.W.(202) 234-4433 WASHINGTON, D.C. 20005-3701 (202) 234-4433
1
1
2
3
4
5
6
7
8
9
10
11
12
13
14
15
16
17
18
19
20
21
222
3456

23
the data collection problems in the past and compare
them to what we've seen in the pilot study. This is
the questionnaire, and in the back of the
questionnaire is a what we refer to as "the foldout
page." Now, the point of the foldout page, reduced
here, is to assist the interviewer with keeping track
of key variables throughout the interview that allow
him to determine whether or not questions should be
asked, which versions of questions should be asked,
and to effectively help the interviewer with the skip
patterns throughout the questionnaire, as well as
with framing questions for the responder, and we'll
see how sometimes it becomes rather difficult.
What I'm going to talk about today is
the lower portion of the foldout page that deals with
three key variables, and they really are key to the
RECS and getting the data that we need, first,
dealing with questions about what fuels are used;
secondly, how those fuels are used; and finally, how
those fuels are paid for.
Okay. The way it sort of works is that
each time an interviewer collects a critical piece of
NEAL R. GROSSCOURT REPORTERS AND TRANSCRIBERS
1323 RHODE ISLAND AVE., N.W.(202) 234-4433 WASHINGTON, D.C. 20005-3701 (202) 234-4433
1
1
2
3
4
5
6
7
8
9
10
11
12
13
14
15
16
17
18
19
20
21
222
3456

24
data, there is an instruction in the questionnaire to
enter the data here. Later on, as we proceed through
the interview, very frequently the interviewer is
told to refer to this page to determine what question
they should ask and how they should ask it.
And, in fact, in the body of this
questionnaire there are 41 references to the foldout
page. So in addition to the complexity of keeping
track of all this and writing it down, the
interviewer is constantly going from here to here,
back and forth, and as you can imagine, if you're not
sitting at a table, and frequently interviewers are
not, sometimes even sitting on the front porch
because some households don't want the interviewer in
the house, it can get very difficult and obviously
great opportunity for error is apparent.
Next.
Okay. Looking at fuels used, these data
show the recode rates from the 1993 survey, and what
we're looking at in this table are we have the
distribution of responses right off the
questionnaires from keypunch compared to the
NEAL R. GROSSCOURT REPORTERS AND TRANSCRIBERS
1323 RHODE ISLAND AVE., N.W.(202) 234-4433 WASHINGTON, D.C. 20005-3701 (202) 234-4433
1
1
2
3
4
5
6
7
8
9
10
11
12
13
14
15
16
17
18
19
20
21
222
3456

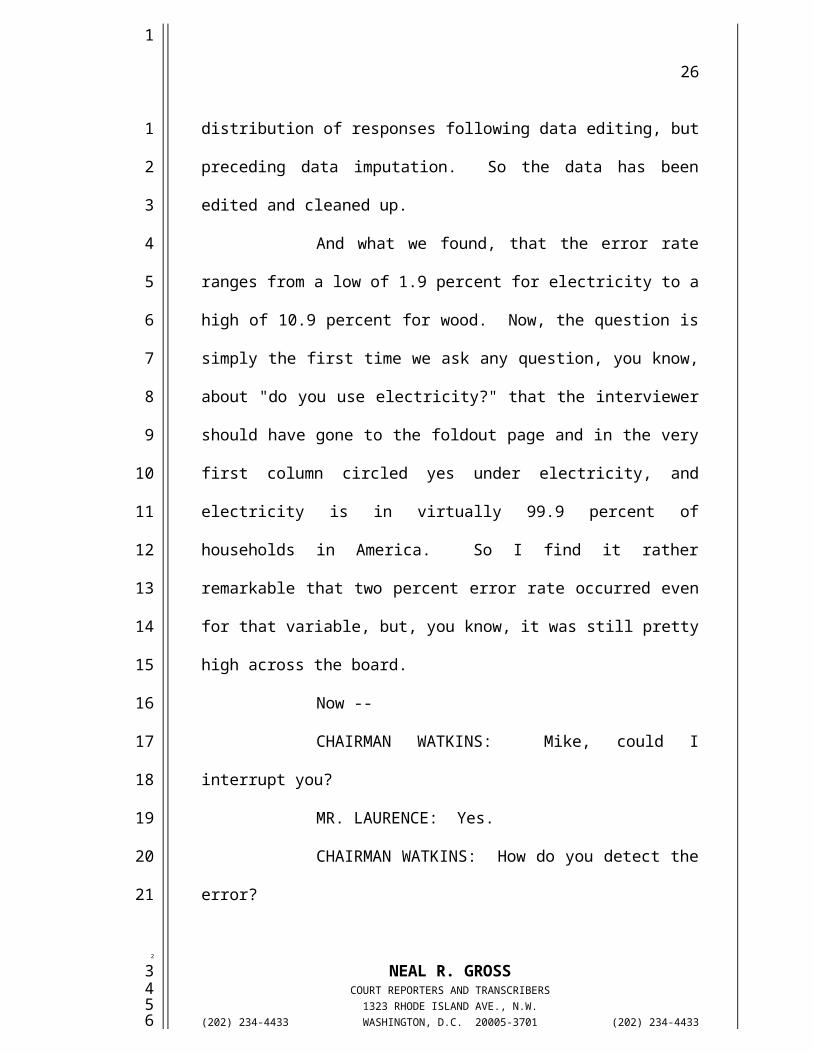
25
distribution of responses following data editing, but
preceding data imputation. So the data has been
edited and cleaned up.
And what we found, that the error rate
ranges from a low of 1.9 percent for electricity to a
high of 10.9 percent for wood. Now, the question is
simply the first time we ask any question, you know,
about "do you use electricity?" that the interviewer
should have gone to the foldout page and in the very
first column circled yes under electricity, and
electricity is in virtually 99.9 percent of
households in America. So I find it rather
remarkable that two percent error rate occurred even
for that variable, but, you know, it was still pretty
high across the board.
Now --
CHAIRMAN WATKINS: Mike, could I
interrupt you?
MR. LAURENCE: Yes.
CHAIRMAN WATKINS: How do you detect the
error?
MR. LAURENCE: Okay. The way we did it
NEAL R. GROSSCOURT REPORTERS AND TRANSCRIBERS
1323 RHODE ISLAND AVE., N.W.(202) 234-4433 WASHINGTON, D.C. 20005-3701 (202) 234-4433
1
1
2
3
4
5
6
7
8
9
10
11
12
13
14
15
16
17
18
19
20
21
222
3456
26
was we took the original data set from keypunch,
okay, and simply did a listing. Then they took a
similar listing of the same variable after editing
and compared the two and calculated. In fact, what
we do is have cross-tab of the response categories
before and the response categories afterwards, and
then you can clearly see where a variable had been
changed from missing to used or not used to used and
so on.
So they were real performance statistics
for each of the several hundred variables in RECS.
Yes?
MR. SKARPNESS: I've got a question. So
you don't give people these surveys to fill out. You
have an interview or scene with them?
MR. LAURENCE: Right.
MR. SKARPNESS: Okay.
MR. LAURENCE: The interviewer asks the
questions, okay?
MR. SKARPNESS: Okay, and then the
person being interviewed responds by saying, "Yes, I
use electricity" --
NEAL R. GROSSCOURT REPORTERS AND TRANSCRIBERS
1323 RHODE ISLAND AVE., N.W.(202) 234-4433 WASHINGTON, D.C. 20005-3701 (202) 234-4433
1
1
2
3
4
5
6
7
8
9
10
11
12
13
14
15
16
17
18
19
20
21
222
3456

27
MR. LAURENCE: Yes.
MR. SKARPNESS: -- or this or that.
Okay.
MR. LAURENCE: So we ask, "What fuel do
you use mainly to heat your home?" And the
respondent says, "Electricity," at which point the
interviewer records it in the body and then also
circles a yes on the foldout page.
MR. SKARPNESS: Well, the reason I ask
that is because I knew there are some CAPI systems
where you can just sit down in front of the computer
and go through the whole survey itself.
MR. LAURENCE: Yes.
MR. SKARPNESS: You know, you don't need
an interviewer.
MR. LAURENCE: No. An interviewer
actually conducted this and will be doing the CAPI as
well.
MR. KENT: That is the question I had.
The interviewer then directly inputs these?
MR. LAURENCE: Yes, these are
interviewers.
NEAL R. GROSSCOURT REPORTERS AND TRANSCRIBERS
1323 RHODE ISLAND AVE., N.W.(202) 234-4433 WASHINGTON, D.C. 20005-3701 (202) 234-4433
1
1
2
3
4
5
6
7
8
9
10
11
12
13
14
15
16
17
18
19
20
21
222
3456

28
MR. SKARPNESS: Trained people.
MR. KENT: And so the difference is in
the method that he's used to record the response.
It's not one where you sent it out to the households
and asked them to respond.
MR. LAURENCE: That's correct.
MR. KENT: Or set them down with a
terminal and guided them through it.
MR. LAURENCE: That's correct.
MR. KENT: Okay.
MR. LAURENCE: In paper/pencil and in
the RECS CAPI, we're really talking about interviewer
recording error here.
MR. KENT: Okay.
MR. LAURENCE: These are the paper and
pencil results.
Okay. Lynda was telling me. I brought
along an interviewer PC, a laptop that has the
interview on it, and for those of you who didn't see
the demonstration or did see it, you know, you can
sit down and play with it and go through a household
interview and see how it does work and how really
NEAL R. GROSSCOURT REPORTERS AND TRANSCRIBERS
1323 RHODE ISLAND AVE., N.W.(202) 234-4433 WASHINGTON, D.C. 20005-3701 (202) 234-4433
1
1
2
3
4
5
6
7
8
9
10
11
12
13
14
15
16
17
18
19
20
21
222
3456

29
effective it is.
MS. CRAWFORD: Mike, how much training
did your interviewers receive in using this new
system?
MR. LAURENCE: For the new system they
received three days of training. In fact, we've just
finished Phase 1 of interviewer training. We had 100
interviewers in Bethesda training them for CAPI, and
in fact, today is the very first day of actual data
collection. They finished up Monday. We'll be
receiving their first assignments today going out
into the field.
They received three days of training.
Approximately eight hours of that training deals with
with care and use of a computer and how to just
manipulate the computer and enter data and use the
case management system. The other two days deal with
the interview itself, going through various versions
and practicing with it and also diads in addition.
So before they leave, they have gone
through at least five iterations of using the
interview. So they're very well familiar with it.
NEAL R. GROSSCOURT REPORTERS AND TRANSCRIBERS
1323 RHODE ISLAND AVE., N.W.(202) 234-4433 WASHINGTON, D.C. 20005-3701 (202) 234-4433
1
1
2
3
4
5
6
7
8
9
10
11
12
13
14
15
16
17
18
19
20
21
222
3456

30
Our experience with the interviewers is
about half have had CAPI experience, have used a PC.
The other half have not and are just learning for the
first time, but they really come along very quickly.
About half of the interviewers have
previous RECS experience, okay, have done this using
this, and then seeing this for the first time. In
our pilot study, I think four out of the seven of the
interviewers we used had done paper/pencil RECS and
were using CAPI RECS for the first time and were just
ecstatic. I mean they were just so happy to be rid
of this book and even just thrilled to be rid of this
page. So it really is effective.
Okay. Returning again to, okay, how do
we -- okay. Just a moment.
In the pilot study, essentially these
rates were reduced to zero. I mean, as I look at the
data I can't find any real problems with it, and the
next slide really shows how we did it.
At the very bottom in the shaded area,
this page is BLAISE code, you know, an idealized
sample of it, but at the bottom you see the first
NEAL R. GROSSCOURT REPORTERS AND TRANSCRIBERS
1323 RHODE ISLAND AVE., N.W.(202) 234-4433 WASHINGTON, D.C. 20005-3701 (202) 234-4433
1
1
2
3
4
5
6
7
8
9
10
11
12
13
14
15
16
17
18
19
20
21
222
3456

31
question we're asking at the top is, "What is your
main heating fuel?" and they can say electricity,
natural gas, bottled gas, any one of the nine
available options.
They report that to the interviewer, and
the interviewer types in the response code. Let's
say it was bottled gas. Okay. Hits the key, presses
enter. The data is entered, but then -- answering
the question, the main fuel used -- but then behind
the scenes the BLAISE code looks at that variable and
then finds out which fuel was used and then goes
through the list of fuels used variables, used
electricity, used natural gas, used LP, all set
initially to no.
So every time a response saying, "I use
that fuel," is entered, the BLAISE system does what
the interviewer had to do here. It's foolproof. So
it greatly reduces the burden on the interviewer and
insures that accuracy of this question being
answered.
Now, this really becomes important
because later on in the interview we asked and we
NEAL R. GROSSCOURT REPORTERS AND TRANSCRIBERS
1323 RHODE ISLAND AVE., N.W.(202) 234-4433 WASHINGTON, D.C. 20005-3701 (202) 234-4433
1
1
2
3
4
5
6
7
8
9
10
11
12
13
14
15
16
17
18
19
20
21
222
3456

32
have actually BLAISE do it for us. You have told me
in the course of this interview that you use fuels A,
B, and C. Well, what about fuels D, E, F, and G? Do
you use these?
Okay. The construction of that question
for an interviewer using this is extremely difficult.
Okay? He's got to look here and sort of remember
here and put a sentence together that makes sense.
Frequently fuels are dropped in one or the other or
reversed and the like.
BLAISE does it for you. There's no way,
assuming the data that the interviewee has provided
is correct, that the interviewer can get it wrong.
BLAISE looks at this throughout the questionnaire and
constructs the question on the screen for them.
Okay. Returning to the foldout page, in
addition to asking what fuel along the way, we also
need to know later on in the interview how that fuel
is used. In the paper/pencil, when an interviewee
said or household says that they use fuel oil to heat
their hot water for bathing and washing, the
interviewer not only has to record on the foldout
NEAL R. GROSSCOURT REPORTERS AND TRANSCRIBERS
1323 RHODE ISLAND AVE., N.W.(202) 234-4433 WASHINGTON, D.C. 20005-3701 (202) 234-4433
1
1
2
3
4
5
6
7
8
9
10
11
12
13
14
15
16
17
18
19
20
21
222
3456

33
page fuel oil used, but also that, well, let's say,
natural gas is used, but also that natural gas is
used for hot water. So now they have to record two
different things.
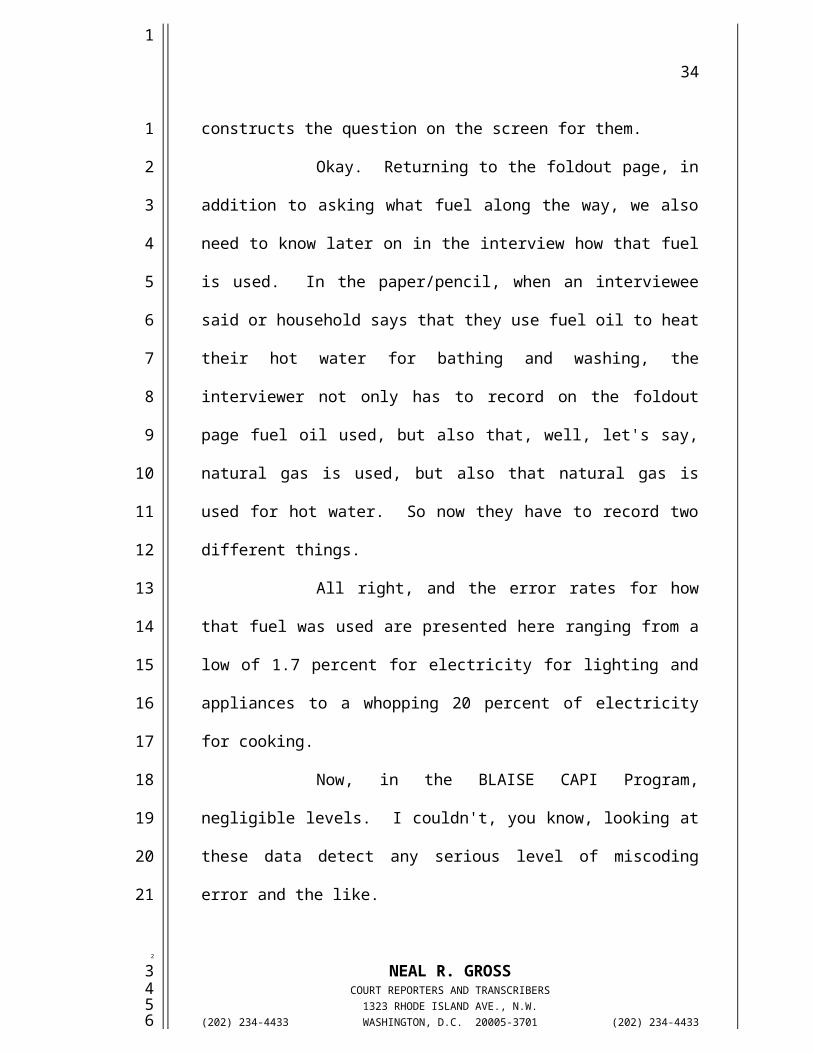
All right, and the error rates for how
that fuel was used are presented here ranging from a
low of 1.7 percent for electricity for lighting and
appliances to a whopping 20 percent of electricity
for cooking.
Now, in the BLAISE CAPI Program,
negligible levels. I couldn't, you know, looking at
these data detect any serious level of miscoding
error and the like.
Now, these are terrible performance
rates. Why are they? They're terrible. Just look
at the error rate, but they're terrible because also
this sets the occasion for the next set of questions,
and these are the penultimate RECS questions of how
is usage paid. Who pays for the fuel? Is it the
household? Is it the renter or a condominium, or is
it paid some other way?
And we also want to know not only who
NEAL R. GROSSCOURT REPORTERS AND TRANSCRIBERS
1323 RHODE ISLAND AVE., N.W.(202) 234-4433 WASHINGTON, D.C. 20005-3701 (202) 234-4433
1
1
2
3
4
5
6
7
8
9
10
11
12
13
14
15
16
17
18
19
20
21
222
3456
34
pays for electricity, but particularly in properties
or households that are renting, sometimes they pay
for electricity for this or not for that. Sometimes
they pay natural gas for some applications or not at
all, included in the rent, a real mixed bag, and then
we've got situations where, quote, other arises, and
it's marvelous how complicated Americans are in the
way they pay their fuel bills, much less how they use
fuel.
So this is really important to get it
right so that when we go to the fuel suppliers and
relate the consumption and energy data to the
household characteristics data and then put that all
into the regression analyses, that it really makes
sense, and if it doesn't make sense because we
collected the wrong data, it makes life much, much
more complicated and certainly reduces the accuracy,
the validity of the regression analysis.
And here are the error rates for these
questions, and there are 11 possible questions. Now,
this time, in addition to have it broken down by
total, I've broken it down by erroneously asked/not
NEAL R. GROSSCOURT REPORTERS AND TRANSCRIBERS
1323 RHODE ISLAND AVE., N.W.(202) 234-4433 WASHINGTON, D.C. 20005-3701 (202) 234-4433
1
1
2
3
4
5
6
7
8
9
10
11
12
13
14
15
16
17
18
19
20
21
222
3456

35
asked. Okay. There are many cases where if they
don't use electricity for cooking, that question
should be skipped. Okay. Similarly, if they do use
it, the interviewer should ask.
As you can see, with the exception of
electricity for lighting and housing, the majority of
recodes were due to the fact that a question was
either erroneously asked or the interviewer
erroneously failed to ask the question, and
remarkably enough, in 18.5 percent of the cases the
electricity for cooking question was not asked.
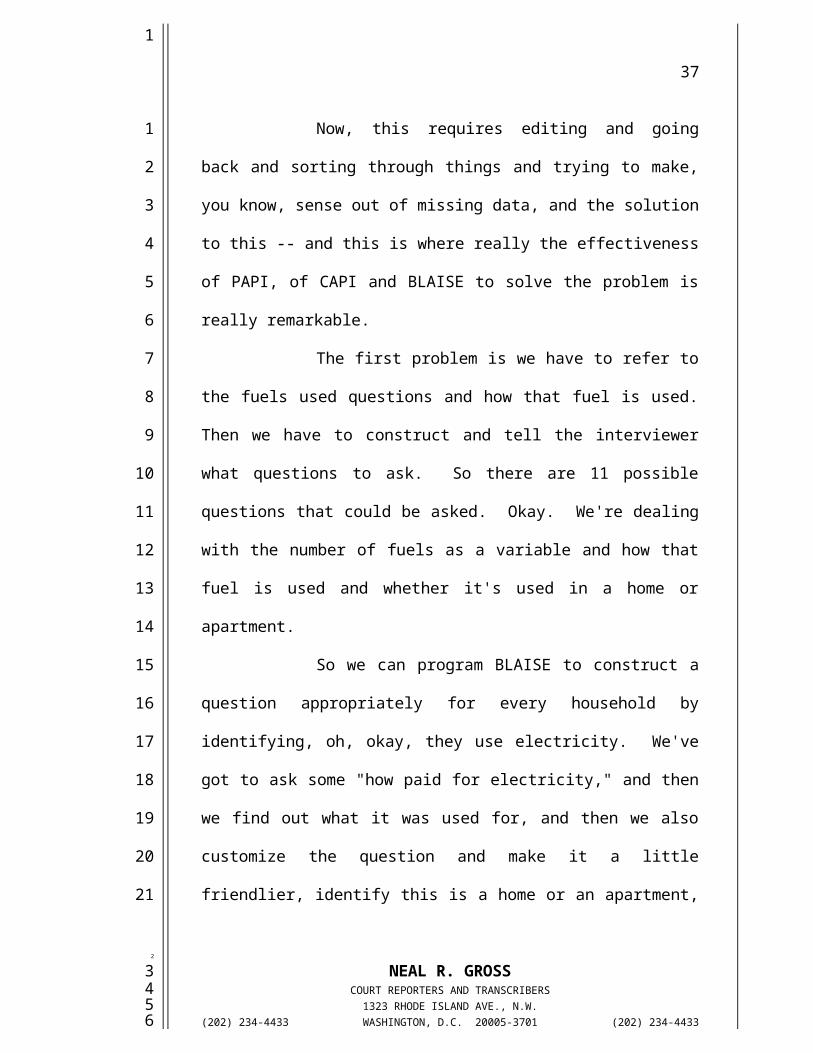
Now, this requires editing and going
back and sorting through things and trying to make,
you know, sense out of missing data, and the solution
to this -- and this is where really the effectiveness
of PAPI, of CAPI and BLAISE to solve the problem is
really remarkable.
The first problem is we have to refer to
the fuels used questions and how that fuel is used.
Then we have to construct and tell the interviewer
what questions to ask. So there are 11 possible
questions that could be asked. Okay. We're dealing
NEAL R. GROSSCOURT REPORTERS AND TRANSCRIBERS
1323 RHODE ISLAND AVE., N.W.(202) 234-4433 WASHINGTON, D.C. 20005-3701 (202) 234-4433
1
1
2
3
4
5
6
7
8
9
10
11
12
13
14
15
16
17
18
19
20
21
222
3456

36
with the number of fuels as a variable and how that
fuel is used and whether it's used in a home or
apartment.
So we can program BLAISE to construct a
question appropriately for every household by
identifying, oh, okay, they use electricity. We've
got to ask some "how paid for electricity," and then
we find out what it was used for, and then we also
customize the question and make it a little
friendlier, identify this is a home or an apartment,
okay, instead of "your household." Okay. We can
really turn this into colloquial English and friendly
English, and then followed by the phrase at the
bottom "paid by your household." Now that carat,
"red condo" is a variable where there will be a word
filled in, okay, or paid some other way. The
possibilities: you pay it, the household pays it, or
it's included in the rent or the condo, or paid some
other way.
What we've done is if you own the house
really you don't want to ask, "Is it included in your
rent or condo fee?" That makes no sense. So we just
NEAL R. GROSSCOURT REPORTERS AND TRANSCRIBERS
1323 RHODE ISLAND AVE., N.W.(202) 234-4433 WASHINGTON, D.C. 20005-3701 (202) 234-4433
1
1
2
3
4
5
6
7
8
9
10
11
12
13
14
15
16
17
18
19
20
21
222
3456
37
drop it out. Okay? But if they do rent, we say, "Is
it paid for by your household, included in the rent,
or paid some other way?" But if it's owned but a
condo, then we can say, "Paid for by your household,
included in the condominium fee, or paid some other
way?"
So it really comes up with elegantly
phrased questions that the interviewer can relate to.
It's not stilted language. Plus BLAISE makes sure
that of these 11 we only ask those that are
appropriate. If it's an all electric house, only the
electric questions would be asked and the others just
ignored.
So it is conceivable that there will be
a household or two out there that uses every fuel for
every possible use. So conceivably this question
might have to be asked 11 times. Terribly boring,
really is boring. The interviewers hate it because
they've got to trudge through.
Now, what the interviewers are supposed
to do, and we know that they didn't because they all
admit it willingly, is they have to ask every
NEAL R. GROSSCOURT REPORTERS AND TRANSCRIBERS
1323 RHODE ISLAND AVE., N.W.(202) 234-4433 WASHINGTON, D.C. 20005-3701 (202) 234-4433
1
1
2
3
4
5
6
7
8
9
10
11
12
13
14
15
16
17
18
19
20
21
222
3456

38
question. So, you know, they ask the question and
the first question says, "Well, the household pays
for it," and there are only really three legitimate
responses. The household pays for it.
Then they ask the second question. "The
household pays for it," and then finally, you know,
they get irritated, "We pay for everything," at which
point the interviewer instead of fastidiously
repeating each question just circles them all "paid
by the household." Okay.
What we've done is programmed the system
to accommodate that. So the interviewer starts out
with, "In the past 12 months was the electricity paid
for your household used for cooking paid for by the
household or some other way?" And the respondent may
say, "Oh, we paid all of our electricity," at which
point the interviewer goes down and responds, circles
them or punches in key four. BLAISE answers the rest
of the questions, and we move out and go on.
Similarly, the interviewee could say,
"We pay for all our fuels." The interviewer would
then hit five or six and BLAISE would go answer all
NEAL R. GROSSCOURT REPORTERS AND TRANSCRIBERS
1323 RHODE ISLAND AVE., N.W.(202) 234-4433 WASHINGTON, D.C. 20005-3701 (202) 234-4433
1
1
2
3
4
5
6
7
8
9
10
11
12
13
14
15
16
17
18
19
20
21
222
3456

39
the questions for the interviewer and then move on.
Okay. Two minutes. Good.
MR. SKARPNESS: I've got a question.
MR. LAURENCE: Yes.
MR. SKARPNESS: Bradley Skarpness.
MR. LAURENCE: Okay.
MR. SKARPNESS: Just to bring this up,
like I've been donating to my electric company or gas
company, you know, a donation to supplement other
people's gas bills or whatever. Where does that come
in here?
MR. LAURENCE: That would come in some
other way.
MR. SKARPNESS: Okay. I mean they are
paying, but it's still supplemented to a certain
extent.
MR. LAURENCE: Yes. The household
responder would say, you know, "Oh, you know, we pay
some of it. Also the utility companies pay some of
it for us."
MR. SKARPNESS: Okay.
MR. LAURENCE: And that would be some
NEAL R. GROSSCOURT REPORTERS AND TRANSCRIBERS
1323 RHODE ISLAND AVE., N.W.(202) 234-4433 WASHINGTON, D.C. 20005-3701 (202) 234-4433
1
1
2
3
4
5
6
7
8
9
10
11
12
13
14
15
16
17
18
19
20
21
222
3456

40
other way, and we would pursue that, and we would
pick up the details of that in the fuel usage. Okay?
I see that I'm going on way too long,
which I'm prone to.
MR. LAURENCE: Well, he tells me I am.
(Laughter.)
MR. LAURENCE: He's the Chair. He just
reminded me.
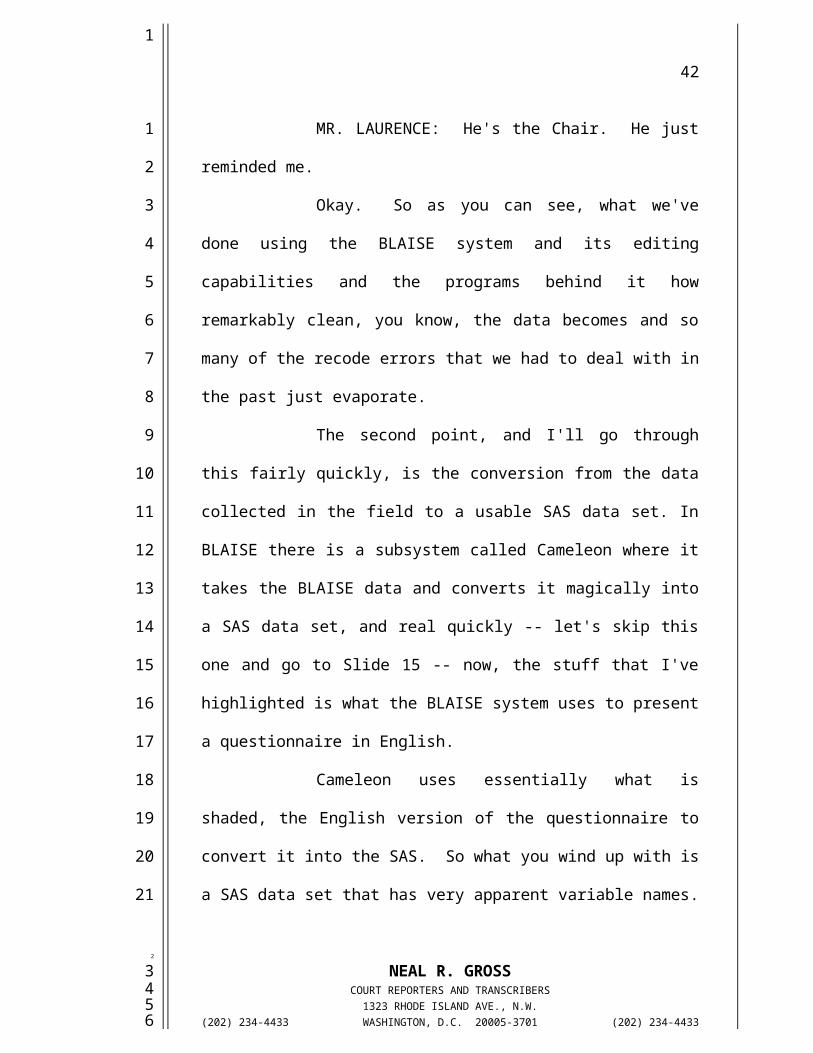
Okay. So as you can see, what we've
done using the BLAISE system and its editing
capabilities and the programs behind it how
remarkably clean, you know, the data becomes and so
many of the recode errors that we had to deal with in
the past just evaporate.
The second point, and I'll go through
this fairly quickly, is the conversion from the data
collected in the field to a usable SAS data set. In
BLAISE there is a subsystem called Cameleon where it
takes the BLAISE data and converts it magically into
a SAS data set, and real quickly -- let's skip this
one and go to Slide 15 -- now, the stuff that I've
highlighted is what the BLAISE system uses to present
NEAL R. GROSSCOURT REPORTERS AND TRANSCRIBERS
1323 RHODE ISLAND AVE., N.W.(202) 234-4433 WASHINGTON, D.C. 20005-3701 (202) 234-4433
1
1
2
3
4
5
6
7
8
9
10
11
12
13
14
15
16
17
18
19
20
21
222
3456

41
a questionnaire in English.
Cameleon uses essentially what is
shaded, the English version of the questionnaire to
convert it into the SAS. So what you wind up with is
a SAS data set that has very apparent variable names.
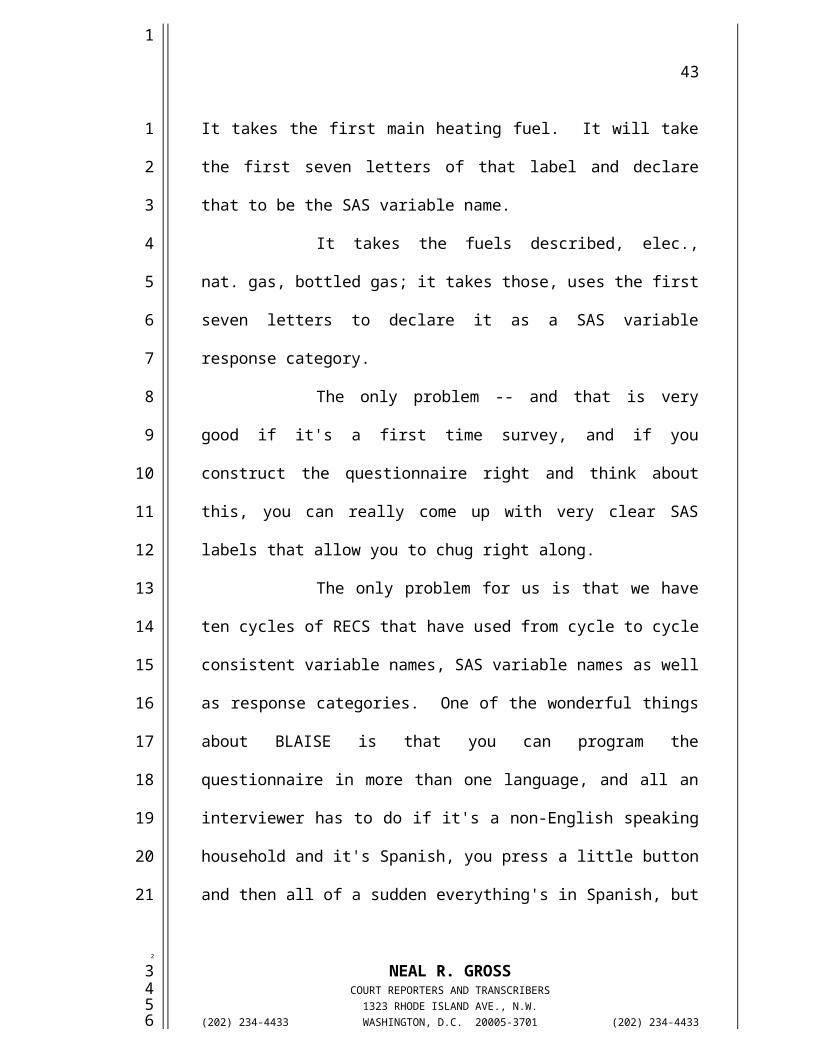
It takes the first main heating fuel. It will take
the first seven letters of that label and declare
that to be the SAS variable name.
It takes the fuels described, elec.,
nat. gas, bottled gas; it takes those, uses the first
seven letters to declare it as a SAS variable
response category.
The only problem -- and that is very
good if it's a first time survey, and if you
construct the questionnaire right and think about
this, you can really come up with very clear SAS
labels that allow you to chug right along.
The only problem for us is that we have
ten cycles of RECS that have used from cycle to cycle
consistent variable names, SAS variable names as well
as response categories. One of the wonderful things
about BLAISE is that you can program the
NEAL R. GROSSCOURT REPORTERS AND TRANSCRIBERS
1323 RHODE ISLAND AVE., N.W.(202) 234-4433 WASHINGTON, D.C. 20005-3701 (202) 234-4433
1
1
2
3
4
5
6
7
8
9
10
11
12
13
14
15
16
17
18
19
20
21
222
3456
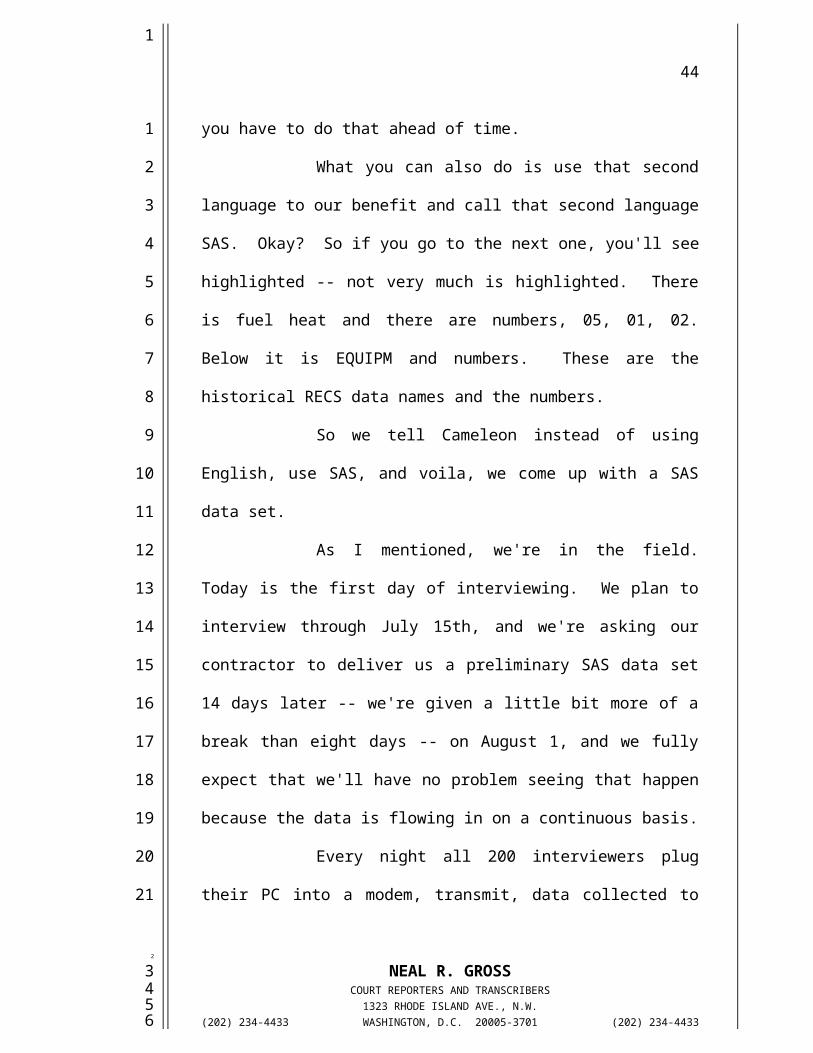
42
questionnaire in more than one language, and all an
interviewer has to do if it's a non-English speaking
household and it's Spanish, you press a little button
and then all of a sudden everything's in Spanish, but
you have to do that ahead of time.
What you can also do is use that second
language to our benefit and call that second language
SAS. Okay? So if you go to the next one, you'll see
highlighted -- not very much is highlighted. There
is fuel heat and there are numbers, 05, 01, 02.
Below it is EQUIPM and numbers. These are the
historical RECS data names and the numbers.
So we tell Cameleon instead of using
English, use SAS, and voila, we come up with a SAS
data set.
As I mentioned, we're in the field.
Today is the first day of interviewing. We plan to
interview through July 15th, and we're asking our
contractor to deliver us a preliminary SAS data set
14 days later -- we're given a little bit more of a
break than eight days -- on August 1, and we fully
expect that we'll have no problem seeing that happen
NEAL R. GROSSCOURT REPORTERS AND TRANSCRIBERS
1323 RHODE ISLAND AVE., N.W.(202) 234-4433 WASHINGTON, D.C. 20005-3701 (202) 234-4433
1
1
2
3
4
5
6
7
8
9
10
11
12
13
14
15
16
17
18
19
20
21
222
3456
43
because the data is flowing in on a continuous basis.
Every night all 200 interviewers plug
their PC into a modem, transmit, data collected to
Rockville, and Rockville sends out new assignments,
and they go back into the field.
Needless to say, we're really pleased
with our experience and what we're seeing, and
indeed, BLAISE and CAPI have revolutionized the
conduct of the RECS in ways that we think are
consistent with EIA's efforts to do more with less
people, as well as do it more efficiently.
As I mentioned, I think we were
scheduled for a break if I haven't run over too much,
but you know, I can answer anymore questions you have
as a group or individually, and I'll pull out the
laptop and you can try it out for yourselves.
CHAIRMAN WATKINS: Thank you, Mike.
Did you have a question?
MS. LJUNG: Does the RECS have questions
related to energy efficiency like type of insulation,
HVAC equipment, participation in demand side
management programs?
NEAL R. GROSSCOURT REPORTERS AND TRANSCRIBERS
1323 RHODE ISLAND AVE., N.W.(202) 234-4433 WASHINGTON, D.C. 20005-3701 (202) 234-4433
1
1
2
3
4
5
6
7
8
9
10
11
12
13
14
15
16
17
18
19
20
21
222
3456
44
MR. LAURENCE: Past RECS have, indeed,
included questions that deal with precisely those
issues. This iteration of the RECS does not. We've
been severely constrained essentially for budgetary
reasons as to how long the interview could be, and
unfortunately many things such as that we would like,
but we simply don't have the time to include them.
CHAIRMAN WATKINS: Dan.
MR. RELLES: Do these BLAISE programs
become complicated to read and understand? And do
you have a process in place to insure that you don't
have BLAISE programming errors in there? Because you
get the survey back in August and you might sort of
blow a whole section. So what do you do to kind of
make sure that that doesn't happen?
MR. LAURENCE: To answer the first
question, BLAISE is remarkably easy to use and to
program. If you can put up just real quickly Slide
-- let me find one -- 7, you'll see some of the code.
It reads like English. All right? A
variable name, "main heating fuel," is very clear
what that variable is, and it can be up to 240
NEAL R. GROSSCOURT REPORTERS AND TRANSCRIBERS
1323 RHODE ISLAND AVE., N.W.(202) 234-4433 WASHINGTON, D.C. 20005-3701 (202) 234-4433
1
1
2
3
4
5
6
7
8
9
10
11
12
13
14
15
16
17
18
19
20
21
222
3456

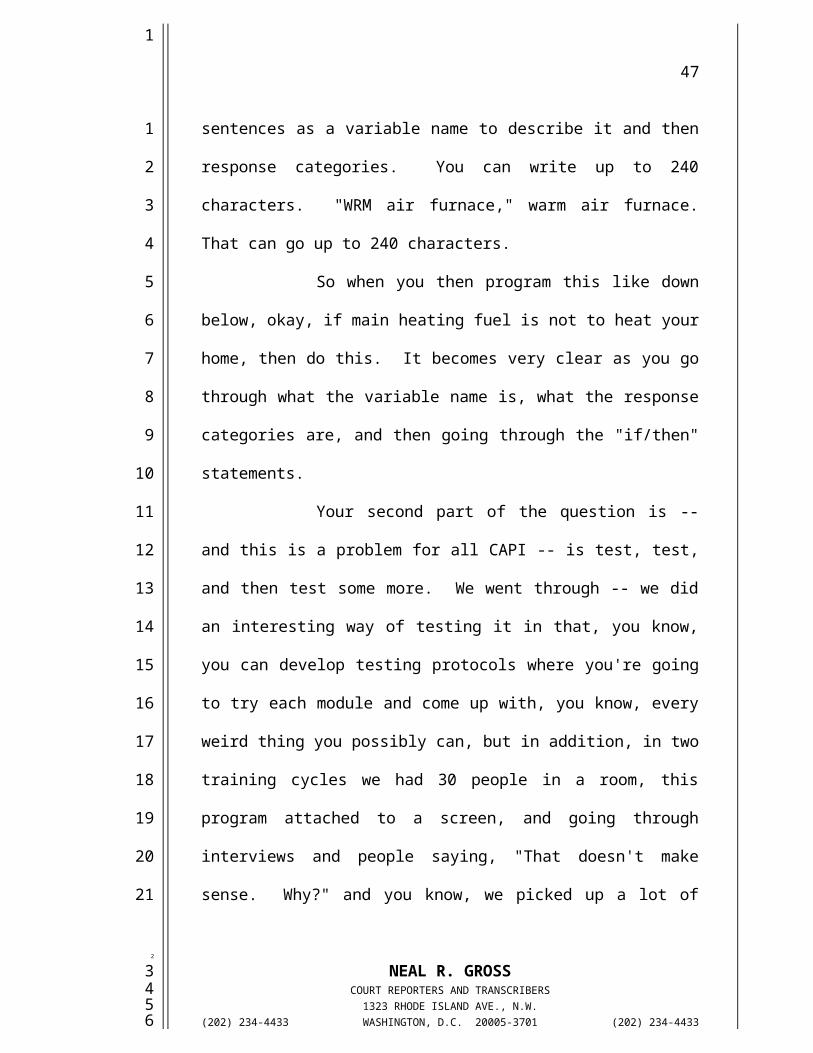
45
characters long. So you can literally write
sentences as a variable name to describe it and then
response categories. You can write up to 240
characters. "WRM air furnace," warm air furnace.
That can go up to 240 characters.
So when you then program this like down
below, okay, if main heating fuel is not to heat your
home, then do this. It becomes very clear as you go
through what the variable name is, what the response
categories are, and then going through the "if/then"
statements.
Your second part of the question is --
and this is a problem for all CAPI -- is test, test,
and then test some more. We went through -- we did
an interesting way of testing it in that, you know,
you can develop testing protocols where you're going
to try each module and come up with, you know, every
weird thing you possibly can, but in addition, in two
training cycles we had 30 people in a room, this
program attached to a screen, and going through
interviews and people saying, "That doesn't make
sense. Why?" and you know, we picked up a lot of
NEAL R. GROSSCOURT REPORTERS AND TRANSCRIBERS
1323 RHODE ISLAND AVE., N.W.(202) 234-4433 WASHINGTON, D.C. 20005-3701 (202) 234-4433
1
1
2
3
4
5
6
7
8
9
10
11
12
13
14
15
16
17
18
19
20
21
222
3456

46
erroneous skip patterns or things that just didn't
make sense or places where, you know, improvements
could be suggested. Well, maybe you want to put an
edit in here; maybe, you know, you want to take
something out.
So it is a problem in all of CAPI, and
we're satisfied that having gone through two sessions
of this kind of, you know, review, and then just
having worked with it, not only myself, but you know,
Westat having worked through it and, you know, going
through it over and over and RAC going through it
over and over again, and then having 100 interviews
conducted by seven different interviewers that, you
know, we've picked up everything that's reasonably
possible.
MR. RELLES: I guess you said you
budgeted a lot for the debugging process.
MR. LAURENCE: Yes.
MR. RELLES: I would urge you to
continue that. I would also say that the mere fact
that a line is English and 240 characters long does
not say it's good programming.
NEAL R. GROSSCOURT REPORTERS AND TRANSCRIBERS
1323 RHODE ISLAND AVE., N.W.(202) 234-4433 WASHINGTON, D.C. 20005-3701 (202) 234-4433
1
1
2
3
4
5
6
7
8
9
10
11
12
13
14
15
16
17
18
19
20
21
222
3456
47
MR. LAURENCE: Oh, that's correct, yes.
MR. RELLES: It depends on how many
lines you've got, but it also depends on how much
cross-referencing there is between the various
sections. You're saying that, okay, the interviewer
doesn't have to flip back and forth to the foldout
page, but if I'm like in the 500th line of code in
BLAISE and I've got to constantly refer back to lines
around 250 to figure out sort of what I'm working
with, that's not a very structured code and not easy
to debug either.
And I guess I don't have a sense of how
-- I understand each line is readable, but how
readable is the entire program, and in fact, can the
program be read by people such as yourself or is it
relegated down to a programmer level?
MR. LAURENCE: I'm not a programmer.
Okay? If you can program cross-tabulations in SAS
or, you know, a few "if/thens," maybe a few
calculations, you can do this.
The other thing about BLAISE which is
really neat is every time there's an "if" statement
NEAL R. GROSSCOURT REPORTERS AND TRANSCRIBERS
1323 RHODE ISLAND AVE., N.W.(202) 234-4433 WASHINGTON, D.C. 20005-3701 (202) 234-4433
1
1
2
3
4
5
6
7
8
9
10
11
12
13
14
15
16
17
18
19
20
21
222
3456
48
and it reaches the "end if" statement, it goes to the
very beginning of the questionnaire, the very
beginning, and goes through the entire questionnaire
doing edit and code checking to insure that, indeed,
it fits the logic.
It's a very seeming excruciating,
obviously, process, but every time there's an
"if/then" statement even if it's the last page of the
questionnaire, it goes back to the very beginning and
goes through again. It does a marvelous job of, you
know, picking up those kinds of logical
inconsistencies from module to module.
CHAIRMAN WATKINS: I think, Brenda, did
you have a comment and then Calvin? And then we'll
have to close it off so we can keep some kind of
semblance of time.
MS. COX: My question actually is
related to more what you might look for. You've done
the filing, and I wouldn't think that would be big
enough to see two effects that I'm kind of curious
about that you might look for in full-scale
implementation. These are nice things.
NEAL R. GROSSCOURT REPORTERS AND TRANSCRIBERS
1323 RHODE ISLAND AVE., N.W.(202) 234-4433 WASHINGTON, D.C. 20005-3701 (202) 234-4433
1
1
2
3
4
5
6
7
8
9
10
11
12
13
14
15
16
17
18
19
20
21
222
3456

49
The first thing is usually for our CADI
CAPI surveys, more for CADI where we've had so much
experience, and that is we generally say cost isn't
reduced over paper and pencil, but quality is, and
you're already saying clearly quality looks like
we're going to get a big improvement. Normally cost
isn't reduced because although the interviewer's task
is a little easier, the computer has to do some
things, and so there's a little bit of loss there.
But your interview looks so difficult to
do with this going back to the form, et cetera, that
it would seem like there would be wasted time where
the interviewer kind of tries to get oriented again,
and so there might be some minor cost improvements in
terms of the length of time to complete an interview.
So I was kind of curious about that.
That was the first thing, and then the second thing,
it occurs to me that you may have a potential here to
increase your overall response rate because, again,
the interviewer even starting the interview knows
they're going to do something which I would say is
difficult, to keep going back to this reference page
NEAL R. GROSSCOURT REPORTERS AND TRANSCRIBERS
1323 RHODE ISLAND AVE., N.W.(202) 234-4433 WASHINGTON, D.C. 20005-3701 (202) 234-4433
1
1
2
3
4
5
6
7
8
9
10
11
12
13
14
15
16
17
18
19
20
21
222
3456

50
and always keep that in mind.
So instead of focusing on what their
real job is, which is interact with respondent,
they're focusing on keeping all of these things in
mind and oriented, but with the computer doing that,
now they can focus on the human interaction back and
forth with the respondent.
And so it occurs to me that maybe it
might help with initial response by knowing that the
interview itself is going to be so much easier.
MR. LAURENCE: Your two points -- I've
been admonished talking about cost. I'll be very
careful.
There are lots of tradeoffs. The
consensus seems to be that when everything is said
and done, CAPI is not really cheaper than paper and
pencil. Indeed, one of these laptops rents for $60 a
month, okay, and there is an incredible amount of,
you know, serious programming behind it, and when I
say serious programming, I mean the folks at Westat
who are managing these 200 computers and managing the
case management system and the data coming in and
NEAL R. GROSSCOURT REPORTERS AND TRANSCRIBERS
1323 RHODE ISLAND AVE., N.W.(202) 234-4433 WASHINGTON, D.C. 20005-3701 (202) 234-4433
1
1
2
3
4
5
6
7
8
9
10
11
12
13
14
15
16
17
18
19
20
21
222
3456
51
out, and all of the stuff behind the scenes.
But, you know, in terms of an individual
interview, yeah, it does really reduce the burden on
the interviewer, as well as the respondent. As you
say, you know, an interviewer going back and forth,
you know, is struggling to keep this thing moving and
to keep a kind of rapport or a conversational flow
going with respondent, and you've got dead time.
If you've ever done a CADI interview,
you know that two seconds of quiet is like an
eternity, okay, for the respondent. Are you still
there? What's going on? Because they expect to
always be hearing something. They hear shuffling
back and forth.
Our interviewers who have worked on the
pilot study, but also others, tell us that
respondents really get into the computer and the
notion of it all, and ideally we imagine that the
respondent is sitting on one side of the table, the
interviewer sitting on the other, and he's reading
the questions, entering data. What we're discovering
is that often the interviewer will sit next to the
NEAL R. GROSSCOURT REPORTERS AND TRANSCRIBERS
1323 RHODE ISLAND AVE., N.W.(202) 234-4433 WASHINGTON, D.C. 20005-3701 (202) 234-4433
1
1
2
3
4
5
6
7
8
9
10
11
12
13
14
15
16
17
18
19
20
21
222
3456

52
respondent, and they kind of do it together.
And we're anticipating that it, indeed,
will reduce respondent burden, but hopefully -- and
we're not sure, but hoping -- that it will, indeed,
improve the rate of completed interviews, the number
of breakoffs, decline, and improve a response rate.
CHAIRMAN WATKINS: Calvin.
MR. KENT: Just two very fast questions.
Has there been any reduction in the amount of time
spent with the interviewee? In other words, can you
get through it faster?
MR. LAURENCE: We have not looked at the
data specifically, and we will be collecting --
MR. KENT: I mean did it used to take a
half hour and it now takes five minutes?
MR. LAURENCE: It's a bit confounded by
the fact that the interview in '93 was a lot longer
than this one, but we do have timers that will
actually time this, and we do have interview time
from the old one, and we will be able to
quantitatively make a comparison when we're done.
MR. KENT: So this year this RECS is
NEAL R. GROSSCOURT REPORTERS AND TRANSCRIBERS
1323 RHODE ISLAND AVE., N.W.(202) 234-4433 WASHINGTON, D.C. 20005-3701 (202) 234-4433
1
1
2
3
4
5
6
7
8
9
10
11
12
13
14
15
16
17
18
19
20
21
222
3456
53
shortly?
MR. LAURENCE: Manifestly shorter. Now,
we don't know to what extent CAPI versus paper and
pencil, all else being equal, will make a difference,
but I suspect --
MR. KENT: Well, this is a follow-up to
Brenda's question. You know about -- because you
could have significant savings or increased response
rates if you've got a person who's taking only half
as long to conduct the interview, and that would be
interesting.
The other thing is what interaction are
you all going to have with the data, if any, before
you receive it from your contractor?
MR. LAURENCE: For the preliminary data
set, none. Okay? We want to see, you know, that
first data set as it comes in. It's more for our
interest in terms of seeing how clean it is and
getting a sense of the magnitude of the post-field
data editing process, which I already know is going
to be dramatically reduced, but we're anxious to see
how much it's going to be reduced.
NEAL R. GROSSCOURT REPORTERS AND TRANSCRIBERS
1323 RHODE ISLAND AVE., N.W.(202) 234-4433 WASHINGTON, D.C. 20005-3701 (202) 234-4433
1
1
2
3
4
5
6
7
8
9
10
11
12
13
14
15
16
17
18
19
20
21
222
3456

54
I mean there are things in there I know
we have to edit on because I know that I didn't build
in edits into the BLAISE program because I decided
that we didn't want to turn this from an interview
into an interrogation, which is easy to do when you
have the opportunity to cross-reference and check
every question with every other question in the
interview. I mean you have our interviewers getting
thrown out the door.
MR. KENT: But I guess my main question
that I was driving at is how are you going to know
the things are going well until 14 days after it's
all over.
MR. LAURENCE: At any point we could
pull the data set down into a SAS data set.
MR. KENT: But you're not planning to do
that
MR. LAURENCE: We're not, but actually,
you know, I've resisted. I've worked on surveys in
CADI where, you know, I've pulled off data sets, you
know, at two-week interviews to take a look at, you
know, what the unweighted raw data looks like, and I
NEAL R. GROSSCOURT REPORTERS AND TRANSCRIBERS
1323 RHODE ISLAND AVE., N.W.(202) 234-4433 WASHINGTON, D.C. 20005-3701 (202) 234-4433
1
1
2
3
4
5
6
7
8
9
10
11
12
13
14
15
16
17
18
19
20
21
222
3456

55
guess it's a function of the past experience with
RECS. Well, you've got to wait until the end of the
field to keypunch it, and then you get a data set.
We could ask --
MR. KENT: Well, my recommendation to
you would be not to wait to the end --
MR. LAURENCE: Okay.
MR. KENT: -- and then I'll shut up so
we can --
MR. LAURENCE: No, that's a great
recommendation. No, that's very good, and I
understand completely what you're telling us.
MR. SKARPNESS: I've moved several
times, and I've gone through heat pumps and gas and
electricity and all kinds of different
configurations, and I dare say if you went to my
house on an interview of my wife right now and she
was asked, "What's heating this house?" she'd
probably just say electricity. Do you know what I
mean? She doesn't pay that bill. She doesn't worry
about that, has no part of it, but it's gas. Okay?
There's a gas furnace down there.
NEAL R. GROSSCOURT REPORTERS AND TRANSCRIBERS
1323 RHODE ISLAND AVE., N.W.(202) 234-4433 WASHINGTON, D.C. 20005-3701 (202) 234-4433
1
1
2
3
4
5
6
7
8
9
10
11
12
13
14
15
16
17
18
19
20
21
222
3456

56
So what checking have you done to sort
of determine if people -- you know, how they are
doing and the real error on the responses? You know,
they are sort of accurate to what? You know, their
perception of what is really going on in the house.
MR. LAURENCE: What you've described is
not an unusual occurrence. I mean, we run into all
the time with the RECS. The first thing we do with
the interviewers is they are trained to look around.
MR. SKARPNESS: Okay. Good.
MR. LAURENCE: Okay? Look around for
ducts in the walls or radiators under windows or --
MR. SKARPNESS: Yes, okay.
MR. KENT: -- baseboard thing.
MR. SKARPNESS: So it's a sanity check.
MR. LAURENCE: Yeah, and frequently
interviewers and respondents will develop a rapport
where they can go down into the downstairs and look
at the water heater, look at the furnace.
MR. SKARPNESS: Okay, good, good.
MR. LAURENCE: And gather the
information that way.
NEAL R. GROSSCOURT REPORTERS AND TRANSCRIBERS
1323 RHODE ISLAND AVE., N.W.(202) 234-4433 WASHINGTON, D.C. 20005-3701 (202) 234-4433
1
1
2
3
4
5
6
7
8
9
10
11
12
13
14
15
16
17
18
19
20
21
222
3456

57
Also, we can look at the actual
consumption and expenditures data and make
determinations on, well, gee whiz, they're not using
any natural gas in the winter or in the summer versus
the winter. So that must mean that, you know,
they're using natural gas and the size of the natural
gas usage is very large so that we can impute that
the gas is natural heat.
MR. SKARPNESS: Okay.
MR. LAURENCE: There are questions built
in here where --
MR. SKARPNESS: Well, you said something
about you were interviewing people on the porch.
MR. LAURENCE: That happens.
MR. SKARPNESS: And so I was wondering
are you really in there looking around or is that --
MR. LAURENCE: Well, sometimes yes,
sometimes no.
MR. SKARPNESS: Okay.
MR. LAURENCE: It really depends so much
on the willingness of the respondent and the kind of
rapport they develop with the interviewer.
NEAL R. GROSSCOURT REPORTERS AND TRANSCRIBERS
1323 RHODE ISLAND AVE., N.W.(202) 234-4433 WASHINGTON, D.C. 20005-3701 (202) 234-4433
1
1
2
3
4
5
6
7
8
9
10
11
12
13
14
15
16
17
18
19
20
21
222
3456

58
CHAIRMAN WATKINS: Thank you, Mike.
I must say that when you first referred
to eight days I thought this was the time it was
going to take to fill out that form.
MR. LAURENCE: Sometimes you wonder.
CHAIRMAN WATKINS: We'll take a quick
break. Before I do that, however, I want to get a
head count from the Committee for dinner this
evening. Who is coming?
David, that means yes?
MR. BELLHOUSE: Yes.
MR. LAURENCE: Okay. One, two, Brenda?
Three, four, Dan? Five, seven. Lynda, are you
coming? Okay. Eight, nine. Thank you.
So we'll take a break. Actually you're
going to be available to show --
MR. LAURENCE: Right. I'm going to pull
it out right now.
CHAIRMAN WATKINS: Pull it out right
now.
MR. LAURENCE: And anyone who would like
to.
NEAL R. GROSSCOURT REPORTERS AND TRANSCRIBERS
1323 RHODE ISLAND AVE., N.W.(202) 234-4433 WASHINGTON, D.C. 20005-3701 (202) 234-4433
1
1
2
3
4
5
6
7
8
9
10
11
12
13
14
15
16
17
18
19
20
21
222
3456

59
CHAIRMAN WATKINS: We'll take no more
than ten minutes.
(Whereupon, the foregoing matter went off the record
at 10:08 a.m. and went back on the
record at 10:22 a.m.)
CHAIRMAN WATKINS: Can we start the next
session, please?
The next presentation will be by Paul
Weir.
MS. WEIR: The title of the paper that I
provided is "The Use of a Variant of Poisson Sampling
to Reduce Sample Size in a Multiple Product Price
Survey." In house we call this Sample 2000.
In this presentation I'm first going to
give some background on the survey itself and its
coverage, talk about the current sample design, talk
about a motivation for a new design which we call
Sample 2000, talk about the design itself and
allocation, then go into the modification algorithms
that we did after testing some of the data and the
estimation methodology, talk about post-
stratification and adjustments, and then the use of
NEAL R. GROSSCOURT REPORTERS AND TRANSCRIBERS
1323 RHODE ISLAND AVE., N.W.(202) 234-4433 WASHINGTON, D.C. 20005-3701 (202) 234-4433
1
1
2
3
4
5
6
7
8
9
10
11
12
13
14
15
16
17
18
19
20
21
222
3456

60
implicit stratification and the design
implementation, and lastly talk about the actual
sample that was selected and how we're implementing
it.
The 782 survey is made up of two forms,
the 782(a), which is filed by all refiners and gas
plant operators, and the 782(b) form which is filed
by a sample of resellers and retailers.
The survey collects monthly sales prices
and sales volumes by state and sales type. The frame
for this survey is a survey conducted once every now
four years, the EIA 863, which is census of resellers
and retailers, and it also collects state level sales
volumes for which was eight target variables and in
the new design is ten target variables.
These variables include No. 2
distillate, which is broken down into residential,
nonresidential, and wholesale; gasoline, which is
broken down into retail and wholesale; and residual
fuel oil, which is broken down into retail and
wholesale.
The current sample design is based on
NEAL R. GROSSCOURT REPORTERS AND TRANSCRIBERS
1323 RHODE ISLAND AVE., N.W.(202) 234-4433 WASHINGTON, D.C. 20005-3701 (202) 234-4433
1
1
2
3
4
5
6
7
8
9
10
11
12
13
14
15
16
17
18
19
20
21
222
3456

61
trying to reach a target coefficient of variation
which we set at 15 percent for distillate volumes and
ten percent for the other volumes, residual fuel oil
and motor gasoline. Previous testings have shown
that this yields a one percent coefficient of
variation for price.
The past sample design was based on the
use of certainty companies and noncertainty
companies. The certainty companies included
refiners, who actually reported on the 782(a) form,
and multi-staters, five or more states, companies who
sell five percent or more in any of the target
variables, and other certainty companies who we found
were very important to specific end use categories in
the marketplace.
The noncertainty companies were
stratified for each of the eight target variables in
the past design, which were also at the state level.
In the last two years we added the propane, which
gave us the other target variables.
The sample is actually selected using a
process we call a joint link selection whereby we
NEAL R. GROSSCOURT REPORTERS AND TRANSCRIBERS
1323 RHODE ISLAND AVE., N.W.(202) 234-4433 WASHINGTON, D.C. 20005-3701 (202) 234-4433
1
1
2
3
4
5
6
7
8
9
10
11
12
13
14
15
16
17
18
19
20
21
222
3456

62
fill all of the allocations simultaneously. This led
us to nonindependent samples, and therefore, the
probabilities of selection that we used were
simulated using 1,000 sample selections.
The current sample was roughly 3,600 at
initiation time, but was quickly reduced to less than
3,000 active companies in our monthly survey.
The motivation for the new design was
the decreased budgets. We were forced to reduce our
survey operating costs. We felt that all operation
efficiencies had already been gained through previous
cutbacks, and the only thing left to do was actually
decrease the sample size.
A stretch goal was set of a company size
of 2,000, hence the name Sample 2000, by 1997, given
the survey resources. We were able to reach this
goal by choosing between elimination of products,
sales types, geographic detail, and/or increasing our
sampling error.
These goals were a reversal from our
previous approach, which was one of fixed sampling
error, and now we are looking at fixed sample sizes.
NEAL R. GROSSCOURT REPORTERS AND TRANSCRIBERS
1323 RHODE ISLAND AVE., N.W.(202) 234-4433 WASHINGTON, D.C. 20005-3701 (202) 234-4433
1
1
2
3
4
5
6
7
8
9
10
11
12
13
14
15
16
17
18
19
20
21
222
3456

63
Therefore, available resources were going to drive
our sample allocations in size rather than targeted
accuracy.
In order to look at our options, we
began by looking at Poisson sampling, and we actually
in Sample 2000 use a variation of Poisson. In
Poisson each frame unit is assigned a probability of
selection based on the proportional size of that
company in each of the cells, of which there are a
potential of 600, 60 geographic areas times ten
target variables, and a random number between zero
and one is assigned to each company. The unit is
sampled if the random number is less than the
probability of selection, a very simple design.
The disadvantage, however, is the sample
size is not fixed. We did look at three options to
reduce or eliminate the variability in the sample
size. The first option was collocated sample in
which units are randomly ordered and assigned a
random number, which is the order, the random number
order, minus X divided by the number of sample units.
In collocated sampling X is .5, the midpoint of the
NEAL R. GROSSCOURT REPORTERS AND TRANSCRIBERS
1323 RHODE ISLAND AVE., N.W.(202) 234-4433 WASHINGTON, D.C. 20005-3701 (202) 234-4433
1
1
2
3
4
5
6
7
8
9
10
11
12
13
14
15
16
17
18
19
20
21
222
3456
64
segment, the interval.
The smallest random number, therefore,
occurs between zero and one over N, the second random
number between one over N and two over N, et cetera.
These new uniformly distributed random numbers are
less likely to cluster towards zero or towards one,
and this is what reduces the sample size variability.
The second option that we considered was
the use of sequential Poisson sampling developed by
Ohlsson in 1995. This precisely controls the sample
size using order sampling, making use of the ratio of
the random number to the probability of selection and
choosing the first N units.
The third option is Pareto or odds ratio
sequential Poisson sampling developed almost
simultaneously by Rosen and Saavedra in 1996, which
was shown to be an improvement over Ohlsson's by
using that same ratio but subtracting from the
numerator and the denominator the random number times
the probability of selection, again, choosing the
first N. Rosen showed theoretically that this third
option was the best to class.
NEAL R. GROSSCOURT REPORTERS AND TRANSCRIBERS
1323 RHODE ISLAND AVE., N.W.(202) 234-4433 WASHINGTON, D.C. 20005-3701 (202) 234-4433
1
1
2
3
4
5
6
7
8
9
10
11
12
13
14
15
16
17
18
19
20
21
222
3456

65
The Sample 2000 design also included a
change in our certainty definition. We dropped our
previous requirement for multi-staters in order to
reduce individual company burden, as well as total
sample size. The reasoning was that if these
companies really were an important contribution to
the overall size, that opportunity would be covered
based on their volumes and coming in through with
their probabilities proportional to size. This
actually reduced the number of certainty companies by
30 percent.
Our probabilities of selection were done
through an iterative process. We set the initial
allocations using our current allocations. We then
calculated the probabilities as the company's
proportion in the cell times the allocation in the
cell, generated estimates in CVs. The initial
probability for each cell used 100 simulations and
volume estimates from 100 samples.
We examined our total sample size and
our coefficients of variation and then adjusted our
allocations.
NEAL R. GROSSCOURT REPORTERS AND TRANSCRIBERS
1323 RHODE ISLAND AVE., N.W.(202) 234-4433 WASHINGTON, D.C. 20005-3701 (202) 234-4433
1
1
2
3
4
5
6
7
8
9
10
11
12
13
14
15
16
17
18
19
20
21
222
3456

66
Our final algorithm included some
modification to both our allocation rules and our
probability rules. In our allocation rules, we
required that any reduction in allocation be less
than ten percent. We also required that an
adjustment, add one to all sales, so that if one sale
was being reduced, there was the potential that the
total sample size would actually be increased, and
this helped buffer that effect.
In testing, we also required that if the
probability were greater than .8, it would be reset
to a probability of 1.0, but when we actually
implemented the sample, we didn't need this
constraint anymore.
We did, however, still require that if
probabilities were less than .01, we would use .01.
Also if the probability was less than 1.0, which
meant they were noncertainty companies, we multiplied
that by a factor to guarantee that the sum of
probabilities equaled the sample size, and the paper
has that formula.
Using this design, we looked at our
NEAL R. GROSSCOURT REPORTERS AND TRANSCRIBERS
1323 RHODE ISLAND AVE., N.W.(202) 234-4433 WASHINGTON, D.C. 20005-3701 (202) 234-4433
1
1
2
3
4
5
6
7
8
9
10
11
12
13
14
15
16
17
18
19
20
21
222
3456

67
previous target CVs and estimated that in order to
produce the same accuracy we had in the past, but
given new frame data and also new targets for
propane, which we didn't have in the past, but we had
proxies from other standard errors from other
products, we found that we'd need a sample size of
roughly 3,200 companies.
In order to reach a sample size of
2,000, we relaxed the requirement on all states for
propane and found the 25 most important states, based
on their aggregate volumes from our frame and also
based on industry data by end use category, we were
able to lower our sample size for 2,000.
This type of design was what allowed us
to look at these various options across the products
and the CVs and the geographic areas to produce a
more efficient design.
The sample design that we currently have
in place makes use of a ratio estimator, which is the
sum of the weighted sample and volume weighted prices
divided by the sample weighted volumes. Our weights
are constant within the strata.
NEAL R. GROSSCOURT REPORTERS AND TRANSCRIBERS
1323 RHODE ISLAND AVE., N.W.(202) 234-4433 WASHINGTON, D.C. 20005-3701 (202) 234-4433
1
1
2
3
4
5
6
7
8
9
10
11
12
13
14
15
16
17
18
19
20
21
222
3456

68
Sample 2000, however, is not stratified,
but could be post-stratified after sample selection
with adjustments within strata for estimation
purposes. Our simulations in testing the data showed
that this post-stratification was effective. We,
therefore, used four strata to post-stratify in the
end. These were certainty companies, zero volume,
low volume, and high volume companies, separate for
each target and state.
The adjustments we considered within
strata were of two type appropriate for Poisson
sampling. The first was a sample expectation
adjustment where the weight was multiplied by the sum
of the probabilities of selection for all frame units
in the stratum divided by the sample size, and the
second was the population expectation adjustment
where the weight is multiplied by the size of the
frame for that stratum divided by the sum of the
sample unit weights which is just the population
estimate from the sample.
These adjusted rates, however, ran as
high as 340. So we then looked at trimming weights.
NEAL R. GROSSCOURT REPORTERS AND TRANSCRIBERS
1323 RHODE ISLAND AVE., N.W.(202) 234-4433 WASHINGTON, D.C. 20005-3701 (202) 234-4433
1
1
2
3
4
5
6
7
8
9
10
11
12
13
14
15
16
17
18
19
20
21
222
3456
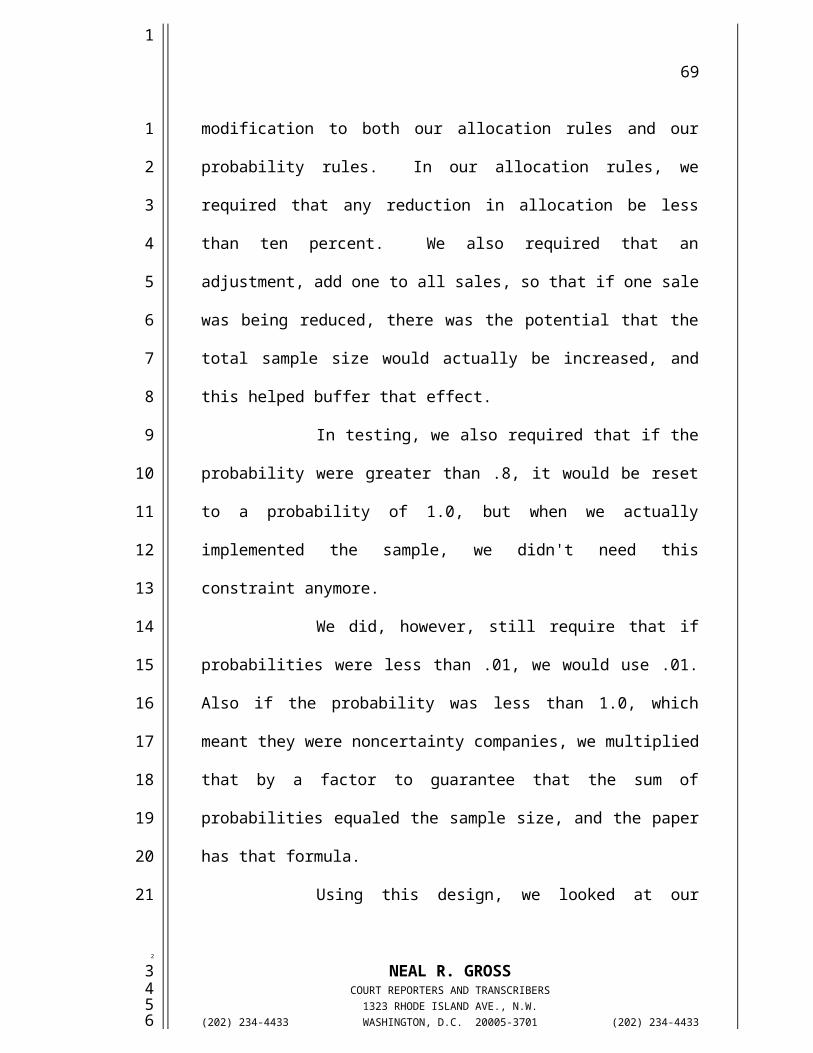
69
We looked at trimming weights to a maximum of 100
when the minimum probability was .005 and found that
it lowered our root mean square error.
Before selection, however, we looked at
the use of implicit stratification to spread our
noncertainty companies within states within those
urban and nonurban areas which we found in the past
can have some effect on price. Companies were
classified by urban status and assigned two random
numbers. The companies were ranked first by the
first random number, and then a third random number,
the permanent random number, was calculated as the
rank minus the second random number divided by N.
This, like the collocated sampling, guaranteed within
state and urban status a random number would occur in
each one over Nth interval.
At this point also we found out that by
setting the minimum probability to .01 rather
than .005 led to a maximum weight of 135, thereby
eliminating the need to trim weights, which we were a
little bit reluctant to do.
Sample 2000 is currently being
NEAL R. GROSSCOURT REPORTERS AND TRANSCRIBERS
1323 RHODE ISLAND AVE., N.W.(202) 234-4433 WASHINGTON, D.C. 20005-3701 (202) 234-4433
1
1
2
3
4
5
6
7
8
9
10
11
12
13
14
15
16
17
18
19
20
21
222
3456

70
overlapped with our current Sample 11, which we have
in place right now, for the January and February
reference month. In the reference month of March
we'll just be using Sample 2000.
It's also been the policy in this survey
to rotate 50 percent of our noncertainty companies
roughly on an annual basis. This sample design
enables these future rotations, and we've considered
so far three options for the future.
The first of these is the rotation of a
permanent random number by a fixed amount.
The second is a rotation by an amount
proportional to the probability of selection, and
this was motivated by the fact that smaller companies
are more likely to rotate out than large companies,
and we wanted to increase that likelihood according
to their probability of selection for the larger
companies.
And the third possibility for rotation
that we'll be considering so far is a combination of
that option and the reparameterization within the
implicit stratification.
NEAL R. GROSSCOURT REPORTERS AND TRANSCRIBERS
1323 RHODE ISLAND AVE., N.W.(202) 234-4433 WASHINGTON, D.C. 20005-3701 (202) 234-4433
1
1
2
3
4
5
6
7
8
9
10
11
12
13
14
15
16
17
18
19
20
21
222
3456

71
In addition, these future rotations have
potential that we hadn't had in the past that we
might be able to use a more gradual rotation more
frequently than on an annual basis with a smaller
amount being rotated.
And the last thing that we will consider
probably in our future rotations that we were not
able to this time was the use of Chromy's algorithm.
Oh, let me just finish one more thing.
The sample that we actually selected was 2,200
companies which we know will produce 2,000
operationally once deaths are accounted for. Of
these, roughly 700 are certainty companies, which was
equivalent to what we had had in the past in terms of
actual numbers, but not percent.
Simulations of the actual sample
selected showed that median coefficients of
variations across cells are one cent or under for all
products, except for one, nonresidential propane. We
felt, however, that because the data is published at
a less aggregated level than just total
nonresidential we'd break it down into commercial,
NEAL R. GROSSCOURT REPORTERS AND TRANSCRIBERS
1323 RHODE ISLAND AVE., N.W.(202) 234-4433 WASHINGTON, D.C. 20005-3701 (202) 234-4433
1
1
2
3
4
5
6
7
8
9
10
11
12
13
14
15
16
17
18
19
20
21
222
3456
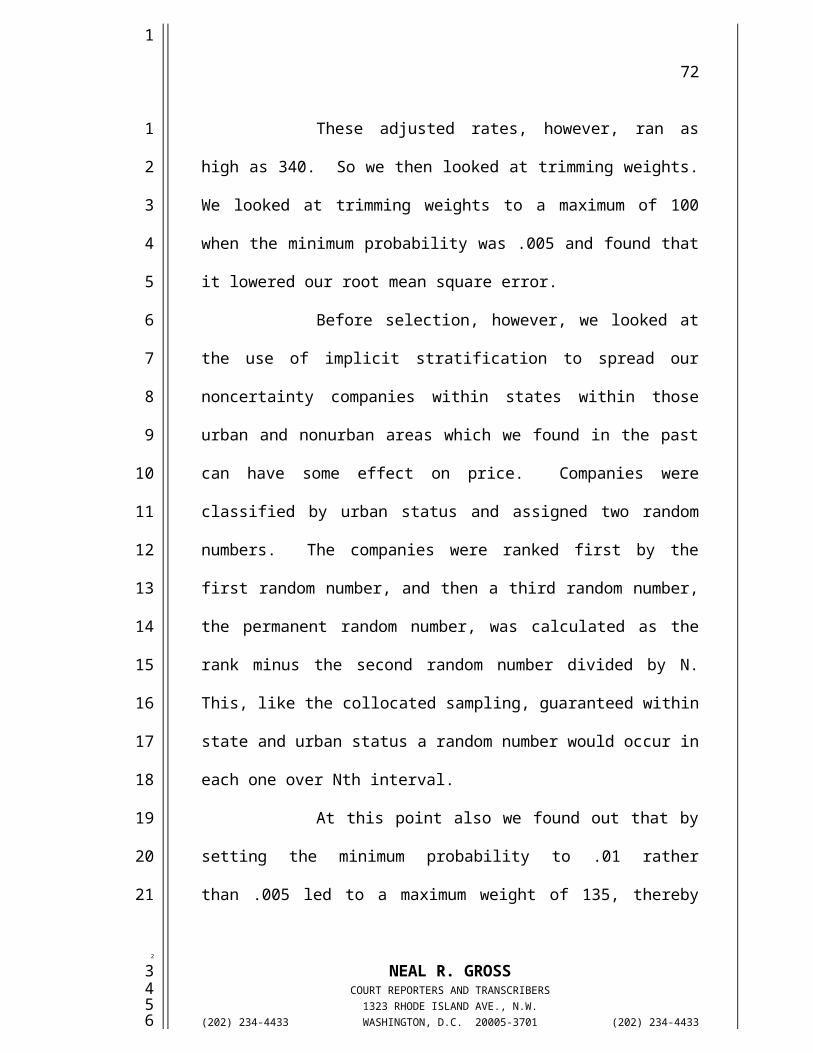
72
industrial, and other end use types, but because that
data will be more homogeneous, we'll actually produce
lower CVs than what we saw in our simulations.
We also found that we had individual,
nonsystematic product sales type cells that exceeded
the target by large amounts, but we found that when
we looked into these, these were due to differences
between sample reporting currently and frame
different. So they appeared to be reporting errors.
Because we can't predict where these
random reporting errors will occur in the future, we
decided to not over-select for those cells, that that
would not be efficient.
In summary, Sample 2000 design
originally started with Poisson sampling in order to
enable comparisons of and options in product sales
types and geographic detail, as well as standard
errors, which the current design did not enable us to
do because it was very labor intensive.
Poisson was found to actually reduce
sample size in and of itself. The only thing we had
to do was restrict the number of states in one
NEAL R. GROSSCOURT REPORTERS AND TRANSCRIBERS
1323 RHODE ISLAND AVE., N.W.(202) 234-4433 WASHINGTON, D.C. 20005-3701 (202) 234-4433
1
1
2
3
4
5
6
7
8
9
10
11
12
13
14
15
16
17
18
19
20
21
222
3456

73
product and redefine our certainty companies which
reduced our individual company burden. Our
simulation showed that median CVs met targets with
random large errors.
The one concern that we do have,
however, is that because we depended very much on
simulations to help prove our results, our
simulations are based on our frame data, and as our
frames become less frequently that will affect the
quality of our samples.
CHAIRMAN WATKINS: Thank you, Paula.
Now, we have two formal discussants from
the Committee. First we'll go with David Bellhouse,
and then following that we'll have Roy Whitmore.
MR. BELLHOUSE: I found this an
interesting and exciting topic to work on, having a
great deal of interest in sampling techniques. I had
a problem at the outset, which is probably my cause.
One, I felt I didn't get enough background
information on the sampling design that was there. I
felt as if I was jumping right into the middle of the
whole problem with the current paper that I got, and
NEAL R. GROSSCOURT REPORTERS AND TRANSCRIBERS
1323 RHODE ISLAND AVE., N.W.(202) 234-4433 WASHINGTON, D.C. 20005-3701 (202) 234-4433
1
1
2
3
4
5
6
7
8
9
10
11
12
13
14
15
16
17
18
19
20
21
222
3456

74
I consider it my problem in that I should have asked
for more background material, and I didn't start
reading the material until too late, until it was too
late to ask for the background material.
So some of the comments that I might
make may have been already answered in the current
talk, but there were a number of things I didn't
understand, and I'll just give some examples.
And the first is a quote right from the
paper, and my question is: is this a single frame or
a multiple frame survey? And the quote from the
paper is a company is selected for the same if any of
the CSUs are selected for any product. So is the
frame by product and you select on the product and
you then amalgamate by companies chosen?
And I wasn't clear on the inclusion
probability calculations that were made. There was a
lot of trial and error. I wasn't sure if there was
domain estimation and how it was used. There's a lot
of, it seems to me, stratification on state, but it
wasn't clear to me, again, from the description.
So all of these led me to wonder how the
NEAL R. GROSSCOURT REPORTERS AND TRANSCRIBERS
1323 RHODE ISLAND AVE., N.W.(202) 234-4433 WASHINGTON, D.C. 20005-3701 (202) 234-4433
1
1
2
3
4
5
6
7
8
9
10
11
12
13
14
15
16
17
18
19
20
21
222
3456

75
survey could be improved, but I wasn't sure because I
wasn't quite clear on the old sample design and the
proposed sample design.
One thing that did come to mind, one
thing that was mentioned was there were population
and sample expectation adjustments. Ken used what's
called a raking ratio estimator to improve the
efficiency, and again, it will depend on exactly how
the whole thing is set up, what kinds of data are
collected, and what kinds of population values you
have or what kind of population measurements are
available in order to do that sort of adjustment.
In the paper, it wasn't mentioned in the
presentation, but in the paper there was talk of the
use of permanent random numbers. In the background
papers, the use of one thing that these permanent
random numbers gave you was automatic rotation of the
sample, and if you used these permanent random
numbers, the rotation is random and uncontrollable,
and so I have a basic philosophical question also on
the permanent random numbers that might be used or
might be suggested, and that is after a few months of
NEAL R. GROSSCOURT REPORTERS AND TRANSCRIBERS
1323 RHODE ISLAND AVE., N.W.(202) 234-4433 WASHINGTON, D.C. 20005-3701 (202) 234-4433
1
1
2
3
4
5
6
7
8
9
10
11
12
13
14
15
16
17
18
19
20
21
222
3456

76
having this permanent random number, is the random
selection in the sample due to the random number or
is it due to the random variability and the size
variable?
And if it's the latter, then how is that
taken into account in terms of the inclusion
probability and the calculation of the sample
weights? So that also relates to the first slide.
Now, I want to go directly to this
consideration of Poisson sampling, and the reasoning,
at least what I saw as some of the major reasoning,
came right out of the background paper by Ohlsson,
and they have two quotes.
Ohlsson in the background paper says in
the literature there is an abundance of fixed size
PPS procedures. See Brewer & Hanif, for example, for
an overview, and then he says, "To the best of our
knowledge, none of these can be performed with this
PRN," the permanent random number, "since they are
not based on the use of individual random numbers,"
and goes on to say in another quote, "There are
efficient techniques of updating small PPS samples,
NEAL R. GROSSCOURT REPORTERS AND TRANSCRIBERS
1323 RHODE ISLAND AVE., N.W.(202) 234-4433 WASHINGTON, D.C. 20005-3701 (202) 234-4433
1
1
2
3
4
5
6
7
8
9
10
11
12
13
14
15
16
17
18
19
20
21
222
3456

77
mainly N equals one. See, for example, Keyfitz and
Kish and Scott. These procedures do not cover cases
with moderate or large N."
So one of the reasons Ohlsson was
suggesting this technique was it's an easy way to
update the size variables. The sample selection
procedure is by probability proportional to size. So
if the size measures are changing over time, you want
to be able to update the size measure to be able to
change the sample selection probabilities.
The response that I have to that
particular comment by Ohlsson is that perhaps there
is one, and that's the Rao-Hartley-Cochran method or
the random group method where the population is
divided at random into a number of groups, and then
within each group you select one unit at random
within the group by probability proportional to size,
and Rao of the Rao-Hartley-Cochran in another paper
said that since only one unit is selected from each
group, the well known Keyfitz method, which was on
the last slide, method of revising selection
probabilities can be applied to these random groups,
NEAL R. GROSSCOURT REPORTERS AND TRANSCRIBERS
1323 RHODE ISLAND AVE., N.W.(202) 234-4433 WASHINGTON, D.C. 20005-3701 (202) 234-4433
1
1
2
3
4
5
6
7
8
9
10
11
12
13
14
15
16
17
18
19
20
21
222
3456

78
which would develop noticeable changes in size
measurements of the Xs in the future without
affecting the selection of the remaining groups.
So there is another method of updating
the selection probabilities that's possible that
might be investigated.
Now, in general, in survey design and
estimation there are basically three methods, I
suppose, of improving efficiency. The first is to
change the sampling design, which is what's being
considered here: change to Poisson sampling. Then
for a given design, change the estimator that's been
used, and that was considered in the background
material of going to this ratio estimator under
Poisson sampling.
And the third is use covariates and
employ a regression or a ratio estimator, and it
seems to me that that latter area should be
investigated; that this is a monthly survey that has
lots of data, I presume. There's also lots of
auxiliary variables that should be around somewhere
that perhaps could be employed.
NEAL R. GROSSCOURT REPORTERS AND TRANSCRIBERS
1323 RHODE ISLAND AVE., N.W.(202) 234-4433 WASHINGTON, D.C. 20005-3701 (202) 234-4433
1
1
2
3
4
5
6
7
8
9
10
11
12
13
14
15
16
17
18
19
20
21
222
3456

79
You can get a ratio or regression
estimator. You can also use what Statistics Canada
has as the generalized estimation system to
automatically employ this, and my bet is that if
you're able to find a number of covariates and able
to do the use of the generalized regression estimator
that Sarndal has developed, then you could have
substantial improvement in efficiency by just using
the covariates rather than any other attempts at
changing the sampling design to improve efficiency.
And finally, my last comment is based on
the rotation. I wasn't quite clear on how much
rotation was desired and whether or not with the
rotation schemes if the classical methods of using
estimators based on previous months' data are used to
improve the efficiency of the estimate.
You have a large number of or a large
accumulation of monthly data that could be useful for
estimation on the current occasion, and how is this
used and how could it be incorporated?
So those are my basic comments.
CHAIRMAN WATKINS: Thank you, David.
NEAL R. GROSSCOURT REPORTERS AND TRANSCRIBERS
1323 RHODE ISLAND AVE., N.W.(202) 234-4433 WASHINGTON, D.C. 20005-3701 (202) 234-4433
1
1
2
3
4
5
6
7
8
9
10
11
12
13
14
15
16
17
18
19
20
21
222
3456

80
The next discussant will be Roy
Whitmore.
MR. WHITMORE: I think I found myself in
much the same boat as David in terms of grappling
with the paper and wishing I had a little more
detailed information or background information. It
wasn't entirely clear to me what I was trying to get
my hands around, and I ultimately decided maybe there
were some things that I saw there that I can comment
on that I thought were positive and some other
potential suggestions I could make of things that
might be investigated for future improvements in
design.
And maybe on that note, I think the sort
of thing that David was talking about in terms of
looking at ways of using covariates to improve the
efficiency of the estimation procedures may be a very
strong avenue for improving efficiency of the overall
estimates from the survey.
First of all, with regard to using
Poisson sampling as a particular probability
proportional to size method of sampling. It's
NEAL R. GROSSCOURT REPORTERS AND TRANSCRIBERS
1323 RHODE ISLAND AVE., N.W.(202) 234-4433 WASHINGTON, D.C. 20005-3701 (202) 234-4433
1
1
2
3
4
5
6
7
8
9
10
11
12
13
14
15
16
17
18
19
20
21
222
3456

81
clearly a very powerful and efficient design when you
have a size measure that's highly correlated with
what you're ultimately going to be estimating, and so
in this case it seemed like a very positive thing to
do where you have data on previous sales volumes and
you're trying to estimate future sales volume, that
probability proportional to size design like Poisson
sampling should be very efficient for that.
To the extent there are other things
being estimated, it may not be as highly correlated
with past sales volume. It might be a stratification
by size might be a compromise approach. I was
thinking of that in terms of estimating price and
volume. I wouldn't think that price would
necessarily be highly correlated with past sales
volume, but based on the results that they were
showing, it looked like they were getting sufficient
precision on price, but that was just a thought in
terms of kind of competing objectives of different
things being estimated, whether we should be sampling
companies with probabilities proportional to their
sales volume or using that as a stratification
NEAL R. GROSSCOURT REPORTERS AND TRANSCRIBERS
1323 RHODE ISLAND AVE., N.W.(202) 234-4433 WASHINGTON, D.C. 20005-3701 (202) 234-4433
1
1
2
3
4
5
6
7
8
9
10
11
12
13
14
15
16
17
18
19
20
21
222
3456

82
variable.
With regard to using the permanent
random numbers to facilitate sample rotation, I
thought I understood that, and I thought that that
was a reasonable way to go in terms of controlling
the rotation of the sample. There was a suggestion
in the paper of a way of doing that where the amount
of rotation was of the random number -- the rotation
of the permanent random number used in the PPS
sampling was proportional to the probability of
selection of the individual company, which caused the
larger companies to rotate in and out of the sample
more than they would otherwise. I thought that was
kind of a clever scheme that might be useful as well.
With regard to just determining the
probabilities of selection of the companies, if I
understood the paper correctly, which I'm not
absolutely certain I did, it sounded to me like they
were looking at the 600 cells based on 60 geographic
areas and ten different estimates that were desired
for each geographic area for each company, looking at
essentially what would be their expected frequency of
NEAL R. GROSSCOURT REPORTERS AND TRANSCRIBERS
1323 RHODE ISLAND AVE., N.W.(202) 234-4433 WASHINGTON, D.C. 20005-3701 (202) 234-4433
1
1
2
3
4
5
6
7
8
9
10
11
12
13
14
15
16
17
18
19
20
21
222
3456

83
selection in a PPS design with regard to that
particular stratum and estimate, and then essentially
taking the maximum over those 600 possible PPS
probabilities or expected frequencies of selection,
and then basically working with simulations to
determine how well that worked and modify those
probabilities of selection up or down until the
simulation showed the overall results were
essentially what was desired.
And I was thinking that maybe a
composite size measure approach could be used to
determine the initial frequencies of selection or
probabilities of selection, and to do that, you might
want to associate each individual company with a
stratum, and the paper wasn't clear to me about
stratification because at some point there's a
statement that the sample is not stratified, and yet
there is discussion of implicit stratification within
home states. Maybe that was just an overall implicit
stratification where the membership of the
urban/rural was determined separated within home
state.
NEAL R. GROSSCOURT REPORTERS AND TRANSCRIBERS
1323 RHODE ISLAND AVE., N.W.(202) 234-4433 WASHINGTON, D.C. 20005-3701 (202) 234-4433
1
1
2
3
4
5
6
7
8
9
10
11
12
13
14
15
16
17
18
19
20
21
222
3456
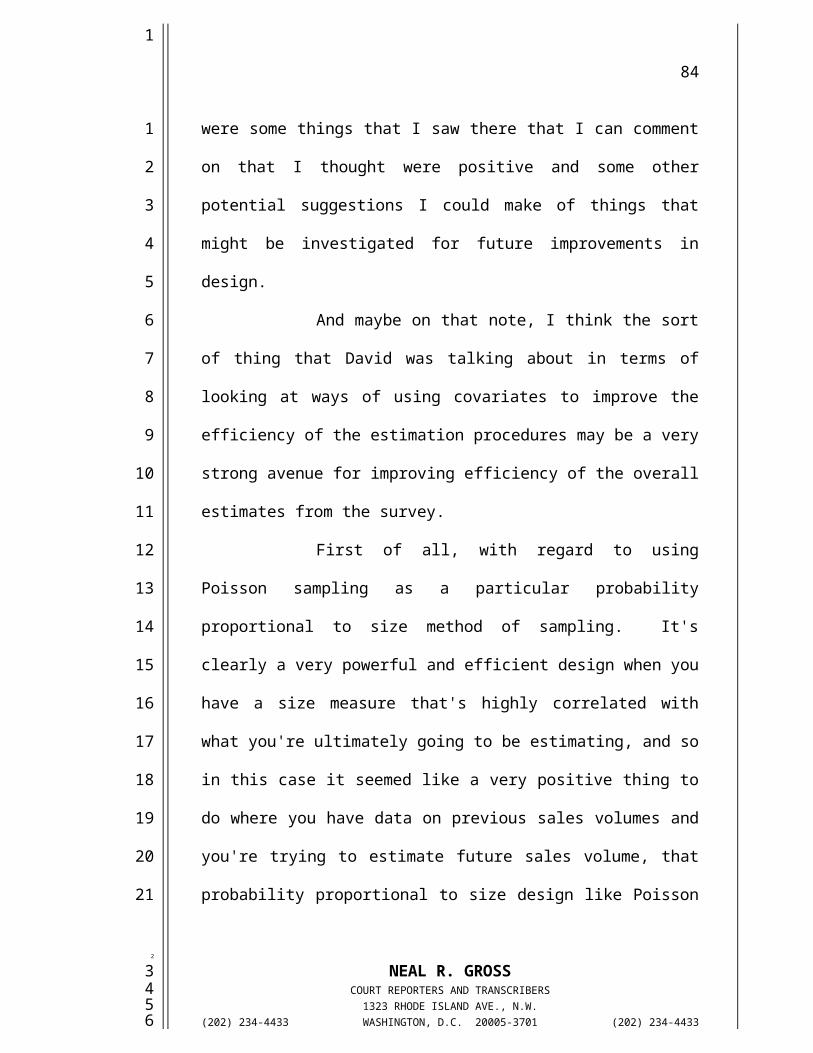
84
But given that the estimates that you're
ultimately trying to get precision on are for 60
geographic areas, it seemed to me that those 60
geographic areas or some strata based on those 60
geographic areas might be an efficient way to
stratify the sample and have a company associated
with a geographic area stratum based on its home
state, even though it has sales in other states which
may be other analysis domains.
So the company may, say, belong to the
Maryland stratum because it's home state is Maryland,
but it has sales in Maryland and Virginia and other
states, so it would contribute to the domain
estimates that are for other states, but it only
belonged to one home state.
So I worked out just a little bit of how
you might go about doing a composite measure of size
approach to setting probabilities of selection.
Assign companies to a strata based on their home
states, and basically the measure of size for a
company would be based on and the standard
probability proportional to size sort of thing where
NEAL R. GROSSCOURT REPORTERS AND TRANSCRIBERS
1323 RHODE ISLAND AVE., N.W.(202) 234-4433 WASHINGTON, D.C. 20005-3701 (202) 234-4433
1
1
2
3
4
5
6
7
8
9
10
11
12
13
14
15
16
17
18
19
20
21
222
3456

85
you look at all of the different domains and
estimates that that company is going to contribute to
and, you know, for an individual company, you know,
its measure of size would be the sales volume
associated with the frame report of the sales volume
for that company and the different type of
application across those 60 sales, the different
types of estimates.
And, you know, there would be basically
a size measure associated with each of those
different strata and analysis domains.
Let's look at this a second.
Anyway, it's kind of like in a
stratified sampling design or multi-stage sampling
design where you have lots of different estimates
that an individual is contributing to. You're
basically looking at the sampling rate for all of
those different things associated and multiplied by
the size or contribution of that individual company
to those, and basically calculate the frequencies,
the expected frequencies of selection for the
company, and from those identify the ones that would
NEAL R. GROSSCOURT REPORTERS AND TRANSCRIBERS
1323 RHODE ISLAND AVE., N.W.(202) 234-4433 WASHINGTON, D.C. 20005-3701 (202) 234-4433
1
1
2
3
4
5
6
7
8
9
10
11
12
13
14
15
16
17
18
19
20
21
222
3456

86
be certainties, and having identified the certainty
selections, then iterate, recalculate probabilities
of selection and come up with the final PPS
probabilities of selection.
So I'm not sure all of that -- again,
those details are important, but basically the idea
is rather than looking at all of these different
estimators and coming up with a frequency of
selection based on the 600 different cells and taking
the maximum over those, I think there's probably a
way of using composite measures of size that might
come up with a more efficient probability, set of
probabilities of selection for the companies.
CHAIRMAN WATKINS: Before I open up the
discussion to the Committee, first of all, Paula,
would you like to respond very quickly to any of
those comments?
MS. WEIR: I would like to respond to
some of them first, and then I've also invited the
co-author that I forgot to introduce, Pedro Saavedra,
to respond to some of the others.
A lot of our responses will be based on
NEAL R. GROSSCOURT REPORTERS AND TRANSCRIBERS
1323 RHODE ISLAND AVE., N.W.(202) 234-4433 WASHINGTON, D.C. 20005-3701 (202) 234-4433
1
1
2
3
4
5
6
7
8
9
10
11
12
13
14
15
16
17
18
19
20
21
222
3456
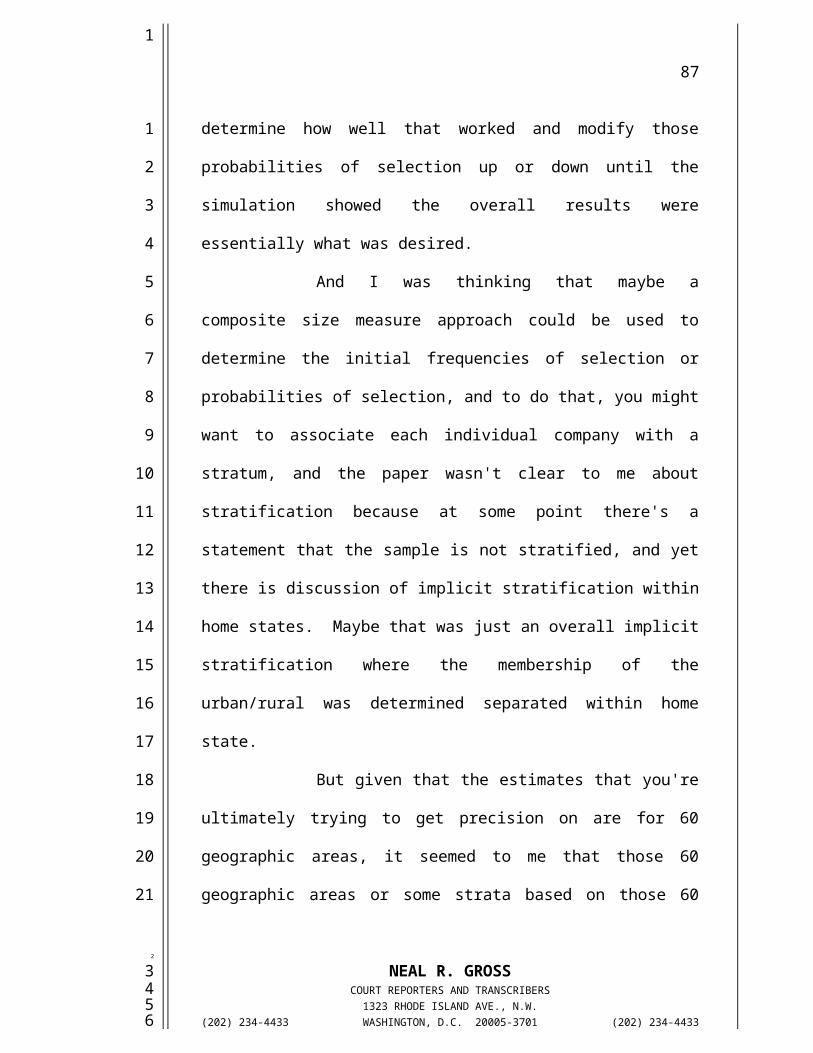
87
previous work we had done before this change in
sample design.
Sample 2000 is the 12th sample rotation
which are all looked at as new designs new
allocations, new selections that we've done. So a
lot of the ideas that we've heard we have looked at
in the past, and we did not incorporate in this
paper. I'd be glad to give you a number of
background papers, more Rosen and more Ohlsson.
And also Pedro did work a little bit
directly with Ohlsson. So I think some of the
concerns can be addressed there also.
I'd like to first sort of straighten out
some of the confusion about this 600 and how many
cells we have and the stratification.
When we multiply 60 geographic areas
times ten target variables, the target variables are
defined as the level of reporting coming from the
frame. It's very aggregated, nonresidential.
The actual publication and form are at a
much more detailed level. We don't ask them to
report nonresidential. We ask for commercial. We
NEAL R. GROSSCOURT REPORTERS AND TRANSCRIBERS
1323 RHODE ISLAND AVE., N.W.(202) 234-4433 WASHINGTON, D.C. 20005-3701 (202) 234-4433
1
1
2
3
4
5
6
7
8
9
10
11
12
13
14
15
16
17
18
19
20
21
222
3456

88
ask for industrial. We ask for farm. So it's much
more disaggregated.
We produce 60,000 cells monthly. So
when you look at regression estimators and things
like that, you may want to take that into account in
a monthly production cycle. It sort of changes the
world that we look at. We're not producing 600
estimates.
Some of the discussion about using
previous months' data we were actually looking at in
a different light. We're looking at trying to
produce more timely estimates, which is a whole
different topic, and using some other methods to do
that, but for the publication right now, it's
preliminary and final estimates. We haven't been
looking at that for our production cycle, but just
for early estimates.
Stratification. Our current sample
design is a stratified design by the size of the
company using its sales volume, which we use from our
frame. We do not have any price data available to us
in our frame, which would be the perfect world.
NEAL R. GROSSCOURT REPORTERS AND TRANSCRIBERS
1323 RHODE ISLAND AVE., N.W.(202) 234-4433 WASHINGTON, D.C. 20005-3701 (202) 234-4433
1
1
2
3
4
5
6
7
8
9
10
11
12
13
14
15
16
17
18
19
20
21
222
3456

89
In the new design what we looked at in
terms of stratification, which were described in the
paper and probably a little confusing because I've
reversed the order, we do implicit stratification,
and that was the distinction between how we spread
the companies within their urban or rural status.
This is to make sure that within a statement and
target variable we have coverage across that state
because we have learned that prices in an urban area,
depending on where you are, may be different than a
non-urban area and within those areas themselves.
So without having to define more
constrained strata, which would increase our sample
size, we have looked at this implicitly. We have
also done it explicitly in the past. In this design
we felt in order to control that sample size, we did
implicit stratification.
We did post-stratification. So the
implicit takes place before sample selection. The
post stratification is after sample selection, and
that was by size of the company. That was a part
that if they were certainty, that was one strata,
NEAL R. GROSSCOURT REPORTERS AND TRANSCRIBERS
1323 RHODE ISLAND AVE., N.W.(202) 234-4433 WASHINGTON, D.C. 20005-3701 (202) 234-4433
1
1
2
3
4
5
6
7
8
9
10
11
12
13
14
15
16
17
18
19
20
21
222
3456

90
zero volume, low or high volume.
So we did make use of stratification,
but it wasn't our primary design. Our primary design
was Poisson.
Some of the other areas I wanted to talk
about were single and multi-frame. We have one
frame, the 863. I defined that as my frame. It's
both a list frame and an attribute frame. On that
frame we have for each respondent they report by
state many products, and those products broken out by
end use category.
The frame is single, but the dimensions
come within the report itself on the frame, which are
more aggregate than the survey itself that we're
talking about. It then takes those, stays at the
same geographic level, but gives more detail to those
more aggregated sales type, like nonresidential
again.
I'll let Pedro discuss the domain ratio,
the domain estimate, and the raking ratio, and
permanent random numbers that he's done a lot of work
in, and also talk with Ohlsson about his paper.
NEAL R. GROSSCOURT REPORTERS AND TRANSCRIBERS
1323 RHODE ISLAND AVE., N.W.(202) 234-4433 WASHINGTON, D.C. 20005-3701 (202) 234-4433
1
1
2
3
4
5
6
7
8
9
10
11
12
13
14
15
16
17
18
19
20
21
222
3456

91
And what was the other area I wanted to
describe? Again, the covariates and regression we
are using for early estimates, and I think some of
the work we've done in the past looked at some of the
covariates. We've looked at cluster -- what are some
of the -- I'll let Pedro talk about those. We have
done some work in that area, too.
Rotation real quickly. How much is
desired? We try, and this is a function of other
things that go on like budgets and crises; we try and
rotate 50 percent of our noncertainty companies
annually, and we're on Sample 12, and this has been
since 1983. So sometimes that's a little bit out of
whack. We've had some samples that have gone on like
our current sample for almost two years because of
budget constraints.
It costs to overlap samples and do
rotations. So we had to sort of stretch our current
sample out.
So, Pedro, if you can address some of
those other things.
MR. SAAVEDRA: Well, first of all, I
NEAL R. GROSSCOURT REPORTERS AND TRANSCRIBERS
1323 RHODE ISLAND AVE., N.W.(202) 234-4433 WASHINGTON, D.C. 20005-3701 (202) 234-4433
1
1
2
3
4
5
6
7
8
9
10
11
12
13
14
15
16
17
18
19
20
21
222
3456

92
think one thing that we have to clarify, some of what
was done is what we were moving from, and ordinarily
I would talk about the weaknesses of the previous
design, except I was part of a team that designed it
in 1982. So I don't want to attack myself.
(Laughter.)
MR. SAAVEDRA: But in '82, we
encountered the problem of having companies each of
which reported for many products in many states and
the correlations between all of these variables, all
of these volume variables are very different.
Finally, what we came up with was the
idea, okay, do a stratified sample for each variable.
Select states, and then if anybody selected in any
state for any product, it's in the sample, and then
we had to do simulations in order to come up with
probabilities of selection.
Now, because we were using strata and so
forth, we often had more units being sampled because
we wanted a minimum per stratum and, you know, all
that sort of thing, and we had the problem of having
to simulate the probabilities.
NEAL R. GROSSCOURT REPORTERS AND TRANSCRIBERS
1323 RHODE ISLAND AVE., N.W.(202) 234-4433 WASHINGTON, D.C. 20005-3701 (202) 234-4433
1
1
2
3
4
5
6
7
8
9
10
11
12
13
14
15
16
17
18
19
20
21
222
3456
93
One of the things that drove this
particular change is that the same problems with the
same experimentations are being experienced in the
Department of Agriculture, and Phil Kott, if you have
attended any of the presentations, has been a co-
author of and has actually been using stuff, some
with parallels to this, some with parallels to the
old design, and in part, even though there was not a
single article that I could quote, it was some of the
work that they've been doing in that shop that
inspired this particular change.
So the original was how do we get all of
this different strata, all of these things that don't
correlate very highly and get good estimates for all.
Now, to clarify a few of the other
questions that have been asked, we did the post-
stratification separately by cell, target variable
cell. Okay? So we had a post-stratification for
residential fuel oil in Massachusetts, for example,
and we did that by taking the certainties as one
stratum. Those who in the frame appeared not to sell
resident fuel oil as a second stratum did a Dalenius-
NEAL R. GROSSCOURT REPORTERS AND TRANSCRIBERS
1323 RHODE ISLAND AVE., N.W.(202) 234-4433 WASHINGTON, D.C. 20005-3701 (202) 234-4433
1
1
2
3
4
5
6
7
8
9
10
11
12
13
14
15
16
17
18
19
20
21
222
3456

94
Hodges to come up with a boundary, and then did low
and high at that point.
There was a separate stratification done
for resale, fuel oil, a separate one for gasoline,
and so forth. Had we wanted to be doing modeling so
that we wanted a single weight and an estimate that
we could actually be doing or wanted to combine
things more, we would have done exactly what you
suggested we would have done, our raking, and you
know, we would have done, you know, to try to get a
single way. We saw that as being unnecessary because
what we were going to be doing is taking out
estimates one product at a time, you know, in one
place at a time, and therefore, we did not go into
that.
A question was asked about the implicit
stratification. If I have two domains, I'm going to
do a Poisson sample, and I'm going to assign random
numbers to those. I may want to insure that within
each domain the random numbers are uniformly
distributed all over in order to avoid any chance
elements that make them lower in one domain than in
NEAL R. GROSSCOURT REPORTERS AND TRANSCRIBERS
1323 RHODE ISLAND AVE., N.W.(202) 234-4433 WASHINGTON, D.C. 20005-3701 (202) 234-4433
1
1
2
3
4
5
6
7
8
9
10
11
12
13
14
15
16
17
18
19
20
21
222
3456

95
another, and that's essentially what we have done.
Had we, in fact, used those random
numbers to have selected an equiprobable sample and
used that procedure, we would have guaranteed
proportional selection from each one of the implicit
strata by this approach.
Since we're doing a PPS sample, we do
not guarantee it, but we at least control for
variants of the random numbers across the different
domains. That was the purpose of that implicit
stratification.
So, you know, some of these issues have,
indeed, come across. The problem of the multiple
states, multiple products has been one that has been
15 years in trying to be solved, and at least some of
the methods that, I mean, Coulter (phonetic) was
using of selecting -- oh, the probabilities. Let me
finish under the probabilities.
What we did essentially was, okay, I
take gasoline in Iowa. Okay. I have a volume
measure. I take the proportion of a volume. I have
an initial allocation. So I multiply that allocation
NEAL R. GROSSCOURT REPORTERS AND TRANSCRIBERS
1323 RHODE ISLAND AVE., N.W.(202) 234-4433 WASHINGTON, D.C. 20005-3701 (202) 234-4433
1
1
2
3
4
5
6
7
8
9
10
11
12
13
14
15
16
17
18
19
20
21
222
3456
96
by the proportion of the volume, and that is my
expectation, my probabilities that it could be
greater than one, for that company, its proportion of
gasoline that it sells in Iowa in that cell.
I then maximize my expectation across
all 600 cells. In most cases somebody would be
selling gasoline in one or two states and maybe three
or four cells that are non-zero. The others would be
zero, and that maximum is what defines the
probability of selection for that particular company.
We then used an iteration, very awkward,
and here's a confession. After we went through the
entire process, after we went through several methods
of trying to iterate to get an optimal solution, I
attended WSS conference in which somebody pointed out
a Chromy's algorithm in the free ware software that
since this produces could be applied to Poisson as
well as to stratified, at which point I went like
this and knew what I had to do for the next go-round
instead of doing iterations, you know, through
simulations since Chromy's algorithm should be able
to optimize those probabilities better than having to
NEAL R. GROSSCOURT REPORTERS AND TRANSCRIBERS
1323 RHODE ISLAND AVE., N.W.(202) 234-4433 WASHINGTON, D.C. 20005-3701 (202) 234-4433
1
1
2
3
4
5
6
7
8
9
10
11
12
13
14
15
16
17
18
19
20
21
222
3456

97
do it through simulation.
What we have done is valid. Okay? It
not necessarily yields the optimum most efficient
ones because we now have -- in my own defense, Sigmon
admitted that the software that they had put out does
not, in fact, make it clear that you can use it with
Poisson.
MS. WEIR: Also adding to that, that
same session at WSS, Phil was there, too, and was
quite surprised that Poisson was another application
of this because everybody was only thinking of it in
terms of stratified. So this was a real eye opener,
I think, for the whole Washington area and a lot of
future potential.
CHAIRMAN WATKINS: I'm now going to
throw it open to the Committee first of all.
David and then Brenda.
MR. BELLHOUSE: A couple of comments.
One is my idea on multiple frames is that if you
consider a state as a stratum, essentially you have a
frame. You have a frame for the whole population,
but it's now broken down by state. So if you sample
NEAL R. GROSSCOURT REPORTERS AND TRANSCRIBERS
1323 RHODE ISLAND AVE., N.W.(202) 234-4433 WASHINGTON, D.C. 20005-3701 (202) 234-4433
1
1
2
3
4
5
6
7
8
9
10
11
12
13
14
15
16
17
18
19
20
21
222
3456

98
companies within a state, you are going to get -- if
you sample within a state, you are going to get
companies selling within that state, but if you
sample in other states, you are going to get
companies selling in the state of interest.
So that essentially you have a multiple
frame situation when you focus on one state, so that
there are methods of essentially getting a multiple
frame estimator for the particular state, which may
be slightly different from what you're doing.
The next idea on using covariates, if
you have lots of small estimates and you're
aggregating, it seems to me that you want to use the
covariates to get good estimates with low
variability, or high efficiency if you want to call
it that. You want good estimates of the aggregated
values using covariates, and then you have other
estimates, and we're talking about 60,000 or
something estimates that you're getting that might
aggregate to the estimate that you have that you've
done with the covariates, and you want to do raking
ratio on that.
NEAL R. GROSSCOURT REPORTERS AND TRANSCRIBERS
1323 RHODE ISLAND AVE., N.W.(202) 234-4433 WASHINGTON, D.C. 20005-3701 (202) 234-4433
1
1
2
3
4
5
6
7
8
9
10
11
12
13
14
15
16
17
18
19
20
21
222
3456

99
CHAIRMAN WATKINS: Brenda.
MS. COX: Yes. I wanted to say before I
started that as sampling statisticians, we can't help
but say, "Did you ever think about this, or didn't
you think about this?" I mean it's impossible for us
not to say that.
But I think we should say from the start
that this is an extremely hard sample design
situation that you have to solve. The problem is
extremely difficult, and I'm really impressed with
the work you've done, and this requires both
difficult sample design work and difficult estimation
work, and so we should recognize this off the top.
This is one of the really, really hard problems you
have.
So given that, then I have to say, "But
did you consider?"
(Laughter.)
MS. COX: Now, one of the things Roy and
I were whispering about is which one of Chromy's
procedures were you talking about. It sounds like
it's the optimal allocation procedure.
NEAL R. GROSSCOURT REPORTERS AND TRANSCRIBERS
1323 RHODE ISLAND AVE., N.W.(202) 234-4433 WASHINGTON, D.C. 20005-3701 (202) 234-4433
1
1
2
3
4
5
6
7
8
9
10
11
12
13
14
15
16
17
18
19
20
21
222
3456

100
Yeah. Chromy also has a sequential
selection procedure that selects PPS samples that's
actually quite effective, and you can do some very
interesting implicit stratification. You can use it
with the composite size measure Roy was discussing,
and you might want to look at the idea of the
composite size measure.
The reason I suggest that is the problem
you were describing that Phil Kott was describing.
I'm more familiar with Phil's problem than with yours
because of having been a Fellow at NASS for a few
years, and I know the survey problem that he was
trying to solve, and I had recommended composite size
measures for that. Those chosen to use this
strategy.
I really think composite size measures
is an easier approach once you understand how the
composite size measure works.
Now, there's a paper by Potter and
Folsom in the proceedings of the Survey Research
Methods Section. I think you'll find it the late
1980s. If you can't find it, I could come up with a
NEAL R. GROSSCOURT REPORTERS AND TRANSCRIBERS
1323 RHODE ISLAND AVE., N.W.(202) 234-4433 WASHINGTON, D.C. 20005-3701 (202) 234-4433
1
1
2
3
4
5
6
7
8
9
10
11
12
13
14
15
16
17
18
19
20
21
222
3456
101
reference for you. I can give you a reference, but I
think you'll find it in the late 1980s.
I've used the composite size measure
approach before, and it's extremely effective. It
works when you have multiple things you have to
control for the same person, just exactly the problem
you have, and in essence what it allows you to do is
select these multiple samples, which is kind of what
you're doing, allocate for the multiple samples all
in one step via this composite size measure.
And so it's a very effective technique
that I would at least look at and see. You may be
too far along in this present design to consider it
here, but at least for other applications, it's an
extremely powerful technique that Roy and I know
about because Ralph Folsom at RTI developed it, and I
use it a lot, and other companies have started
adapting it.
And then I'm going to assume that you've
actually considered how you're going to handle growth
in companies because in such a difficult design, you
have to consider, well, how does growth and how does
NEAL R. GROSSCOURT REPORTERS AND TRANSCRIBERS
1323 RHODE ISLAND AVE., N.W.(202) 234-4433 WASHINGTON, D.C. 20005-3701 (202) 234-4433
1
1
2
3
4
5
6
7
8
9
10
11
12
13
14
15
16
17
18
19
20
21
222
3456

102
deaths affect the design, but since you've been
working with Ohlsson, I know you've got that squared
away.
MR. SAAVEDRA: Let me just first say I
have exchanged E-mails with Ohlsson, which is not
what I consider working with Ohlsson.
(Laughter.)
MR. SAAVEDRA: But one of the advantages
of this kind of a design is since we're using a
Poisson type of sample selection, then the
possibility of actually having between cycles, that
is, between the time when you have to do a completely
new selection or rotation; if new companies come to
our attention, one can actually do a straight
probability selection of the new companies that they
come in, as you figure out what would have been had
they been in the probability of selection; select
them with that probability; change the post-strata,
you know, by putting them in the proper place; and
you know, there you have it.
Then, you know, you allocate the random
number to them in the rotation. One of the things
NEAL R. GROSSCOURT REPORTERS AND TRANSCRIBERS
1323 RHODE ISLAND AVE., N.W.(202) 234-4433 WASHINGTON, D.C. 20005-3701 (202) 234-4433
1
1
2
3
4
5
6
7
8
9
10
11
12
13
14
15
16
17
18
19
20
21
222
3456
103
that we're trying to decide is exactly the method of
rotation vis-a-vis implicit stratification. That is
one of the things which we will face when we see how
much of a change there is in the frame for the next
rotation. That's always one of the questions.
We always update the frame from new
information that we get from different surveys, from
the 782 and the 821. So companies change size and
they die and so forth.
CHAIRMAN WATKINS: I have a couple of
questions myself.
The first one, I just wanted to be clear
on the range of products that you're looking at.
You're looking at gasolines and types of gasoline,
grades of gasoline, aviation gasoline, diesel, light
fuel oil, heavy fuel oils.
MS. WEIR: Just motor fuel oil.
CHAIRMAN WATKINS: Just motor fuel oil.
What is your source of price data for that? Do you
overlap with the collection of data on the consumer
price index? Are there economies there?
MS. WEIR: We've got a much longer in-
NEAL R. GROSSCOURT REPORTERS AND TRANSCRIBERS
1323 RHODE ISLAND AVE., N.W.(202) 234-4433 WASHINGTON, D.C. 20005-3701 (202) 234-4433
1
1
2
3
4
5
6
7
8
9
10
11
12
13
14
15
16
17
18
19
20
21
222
3456

104
house paper describing that. Our price collection or
the published prices we produce I mentioned probably
too quickly to catch. They're current volume
weighted average prices. They represent all sales in
that month, as opposed to the CPI has its fixed
market basket based on the consumer expenditure
survey back ten, 15 years ago.
So we are representing what we call the
price at which it cleared the market. That was what
people actually paid. That was what it was sold for.
So that was what people bought it at, as opposed to
the CPI, which, you know, all the controversies with
the CPI right now about having that fixed market
basket. We've always taken the opposite approach in
that we currently volume weight them.
So we overlap, you know, to the fact
that we collect prices. The CPI doesn't release data
at the level we do, state level data. They do have
some urban area prices. There are many differences.
Those are some of the key ones.
Is that what you meant with that CPI
part?
NEAL R. GROSSCOURT REPORTERS AND TRANSCRIBERS
1323 RHODE ISLAND AVE., N.W.(202) 234-4433 WASHINGTON, D.C. 20005-3701 (202) 234-4433
1
1
2
3
4
5
6
7
8
9
10
11
12
13
14
15
16
17
18
19
20
21
222
3456
105
CHAIRMAN WATKINS: I might have just
missed one thing. I understand the volume weighting.
My question was going back a step from that, the
actual price data you collect from all of these --
MS. WEIR: The suppliers, not the
consumers. CPI comes from the consumers, the end of
the market. We collect from the people that are
making the sale, not the buyers. We collect it from
the refiners, from the gas stations, the companies
that own the gas stations directly, the people
selling the residential heating oil, the wholesalers,
the big companies as opposed to RECS going around and
asking the individual consumers, "What did you pay?"
CHAIRMAN WATKINS: Okay. Let me get it
another way. Is the price gross of tax what the
consumer pays, what the final consumer pays or is it
the wholesale price, in effect?
MS. WEIR: It's what the price is to the
consumer, excluding taxes. So it's not a wholesale
price, but it excludes taxes.
CHAIRMAN WATKINS: So it's not the price
that the consumer actually pays, but it's the net of
NEAL R. GROSSCOURT REPORTERS AND TRANSCRIBERS
1323 RHODE ISLAND AVE., N.W.(202) 234-4433 WASHINGTON, D.C. 20005-3701 (202) 234-4433
1
1
2
3
4
5
6
7
8
9
10
11
12
13
14
15
16
17
18
19
20
21
222
3456
106
tax price. Okay. Thank you.
Any more questions from the Committee?
Oh, I didn't see you.
MS. COX: Roy and I were whispering
among ourselves because we realize that for a one
time only survey, the composite size measure really
would probably be a superior strategy to what you're
proposing, but it doesn't rotate. It's hard to
figure out how to rotate, and that's an important
part of your problem, is trying to reduce spread.
For Phil's problem, by the way, I don't
think they rotate. So it wasn't an issue, but for
yours, that rotation is a big deal, and the permanent
random number, the general approach you're using is a
good solution.
So I thought I'd clear that up.
CHAIRMAN WATKINS: Thank you.
MR. SAAVEDRA: One more clarification.
CHAIRMAN WATKINS: Would you speak into
the microphone?
MR. SAAVEDRA: The issue of when are you
doing this PPS with volumes, is that related to
NEAL R. GROSSCOURT REPORTERS AND TRANSCRIBERS
1323 RHODE ISLAND AVE., N.W.(202) 234-4433 WASHINGTON, D.C. 20005-3701 (202) 234-4433
1
1
2
3
4
5
6
7
8
9
10
11
12
13
14
15
16
17
18
19
20
21
222
3456

107
price? Well, we obtained a weighted price. That is,
we weigh the price each company reports by the volume
that it sells. For that reason we want to be
sampling the companies that sell more, and that is
why our entire PPS strategy is based on those
volumes.
Also, the frame has only volume
information. We did simulations by using the price
information of companies that have been sampled in
the past and then using regression shows them
attached at random simulations and so forth for the
simulations that we did.
CHAIRMAN WATKINS: Okay. I'd like to
throw it open to the floor. If you have any
questions, please identify yourself and the
affiliation for the reporter.
MR. GRAPE: Howdy. I'm Steve Grape.
I'm with the Dallas field office of EIA.
And having gone through budget cuts
ourselves and knowing what's involved, I feel your
pain.
(Laughter.)
NEAL R. GROSSCOURT REPORTERS AND TRANSCRIBERS
1323 RHODE ISLAND AVE., N.W.(202) 234-4433 WASHINGTON, D.C. 20005-3701 (202) 234-4433
1
1
2
3
4
5
6
7
8
9
10
11
12
13
14
15
16
17
18
19
20
21
222
3456

108
MR. GRAPE: I'd like to have your
opinion on how you feel this works to cover the loss
of the original survey. Is this, to use a Pentagon
term, is this acceptable losses or is it trying to
put a Bandaid on a bullet wound?
MS. WEIR: A loaded question, huh?
What we felt is that we did not give up
very much data, which was important, we felt, to our
overall price program and understanding how the
market works. We gave up a little bit, we feel, on
the accuracy of the data. How much we're not sure
until we actually get the data in and see how it
performs. We're hoping that it does have some
benefits, and if you have less data to process, maybe
you can do a better job at it, get at some of those
reporting problems.
That's one of our main concerns, is
nonreporting error or nonsampling error is a bigger
problem than any sampling error we've ever had.
Maybe this will help in that area. Maybe the quality
will go up.
But from an accuracy point of view and
NEAL R. GROSSCOURT REPORTERS AND TRANSCRIBERS
1323 RHODE ISLAND AVE., N.W.(202) 234-4433 WASHINGTON, D.C. 20005-3701 (202) 234-4433
1
1
2
3
4
5
6
7
8
9
10
11
12
13
14
15
16
17
18
19
20
21
222
3456

109
even on our targets, we're looking at median CVs.
Median CVs? I mean not ever CV is going to meet
those targets. So we know we're giving up a little
bit there, but we're controlling it, and at least we
know what we're getting or we expect to through our
simulations.
The other area that I also mentioned was
that because of the use of the previous data and the
frame, we're highly dependent on that frame data.
This has been my main concern throughout this whole
design.
We have always been because we
stratified, but it makes that frame data, which has
also gone through tremendous budget cuts -- used to
do a frame every three years. This is a very dynamic
marketplace. Now it's every four years. A lot of
companies are born, died, bought out, sell, and
everything in those four years. What effect that
will have on our actual sample estimates is not known
for sure because there is some risk.
Does that answer your question?
CHAIRMAN WATKINS: Yes, sir.
NEAL R. GROSSCOURT REPORTERS AND TRANSCRIBERS
1323 RHODE ISLAND AVE., N.W.(202) 234-4433 WASHINGTON, D.C. 20005-3701 (202) 234-4433
1
1
2
3
4
5
6
7
8
9
10
11
12
13
14
15
16
17
18
19
20
21
222
3456

110
MR. COFFEY: Jerry Coffey, OMB.
I'd like to make one comment on the
earlier presentation and particularly a couple of
questions that came up. It involves the whole issue
of how you review and manage and oversee the
development and execution of electronic survey
instruments.
There are, in fact, several agencies now
that are taking a look at this because lots of
statistical agencies are getting into this kind of
work. The early look that they took really was
driven by the frustration of managers who felt --
some of them felt they were having to become
programmers to find out what their staff were doing.
We got into it because we also have an
obligation to review these instruments when they come
into OMB during the clearance process.
But the most important consideration
which may be driving this a lot farther than people
anticipated is what I call the sunshine provisions in
the 1995 Paper Work Reduction Act. That law, the way
it was amended in '95, now gives the public a right
NEAL R. GROSSCOURT REPORTERS AND TRANSCRIBERS
1323 RHODE ISLAND AVE., N.W.(202) 234-4433 WASHINGTON, D.C. 20005-3701 (202) 234-4433
1
1
2
3
4
5
6
7
8
9
10
11
12
13
14
15
16
17
18
19
20
21
222
3456

111
to look at what an agency is doing. It imposes a
responsibility on the agency to present it to the
public in such fashion that the public can reasonably
understand what they are doing and offer comments.
In the past with paper survey forms, you
simply put something in a Federal Register notice
saying, "If you're really interested, we'll send you
a copy of the form, and if you want to give us any
comments on it, that's fine."
What do you do now? They're talking to
us about, "Could you guys live with a disk and run it
on your computers and, you know, play around with it
for a while and decide whether or not we did it
right?" And actually, you know, a lot of my
colleagues say, you know, that really takes too much
time. We'd like something better than that.
We have asked these agencies now to take
a look at a much broader approach. Essentially try
to develop some software engineering tools that will
translate these electronic instruments into more
human readable, human understandable form, first, for
the benefit of the managers who would like to be able
NEAL R. GROSSCOURT REPORTERS AND TRANSCRIBERS
1323 RHODE ISLAND AVE., N.W.(202) 234-4433 WASHINGTON, D.C. 20005-3701 (202) 234-4433
1
1
2
3
4
5
6
7
8
9
10
11
12
13
14
15
16
17
18
19
20
21
222
3456

112
to look at something, and essentially it's another
way of testing what the staff has done; for the OMB
reviewers, simply to cut down on the amount of time
that we have to spend on something if they can come
up with some tools that capture a good bit of what is
in the electronic instrument itself; but ultimately
this is really needed to satisfy the public.
And I told them, you know, you've really
got to produce some things that the average reader of
the Federal Register can understand. You can't just
say, "Well, I'll give you a disk, and then you're
entitled to comment on it if you've got some way of
turning this disk into something useful to us."
It's a serious problem, and several
agencies are working very hard on it right now. It's
something that, I suppose, is getting a lot of
attention in the software industry generally, but
it's a very important one for the statistical system,
and those were very incisive questions that I heard
this morning on this issue.
CHAIRMAN WATKINS: Do you have any
comments?
NEAL R. GROSSCOURT REPORTERS AND TRANSCRIBERS
1323 RHODE ISLAND AVE., N.W.(202) 234-4433 WASHINGTON, D.C. 20005-3701 (202) 234-4433
1
1
2
3
4
5
6
7
8
9
10
11
12
13
14
15
16
17
18
19
20
21
222
3456

113
MS. WEIR: No, because we don't have any
CAPI. We do have some CADI ourselves, but Lynda
could probably address this better under her old hat
than I could.
I have heard of the problems that BLS is
going through and the struggles with OMB about using
forms.
MS. CARLSON: Actually under both hats.
What we are considering doing, Jerry, is to put all
of our Federal Register notices and questionnaires up
on a Web site so that the public can also access them
as well, and that's an alternate way of looking at
it.
CHAIRMAN WATKINS: Thank you.
I think we'll close this session and now
ask Jay Hakes, Administrator, for his opening
remarks.
Oh, sorry, Roy. I didn't see you there.
MR. WHITMORE: Could I make one final
clarification on the ongoing discussion here about
the composite size measure and PPS sampling?
I think you could use composite measures
NEAL R. GROSSCOURT REPORTERS AND TRANSCRIBERS
1323 RHODE ISLAND AVE., N.W.(202) 234-4433 WASHINGTON, D.C. 20005-3701 (202) 234-4433
1
1
2
3
4
5
6
7
8
9
10
11
12
13
14
15
16
17
18
19
20
21
222
3456

114
of size to determine the initial probabilities of
selection and then select them using the Poisson
method rather than using the Chromy's algorithm for
the PPS samples.
MR. HAKES: Good morning. I apologize
that I have had several other engagements that have
distracted me.
As you're aware, we have a new Secretary
of Energy, Frederico Pena, and his intent is to meet
with the Energy Resources Board when they get
together, which we have never had a Secretary of
Energy do that, and this morning was our first
meeting. So I felt I needed to be there, and he has
another meeting tomorrow morning that I must attend.
However, my meeting with the Senate
Appropriations Committee this afternoon has been
postponed. So I fortunately will be able to be here
most of the afternoon.
Since we last got together there have
been a number of interesting developments, and I'll
just try to hit on a few that I think are
particularly critical. One is that the Director of
NEAL R. GROSSCOURT REPORTERS AND TRANSCRIBERS
1323 RHODE ISLAND AVE., N.W.(202) 234-4433 WASHINGTON, D.C. 20005-3701 (202) 234-4433
1
1
2
3
4
5
6
7
8
9
10
11
12
13
14
15
16
17
18
19
20
21
222
3456

115
the Office of Statistical Standards, Yvonne Bishop,
has retired. She retired rather quickly on us, and
we tried to do the appropriate number of parties and
whatever before she left, but she is now, I think,
probably vacationing somewhere.
Most of you know Yvonne, who has been a
very distinguished statistician, a very visible
person within the academic community and in
government and has contributed a lot to our
statistical standards over the years, and we're going
to miss her.
The new Director of the renamed office,
temporarily named Methods and Statistical Group but
changed to Statistical and Methods Group, is headed
by Lynda Carlson. Lynda is someone who's also very
visible and active within the discipline. She's been
a very active ASA member, has put together many
panels and groups within that area, and I think
you'll enjoy talking to Lynda. I think she's going
to play a very dynamic role for us in this area.
One other personnel change. I think
many of you know Nancy Kirkendall, who recently was a
NEAL R. GROSSCOURT REPORTERS AND TRANSCRIBERS
1323 RHODE ISLAND AVE., N.W.(202) 234-4433 WASHINGTON, D.C. 20005-3701 (202) 234-4433
1
1
2
3
4
5
6
7
8
9
10
11
12
13
14
15
16
17
18
19
20
21
222
3456

116
Vice President of the ASA, was stolen from us by the
Office of Management and Budget. Nancy made a great
contribution to our office and is making a great
contribution at OMB also. We miss her, but we
understand.
She's working on some things like the
evaluation of welfare reform over there and other
things that are, you know, critical, and that is a
major position in the statistical community, that
position over at the Office of Statistical -- what?
MR. COFFEY: Statistical Policy.
MR. HAKES: Statistical Policy Office.
Thanks, Jerry.
So these are all major changes, and I
think you'll enjoy working with Lynda.
Now, in appropriations I always give a
little report on appropriations. Just for those of
you who want a little history, in fiscal year 1994,
we had a budget of $85 million. We got caught in
some last minute machinations in Congress in next
year's budget, and that was cut to $72 million. That
was a very traumatic time for all of us.
NEAL R. GROSSCOURT REPORTERS AND TRANSCRIBERS
1323 RHODE ISLAND AVE., N.W.(202) 234-4433 WASHINGTON, D.C. 20005-3701 (202) 234-4433
1
1
2
3
4
5
6
7
8
9
10
11
12
13
14
15
16
17
18
19
20
21
222
3456

117
The following year, for fiscal year '97,
which is the year that we're in now, the
administration recommended a slight decline down to
$71 million, and that was approved by the Congress,
and this year the administration is requesting $68
million, which is a cut of three, and my guess is
that the Congress will approve that. I think they
probably would have approved more than that.
But we are still early in that process.
So there are no guarantees, but I think we have over
the last year or two established closer relations
with many of the members of Congress.
I've been particularly sensitive to
members who are strong supporters of the National
Endowment for the Arts and the National Endowment for
the Humanities because in the Interior appropriation,
that's often the kind of struggle. Most of the
energy elements in the budget never want to take
money from EIA. They know better, but those other
areas sometimes see us as a target, and they have a
whole different constituency. So they don't hear
complaints as much, but they will now, and so I think
NEAL R. GROSSCOURT REPORTERS AND TRANSCRIBERS
1323 RHODE ISLAND AVE., N.W.(202) 234-4433 WASHINGTON, D.C. 20005-3701 (202) 234-4433
1
1
2
3
4
5
6
7
8
9
10
11
12
13
14
15
16
17
18
19
20
21
222
3456
118
we're in pretty good shape on the congressional side.
This has all sorts of ramifications.
For fiscal year '95, we had 460 federal employees.
By this October, we are committed to be down to 396,
a drop of 64 federal employees. The number of
contract employees has dropped from 494 in fiscal
year 1995 to 244 estimated for 1998. In other words,
we have less than 50 percent of the number of
contract employees that we had in 1995.
This has obviously been a difficult
situation. I think that EIA has responded very
aggressively to this challenge, and you've been part
of the discussions on much of this in trying to work
as smartly as we can to utilize technology as well as
we can and to be just generally as efficient as we
can.
This is only an educated guess because
the appropriations process is an annual process and
filled with all sorts of traps and difficulties, but
I do think we will get our request this year, and I
think we will get more support in the administration
next year, and I think the chances for further cuts
NEAL R. GROSSCOURT REPORTERS AND TRANSCRIBERS
1323 RHODE ISLAND AVE., N.W.(202) 234-4433 WASHINGTON, D.C. 20005-3701 (202) 234-4433
1
1
2
3
4
5
6
7
8
9
10
11
12
13
14
15
16
17
18
19
20
21
222
3456

119
have been somewhat diminished, but we'll have to see.
And we must be careful as we go through
this that we are able to maintain quality. There are
a lot of tough judgments. There is the judgment of
coverage, and sometimes your coverage versus quality,
your ability to analyze the data and actually make it
useful to the people that use it.
So these are things that we're wrestling
with, and to the extent you can help us wrestle with
them, that'll be very positive.
As part of the effort to kind of work
smarter and at the same time provide better service
to our customers, we have some momentum going with
the Office of Statistical Policy at OMB in getting
the federal statistical agencies to work closer
together.
We have a Council on Statistical Policy
that is made up of the agency heads of the federal
statistical agencies, and we've been looking for
opportunities to cooperate, and I would say in the
last few months these efforts have picked up some
steam and seem to have a little bit more momentum
NEAL R. GROSSCOURT REPORTERS AND TRANSCRIBERS
1323 RHODE ISLAND AVE., N.W.(202) 234-4433 WASHINGTON, D.C. 20005-3701 (202) 234-4433
1
1
2
3
4
5
6
7
8
9
10
11
12
13
14
15
16
17
18
19
20
21
222
3456

120
than they had initially.
Part of this was a statement by the new
Director of the Office of Management and Budget,
Franklin Raines, that he felt that we should operate
as a virtual statistical agency. In other words, we
didn't need to take all of the statistical agencies
and put them together in one super organization, but
from the standpoint of the user of federal
statistics, they shouldn't have to know what agency
collects what statistics, and as a user of the
statistical system itself over his career, I think he
had a good insight there, and it's one that we have
tried to be responsive to.
One of the fruits of these efforts is
that on probably April 30th -- I don't know if that
date is fixed, but somewhere around that time -- we
will be announcing a new Web site called FEDSTATS,
and you can reach it by just typing www.fedstats.gov.
This is a server located at the Census Bureau, and
basically what this is at this point is a front end
for the Web sites that the statistical agencies
already have.
NEAL R. GROSSCOURT REPORTERS AND TRANSCRIBERS
1323 RHODE ISLAND AVE., N.W.(202) 234-4433 WASHINGTON, D.C. 20005-3701 (202) 234-4433
1
1
2
3
4
5
6
7
8
9
10
11
12
13
14
15
16
17
18
19
20
21
222
3456

121
You can ask, you know, what's the value
added to that. I can find these things with search
functions and whatever. I think there is quite a bit
of value added. One is it makes it clear to the
public and the general user that there are federal
statistics out there and also that these statistics
may be qualitatively different from other statistics
that are floating around on the Web, some of which
probably are statistics only in a rough
approximation.
And so we want to publicize this in the
academic community with the general public, that
these statistics are there.
Also, I think, you know, it will add
some modicum of improvement in the ease of using the
statistics and moving back and forth, and I think,
thirdly, it will encourage us to look for cross-
referencing ourselves. There may be ways in which we
can get our definitions to be more commonly defined.
Common use is a computer code. There's a lot of
things that one could imagine would happen out of
this project.
NEAL R. GROSSCOURT REPORTERS AND TRANSCRIBERS
1323 RHODE ISLAND AVE., N.W.(202) 234-4433 WASHINGTON, D.C. 20005-3701 (202) 234-4433
1
1
2
3
4
5
6
7
8
9
10
11
12
13
14
15
16
17
18
19
20
21
222
3456

122
We've seen that happen somewhat within
the EIA where the Web has sort of demonstrated the
need for us to be as seamless as possible in the way
we present data to the user. The user shouldn't have
to know what person or what part of the organization
is producing data. They should be able to access it
topically rather than organizationally.
So we are making efforts in that area,
and you might even type that URL right away. You
probably might even find it there already. I don't
know.
So I think that's something that you'll
want to follow, and we'll keep you up to date on.
The other thing I try to do is give you
sort of a feeling of where we are in terms of overall
performance, and I think you're getting our
performance measures. We'll pass those out.
We are actually a pilot project under
the Government Performance and Results Act of 1994,
which is an effort to bring strategic planning and
performance measures to all federal agencies.
Now, let me say that we would be doing
NEAL R. GROSSCOURT REPORTERS AND TRANSCRIBERS
1323 RHODE ISLAND AVE., N.W.(202) 234-4433 WASHINGTON, D.C. 20005-3701 (202) 234-4433
1
1
2
3
4
5
6
7
8
9
10
11
12
13
14
15
16
17
18
19
20
21
222
3456

123
this whether that law had passed or not, and we had
started working on these things before the law was
passed, but if you're interested in how agencies are
doing this in the studies of these pilot studies,
it's available on the Web site of the National
Performance Review, sometimes known as "reinventing
government," and we're there.
But one of the nice things about these
statistics is every time you come back from a meeting
or you want to see how we're doing on some factor, in
many cases there will be a measure that has a nice
graph that shows you how we're doing. Many of these
are derived from surveys of our customers. Those are
what we would call the lagging indicators of how
we're doing, and the leading indicators are things
like how are we doing on timeliness, how are we doing
on accuracy, the things that are eventually going to
make our customers happy.
And I thought I would just talk for a
moment about some of the dissemination aspects of
this because there are performance measures on that,
and it's something that we've put some effort into
NEAL R. GROSSCOURT REPORTERS AND TRANSCRIBERS
1323 RHODE ISLAND AVE., N.W.(202) 234-4433 WASHINGTON, D.C. 20005-3701 (202) 234-4433
1
1
2
3
4
5
6
7
8
9
10
11
12
13
14
15
16
17
18
19
20
21
222
3456

124
the last couple of years.
I noticed this morning that we're in the
Lewis and Clark Rooms. I think this one is named
after William Clark, and I assume the other one is
named after Meriwether Lewis, the people who led the
expedition across the United States and first to
reach the West Coast by land back in the early part
of the 19th Century.
A friend of mine, Steve Ambrose, wrote a
recent book about that that actually reached the best
seller list, and the book makes a very good point out
dissemination because when Meriwether Lewis was on
this trek to the West Coast, he kept very meticulous
notes on all the new plants that he had discovered,
and he discovered many new plants that had never been
reported in the literature before, many animals that
had never been recorded in the literature before, and
of course, he made all sorts of geographical
discoveries.
And when he got back, there was a lot of
anticipation. The intellectual communities of the
world, which at that time was probably mainly Paris
NEAL R. GROSSCOURT REPORTERS AND TRANSCRIBERS
1323 RHODE ISLAND AVE., N.W.(202) 234-4433 WASHINGTON, D.C. 20005-3701 (202) 234-4433
1
1
2
3
4
5
6
7
8
9
10
11
12
13
14
15
16
17
18
19
20
21
222
3456

125
for European cultures, London, and Philadelphia was
probably the intellectual center in the U.S. at that
time -- maybe still is. I don't know, and he
actually had a contract with a publisher, and
President Jefferson, who was vitally interested in
this, was pushing him to publish his work, and he
fully intended to do it, and he never got around to
writing a page.
And one of the results of that was for
most of the 19th Century his intellectual achievement
went totally unrecognized until some people later on
got his notes, went through them, collated them, and
published them, and people realized what had been
done.
I guess this was an example, using the
academic lingo, of someone who perished before they
published.
(Laughter.)
MR. HAKES: But when you have valuable
data, there is some public compulsion for it to be
shared as widely as possible, and I think we're doing
a good job of sharing.
NEAL R. GROSSCOURT REPORTERS AND TRANSCRIBERS
1323 RHODE ISLAND AVE., N.W.(202) 234-4433 WASHINGTON, D.C. 20005-3701 (202) 234-4433
1
1
2
3
4
5
6
7
8
9
10
11
12
13
14
15
16
17
18
19
20
21
222
3456

126
The Web site, which I've reported to you
before on, when we first opened the Web site, we were
quite pleased. There seemed to be a couple hundred
of people per day that were using it. We're using
people coming on the site, not hits or other numbers
that produce larger totals, but now on a busy day
we're getting over 2,000 people come on that site.
It's not unusual on a weekend for over 1,000 people
to come on the site, and they're downloading whole
documents, several hundred pages of documents in some
cases, which just means they're very motivated to get
these documents.
So the trends lines on this is something
that we're looking at. I think it's a very good new
story.
There are two ways for us to reach large
numbers of people within the budgets that we have,
and the other one is through press coverage of our
activities, and we feel that this is a good way of
drawing the attention of the public to energy issues
and to the knowledge that there are more data out
there for those who want them, and we track our
NEAL R. GROSSCOURT REPORTERS AND TRANSCRIBERS
1323 RHODE ISLAND AVE., N.W.(202) 234-4433 WASHINGTON, D.C. 20005-3701 (202) 234-4433
1
1
2
3
4
5
6
7
8
9
10
11
12
13
14
15
16
17
18
19
20
21
222
3456
127
overall media citations, and you'll see in there that
it's gone up each year in the recent years.
We also looked at the major media, and
that means to us The New York Times, the Washington
Post, the Wall Street Journal, USA Today, and the
Los Angeles Times; just sort of gives us a barometer
of how the majors are covering EIA, and we track
citations of the Energy Information Administration.
And I couldn't find the '94 number this
morning written down, but I'm quite certain that we
got 11 citations in 1994. I did find '95, and that
was 20 citations, and the number of citations in 1996
was 55. So we went from 11 to 55 in a two-year
period.
Now, some of that has to do with price
spikes in petroleum, which are one of the best ways
for EIA to get recognition in the press, but if you
look at the month-to-month figures, it's not all
that, and I think the numbers for this year will be
good as well.
We had a press conference last week
which probably wouldn't rival the ones that Cal had
NEAL R. GROSSCOURT REPORTERS AND TRANSCRIBERS
1323 RHODE ISLAND AVE., N.W.(202) 234-4433 WASHINGTON, D.C. 20005-3701 (202) 234-4433
1
1
2
3
4
5
6
7
8
9
10
11
12
13
14
15
16
17
18
19
20
21
222
3456
128
during the Persian Gulf War, but it probably was a
peacetime record. We had 51 reporters show up.
There were 14 microphones at the podium, and I think
there were four or five TV cameras.
Now, that wouldn't have surprised me too
much if we had been about to announce that prices
were going to run up a lot this spring, but we were
basically announcing that prices were going to stay
in their current range, and so I thought that was a
sign of perhaps increased maturity on the part of the
news media, that they would cover energy as something
because it's important to cover and not just because
there's a crisis going on.
And I think that that does create a
situation where you do get a little bit more public
understanding of an issue if there's more of that
regular type of discussion, and then hopefully people
will read about these things and then start drilling
into our Web site.
In terms of other usage, we've had a
heavy demand this last year for congressional
briefings. We haven't actually quantified that,
NEAL R. GROSSCOURT REPORTERS AND TRANSCRIBERS
1323 RHODE ISLAND AVE., N.W.(202) 234-4433 WASHINGTON, D.C. 20005-3701 (202) 234-4433
1
1
2
3
4
5
6
7
8
9
10
11
12
13
14
15
16
17
18
19
20
21
222
3456

129
although I guess there's no reason we couldn't, but
recently we've had a briefing that we've done on the
Hill on the changing nature of the electric industry.
We published a book on that earlier in the year, and
it has been a very, very popular item. It's one of
those ones that people have been downloading a lot
off the Web site.
But the staff that produced that
publication has sort of an ABCs of electric
restructuring that they do, and the first couple of
times that we did it on the Hill for Senate staff,
there was standing room only, and I would suspect now
that at least about a third of the Senate has had
their staff come to one of our electric restructuring
briefings.
Of course, we're over there a lot to
talk about heating fuels when the early part of the
winter was cold and it looked like there might be
tough times ahead for heating fuels.
So I think this usage is good. I think
we have good momentum going. I think it's an area
where we may not need to do as much new things in
NEAL R. GROSSCOURT REPORTERS AND TRANSCRIBERS
1323 RHODE ISLAND AVE., N.W.(202) 234-4433 WASHINGTON, D.C. 20005-3701 (202) 234-4433
1
1
2
3
4
5
6
7
8
9
10
11
12
13
14
15
16
17
18
19
20
21
222
3456

130
this area, but sort of continue on the path we're
headed.
One of the things that I think we have
to look at more, and I tend to look at more in the
coming year, is the whole area of quality
measurement. How do we measure quality? And I think
when I came to EIA, I always assumed quality, and I
think everybody assumes quality. It's because of
organizations like this and the quality controls that
we have built into our system, and I think those
systems are extremely strong, and so I'm not worried
about it now to the extent that anyone has the
slightest doubt that we're not putting out quality
materials.
But I think if you look at the budget
cuts, the cuts in the number of people, we have to
look carefully at the quality issues to see are we
maintaining quality. Are we losing quality? Are we
gaining quality? And for two reasons.
One is as we make cuts, we don't want to
create a situation that we maintain all the coverage
that we have, but the coverage has a quality level
NEAL R. GROSSCOURT REPORTERS AND TRANSCRIBERS
1323 RHODE ISLAND AVE., N.W.(202) 234-4433 WASHINGTON, D.C. 20005-3701 (202) 234-4433
1
1
2
3
4
5
6
7
8
9
10
11
12
13
14
15
16
17
18
19
20
21
222
3456

131
that's not acceptable to us. So having those data
helps us make those kinds of decisions.
Also, we think we have some real
opportunities to improve timeliness. A lot of those,
I think, are there because of the electronic tools
that we have today that are so much stronger than we
had when we set up these systems, but if we're going
to push on timeliness, we want to make sure we're not
doing it at the cost of quality or if there is some
quality tradeoff, that it's at an acceptable level.
So I think you will find that these
performance measures are balanced. We try to look at
the whole landscape of things that affect us. I
think you do have to supplement them with qualitative
analysis and not conclude that you can quantify
everything, but they are strong tools for us, and I
think they are going to help us internally do our
business better, and I think they are going to help
us externally explain what we do, and I think
generally we have a very good story to tell.
That's all I have written down to talk
about. I'd be happy to take questions, comments.
NEAL R. GROSSCOURT REPORTERS AND TRANSCRIBERS
1323 RHODE ISLAND AVE., N.W.(202) 234-4433 WASHINGTON, D.C. 20005-3701 (202) 234-4433
1
1
2
3
4
5
6
7
8
9
10
11
12
13
14
15
16
17
18
19
20
21
222
3456

132
Yes, there's a man that knows a lot
about these issues. Dr. Kent.
MR. KENT: Did Ed Rothchild show up to
your press conference?
(Laughter.)
MR. HAKES: Well, Ed Rothchild, who's
the energy analyst for Citizen Action, feels that we
-- that gasoline prices will be higher this spring
than we projected, and the main reason that he felt
that that was the case was that we are assuming
refinery runs of about 96 percent in our projections,
and those are very high, I think anyone would
recognize.
But we've been seeing recently some very
high refinery runs. I think we were up in what,
John, about the 95 percent range at the beginning of
the winter? And so those numbers are not as
impressive as they might have been a few years ago.
It's also our belief that there's excess
refining capacity in Europe that's available, if
needed, and also right now crude is running about $2
less than we projected at the time of our
NEAL R. GROSSCOURT REPORTERS AND TRANSCRIBERS
1323 RHODE ISLAND AVE., N.W.(202) 234-4433 WASHINGTON, D.C. 20005-3701 (202) 234-4433
1
1
2
3
4
5
6
7
8
9
10
11
12
13
14
15
16
17
18
19
20
21
222
3456
133
projections. So there's probably more downside
potential here than there is upside potential, but Ed
and we just have a disagreement about that, but Ed's
been very supportive of EIA and very supportive of
our budget and uses our base.
MR. KENT: Has he been supportive of
your budget or of the budget cuts?
MR. HAKES: He's been very active asking
for more money for EIA. It's one of the few things
that he and API agree on, is that you need a strong
EIA.
MR. KENT: Let me just ask another
question then to follow up. One is almost left with
the impression that you've been able to have these
substantial budget cuts and that you've weathered
them and that things are just going along fine, and
maybe you don't want to go publicly with what's
happened with the 20 million. What have we lost with
the 20 million that you all have lost?
MR. HAKES: Well, I think if I was going
to say one factor here, I think it's the intelligent
use of technology. You read of some other federal
NEAL R. GROSSCOURT REPORTERS AND TRANSCRIBERS
1323 RHODE ISLAND AVE., N.W.(202) 234-4433 WASHINGTON, D.C. 20005-3701 (202) 234-4433
1
1
2
3
4
5
6
7
8
9
10
11
12
13
14
15
16
17
18
19
20
21
222
3456
134
agencies right now that have been not able to find
ways that they can take the technology and utilize it
in a very cost effective way. They may be using
computer systems that were designed in the '60s or
'70s.
One of the advantages of EIA is we have
a lot of very intelligent people. They're very
computer literate, and so when we developed our Web
site, for instance, we did not really hire contract
employees to do that. That was basically done by our
people, in some cases people staying up until three
in the morning. You know, there's a certain
addictive behavior that's associated with some of
this computer usage.
MR. KENT: Addictive behavior.
MR. HAKES: Yes. So, you know, I think
that's part of it. I think it is a reasonable
expectation by the outside public that all people,
including the information areas and intellectual
areas, can do more work with less time and people.
I know when I go back to do guest
lectures at universities, I just think of those days
NEAL R. GROSSCOURT REPORTERS AND TRANSCRIBERS
1323 RHODE ISLAND AVE., N.W.(202) 234-4433 WASHINGTON, D.C. 20005-3701 (202) 234-4433
1
1
2
3
4
5
6
7
8
9
10
11
12
13
14
15
16
17
18
19
20
21
222
3456

135
when I wrote out my lectures in longhand, and then
the next year if I wanted to change 20 percent of the
lecture to bring it up to date, I either cut and
pasted it or wrote it out in longhand again. Maybe
none of you were ever that efficient.
But now I sit down and I write out what
I'm going to say, and if I need to update it, it
takes me, you know, a couple of seconds on the
computer, and I've got my new lecture.
So, you know, I think those are
opportunities that we've been forced to be very, very
aggressive on.
Now, I'm not saying that there isn't a
cost, and the message I would like to go out is that
there has been a cost. You know, for instance,
consumption surveys, we're doing those now in a four-
year cycle. Why is that important? Well, I think
the country is about to make some huge investments in
doing something or other about climate change. Those
have tremendous ramifications, and, you know, to try
to save a couple million dollars and not have the
data you need to have up-to-date information for
NEAL R. GROSSCOURT REPORTERS AND TRANSCRIBERS
1323 RHODE ISLAND AVE., N.W.(202) 234-4433 WASHINGTON, D.C. 20005-3701 (202) 234-4433
1
1
2
3
4
5
6
7
8
9
10
11
12
13
14
15
16
17
18
19
20
21
222
3456

136
these big decisions is foolish, and you're aware of
other areas where we've had cuts.
I do think we have reached the point --
I mean, EIA has tried to work in this balanced budget
environment where we have acknowledge that some
cutting would be appropriate as part of one's
contribution to reducing the national deficit, but I
think we've reached the point where the pain gets
greater and greater. I think we have a number of
areas where we need to be doing enhancements so that
we don't get in the situation where we have parts of
these industries developing that we're not covering.
You know, we've had this deregulation of
the natural gas industry. The whole nature of the
electric industry is changing, and we have big
reporting problems in electricity because we publish
a lot of data on regulated utilities and not very
much on other electric generators. It causes a lot
of confusion. People take our data and say, "Here's
what the electric industry is doing," and it's just
because they got our utility data and they left out
the unregulated, which has a whole different profile
NEAL R. GROSSCOURT REPORTERS AND TRANSCRIBERS
1323 RHODE ISLAND AVE., N.W.(202) 234-4433 WASHINGTON, D.C. 20005-3701 (202) 234-4433
1
1
2
3
4
5
6
7
8
9
10
11
12
13
14
15
16
17
18
19
20
21
222
3456

137
and, you know, uses a lot more gas, uses more
renewables.
So we need to not just be trying to
protect what we have. We have to be moving ahead in
a lot of these areas.
I think that there has been a general
acceptance that that is the case, that nobody wants
to kill the golden goose. I think we are clearly the
most used part of the Department of Energy at least
in the energy sector. So my guess is we've sort of
bottomed out, but I think we've done a really good
job of trying to minimize the adverse effects of the
public, but there are some.
Yes.
MS. LJUNG: We were told this morning
that the information about the energy efficiency was
not included in this year's RECS survey, and I think
we need to talk about climate change, energy
efficiency. Information on that would be real
important.
MR. HAKES: Well, you should take that
up with the Clinton Administration.
NEAL R. GROSSCOURT REPORTERS AND TRANSCRIBERS
1323 RHODE ISLAND AVE., N.W.(202) 234-4433 WASHINGTON, D.C. 20005-3701 (202) 234-4433
1
1
2
3
4
5
6
7
8
9
10
11
12
13
14
15
16
17
18
19
20
21
222
3456

138
MS. LJUNG: Yes, I've sent an E-mail.
(Laughter.)
MR. HAKES: Anything else?
(No response.)
MR. HAKES: Okay. Thank you very much.
I've just been informed this is Renee
Miller's last meeting, and so, Renee, why is it your
last meeting?
(Laughter.)
MR. HAKES: I was supposed to thank her,
but I'm also announcing to myself that I didn't even
know this was happening, but Renee is one of the
great people at EIA who does a lot of good work,
sometimes behind the scenes, and has been very
helpful to me and, I think, been a real liaison for
this Committee, and we'll miss her and look forward
to working with Bill.
CHAIRMAN WATKINS: Thanks.
(Applause.)
CHAIRMAN WATKINS: Well, thank you.
We'll break for lunch now. On the one
o'clock reconvening, there is two parts to it. One
NEAL R. GROSSCOURT REPORTERS AND TRANSCRIBERS
1323 RHODE ISLAND AVE., N.W.(202) 234-4433 WASHINGTON, D.C. 20005-3701 (202) 234-4433
1
1
2
3
4
5
6
7
8
9
10
11
12
13
14
15
16
17
18
19
20
21
222
3456
139
is the beauty -- not the beauty contest -- the
graphic contest --
(Laughter.)
CHAIRMAN WATKINS: -- and some are at
that, and then the rest of us are back here.
Okay. We'll see you at one o'clock.
(Whereupon, at 12:00 noon, the meeting
was recessed for lunch, to reconvene at 1:00 p.m.,
the same day.)
NEAL R. GROSSCOURT REPORTERS AND TRANSCRIBERS
1323 RHODE ISLAND AVE., N.W.(202) 234-4433 WASHINGTON, D.C. 20005-3701 (202) 234-4433
1
1
2
3
4
5
6
7
8
9
10
11
12
13
14
15
16
17
18
19
20
21
222
3456

140
NEAL R. GROSSCOURT REPORTERS AND TRANSCRIBERS
1323 RHODE ISLAND AVE., N.W.(202) 234-4433 WASHINGTON, D.C. 20005-3701 (202) 234-4433
1
1
2
3
4
2
3456

141
AFTERNOON SESSION
(1:13 p.m.)
CHAIRMAN WATKINS: I'd like to start the
first session this afternoon, and we have Colleen
Blessing here to run us through your customer
satisfaction survey results.
MS. BLESSING: Thank you.
Okay. Is that good now? Good. I
forgot that it was going to be recorded because
usually I can talk loud enough.
I'm Colleen Blessing, and this afternoon
I'd just like to review with you the results of the
three customer satisfaction surveys that we did just
this past January. We've been doing the telephone
survey, the telephone satisfaction survey, for three
years in January, and this is the first year we've
decided to do three in one week. Someone is
laughing. Yeah, it actually was a lot of work.
I just saw an organization, National
Center for Education Statistics, that did one survey,
and it looked like it cost a boatload of money. Our
surveys are all done in house, no contractors. It's
NEAL R. GROSSCOURT REPORTERS AND TRANSCRIBERS
1323 RHODE ISLAND AVE., N.W.(202) 234-4433 WASHINGTON, D.C. 20005-3701 (202) 234-4433
1
1
2
3
4
5
6
7
8
9
10
11
12
13
14
15
16
17
18
19
20
21
222
3456

142
a volunteer effort by the Customer Survey Committee.
One thing I wanted to point out is that
a lot of the information that we get from the
customer satisfaction surveys ties into our
performance measures. We have performance measures
that we're looking at both for our performance
agreement and for the Government Performance and
Results Act, performance measures on accuracy,
relevance, timeliness, ease of access, and overall
service, satisfaction with overall service.
So we're collecting the information both
to figure out where we need to improve and where our
good sides are, and also to measure over time how
well we're serving our customers.
The first survey that I'd like to go
over, and I'll spend the most time on that one, is
the telephone survey. The other two I'll give you a
little heads up. We did a survey of our Web site
customers, and then we did a survey of our list serve
customers. So the very first survey, I'm going to
talk for just a couple of seconds about that before
this slide.
NEAL R. GROSSCOURT REPORTERS AND TRANSCRIBERS
1323 RHODE ISLAND AVE., N.W.(202) 234-4433 WASHINGTON, D.C. 20005-3701 (202) 234-4433
1
1
2
3
4
5
6
7
8
9
10
11
12
13
14
15
16
17
18
19
20
21
222
3456

143
The telephone survey, the way it works
is we picked a week in January. We picked three days
in January, and whoever called into the Energy
Information Administration during those three days,
we asked them if they would like to participate in
our customer satisfaction survey.
If they said yes, then they were
transferred to another person who actually conducted
the survey.
Now, we have to be careful when we look
at these results to realize a couple of things. One
is that this is not a statistical sample obviously.
This is whoever called in in that week. Now, I'd
like to think that not all the weirdos called in in
that week and not all of the cheerleaders called in
in that week, and since we've done the survey three
years in a row and we've gotten fairly similar
results, that it looks like, you know, we're getting
a good representation of our population, but it was
just whoever happened to call in during that week.
We ended up talking with, completing 247
interviews with customers during those three days.
NEAL R. GROSSCOURT REPORTERS AND TRANSCRIBERS
1323 RHODE ISLAND AVE., N.W.(202) 234-4433 WASHINGTON, D.C. 20005-3701 (202) 234-4433
1
1
2
3
4
5
6
7
8
9
10
11
12
13
14
15
16
17
18
19
20
21
222
3456

144
So that's the number to remember. That's the 247,
and that's what all of these statistics on the purple
charts are based on.
We asked people what type of
organization they were calling from, and this chart
obviously indicates the breadth of our customers
base. The research category, which is the lighter
blue color, also includes consultants and academia,
and we've got industry, government, finance, DOE, and
other is people who are calling for themselves, law
firms, nonprofit organizations, those kinds of
groups.
Okay. Next slide.
We asked people how often they call us
for information, and I'd kind of like to look at this
chart. It's not exactly a third, a third, a third,
but I kind of think of it that way.
A third of the people were first time
callers. That week was the first time they had ever
contacted us. About a third of the people called
more than once a month, and a third of the people
called once a month or less.
NEAL R. GROSSCOURT REPORTERS AND TRANSCRIBERS
1323 RHODE ISLAND AVE., N.W.(202) 234-4433 WASHINGTON, D.C. 20005-3701 (202) 234-4433
1
1
2
3
4
5
6
7
8
9
10
11
12
13
14
15
16
17
18
19
20
21
222
3456

145
The reason why I think this slide is
interesting is that we talk a lot about expanding our
customer base, and for three years in a row a third
of our callers during that week have been first time
customers. So our customer base is expanding every
day. There are new people that are finding out about
us and calling us.
Okay. We have -- I kind of call it a
national phone line center. It's called the National
Energy Information Center. These people are on the
phone lines from nine to five every day answering
incoming calls from customers from all over the
world. That's the NEIC.
So they received the bulk of the calls,
and the other acronyms are the other program offices,
the Coal, Nuclear, Oil and Gas, Energy Markets, and
the Forecasting Group. So two-thirds of the calls
came into the national phone lines, and a third came
into a program office and lists.
Okay. This is my favorite chart because
it has a lot of good information on it and because I
think it's the prettiest one. It's Michael's chart
NEAL R. GROSSCOURT REPORTERS AND TRANSCRIBERS
1323 RHODE ISLAND AVE., N.W.(202) 234-4433 WASHINGTON, D.C. 20005-3701 (202) 234-4433
1
1
2
3
4
5
6
7
8
9
10
11
12
13
14
15
16
17
18
19
20
21
222
3456

146
right there. We both independently nominated it. I
hope we win. "We," I shouldn't say "we." It's
Michael's chart.
We asked customers about their
satisfaction with five attributes of customer
service: the ease of access -- Paul, you might want
to move that up just a little bit and pull it away --
ease of access to our information; our staff
courtesy; that the staff was familiar with our
information; that they understood what the customer
asked for; and our promptness in getting back to them
or getting the facts or the information that they
asked for.
The satisfaction numbers on the top of
the bars represent the percent of customers who said
they were satisfied or very satisfied. Okay. Now,
the one I'd like to point out is courtesy. That one
rounded to 100 percent. A hundred percent of the
people who called, all of those people either said
they were satisfied or very satisfied with our
courtesy.
Our overall score for service in general
NEAL R. GROSSCOURT REPORTERS AND TRANSCRIBERS
1323 RHODE ISLAND AVE., N.W.(202) 234-4433 WASHINGTON, D.C. 20005-3701 (202) 234-4433
1
1
2
3
4
5
6
7
8
9
10
11
12
13
14
15
16
17
18
19
20
21
222
3456

147
was 99 percent. So that's a high score.
Now, on the information quality, we end
up being a little bit lower. The five attributes we
asked about were availability of the information, the
relevance, accuracy, comprehensiveness, and
timeliness. Again, pretty high scores except for the
75 percent satisfied or very satisfied with
timeliness. That's a number that really hasn't
changed over the last three years. Three years in a
row we've asked the exact same question, and the
percent satisfied or very satisfied has pretty much
remained the same of the telephone customers.
I'll go into some comparisons with the
Web customers and the list serve customers were also
asked this question, and there's a little different
results from them.
I also wanted to say this is not a
formal presentation. I don't have discussants or
anything. So if anybody wants to ask me any
questions, feel free to just raise your hand and ask
me as we're going along.
Yes?
NEAL R. GROSSCOURT REPORTERS AND TRANSCRIBERS
1323 RHODE ISLAND AVE., N.W.(202) 234-4433 WASHINGTON, D.C. 20005-3701 (202) 234-4433
1
1
2
3
4
5
6
7
8
9
10
11
12
13
14
15
16
17
18
19
20
21
222
3456
148
MR. BELLHOUSE: Just on the timeliness,
do you know why it's lower than the rest? Why is it
75 percent rather than higher?
MS. BLESSING: Well, we asked them. If
people say they're either neutral or not satisfied,
there's a skip pattern that goes out to probe and
asks them why aren't you satisfied with whatever it
is they're not satisfied with. So obviously
timeliness is the one where they're skipping out.
We ask them why they're not satisfied.
Customers basically -- I have two answers. One is
our information, I mean, you can't have December's
data before December is over. Some customers think
they want to have it earlier than that. There is a
certain amount of time that you need to collect it
and clean it and get it ready and send it to the
publisher, get it ready to be put out on the
electronic bulletin boards, and people always want it
faster.
There are several customers that I've
interviewed that have said, "You've gotten it out a
lot faster, and now I want it faster." I think the
NEAL R. GROSSCOURT REPORTERS AND TRANSCRIBERS
1323 RHODE ISLAND AVE., N.W.(202) 234-4433 WASHINGTON, D.C. 20005-3701 (202) 234-4433
1
1
2
3
4
5
6
7
8
9
10
11
12
13
14
15
16
17
18
19
20
21
222
3456

149
bar has been raised, and I think there's an
expectation that they want it even faster.
Anybody else who can comment on that?
CHAIRMAN WATKINS: To be a bit more
specific, how did you define timeliness is the sense
did you give them a measure or did you just say, "Was
it timely or not?"
MS. BLESSING: Choice B. We did not
define timeliness because timeliness means different
things to different users. A Wall Street trader who
needs the number in five minutes, if you're five
minutes late, that's too late. An academic person
who's maybe doing a research paper, maybe a week is
okay.
So we defined timeliness as whatever you
feel it is. I've done over 100 interviews, and I've
never had anybody say, "Well, what do you mean by
that?" They all know exactly what they mean by that,
and they'll tell you. "I'm tired of getting the '94
data in the middle of '96."
So the only attribute that people did
ask questions about is accuracy. That's the one that
NEAL R. GROSSCOURT REPORTERS AND TRANSCRIBERS
1323 RHODE ISLAND AVE., N.W.(202) 234-4433 WASHINGTON, D.C. 20005-3701 (202) 234-4433
1
1
2
3
4
5
6
7
8
9
10
11
12
13
14
15
16
17
18
19
20
21
222
3456

150
a little bit trips them. They'll say, "What do you
mean by that? What do you mean your number -- aren't
they good? Why are you asking me that question?"
But timeliness we didn't define.
He's still got a rejoinder.
MR. BELLHOUSE: So the follow-up is: is
the 75 percent a high number? The fact that it is 75
percent, do you consider that high?
I mean you have all kinds of
constraints, but you know --
MS. BLESSING: Yeah.
MR. BELLHOUSE: -- that people aren't
satisfied because you physically can't go any faster.
MS. BLESSING: I think that's one
possibility. When I saw the National Center for
Education Statistics survey results last week, they
had 90, 90, all their attributes, 90, 90, 90, 90, 90,
and timeliness was 70 percent on the same five-point
scale as ours.
So in a way I was sort of pleased to see
that. That was the first really comparable survey
and a really comparable service to ours, and they
NEAL R. GROSSCOURT REPORTERS AND TRANSCRIBERS
1323 RHODE ISLAND AVE., N.W.(202) 234-4433 WASHINGTON, D.C. 20005-3701 (202) 234-4433
1
1
2
3
4
5
6
7
8
9
10
11
12
13
14
15
16
17
18
19
20
21
222
3456
151
were also at -- they were even lower. They were at
70 percent.
MR. BELLHOUSE: So the same people?
MS. BLESSING: I'm not saying the
exactly people, but the same types of groups, and
they were a statistical organization that collected,
analyzed, and disseminated, which is very similar to
us.
MS. CARLSON: Do you have the one that
has timeliness by the Web customers? Do you have
that chart?
MS. BLESSING: Yeah, I'll get to that.
MS. CARLSON: Yeah, because it's a
different number.
MS. BLESSING: Yes.
MS. CARLSON: These are the telephone
surveys.
MS. COX: You don't have the same type
of customers. NCES, your customers may be trading
stock, buying things. They need instant data.
MS. CARLSON: They needed Web customers.
MS. COX: NCES, its customers tend to be
NEAL R. GROSSCOURT REPORTERS AND TRANSCRIBERS
1323 RHODE ISLAND AVE., N.W.(202) 234-4433 WASHINGTON, D.C. 20005-3701 (202) 234-4433
1
1
2
3
4
5
6
7
8
9
10
11
12
13
14
15
16
17
18
19
20
21
222
3456

152
the more academic types, and the ones for which a
little bit more time, but I'd say all of our surveys,
we can never get any of our survey data out to suit
our users. They always want it faster, which means
that it is something that we always have to think
about. How fast can we do things? Because what they
say is value diminishes as the time since it was
collected increases.
MR. HAKES: We might mention our
performance goals on this area, where we've set a
goal for 2002 that that number will rise to 80
percent, and the leading indicator is that annual
publications will come out within 180 days of the
data period, and it's now 342. So that's a fairly
ambitious goal.
MS. BLESSING: NCES also did something
that -- National Center for Education Statistics also
did one other thing. They did a mail-out survey. So
they went into even more detail. They not only asked
satisfaction. They asked importance, and when they
asked about the importance of timeliness, which is
something we haven't done, it came in third. People
NEAL R. GROSSCOURT REPORTERS AND TRANSCRIBERS
1323 RHODE ISLAND AVE., N.W.(202) 234-4433 WASHINGTON, D.C. 20005-3701 (202) 234-4433
1
1
2
3
4
5
6
7
8
9
10
11
12
13
14
15
16
17
18
19
20
21
222
3456

153
were most concerned about accuracy, secondly
concerned about comprehensiveness, and not a distant
third, but it was down there, was timeliness.
So that's an interesting thing to think
about. If that's not the most important thing in the
customer's mind, that may not be where you need to --
you're right. That may be the best score we can get.
Thanks.
CHAIRMAN WATKINS: Plus there are the
obvious tradeoffs.
MS. BLESSING: Right. There are the
obvious tradeoffs. Like you can put out December
before December is finished, but the data aren't
good.
These are a couple of charts that I'll
go through quickly. Our Administrator had said,
"Well, you know, we've got these high numbers. We've
got these 98 and 99 percents, but it would be
interesting to look and see how many people said they
were satisfied and how many people said they were
very satisfied."
So we're looking at the numbers for
NEAL R. GROSSCOURT REPORTERS AND TRANSCRIBERS
1323 RHODE ISLAND AVE., N.W.(202) 234-4433 WASHINGTON, D.C. 20005-3701 (202) 234-4433
1
1
2
3
4
5
6
7
8
9
10
11
12
13
14
15
16
17
18
19
20
21
222
3456
154
customer service. You don't need to look at really
the bars, but just look at how big the red part is.
The red part is the very satisfied, and for service,
the very satisfied is in the 70s to 85 percent. So I
think that's a big number of people that said they
were very satisfied.
Okay. Then compare that with the next
slide. These are the numbers for our information
quality, okay, and the number of people, again, we're
getting in the 90s, but the split between people who
said they are satisfied, a rating of four, or very
satisfied, a rating of five, were more in the 50s
here for the information quality.
So one of the things that we had put in
the performance agreement was to try to raise some of
these satisfied people to very satisfied.
Okay. This year we decided we'd go a
little deeper into the questions about electronic
users. We realized that we're looking at telephone
customers, but even from the first year you can see
since we've got three years of data on here, we've
asked this question three times. Have they used an
NEAL R. GROSSCOURT REPORTERS AND TRANSCRIBERS
1323 RHODE ISLAND AVE., N.W.(202) 234-4433 WASHINGTON, D.C. 20005-3701 (202) 234-4433
1
1
2
3
4
5
6
7
8
9
10
11
12
13
14
15
16
17
18
19
20
21
222
3456

155
electronic product?
Now, all you really need to look at is
sort of the third spaceship. In '95, 49 percent of
the people that we completed interviews with had used
some kind of an electronic product, home page, CD-
ROM, a bulletin board, a fax, some of the call-in
numbers, the hotlines; went up to 60 percent last
year, and it's up to 66 percent this year, and I
think the thing that's interesting is in EIA it seems
like there are certain people -- there are some times
when people think there's those telephone customers
over here, and I think there's a feeling that they're
a little less savvy. They're the telephone people,
and then there are those electronic people over here,
and they may be a little more savvy.
But what I think we're looking at is
those people that we're calling on the telephone are
also electronic users. Two-thirds of them are, and
we'll see in a slide -- I don't know if it's the next
one, but it's coming up -- a great majority of those
are our home page people, Web site people. It's not
that they're just getting a fax.
NEAL R. GROSSCOURT REPORTERS AND TRANSCRIBERS
1323 RHODE ISLAND AVE., N.W.(202) 234-4433 WASHINGTON, D.C. 20005-3701 (202) 234-4433
1
1
2
3
4
5
6
7
8
9
10
11
12
13
14
15
16
17
18
19
20
21
222
3456
156
And here it is now. Okay. This is the
percentage of all product users who use some kind of
an electronic product during the past year. This is
the only chart that's really hard to read. So I'll
just go over it. This is E-mail, home page. Okay.
Sixty-one percent of the people had used the home
page.
COGIS, that's an Oil and Gas Information
System; EPUB; diskette; fax; CD-ROM. Fourteen
percent of the people had used the CD-ROM. Fax on
demand. List serve popped up this year, and I don't
think we asked about it last year, and then other.
So the point on this page is that the
electronic use is definitely on the home page. We
can see that from our numbers, our home page numbers.
This is my last slide on the telephone
survey. Only look at the EIA bar. We've asked the
same question exactly three times. If the
information you need were available electronically,
would you still want the paper copy?
Okay, and what did our customers tell
us? Sixty-nine percent said they want the paper; 62,
NEAL R. GROSSCOURT REPORTERS AND TRANSCRIBERS
1323 RHODE ISLAND AVE., N.W.(202) 234-4433 WASHINGTON, D.C. 20005-3701 (202) 234-4433
1
1
2
3
4
5
6
7
8
9
10
11
12
13
14
15
16
17
18
19
20
21
222
3456

157
percent this year 63 percent. So we didn't see a
change at all this year. People are still saying
that they want the paper, and in some of the
interviews that I did, I just sort of coined a term.
It was just sort of the historical archives that
people are worried about.
Some people said, "Well, the Annual
Energy Outlook is out there this year. When the next
one comes out, are you going to roll that one off and
put the new one on? I know that my book is going to
be in my bookshelf."
They may be on electronically, but there
are some people that are expressing worries about the
archives. They want the books in their bookshelf,
and also people said that there wasn't enough
historical data on the Web site. People would say,
"I want four decades of information," and they're
going to get that from the paper.
And then there are other people. There
are some customers that say -- I've had two people
say, "I go to court. I'm a lawyer, and when I'm in
court, I need a book," or people say, "If I'm on an
NEAL R. GROSSCOURT REPORTERS AND TRANSCRIBERS
1323 RHODE ISLAND AVE., N.W.(202) 234-4433 WASHINGTON, D.C. 20005-3701 (202) 234-4433
1
1
2
3
4
5
6
7
8
9
10
11
12
13
14
15
16
17
18
19
20
21
222
3456
158
airplane, I know you can use a laptop on the
airplane, but you have to turn it off when you land.
You know, it's a pain," and people said, "I'm just
comfortable with paper." Another person said, "I
don't want to browse 500 pages," like Lynda's
publications are fairly long. They don't want to.
(Laughter.)
MS. BLESSING: They don't want to browse
500 pages on the Web.
So these people are using it, and these
are the same people that were using the Web page that
are coming back and saying they still want the paper.
Okay. Does anybody have any questions?
Let's just turn this machine off. Any more questions
about the telephone survey?
MS. COX: I think it's interesting that
you're saying that they still want paper. That's how
I feel.
MS. BLESSING: I do, too.
MS. COX: It's faster. Use of paper is
faster. So if you're a heavy user, you want
something there that you can just pull the report
NEAL R. GROSSCOURT REPORTERS AND TRANSCRIBERS
1323 RHODE ISLAND AVE., N.W.(202) 234-4433 WASHINGTON, D.C. 20005-3701 (202) 234-4433
1
1
2
3
4
5
6
7
8
9
10
11
12
13
14
15
16
17
18
19
20
21
222
3456

159
down, flip it open, find it. By the time you
actually got that data set cranked up on the
computer, you'd be done.
MS. CRAWFORD: And you can mark the
pages, too. If there's an important page or
something, you can actually put a sticky there.
MS. BLESSING: Write these down. These
are good.
No, no, I'm not calling on him.
MR. HAKES: Let me play devil's
advocate.
MS. BLESSING: I know what he's going to
say.
MR. HAKES: I agree with a lot of what
you're saying, but I'll just play devil's advocate
for the moment. One is our paper costs went down
substantially last year. It was some real savings,
and we sort of need those savings in a sense because
things like color cost a lot of money, and my view in
the future is you might move to a system where you
had shorter publications that were more easy to read,
had very good graphs in them, that would be suitable
NEAL R. GROSSCOURT REPORTERS AND TRANSCRIBERS
1323 RHODE ISLAND AVE., N.W.(202) 234-4433 WASHINGTON, D.C. 20005-3701 (202) 234-4433
1
1
2
3
4
5
6
7
8
9
10
11
12
13
14
15
16
17
18
19
20
21
222
3456

160
for policy makers and people like that, and then the
heavy duty users would be operating mainly in an
electronic environment.
I don't think we're there yet because I
don't think the user community is ready for that, but
I think it depends a little bit on the breadth of
what you're doing. I mean since I deal with the
whole range of EIA data, I have a whole bookshelf
just with current publications, and a lot of times it
is easier -- now if I was just dealing with, say,
five of our publications, it would be easier in hard
copy, but if I'm looking for something and can't
quite remember what publication it was even in, I
mean it takes seconds if your computer is on to get
access to it electronically.
There are also some usability features
in terms of word searches, getting stuff into your
spreadsheets, and all of that. I mean I actually
have seen my own pattern of use change in the last
year. Things that I used to, say, use the MER or the
AER, which are sort of core to data series, I'm just
finding it easier now to do it at the computer than
NEAL R. GROSSCOURT REPORTERS AND TRANSCRIBERS
1323 RHODE ISLAND AVE., N.W.(202) 234-4433 WASHINGTON, D.C. 20005-3701 (202) 234-4433
1
1
2
3
4
5
6
7
8
9
10
11
12
13
14
15
16
17
18
19
20
21
222
3456

161
walk over to the bookshelf and take it off the shelf.
I think that's going to happen, but we
wouldn't make any precipitous move in that direction
without people feeling pretty comfortable with it.
MS. CRAWFORD: I had a question. I was
wondering if there was any way that you could track
the type of information that the people were
requesting or they were just requesting such a
diverse amount of information that there's no way you
can classify it?
MS. BLESSING: That's interesting. The
same question got asked at the Washington Statistical
Society last Tuesday.
MS. CRAWFORD: Oh, statisticians think
alike.
MS. BLESSING: The same question.
MS. CARLSON: We do know what original
office the call came into.
MS. BLESSING: That was my answer.
MS. CARLSON: And I think we know --
MS. BLESSING: We know if they've called
Oil and Gas.
NEAL R. GROSSCOURT REPORTERS AND TRANSCRIBERS
1323 RHODE ISLAND AVE., N.W.(202) 234-4433 WASHINGTON, D.C. 20005-3701 (202) 234-4433
1
1
2
3
4
5
6
7
8
9
10
11
12
13
14
15
16
17
18
19
20
21
222
3456

162
MS. CARLSON: Or the Analysis Office.
MS. BLESSING: But we don't know what
they asked because the person who answered that
question, I guess they could write that down on the
survey form. It's just kind of physically -- the
survey form itself is physically trotted over to
someone else in a different part of the building to
conduct the interview independently.
They could have written down what the
person asked for, but we didn't.
MS. CARLSON: And since that is not a
question that would be a big burden, we could easily
in the future put a little note on it.
MR. BELLHOUSE: The move to getting rid
of paper, it might help if you had an electronic
archive. I mean if the concern is archival material
and whether or not it's up on the Web, I mean, if
it's only up on the Web for a year, I can understand
why people would want paper copies, but if you're
able to take past publications and put them on disk
and have an electronic archive so that people today
can get the past 20 years of data. Then I would bet
NEAL R. GROSSCOURT REPORTERS AND TRANSCRIBERS
1323 RHODE ISLAND AVE., N.W.(202) 234-4433 WASHINGTON, D.C. 20005-3701 (202) 234-4433
1
1
2
3
4
5
6
7
8
9
10
11
12
13
14
15
16
17
18
19
20
21
222
3456

163
that the paper consumption would go down even
further.
Now, there's an expense involved in that
obviously.
MS. BLESSING: I'm not on the committee
that works with the CD-ROM, but I know there was a
discussion not too long ago about possibly having two
CD-ROMs, one that was the one that came out -- I mean
a discussion at one of our committee meetings -- one
that came out with the latest data, and then there
would be one that could be more like an archival CD-
ROM.
And then if you had the archive, if you
had the electronic data in your office on a CD, then
you'd be okay.
MS. COX: I think it goes both ways. I
don't think you'll ever replace paper. Maybe
there'll be some younger generation, but I'm saying
it'll be a while down the road before that happens.
But I don't even think this is
technology. It's just what is the best way to use
your resources, and the resources of your own time.
NEAL R. GROSSCOURT REPORTERS AND TRANSCRIBERS
1323 RHODE ISLAND AVE., N.W.(202) 234-4433 WASHINGTON, D.C. 20005-3701 (202) 234-4433
1
1
2
3
4
5
6
7
8
9
10
11
12
13
14
15
16
17
18
19
20
21
222
3456

164
I find some of the things you're talking about --
like I store things electronically now, and for quick
searches and things like that I go into my computer.
I don't try to find the letter or the memo or things
like that. I go to where it's stored and look and
see what was there.
But I find when I really want to study
something, I want to see paper, and that I can
actually do more with something physical.
Now, for the National Science
Foundation, they decided to put their scientists' and
engineers' statistical data system on -- to create a
home page for it, to allow estimation capabilities
and all kinds of things for it, the kind of things
that you all are doing, by the way.
Their idea was, oh, paper and pencil and
CD-ROMs and things like that are things of the past,
and so they said, "No, we don't want you working on
those because" -- we were the ones preparing these
documents. So what we were saying is, you know, we
think the first step before we go and create the home
page and put all of these things there is to create a
NEAL R. GROSSCOURT REPORTERS AND TRANSCRIBERS
1323 RHODE ISLAND AVE., N.W.(202) 234-4433 WASHINGTON, D.C. 20005-3701 (202) 234-4433
1
1
2
3
4
5
6
7
8
9
10
11
12
13
14
15
16
17
18
19
20
21
222
3456

165
physical data set that can be put on CD-ROMs, et
cetera, and to create documentation. We were
thinking paper documentation, like a paper code book,
paper reports that document it, then to move to the
next step, to go onto the Internet, and they said,
"No, no, old fashioned. People don't do things like
that. You know, you're old fashioned."
So we jumped that stage, and so instead
of developing documentation that would be good paper
documentation, we jumped to the stage of developing
documentation directly for the Internet and the data
files directly.
Well, after the system had been up and
running for some time, like after a year, NSF's
analysts are saying, "I can't stand these time
delays. I can't stand the problem. I want to look,"
and they'd say, "I want a data set. I want it on CD-
ROM. I don't want to have to go through it. I want
it here where I can do anything I want with it," and
then they'd say, "And I want a code book, and I want
it on paper."
So I think those paper needs aren't
NEAL R. GROSSCOURT REPORTERS AND TRANSCRIBERS
1323 RHODE ISLAND AVE., N.W.(202) 234-4433 WASHINGTON, D.C. 20005-3701 (202) 234-4433
1
1
2
3
4
5
6
7
8
9
10
11
12
13
14
15
16
17
18
19
20
21
222
3456

166
going to go away.
MS. BLESSING: I think our customer
numbers are kind of on your side there.
The other thing that I noticed
personally, I think I did about 40 interviews this
year. Last year -- I never said this before. I
never really thought about it -- but last year a lot
of people said, "I can't get on at work. I can get
on at home. I don't have the right stuff." Nobody
said that this year. So it's not an accident. It
didn't seem to me at least.
Now, I could have gotten 40 people that
just happened to be electronic. I didn't see the
block to getting to the access. I saw people saying
they wanted historical data and that they wanted the
archives and that they liked the paper.
MS. CARLSON: However, on the other
side, and I personally feel very strongly about paper
because I am concerned that we are losing all the
caveats. People don't bother looking at the
appendices. What I have been struck with over the
last year is the number of E-mail questions that I
NEAL R. GROSSCOURT REPORTERS AND TRANSCRIBERS
1323 RHODE ISLAND AVE., N.W.(202) 234-4433 WASHINGTON, D.C. 20005-3701 (202) 234-4433
1
1
2
3
4
5
6
7
8
9
10
11
12
13
14
15
16
17
18
19
20
21
222
3456

167
get from people who have gone to our home page, who
have gone to the consumption pages with my name
there.
The questions they're asking are peeling
the onion. So we're developing a whole new set of
customers and worldwide customers that we never had
before because of the home page, and we never reached
them with our paper.
MS. COX: And actually it sounds like
from what you're saying they may come in via the
Internet and then come back for other kinds of
products directly, but your telephone calls or other
requests for documents or CDs --
MS. BLESSING: Or clarification, more
detail, yeah. A couple of people said that, too.
MS. CARLSON: The other interesting
thing that Colleen didn't really bring up on there is
the dramatic drop in the number of telephone calls
going to the program offices.
MS. BLESSING: I pulled that slide.
Yeah, I have that slide.
MS. CARLSON: Which is really what's
NEAL R. GROSSCOURT REPORTERS AND TRANSCRIBERS
1323 RHODE ISLAND AVE., N.W.(202) 234-4433 WASHINGTON, D.C. 20005-3701 (202) 234-4433
1
1
2
3
4
5
6
7
8
9
10
11
12
13
14
15
16
17
18
19
20
21
222
3456

168
going on. To me what's fascinating is that our face
of the world very much is now the National Energy
Information Center, not the program offices. They're
getting very few telephone calls.
MS. BLESSING: I'd like to move on to
the results of our Web site survey, and I want to
explain. The reason I decided I'm going to put the
microphone down is I really talk with my hands. I'm
not Italian, but especially with the Web site, I need
to have my hands to describe it.
On the Web site --
CHAIRMAN WATKINS: We need you on video.
MS. BLESSING: Right, yeah.
On the Web site survey, we thought about
a while, and since our Web site has been in
existence --
MS. CARLSON: Can I stop you?
MS. BLESSING: Yeah.
MS. CARLSON: And this is an example of
how we use the Committee. Colleen, Paula, and I went
to have lunch with Brenda, and Brenda provided us
advice on how to attempt to sample the Web.
NEAL R. GROSSCOURT REPORTERS AND TRANSCRIBERS
1323 RHODE ISLAND AVE., N.W.(202) 234-4433 WASHINGTON, D.C. 20005-3701 (202) 234-4433
1
1
2
3
4
5
6
7
8
9
10
11
12
13
14
15
16
17
18
19
20
21
222
3456

169
MS. BLESSING: I'm not going to go
into --
MS. CARLSON: Yeah, yeah.
MS. BLESSING: First I was going to
really describe the screen. When we first created
our Web page, if you guys have ever gotten onto the
home page where it has the earth with the continents,
there was a little feedback button over to the right,
but you actually had to see that and you had to go
over there and click on it. We thought that was too
passive for our survey.
So initially we thought, well, we'll do
kind of an "in your face." The minute they clicked
into the home page, there are the survey questions
right there, and the Webmaster and some other people
thought that might be a little too invasive.
So we decided what we would do -- this
was kind of like the last minute. Oh, sorry. Let me
know if I get too far away. At the last minute we
decided what we would do is create a -- it was a
nice, clean screen that just said, "It's survey week
at EIA." One box over here. "Click here if you want
NEAL R. GROSSCOURT REPORTERS AND TRANSCRIBERS
1323 RHODE ISLAND AVE., N.W.(202) 234-4433 WASHINGTON, D.C. 20005-3701 (202) 234-4433
1
1
2
3
4
5
6
7
8
9
10
11
12
13
14
15
16
17
18
19
20
21
222
3456

170
to help us out and do our survey." Another box over
here, "Click here if you just want to go straight to
the home page."
So it was sort of -- it was pretty
active in that we caught people. We gave them a
choice right up front, but if they were in a hurry or
they just didn't want to do the survey, they could
get right to where they wanted to go with just one
click.
We put the survey up on a Friday night,
and we took it down on a Friday night, and the was
the same week that we did the telephone survey. The
three days were kind of in the middle there. We
wanted to catch our weekend customers, as well as our
weekday customers.
We got 632 responses to that survey, the
Web site survey, which we thought was high. We
thought that was good, and we have thousands and
thousands of unique daily users, but what the
Webmaster figured out for us was that not all of
those people come in -- I call it the front door --
not all of the people come in from the front page.
NEAL R. GROSSCOURT REPORTERS AND TRANSCRIBERS
1323 RHODE ISLAND AVE., N.W.(202) 234-4433 WASHINGTON, D.C. 20005-3701 (202) 234-4433
1
1
2
3
4
5
6
7
8
9
10
11
12
13
14
15
16
17
18
19
20
21
222
3456

171
They come in on links. They come in bookmarks, and
lots of them are coming in this way. We did not
catch those people. The only people we caught were
the people that came in the front door.
And I keep forgetting to write down the
denominator. The Webmaster gave it to me. I think
the denominator is about 4,000, four or 5,000, and we
got 600 of those people. So a lot of people decided
to click on the box to take the survey.
MS. COX: How well did you determine
that those were unique people?
MS. BLESSING: The Webmaster can do
that.
MS. COX: So he was doing like IDs or
something. Okay.
MS. BLESSING: Yeah.
MS. COX: So they were unique people.
MS. BLESSING: So we had 600 people
complete the survey. I'm just going to round it to
600 because it makes it easier to do the first number
anyway.
Two hundred were first time users and
NEAL R. GROSSCOURT REPORTERS AND TRANSCRIBERS
1323 RHODE ISLAND AVE., N.W.(202) 234-4433 WASHINGTON, D.C. 20005-3701 (202) 234-4433
1
1
2
3
4
5
6
7
8
9
10
11
12
13
14
15
16
17
18
19
20
21
222
3456

172
400 were, a little more than 400 -- they had been in
before. They had used it before. Okay. So the 200
people that were first time users got skipped out to
the end because we didn't ask them how did it meet
your needs and what did you think because they hadn't
used it yet.
We asked them did the information on the
site meet your needs, and the scale on this was two,
yes/no. Eighty-six percent of the people said yes.
The information met their needs. Fourteen percent
said, no, it didn't.
The people who didn't, we skipped them
out to say there was a pro question asked on why it
didn't meet their needs, and they said they were
looking for something they didn't find. There were
technical comments. They don't like PDFs. They
couldn't download. Their screen got filled with
junk. The search engine didn't work like they
thought, those technical issues.
Wish lists. They wished they could have
seen something. Some people said, you know, company
specific information, and they're dreaming about what
NEAL R. GROSSCOURT REPORTERS AND TRANSCRIBERS
1323 RHODE ISLAND AVE., N.W.(202) 234-4433 WASHINGTON, D.C. 20005-3701 (202) 234-4433
1
1
2
3
4
5
6
7
8
9
10
11
12
13
14
15
16
17
18
19
20
21
222
3456

173
they want, and then the need for historical data and
the archiving again came up. If they said it didn't
meet their needs, they were doing time series, and
they needed 30 years of data.
We asked them -- now, this is the exact
same question as on the telephone survey -- "How
satisfied are you with the timeliness of the
information you found on this site?" For that
question only we went to the five point scale so that
it would be comparable to the very satisfied,
satisfied, neutral, dissatisfied, very dissatisfied.
Eighty-three percent of the people said that they
were satisfied or very satisfied with the timeliness
of the information on the Web site. That's 83
compared to the 75. So we got a jump up there.
We asked them was the site easy to use.
Yes, somewhat, or no were the choices. Ninety-eight
percent said yes or somewhat. Only two percent said
no. They actually said, no, it wasn't easy to use.
They still had a lot of comments either
at the end of the survey or in the middle. They
commented that there's just a huge amount of
NEAL R. GROSSCOURT REPORTERS AND TRANSCRIBERS
1323 RHODE ISLAND AVE., N.W.(202) 234-4433 WASHINGTON, D.C. 20005-3701 (202) 234-4433
1
1
2
3
4
5
6
7
8
9
10
11
12
13
14
15
16
17
18
19
20
21
222
3456

174
information out there, and the organization wasn't as
good as they would have liked. They wanted more
indexes, directories, links, search capabilities,
descriptive titles. There were lots of things that
came back that the people that work on the Web could
use, if they thought that that was a good idea, to
improve the site.
There was one person I thought that said
-- this was on list serve -- that they wanted
comparable titles on everything. So if they looked
in the same field, they would see what it was so that
the titles weren't sometimes here or sometimes here
or sometimes here. That was just one person, but I
thought that was an interesting comment.
Also if they wanted to file it in a
folder and look at it later, they would know where to
look for it with some kind of a tag, and they didn't
see that.
Will you revisit the site? Ninety-nine
percent of the people said yes. Only one percent --
only six people said, no, they wouldn't revisit.
We asked them to check off all of the
NEAL R. GROSSCOURT REPORTERS AND TRANSCRIBERS
1323 RHODE ISLAND AVE., N.W.(202) 234-4433 WASHINGTON, D.C. 20005-3701 (202) 234-4433
1
1
2
3
4
5
6
7
8
9
10
11
12
13
14
15
16
17
18
19
20
21
222
3456
175
EIA services that they used, and we asked them about
telephone, published reports, direct E-mail. Eighty-
two percent of the people who took this survey also
used paper, 82 percent. So that's where the Venn
diagram comes in and also those 63 percent who still
wanted the paper.
Thirteen percent had used the CD-ROM.
We've gotten some feedback that PDFs
aren't the way to go. They're frustrating people.
When we asked them what format would you like us to
use, there were seven or eight other ones, and they
all get lots of votes. So it wasn't like they all
voted in a different direction. I don't know if the
Webmaster saw any decisions to be made here, but it
looked like we asked them PDF, HTML, text, database,
spreadsheet, and word processor, and they all got
hundreds of votes. It wasn't like any of them only
got three.
So we're doing a CD-ROM survey. It's
under development right now, and we're thinking about
asking them this question and wondering why because
we're probably going to get the same answers again.
NEAL R. GROSSCOURT REPORTERS AND TRANSCRIBERS
1323 RHODE ISLAND AVE., N.W.(202) 234-4433 WASHINGTON, D.C. 20005-3701 (202) 234-4433
1
1
2
3
4
5
6
7
8
9
10
11
12
13
14
15
16
17
18
19
20
21
222
3456
176
MS. COX: Will you give them the PDF
files? Do you give them the software or the link to
the software?
MS. BLESSING: Yeah, but people have
trouble with that.
MS. CRAWFORD: Yeah. I know where I
work they're having trouble with the visual interface
between that and the computer. I can't see a lot of
the graphics. I can print it just fine, and so
depending on your particular system, there can be
problems.
MS. BLESSING: Well, a lot of people do,
but then there was a vocal minority of people that
mentioned PDFs specifically in the open ended
comments. In all three of them, in any of the
surveys they'll take that opportunity.
MS. COX: I'm wondering if you could
just do something to educate the people who don't
understand how to use them and how to download the
software, you know, a little thing like if you need
special information, go here.
MS. CARLSON: They have that.
NEAL R. GROSSCOURT REPORTERS AND TRANSCRIBERS
1323 RHODE ISLAND AVE., N.W.(202) 234-4433 WASHINGTON, D.C. 20005-3701 (202) 234-4433
1
1
2
3
4
5
6
7
8
9
10
11
12
13
14
15
16
17
18
19
20
21
222
3456

177
MS. COX: You do? Hum.
MS. BLESSING: The last question we
asked them was, "What type of organization do you
work for?" We're just trying to replicate that pie
chart that I showed you at the beginning with
government and research and industry and all of that,
and basically the vast majority of the Web users were
research, academia, government, and industry, and
then there's a big fall-off down to the next
categories, but it pretty much replicates the circle
that I showed you before.
So these customers are similar to our
telephone customers. We also gave them an
opportunity. Is there anything else you'd like to
say, and most of them reiterated the comments that
they had already -- they said either compliments,
"It's fabulous, couldn't live without it, absolutely
love it, best site I've ever seen" -- and we like
those comments -- or they talked about the timeliness
and the technical problems again.
You could almost follow somebody through
the survey even though you didn't know necessarily
NEAL R. GROSSCOURT REPORTERS AND TRANSCRIBERS
1323 RHODE ISLAND AVE., N.W.(202) 234-4433 WASHINGTON, D.C. 20005-3701 (202) 234-4433
1
1
2
3
4
5
6
7
8
9
10
11
12
13
14
15
16
17
18
19
20
21
222
3456

178
who was who because their comments kept coming up
again and again.
MS. COX: The timeliness aspect you
mentioned, to what extent for the two surveys -- I
was trying to figure out the extent to which both of
these two surveys are volunteer surveys.
MS. BLESSING: The telephone survey and
the Web site?
MS. COX: Un-huh, because you have 83
percent for the Web site saying timeliness is gray,
and it very much is a volunteer survey. You say,
"Would you do this?"
How does that compare with the telephone
survey?
MS. BLESSING: Whether it's a volunteer
survey or not?
MS. COX: Un-huh.
MS. BLESSING: The telephone survey, if
a person called in, if you called in for information,
I gave you your information. Then I would say, "It's
survey week. We'd like to know if you could take a
few minutes to answer some questions to help us
NEAL R. GROSSCOURT REPORTERS AND TRANSCRIBERS
1323 RHODE ISLAND AVE., N.W.(202) 234-4433 WASHINGTON, D.C. 20005-3701 (202) 234-4433
1
1
2
3
4
5
6
7
8
9
10
11
12
13
14
15
16
17
18
19
20
21
222
3456

179
improve our products," and you could say yes or no.
MS. COX: What kind of response rate did
you get?
MS. BLESSING: We finally figured it out
this year. We figured out a way to -- we hope we got
this tracked correctly -- about a 25 percent refusal
rate is what we're calculating.
MS. COX: So you got a 75 percent --
MS. BLESSING: Seventy-five percent said
yes.
MS. COX: And on the Web site you got
about?
CHAIRMAN WATKINS: What was your
acceptance? Do you know what your acceptance rate
was on the Web site?
MS. BLESSING: Well, if 600 people took
it, and I think Eric said four or 5,000 came in
through the front door, it's definitely lower.
CHAIRMAN WATKINS: Related to Brenda's
comment, particularly in the case of the Web site
whether you have what is called self-selection bias.
MS. BLESSING: Oh, yeah.
NEAL R. GROSSCOURT REPORTERS AND TRANSCRIBERS
1323 RHODE ISLAND AVE., N.W.(202) 234-4433 WASHINGTON, D.C. 20005-3701 (202) 234-4433
1
1
2
3
4
5
6
7
8
9
10
11
12
13
14
15
16
17
18
19
20
21
222
3456

180
CHAIRMAN WATKINS: I'm not clear which
direction the bias is.
MS. BLESSING: I think in the telephone
survey, too.
CHAIRMAN WATKINS: Yes, except you've
got 75 percent that accept there.
MS. BLESSING: Yeah.
MS. COX: So less opportunity. The
reason I was asking that is there is also the issue
for timeliness because these people are getting
electronic product. If they need it, they can get it
as soon as it's released if they know when it's
released, so that they are getting quicker access to
it.
MS. BLESSING: That's what we were
testing. I think that's what we were trying to see,
whether they actually -- the results would come up
that way, and they did.
MR. WHITMORE: I think there might be
another factor also in that it affects that
comparison if you have a first time user on the Web
site, that they were essentially skipping because
NEAL R. GROSSCOURT REPORTERS AND TRANSCRIBERS
1323 RHODE ISLAND AVE., N.W.(202) 234-4433 WASHINGTON, D.C. 20005-3701 (202) 234-4433
1
1
2
3
4
5
6
7
8
9
10
11
12
13
14
15
16
17
18
19
20
21
222
3456

181
there would be questions that would not be
applicable, like was the data sufficiently timely.
So you're getting people that are using it more than
once, which would suggest they're getting what they
wanted. So you may have some bias towards people
that have higher satisfaction just due to that.
MS. CARLSON: But we're also losing
anybody who uses it so frequently that they have a
bookmark, that they have specific pages bookmarked.
MS. BLESSING: Yes, the real hot users
that don't come in up front, yeah.
Jay?
MR. HAKES: I would guess that another
bias, too, is you underrepresent the trading
community because one of the interviews I did with
someone who was a commodities trader, and I think
they're pretty heavy users of this stuff, and during
business hours they are very focused on what's
happening in the market. So, you know, they're going
to be the hardest people to measure.
Just Brenda's comment that if they know
it is available, I just wanted to reiterate that, you
NEAL R. GROSSCOURT REPORTERS AND TRANSCRIBERS
1323 RHODE ISLAND AVE., N.W.(202) 234-4433 WASHINGTON, D.C. 20005-3701 (202) 234-4433
1
1
2
3
4
5
6
7
8
9
10
11
12
13
14
15
16
17
18
19
20
21
222
3456
182
know, there is this list or function on the site so
that many products you can sign up for automatic
notification. So, I mean, anybody on the Committee,
if, for instance, they want to know when EIA puts out
a press release, for instance, you can get on a list
for that, and it'll automatically appear the moment
it goes out. It's a pretty nice convenience, and
then you don't have to remember.
MS. BLESSING: Which leads me to my next
survey.
The last survey we did was of the list
serve customers.
The list serve customers, and the list
serve, like Jay said, I sort of liken it to an
electronic mailing list. Lots of our most popular
publications and our press releases are available by
list serve.
So you can put your name on the list,
and any time one comes out or is released, it just
automatically comes to you.
We have a frame. We had the total list
of people that are on those list serves. The
NEAL R. GROSSCOURT REPORTERS AND TRANSCRIBERS
1323 RHODE ISLAND AVE., N.W.(202) 234-4433 WASHINGTON, D.C. 20005-3701 (202) 234-4433
1
1
2
3
4
5
6
7
8
9
10
11
12
13
14
15
16
17
18
19
20
21
222
3456

183
Webmaster took all of the lists and took out all of
the duplicates. So we had a good frame, and we
picked. Paula helped us pick out a statistical
sample, and we picked out 325 people, every fifth one
or whatever it was we needed.
So we did a random sample, electronic
mail to them. Very similar questions. I'll go over
the questions in a minute to the ones on the Web
site.
I realize a clerical person did all of
the mailing, but I took in the results, and I got so
many wrong address, wrong format, no longer exists,
moved, doesn't work here anymore. So I realized, and
the Webmaster knows this, that the mailing list for
the list serve, like any other mailing list, has
births and deaths, and it needs to be kept up to
date, and EIA, I think, has worked really hard on
beefing up that list and not -- we haven't done any
purging or figuring out who's not there or who's
moved.
So out of the 325 that we sent out, at
least 27 came back saying that it couldn't even be
NEAL R. GROSSCOURT REPORTERS AND TRANSCRIBERS
1323 RHODE ISLAND AVE., N.W.(202) 234-4433 WASHINGTON, D.C. 20005-3701 (202) 234-4433
1
1
2
3
4
5
6
7
8
9
10
11
12
13
14
15
16
17
18
19
20
21
222
3456

184
delivered to the customer. So that reduced my
denominator I'm saying to about 300.
I heard back from 76 customers. So my
response rate was about 25 percent, which I thought
was good. Twenty-five percent of the list serve
people got back to me.
We asked them: does the information you
received in electronic mail meet your needs? Ninety
percent said, yes, it met their needs.
How satisfied were you? Same question
with the timeliness of the information. Ninety-five
percent said they were satisfied or very satisfied
with the list serve.
Now, they've chosen to be on that list,
and they know what they're getting. They're not
searching for it, and it just pops up on their screen
when it's ready, but 95 percent of them said that
they were satisfied. So that's a completely
different number from the 75 percent.
We asked them what other EIA services do
you use. Fifty-five percent used paper. Twenty-four
percent, 24 percent, I mean one in four was still a
NEAL R. GROSSCOURT REPORTERS AND TRANSCRIBERS
1323 RHODE ISLAND AVE., N.W.(202) 234-4433 WASHINGTON, D.C. 20005-3701 (202) 234-4433
1
1
2
3
4
5
6
7
8
9
10
11
12
13
14
15
16
17
18
19
20
21
222
3456

185
direct telephone customer. So the list serve -- I
mean there's just a lot of cross-over that you can
see in these numbers.
The type of organization was the last
question we asked them, and again, it was research,
academic, government, and industry in the three big
categories on list serve. So those just are coming
out as obviously our largest customer based
subgroups.
We asked then if there was anything else
they wanted to say, and they talked about -- list
serve people wanted more -- we have a lot of our
general publications that are sort of global
publications out there. They wanted more specifics.
People said they wanted photovoltaics, utility
deregulation. They wanted more specific things, just
more titles available on list serve.
Several people said they wanted to make
it easier to get themselves off of the E-mail list.
They didn't know how to do that, and I don't know
that we helped them do that. I don't know that the
instructions are on there, but that would have helped
NEAL R. GROSSCOURT REPORTERS AND TRANSCRIBERS
1323 RHODE ISLAND AVE., N.W.(202) 234-4433 WASHINGTON, D.C. 20005-3701 (202) 234-4433
1
1
2
3
4
5
6
7
8
9
10
11
12
13
14
15
16
17
18
19
20
21
222
3456

186
us with the list.
MS. COX: Usually when you sign on lists
you get something that tells you, "Keep this note."
It tells you how to get off the list and how to
change it.
MS. BLESSING: And who does.
MS. COX: I'm assuming you send
something like that out. You might want to check.
MS. BLESSING: What we're in the process
of doing right now is doing a purge of our mail list.
We have about 15,000 people, mail list customers, and
we've sent out a card to them saying, "Return the
card if you still want the publication," and that's a
good way to at least try to update the mailing list.
To my knowledge, we haven't done that with the list
serve, and so I think there's some people out there
that for whatever reason don't know how to get their
name off, but would like to be off.
MS. COX: I guess they might have thrown
away that initial --
MS. BLESSING: They may have.
The list serve people also wanted
NEAL R. GROSSCOURT REPORTERS AND TRANSCRIBERS
1323 RHODE ISLAND AVE., N.W.(202) 234-4433 WASHINGTON, D.C. 20005-3701 (202) 234-4433
1
1
2
3
4
5
6
7
8
9
10
11
12
13
14
15
16
17
18
19
20
21
222
3456

187
historical data, and then several people said that
they were really glad or they liked the fact they
didn't have to search for it, that it popped up on
their screen, but that sometimes they still had to
call anyway for clarification. So several people
were still telephone customers even though they got
what they needed on the list serve.
So those are the three that we did.
Does anybody have any questions on any of the three
surveys? Any other questions?
MS. COX: It doesn't leave you with any
doubt that your electronic products are really highly
valued.
MS. BLESSING: Right, right.
CHAIRMAN WATKINS: That's a good point
at which to stop, right?
MS. BLESSING: Right. That's right.
Any other questions?
(No response.)
MS. BLESSING: Thanks.
CHAIRMAN WATKINS: Thank you, Colleen.
I think I'll just take a quick break to
NEAL R. GROSSCOURT REPORTERS AND TRANSCRIBERS
1323 RHODE ISLAND AVE., N.W.(202) 234-4433 WASHINGTON, D.C. 20005-3701 (202) 234-4433
1
1
2
3
4
5
6
7
8
9
10
11
12
13
14
15
16
17
18
19
20
21
222
3456

188
see where our judges are, and we'll resume with, I
guess, Arthur Andersen, you're next.
(Whereupon, the foregoing matter went off the record
at 2:00 p.m. and went back on the record
at 2:07 p.m.)
CHAIRMAN WATKINS: So our next section,
Art, you're going to do the talking?
MR. ANDERSEN: Both of us.
CHAIRMAN WATKINS: Both of you. Okay.
Go ahead.
MR. ANDERSEN: Hi. I guess it's what,
about a year and a half ago we had a little session
on looking at differences between the Annual Energy
Outlook forecasts and the Short-term Energy Outlook
forecasts for common years and trying to worry about
why are there differences and to what extent might
they be moderated or might we understand the reason
for their existence?
Why did people worry about this? To the
extent there were differences between the forecasts
for STEO -- where is the focus? Is that better for
anybody?
NEAL R. GROSSCOURT REPORTERS AND TRANSCRIBERS
1323 RHODE ISLAND AVE., N.W.(202) 234-4433 WASHINGTON, D.C. 20005-3701 (202) 234-4433
1
1
2
3
4
5
6
7
8
9
10
11
12
13
14
15
16
17
18
19
20
21
222
3456
189
All right. At any rate, to the extent
that there are differences between the STEO and the
AEO in common years, it can give rise to confusion,
and it can give rise to the question of which is the
official forecast, but the two models or the two
modeling systems are fundamentally different, and so
you'd expect some differences between the two.
STEO is oriented to short-term impacts
associated with weather and short-term shocks to the
system for whatever reason, whereas the NEMS is in
the business of trying to understand the implications
of long-term trends and, for that matter, to be able
to fold in changes in energy policy that will work
its way through the capital stock through time.
The idea was not to make all of the
numbers in the two systems be the same in the two
common years. The idea rather was to understand why
are the differences there, and to what extent can we
get rid of ones that are extraneous. To what extent
can we identify differences which are of interest and
may, in fact, help enrich the analysis agenda for
either of the modeling systems?
NEAL R. GROSSCOURT REPORTERS AND TRANSCRIBERS
1323 RHODE ISLAND AVE., N.W.(202) 234-4433 WASHINGTON, D.C. 20005-3701 (202) 234-4433
1
1
2
3
4
5
6
7
8
9
10
11
12
13
14
15
16
17
18
19
20
21
222
3456

190
So we weren't, and in fact, if we were
in the business of just getting rid of the
differences, we wouldn't have gotten involved with
this exercise. It would have been easy to just, say,
plus the STEO numbers, but rather, what we're in the
business of doing is trying to understand better what
can we learn from the two modeling systems that can
enrich the analysis agenda of the two programs.
To our surprise, in fact, as this
exercise evolved, the extent to which differences
persist in the common point of release of data for
the two programs, we've moved to a lot less
difference than when we began. The AEO '95 was
released in line with the third quarter STEO of '95,
and there you see the range of differences, and
frankly, it was at that point that I got involved
because I heard all sorts of problems associated
with, you know, why do we have this difference.
We're not going to sign off on this until you fix it,
and so on.
So that experience in '90 --
CHAIRMAN WATKINS: Art, could I just
NEAL R. GROSSCOURT REPORTERS AND TRANSCRIBERS
1323 RHODE ISLAND AVE., N.W.(202) 234-4433 WASHINGTON, D.C. 20005-3701 (202) 234-4433
1
1
2
3
4
5
6
7
8
9
10
11
12
13
14
15
16
17
18
19
20
21
222
3456

191
please ask you a question of clarification? These
numbers are for a year?
MR. ANDERSEN: That's right. That's
right, and this would be --
CHAIRMAN WATKINS: The third quarter '94
is the forecast for 1995, for the year as a whole
from STEO?
MR. ANDERSEN: Yes.
CHAIRMAN WATKINS: And the other one is
for NEMS?
MR. ANDERSEN: Yes, that's right.
So what we under --
MR. BISCHOFF: That's the third quarter
for '94, not for '95. The current year is '94,
right?
MR. ANDERSEN: The current common year
in this case would be for 1995 and 1996, right?
MR. LADY: Well, for the STIFS solution
on the left, it would begin the year, the current
year, so that AEO '95 was done in '94.
MR. ANDERSEN: Right.
MR. LADY: So it's '94 is the current
NEAL R. GROSSCOURT REPORTERS AND TRANSCRIBERS
1323 RHODE ISLAND AVE., N.W.(202) 234-4433 WASHINGTON, D.C. 20005-3701 (202) 234-4433
1
1
2
3
4
5
6
7
8
9
10
11
12
13
14
15
16
17
18
19
20
21
222
3456

192
year, and '95 that's the next year.
MR. ANDERSEN: Right.
MR. BISCHOFF: Well, the three current
years are '94, '95, and '96, and the three next years
are '95, '96, and '97, correct?
MR. LADY: Exactly.
MR. ANDERSEN: In any event, when we
started this exercise you did have quite a larger
range of differences than in the next cycle, the '96
cycle, and then the third column relates to the most
recent cycle for the AEO, and in this case you'll see
that it's a comparison to the fourth quarter STEO in
that the publication dates for the two pubs. have
been moved so they're more contemporaneous than they
were when we first started this exercise.
What are some of the things that
happened to bring us to more common numbers for the
coming years? And what we found, surprisingly, was
that there were a number of things that could have
been reconciled that weren't.
For instance, there was no reason to
have different assumptions or different sources of
NEAL R. GROSSCOURT REPORTERS AND TRANSCRIBERS
1323 RHODE ISLAND AVE., N.W.(202) 234-4433 WASHINGTON, D.C. 20005-3701 (202) 234-4433
1
1
2
3
4
5
6
7
8
9
10
11
12
13
14
15
16
17
18
19
20
21
222
3456

193
information with regards to pipeline capacities from
Canada, and those have been reconciled. There were,
in fact, two different approaches to estimating
electricity losses, which have now been reconciled,
and then there's been, and it's still ongoing --
George will talk about this a little bit later -- the
puzzle of where you count and how do you best account
for energy data in the context of cogeneration.
Then in addition, we found that the
reconciliation of international data had not been
maintained in the two systems that's been dealt with.
Renewable energy wasn't in STIFS when we started this
cycle. Now it is, and in the modeling of natural
gas, you had a situation where STIFS had a
discrepancy number which is a data number, and we in
the NEMS had gotten rid of discrepancy. Well, we've
changed that so that it's easier to make comparisons.
What I consider to be one of the real
long-term benefits of this effort is that you find
after you get rid of some of these differences that
are due to data or common assumptions, you find there
are differences in the numbers that relate to the
NEAL R. GROSSCOURT REPORTERS AND TRANSCRIBERS
1323 RHODE ISLAND AVE., N.W.(202) 234-4433 WASHINGTON, D.C. 20005-3701 (202) 234-4433
1
1
2
3
4
5
6
7
8
9
10
11
12
13
14
15
16
17
18
19
20
21
222
3456

194
projection, and one characteristic of STIFS versus
NEMS is that they've had more growth in some areas
than we've had in our forecast for NEMS, and that
difference has caused us to review rather carefully
some of the underlying characteristics of demand.
And in the case of the residential and
commercial sector, both models have been adjusted as
a result of this exercise. On the NEMS side, one of
the real puzzles long term is new uses in
electricity. In fact, if you look at 2015 with
respect to growth in demand in our forecast, almost
all of the growth is associated with new uses. So we
are projecting a major role for new uses in an area
we know very little about.
On the other hand, we know an awful lot
about turnover of capital stock and relative
efficiencies of refrigerators, et cetera, and in
there we can account for gains in efficiency
associated with the kinds of equipment that's going
into use and the rate of turnover.
Well, in the context of STIFS driven by
data, but interested in what will happen in
NEAL R. GROSSCOURT REPORTERS AND TRANSCRIBERS
1323 RHODE ISLAND AVE., N.W.(202) 234-4433 WASHINGTON, D.C. 20005-3701 (202) 234-4433
1
1
2
3
4
5
6
7
8
9
10
11
12
13
14
15
16
17
18
19
20
21
222
3456

195
anticipation of this data, we've had two kinds of
things. In the context of STIFS, they are now trying
to take into account the recognized consequences of
efficiency standards and the rolling in of more
efficient capital stock, and, on the other hand, in
the NEMS area we've been trying to look more closely
and have upped our forecast with regards to the new
uses aspect, which is in some measure continually
captured by the STIFS data, by the data that drives
STIFS.
And at this point, I let George pick up
and carry forward where we are. The point that I
think we are at is that we believe we started out
with it's a problem to be solved, and we are now at a
point where we believe it's a process to be sustained
because it is a process that gives opportunity to
identify and target analytic issues in both sets of
projects.
MR. LADY: If you think back to the
third slide, you can remember that the major fuel
specific series were really quite close so that the
various initiatives that Art just described that were
NEAL R. GROSSCOURT REPORTERS AND TRANSCRIBERS
1323 RHODE ISLAND AVE., N.W.(202) 234-4433 WASHINGTON, D.C. 20005-3701 (202) 234-4433
1
1
2
3
4
5
6
7
8
9
10
11
12
13
14
15
16
17
18
19
20
21
222
3456

196
put in place for last year served us very well this
year.
There really were only two generic areas
where there were still problems. One of them I can
see from the agenda you have or will hear about,
which is the fact that electricity markets are being
deregulated and the way in which electricity is going
to be supplied is going to be quite a bit different.
I'm not even sure if we know altogether how different
compared to most of it coming from regulated
utilities.
And the way in which that's accounted
for is being decided. The way in which the data are
collected and the way in which NEMS processes the
solution are all in the process of being changed and
I guess will be changed more, and as a result we were
seeing as differences the truth of the matter was a
part of the software that I was using just hadn't
caught up with some of the changes. So this is an
area of transition and how the reports will be done
and what the proper way to keep these scores will be,
I guess, decided.
NEAL R. GROSSCOURT REPORTERS AND TRANSCRIBERS
1323 RHODE ISLAND AVE., N.W.(202) 234-4433 WASHINGTON, D.C. 20005-3701 (202) 234-4433
1
1
2
3
4
5
6
7
8
9
10
11
12
13
14
15
16
17
18
19
20
21
222
3456

197
The other area where we had large
percentage differences but really differences that
didn't involve very much energy per se was
renewables, and these had to do with problems that
people had to be patient with. This was an area
compared to some of the other issues that people
could not spend the same priority to deal with, and
there were small changes in definitions, small
changes in the way the data were defined when they
were collected versus what NEMS could sensibly try to
project, and these differences would lead to small
changes with very small percentage basis and you
would get large differences.
So here are three examples that we
brought forward. For example, the NEMS reports
energy consumed from geothermal resources in terms of
what that energy is perceived to be literally. STIFS
tries to convert the energy to a proper fossil input
for the electricity that is being generated by the
fossil resource. These are in some sense both right,
depending on what you want to measure. They just
look different when you report them.
NEAL R. GROSSCOURT REPORTERS AND TRANSCRIBERS
1323 RHODE ISLAND AVE., N.W.(202) 234-4433 WASHINGTON, D.C. 20005-3701 (202) 234-4433
1
1
2
3
4
5
6
7
8
9
10
11
12
13
14
15
16
17
18
19
20
21
222
3456

198
STIFS takes Canadian electricity imports
and tries to pro rata a part of that as a renewable
resource because it's believed this is the case.
NEMS does not do that, and there are a number of
issues in terms of what solar resources are
identified in the data versus what is projected.
These things just have to be patiently
dealt with. We're down below the big differences
energy-wise. We are getting the details straight, I
think.
This chart was actually simplified. I
was accused of having too many numbers. How could
that be for statisticians? How could there be too
many numbers?
So in any case, the point of this
display is to look at how fast it goes out of date.
In other words, the AEO is an annual publication.
The Short-term Energy Outlook is published four times
a year. So this is the way it looked this year.
The left-hand column is the comparison
of the AEO and STEO results that are contemporaneous
and which the staffs were trying to coordinate. Then
NEAL R. GROSSCOURT REPORTERS AND TRANSCRIBERS
1323 RHODE ISLAND AVE., N.W.(202) 234-4433 WASHINGTON, D.C. 20005-3701 (202) 234-4433
1
1
2
3
4
5
6
7
8
9
10
11
12
13
14
15
16
17
18
19
20
21
222
3456
199
the right-hand column in the two groups is how it
looked three months later, so to speak, when the next
cycle of STEO came out, and it's not too bad, but you
can see that it's changing.
On the right-hand side on the bottom, we
went ahead to check and see what kinds of changes
were involved, and although the percentage change was
up by 50 percent perhaps, the amount of energy
difference was not. It was mostly in prices series
this year. The change in oil prices led to the NEMS
projections that are going a bit out of date.
Last year the same slide, which would
have been too many numbers, too many notes, the same
slide would have shown that the energy difference
would have gone up almost double so that, in fact,
the coordination has also left a less volatile or
more robust set of publications.
The rows in the two columns, the top row
would be of the 53 commonly reported series, the
series that are published in STEO that are also
published in the AEO. The first row is how many are
less than five percent. Then the next -- oh, all
NEAL R. GROSSCOURT REPORTERS AND TRANSCRIBERS
1323 RHODE ISLAND AVE., N.W.(202) 234-4433 WASHINGTON, D.C. 20005-3701 (202) 234-4433
1
1
2
3
4
5
6
7
8
9
10
11
12
13
14
15
16
17
18
19
20
21
222
3456
200
right.
So our sense of this is that this has
been successful and should continue. An important
improvement we're hoping to put in place is to make
the ability to compare more available to everybody.
What was done so far is a little bit of a special
project, and we're thinking we can just have anyone
can dial up as they can so many other things and
compare the two forecasts.
Art already mentioned that the schedules
of the two publications were brought to a more
contemporaneous outcome so that we're comparing
apples and apples better, and there's been a general
success in sensitizing everybody to being patient
with this so that when problems come up, people are
very cooperative and try to figure it out.
In fact, from my perspective the project
has had a very interesting outcome. Two years ago
there was a lot of skepticism that the differences in
the models were so substantial that the results
almost weren't commensurate. It was almost
unreasonable to compare them, and when the reasons
NEAL R. GROSSCOURT REPORTERS AND TRANSCRIBERS
1323 RHODE ISLAND AVE., N.W.(202) 234-4433 WASHINGTON, D.C. 20005-3701 (202) 234-4433
1
1
2
3
4
5
6
7
8
9
10
11
12
13
14
15
16
17
18
19
20
21
222
3456

201
for the differences were examined, a large proportion
of them were administrative. In other words, if the
series being compared were brought into a properly
defined basis, the differences would be much reduced.
So that a lot of what has gone on has
not really been structured to deal with the
substantive analytic content of the models, but
rather to do the administrative job of bringing them
on a common basis.
For 20 years the AEO has published five
forecasts, four of them being variations around a
base case where all prices and economic activity were
the source of the variations, and this kind of
comparative substance permits more numerical work to
be done to see how the models actually work.
When we started out, for example, we had
to make special runs to find out whether or not
changes in the economic assumptions would affect one
model more than the other, and they didn't as it
turned out, but it turns out there's a lot of routine
computing that can be done with the solutions that
are done that don't require any extra work that can
NEAL R. GROSSCOURT REPORTERS AND TRANSCRIBERS
1323 RHODE ISLAND AVE., N.W.(202) 234-4433 WASHINGTON, D.C. 20005-3701 (202) 234-4433
1
1
2
3
4
5
6
7
8
9
10
11
12
13
14
15
16
17
18
19
20
21
222
3456
202
begin to look at how the models work in an
underlying basis, how the assumptions drive the
solutions, which not only helps understand when you
compare the models, but can also be used to audit
each model individually, and in fact, we found for
each model issues that just pertain to that model
that came from a diagnostics.
The one there -- you can tell I'm an
economist -- is just a standard elasticity between a
dependent and independent variable.
We do have some examples. The example
at the top has to do with the nominal, since the
reasons why these are gross rather than net measures;
this has to do with the nominal price sensitivity of
oil, and in my view this is very plausible. The
literature very much supports these findings, and the
models really aren't very different, and this was
very reassuring to find that this came out of what
was going on.
The bottom group of elasticities has to
do with the supply price elasticity of gas, and in
the case of STEO, 1998 number is broad sign and
NEAL R. GROSSCOURT REPORTERS AND TRANSCRIBERS
1323 RHODE ISLAND AVE., N.W.(202) 234-4433 WASHINGTON, D.C. 20005-3701 (202) 234-4433
1
1
2
3
4
5
6
7
8
9
10
11
12
13
14
15
16
17
18
19
20
21
222
3456

203
large, which doesn't mean necessarily that anything
is wrong at all. It simply means that here's another
tool to investigate how the models are working and
something that comes up which is not back-of-the-
envelope intuitive. It provides a basis for further
study, and in the case of natural gas, STEO does have
a project underway to change some of its substantive
nature, and these numbers indicate just that. This
is an area that has to be worried about.
One of our thoughts is that since the
administrative part of this has worked so well, it
could very well be a resource to everyone if we
developed an information system, if you will, which
takes information of this kind and delivers it or
makes it available just to support the models.
CHAIRMAN WATKINS: Okay. Thank you.
Dan?
MR. RELLES: There's two kinds of
discussants in the world. One looks at your paper
with binoculars and comments extensively on the
details, and the other turns the binoculars around
and looks at it from a great distance because he
NEAL R. GROSSCOURT REPORTERS AND TRANSCRIBERS
1323 RHODE ISLAND AVE., N.W.(202) 234-4433 WASHINGTON, D.C. 20005-3701 (202) 234-4433
1
1
2
3
4
5
6
7
8
9
10
11
12
13
14
15
16
17
18
19
20
21
222
3456
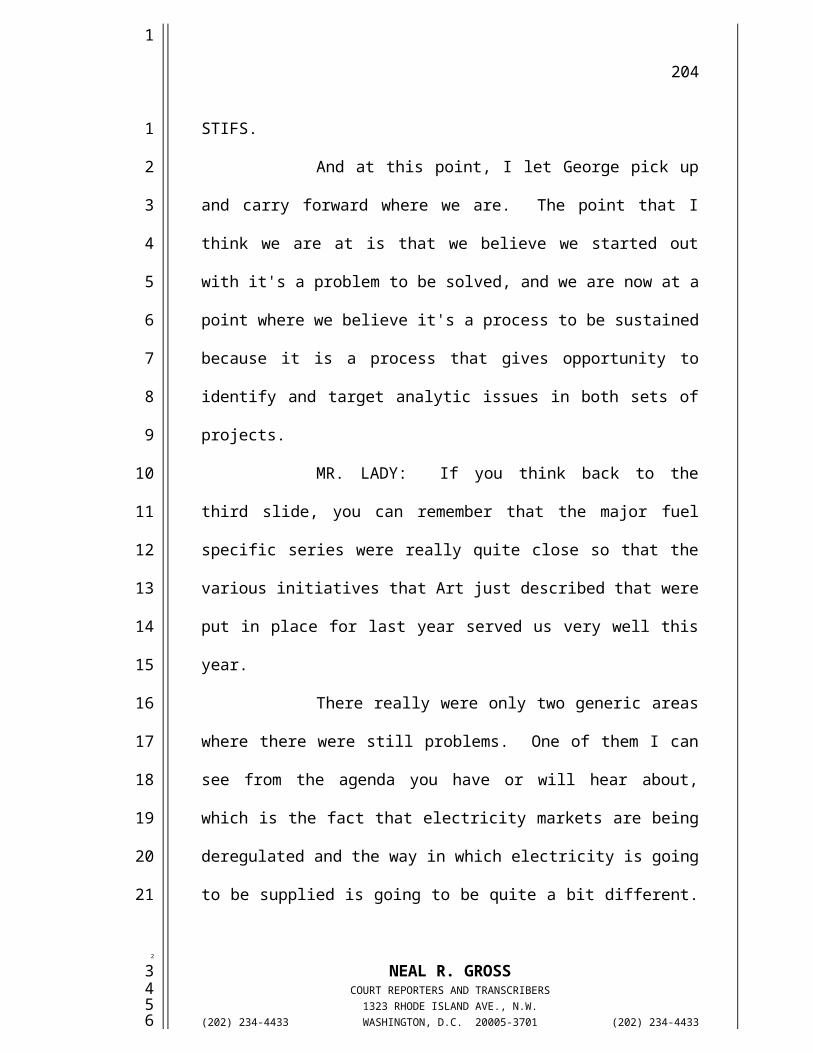
204
doesn't understand the details. I'm afraid I'm of
the latter type. So I apologize for not being able
to do the former.
I think this is an example of great
work. I think the discussions we've had in the past
about the differences has led to a fairly extensive
process that's also resulted in improved
understanding and improved forecasting for both of
these models, and I need to develop a point of view
on this review. So I guess the point of view I've
tried to adopt is how could we take this paper and
turn it into something that would be of greater
utility to EIA, and I'm thinking in terms of a
document that you can point to that will deal with
your future criticizers who basically say you're
always publishing numbers and they're always
inconsistent. I think finishing this off into a
paper that will be something you can point to as a
way to resolve these kinds of conflicts would be a
very good thing. So the comments I make will be kind
of focused on what it might take to do that, and I
guess I'm thinking of myself as the consumer, the
NEAL R. GROSSCOURT REPORTERS AND TRANSCRIBERS
1323 RHODE ISLAND AVE., N.W.(202) 234-4433 WASHINGTON, D.C. 20005-3701 (202) 234-4433
1
1
2
3
4
5
6
7
8
9
10
11
12
13
14
15
16
17
18
19
20
21
222
3456

205
person who's sort of ignorant of this process but
really wants to understand more about the details.
And I always find it helpful to adopt a
framework when I try to criticize something like
this. So I think the framework I'm going to adopt is
what I'll call the process improvement framework,
which I've had a little bit of experience with, and
it basically recognizes that process improvement
consists of three steps, three explicit steps, and
they should each be recognized and dealt with in
totality.
The first has to do with defining the
process you're trying to improve, drawing maps,
specifying details of it.
The second step has to do with defining
metrics that measure the process.
And the third talks about how you
improve on it. The metrics presumably show you where
you can do better, and then you go back to the
definition of the process and try to improve it.
And one reason that mapping of that
process is useful, it traces the information flows
NEAL R. GROSSCOURT REPORTERS AND TRANSCRIBERS
1323 RHODE ISLAND AVE., N.W.(202) 234-4433 WASHINGTON, D.C. 20005-3701 (202) 234-4433
1
1
2
3
4
5
6
7
8
9
10
11
12
13
14
15
16
17
18
19
20
21
222
3456

206
from the start till the finish, and it sort of forces
you to deal explicitly with the consumers, and that
was one thing I didn't see in this paper, was the
question of, well, who's the consumer of this
process. Who is this information flowing to?
Let me take a quick stab at defining the
process here, and this isn't necessarily the process,
but the process definition always starts with one
view and tries to get better.
So my process definition basically
starts with a bunch of data lists, a bunch of data
series, some of which get fed into STIFS and some of
which get fed into NEMS, both of which are complete
black boxes to me.
And what comes out of these is
apparently a bunch of comparison outputs that are
different and shouldn't be different, and we want to
understand them, and then presumably what goes on
beyond that, that's not well defined at the moment,
but I guess I'd like to identify two customers of it.
One would be the newspaper reporter who are very
important consumers of your work as the budget trend
NEAL R. GROSSCOURT REPORTERS AND TRANSCRIBERS
1323 RHODE ISLAND AVE., N.W.(202) 234-4433 WASHINGTON, D.C. 20005-3701 (202) 234-4433
1
1
2
3
4
5
6
7
8
9
10
11
12
13
14
15
16
17
18
19
20
21
222
3456
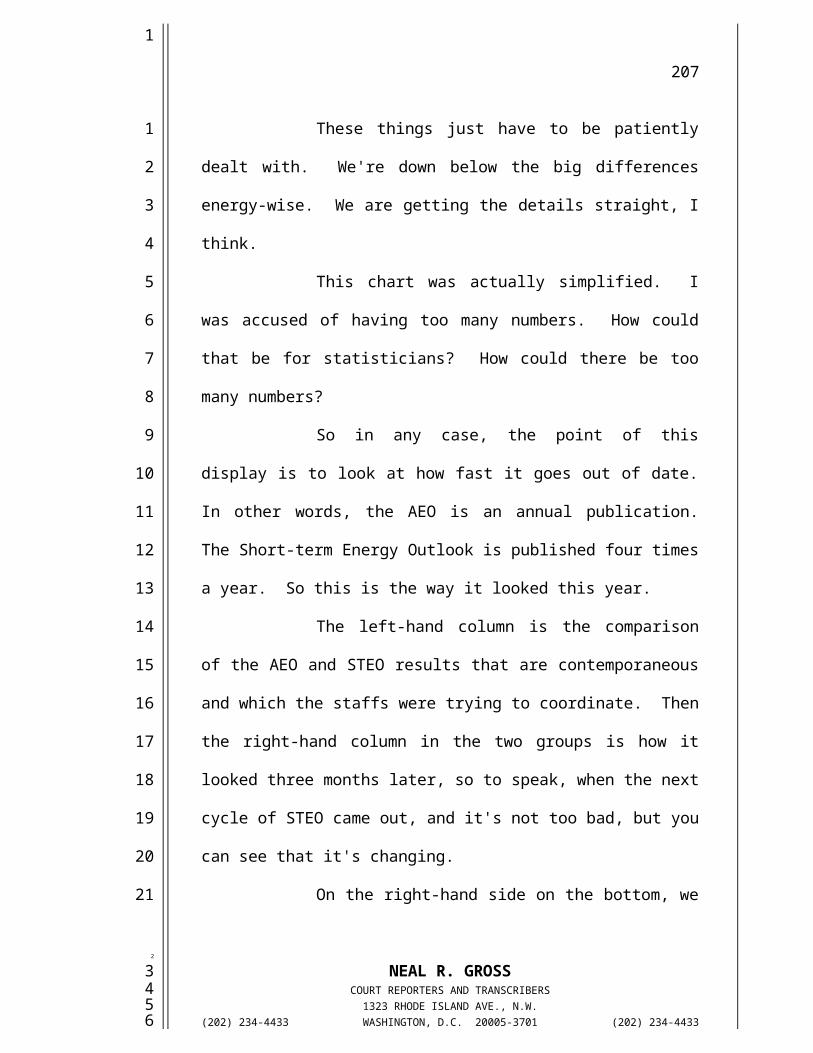
207
line we saw this morning attests to, and of course,
the modelers themselves.
The people who are doing these models
are consumers of these differences because they'll
take that information and kind of walk back here and
try to do additional things with it, like talk about
what data series are different and really shouldn't
be different; what data series ought to be added.
Essentially they'll take that information, go back
and figure out how to make both their processes
better, and I think that's one of the great things
that's come out of this process you're talking about,
namely, the NEMS models improved by incorporation of
more recent data and the STIFS models improve also
because they're aware of more of technology trends.
So that's my sort of instant definition
of the process. Again, I would ask the authors in
the revision, if there is a revision of this paper,
to try to explicitly recognize this process, and also
to fill in some more steps here because as a consumer
out here, I'm not benefitting a lot by hearing only
that the data series are sometimes different
NEAL R. GROSSCOURT REPORTERS AND TRANSCRIBERS
1323 RHODE ISLAND AVE., N.W.(202) 234-4433 WASHINGTON, D.C. 20005-3701 (202) 234-4433
1
1
2
3
4
5
6
7
8
9
10
11
12
13
14
15
16
17
18
19
20
21
222
3456

208
geographically or different in matters of inclusion,
et cetera. That doesn't give me enough insight to
understand why these things are different.
I think I need to hear something about
what's going on in these models that may be promoting
the differences. Step 1 might be to tell me that
this is autoregressive and that's not, but again, I
put in a plea for increasing the understanding of
what comes out here so that you can decide that the
comparisons are adequate or not adequate.
Step 2 is measurement, and that always
becomes a lot easier, I think, once you've laid out
the process because the measures have a consumer, and
one thing I think, and this also points out one thing
I think that can be improved in the current paper.
The modelers are consumer of this, but as a modeler
for me to be a consumer, you can't just tell me the
numbers are two percent different or three percent
different. You've got to tell me how different they
are relative to my uncertainty of these parameters.
So telling me something is five standard
deviations different tells me I ought to go back
NEAL R. GROSSCOURT REPORTERS AND TRANSCRIBERS
1323 RHODE ISLAND AVE., N.W.(202) 234-4433 WASHINGTON, D.C. 20005-3701 (202) 234-4433
1
1
2
3
4
5
6
7
8
9
10
11
12
13
14
15
16
17
18
19
20
21
222
3456

209
there and think about how I'm fitting that regression
coefficient in that module. Telling me something is
two percent different when, indeed, the uncertainty
difference is 20 percent is not helping me very much.
So I guess one thing I would observe
about the way the paper is currently structured is
it's much better now or it worked much better for the
newspaper reporter. The kind of thing that person
wants to do is report that these numbers are two
percent different or one percent different and say
that EIA doesn't think that's very much.
But as far as modeling I really would
like to see in this paper the incorporation of
uncertainty bands. That's just one of the metrics I
think will be worthwhile.
Another metric that will be worthwhile
would be -- and this isn't really a metric but
graphics -- we just had a graphics contest, and when
you're talking about 53 data series, and you're
trying to summarize how similar or how different they
are, it would be nice to have plots that will
indicate that.
NEAL R. GROSSCOURT REPORTERS AND TRANSCRIBERS
1323 RHODE ISLAND AVE., N.W.(202) 234-4433 WASHINGTON, D.C. 20005-3701 (202) 234-4433
1
1
2
3
4
5
6
7
8
9
10
11
12
13
14
15
16
17
18
19
20
21
222
3456

210
I realize you can't develop long time
series plots here because I think the STIFS forecasts
only go out for two or three years, but still in
thinking about kind of how you're going to measure
what comes out of here and, in particular, how are
you going to measure similarity or difference in the
outputs, I think that graphics would be quite useful.
As far as the process improvement end,
that's going wonderfully, I think. The paper is
really mostly about the improvements and the
successes that you've achieved, and the measures you
have chosen of series discrepancies are, indeed,
getting smaller. Indeed, as I indicated before,
you're improving things.
You're also improving the speed at which
you can do these comparisons. Some of the paper was
about automating the process of comparing the series,
and so I couldn't be more complimentary there.
Although I think there's a general
lesson in here, too, for improvement on other series
because what this really is, there's always something
else to compare a projection to. It may be that
NEAL R. GROSSCOURT REPORTERS AND TRANSCRIBERS
1323 RHODE ISLAND AVE., N.W.(202) 234-4433 WASHINGTON, D.C. 20005-3701 (202) 234-4433
1
1
2
3
4
5
6
7
8
9
10
11
12
13
14
15
16
17
18
19
20
21
222
3456

211
you've developed both these projections in house and
you have two groups who know a lot about them and you
can have a fairly extensive discussion about why
they're different and how to improve them, but even
when you're not both working in house, there's always
something you can compare a projection to. There are
other projections out there in the world, and it
would seem to me in general that this comes under the
title of reanalysis of models.
No model is ever really complete.
Models can always be improved and should always be
improved, subject to budgetary constraints. So I
guess I would sort of think there of reanalysis as
the generic step you're performing, and I think
everybody not only in EIA but in the rest of the
world needs to continually reanalyze the results of
their models.
I think it's fortuitous here that you
had two alternative and somewhat independently
developed methods for producing the same numbers.
Whoever made the decision that these things would not
get commingled together made a very wise decision in
NEAL R. GROSSCOURT REPORTERS AND TRANSCRIBERS
1323 RHODE ISLAND AVE., N.W.(202) 234-4433 WASHINGTON, D.C. 20005-3701 (202) 234-4433
1
1
2
3
4
5
6
7
8
9
10
11
12
13
14
15
16
17
18
19
20
21
222
3456

212
a way because it's enabled you to have independent
development of models and subsequent checking, and I
think when one has dependent development of models --
and that's what we always do really, you know -- we
all try to fit models, and in the end, we make
decisions among the three or four that look plausible
and probably report one. The fact that you got two
long-term, stable models here to compare, I think,
really helps make them both a lot better.
But, okay, I just want to applaud the
authors for the important findings and improvements
that they've developed and put in my own plug for
trying to further develop this paper into something
that can be more widely disseminated.
Thank you.
CHAIRMAN WATKINS: Okay. The discussion
is open to the Committee.
Greta.
MS. LJUNG: Yeah, I agree with Dan.
What you're trying to do is to make two point
predictions agree, and I think what you should be
doing is looking at prediction intervals. You know,
NEAL R. GROSSCOURT REPORTERS AND TRANSCRIBERS
1323 RHODE ISLAND AVE., N.W.(202) 234-4433 WASHINGTON, D.C. 20005-3701 (202) 234-4433
1
1
2
3
4
5
6
7
8
9
10
11
12
13
14
15
16
17
18
19
20
21
222
3456

213
see how those point predictions fall within the
intervals. So you need some kind of error band
around the predicted values.
Now, I don't know whether you can from
the models you have, whether you can generate those,
the standard errors and the predicted values, but
what you could do is fit some time series models and
if you have a probabilistic time series model, you
can develop prediction intervals, and those intervals
may not be too different from the intervals you might
get if you were able to develop and use the models
you have.
And doing a time series prediction would
give you an additional comparison as well to see how
your values stack up.
Now, also comparing them, there must be
some kind of true underlying values, some actual
values that are being generated as well, and I think
comparing your forecast to actual values would be
valuable.
Also, a question I had when you work
with the NEMS forecast short term, what is the impact
NEAL R. GROSSCOURT REPORTERS AND TRANSCRIBERS
1323 RHODE ISLAND AVE., N.W.(202) 234-4433 WASHINGTON, D.C. 20005-3701 (202) 234-4433
1
1
2
3
4
5
6
7
8
9
10
11
12
13
14
15
16
17
18
19
20
21
222
3456

214
on the long-term forecasts? Because obviously if
you're changing the short-term trend in the NEMS
prediction, that's going to have an impact on the
successive forecasts as well because they should be
correlated.
So I was wondering whether you have
looked at that at all.
CHAIRMAN WATKINS: I have some comments
I'd like to make myself. I have a feeling I was a
discussant in an earlier session on this issue.
Let me make two or three remarks. First
of all, of course, the models will yield different
results. They are different animals. They use
different data, but also to support what Dan was
saying, you've done a really good job now of
eliminating those data differences that could lead to
differences in the models to the extent that you can.
One very simple minded approach is to
say: all right. The STIFS is basically a quarterly
model. You could normalize everything to say the
annual data that comes out of NEMS so that it would
always add up to the NEMS annual total, and you'd get
NEAL R. GROSSCOURT REPORTERS AND TRANSCRIBERS
1323 RHODE ISLAND AVE., N.W.(202) 234-4433 WASHINGTON, D.C. 20005-3701 (202) 234-4433
1
1
2
3
4
5
6
7
8
9
10
11
12
13
14
15
16
17
18
19
20
21
222
3456

215
rid of, in effect, any difference between the two
outputs.
However, that means you're losing quite
a lot of information because as I understand the way
the STIFS operates, you get new information coming in
during the year, and you can reestimate your model
coefficients.
So in a way this updated information is
new information and provides you ostensibly with a
way of tracking what's going on within the year in
relation to whatever NEMS is predicting.
I think what doesn't come clearly from
me out of the paper as it's written at present is the
notion of the extent to which these differences
between the model outputs are systematic or not and
the relationship -- and I think Greta was touching on
this -- with the actual data as well.
By systematic I mean -- I think we saw
it on one of the other graphs -- is it always the
case that, say, STIFS estimates oil production to be
higher than NEMS. Is it always that way around?
Now, I think we want to relate that, and
NEAL R. GROSSCOURT REPORTERS AND TRANSCRIBERS
1323 RHODE ISLAND AVE., N.W.(202) 234-4433 WASHINGTON, D.C. 20005-3701 (202) 234-4433
1
1
2
3
4
5
6
7
8
9
10
11
12
13
14
15
16
17
18
19
20
21
222
3456

216
Dan and Greta both touched on this, to the errors.
To the extent that you can get an error term for each
forecast, that will give you the error band, but
you've still got a problem if you really see the
systematic difference.
And then the next question is if you see
the systematic difference, how does it relate to the
actual? Is there one model here that is, in effect,
doing better?
If it is, then maybe what you can have
is you can better link the models. I mean, let's say
for the sake of argument that the STIFS is on one
component persistently more accurate than the NEMS,
and you can see this systematic difference. Maybe
you have the right link between the two models by
using some kind of adjustment coefficient to the NEMS
that would tell you here are these results emerging
from STIFS. You know which way it's going to be. So
we can alter the NEMS projection right now just by
adjustment mechanism.
Another idea I had was that I haven't
thought through the analytics of it, but it's, again,
NEAL R. GROSSCOURT REPORTERS AND TRANSCRIBERS
1323 RHODE ISLAND AVE., N.W.(202) 234-4433 WASHINGTON, D.C. 20005-3701 (202) 234-4433
1
1
2
3
4
5
6
7
8
9
10
11
12
13
14
15
16
17
18
19
20
21
222
3456

217
in terms of explaining to the public what's going on.
One way of posing the question is: do these results,
in effect, emerge from the same population?
That question often arises with
regression analysis. Has the model changed? And a
difficult test to use there, the Chow test, to see
whether, in fact, when you have differential
coefficients could they have been drawn from the same
population. One approach or one avenue you might
look at is to see if you could adapt a Chow style
test to your results. Kind of ask yourself: well,
are they really totally different or could they
plausibly come from the same populations results?
So my suggestion is that what you've
done here is very valuable, and the ideas I've tried
to put forward here are ways in which maybe it could
be sharpened up a bit and focused on this,
particularly this question of whether the differences
are systematic or not, and it also has to be clearly
understood that these are models of estimating
different data because for some of the data in NEMS
you do not have the quarterly information. So, of
NEAL R. GROSSCOURT REPORTERS AND TRANSCRIBERS
1323 RHODE ISLAND AVE., N.W.(202) 234-4433 WASHINGTON, D.C. 20005-3701 (202) 234-4433
1
1
2
3
4
5
6
7
8
9
10
11
12
13
14
15
16
17
18
19
20
21
222
3456

218
course, you have to have a different model if you do
a quarterly assessment.
Chuck.
MR. BISCHOFF: Yeah, I'd like to make a
comment about the elasticities. Could we have that
chart with the elasticities back up again?
When we look at the elasticities in the
top part, we look at the elasticities of ST04496 or
AEO496, okay, for HIWOP and LOWOP, if you look at
those for 1996, we have an elasticity of .23 compared
with an elasticity of zero, an elasticity of .25
compared with an elasticity of zero. To me those are
very, very different elasticities. Okay?
So to me the statement that these
sensitivities are plausible is a little bit too
sanguine.
Yes?
MR. LADY: That just means that in NEMS,
which is a long-term model, they did not vary that
number across the oil price scenarios.
MR. BISCHOFF: In other words, there's
no impact effect is what you're saying?
NEAL R. GROSSCOURT REPORTERS AND TRANSCRIBERS
1323 RHODE ISLAND AVE., N.W.(202) 234-4433 WASHINGTON, D.C. 20005-3701 (202) 234-4433
1
1
2
3
4
5
6
7
8
9
10
11
12
13
14
15
16
17
18
19
20
21
222
3456

219
MR. LADY: No. It's important, I
believe, to view these as resources rather than
results. In other words, you would check and see why
that's true. You're right. That's very different,
but in this case there's no anomaly. There's no
misfunction.
MR. BISCHOFF: Okay, okay. The other
thing is with regard to Campbell's notion. One
thing, I don't know how you can compare these two
results with a Chow test, but one method that some
forecasters have used, and I think in particular,
there was an article by Fair and Shiller in the
American Economic Review about five years ago, where
they ran series of actual values on time series of
forecasts from two different models.
You need a time series for this. So you
need more than just three or four years, but if you
had a series, to see whether or not the coefficients
of the two model forecasts in predicting the actual
value were significantly different, and they
interpreted this as saying as a test of whether or
not the two different forecasts were based on
NEAL R. GROSSCOURT REPORTERS AND TRANSCRIBERS
1323 RHODE ISLAND AVE., N.W.(202) 234-4433 WASHINGTON, D.C. 20005-3701 (202) 234-4433
1
1
2
3
4
5
6
7
8
9
10
11
12
13
14
15
16
17
18
19
20
21
222
3456

220
different information.
So this might be something in the future
as you accumulate more ex ante forecast results that
you might be able to use.
Of course, your models change from year
to year. So you'd have to consider the model is not
really a set of equations, but the set of equations
and all the assumptions and the forecaster who makes
the forecast, but still it would be a way of
comparing the two models in a formal way to see
whether the differences are statistically significant
different.
CHAIRMAN WATKINS: Any comments from the
floor before we ask Art and George to reply?
(No response.)
CHAIRMAN WATKINS: No? You have the
floor.
MR. ANDERSEN: Well, I won't try to go
over all the comments. There is one thing that was
said at various points, and that is where you
understand differences to be other than housekeeping,
which George made the comment.
NEAL R. GROSSCOURT REPORTERS AND TRANSCRIBERS
1323 RHODE ISLAND AVE., N.W.(202) 234-4433 WASHINGTON, D.C. 20005-3701 (202) 234-4433
1
1
2
3
4
5
6
7
8
9
10
11
12
13
14
15
16
17
18
19
20
21
222
3456

221
That's when you get to a point to my
mind where this exercise is a true resource
potentially in that you ask the question once you
adjusted all of this: is there a reason for you to
understand why these differences persist or are
evident, and is it because one's wrong?
So that's the beginning point in my
judgment where you help to focus your analysis, and
there are several areas where I think we are, in
fact, looking more closely, perhaps in part because
of this exercise, looking more closely at
differences. The STEO is, of course, refreshed by
data year by year and does things like oil
production, does things on consumption of
electricity, does things on gasoline.
We have in the NEMS a system which sort
of moves through taking into account a variety of
considerations in oil, the notion of the tradeoff
between depletion versus technological change, and
one can at any one point in time be more or less
optimistic about that tradeoff.
The fact that in the NEMS you've tended
NEAL R. GROSSCOURT REPORTERS AND TRANSCRIBERS
1323 RHODE ISLAND AVE., N.W.(202) 234-4433 WASHINGTON, D.C. 20005-3701 (202) 234-4433
1
1
2
3
4
5
6
7
8
9
10
11
12
13
14
15
16
17
18
19
20
21
222
3456

222
in the past to have somewhat more rapid decline in
oil production versus what's being realized in the
current data and then what's being realized in the
STEO in their forecast as they refresh their
parameters means that maybe it's appropriate for us
to reexamine the tradeoff between depletion and
technological change, and that's been an area of
examination, the other uses, if you will.
It's always been a puzzle. We've always
worried about it, but it's much more a focus of
analysis at this stage of the game than a residual to
take into account because, in effect, the refreshing
of STEO tends to make a liar out of us with regards
to what's happening to the growth rate for
electricity.
So there is another place where I think
the analysis has been sharpened.
On the other hand, STEO has had no way
of taking into account the consequences of
requirements with regards to the efficiency of
various appliances, and we've been able to provide a
way of that being taken into account in the STEO
NEAL R. GROSSCOURT REPORTERS AND TRANSCRIBERS
1323 RHODE ISLAND AVE., N.W.(202) 234-4433 WASHINGTON, D.C. 20005-3701 (202) 234-4433
1
1
2
3
4
5
6
7
8
9
10
11
12
13
14
15
16
17
18
19
20
21
222
3456
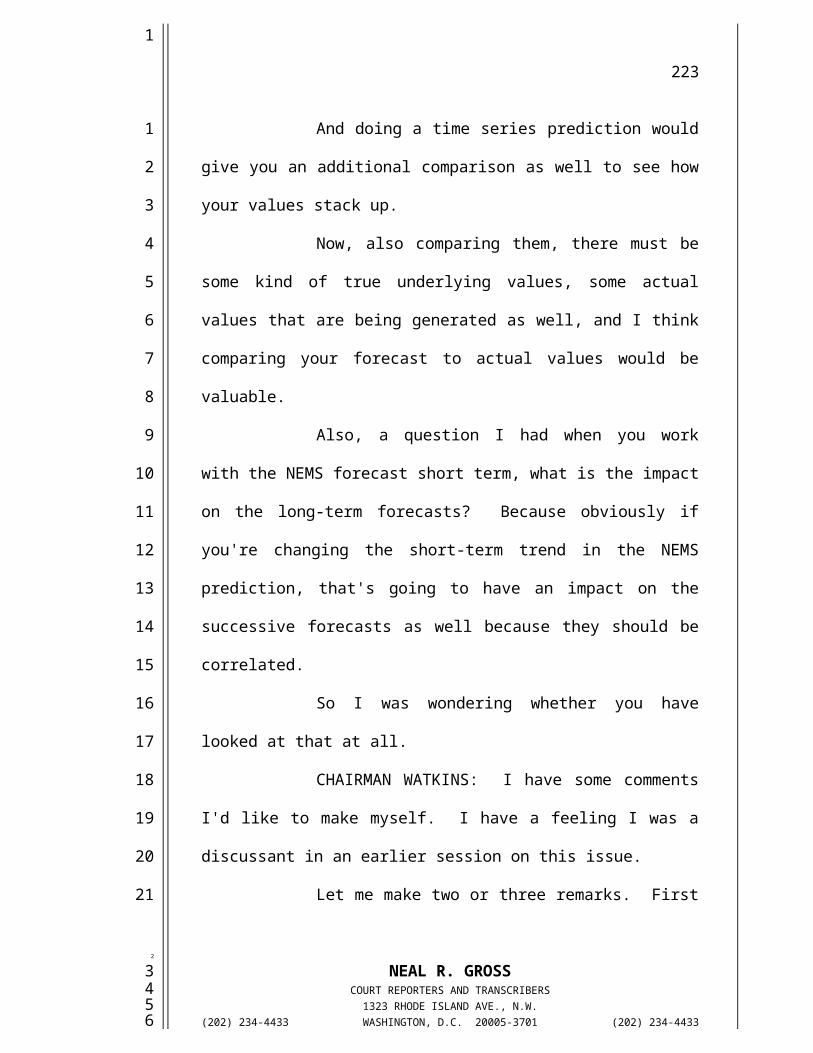
223
exercise.
Everybody knows in gasoline that there's
a big uncertainty in terms of driving characteristics
through time. The U.S. is involved in a serious
change in terms of demographics. The NEMS reflects
certain judgments about how those demographics will
play out, but, again, the data comes in, and it's an
ongoing test.
And so the issue of trying to identify
differences that seem to be in the two models,
particularly after you've adjusted for all of these
housekeeping details is, I think, the heart of this
reexamination and planning of your analysis agenda.
I mean you can't use two years as the
whole thing with regards to your analysis agenda in
that there are lots of things that are kicking in
some years out, but it is a tool in that regard.
CHAIRMAN WATKINS: Thank you.
Well, we'll take -- do you have anything
to add, George?
MR. LADY: In terms of the notion of
error bounds and the Chow test for looking for
NEAL R. GROSSCOURT REPORTERS AND TRANSCRIBERS
1323 RHODE ISLAND AVE., N.W.(202) 234-4433 WASHINGTON, D.C. 20005-3701 (202) 234-4433
1
1
2
3
4
5
6
7
8
9
10
11
12
13
14
15
16
17
18
19
20
21
222
3456

224
structural change or what we used to call
backcasting, which was to take a conditional forecast
and then run the proper values for the assumptions
through the simulation rather than the projected
ones, this would work much better for STIFS, and
STIFS in one form or another has been used by EIA for
decades, two decades anyway, and these things are
done basically to test the structural change and to
decompose the error between estimation errors and the
conditional problems of the forecast.
With NEMS it's a lot harder, and I'm not
even sure that there's really a state-of-the-art in
hand to bring the same ideas with the same rigor to
the NEMS forecast. I'm just not sure, and it was in
my mind at least that the elasticities, as an
example, you could derive diagnostics which begin to
speak to these issues even though they wouldn't have
the same rigor and the same literature to support
them.
So these are very proper ideas, but NEMS
is a hard model to organize in the same fashion that
one that is just outright fitted to data and
NEAL R. GROSSCOURT REPORTERS AND TRANSCRIBERS
1323 RHODE ISLAND AVE., N.W.(202) 234-4433 WASHINGTON, D.C. 20005-3701 (202) 234-4433
1
1
2
3
4
5
6
7
8
9
10
11
12
13
14
15
16
17
18
19
20
21
222
3456

225
estimated in a standard statistical regime.
MR. RELLES: Well, if I could just make
a comment, there are methods that we could still
consider using for something like that. The
bootstrap, where parameters are based on surveys,
would be one possibility or just perturbing things
and seeing what makes a difference.
What you really want to understand is
the sensitivity of an inference to data and
assumptions, and even if you can't analytically
derive a formula for a standard error on it, I still
think it's helpful to generate five or ten different
values and see if you have stability or not.
MR. LADY: Well, that's what the
diagnostics would do. The elasticity, the measures
that come out of elasticity.
CHAIRMAN WATKINS: Greta?
MS. LJUNG: Could I just ask about
longer term forecasts? How stable are those? If the
short-term forecasts, NEMS forecasts change, how are
the long-term forecasts impacted? Have you looked at
that?
NEAL R. GROSSCOURT REPORTERS AND TRANSCRIBERS
1323 RHODE ISLAND AVE., N.W.(202) 234-4433 WASHINGTON, D.C. 20005-3701 (202) 234-4433
1
1
2
3
4
5
6
7
8
9
10
11
12
13
14
15
16
17
18
19
20
21
222
3456

226
MR. ANDERSEN: Well, I'm not sure
exactly what the best answer is, but I think the
answer is reasonably stable with regards to if I
understood it, if you remove benchmarking, we'll say,
with regards to the NEMS forecast in years out, will
it make much difference in the years out, and the
answer is no, but it makes a big difference if we're
doing something that underestimates, say, the
underlying growth rates for other uses.
MS. LJUNG: So you are saying it varies
from series to series. It varies from case to case
how they are impacted in long terms.
I would think that if you fudge a little
bit with the short-term forecast, the long-term
forecast -- it could have a big impact on the long-
term forecasts.
MR. ANDERSEN: Well, if we, for
instance, just simply keyed the STEO numbers in
relative to the NEMS projection, the underlying
behavioral characteristics of NEMS probably would not
change. In that sense it would be stable. That's
what I was trying to say.
NEAL R. GROSSCOURT REPORTERS AND TRANSCRIBERS
1323 RHODE ISLAND AVE., N.W.(202) 234-4433 WASHINGTON, D.C. 20005-3701 (202) 234-4433
1
1
2
3
4
5
6
7
8
9
10
11
12
13
14
15
16
17
18
19
20
21
222
3456
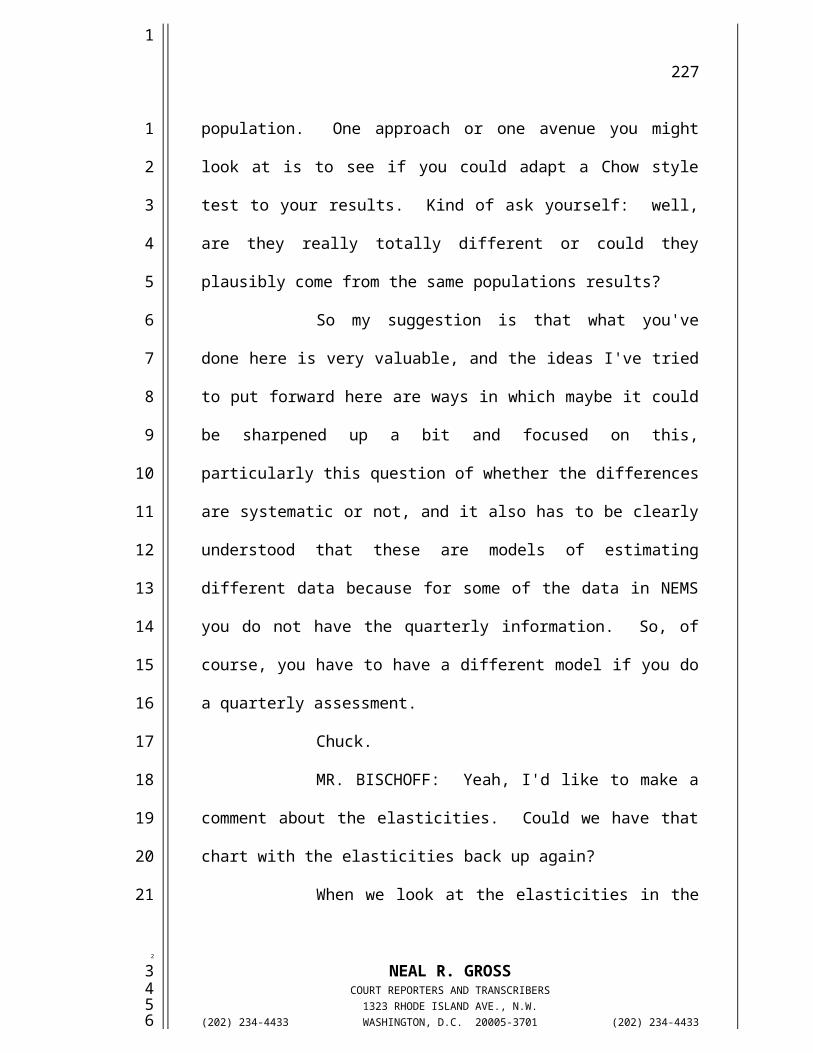
227
Does that --
MS. LJUNG: Well, I was just wondering
whether you had studied that at all. I mean you're
talking about studying the short-term forecast. I
was just wondering whether you had looked longer
term, at the impact on longer term.
MR. ANDERSEN: Well, the levels make
much less difference than the behavioral implications
of the sources of differences, I guess, the way I
think about it.
CHAIRMAN WATKINS: You get an
opportunity in the next session to bring it up as
well, Greta.
Can we take a short break, and then
we're back on NEMS with Susan Shaw?
(Whereupon, the foregoing matter went off the record
at 3:00 p.m .and went back on the record
at 3:10 p.m.)
CHAIRMAN WATKINS: Okay. Could we
reconvene, please?
NEMS, again, is in the news. So we've
just had part of the last session on NEMS, and now we
NEAL R. GROSSCOURT REPORTERS AND TRANSCRIBERS
1323 RHODE ISLAND AVE., N.W.(202) 234-4433 WASHINGTON, D.C. 20005-3701 (202) 234-4433
1
1
2
3
4
5
6
7
8
9
10
11
12
13
14
15
16
17
18
19
20
21
222
3456

228
return to it again.
Susan Shaw.
MS. SHAW: Okay. Thank you.
Of course the next part of this program
is reviewing this document, the National Energy
Modeling Systems and overview. I just have a few
introductory remarks about this.
As you probably know, we have rather
extensive documentation requirements for all of the
models at EIA, and unfortunately that does make the
documentation rather voluminous. I estimate NEMS
documentation total is about a foot thick which
sometimes isn't very useful for people who say, "What
is NEMS?"
So rather early on we decided it would
be useful to have some sort of a capsule summary of
the model and its capabilities that we could hand out
to people just like the briefing that Scott and I did
this morning for some people from the Netherlands.
So the purpose of this in our mind was
to have a fairly summary report, somewhat slim, that
would describe the general methodology of the model,
NEAL R. GROSSCOURT REPORTERS AND TRANSCRIBERS
1323 RHODE ISLAND AVE., N.W.(202) 234-4433 WASHINGTON, D.C. 20005-3701 (202) 234-4433
1
1
2
3
4
5
6
7
8
9
10
11
12
13
14
15
16
17
18
19
20
21
222
3456

229
describe in a very general form the computation steps
in each of the modules, and answer some very basic
questions that we do get asked like: what's the
regional structure of NEMS? Is it an econometric
model? It is an optimization model? Those sorts of
very general questions.
And we also wanted to provide some means
of presenting the inputs and the outputs to the
different models so that somebody could get a concept
of the different factors and features of energy
markets that we took into account in doing the
projections.
It was also a goal to have this a sort
of mid-level of complexity. The report is not meant
to be an energy primer. It does say up front in the
introduction that we expect a reader to be
knowledgeable with terms from economics and
operations research and energy and energy modeling.
On the other hand, it is not meant to be
documentation. I pride myself in the fact that there
is not a single equation in this report. At some
level if people want to know more, then they can go
NEAL R. GROSSCOURT REPORTERS AND TRANSCRIBERS
1323 RHODE ISLAND AVE., N.W.(202) 234-4433 WASHINGTON, D.C. 20005-3701 (202) 234-4433
1
1
2
3
4
5
6
7
8
9
10
11
12
13
14
15
16
17
18
19
20
21
222
3456

230
to the detailed documentation that we do have on each
of the components.
And it is not meant to be a user's
guide, and so that is sort of the purpose of this.
NEMS does change every year. There are always
updates to the methodology. We decided that probably
updating it biennially. That we really didn't need
to do this every year.
This latest version was done in March of
'96, and it captures the model as it was used in the
Annual Energy Outlook '96, which means that we're due
to update it this coming year for the AEO '98.
Hopefully we'll publish it very shortly after the
first of the year, and so now is really the
appropriate time to step back, take a look at it, and
see if there is anything we want to do for this next
round.
I presented some questions through
Renee. I guess my questions would be: is there any
additional material that might be added with the
overall idea of keeping it somewhat nontechnical and,
you know, fairly compact? Is there any better way to
NEAL R. GROSSCOURT REPORTERS AND TRANSCRIBERS
1323 RHODE ISLAND AVE., N.W.(202) 234-4433 WASHINGTON, D.C. 20005-3701 (202) 234-4433
1
1
2
3
4
5
6
7
8
9
10
11
12
13
14
15
16
17
18
19
20
21
222
3456

231
represent graphically the inputs and the outputs? We
have a diagram of this sort for each of the models.
And finally, do people find the
discussions of the different modules relatively
balanced in their coverage?
CHAIRMAN WATKINS: Charles will be the
discussant.
MR. BISCHOFF: Do we have somebody who
can operate the overhead for me? David, could you?
First, let me say that overall I feel
that this is an excellent report on the National
Energy Modeling System. It is easy to ready,
generally nontechnical, but detailed enough of the
basic structure that the model is clearly explained.
And the model itself is an admirable
thing. I am much in awe of it and the ground amount
of work which went into its construction. However,
I'm here to criticize. I'm here to be critical, and
in particular, to ask Susan's three questions about
it.
So without further ado, I will take the
three questions in reverse order as that seems to me
NEAL R. GROSSCOURT REPORTERS AND TRANSCRIBERS
1323 RHODE ISLAND AVE., N.W.(202) 234-4433 WASHINGTON, D.C. 20005-3701 (202) 234-4433
1
1
2
3
4
5
6
7
8
9
10
11
12
13
14
15
16
17
18
19
20
21
222
3456

232
the increasing order of difficulty.
The third question which I will deal
with first is: do you feel the narrative
descriptions of the modules are balanced relative to
each other? There are two sub modules which I felt
were not given their fair share of space: the
international energy module and the macroeconomic
activity module.
With the respect to the macroeconomic
activity module, of course much has been written
about the DRI model, and it may seem that nothing
needs to be said about it here, but I think that is
not true for three reasons.
One, this report should be self-
contained so that it should include a summary of the
DRI model.
Second, more recent macro models, such
as real business cycle models, vary greatly in
structure from the basically Keynesian DRI model. A
summary of its structure is needed lest anyone become
confused about what type of macro model is used.
Third, both the national sub model and
NEAL R. GROSSCOURT REPORTERS AND TRANSCRIBERS
1323 RHODE ISLAND AVE., N.W.(202) 234-4433 WASHINGTON, D.C. 20005-3701 (202) 234-4433
1
1
2
3
4
5
6
7
8
9
10
11
12
13
14
15
16
17
18
19
20
21
222
3456

233
the inter-industry sub model are response service
approximations to the actual DRI models. More needs
to be said about these approximations than the few
sentences included here which say simply that they
exist.
As for the international energy module,
there is barely a page of text for this important
module. Although the text is clear, there is a good
deal more information that could be given. I will
detail this under the third portion of my discussion.
Moving on to the second question, do you
have any recommendations for an improved way to
present graphically the interrelationships of the
modules and the National Energy Modeling System?
First, let me say that some of the
figures in this report are completely wasted. I have
in mind especially Figures 1, 2, 3, 10, 15, and 17.
Let us start with Figure 2.
Okay. This is Figure 2. This figure,
which is intended to give an overview, shows
virtually nothing at all. It could have been
replaced by the sentence "each of the 12 modules
NEAL R. GROSSCOURT REPORTERS AND TRANSCRIBERS
1323 RHODE ISLAND AVE., N.W.(202) 234-4433 WASHINGTON, D.C. 20005-3701 (202) 234-4433
1
1
2
3
4
5
6
7
8
9
10
11
12
13
14
15
16
17
18
19
20
21
222
3456
234
feeds input into the integrated module and gets
output from the integrated module." And we see 12
modules around the integrated module, and we see them
going back and forth. There's no information in this
diagram.
Okay. More than one half page could be
saved. An example of a graph which is really useful
is Figure 9, Exhibit 2, okay, which shows the
international of a national gas transmission and
distribution module and five other modules.
Now, it might not be possible to draw a
graph with comparable detail for the whole NEMS, but
if you can't, please don't waste space with something
like Figure 2.
Now, Figures 1, 3, 10, 15, and 17 are
essentially uninformative maps. Figure 1, Exhibit 3,
for example, shows nine Census divisions. Okay. How
does this advance our understanding of the NEMS
module? You could have the sentence "we have nine
geographical Census divisions." Okay.
Some of the maps, however, are quite
helpful, such as Figure 7, 8 and 11. See, for
NEAL R. GROSSCOURT REPORTERS AND TRANSCRIBERS
1323 RHODE ISLAND AVE., N.W.(202) 234-4433 WASHINGTON, D.C. 20005-3701 (202) 234-4433
1
1
2
3
4
5
6
7
8
9
10
11
12
13
14
15
16
17
18
19
20
21
222
3456

235
example, Exhibit 4, Figure 7. Now, this shows
something that you need to show in a figure. It
shows where gas comes in and out of the country.
Okay? So this is a place where a map is really
useful as opposed to just a regional breakdown.
Okay. Other figures which are
relatively good includes Figures 3, 4, 6, 9, 13, 16,
and 20. Figures which could be strengthened include
12, 14, 18, 19, and 21.
The major improvements in figures would
be to show just which other modules are affected by
parts of the module under discussion and how the
interactions occur.
Okay. Now, the third part of my
comments answers the question "do you have any
recommendations for additional material that could be
useful in a nontechnical summary of the National
Energy Modeling System?"
Okay. I do, indeed, and my
recommendations relate to the fact that not a single
number relating to any estimate of a parameter
appears anywhere in the 53 pages in the body of this
NEAL R. GROSSCOURT REPORTERS AND TRANSCRIBERS
1323 RHODE ISLAND AVE., N.W.(202) 234-4433 WASHINGTON, D.C. 20005-3701 (202) 234-4433
1
1
2
3
4
5
6
7
8
9
10
11
12
13
14
15
16
17
18
19
20
21
222
3456

236
document. Put differently, this entire document
could have been put together before a single
parameter was estimated simply on the basis of the
theoretical structure of the model.
Now, I am very aware by inference and by
what Susan said explicitly that it was not the
purposes of the authors of this sub model to include
statistical results. Many statistics were available,
and they chose to leave them out, but I would argue
that one cannot get in, quote, an overview of the
model without knowing some of the numerical results.
Now, let me refer to one article and one
book in the macroeconomics literature, which is,
after all, my field, which gives the kinds of model
overview which I think would be appropriate in this
document.
One article is "The Channels of Monetary
Policy," by Frank DeLeeuw and Edward M. Gramlich in
the Federal Reserve Bulletin, Volume 55, June 1969,
pages 472 to 491.
The second is "The DRI model of the U.S.
Economy," by Otto Eckstein, McGraw-Hill, 1983.
NEAL R. GROSSCOURT REPORTERS AND TRANSCRIBERS
1323 RHODE ISLAND AVE., N.W.(202) 234-4433 WASHINGTON, D.C. 20005-3701 (202) 234-4433
1
1
2
3
4
5
6
7
8
9
10
11
12
13
14
15
16
17
18
19
20
21
222
3456

237
Neither of these reports give full
details on the empirical results. Okay? But certain
key results are highlighted. Now, they do contain
equations, but you wouldn't have to have equations.
You could simply have tables of elasticities or
multipliers.
For example, Table 1, Exhibit 5, from
"The Channels of Monetary Policy" gives direct
effects of a monetary change. Now, this is broken
down through the cost of capital channel, the wealth
channel, and the total channel. So essentially we
have simulations of sub modules of this large
macroeconomic model, and all of this is really only
the demand side of the model.
Now, if we go to the next diagram, the
next figure, Figure 6, now we have the overall
multipliers. Okay. Now, clearly, one can find these
numbers in other places. Okay. One can find numbers
like this by reading the Annual Energy Outlooks for
1994, '95, '96, and '97. If you look in the back,
you can figure out some of these multipliers. Okay?
If you look in the 25 or so supporting
NEAL R. GROSSCOURT REPORTERS AND TRANSCRIBERS
1323 RHODE ISLAND AVE., N.W.(202) 234-4433 WASHINGTON, D.C. 20005-3701 (202) 234-4433
1
1
2
3
4
5
6
7
8
9
10
11
12
13
14
15
16
17
18
19
20
21
222
3456

238
volumes that are listed in the bibliography of this
paper, you can find some of these numbers, but
there's no place where they are listed
systematically.
Now, let me go on to Figure 7 and 8 from
Eckstein's book. Here again we see the sort of
things you see in the econometrics literature:
fiscal policy multipliers under various monetary
assumptions. Okay. So we assume that the interest
rate is held constant or the money supply is held
constant.
We on go to Figure 8. We see the supply
side effects. Okay. These are the sort of tables,
nontechnical tables, tables that you don't have to be
a specialist to understand, that I would like to see
in the paper.
Now, let me give you some examples
specifically from the energy sector. Some of the 25
or so supporting papers give the kind of useful
summary, empirical results I am talking about, but it
would be necessary to go through each of the modules
and identify which elasticities of key outputs with
NEAL R. GROSSCOURT REPORTERS AND TRANSCRIBERS
1323 RHODE ISLAND AVE., N.W.(202) 234-4433 WASHINGTON, D.C. 20005-3701 (202) 234-4433
1
1
2
3
4
5
6
7
8
9
10
11
12
13
14
15
16
17
18
19
20
21
222
3456

239
respect to which key inputs need to be reported.
For example, in the international energy
module, I would like to run this module to see the
elasticity of world oil price with respect to OPEC
production path; the elasticity of world oil price
with respect to U.S. crude oil production; the
elasticity of world oil price with respect to U.S.
crude oil demand; the elasticity of crude oil import
supply with respect to each of these factors, and so
forth and so forth.
All of these elasticities would need to
be reported in the short, medium, and long runs.
Let me report some material I found in
the underlying documents. From studying the modeling
developers' appendix to the national documentation
report, NEMS macroeconomic activity module, I found
Exhibit 9. Okay. I pulled these elasticities off of
five different pages. These are five different
scenarios. These are elasticities not of the whole
NEMS model, but only the macroeconomic activity
module and only the response surface approximation,
but still we've got elasticities of GDP, domestic
NEAL R. GROSSCOURT REPORTERS AND TRANSCRIBERS
1323 RHODE ISLAND AVE., N.W.(202) 234-4433 WASHINGTON, D.C. 20005-3701 (202) 234-4433
1
1
2
3
4
5
6
7
8
9
10
11
12
13
14
15
16
17
18
19
20
21
222
3456

240
unit sales of automobiles, and CBI with respect to
world oil prices in five different time periods for
five different scenarios, and this is the sort of
thing that I think if you go through and carefully
select which variables are the key variables in each
model, the key output variables and the key input
variables and produce the elasticities, you would
have a much more useful book.
I'll finally go on to Exhibit 10. From
the industrial sector demand module, the National
Energy Modeling System, I found a matrix of own and
cross-price elasticities, fuel price elasticities.
Again, somebody who knows a little bit about
econometric modeling in the oil and gas business
could find these elasticities extremely useful as
part of the NEMS model.
Okay. Now, there's a reason why the
parameters of a model are estimated. If a model is
just as useful without the estimates, why do we
estimate?
To pick a homely example from
macroeconomics, it is as if this book described the
NEAL R. GROSSCOURT REPORTERS AND TRANSCRIBERS
1323 RHODE ISLAND AVE., N.W.(202) 234-4433 WASHINGTON, D.C. 20005-3701 (202) 234-4433
1
1
2
3
4
5
6
7
8
9
10
11
12
13
14
15
16
17
18
19
20
21
222
3456

241
ISLM model qualitatively, which is indeed valuable in
itself, but left out all the multipliers.
Well, when I made this argument to one
of my colleagues, of course, he pointed out that
there wasn't a single number in Keynes' general
theory and it was still valuable. Okay. So I guess
I must qualify my comments to that extent.
Well, I have had my say. Perhaps the
EIA doesn't want any numbers in this book, but that
is not the practice of econometricians when
describing their models, and I feel the addition of
numbers to this book would make it much more useful,
but then it would also represent a lot more work.
CHAIRMAN WATKINS: Did you want to
comment on Charles' comments right now? Do you want
to defer?
MS. SHAW: No.
CHAIRMAN WATKINS: Any other comments
from the Committee on this presentation?
I had one question. Can you find the
set of --
(Laughter.)
NEAL R. GROSSCOURT REPORTERS AND TRANSCRIBERS
1323 RHODE ISLAND AVE., N.W.(202) 234-4433 WASHINGTON, D.C. 20005-3701 (202) 234-4433
1
1
2
3
4
5
6
7
8
9
10
11
12
13
14
15
16
17
18
19
20
21
222
3456

242
CHAIRMAN WATKINS: Charles, you still
have it? Figure 7 from the NEMS.
MR. BISCHOFF: Figure 7?
CHAIRMAN WATKINS: Yes.
MR. BISCHOFF: That's from Eckstein.
CHAIRMAN WATKINS: No. Well, my
question is these double arrow directions.
PARTICIPANT: It's the "For Natural Gas
Trade Via Pipeline."
CHAIRMAN WATKINS: The pipeline flows.
MR. BISCHOFF: This one.
CHAIRMAN WATKINS: I just wanted to make
sure I understand this. These double arrowed flows,
are they indicating reversibility of pipeline flows?
MS. SHAW: I think in the case of
Mexico, yes, because we're --
CHAIRMAN WATKINS: Yeah, I understand
Mexico. It's really the Canadian border ones.
MS. SHAW: No, not really.
MR. BISCHOFF: I guess I wanted to
second. Maybe this one has got a problem, too.
MS. SHAW: We are only dealing with
NEAL R. GROSSCOURT REPORTERS AND TRANSCRIBERS
1323 RHODE ISLAND AVE., N.W.(202) 234-4433 WASHINGTON, D.C. 20005-3701 (202) 234-4433
1
1
2
3
4
5
6
7
8
9
10
11
12
13
14
15
16
17
18
19
20
21
222
3456

243
imports from Canada, but Mexico really can go either
way.
CHAIRMAN WATKINS: Yeah, and does.
MS. SHAW: Yes.
CHAIRMAN WATKINS: I understand that. I
think you're okay in eastern Ontario because there is
a link going both ways there. I'm not aware, for
example of movements of gas from the Rocky Mountain
states, say, into Canada, which I take it those
arrows are intended to depict.
So I guess my comment is whether that
particular illustration is accurate or am I
misinterpreting what you mean with those?
MR. SITZER: I think it's simply
indicating the potential for two-way flows.
CHAIRMAN WATKINS: Oh, okay.
MR. SITZER: But in actuality it's one
way in terms of Canada importing to the U.S. or
exporting to the U.S.
CHAIRMAN WATKINS: Okay. That's my
question.
MR. SKARPNESS: This is going back to
NEAL R. GROSSCOURT REPORTERS AND TRANSCRIBERS
1323 RHODE ISLAND AVE., N.W.(202) 234-4433 WASHINGTON, D.C. 20005-3701 (202) 234-4433
1
1
2
3
4
5
6
7
8
9
10
11
12
13
14
15
16
17
18
19
20
21
222
3456

244
what Charles is saying. There used to be some
information out in the Pacific Ocean about what the
actual volumes were going across these. In this
particular graph, I've seen this before, and out here
there were some numbers about, you know, how many
cubic million metric or, you know, volume that was
going across between Mexico and so forth, and now
it's missing.
Again, you know, I don't know if it
causes a problem, but --
MS. SHAW: That might have been a data
report? Because the volumes are going to change each
year, the projections.
MR. SKARPNESS: I mean, it was a
particular year, yeah, that they were assessing.
MR. HAKES: That's not meant to be a
portrayal of reality. It just shows what the model
can handle. I mean those liquified natural gas
important terminals, one of them has been mothballed
for many years and isn't in use, but at least the
model has the capability of dealing with it if it
occurs.
NEAL R. GROSSCOURT REPORTERS AND TRANSCRIBERS
1323 RHODE ISLAND AVE., N.W.(202) 234-4433 WASHINGTON, D.C. 20005-3701 (202) 234-4433
1
1
2
3
4
5
6
7
8
9
10
11
12
13
14
15
16
17
18
19
20
21
222
3456

245
So it's not meant to be a portrayal of
data.
MR. SKARPNESS: But this particular
graph did have actual numbers there at one point, and
then they've been removed. It was just, again, if
you were going to go along Charles' lines and add
some elasticity numbers in there, you know, I mean,
those numbers are good for a particular year, and
then you would also need -- maybe that's one of the
problems -- you would also need some of this
accompanying, you know, volume information to go
along with that.
CHAIRMAN WATKINS: Greta.
MS. LJUNG: On the graphs, I felt that
Charles was really quite -- quite references, and I
actually like Figure No. 2. It gives the names of
all the modules. So I think it serves some purpose.
I don't see it necessarily ahead of -- before that,
and I also like the other charts.
MR. BISCHOFF: Well, Greta and I
disagreed on which graphs to vote for in the context,
too.
NEAL R. GROSSCOURT REPORTERS AND TRANSCRIBERS
1323 RHODE ISLAND AVE., N.W.(202) 234-4433 WASHINGTON, D.C. 20005-3701 (202) 234-4433
1
1
2
3
4
5
6
7
8
9
10
11
12
13
14
15
16
17
18
19
20
21
222
3456

246
(Laughter.)
MS. SHAW: In the spirit of keeping it
self-contained in this, I'm not sure that everybody
knows what Census divisions and Census regions are.
CHAIRMAN WATKINS: Okay. Any other
comments?
Any comments from the floor?
MR. GRAPE: I had one. I decided --
CHAIRMAN WATKINS: Please identify
yourself.
MR. GRAPE: Oh, sorry. I'm Steve Grape.
I'm with the Dallas field office of EIA.
I work in the Domestic Reserves Program,
and we try to avoid your comments regarding more
involvement of the world oil or international oil
input into the domestic model and are actually
demanding that. I just raise my eyebrows because the
Russians don't even define reserves the same way as
we do. They incorporate more than a third of their
actual resources as actual proved reserves, and
they're not on the same playing field. It becomes
apples and oranges.
NEAL R. GROSSCOURT REPORTERS AND TRANSCRIBERS
1323 RHODE ISLAND AVE., N.W.(202) 234-4433 WASHINGTON, D.C. 20005-3701 (202) 234-4433
1
1
2
3
4
5
6
7
8
9
10
11
12
13
14
15
16
17
18
19
20
21
222
3456

247
How can they avoid getting into that
quagmire unless they try and keep its impact as
minimal as it is?
CHAIRMAN WATKINS: Do you have a
comment, Charles?
MR. BISCHOFF: Well, my comment was not
so much on the facts of the international module, but
I felt that out of a 53 page document, more than
actually one page needed to be devoted to the
interaction of the international energy market on the
U.S. energy market.
I think that the international impact is
more than 1/53 of a model.
CHAIRMAN WATKINS: Could I ask a
question because I'm not quite sure I understood the
tenor of the comment?
There is an international module, right,
with the NEMS, and I think what Charles was talking
about was some of the simulations of the impacts of
changes from there on the various domestic parameters
or domestic quantities.
The burden of your point, I think, was
NEAL R. GROSSCOURT REPORTERS AND TRANSCRIBERS
1323 RHODE ISLAND AVE., N.W.(202) 234-4433 WASHINGTON, D.C. 20005-3701 (202) 234-4433
1
1
2
3
4
5
6
7
8
9
10
11
12
13
14
15
16
17
18
19
20
21
222
3456

248
that if you look at the international data that goes
into the module, yes, you're in a different playing
field, and I entirely agree with you, but I wonder if
that wasn't just a problem with the international
module itself, and Charles' comments were more let's
use that to see what happens.
Am I missing the essence of what you
were saying?
MR. GRAPE: No, you have my point. Your
point is well taken. I painted that from a reservoir
engineering standpoint, coming in and trying to
actually translate data, which I've attempted to do
in the past, and I know what a problem that is.
If you just look at the international
market, there's more than just reserves, but us
reservoir engineers, we, you know, like to think that
globally.
CHAIRMAN WATKINS: Anymore comments?
If not, we'll have Scott Sitzer proceed.
MR. SITZER: I won't go into very much
detail on this paper. I assume you've all read it,
if not memorized it.
NEAL R. GROSSCOURT REPORTERS AND TRANSCRIBERS
1323 RHODE ISLAND AVE., N.W.(202) 234-4433 WASHINGTON, D.C. 20005-3701 (202) 234-4433
1
1
2
3
4
5
6
7
8
9
10
11
12
13
14
15
16
17
18
19
20
21
222
3456

249
Just a few words about why we did it and
what the genesis of it was. There were essentially
at least two previous papers that looked at forecast
errors that we had done in EIA, actually more than
two, but the two that I was thinking of was one that
was done a couple of years ago, and Susan was a
contributor to it; also three other EIA employees,
Mark Rodekour (phonetic), Jerry Peabody, and Barry
Cohen, and they looked at Annual Energy Outlook
projections actually going back to the 1977 annual
report to Congress for three data years, 1985, 1990,
and 1995, for a number of aggregate variables, and it
was a very good paper.
One of the things that I wanted to add
to what they had done was to look at some of the
intervening years and also to get a kind of a summary
of what the forecast evaluation had been over those
AEOs, and those of you who have looked at the paper
know that I didn't go back to the annual report to
Congress, but rather I started with the Annual Energy
Outlook 1982.
And another paper that's been done along
NEAL R. GROSSCOURT REPORTERS AND TRANSCRIBERS
1323 RHODE ISLAND AVE., N.W.(202) 234-4433 WASHINGTON, D.C. 20005-3701 (202) 234-4433
1
1
2
3
4
5
6
7
8
9
10
11
12
13
14
15
16
17
18
19
20
21
222
3456

250
these lines has been the series actually that's been
done for the Short-term Energy Outlook, and in a
sense that's what we modeled this on, where we would
look at each of the publications going back as far as
we could, look at the intervening years, and come up
with some summary statistics as to what the errors
had been between the forecast and actual.
I think the main reason for doing it is
to give us an idea of how we have done in the past,
to see what kind of improvements hopefully that we
have made over the years, and perhaps to look at
where we might put our attention in future years.
So I decided to just summarize some of
the results, and first of all, looking at the
consumption forecasts, I think these actually turned
out to be pretty good over the years. We have an
error of under two percent for both electricity sales
and total energy consumption going up to about six
percent for natural gas consumption, and I think if
you're familiar with the data series here, you'll see
that, in essence, if a series tends not to vary very
much over the years, we've tended to do a good job on
NEAL R. GROSSCOURT REPORTERS AND TRANSCRIBERS
1323 RHODE ISLAND AVE., N.W.(202) 234-4433 WASHINGTON, D.C. 20005-3701 (202) 234-4433
1
1
2
3
4
5
6
7
8
9
10
11
12
13
14
15
16
17
18
19
20
21
222
3456

251
forecasting it, and probably all of these fall into
that category.
I think natural gas has had more
variability over the years, and that's probably one
of the reasons, among those that are in the paper,
for the fact it's got somewhat of a higher error rate
than some of the others.
Looking at the next graph shows kind of
a different take on it. This isn't in the paper, but
it's something that we're doing right now for our
performance measures here in EIA, and what this graph
shows is the three, five, and ten years ahead results
for natural gas consumption, and I think one of the
interesting things here is that we do tend to get
better over time. We use the same data, and
therefore, we don't have results for all the years
for all the AEOs, but looking particularly at the
three-year forecast, there is a tendency for it to
improve from the AEO '85 to the AEO '93.
The supply forecasts for coal, oil, and
natural gas were all less than five percent in terms
of average errors over all of the AEOs, and again, I
NEAL R. GROSSCOURT REPORTERS AND TRANSCRIBERS
1323 RHODE ISLAND AVE., N.W.(202) 234-4433 WASHINGTON, D.C. 20005-3701 (202) 234-4433
1
1
2
3
4
5
6
7
8
9
10
11
12
13
14
15
16
17
18
19
20
21
222
3456

252
think natural gas has been one of the areas that's
been among the most variable in terms of energy
production, and so that's where we've had our errors
somewhat higher.
This is the one that really stands out,
and these are prices, and as you can see, we're quite
a bit worse on an order of magnitude in terms of what
we did with prices over this series of AEOs, and I
didn't show a graph that shows it's getting better,
but I think that's something that we should keep in
mind.
We have gotten better over the years,
but when you go back to the 1982 and the 1983 AEOs,
we were still looking at a period where crude oil
prices were very high, where we expected them to stay
high for a number of years, and where we didn't
necessarily catch some of the post-1986 period of
lower oil and gas prices.
So in this case we had residential
electricity showing about an 11 percent error rate
going to natural gas prices at the wellhead at over
100 percent on average over this period of time.
NEAL R. GROSSCOURT REPORTERS AND TRANSCRIBERS
1323 RHODE ISLAND AVE., N.W.(202) 234-4433 WASHINGTON, D.C. 20005-3701 (202) 234-4433
1
1
2
3
4
5
6
7
8
9
10
11
12
13
14
15
16
17
18
19
20
21
222
3456

253
PARTICIPANT: When you say "average,"
are you talking about --
MR. SITZER: I'm talking about averaging
all of the AEOs and the years that we forecast
basically in an unweighted sense over that period of
time for those projections. Okay?
That's essentially the summary, and the
questions that I thought the Committee might be able
to help us with are up on the board there.
Does the Committee have any other
suggestions for presentation of the results on AEO
forecast evaluations?
Are there any suggestions for what kinds
of different measures we might use, such as different
statistics?
And were there any comments on the
selection of energy variables that we might be using
in the future evaluations of this sort?
I might say that what we want to do is
to make this essentially a regular feature that we
produce, and in fact, we're planning to update this
piece for our next issues report. We've got really
NEAL R. GROSSCOURT REPORTERS AND TRANSCRIBERS
1323 RHODE ISLAND AVE., N.W.(202) 234-4433 WASHINGTON, D.C. 20005-3701 (202) 234-4433
1
1
2
3
4
5
6
7
8
9
10
11
12
13
14
15
16
17
18
19
20
21
222
3456

254
about another year of actual data, but we're also
going back and looking at some of the intervening
years that were not included in this article.
MR. KENT: Calvin.
MR. KENT: I fully recognize that I'm
the only thing that stands between us and dismissal.
I do have eight comments that I want to make, none of
which will take more than ten minutes. So don't get
too nervous out there about how long I will be going
on.
I was going to ask to be postponed until
tomorrow so I could borrow Greta's crayons so we
could come up with some better graphs, for those of
us who were in on the graphic contest know what I'm
talking about.
But leaving that aside, let me share
with you my comments on this paper. The first of my
comments is I'm not sure exactly why this paper was
undertaken. I'm a little bit dismayed to find out
that it is going to continue. So let me explain that
for a moment.
I think that at least in my recollection
NEAL R. GROSSCOURT REPORTERS AND TRANSCRIBERS
1323 RHODE ISLAND AVE., N.W.(202) 234-4433 WASHINGTON, D.C. 20005-3701 (202) 234-4433
1
1
2
3
4
5
6
7
8
9
10
11
12
13
14
15
16
17
18
19
20
21
222
3456
255
the reason for modeling is to test policy options and
to show the impact of policy changes or the potential
impact of policy changes. It is not, in my opinion,
to predict future prices, consumption, and
production.
I, therefore, get distressed when I hear
terms being used such as "forecast errors," such as
assuming that if we could just somehow or another
become more clairvoyant we would come up with
statistics which were closer to the real world
statistics after the ten years or five years have
lapsed.
The real test of any model, such as the
ones that we were using to produce the AEO, is how
useful these models are in making policy, not how
well did they forecast by driving looking in the rear
view mirror.
So, therefore, I think that any
evaluation in this area should focus on the model's
assumptions and on the model's interrelationships and
asking the question, do these assumptions and do
these interrelationships make sense, rather than did
NEAL R. GROSSCOURT REPORTERS AND TRANSCRIBERS
1323 RHODE ISLAND AVE., N.W.(202) 234-4433 WASHINGTON, D.C. 20005-3701 (202) 234-4433
1
1
2
3
4
5
6
7
8
9
10
11
12
13
14
15
16
17
18
19
20
21
222
3456

256
they give us correct answers as we take a look at the
historical perspective.
Now, I also think that an emphasis on
forecast accuracy may turn out for EIA to be
counterproductive. The reason for this is a simple
statement that I could see some legislator making.
If the model can't forecast accurately natural gas
prices ten years into the future, of what value is it
to us?
And so I think by using this, as is done
in the EIA performance agreement here, as the test of
whether or not the modeling used in the Annual Energy
Outlook is or is not valid is something that should
be reconsidered.
My second comment is: what is the
quality standard that is actually being used? In the
paper we find this comment that macroeconomic
variables, consumption and supply are graded as being
very good. Prices are graded as poor, but there is
no standard that is ever established in the paper for
what is a good forecast or what is a poor forecast,
and therefore, I think that those need to be
NEAL R. GROSSCOURT REPORTERS AND TRANSCRIBERS
1323 RHODE ISLAND AVE., N.W.(202) 234-4433 WASHINGTON, D.C. 20005-3701 (202) 234-4433
1
1
2
3
4
5
6
7
8
9
10
11
12
13
14
15
16
17
18
19
20
21
222
3456

257
established if, indeed, this process continues at
all, either that or the terms ought to be dropped.
The third comment that I have to make is
that the paper uses the reference case projections,
and that may be the appropriate thing to do because
it is the most commonly referred to of all of the
projections, but there are other AEO projections, and
I did a very quick look-back, and if we had used the
low oil price, we might have come up with better
results, if we'd used the low oil price case rather
than using the reference case.
Therefore, I think that EIA may have
well been very much too hard on itself by using the
reference case.
I'm also not sure under this point how
much information we get by looking at absolute
errors, whether they are absolute in terms of the
data or absolute in terms of percentage. I don't
think that absolute errors tell us that much about
forecasting accuracy.
To me it would have been better if we
would have had some analysis of the variance. It
NEAL R. GROSSCOURT REPORTERS AND TRANSCRIBERS
1323 RHODE ISLAND AVE., N.W.(202) 234-4433 WASHINGTON, D.C. 20005-3701 (202) 234-4433
1
1
2
3
4
5
6
7
8
9
10
11
12
13
14
15
16
17
18
19
20
21
222
3456

258
would have been more useful to me if we had
uncertainty bands in there. It would have been more
instructive for me to learn whether or not these
estimates fell one or two standard deviations away
from what had been predicted, and therefore, I think
that there are other standards that could have been
used that would have been much more useful for the
purposes of grading, which is basically what this
paper is, which is a report card.
Fourth, I would have liked to have seen
more of an evaluation of whether or not the forecasts
were improving over time. Scott indicated that at
least in one area that they were getting better over
time. This is not true in all of the areas, and I
won't go into this in detail, but if there is a
learning curve in forecasting, then one would expect
that the forecast would get somewhat better over
time. Some of the forecasts have. Some of the
forecasts have not necessarily improved over time.
My fifth comment is there needs to be a
more specific determination in the paper of how
external events impact these estimates. The ten-year
NEAL R. GROSSCOURT REPORTERS AND TRANSCRIBERS
1323 RHODE ISLAND AVE., N.W.(202) 234-4433 WASHINGTON, D.C. 20005-3701 (202) 234-4433
1
1
2
3
4
5
6
7
8
9
10
11
12
13
14
15
16
17
18
19
20
21
222
3456

259
period that is covered in this paper was a very
tumultuous time for energy markets. The paper though
only uses two principal reasons why the estimates do
not become actualities.
The first of these is changes in
government policy, and there were, of course, many
which are mentioned in the paper, and secondly are
departures from normal weather. I'll leave the
weather alone, but I do want to focus on this
question of changes in government policies.
I think that in some cases the analysis
that is contained in this document does tie a direct
link between the changes in government policies and
the departures from between the forecast and the
actual. It does not do it in the majority of cases,
and I think it would be extremely useful to go back
when this paper is done again, if it is to be done
again, and say here are the specific policies; here
are the specific predicted results that we had from
the changes in those policies; and did those changes
actually come true?
There is also a lingering question in my
NEAL R. GROSSCOURT REPORTERS AND TRANSCRIBERS
1323 RHODE ISLAND AVE., N.W.(202) 234-4433 WASHINGTON, D.C. 20005-3701 (202) 234-4433
1
1
2
3
4
5
6
7
8
9
10
11
12
13
14
15
16
17
18
19
20
21
222
3456

260
mind of how fast changes in government policy can be
actually expected to impact energy markets. In
places in this report, it assumes that the impact is
almost instantaneous, and that clearly is not the
case.
For example, much of the deregulation
that has taken place in natural gas and is now
beginning in electrical generation during this ten-
year period has been introduced rather slowly and
very imperfectly, and therefore, I doubt if many of
the results are already showing up in the data to the
extent that the verbiage at least in this report
attributes to them.
I would also think that one should be
able to take the changes in the forecasts after a
policy change and see if these are any less or more
accurate than the forecasts that were made before
that policy change, and that this would be useful
information to be contained in such a report.
Sixth, in addition to changes in weather
and energy policy, I think there is a third category
which may explain much of the deviation of actual
NEAL R. GROSSCOURT REPORTERS AND TRANSCRIBERS
1323 RHODE ISLAND AVE., N.W.(202) 234-4433 WASHINGTON, D.C. 20005-3701 (202) 234-4433
1
1
2
3
4
5
6
7
8
9
10
11
12
13
14
15
16
17
18
19
20
21
222
3456
261
from projected because there are a large number of
miscellaneous events, some of which are mentioned but
not analyzed in this report, such as the very bitter
cold strike, which affected many of us in West
Virginia very directly. There was, of course, the
Gulf War. There is the collapse of OPEC, and then of
course, more specifically there are all of the
changes in technology.
Technology is mentioned, but only
mentioned in several places in the report. It does
not seem to be fully incorporated at all in the
analysis.
The most useful part of this analysis is
when it does take these miscellaneous events and
tries to explain how they have impacted the forecast.
In almost every case where this is done, the
difference of both the direction and magnitude are
what one would have expected, and these events then,
I think, have confirmed the reliability and
usefulness of these models, but I think that should
be stressed in any future write-ups of the report.
Seventh, the article could have been
NEAL R. GROSSCOURT REPORTERS AND TRANSCRIBERS
1323 RHODE ISLAND AVE., N.W.(202) 234-4433 WASHINGTON, D.C. 20005-3701 (202) 234-4433
1
1
2
3
4
5
6
7
8
9
10
11
12
13
14
15
16
17
18
19
20
21
222
3456

262
made more if mention had been made of the changes in
forecast methodology employed by EIA in making the
Annual Energy Outlook.
Even before NEMS, there were sometimes
substantial changes in the methodology that was used
and certainly in the assumptions that were
incorporated in getting the reference case for the
EIA's AEO.
These should have been made explicit,
and at least to the extent that these changes either
in methodology or changes in assumption may have
impacted the forecast should have been detailed. In
other words, we are not looking at a static model.
We are not looking at a static process, but one that
changed significantly over time even before the
introduction of NEMS, and of course very dramatically
after the introduction of NEMS.
The last comment that I will make, which
is the one that all economists would be expected to
make, and that is that the projections for supply and
consumption are significantly more accurate than were
the projections for prices. In fact, in the
NEAL R. GROSSCOURT REPORTERS AND TRANSCRIBERS
1323 RHODE ISLAND AVE., N.W.(202) 234-4433 WASHINGTON, D.C. 20005-3701 (202) 234-4433
1
1
2
3
4
5
6
7
8
9
10
11
12
13
14
15
16
17
18
19
20
21
222
3456

263
conclusion of the report -- and I kept waiting for
this to come up, and it was sort of "snuck" in here
at the end. In the last paragraph is this comment:
"The overprediction of prices is the most striking
feature of this evaluation. In general,
technological improvements were higher than expected.
The demise of OPEC's market power, excessive
productivity capacity, and market competitiveness
were factors that the AEO forecasts failed to
anticipate. While errors for prices were large, they
appear to have had a relatively minor impact on
overall predictions for demand and production."
As an economist, I say: how in the
world is that possible? Maybe it is time to repeal
the laws of supply and demand. I don't know.
It does then reach this. "One possible
conclusion is that relatively low price elasticities
for supply and demand imbedded in the models may have
been confirmed by this result."
I'm not sure why that follows, but it
then says, "However, another possible conclusion is
that the higher priced projections helped to offset
NEAL R. GROSSCOURT REPORTERS AND TRANSCRIBERS
1323 RHODE ISLAND AVE., N.W.(202) 234-4433 WASHINGTON, D.C. 20005-3701 (202) 234-4433
1
1
2
3
4
5
6
7
8
9
10
11
12
13
14
15
16
17
18
19
20
21
222
3456

264
elasticities that were too low, and the model
elasticities may not have reflected the adjustment in
demands that were made in the face of higher energy
prices that resulted after the two oil disruptions."
What I am simply suggesting here is, as
I think was the theme of Charles' earlier comments,
that there needs to be a great deal more emphasis
placed upon analyzing the elasticities within the
model and to try to understand why it is possible to
have relatively good forecasts of supply and demand
while at the same time having rather poor forecasts
of prices.
CHAIRMAN WATKINS: Thank you, Calvin.
Carol?
MS. CRAWFORD: I have actually two
comments. The first one is a reaction to Calvin's
comments.
I actually liked this paper. I liked
the purpose of this paper. I completely disagree
that the purpose of modeling is not forecasting.
Maybe it's not the purpose, but it certainly is one
purpose of modeling, and I think that it's very
NEAL R. GROSSCOURT REPORTERS AND TRANSCRIBERS
1323 RHODE ISLAND AVE., N.W.(202) 234-4433 WASHINGTON, D.C. 20005-3701 (202) 234-4433
1
1
2
3
4
5
6
7
8
9
10
11
12
13
14
15
16
17
18
19
20
21
222
3456

265
important to validate the models that are done here.
Too often in statistics that's not
possible or it's not done, and so I applaud the
effort there.
My second comment concerns your second
question, and Calvin alluded to this. I'd just like
to be a little bit more specific.
Essentially the way I think about it is
accuracy is composed of two components: a lack of
bias, meaning that on the average you tend to
overestimate and underestimate the true value with
about the same frequency, and when you measure things
with absolute error, you lose that. You can't tell
if you have an absolute error of 1.3 percent or was
it on the average some higher or lower or were they
all biased in a certain direction?
So that's the first component, and then
the second component Calvin mentioned is variation.
I call it precision actually, and that is concerned
about the repeatability of your results or the
variance.
If your predictions are all over the
NEAL R. GROSSCOURT REPORTERS AND TRANSCRIBERS
1323 RHODE ISLAND AVE., N.W.(202) 234-4433 WASHINGTON, D.C. 20005-3701 (202) 234-4433
1
1
2
3
4
5
6
7
8
9
10
11
12
13
14
15
16
17
18
19
20
21
222
3456

266
board, they might average out to zero, but in general
they're not very reliable. So I guess the analogy is
if you think of a target and throwing darts at the
board, the bias would be measured all your throws are
on one side of the target. Precision is all your
throws are close together, and ideally what you would
really like is everything right on center very
tightly together.
So the thing to do then is to try to get
at least two statistics, but I agree with Calvin.
There are a lot of other things that you could do,
but I'm just trying to be constructive, that would
isolate those components, and one to get at the bias
would be average error or median error, something
where you actually take into account the sign of your
errors, and then a variance statistic of some kind.
If you want to compare, sometimes a CV
is very good. Sometimes it can just be a standard
deviation. Sometimes it can be something that's more
robust. It really depends on the type of data that
you have, and you can be creative there, but that's
just a constructive comment in support of Question 2.
NEAL R. GROSSCOURT REPORTERS AND TRANSCRIBERS
1323 RHODE ISLAND AVE., N.W.(202) 234-4433 WASHINGTON, D.C. 20005-3701 (202) 234-4433
1
1
2
3
4
5
6
7
8
9
10
11
12
13
14
15
16
17
18
19
20
21
222
3456

267
CHAIRMAN WATKINS: Thank you.
Charles.
MR. BISCHOFF: First I want to agree
with Carol and disagree with Calvin about the value
of ex ante forecasts. Certainly ex ante forecasts
are not the only standard for an econometric model,
but they certainly cannot be ignored, and they are
one standard which must be considered.
However, I do agree with Calvin that we
have to be very careful lest Congress get hold of
these numbers. Of course, they will. So we have to
be careful about putting them into perspective.
I have the point of view of somebody
who's tried to forecast, and I have a very low
standard for how good forecasts can really be
expected to be. Nobody could have predicted the
break-up of OPEC in the '80s. Nobody could have
predicted the formation of OPEC in the '70s, and
therefore, you can't penalize people for making 80
percent errors in the price level or something like
this because they don't forecast it.
And this brings up one thing that has
NEAL R. GROSSCOURT REPORTERS AND TRANSCRIBERS
1323 RHODE ISLAND AVE., N.W.(202) 234-4433 WASHINGTON, D.C. 20005-3701 (202) 234-4433
1
1
2
3
4
5
6
7
8
9
10
11
12
13
14
15
16
17
18
19
20
21
222
3456

268
not been mentioned that is, in fact, a valid use of
evaluation of forecasts, and that is -- it was
mentioned earlier today -- ex post simulations of the
model. You plug in the actual OPEC price pattern,
and then you see how well the model does when it has
the right exogenous variables, and that's a much more
fair evaluation, and furthermore, you plug in the
actual policy variables and you see how well it does
with the policy variables.
Thirdly though, I certainly want to
underline this point. You really do need the
elasticities, and this was Calvin's other point, that
we really have to ask ourselves: why are these
elasticities so low, or are they low? We don't even
know.
We don't have the numbers to see whether
these elasticities are high or low, and we don't
really have a standard to know whether they're high
or low, and until we really judge these things, we
won't be able to evaluate whether these models are
really good or not.
CHAIRMAN WATKINS: I have a couple of
NEAL R. GROSSCOURT REPORTERS AND TRANSCRIBERS
1323 RHODE ISLAND AVE., N.W.(202) 234-4433 WASHINGTON, D.C. 20005-3701 (202) 234-4433
1
1
2
3
4
5
6
7
8
9
10
11
12
13
14
15
16
17
18
19
20
21
222
3456

269
comments myself.
With respect to Calvin's suggestion
about the forecasts, I do think this is a suitable
exercise. However, I think if I hear the tenor of
your comments, Calvin, maybe it helps to make the
following distinction that Charles has just made. We
have to be very careful to distinguish between the
variations due to the input variables, the forecasts
of those, and what the model does with that
information.
You can't attribute errors to the model
which are errors in the projections of the exogenous
variables, and so the exercise that Charles just
mentioned whereby you plug in the actual values and
then see what the model does, that's the crucial test
for the model.
And in any evaluation of the forecast
procedure or the forecast output, I think you have to
make that distinction, and it wasn't clear to me.
That's why I asked you the question, Scott, about
what was being measured there. It wasn't clear to me
that, in fact, that actually flows out of the paper.
NEAL R. GROSSCOURT REPORTERS AND TRANSCRIBERS
1323 RHODE ISLAND AVE., N.W.(202) 234-4433 WASHINGTON, D.C. 20005-3701 (202) 234-4433
1
1
2
3
4
5
6
7
8
9
10
11
12
13
14
15
16
17
18
19
20
21
222
3456

270
Another comment I wanted to make relates
to just the mechanics of how you express the forecast
errors. If we have a variable such as, say, the
demand for natural gas where there's in effect what I
would call a big stock element, you already have a
big aggregate. Let's say it's 17 or 18 trillion
cubic feet, and then you make the forecast, and then
you do the calculation of the so-called forecast
error, and you make it as a percentage of the overall
total.
Well, given the big aggregate that you
start out with, and it's not going to change much in
the next few years you're going to look at, of
course, your forecast errors may look quite small,
and then you look at and contrast it with the price,
and you think of those errors, and you think, "Good
Lord, they're huge."
Well, one of the big reasons is you're
starting off from a big stock denominator, and so you
can be two and a half percent or five percent. It
doesn't look that great, but in fact, what you're
really interested in is the increment because you
NEAL R. GROSSCOURT REPORTERS AND TRANSCRIBERS
1323 RHODE ISLAND AVE., N.W.(202) 234-4433 WASHINGTON, D.C. 20005-3701 (202) 234-4433
1
1
2
3
4
5
6
7
8
9
10
11
12
13
14
15
16
17
18
19
20
21
222
3456
271
know that the basic demand is there or the basic
supply is there, and it's not going to change much in
aggregate over the five years, but the increments
could be very important.
So in those kinds of variables, I think
you have to focus more on the increments of the
forecast and the variation there rather than the
percentage of some large aggregate that isn't going
to change over the forecast interval.
Another comment relates to Calvin was
talking about how come we've got these big price
effects. It may be safe in the world oil price, and
we don't have very large quantity effects. Those
elasticities, as Charles was mentioning, you need to
look at where they're imbedded.
If we're looking at consumer response,
say, to let's say a 30 percent variation in the world
oil price, the consumer doesn't see a 30 percent
variation. He sees the variation in the price of the
refined product after adding refinery costs, after
adding distribution costs, after adding marketing
costs.
NEAL R. GROSSCOURT REPORTERS AND TRANSCRIBERS
1323 RHODE ISLAND AVE., N.W.(202) 234-4433 WASHINGTON, D.C. 20005-3701 (202) 234-4433
1
1
2
3
4
5
6
7
8
9
10
11
12
13
14
15
16
17
18
19
20
21
222
3456

272
So the elasticity of the end user price
with respect to the elasticity of the base price,
say, the world oil price, the variation in that is a
lot less. I mean just in terms of simple arithmetic
if you have a 20 percent variation in the crude oil
price and let's say the wedge of costs that you add
on to the crude oil price that are reflected in the
consumer price would double that, then you'd have a
ten percent variation in the consumer price.
So when you do your elasticity
calculations, don't think because, say, there's a
variation of crude oil price of so much percent and
the elasticity there that you get that kind of
response down the line from the consumer.
So, in fact, some of these numbers, when
you actually translate them through, may not be so
offensive to economists' perceptions as they may be,
depending on the wedge of cost between whatever
you're varying and what the end user pays.
MR. KENT: Can I make another comment?
CHAIRMAN WATKINS: Yes.
MR. KENT: Partially in defense of my
NEAL R. GROSSCOURT REPORTERS AND TRANSCRIBERS
1323 RHODE ISLAND AVE., N.W.(202) 234-4433 WASHINGTON, D.C. 20005-3701 (202) 234-4433
1
1
2
3
4
5
6
7
8
9
10
11
12
13
14
15
16
17
18
19
20
21
222
3456

273
first point, and that is back when we put NEMS
together and had the idea for NEMS, the basic use of
NEMS was not for trying to make sure we could
forecast way out into the future. It was to use it
as a tool for policy analysis, and I think that needs
to be stressed in any evaluation of NEMS, and I don't
want to discount the usefulness of making the
forecast or even of going back, although I don't
think this is the appropriate way to measure the
accuracy of the forecast, as I indicated in my paper,
but I would not want to put that down.
But I do want to stress that the reason
the whole NEMS model was put together was not to be
principally a forecasting tool, but was to be a
policy analysis tool, and that was the point that I
was attempting to make.
CHAIRMAN WATKINS: Charles.
MR. BISCHOFF: Yes, I thought of one
other point, and actually this is the sort of point I
would expect Greta to make. I thought of a way that
might --
CHAIRMAN WATKINS: Is your forecast that
NEAL R. GROSSCOURT REPORTERS AND TRANSCRIBERS
1323 RHODE ISLAND AVE., N.W.(202) 234-4433 WASHINGTON, D.C. 20005-3701 (202) 234-4433
1
1
2
3
4
5
6
7
8
9
10
11
12
13
14
15
16
17
18
19
20
21
222
3456

274
good?
(Laughter.)
MR. BISCHOFF: I will ask her to tell me
whether.
One way to make ex ante forecast errors
meaningful is to fit alongside the NEMS model time
series models. Let us say you do an ARIMA model for
each variable, and then you compare the NEMS forecast
error to the ARIMA forecast error for that same
horizon. So if there is a big change that is
unpredictable from past time series, that will show
up as a big forecast error in the time series model.
You will also show it as a big forecast error in the
NEMS model, and essentially you will normalize that
error by the big error, and it won't show up as a big
error overall.
So this would be fitting the time series
models as a benchmark in comparing the forecast
errors to the benchmark forecast errors.
Greta, do we agree that that's a --
MS. LJUNG: Yes, I do agree. The reason
I didn't make that point, I've made it quite a few
NEAL R. GROSSCOURT REPORTERS AND TRANSCRIBERS
1323 RHODE ISLAND AVE., N.W.(202) 234-4433 WASHINGTON, D.C. 20005-3701 (202) 234-4433
1
1
2
3
4
5
6
7
8
9
10
11
12
13
14
15
16
17
18
19
20
21
222
3456
275
times over the years, and I haven't seen it
implemented yet.
(Laughter.)
CHAIRMAN WATKINS: Jay.
MR. HAKES: With low elasticities to
your suggestions, I guess.
(Laughter.)
MR. HAKES: Be a delayed response.
I think these points were very good, and
I think we need to heavily caveat what the limited
impact of these measures are, but I think they're
valuable nonetheless partly because groups like the
Congressional Budget Office use these as the forecast
that they use in projecting tax revenues and things
like that in the future, whether we want them to or
not.
So the fact of the matter is important
users out there are using these as forecasts in ways
that have real economic impacts, and we really
probably can't stop them from doing that.
I thought I would just also make a
comment or two on the political ramifications of
NEAL R. GROSSCOURT REPORTERS AND TRANSCRIBERS
1323 RHODE ISLAND AVE., N.W.(202) 234-4433 WASHINGTON, D.C. 20005-3701 (202) 234-4433
1
1
2
3
4
5
6
7
8
9
10
11
12
13
14
15
16
17
18
19
20
21
222
3456
276
having this kind of data floating around. It's been
30 years since I've studied philosophy, but I think
this reminds me of Averroes, who was an Arabic
philosopher in the Middle Ages and a disciple of
Aristotle, and one of his big concerns was that the
brilliant ideas that were being discussed by the
philosophers might leak out to the masses, and this
would create great unrest, and the philosophers had
to be very careful that this not happen.
I really have very little fear of
anything that we do that's self-critical getting out
to the Congress, and the reason for that is that I
think that our reputation for transparency is so well
recognized that this actually works very much to our
advantage.
Last week at this press conference I
presented data that our forecasts for winter fuel
prices had been very close to being accurate, and I
pointed out that the reason this was true was because
we had made two major errors that canceled each other
out. We had predicted normal weather for the winter,
and it turned out to be much milder unless you lived
NEAL R. GROSSCOURT REPORTERS AND TRANSCRIBERS
1323 RHODE ISLAND AVE., N.W.(202) 234-4433 WASHINGTON, D.C. 20005-3701 (202) 234-4433
1
1
2
3
4
5
6
7
8
9
10
11
12
13
14
15
16
17
18
19
20
21
222
3456

277
in the Dakotas or Minnesota, and we also had
underestimated the price of crude oil, and having
gotten both of those things wrong, our price forecast
was quite right.
Now, some of the people thought that I
shouldn't have said that because it might have caused
the press to underestimate our wisdom, but I think
it's exactly that kind of thing which is relatively
rare in Washington, to be frank, that has put EIA in
somewhat of a special category, and I think when I've
had this issue raised before, you know, sometimes
you'll get a hostile question from the audience.
"Why are your forecasts all off base?"
And I say, "Well, you know, we've been
improving over the years, but we have to say
historically that for factors that may be now
explainable, these price forecasts have been off, and
we study that on a regular basis, and we distribute
that data."
And the rest of the audience kind of
nodded and said, "Yeah, that's kind of what we would
expect from EIA, and that's why we kind of believe
NEAL R. GROSSCOURT REPORTERS AND TRANSCRIBERS
1323 RHODE ISLAND AVE., N.W.(202) 234-4433 WASHINGTON, D.C. 20005-3701 (202) 234-4433
1
1
2
3
4
5
6
7
8
9
10
11
12
13
14
15
16
17
18
19
20
21
222
3456

278
them more than we do other people, even though we
realize this is kind of a fuzzy area and not an exact
science."
So I think that the perception -- and
this may be true more at, say, the professional staff
level in the Congress than it is of the actual
Congressmen themselves who maybe don't deal on the
technical side so much, but these staffers do tend to
stay over long periods of time, and they really do
like that transparency.
I think it's a little bit like they used
to say of Horowitz. You know, he would hear errors
that no music critic or the audience could ever hear,
and the fact that he heard them first meant that the
audience never would hear them, and I think that's
sort of the way we approach these things.
We know that we print data that's wrong
sometimes. Somebody made a mistake, but we almost
always catch it before anybody else does, and as long
as that's the case, we're in pretty good shape.
CHAIRMAN WATKINS: Anymore comments?
Calvin.
NEAL R. GROSSCOURT REPORTERS AND TRANSCRIBERS
1323 RHODE ISLAND AVE., N.W.(202) 234-4433 WASHINGTON, D.C. 20005-3701 (202) 234-4433
1
1
2
3
4
5
6
7
8
9
10
11
12
13
14
15
16
17
18
19
20
21
222
3456

279
MR. KENT: Just one last comment on
this. If you look at your standards, your
performance standards here, you really have only one
that concerns your modeling, and I think you need to
be very, very careful when you're defining your own
report card, and I'm not sure that this particular
report is the best way to be transparent.
And not that I think you ought not be
transparent or go back and try to say here are the
comparisons between what was forecast and what was
actual. I am not at all convinced that this is the
way it should be done.
CHAIRMAN WATKINS: Before we check with
the audience whether they have any questions, I had
one, Susan, few that I forgot to ask about the NEMS,
and it was when Charles was talking about other
models.
To what extent is the NEMS in terms of
macroeconomic assumptions captive to DRI or could you
use or relatively easily plug in forecasts from other
models or is the set-up of NEMS such that you need
the DRI specification for it to run?
NEAL R. GROSSCOURT REPORTERS AND TRANSCRIBERS
1323 RHODE ISLAND AVE., N.W.(202) 234-4433 WASHINGTON, D.C. 20005-3701 (202) 234-4433
1
1
2
3
4
5
6
7
8
9
10
11
12
13
14
15
16
17
18
19
20
21
222
3456
280
MS. SHAW: Well, I wish that somebody
else was here to answer that -- I wish one of our
macroeconomic modelers was here for that because I
really don't know. That's not my field.
I mean one thing, you know, DRI is, from
what I've always understood, is just a well
recognized model, and apart from its use as providing
drivers to NEMS, our economic analysts do use the DRI
model itself, do a great deal of work taking energy
results from NEMS basically to prices, and then doing
a whole variety of economic simulations.
They look at the impacts under, you
know, a variety of different tax scenarios or things
like that, and I really don't know to what extent
other economic models have all those capabilities.
CHAIRMAN WATKINS: Any comments from the
floor?
(No response.)
CHAIRMAN WATKINS: Now you have a right
of reply, so to speak, Scott.
MR. SITZER: I don't have much. I don't
want to reply particularly. I just do want to thank
NEAL R. GROSSCOURT REPORTERS AND TRANSCRIBERS
1323 RHODE ISLAND AVE., N.W.(202) 234-4433 WASHINGTON, D.C. 20005-3701 (202) 234-4433
1
1
2
3
4
5
6
7
8
9
10
11
12
13
14
15
16
17
18
19
20
21
222
3456

281
the Committee for all of these comments. I think
they are all well taken and very useful, and I know
Susan appreciates them because she's supposed to be
doing the update.
(Laughter.)
MS. SHAW: I liked your comment best:
why are we doing this?
(Laughter.)
MR. SITZER: Well, that's the only one I
really want to talk about in particular, and I think
Jay may have alluded to the fact that other people
are looking at the projections as they've turned out,
and in fact, some people have done their own
analysis. So I think really the only thing that we
were trying to do was to show that if other people
were going to do an analysis of what we had done in
the past, we should have something similar on the
record that at least did it in a way that we felt was
as comprehensive as possible.
I do think there are other statistics
that we could use. One of the reasons we did use
absolute average error was because we didn't want to
NEAL R. GROSSCOURT REPORTERS AND TRANSCRIBERS
1323 RHODE ISLAND AVE., N.W.(202) 234-4433 WASHINGTON, D.C. 20005-3701 (202) 234-4433
1
1
2
3
4
5
6
7
8
9
10
11
12
13
14
15
16
17
18
19
20
21
222
3456

282
wash out the effects of errors that were too high
versus errors that were too low. So the absolute
average error met that test, but it doesn't meet the
test of bias. So I think we do need to look at that.
And some of the other suggestions about
plugging assumptions back into the old models and
looking at methodology changes and so on are very
good. This was just meant to be a start with the
data and the forecasts that we had available. I
think those suggestions would certainly help it.
It's just a question of whether or not we can get the
resources to do that.
CHAIRMAN WATKINS: Thank you.
Any other comments?
(No response.)
CHAIRMAN WATKINS: If not, in the spirit
of Carol's dart board, we have finished right on the
very precise target.
I do have one announcement to make, and
that is that the restaurant has been booked for seven
o'clock at 701 Pennsylvania. Those of us who are
going from this hotel, I suggest we meet at 6:15 in
NEAL R. GROSSCOURT REPORTERS AND TRANSCRIBERS
1323 RHODE ISLAND AVE., N.W.(202) 234-4433 WASHINGTON, D.C. 20005-3701 (202) 234-4433
1
1
2
3
4
5
6
7
8
9
10
11
12
13
14
15
16
17
18
19
20
21
222
3456

283
the lobby.
Yes, it's walkable.
I'm assuming there's a bit of a standard
deviation. When we say 6:15, it's maybe more like.
Six, thirty is fine by me if everybody
is precise. Six, thirty, 6:30.
Okay. So those of us in the hotel or if
you're staying outside and want to join us at 6:30,
we'll walk over.
And tomorrow morning we start at nine
o'clock, and there's committee breakfast at eight.
Thank you.
(Whereupon, at 4:15 p.m., the meeting
was adjourned, to reconvene at 9:00 a.m., Friday,
April 11, 1997.)
NEAL R. GROSSCOURT REPORTERS AND TRANSCRIBERS
1323 RHODE ISLAND AVE., N.W.(202) 234-4433 WASHINGTON, D.C. 20005-3701 (202) 234-4433
1
1
2
3
4
5
6
7
8
9
10
11
12
13
14
15
2
3456
![Illuminating OpenMP + MPI Performance€¦ · cpi-mpi.c:48 cpi-mpi.c:84 cpi-mpi.c:109 cpi-mpi.c:97 1.0% cpi-mpi [program] main main [OpenMP region O] MPI Finalize MPI Reduce Showing](https://static.fdocuments.in/doc/165x107/6022cc2b9a65990f6b41506f/illuminating-openmp-mpi-performance-cpi-mpic48-cpi-mpic84-cpi-mpic109-cpi-mpic97.jpg)