· Web viewThe Oil Fund, in accordance with its mission and objectives, continued its activity on...
52
ANNUAL REPORT 2012 CONTENTS INTRODUCTION 2. NATIONAL ECONOMY AND THE OIL FUND 2.1. Macroeconomic development 2.2. SOFAZ Revenues 2.3. SOFAZ Expenditures 3. INVESTMENT STRATEGY AND RISK MANAGEMENT 3.1. Global economy during 2012 3.2. SOFAZ investment portfolio 3.3. SOFAZ’s investment portfolio performance 3.4. Restrictions on investment 3.5. Risk management 4. MANAGEMENT 5. OIL FUND—TRANSPARENT SOVEREIGN WEALTH FUND 5.1. SOFAZ public relations 5.2. Extractive Industries Transparency Initiative (EITI) activities 5.3. International Forum of Sovereign Wealth Funds 6. OUR VALUES: RESPECT, TEAMWORK, TRUST, TRANSPARENCY 7. 2012 STATE OIL FUND’S BUDGET EXECUTION 8. CONSOLIDATED FINANCIAL STATEMENTS OF THE STATE OIL FUND OF THE REPUBLIC OF AZERBAIJAN APPENDIX
Transcript of · Web viewThe Oil Fund, in accordance with its mission and objectives, continued its activity on...

ANNUAL REPORT 2012
CONTENTS
INTRODUCTION
2. NATIONAL ECONOMY AND THE OIL FUND2.1. Macroeconomic development2.2. SOFAZ Revenues2.3. SOFAZ Expenditures
3. INVESTMENT STRATEGY AND RISK MANAGEMENT3.1. Global economy during 2012 3.2. SOFAZ investment portfolio 3.3. SOFAZ’s investment portfolio performance3.4. Restrictions on investment 3.5. Risk management
4. MANAGEMENT
5. OIL FUND—TRANSPARENT SOVEREIGN WEALTH FUND 5.1. SOFAZ public relations5.2. Extractive Industries Transparency Initiative (EITI) activities 5.3. International Forum of Sovereign Wealth Funds
6. OUR VALUES: RESPECT, TEAMWORK, TRUST, TRANSPARENCY
7. 2012 STATE OIL FUND’S BUDGET EXECUTION
8. CONSOLIDATED FINANCIAL STATEMENTS OF THE STATE OIL FUND OF THE REPUBLIC OF AZERBAIJAN
APPENDIX

INTRODUCTION
The Oil Fund, in accordance with its mission and objectives, continued its activity on accumalation and proper management of revenues generated from Azerbaijan's national treasure-black gold and also celebrated its 13th anniversary in 2012. As in previous years, the Fund’s assets increased by 14.5% by the end of the year, reaching USD 34.1 billion. The portion of the Fund’s inflows set aside for reserves equalled 22.7%.
2012 was a successful year in terms of diversification of the investment portfolio of the Fund. The new investment policy enabled SOFAZ to include new assets, such as gold bullions conforming to the requirements of London Bullion Market Association (LBMA) and real estates to the State Oil Fund’s invesment portfolio in 2012. At the same time, Russian ruble, Turkish lira and the Australian dollar have been included to the Fund’s portfolio.
Starting from 2010, the Fund`s annual reports include quotations from the works of famous Azerbaijani writers and poets, together with biographical notes. The cultural theme of the State Oil Fund's 2012 Report will trace the legacy of the founder of Azerbaijani philosophical poetry, outstanding poet Imadaddin Nasimi.
The State Oil Fund's 2010 Annual Report was the first report to feature this new design and it was dedicated to the great Nizami Ganjavi, while 2011 Annual Report was honoured to Muhammad Fuzuli. This new reporting concept, complete with literary quotations, should also serve as a small but valuable contribution by the Fund to bring the literature of Azerbaijan to international audience.

2. NATIONAL ECONOMY AND THE OIL FUND
2.1. Macroeconomic Development
The economy of Azerbaijan performed sustainably during the ongoing global economic crisis which was mainly observed in the Eurozone throughout the previous year. Despite decreasing crude oil production and diminishing oil sector, gross domestic product (GDP) maintained its growth rate thanks to the rapid expansion in the non-oil sector of GDP. As a result, in 2012 the non-oil sector grew by 9.7% and the overall economy grew by 2.2%.
In 2012, AZN 15.3 billion was invested in fixed capital, of which 79% was internal investments and 21% foreign investments. GDP per capita amounted to AZN 5.9 thousand, real income increased by 12.5%, unemployment and poverty declined to 5.2% and 6%, respectively. Inflation rate was 1.1%, the lowest level compared to the previous years.
Real Sector.The decrease in oil production resulted in 3.8% decline in the volume of industrial production in 2012. Real GDP growth was greater than in the previous year and the non-oil sector surpassed oil sector in contribution to the overall GDP. The share of non-oil sector in total GDP reached 52.7%. (Chart 2.1.1.). Chart 2.1.1. Share of non-oil sector in total GDP
Source: Ministry of Economic Development of the Republic of Azerbaijan
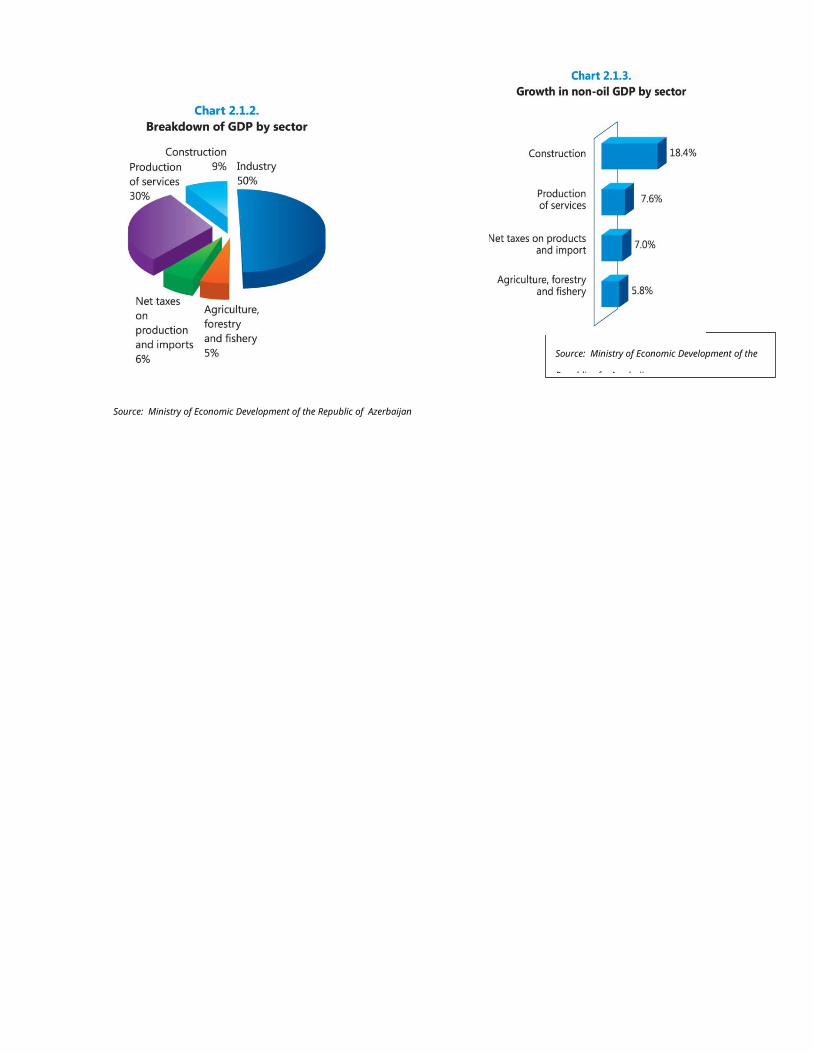
Industrial production was the largest contributor to GDP with a 50% share. In addition, significant growth was observed in different segments of the non-oil sector. Thus, the real growth was 18.4% in construction sector, 7.6% in services, 7.0% in net taxes on products and imports and 5.8% in agriculture, forestry and fishery sector. Charts 2.1.2. and 2.1.3. present the breakdown and growth of GDP by sector.

Source: Ministry of Economic Development of the Republic of Azerbaijan
Source: Ministry of Economic Development of the
Republic of Azerbaijan
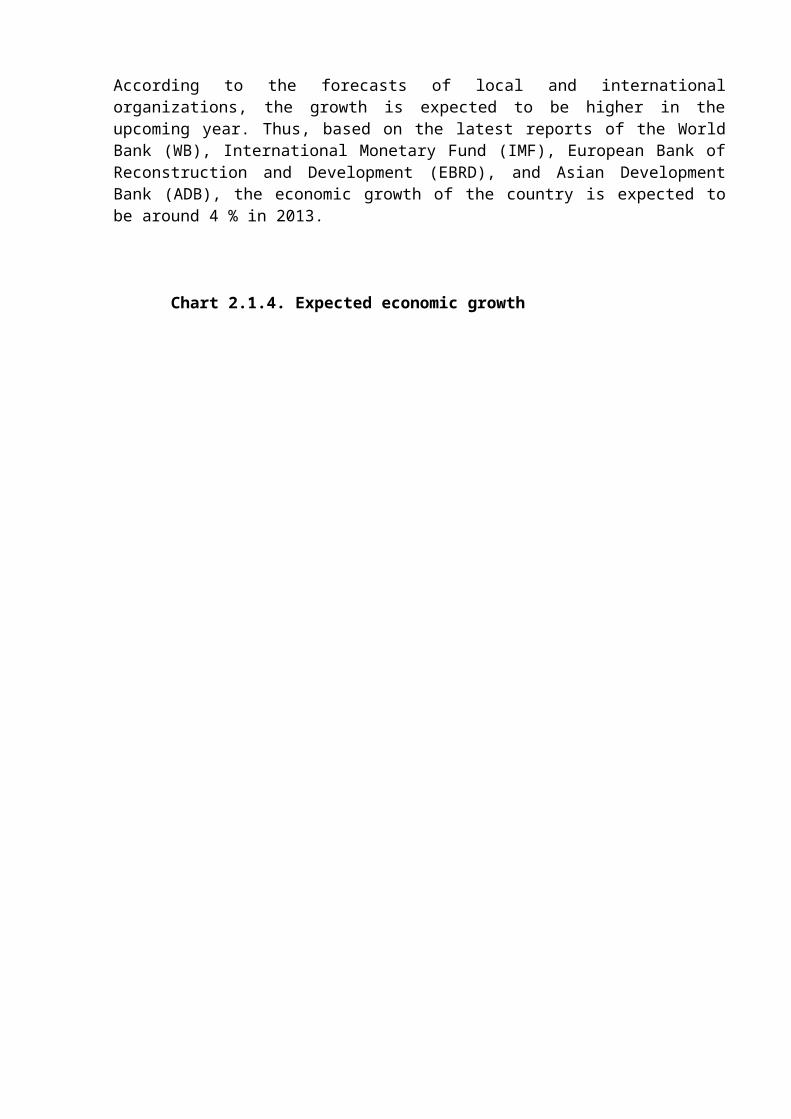
According to the forecasts of local and international organizations, the growth is expected to be higher in the upcoming year. Thus, based on the latest reports of the World Bank (WB), International Monetary Fund (IMF), European Bank of Reconstruction and Development (EBRD), and Asian Development Bank (ADB), the economic growth of the country is expected to be around 4 % in 2013.
Chart 2.1.4. Expected economic growth
Strategic foreign exchange reserves. The State Oil Fund`s assets under management increased by USD 4 329.4 million, or 14.5%, from USD 29 800.0 million to USD 34 129.4 million in 2012.
Chart 2.1.5. Growth in SOFAZ assets, 2001-2012 (USD million, as of 31.12.2012)
In recent years, the share of the Fund's assets in total GDP significantly increased and amounted to 50% in 2012.
Chart 2.1.6. Share of SOFAZ’s assets in GDP
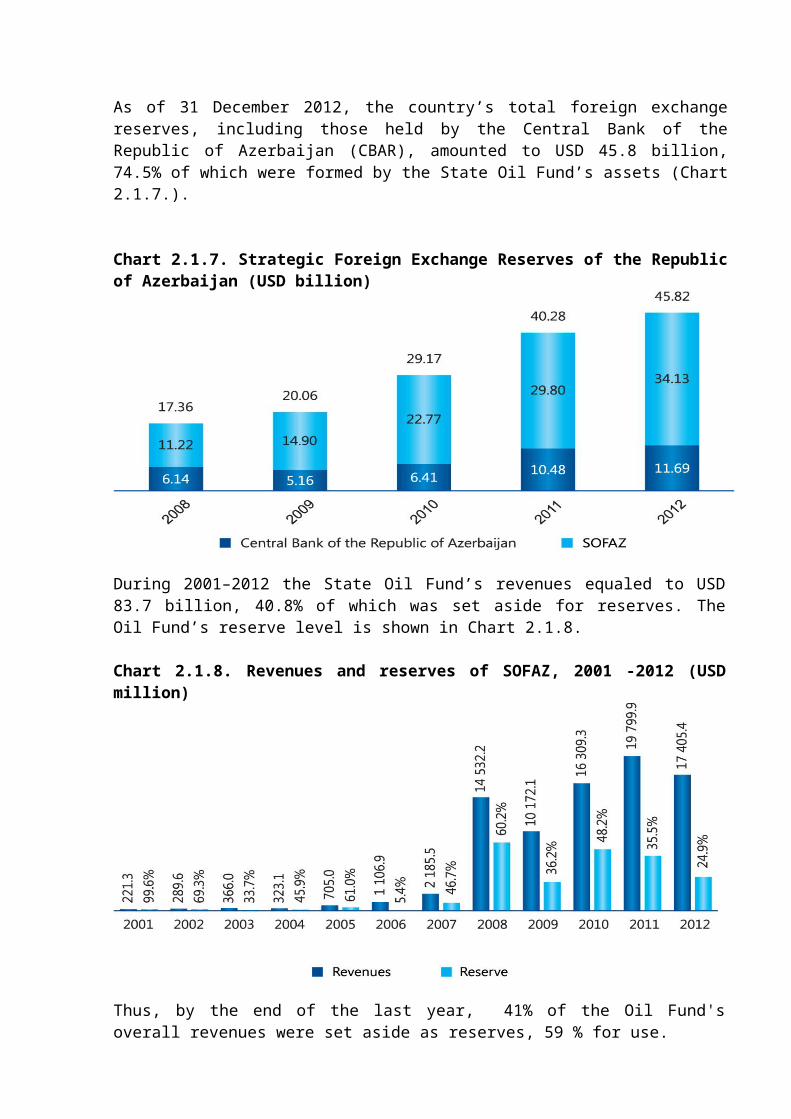
As of 31 December 2012, the country’s total foreign exchange reserves, including those held by the Central Bank of the Republic of Azerbaijan (CBAR), amounted to USD 45.8 billion, 74.5% of which were formed by the State Oil Fund’s assets (Chart 2.1.7.).

Chart 2.1.7. Strategic Foreign Exchange Reserves of the Republic of Azerbaijan (USD billion)
During 2001–2012 the State Oil Fund’s revenues equaled to USD 83.7 billion, 40.8% of which was set aside for reserves. The Oil Fund’s reserve level is shown in Chart 2.1.8.
Chart 2.1.8. Revenues and reserves of SOFAZ, 2001 -2012 (USD million)
Thus, by the end of the last year, 41% of the Oil Fund's overall revenues were set aside as reserves, 59 % for use.
Chart 2.1.9. SOFAZ’s reserves, 2001-2012 (USD million)
Securing fiscal sustainability. The State Oil Fund has played a more prominent role in securing fiscal sustainability in the state economy for the last few years. The amount of transfers to the state budget from the Oil Fund has significantly increased since 2008. Thus, in 2012, AZN 9 905.0 million transfer was the major contributor to the state budget revenues.
Chart 2.1.10. SOFAZ transfer as a percentage of state budget revenues, 2003-2012
As one of the main courses of SOFAZ’s activity, in 2012 a part of the Fund's assets was directed to financing major national scale projects in order to support socio-economic progress. In 2012 part of SOFAZ’s funds was allocated to implementation of state programs and activities aimed at reduction of poverty, as well as investing in infrastructure and development of human capital through financing the foreign education program. Foreign trade. The global economic crisis imposed downward pressure on the foreign trade volume. The position of the advanced economies in the world trade deteriorated compared to the previous year. Thus, the growth of export decreased from 5.6% to 2.1% in advanced economies and from 6.6 % to 3.6% in emerging economies during the last year.
In 2012 higher crude oil prices in the world energy markets affected Azerbaijani foreign trade balance positively. Foreign trade turnover amounted to USD 33 560.8 million, including export volume of USD 23 908.0 million and import volume of USD 9 652.9 million. Foreign trade balance surplus was USD 14 255 million (source: The State Customs Committee of the Republic of Azerbaijan).
At the same time, there was a reduction in the volume of export and import equal to 10% and more than 1% respectively, compared to the last year. This was mainly due to the reduction in crude oil production in 2012.
2.2. SOFAZ Revenues
The Oil Fund’s revenues came to a total of AZN 13 674.1 million (USD 17 405.4 million) in 2012. They consisted of the proceeds from sales of the Republic of Azerbaijan’s share of

hydrocarbons, as well as transit fees, bonus payments, acreage fees, revenues from management of the Fund’s assets and other revenues.
Chart 2.2.1. Structure of SOFAZ revenues, 2012 (USD million)
Proceeds from profit oil and gas sales. In 2012, the State Oil Fund received a total of AZN 13 117.4 million or USD 16 695.8 million from sales of the Republic of Azerbaijan’s share of hydrocarbons (Chart 2.2.2.).
Chart 2.2.2.Proceeds from profit oil and gas sales by fields, 2012 (USD million)
The State Oil Company of Azerbaijan Republic (SOCAR) deducts the costs of oil transportation, banking, customs clearances, surveying, marketing and insurance costs before transferring the proceeds from profit oil sales to the State Oil Fund.
Revenues from SOFAZ’s asset management. SOFAZ asset management revenues amounted to AZN 544.0 million or USD 693.5 million, yielding 2.2% rate of return in 2012.

Transit fee revenues. Revenues from transportation of oil and gas through the territory of Azerbaijan (transit fees), which amounted to AZN 7.9 million or USD 10 million, was another source of SOFAZ’s revenues in 2012 (Table 2.2.1.).
Table 2.2.1. SOFAZ transit fee revenues, 2012
Transferor Date Amount
USD mln. AZN mln.AIOC 12.01.2012 0.6 0.5AIOC 14.02.2012 1.0 0.8AIOC 02.04.2012 0.9 0.7AIOC 12.04.2012 1.0 0.8AIOC 24.05.2012 1.0 0.7AIOC 14.06.2012 0.4 0.3AIOC 12.07.2012 0.4 0.3AIOC 14.08.2012 1.0 0.8AIOC 13.09.2012 1.0 0.8AIOC 12.10.2012 0.9 0.7AIOC 14.11.2012 0.8 0.7AIOC 13.12.2012 1.0 0.8Total 10.0 7.9
Acreage fees. Another source of SOFAZ’s revenues in 2012 was acreage fees paid by foreign investors for the utilization of contract areas for development of hydrocarbon resources. Acreage fees received by the Oil Fund in the year under review amounted to a total of AZN 3.0 million or USD 3.8 million (Table 2.2.2.).
Table 2.2.2. SOFAZ acreage fee revenues, 2012
Transferor Oilfield DateAmount
USD mln. AZNmln.
GDF SUEZ E&P ABSHERON B.V. Absheron 28.06.2012 0.5 0.4
Total E&P ABSHERON B.V. Absheron 29.06.2012 1.0 0.7
BP International Shafag-Asiman 29.06.2012 2.1 1.7
Bahar Energy Bahar and Gum-deniz 10.10.2012 0.2 0.2
Total 3.8 3.0

Bonus payments. Another source of SOFAZ’s revenues in 2012 was bonuses paid by investors for signing and fulfilling oil and gas contracts. The Fund received a total of AZN 1.6 million or USD 2.0 million in bonus payments in 2012 (Table 2.2.3.).
Transferor OilfieldAmount
USD mln. AZNmln.
UGE-LANCER Balakhani 02.02.2012 2.0 1.6Total 2.0 1.6
Table 2.2.3. SOFAZ bonus payment revenues, 2012Other revenues. In the year under review, assets (obsolete or unused metal scrap, pipes) received from investors (international oil companies) under oil and gas contracts were sold, bringing SOFAZ AZN 0.2 million or USD 0.3 million.
2.3. SOFAZ Expenditures
The Oil Fund’s expenditures in 2012 amounted to AZN 10 573.6 million. The major areas of spending were:1) Transfers to the state budget;2) Funding social projects;3) Funding infrastructure projects;4) Funding human capital development program;5) Administrative expenses.
Chart 2.3.1. The structure of the SOFAZ’s expenditures in 2012 (AZN million)
Transfer to the state budget. In 2012 the amount of transfers to the state budget from SOFAZ was AZN 9 905.0 million, which constituted 93.7% of the Fund’s total expenditures. Total transfers to the state budget from SOFAZ amounted to AZN 35 085.0 million since 2003.
Chart 2.3.2. SOFAZ’s transfers to the state budget in 2003-2012 (AZN million)

Funding of social and infrastructure projects. In 2012 SOFAZ continued to finance important infrastructure and social projects in the country, as well as the government program on the human capital development.
The improvement of the social and economic conditions of refugees and internally-displaced persons. In 2012 the Fund allocated a total of AZN 300.0 million for these purposes. Total allocation to this project has been AZN 1 157.8 million since 2001. SOFAZ’s resources directed to the construction of 61 private house settlements for 20 778 families, along with multi-story buildings and a number of social and infrastructure facilities. The project aims to provide homes and appropriate social, cultural and other facilities to enable refugees and internally-displaced families driven from their homes by the conflict between Armenia and Azerbaijan over Nagorno-Karabakh to settle and improve their social and living conditions.
Samur-Absheron irrigation system reconstruction project. In 2012 SOFAZ allocated AZN 200.0 million to this project. A total of AZN 895.5 million has been allocated to this project since 2006. AZN 82.9 million was allocated for construction of the Takhtakorpu water storage with hydroelectric station, AZN 80.8 million for the Takhtakorpu-Jeyranbatan water canal construction, AZN 35.8 million for the Velvelechay-Takhtakorpu canal construction and AZN 0.5 million for personnel expenses based on the request from Irrigation and Water Management OJSV, which is responsible for the program implementation.
The project is designed to create a reliable water supply to Baku and Sumgait, enable energy efficient water transportation and create electricity generation capacity of 25 MW.
New Baku-Tbilisi-Kars railway construction project. In 2012 SOFAZ provided AZN 119.0 million to finance this project. The total allocated amount to the project has been AZN 341.5 million since 2007. The main purpose of the project is to enhance the transit capacity of the region’s countries by building a railway line that goes through Azerbaijan, Georgia and Turkey connecting the Trans-European and Trans-Asian railway networks To this end, the project envisages building a Kars-Akhalkalaki railway line, 76 km of which will pass through Turkey and 26 km through Georgia, as well as restoring and rebuilding the 160 km of Georgia’s Marabda-Akhalkalaki railway.
Human capital developmentThe “State Program on Education of Azerbaijani Youth Abroad in the years 2007-2015”. This program helps to realize the idea of “transforming black gold into human capital”. SOFAZ allocated AZN 20.0 million to finance the program in 2012. A total of AZN 54.8 million has been spent to fund the program since 2008. Based on the request from the Ministry of Education of the Republic of Azerbaijan which is responsible for the program implementation, the Oil Fund allocated AZN 11.9 mln. for accommodation, AZN 6.6 mln. for tuition, AZN 0.8 mln. for travel, AZN 0.3 mln. for health insurance, AZN 0.1 mln. for visa and registration, AZN 0.3 mln. for the other expenditures and AZN 0.13 mln. for administrative and

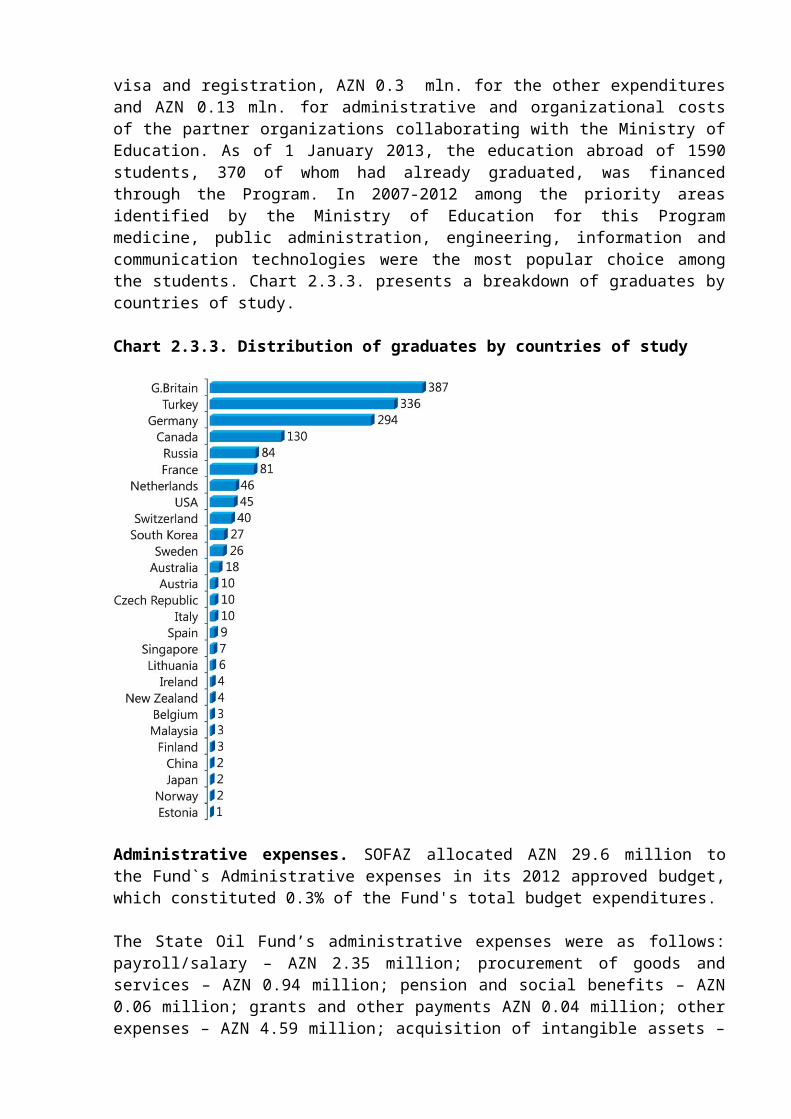
organizational costs of the partner organizations collaborating with the Ministry of Education. As of 1 January 2013, the education abroad of 1590 students, 370 of whom had already graduated, was financed through the Program. In 2007-2012 among the priority areas identified by the Ministry of Education for this Program medicine, public administration, engineering, information and communication technologies were the most popular choice among the students. Chart 2.3.3. presents a breakdown of graduates by countries of study.
Chart 2.3.3. Distribution of graduates by countries of study
Administrative expenses. SOFAZ allocated AZN 29.6 million to the Fund`s Administrative expenses in its 2012 approved budget, which constituted 0.3% of the Fund's total budget expenditures.
The State Oil Fund’s administrative expenses were as follows: payroll/salary – AZN 2.35 million; procurement of goods and services – AZN 0.94 million; pension and social benefits – AZN 0.06 million; grants and other payments AZN 0.04 million; other expenses – AZN 4.59 million; acquisition of intangible assets – AZN 21.64 million.
3. INVESTMENT STRATEGY AND RISK MANAGEMENT
3.1. Global economy during 2012
2012 was marked by the deterioration of the economic growth rates in both developed and emerging economies. A slowdown in global growth at the beginning of 2012 was deeper than expected, as the growth equalled to 2.9% at the yearend vs. 3.4% forecasted. European growth

amounted to -0.6% for the Eurozone vs. +0.2% expected at the beginning of the year. In general, The Eurozone, as well as the United Kingdom slid into recession. The GDP growth rate equalled 7.7% in China, 1.0% in Brazil in 2012. On the other hand, US growth was in line with forecasts at the beginning of 2012 equaling to 2.2% on average.
Chart 3.1.1. Rates of growth in GDP in the USA, Eurozone and UK (2006-2012, percentages)
Source: Bloomberg
A deepening Eurozone crisis played a crucial part in deterioration of global economic environment. The global trade dropped from 4.5% in 2011 to 2.5% in 2012. Fiscal austerity in Europe, the ongoing deleveraging among private economic agents in developed countries, as well as the monetary tightening in 2011 played a significant role in a slowdown in growth in most countries. However, highly expansionary economic policies in 2012 of the United States have helped them to maintain stable growth rate. Japan was exception as well, as the latter benefited from the after-effects of the Fukushima disaster.
In general, global growth dropped by nearly one percentage point in 2012, from 3.8% (in PPP terms) in 2011 to 2.9% in 2012. After the inflationary shock in 2011, inflation tended to decrease in most countries.
Chart 3.1.2. Inflation rates in the USA, Eurozone and UK (2006-2012, percentages)

Source: Bloomberg
Elections in the United States were the most significant event in the country. However, they did not change the political configuration that had prevailed in the previous two years and resulted in re-election of Barack Obama.
The economic growth rates were in line with forecasted and equalled to 2.2% on average in 2012 after 1.8% in 2011. Highly expansionary economic policies in 2012 of the United States have helped them to maintain stable growth rate. Fiscal policy did not become restrictive and monetary policy continued to ease. As a result, the fiscal deficit declined to 6.7% in 2012 from 8.6% in 2011.
Unlike to the previous year when growing commodities prices led to increasing inflation, 2012 was marked by gradual disappearance of the sharp increase in commodity prices of preceding year. As a result, inflation fell noticeably over the year to 2.1% on average after 3.2% in 2011.About 1.8 million jobs were created during 2012 and country’s unemployment rate at 8.3% in January went down slightly to 7.7% in December. Real estate sector improved as well in 2012 as investment in structures and residential investment accelerated, prices returned to upward trend and inventories fell. On the other hand, household consumption dropped to 1.8% in 2012 against 2.5% in 2011.
A deepening sovereign debt crisis continued to deteriorate social and economic situations in the Eurozone and was the main factor driving the economic slowdown in the region. The peripheral countries and other countries in the zone as well suffered from the ongoing fiscal austerity, even though due to interventions by the European Central Bank, financial environment gradually improved.
Similar to 2011, the Eurozone economy was characterized by its heterogeneity in 2012 as well. Thus, while some countries showed positive growth rates, for instance growth rate in Germany equalled to 1% on average, other countries in the Eurozone gradually slid to recession, showing falling GDP. Italy and Spain have been facing severe problems since the second half of 2011 and continued to show signs of recession in 2012 as well. Hence, growth rate in Spain and Italy equalled -1.6% and -2.1%, respectively. France avoided recession; however, showed very modest growth rate amounted to 0.1%. The United Kingdom also showed signs of weakness in 2012 with a recession of 0.2%.
The fiscal deficit in the Eurozone was reduced from 4.1% of GDP to 3.5% in 2012. Deleveraging among private agents, as well as the negative effects on growth created difficulties for some countries to keep their deficit commitments.
Inflation remained relatively high in the Eurozone equalling to 2.5% at an annual average, nevertheless before declining towards the end of the year. Similar to GDP growth, the significant cross-country variations were observed on unemployment as well. Thus, the German unemployment rate fell slightly from 7.05% to 6.83% while the French unemployment rate rose from 9.62% to 10.24% at the end of 2012. In general, the unemployment rate stayed on its upward trend, rising from 10.16% at the beginning of the year to 11.37% in December. However, in Spain unemployment rate increased sharply and amounted to 26.06%.
Chart 3.1.3. Unemployment rates in the USA, Eurozone and UK (2006-2012, percentages)
Source: Bloomberg
The monetary policies of countries in 2012 aimed to counter the recessionary effect of the fiscal deficit and the private-sector deleveraging. While in emerging countries central banks eased their monetary policies in 2012 via rate cuts, developed countries continued unconventional policy tools, because rates there were already low. For instance, China lowered the reserve requirement ratio and twice (in July and August) cut the 1-year lending rate from 6.56% to 6%. India lowered its rates only marginally by 50 bp to 8%. The Russian central bank in particular was forced to hike its key intervention rate by 50 bp to 8.5% in September, owing to persistently high inflation.
The Federal Reserve, the central bank of the United States continued its policy launched in 2010 of purchasing treasuries. In October 2011 the Federal Reserve made some changes in monetary policy namely Operation Twist, to amount to USD 267 bln. In order to drive down long-term interest rates the FED started selling short-term securities and buying long-term

securities. In September 2012 it launched a third wave of quantitative policy by purchasing of Agency MBS for an amount USD 40 bln per month.
Furthermore, December 2012 meeting at the Federal Reserve resulted in an announcement of a new programme of purchase of Treasury securities for and amount of USD 45 bln per month, starting in early 2013.
Chart 3.1.4. Leading countries’ central banks interest rates (2002-2012, percentages)
Source: Bloomberg
In the reporting year European Central Bank (ECB) was very active in implementing of unconventional monetary policies to prevent widespread recession and growing liquidity crisis, as the interbank market seized up, and reduce sovereign risk. In July 2012 the ECB officially announced the closing of the SMP (Securities Markets Programme) and the launch of OMT (Outright Monetary Transactions). According to this programme, sovereign papers with short maturities up to 3 years should be purchased in secondary market. In 2012 ECB allotted unlimited amounts of liquidity to the banks with a maturity of 3 years. ECB also launched a next Very Long Term Refinancing Operation in late February which amounted to EUR 530 bln.
In July 2012 the ECB also lowered the Refi rate by 25 bp to 0.75%. Consequently, this rate went below 1% for the first time since the creation of the ECB. As a result of the weakening economic growth short-term interest rates decreased during the year and reached very low level, reflecting the excess liquidity and the fall in banking risk.
The Bank of England (BoE) extended its government bond purchase programmes, by purchasing Gilts for GBP 100 bn in 2012 bringing the total amount held to GBP 375 bln. Additionally, in August it launched a new programme which aimed to help the banks to obtain cheap funding over a period of up to 4 years.
The Bank of Japan launched its government bond (JGBs) purchase programme in order to prevent the persistent deflation and in attempt to weaken the yen.

Chart 3.1.5. 5-year Credit Default Swap (CDS) of named European countries (basis points)
Source: Bloomberg
Equity market
In 2012, coordinated efforts by central banks, especially by the ECB, contributed to positive performance of the major stock indices. The MSCI World Index, composed of stocks of 24 developed countries, ended the year with a +12.2% return, while MSCI EM Index, the stock market measure of developing countries, examined +15.1% return. Major US broad market index, S&P500 increased +13.4% over the year, mainly due to the strong positive earnings. The first quarter of the year which saw a monetary interventions by central banks and rise in stock prices, was followed by macroeconomic and political risks during the second quarter and consequently major declines in both MSCI World and MSCI Emerging Markets indices. Coordinated monetary easing measures by the ECB, the Fed and the People’s Bank of China resulted in major gains in European stock prices in Q3. Due to uncertainty with Spain, the fourth quarter was characterized by volatility in stock prices. Overall, European stock market gauge, Eurostoxx posted a positive gain of 15.2% during the 2012. In terms of individual country performances, German DAX showed the most significant increase of 29.1% over the year. France’s CAC40 gained 14.6%. Similar to previous years since the beginning of sovereign debt crisis, South European countries, Spain, Italy and Portugal were among the worst stock market performers in Eurozone, with Spanish IBEX, Italian MIB and Portuguese PSI posting annual returns of -5.1%, +7.8% and +3%, respectively. Exception was Greece; driven by the determination of EU member countries to keep the country in Eurozone, its benchmark index Athex gained 32.5%, following the severe decline of 2011 (-52%).
In Asia, Japanese stock market gauge, Nikkei 225 Index, surged 23% during the year, the strongest return for the index since 2005. The strong results can partly be attributed to the newly elected government, which pledged to turn around the nation’s long-suffered economy and undertake more economy-stimulating measures.
Chart 3.1.6. MSCI World Index (2002-2012, index points)

Source: Bloomberg
Real Estate
The global real estate market’s movement in 2012 was better than expected. Investment volume in 2012 slightly exceeded 2011 level by around 2%.
An exceptional rally in 2012 has served to demonstrate the strength of investors’ appetite for core commercial property. The search for yield in the low interest rate environment, combined with perceived reduction in macro-economic risks and the selective improvement in debt markets, is supporting increasing investor activity. In this context real estate market expects investment volumes to grow more in 2013, with the best upside potential in secondary markets, which are now beginning to be attractive to investors with their more favourable yields.
The leasing markets have been less resilient however, as corporates focus on productivity gains and cost savings, rather than on expansion. But even here, improvement in optimism is detected which should translate into renewed growth in leasing activity during 2013.
Commodity market
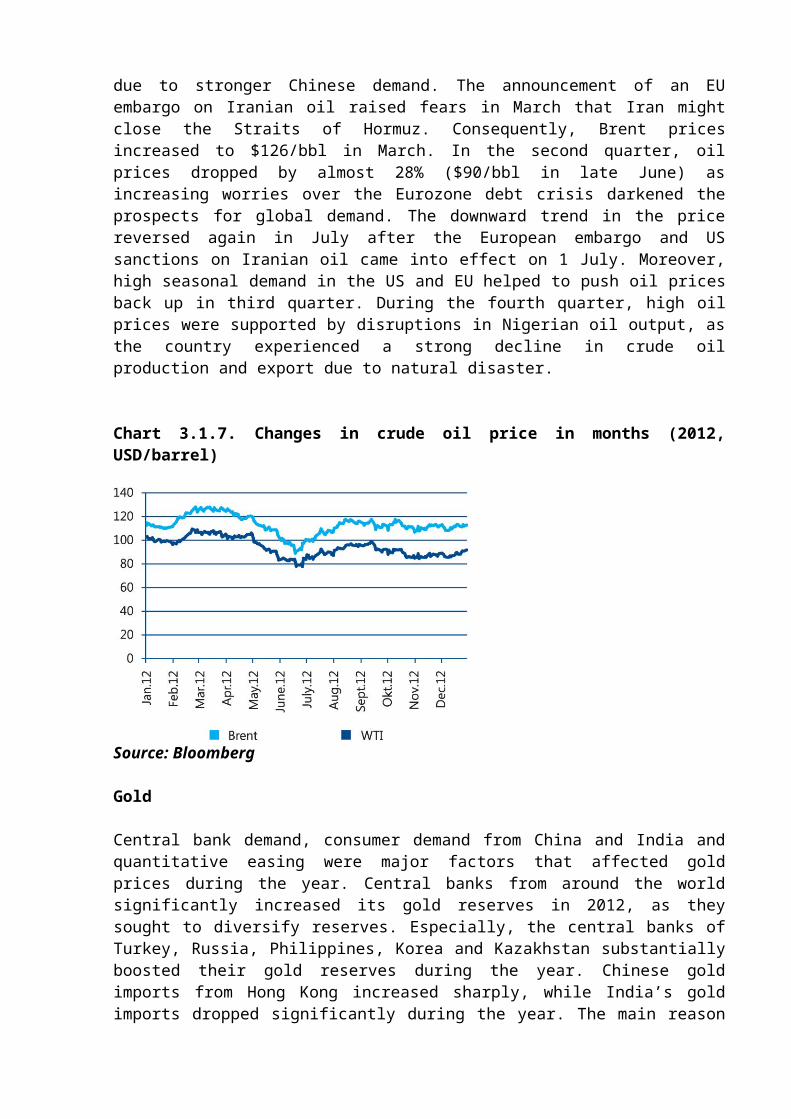
The fluctuations experienced by oil prices in 2012 can be explained primarily by market fundamentals and geopolitical tensions. In the first quarter of 2012, oil prices increased due to stronger Chinese demand. The announcement of an EU embargo on Iranian oil raised fears in March that Iran might close the Straits of Hormuz. Consequently, Brent prices increased to $126/bbl in March. In the second quarter, oil prices dropped by almost 28% ($90/bbl in late June) as increasing worries over the Eurozone debt crisis darkened the prospects for global demand. The downward trend in the price reversed again in July after the European embargo and US sanctions on Iranian oil came into effect on 1 July. Moreover, high seasonal demand in the US and EU helped to push oil prices back up in third quarter. During the fourth quarter, high oil prices were supported by disruptions in Nigerian oil output, as the country experienced a strong decline in crude oil production and export due to natural disaster.
Chart 3.1.7. Changes in crude oil price in months (2012, USD/barrel)

Source: Bloomberg
Gold
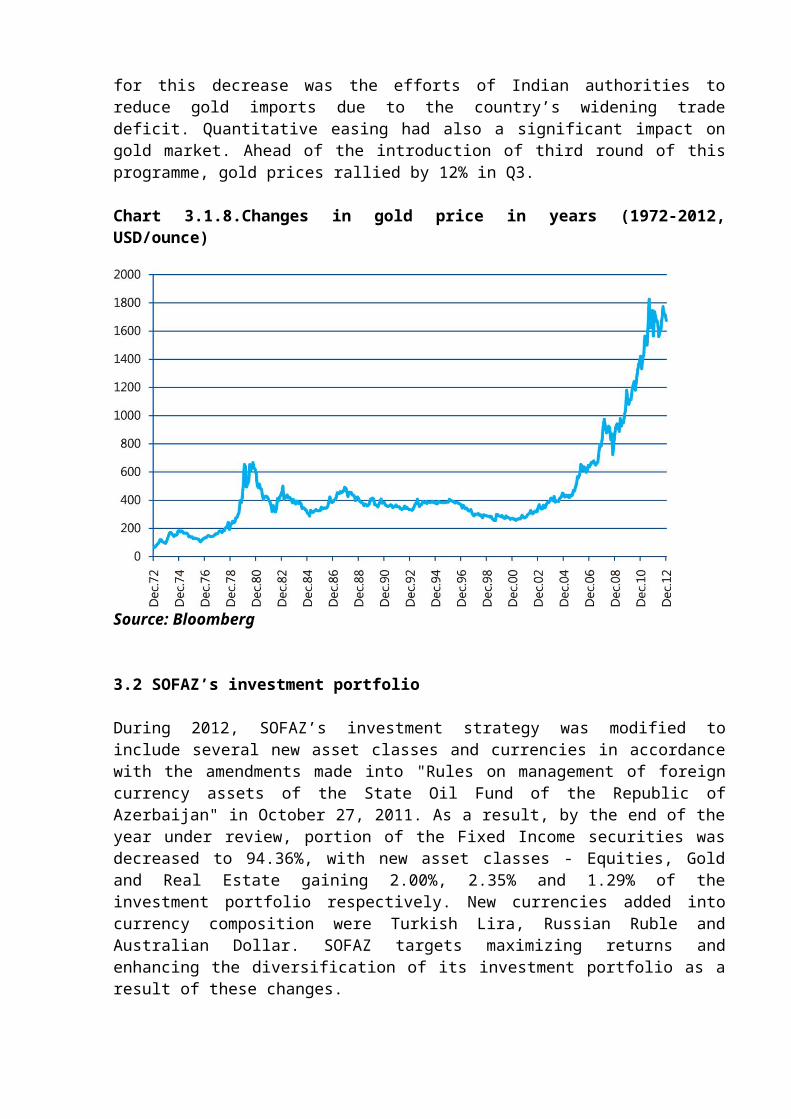
Central bank demand, consumer demand from China and India and quantitative easing were major factors that affected gold prices during the year. Central banks from around the world significantly increased its gold reserves in 2012, as they sought to diversify reserves. Especially, the central banks of Turkey, Russia, Philippines, Korea and Kazakhstan substantially boosted their gold reserves during the year. Chinese gold imports from Hong Kong increased sharply, while India’s gold imports dropped significantly during the year. The main reason for this decrease was the efforts of Indian authorities to reduce gold imports due to the country’s widening trade deficit. Quantitative easing had also a significant impact on gold market. Ahead of the introduction of third round of this programme, gold prices rallied by 12% in Q3.
Chart 3.1.8.Changes in gold price in years (1972-2012, USD/ounce)
Source: Bloomberg

3.2 SOFAZ’s investment portfolio
During 2012, SOFAZ’s investment strategy was modified to include several new asset classes and currencies in accordance with the amendments made into "Rules on management of foreign currency assets of the State Oil Fund of the Republic of Azerbaijan" in October 27, 2011. As a result, by the end of the year under review, portion of the Fixed Income securities was decreased to 94.36%, with new asset classes - Equities, Gold and Real Estate gaining 2.00%, 2.35% and 1.29% of the investment portfolio respectively. New currencies added into currency composition were Turkish Lira, Russian Ruble and Australian Dollar. SOFAZ targets maximizing returns and enhancing the diversification of its investment portfolio as a result of these changes.
Chart 3.2.1. Breakdown of SOFAZ investment portfolio by asset classes (31.12.2012)
Fixed Income Investments
During the year under review, the Fund’s fixed income investment strategy has not undergone significant changes compared to the previous year. As in 2011, it continued investing primarily in short-term fixed-income securities as well as commercial papers, and floating rate notes.
The portion of the Fixed Income securities equalled 94.36%, in line with Fund’s İnvestment Policy, which implies that at least 85% of the overall portfolio should consist of, debt obligations and money market instruments. The Fund sought to achieve the highest possible return with minimal risk in the prevailing low-interest-rate environment. The scope of fixed income investments was also broadened to include lower investment grade securities into portfolio with the aim to enhance the yield and secure greater diversification.

Chart 3.2.2. Breakdown of fixed income portfolio by product types
Holdings of short term commercial papers in the Fund’s fixed income portfolio have increased to 24.74% of total portfolio by the end of 2012 compared to 12.76% a year earlier. On the other hand, proportion of the Fund’s sovereign debt holdings declined to 11.40% from 17.01% in 2011. This shift led to drop in the duration of portfolio to 0.36, resulting in less sensitivity to interest rate movements.
In line with the changes into investment guidelines, new currencies - Turkish lira, Russian ruble and Australian dollar were added to portfolio in the year under review. In accordance with these guidelines, total amount of investments in new currencies is limited to maximum of 5% of total assets under management. The Fund got a mandate to invest in Australian government bonds in 2012 and this investment equalled to 0.65% of the portfolio by the end of the year. Turkish lira and Russian ruble denominated investments were in the form of deposits at the largest local banks and constituted to 1.43% and 0.31% of the investment portfolio, respectively. Thus, total exposure to new currencies was in line with the limits put forth by investment guidelines. Exposure to USD, EUR, and GBP has not experienced significant changes during 2012.
Chart 3.2.3. Breakdown of SOFAZ fixed income portfolio by currencies

During the year under review, the Fund continued its strategy of achieving geographic diversification of the investment portfolio. As a result, emerging markets exposure was gradually increased to 13.07% compared to 9.5% a year earlier. In spite of these activities, Europe still remained the largest exposure of the portfolio by the end of 2012.
Chart 3.2.4. SOFAZ investment portfolio: Geographical distribution
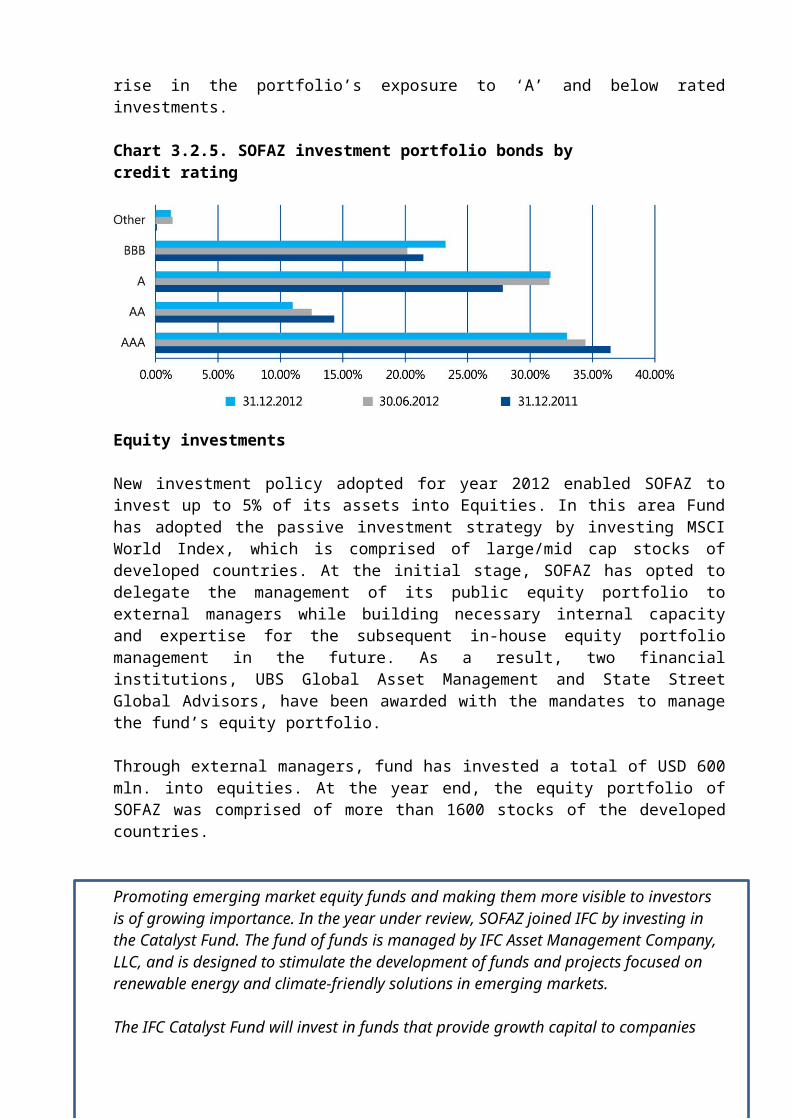
During 2012, the Fund also gradually decreased its exposure to high-grade bonds, while increasing its exposure to lower grade bonds. Thus, investments in ‘AAA’ and ‘AA’ rated securities declined to 32.96% and 10.98% respectively, down from previous year’s 36.44% and 14.30%. Increase in exposure to emerging markets and non-investment grade deposit investments in Turkey and Russia during the year under review, led to significant rise in the portfolio’s exposure to ‘A’ and below rated investments.
Chart 3.2.5. SOFAZ investment portfolio bonds by credit rating
Equity investments
New investment policy adopted for year 2012 enabled SOFAZ to invest up to 5% of its assets into Equities. In this area Fund has adopted the passive investment strategy by investing MSCI World Index, which is comprised of large/mid cap stocks of developed countries. At the initial stage, SOFAZ has opted to delegate the management of its public equity portfolio to external managers while building necessary internal capacity and expertise for the subsequent in-house equity portfolio management in the future. As a result, two financial institutions, UBS Global

Asset Management and State Street Global Advisors, have been awarded with the mandates to manage the fund’s equity portfolio.
Through external managers, fund has invested a total of USD 600 mln. into equities. At the year end, the equity portfolio of SOFAZ was comprised of more than 1600 stocks of the developed countries.
Promoting emerging market equity funds and making them more visible to investors is of growing importance. In the year under review, SOFAZ joined IFC by investing in the Catalyst Fund. The fund of funds is managed by IFC Asset Management Company, LLC, and is designed to stimulate the development of funds and projects focused on renewable energy and climate-friendly solutions in emerging markets.
The IFC Catalyst Fund will invest in funds that provide growth capital to companies developing innovative ways to address climate change, and invest directly in those companies. The commitment period of the fund is 3 years for investee funds and 5 years for co-investments. At the first closing of the fund, SOFAZ committed USD 50 million of the USD 280 million raised.
In 2010, SOFAZ also committed USD100 million to the IFC African, Latin American and Caribbean Fund (ALAC). The USD1 billion Fund invests in private sector growth opportunities in emerging markets. As of December 2012, SOFAZ has contributed USD 54.7 million of its commitment to the ALAC Fund.
Real estate investments
In 2012, SOFAZ made its foray into real estate market through direct property acquisitions in several key European cities. Fund’s strategy is aimed at investing in key business cities with high market transparency, depth, liquidity, landlord friendly laws and practice of very long
leases. The investments were primarily directed into mixed use office space. SOFAZ made its first investment in London followed by Moscow and Paris:
78 St James Street, London, UK for 177,350,000 GBP (285,550,000 USD) completed in December Actor Gallery, Tverskaya 16, Moscow, Russia for 133,000,000 USD completed in December 8, Place Vendome, Paris, France for 135,000,000 EUR (180,000,000 USD) to be completed in March 2013 These acquisitions are early examples of SOFAZ’s successful realization of its real estate investment strategy. The secure income that will be generated tied with strong fundamentals of prime office space in major world capitals are the defining factors in fund’s investment rationale. From 2013, the Fund will start broadening its investment geography outside the European market with global diversification of the real estate portfolio.
Gold
According to the investment guidelines, up to 5% of the SOFAZ’s assets can be invested into gold and Fund has been making this investment by purchasing the gold bars conforming to the requirements of the London Bullion Market Association (LBMA). In order to reduce the risks associated with price fluctuations, fund has scheduled to acquire the planned overall amount of gold on a weekly basis in equal amounts within two years. Starting from February 1, 2012, SOFAZ started the purchase of 25 gold bars conforming to the requirements of London Bullion Market Association (LBMA) per week (10,000 troy ounces) from the market-maker member banks of LBMA. As of December 31, 2012 14 934 kg of gold (480 146 troy ounces) was acquired. The gold is kept in JP Morgan’s London vault.In the next stage, it is planned to ship strategically important gold reserves to Azerbaijan and preserve it inside the country. Currently, in order to get extra return on the gold investments, some amount of the gold is invested in short-term deposits at the reputable banks operating in the international financial markets.
3.3. SOFAZ investment portfolio performance
Performance measurement methodology . Returns on SOFAZ assets are calculated in accordance with the “Performance measurement methodology for the investment portfolio and sub-portfolios of the State Oil Fund” approved by the Resolution No. 5 of 21 April 2009. In accordance with this methodology, the AZN, USD or EUR is taken as the base currency in calculating the performance of the total investment portfolio. Performance is also calculated without a base currency, i.e. without taking currency exchange fluctuations into account. The performance of the sub-portfolios is measured in the respective (local) currency of each sub-portfolio and in the base currency, i.e. USD (provided the impact of the currency component is indicated).
The following information is used for performance measurement:The portfolio’s COB market value in local currency. The prices provided by the custodian bank and stored in the Oil Fund’s portfolio management system are used to calculate the portfolio’s COB market value in local currency. The prices provided by the custodian bank, audited and stored in the Oil Fund’s portfolio management system are used for calculating the portfolio’s month-end market value in local currency.
The portfolio’s previous day COB market value in local currency. The prices provided by the custodian bank and stored in the Oil Fund’s portfolio management system are used to
calculate the portfolio’s previous day COB market value in local currency.
COB net flows defined as the difference between inflows and outflows during the business day. Net flow figures are calculated by the SOFAZ portfolio management system on a daily basis.
SOFAZ rate of return in 2012. The return on the SOFAZ investment portfolio was equal to about 4.2%, 4.5%, 3.8%, 3.3%, 1% and 0.8% in 2006, 2007, 2008, 2009, 2010 and 2011 respectively. The return from managing its investment portfolio was equal to 2.2% in 2012.
Chart 3.3.1. SOFAZ investment portfolio: Rate of return
3.4. Restrictions on investment
The Oil Fund’s investment portfolio is managed in accordance with the “Rules on managing the foreign currency assets of the State Oil Fund of the Republic of Azerbaijan” (“Investment Guidelines”), approved by Presidential Decree No. 511 of 19 June 2001. According to the Rules, SOFAZ assets may be invested in the following:
• Deposits in the central (national) banks, commercial banks and other financial institutions;• Debt obligations issued by the governments, government agencies, international financial organizations, for profit organizations and other institutions with long-term investment grade credit ratings (Standard & Poor’s or Fitch or Moody’s);• Debt obligations with long-term investment grade credit ratings (Standard & Poor’s or Fitch or Moody’s) issued by governments, government agencies, international financial organizations, for profit organizations and other institutions;• Investments in stocks included in major international equity indices;• Shares of mutual and alternative investment funds;• Gold bars conforming to the requirements of the London Bullion Market Association;• Real Estate;• Non-investment grade debt obligations or deposits with credit rating of not less than BB- (Standard & Poor’s or Fitch) or Ba3 (Moody’s). Maximum capital, allocated to those investments should not exceed 5% of the total value. In this case, the counterparty banks of the Oil Fund providing custodian (depositary) services and holding correspondent accounts for Oil Fund may have non-investment grade credit rating (not less than BB- (Standard & Poor’s, Fitch) or Ba3 (Moody’s)) (According to the “Rules on management of the foreign currency assets of the State Oil Fund of the Republic of Azerbaijan” (“Investment Guidelines”), approved by Presidential Decree No. 511 of 19 June 2001 as amended by decrees No. 607 of 21 December 2001, No. 202 of 1 March 2005 and No. 519 of 27 October 2011).

Derivatives (i.e. swaps, forwards, futures, etc.) may be used for hedging or optimizing the currency composition and asset allocation of the Investment Portfolio.
Investment policy SOFAZ currency assets are managed in accordance with the Fund’s investment policy which is approved by the President of the Republic of Azerbaijan on an annual basis.
According to that policy: The Oil Fund’s assets must have reasonable liquidity in order to ensure that planned money and other transfers related to the Fund’s budgetary expenditures can be made in an accurate and timely manner. For this reason, a proportion of these assets, equivalent to no less than USD 100 million (minimum liquidity level) is to be held in cash or cash equivalents. If minimum liquidity level is breached, it must be restored within 7 (seven) working days.
The Oil Fund determines the target duration (not exceeding 48 months) of its investment portfolio in line with the current status of the global financial markets.
The maximum average weight of one specific security or one issuer (excluding depository banks) in the investment portfolio should not exceed 15% of the total value of the investment portfolio.
External managers According to the “Rules on managing the foreign currency assets of the State Oil Fund of the Republic of Azerbaijan” (“Investment Guidelines”), approved by Presidential Decree No. 511 of 19 June 2001 as amended by decrees No. 607 of 21 December 2001, No. 202 of 1 March 2005 and No. 519 of 27 October 2011 an external manager engaged in managing the Fund’s financial assets, or its parent company, shall have an investment-grade credit rating (of no less than Baa3 (Moody’s) or BBB- (Standard & Poor’s, Fitch)), at least 5 years relevant experience of managing financial assets or experience of managing financial assets equal to or exceeding USD 1 billion.
In February, 2012 SOFAZ announced the Request for Proposal for selection of managers for passive equity portfolio management. After a detailed due diligence of all the provided proposals, State Street Global Advisors (SSgA) and UBS Global Asset Management (UBS) were selected as the winners and in June, 2012 SOFAZ signed contracts with them. Besides, following the legal merger between Credit Suisse and Clariden Leu, on April 2, 2012, Credit Suisse assumed all the rights and obligations of Clariden Leu. Accordingly, from this date onwards, any existing or future reference to Clariden Leu in any documentation was to be read as a reference to Credit Suisse.
The external managers handling SOFAZ financial assets as of 31 December 2012 are the World Bank, Deutsche Asset Management, Credit Suisse, SSgA and UBS.
3.5. Risk management Risk management is an essential element of the Oil Fund’s operations. SOFAZ employs globally recognized, state-of-the-art models, procedures and indicators to handle this particular task. The Risk manager software application (developed by Riskmetrics) procured in February 2010 has greatly enhanced the Fund’s risk management capabilities. Its risk management practices are divided into two areas: financial risks and operational risks.
Financial risks

Market risk. Also commonly referred to as systematic risk, market risk is the risk that a portfolio’s value will decline because of changes in market risk factors. These include security prices, interest rates, foreign currency exchange rates and commodity prices. Market risks are tightly controlled in all investment management companies and SOFAZ is continuously improving control of these risks. The Fund’s investment portfolio is dominated by short-term bonds. However, it constantly monitors the central bank interest rates of the countries to which it is exposed and adjusts the duration of the relevant fixed-income securities accordingly.
Credit risk. Credit risk is the risk that a borrower will fail to repay the principal or interest on borrowed funds on time or fail to honour its contractual obligations. Credit risk stems from a number of sources, such as the borrower’s bankruptcy, credit rating downgrade, etc. As credit risks increase, investors tend to lend their assets at higher interest rates. Credit risk is an essential consideration when investing in fixed income assets and key credit rating agencies regularly assess the credit ratings of thousands of companies, agencies and financial institutions. The credit ratings of the securities in which SOFAZ invests, as well as their issuers, are regulated by the Fund’s “Investment Guidelines”.
Operational risks
Operational risk is the risk of contingent financial or non-financial losses caused by internal processes, the human factor and external factors.
Human risk. This is associated with the deliberate or unintentional failure of staff to comply with the organization’s rules and codes of conduct. SOFAZ closely monitors its staff to ensure strict compliance with its policies and procedures and to prevent any engagement in illegal market transactions and disclosures of the corporate commercial secrets. Furthermore, as part of the personnel’s skill development, staff from relevant departments regularly attend numerous training seminars and courses, held by investment banks with which the Fund cooperates.
Reputational risk. Reputational risk is the risk that the organization may experience difficulties in maintaining past business relations, establishing new ones or gaining access to capital because it is perceived negatively by its stakeholders (customers, counterparts, shareholders, regulators, etc.). An organization might face reputational risk even without violating any law. SOFAZ pays particular attention to reputational risk and has been able to enhance its reputation and positive image both at home and abroad a great deal, especially thanks to its success in the Extractive Industries Transparency Initiative.
4. MANAGEMENT
The Oil Fund’s day-to-day activities are managed by the Executive Director who is appointed by the President of the Republic of Azerbaijan.
SOFAZ Supervisory Board The Supervisory Board, consisting of representatives of the state authorities and public organizations, carries out general oversight of State Oil Fund operations. The Board reviews and evaluates the Fund’s draft annual budgets, annual reports and financial statements, along with audit reports. Members of the Supervisory Board are approved by the President of the Republic of Azerbaijan. The Board members act on a voluntary (non-remunerable) basis.
Presidential Decree No. 73 of 27 November 2008 approved the new composition of the State Oil Fund’s Supervisory Board as consisting of the following members:

Artur Rasizade Prime Minister of the Republic of Azerbaijan
Valeh Alesgerov Vice-Speaker of the Parliament (Milli Majlis) of the Republic of Azerbaijan
Vahid Akhundov State Economic Policy Adviser of the Republic of Azerbaijan
Samir Sharifov Minister of Finance of the Republic of Azerbaijan
Shahin Mustafayev Minister of Economic Development of the Republic of Azerbaijan
Elman Rustamov Chairman of the management Board of the Central Bank of the Republic of Azerbaijan
Mahmud Kerimov President of the National Academy of Sciences of the Republic of Azerbaijan
The Supervisory Board held 1 meeting in 2012. At the meeting on 7 June 2012, Fund’s 2011 annual performance report and the audit findings were discussed and deemed satisfactory. In addition, the Supervisory Board discussed and agreed on certain changes and amendments to the Fund’s 2012 annual budget.
On 27 December 2012 Supervisory Board by the means of request discussed and approved the Oil Fund’s draft annual budget for 2013, its draft investment programme (including its investment policy), as well as the Fund’s draft administrative expenses. The Board resolved to submit the Fund’s draft annual budget to the President of the Republic of Azerbaijan for approval.
SOFAZ organizational structure SOFAZ’s investment activity is conducted by Front, Middle and Back Offices. Front and Middle office functions are performed by the Investment and Risk management Departments set up under the Asset management Administration.
Investment Department (Front-Office) The Investment Department is responsible for developing investment strategy, real estate, portfolio management and trading. The Department has 3 divisions: • the Fixed-Income Division; • the Equity and Alternative Investments Division; • the Money Market and Foreign Exchange Division.
Risk Management Department (Middle-Office) The Risk management Department is responsible for conducting assessments of and preparing proposals for the Fund’s investment policy and strategic asset allocation (SAA), selecting benchmarks and risk budgeting. In addition, this department is also responsible for risk and performance measurement, performance attribution, modeling and research, compliance supervision and supervision of external managers. The department has 2 divisions: • the Strategic Asset Allocation/Risk and Performance Measurement Division;
• the External Asset Management/ Research Division.
Settlements Department (Back-Office) Back-office functions are performed by the Settlements Department, operating under the Fund’s Finance and Operations Administration.
The Settlements Department is responsible for verifying trades with counterparties, for trade settlement with the custodian bank and correspondent banks, for reconciling cash and transactions with statements from the banks, and for reconciling external managers’ transactions and positions with information from custodians on a daily and monthly basis.
Budget Forecasting and Projects Department The Budget Forecasting and Projects Department is responsible for forecasting SOFAZ revenue and expenditures, organizing its budgeting, its economic analysis, strategic research and macroeconomic modelling work, and for organizing and supporting the activities of the Fund’s Supervisory Board and the financing of fund-sponsored projects.
Figure 4.1. SOFAZ organizational structure
5. OIL FUND—TRANSPARENT SOVEREIGN WEALTH FUND
5.1. SOFAZ public relations
Transparency has been a key principle in the State Oil Fund’s operations since its inception. Regular auditing of the Fund’s financial statements by a global reputable auditor is used as the primary safeguard to ensure the transparency of SOFAZ operations. The State Oil Fund’s financial performance in 2012 was audited by Ernst&Young.

SOFAZ information policy. The State Oil Fund’s public relations are managed in accordance with its Information Policy, as approved by the Order of Executive Director of SOFAZ, dated 20 April 2007. This policy was developed to properly coordinate and effectively manage the Fund’s public relations, ensuring it meets the public’s need for information and maintains and further develops its reputation of being a transparent public organization, in accordance with the Law of the Republic of Azerbaijan “On right to obtain information”. Instruments employed by the Oil Fund for public information and disclosure purposes include: • Press-releases; • Quarterly and annual reports; • The official website; • Press conferences; • Disclosures and publications in the mass media.
SOFAZ issues press releases about its assets, projects, revenues and expenditures through the periodical press on a quarterly basis. Furthermore, press releases are used to inform the public about various events and meetings held at the Fund.
SOFAZ publishes quarterly revenue and expenditure statements, annual reports and reports on EITI activities through the press and its own website (www.oilfund.az). It ensures the transparency of the revenues from the management of the natural reserves and their utilization.
Quarterly press conferences are held for media representatives in order to keep them updated of the Oil Fund’s activities. In addition, SOFAZ’s Executive Director gives interviews to reputable local and international media.
Oil Fund always takes an interest in answering questions of public. SOFAZ replies to all verbal and written Fund-related requests directed to the Fund in the frame of time envisaged by the Law of the Republic of Azerbaijan "On right to obtain information".
Today mass media, NGOs and independent experts appreciate Fund as the governmental organization replying to their requests on time and in details.
Seminar for mass media representatives was held by the staff of the State Oil Fund of the Republic of Azerbaijan on 4 July, 2012.The purpose of the seminar was to enhance the awareness of mass media about the Oil Fund who carefully deals with transparency issues and highly valued by numerous authoritative international organizations for its achievements, to disseminate professional information about the Fund and to cooperate with mass media on providing information to the population about SOFAZ.During the seminar journalists were informed about SOFAZ, the organizational structure, Fund's management mechanism, SOFAZ’s budget, financed projects, new investment policy, transparency activities, information about sovereign wealth funds and financial markets.
5.2. Extractive Industries Transparency Initiative (EITI) activities
The Extractive Industries Transparency Initiative (EITI) is designed to promote transparency and accountability in the extractive industry. It was first announced in September 2002 in Johannesburg by British Prime Minister Tony Blair. The first EITI conference was held in London on 17 June 2003. A delegation, headed by the current President of the Republic of Azerbaijan Ilham Aliyev, attended the conference and announced Azerbaijan’s accession to the international initiative.
The EITI Committee was set up by the Cabinet of Ministers of the Republic of Azerbaijan in its 13 November 2003 decree. The Committee, chaired by the Executive Director of the Oil Fund, consists of representatives of the ministries of Foreign Affairs, Economic Development, Industry and Energy, Finance, Taxes, Ecology and Natural Resources, the State Statistical Committee, the State Oil Company and the Ambassador of the Republic of Azerbaijan in the United Kingdom of Great Britain and Northern Ireland.
The EITI is a voluntary initiative, supported by companies, governments, investors and civil society organizations. It provides the implementing countries with a significant capacity to demonstrate a completely transparent investment environment that is attractive to investors and to international financial institutions. The EITI acts as a major incentive to improve accountability and governance in a politically stable and rapidly growing country. This, in turn, helps to avoid any possible disagreements that may arise over the revenue distribution in the extractive industries.
On 24 November 2004, the EITI Committee, local and foreign oil and gas companies and the Increasing Transparency in the Extractive Industries coalition of NGOs signed a memorandum of Understanding on implementing the EITI in Azerbaijan.
The government of Azerbaijan discloses its EITI reports about the mechanism as stipulated by the memorandum. In accordance with the memorandum, a competition is held to select a reliable international audit firm for each reporting cycle to analyze and reconcile government and company reports. The successful bidder is selected by EITI multi-stakeholder Group (MSG), consisting of representatives of the parties to the Memorandum.
All companies operating in extractive industries, as well as state enterprises are involved in EITI implementation process. The government has also ensured active participation of the civil society in development, monitoring and evaluation of the EITI implementation process.
In 2012, the Oil Fund continued its activities within EITI.
The EITI International Board held 19th meeting in Sussex, England on 14-15 February, 2012. The delegation headed by the chairman of the National EITI Committee, a member of the EITI International Board and the Executive Director of the State Oil Fund of the Republic of Azerbaijan Shahmar Movsumov participated at this meeting.The delegation of representatives of Kyrgyzstan and Tajikistan visited Azerbaijan between March 26-30, 2012 and Afghani delegation visited Baku on 5 November, 2012. During the meetings the delegations had studied the experience earned by Azerbaijan in the management of revenues received from the extractive industries and the provision of transparency in this field.
On 14 December, 2012, Moore Stephens, the audit company and the EITI Secretariat arranged a training session with the organizational support of BP for local and foreign companies operating in the extractive industry of Azerbaijan. The main purpose of the training was to eliminate inconsistencies and errors detected during the reconciliation of EITI reports in Azerbaijan, and the attempt to increase the quality of EITI reporting by reducing the number of such errors in reports for the next accounting period. Such training, which was held in Azerbaijan for the first time, allowed its participants to communicate with both employees of other companies, and directly with the auditors. Thus, the training participants managed to clarify various aspects related to the preparation of the EITI reports, get timely answers to their

questions. Representatives of local and foreign companies participated in the training and they have increased their professionalism on preparation of EITI reports.
The meeting of the Multi-stakeholder Group (MSG) on implementation of EITI in Azerbaijan was held on June 4, 2012.
At the meeting Azerbaijan Government Committee on EITI announced the release of the Government's EITI report (2011) audited by Moore Stephens, the independent Aggregator. The release is accompanied by the Aggregator's opinion based on individual submissions of extractive industry companies participating in the EITI process in Azerbaijan.
At the meeting held on July 17, 2012, the EITI NGO Coalition presented its opinion with regard to the 16th report on the EITI (for 2011 reporting year) – Government’s report and the Independent Accountants' Opinion(IAO).
In 2012, another innovation was implemented in the EITI process in Azerbaijan and the EITI report was issued on the 31st of August in the form of an integrated document. This document includes a report on the aggregate revenues received by the Government of the Republic of Azerbaijan from the extractive industries, the Independent Accountants opinion and the opinion of the EITI Coalition of public organizations, which earlier were issued separately. On 29 June 2012 the first annual report on implementation of Extractive Industries Transparency Initiative in Azerbaijan for the year 2011 was published.
The report is published based on new rules on EITI adopted at the V Global EITI Conference in Paris in 2011.
On the 24th of September 2012, SOFAZ held a meeting with a youth delegation of the African Union. The African Union was represented by 16 countries in the meeting. During the meeting participants widely discussed the issues related to the situation in the oil and gas sector of Azerbaijani economy, national strategy, management of oil revenues, implementation mechanism and coordination structure of the EITI in Azerbaijan and associated problems and prospects, the significance of the EITI for our country and many other aspects. Young delegates received answers to their questions as to the EITI implementation and reporting in Azerbaijan.
The last meeting of the MSG for the year 2012 was held on 21 December 2012. 2013 EITI Work plan was approved, other issues on EITI implementation in Azerbaijan were discussed and appropriate decisions were made at the meeting.
5.3. International Forum of Sovereign Wealth Funds
The International Forum of Sovereign Wealth Funds (IFSWF or Forum) was established by the International Working Group of Sovereign Wealth Funds, meeting in Kuwait City on 5-6 April 2009. IFSWF is a voluntary group of Sovereign Wealth Funds (SWFs), which meets, exchanges views on issues of common interest and facilitates an understanding of the Santiago Principles and of SWF activities.
The State Oil Fund of the Republic of Azerbaijan is an active member of IFSWF and has systematically participated in its meetings. IFSWF held its first meeting in Baku organized by the government of Azerbaijan and SOFAZ on 8-9 October 2009.
IFSWF met for its fourth annual meeting in Mexico City, Mexico on September 5–7, 2012. Hosted by the Mexican Ministry of Finance and Public Credit, the Forum advanced on its commitments made in Beijing in May 2011 by discussing the IFSWF Members application of the Santiago Principles, risk management and the investment environment, commitment to an open investment environment, as well as making progress on its internal governance issues.
In accordance with Santiago Principle №24, SOFAZ published its first self-assessment report on its adherence to these Principles and the report is reviewed on an annual basis. The report is presented in the Appendix.
6. OUR VALUES: RESPECT, TEAMWORK, TRUST, TRANSPARENCY
Since its inception, SOFAZ has cooperated closely with a number of economic organizations, financial institutions and banks, both in Azerbaijan and worldwide. Its economic relations with all its counterpart organizations are based on the principles of respect, transparency, mutual trust and reliable partnership.
The great success the State Oil Fund has been able to achieve in a short period of time stems mainly from its personnel’s creative approach, hard work and, above all, eagerness to improve their qualifications and corporate culture. The Fund’s team consisting of highly qualified and competent young professionals values personal respect, responsibility and teamwork.
The State Oil Fund assigns particular importance to solidarity, mutual trust, understanding, professionalism, conscientiousness and teamwork. It is through teamwork and joint efforts that it has been able to gain success and a good reputation, not only in Azerbaijan but worldwide, as well. Complete and accurate information about all proceeds from the country’s sales of each barrel of oil and each cubic metre of gas under production sharing agreements is freely available on SOFAZ website thanks to the Transparency Initiative. By making information on its revenues and income publicly available, the State Oil Fund strengthens the trust of the country’s citizens and international organizations in the transparency of its operations.
As a highly specialized entity, the State Oil Fund operates in accordance with transparency principles and criteria. The Fund is highly praised at home and abroad as an example of credibility and transparency because of its transparent work with its staff, counterparties and external managers in line with best international practices. Azerbaijan’s complete compliance with the EITI principles and criteria and the Fund’s achievements in implementing the EITI brought SOFAZ the UN 2007 Public Service Award and the EITI 2009 Award.
Effective use of the country’s resources by applying state-of-the-art technologies, utilization of the resulting proceeds and revenues to improve the welfare of the nation and the country, fair distribution of oil revenues between current and future generations are the primary goals and objectives of the State Oil Fund. Mutual respect, trust, teamwork and transparent operations provide the necessary foundation and favourable conditions for achieving these goals.
7. 2012 STATE OIL FUND’S BUDGET EXECUTION
The State Oil Fund’s budget for 2012 was approved by Decree No.570 of the President of the Republic of Azerbaijan on 29 December, 2011.
In order to ensure timely implementation of arrangements related to socio-economic issues and settlement of refugees and internally displaced persons in 2012, changes were made to the budget of the State Oil Fund by Decree No.589 of the President of the Republic of Azerbaijan on 8 February, 2012.
Based on the changes, the expenditures related to financing of arrangements related to social conditions and settlement issues of refugees and internally displaced persons was increased from AZN 110 000.0 thousand to AZN 300 000.0 thousand and total budget expenditures of the Fund increased from AZN 10 561 304,0 thousand to AZN 10 751 304,0 thousand accordingly.
By Decree of the President of the Republic of Azerbaijan on 2 July, 2012 the budget of the State Oil Fund was amended again. One of the reasons for this amendment was expected additional revenues to Azerbaijani Government from Production Sharing Agreements due to high level of crude oil prices. Another reason was the need to specify the revenues of the budget of SOFAZ for 2012 related to the changes in the state budget of Republic of Azerbaijan for 2012. Based on these changes, net revenues generated from the sale of the Republic of Azerbaijan`s share of hydrocarbons was increased from AZN 10 365 432.0 thousand to AZN 13 388 644,0 thousand, at the same time revenues of AZN 1 572.6 thousand related to “Bonuses paid by investors when signing and fulfilling oil and gas contracts” was added and the total amount of revenues of SOFAZ was increased from AZN 10 697 030.6 thousand to AZN 13 721 815.2 thousand accordingly.
Revenues
In 2012 the State Oil Fund’s revenues amounted to AZN 13 674.1 million, which compared to the amount indicated in the budget (AZN 13 721.8 million) was implemented at 99.7% level. Foreign currency translation gain was 253.4 million. Differences in the implementation of each revenue item in 2012 SOFAZ budget is as follows:
Profit proceeds from sales of hydrocarbons.In 2012 the State Oil Fund received a total of AZN 13 117.4 million, or USD 16 695.8 million, from sales of the Republic of Azerbaijan’s share of hydrocarbons, which compared to the initially forecasted amount (13 388.6 million AZN) was implemented at 98 % level. The reason of lower level of implementation of this revenue item was production of crude oil at a level relatively lower than the volume planned in the budget of SOFAZ. On the other hand the revenues of USD 234.2 million from the sale of 2.1 million barrel crude oil on 30.10.2012 by SOCAR was expected to be included in the Oil Fund’s budget within 120 days (on 28.02.2013). Therefore, this amount will be allocated to 2013 budget.
Acreage fees paid by foreign investors for the use of contract areas for development of hydrocarbon resources. Acreage fees received by the Oil Fund in the year under review was AZN 3.0 million, or USD 3.8 million.
In 2012 SOCAR, Total E&P Azerbaijan B.V. and SOCAR OIL affiliate company paid USD 1.5 million in accordance with the implementation of 28.2 Article of Exploration, Development, and Production Sharing Agreement for the Absheron Offshore Block in the

Azerbaijani Sector of the Caspian Sea. Besides, SOCAR, BP (Azerbaijan) Exploration and SOCAR OIL affiliate company paid USD 2.1 million in accordance with the implementation of 28.2 Article of Exploration, Development, and Production Sharing Agreement for the Shafag-Asiman Offshore Block in the Azerbaijani Sector of the Caspian Sea. At the same time, SOCAR, Bahar Energy Operating Limited and SOCAR Oil affiliate company paid USD 0.2 million (Due to less coverage of production area in Bahar and Gum Deniz Fields compared to initial forecasts, Bahar Energy LTD paid to budget less than USD 0.62 million) in accordance with the implementation of 31.2 Article of Exploration, Rehabilitation, Development and Production Sharing Agreement for the Bahar and Gum Deniz Fields in the Azerbaijani Sector of the Caspian Sea. Due to these, revenues under this item were executed 90% against the budgeted amount (AZN 3.3 million).
Revenue from transportation of oil and gas through the territory of Azerbaijan. Revenues from transportation of oil and gas through the territory of Azerbaijan (transit fees) amounted to AZN 7.9 million or USD 10.0 million in 2012. Transit fee revenues were fulfilled at 97% level of the planned AZN 8.1 million. A 3% gap for this revenue item is a result of lower crude oil production and a decrease in oil transportation through Baku-Supsa pipeline.
Bonuses paid by investors when signing and fulfilling oil and gas contracts. In 2012 revenues from this source equaled to AZN 1.6 million or USD 2.0 million. The payment due in 2011 (to be paid within 30 days from the signature date) according to the Production Sharing Agreement between SOCAR, UGE-LANCER PTE LTD and SOCAR OIL affiliate company for Exploration, Rehabilitation, and Development of Balakhani-Sabunchu-Ramana and Kurdakhani Oil Field Blocks, was transferred to SOFAZ in 2012.
Asset management revenues of SOFAZ. Revenues generated through asset management equaled to AZN 544 million (693.5 million USD) which was over-fulfilled by 70.4 %. In 2012 the SOFAZ’s investment portfolio yielded 2.2 % rate of return.
Other revenues and proceeds. In 2012, assets (obsolete or unused metal scrap, pipes) received from investors (international oil companies) under oil and gas contracts were sold, bringing SOFAZ AZN 0.3 million. This revenue item was executed at 28% level of the planned AZN 0.9 million. (The execution level of the budget is presented in Table 7.1.)
Table 1. Revenues of the State Oil Fund of Azerbaijan in 2012№
Revenue ItemsAmount of the Revenues
(AZN mln) Execution Percentagebudgeted actual
1.
Net revenues generated from the sale of the share of the Republic of Azerbaijan in hydrocarbons (excluding expenditures on transportation of hydrocarbons, customs clearance and banking costs, marketing, insurance and independent surveyor fees, as well as shareholder revenues of State Oil Company of the Republic of Azerbaijan from the investments in the projects where it is an investor, participant or a contracting party)
13388 ,6 13117 ,4 98,0
2.Acreage fees paid by foreign investors for the use of contract areas for development of hydrocarbon resources
3 ,3 3 ,0 90,0

3. Revenue from transporting oil and gas through the territory of the Republic of Azerbaijan 8 ,1 7 ,9 97,0
4.
Bonuses paid to the State oil Company of the Republic of Azerbaijan or other relevant state bodies by investors when signing and fulfilling oil and gas contracts
1 ,6 1 ,6 100,0
5. Asset management revenues of the State Oil Fund 319,2 544,0 170,4
6. Other revenues and proceeds 0,9 0,3 28,0
Total revenues 13721,8 13674,1 99,7Extra-budgetary revenues 253,4
Expenditures
During the reporting year, the State Oil Fund’s budget expenditures amounted to AZN 10 573.6 million which made up 98.4% of the planned expenditures (AZN 10 751.3) million.
The improvement of the social and economic conditions of refugees and internally displaced persons. In 2012 the State Oil Fund allocated AZN 300 million for this project. This expenditure item was fulfilled by 100% as planned.
Transfers to the state budget of the Republic of Azerbaijan in 2012. Budget transfers of AZN 9 905.0 million constituted significant portion (93.7%) of the State Oil Fund’s budget expenditures in 2012. This expenditure item was fulfilled by 100.0% as planned.
Samur-Absheron irrigation system reconstruction project. In 2012 the State Oil Fund allocated AZN 200 million to finance this project, fulfilling this expenditure item by 100%..
New Baku-Tbilisi-Kars railway construction project. In 2012 the State Oil Fund allocated AZN 119.0 million to finance the new Baku-Tbilisi-Kars railway construction project and the Oil Fund fulfilled this expenditures item by 47.1% of the planned AZN 252.5 million.
Financing the State Program on the Education of Azerbaijani Youth Abroad.In 2012 the State Oil Fund allocated AZN 20 million to finance the State Program on the Education of Azerbaijani Youth Abroad in the years 2007–2015 as adopted by decree of the President of the Republic of Azerbaijan No.2090 on 16 April 2007.
Administrative expenses of the State Oil Fund. Administrative expenses of SOFAZ totaled to AZN 29.6 million which amounted to 40.1% of its 2012 approved budget expenditure item (AZN 73.8 million). Under-fulfillment of this expenditure item can be explained by lower than the planned costs on the construction of the Fund’s new administrative building and management fees paid to external asset managers during the year.

Table 7.2. Expenditures of SOFAZ in 2012
№
EXPENDITURE ITEMS
AMOUNT OF EXPENDITURES
(AZN MLN) EXECUTION PERCENTAGEBUDGET
ED ACTUAL
1.The improvement of the social and economic conditions of refugees and internally-displaced persons 300 .0 300 .0 100.0
2. Transfers to the state budget of the Republic of Azerbaijan in 2012 9905 .0 9905 .0 100.0
3. Samur-Absheron irrigation system reconstruction project 200.0 200.0 100.0
4. New Baku-Tbilisi-Kars railway construction project 252.5 119.0 47.1
5.Financing the State Program on the Education of Azerbaijani Youth Abroad in the years 2007-2015
20.0 20.0 100.0
6. Administrative expenses of the State Oil Fund 73.8 29.6 40.1
Total 10 751. 3 10 573.6 98.4


![[XLS] · Web viewIncome Statement Summary Non-operating income Total Airport Revenues Operating aeronautical revenues Ground handling revenues Operating non-aeronautical revenues](https://static.fdocuments.in/doc/165x107/5acac1f37f8b9a7d548e1826/xls-viewincome-statement-summary-non-operating-income-total-airport-revenues-operating.jpg)