Cytogenetic abnormalities in patients with hematological ...
The Genomic Landscape of Balanced Cytogenetic Abnormalities Associated with Human Congenital Anomalies
Claire Redin1,2,3, Harrison Brand1,2,3, Ryan L. Collins1,2,3,4, Tammy Kammin5, Elyse Mitchell6, Jennelle C. Hodge6,7,8, Carrie Hanscom1,2,3, Vamsee Pillalamarri1,2,3, Catarina M. Seabra1,2,3,9, Mary-Alice Abbott10, Omar A. Abdul-Rahman11, Erika Aberg12, Rhett Adley1, Sofia L. Alcaraz-Estrada13, Fowzan S. Alkuraya14, Yu An1,15, Mary-Anne Anderson16, Caroline Antolik1,2,3, Kwame Anyane-Yeboa17, Joan F. Atkin18,19, Tina Bartell20, Jonathan A. Bernstein21, Elizabeth Beyer22, Ian Blumenthal1, Ernie M.H.F. Bongers23, Eva H. Brilstra24, Chester W. Brown25,26, Hennie T. Brüggenwirth27, Bert Callewaert28, Colby Chiang1, Ken Corning29, Helen Cox30, Edwin Cuppen24, Benjamin B. Currall1,5,31, Tom Cushing32, Dezso David33, Matthew A. Deardorff34,35, Annelies Dheedene28, Marc D’Hooghe36, Bert B.A. de Vries23, Dawn L. Earl37, Heather L. Ferguson5, Heather Fisher38, David R. FitzPatrick39, Pamela Gerrol5, Daniela Giachino40, Joseph T. Glessner1,2,3, Troy Gliem6, Margo Grady41, Brett H. Graham25,26, Cristin Griffis22, Karen W. Gripp42, Andrea L. Gropman43, Andrea Hanson-Kahn44, David J. Harris45,46, Mark A. Hayden5, Rosamund Hill47, Ron Hochstenbach24, Jodi D. Hoffman48, Robert J. Hopkin49,50, Monika W. Hubshman51,52,53, A. Micheil Innes54, Mira Irons55, Melita Irving56,57, Jessie C. Jacobsen58, Sandra Janssens28, Tamison Jewett59, John P. Johnson60, Marjolijn C. Jongmans23, Stephen G. Kahler61, David A. Koolen23, Jerome Korzelius24, Peter M. Kroisel62, Yves Lacassie63, William Lawless1, Emmanuelle Lemyre64, Kathleen Leppig65,66, Alex V. Levin67, Haibo Li68, Hong Li68, Eric C. Liao69,70,71, Cynthia Lim61,72, Edward J. Lose73, Diane Lucente1, Michael J. Macera74, Poornima Manavalan1, Giorgia Mandrile40, Carlo L. Marcelis23, Lauren Margolin75, Tamara Mason75, Diane Masser-Frye76, Michael W. McClellan77, Cinthya J. Zepeda Mendoza5,78, Björn Menten28, Sjors Middelkamp24, Liya R. Mikami79,80, Emily Moe22, Shehla Mohammed56, Tarja Mononen81, Megan E. Mortenson59,82, Graciela Moya83, Aggie W. Nieuwint84, Zehra Ordulu5,78, Sandhya Parkash12,85, Susan P. Pauker78,86, Shahrin Pereira5, Danielle Perrin75, Katy Phelan87, Raul E. Piña Aguilar13,88, Pino J. Poddighe84, Giulia Pregno40, Salmo Raskin79, Linda Reis89, William Rhead90, Debra Rita91, Ivo Renkens24, Filip Roelens92, Jayla Ruliera16, Patrick Rump93, Samantha L.P. Schilit30,78, Ranad Shaheen14, Rebecca Sparkes54, Erica Spiegel17, Blair Stevens94, Matthew R. Stone1,2,3, Julia Tagoe95, Joseph V. Thakuria78,96, Bregje W. van Bon23, Jiddeke van de Kamp84, Ineke van Der Burgt23, Ton van Essen93, Conny M. van Ravenswaaij-Arts93, Markus J. van Roosmalen24, Sarah Vergult28, Catharina M.L. Volker-Touw24, Dorothy P. Warburton97, Matthew J. Waterman1,98, Susan Wiley99, Anna Wilson1, Maria de la Concepcion A. Yerena-de Vega100, Roberto T. Zori101, Brynn Levy102, Han G. Brunner23,103, Nicole de Leeuw23, Wigard P. Kloosterman24, Erik C. Thorland6, Cynthia C. Morton3,5,78,104,105, James F. Gusella1,3,31, Michael E. Talkowski1,2,3,*
1Molecular Neurogenetics Unit, Center for Human Genetic Research, Department of Neurology, Massachusetts General Hospital, Boston, MA 02114, USA;2Psychiatric and Neurodevelopmental Genetics Unit, Center for Human Genetic Research, Department of Neurology, Massachusetts General Hospital and Harvard Medical School, Boston, MA 02114, USA;3Program in Medical and Population Genetics, Broad Institute of MIT and Harvard, Cambridge, MA 02141, USA; 4Program in Bioinformatics and Integrative Genomics, Division of Medical Sciences, Harvard Medical School, Boston, MA 02115, USA;5Department of Obstetrics and Gynecology, Brigham and Women's Hospital, Boston, MA 02115, USA; 6Department of Laboratory Medicine and Pathology, Mayo Clinic, Rochester, MN 55902, USA;7Department of Pathology and Laboratory Medicine, Cedars-Sinai Medical Center, Los Angeles, CA 90048, USA;8Department of Pediatrics, University of California Los Angeles, Los Angeles, CA 90095, USA;9GABBA Program, University of Porto, Porto, Portugal;10Medical Genetics, Baystate Medical Center, Springfield, MA 01199, USA;
1

11Department of Pediatrics, University of Mississippi Medical Center, Jackson, MS 39216, USA;12Maritime Medical Genetics Service, IWK Health Centre, Halifax, Nova Scotia, Canada;13Medical Genomics Division, Centro Medico Nacional 20 de Noviembre, ISSSTE, Mexico City, Mexico;14Department of Genetics, King Faisal Specialist Hospital and Research Center, MBC-03 PO BOX 3354, Riyadh 11211, Saudi Arabia;15The Institutes of Biomedical Sciences (IBS) of Shanghai Medical School and MOE Key Laboratory of Contemporary Anthropology, Fudan University, Shanghai, China;16Center for Human Genetic Research DNA and Tissue Culture Resource, Boston, MA 02114, USA;17Division of Clinical Genetics, Columbia University Medical Center, New York, NY 10032, USA; 18Department of Pediatrics, The Ohio State University College of Medicine, Columbus, OH 43210, USA; 19Division of Molecular and Human Genetics, Nationwide Children's Hospital, Columbus, OH 43205, USA20Kaiser Permanente, Genetics Department, Sacramento, CA 95815, USA;21Department of Pediatrics, Stanford University School of Medicine, Stanford, CA 94305, USA;22Children's Hospital of Wisconsin and Department of Pediatrics, Medical College of Wisconsin, Milwaukee, WI 53226, USA;23Department of Human Genetics, Radboud Institute for Molecular Life Sciences and Donders Institute for Brain, Cognition and Behavior, Radboud University Medical Center, Nijmegen 6500 HB, the Netherlands;24Department of Genetics, Division of Biomedical Genetics, Center for Molecular Medicine, University Medical Center Utrecht, 3508 AB Utrecht, The Netherlands;25Department of Molecular and Human Genetics, Baylor College of Medicine, Houston, TX 77030, USA;26Department of Genetics, Texas Children's Hospital, Houston, TX 77054, USA;27Department of Clinical Genetics, Erasmus University Medical Centre, PO BOX 2040, 3000 CA Rotterdam, The Netherlands;28Center for Medical Genetics, Ghent University, De Pintelaan 185, 9000 Ghent, Belgium;29Greenwood Genetic Center, Columbia, SC, 29201, USA;30West Midlands Regional Clinical Genetics Unit, Birmingham Women's Hospital, Edgbaston, Birmingham B15 2TG, England, UK;31Department of Genetics, Harvard Medical School, Boston, MA 02115, USA;32University of New Mexico, School of Medicine, Department of Pediatrics, Division of Pediatric Genetics, Albuquerque, NM 87131, USA;33Department of Human Genetics, National Health Institute Doutor Ricardo Jorge, Lisbon, Portugal;34Department of Pediatrics, Perelman School of Medicine at the University of Pennsylvania, Philadelphia, PA 19104, USA;35Division of Human Genetics, Children's Hospital of Philadelphia, Philadelphia, PA 19104, USA;36Department of Neurology and Child Neurology, Algemeen Ziekenhuis Sint-Jan, Brugge, Belgium;37Seattle Children’s, Seattle, Washington, WA 98105, USA;38Mount Sinai West Hospital, New York, NY 10019, USA;39Medical Research Council Human Genetics Unit, Institute of Genetic and Molecular Medicine, University of Edinburgh, Western General Hospital, Edinburgh EH4 2XU, UK;40Medical Genetics Unit, Department of Clinical and Biological Sciences, University of Torino, Italy;41UW Cancer Center at ProHealth Care, Waukesha, Wisconsin, WI 53188, USA;42Sidney Kimmel Medical School at Thomas Jefferson University, Philadelphia, PA 19107, USA;43Children's National Medical Center, Washington, DC 20010, USA;44Departments of Pediatrics and Genetics, Stanford University School of Medicine, Stanford, CA 94305, USA;45Division of Genetics, Boston Children's Hospital, Boston, MA 02115, USA;46Department of Pediatrics, Harvard Medical School, Boston, MA 02115, USA;47Department of Neurology, Auckland City Hospital, Auckland, New Zealand;48Department of Pediatrics, Division of Genetics, Boston Medical Center, MA 02118, USA;49Cincinnati Children's Hospital Medical Center, Division of Human Genetics, Cincinnati, OH 45229, USA;50Department of Pediatrics, University of Cincinnati College Medicine, Cincinnati, OH 45267, USA;51Pediatric Genetics Unit, Schneider Children’s Medical Center of Israel, Petach Tikva 49202, Israel;52Raphael Recanati Genetic Institute, Rabin Medical Center, Petach Tikva 49100, Israel;53Sackler Faculty of Medicine, Tel Aviv University, Tel Aviv 69978, Israel;54Department of Medical Genetics, Cumming School of Medicine, University of Calgary, Calgary, Alberta, Canada;55Academic Affairs, American Board of Medical Specialties, Chicago, IL 60654, USA;56Department of Clinical Genetics, Guy's and St Thomas' NHS Foundation Trust, London, UK;57Division of Medical and Molecular Genetics, King's College London, UK;
2
58Centre for Brain Research and School of Biological Sciences, The University of Auckland, Auckland, New Zealand;59Department of Pediatrics, Wake Forest School of Medicine, Winston Salem, NC 27157, USA;60Shodair Children's Hospital, Molecular Genetics Department, Helena, MT 59601, USA;61Division of Genetics and Metabolism, Arkansas Children's Hospital, Little Rock, AR 72202, USA;62Institute of Human Genetics, Medical University of Graz, Graz, Austria;63Department of Pediatrics at Louisiana State University Health Sciences Center (LSUHSC) and Children's Hospital, New Orleans, LA 70118, USA;64Department of Pediatrics, University of Montreal, CHU Sainte-Justine, Montréal QC, Canada;65Division of Medical Genetics, Department of Medicine, University of Washington, Seattle, WA 98195, USA; 66Clinical Genetics, Group Health Cooperative, Seattle, WA 98112, USA;67Wills Eye Hospital, Thomas Jefferson University, Philadelphia, PA 19107, USA;68Center for Reproduction and Genetics, The affiliated Suzhou Hospital of Nanjing Medical University, Suzhou, Jiangsu, China; 69Center for Regenerative Medicine, Massachusetts General Hospital and Harvard Medical School, Boston, MA 02114, USA;70Division of Plastic and Reconstructive Surgery, Massachusetts General Hospital, Boston, MA 02114, USA;71Harvard Stem Cell Institute, Cambridge, MA 02138, USA;72Virginia G. Piper Cancer Center at HonorHealth, Scottsdale, AZ 85258, USA;73Department of Genetics, University of Alabama at Birmingham (UAB), Birmingham, AL 35233, USA;74New York-Presbyterian Hospital, Columbia University Medical Center, New York, NY 10032,USA;75Program in Medical and Population Genetics and Genomics Platform, Broad Institute of Harvard and MIT, Cambridge, MA 02141, USA;76Department of Genetics, Rady Children's Hospital San Diego, CA 92123, USA;77Department of Obstetrics and Gynecology, Madigan Army Medical Center, Tacoma, WA 98431, USA;78Harvard Medical School, Boston, MA 02115, USA;79Group for Advanced Molecular Investigation, Graduate Program in Health Sciences, School of Medicine, Pontifícia Universidade Católica do Paraná, Curitiba, Paraná, Brazil;80Centro Universitário Autônomo do Brasil (Unibrasil), Curitiba, Paraná,Brazil;81Department of Clinical Genetics, Kuopio University Hospital, Finland;82Novant Health Derrick L. Davis Cancer Center, Winston Salem, NC 27103, USA;83GENOS Laboratory, Buenos Aires, Argentina;84Department of Clinical Genetics, VU University Medical Center, De Boelelaan 1117, Amsterdam 1081 HV, The Netherlands;85Department of Pediatrics, Maritime Medical Genetics Service, IWK Health Centre, Dalhousie University, Halifax, Nova Scotia, Canada;86Medical Genetics, Harvard Vanguard Medical Associates, Watertown, MA 02472, USA;87Hayward Genetics Program, Department of Pediatrics, Tulane University School of Medicine, New Orleans, LA 70112, USA;88School of Medicine, Medical Sciences and Nutrition, University of Aberdeen, Aberdeen, United Kingdom;89Department of Pediatrics and Children’s Research Institute, Medical College of Wisconsin, Milwaukee, WI 53226, USA;90Children's Hospital of Wisconsin and Departments of Pediatrics and Pathology, Medical College of Wisconsin, Milwaukee, WI 53226, USA;91Midwest Diagnostic Pathology, Aurora Clinical Labs, Rosemont, IL 60018, USA;92Algemeen Ziekenhuis Delta, Roeselare, Belgium;93University of Groningen, University Medical Center Groningen, Department of Genetics, PO Box 30.001, 9700RB Groningen, The Netherlands;94McGovern Medical School at The University of Texas Health Science Center at Houston, TX 77030, USA;95Genetic Services, Alberta Health Services, Alberta T1J 4L5, Canada;96Division of Medical Genetics, Massachusetts General Hospital, Boston, MA 02114, USA;97Department of Clinical Genetics and Development, Columbia University Medical Center, New York, NY 10032, USA;98Eastern Nazarene College, Department of Biology, Quincy, MA 02170, USA;99Cincinnati Children’s Hospital Medical Center, University of Cincinnati, OH 45229, USA;100Laboratory of Genetics, Centro Medico Nacional 20 de Noviembre, ISSSTE, Mexico City, Mexico;101Division of Pediatric Genetics & Metabolism, University of Florida, Gainesville, FL 32610, USA;102Department of Pathology, Columbia University, New York, NY10032, USA;103Department of Clinical Genetics, Maastricht University Medical Centre, Universiteitssingel 50, 6229 ER Maastricht, The Netherlands;
3

104Department of Pathology, Brigham and Women's Hospital, Boston, MA 02115, USA;105Division of Evolution and Genomic Sciences, School of Biological Sciences, University of Manchester, Manchester Academic Health Science Center, Manchester, UK;*Correspondence should be addressed to M.E.T. ([email protected])
4

ABSTRACT
Despite their clinical significance, characterization of balanced chromosomal abnormalities (BCAs) has
largely been restricted to cytogenetic resolution. We explored the landscape of BCAs at nucleotide
resolution in 273 subjects with a spectrum of congenital anomalies. Whole-genome sequencing revised
93% of karyotypes and revealed complexity that was cryptic to karyotyping in 21% of BCAs,
highlighting the limitations of conventional cytogenetic approaches. At least 33.9% of BCAs resulted in
gene disruption that likely contributed to the developmental phenotype, 5.2% were associated with
pathogenic genomic imbalances, and 7.3% disrupted topologically associated domains (TADs)
encompassing known syndromic loci. Remarkably, BCA breakpoints in eight subjects altered a single
TAD encompassing MEF2C, a known driver of 5q14.3 microdeletion syndrome, resulting in decreased
MEF2C expression. This study proposes that sequence-level resolution dramatically improves prediction
of clinical outcomes for balanced rearrangements, and provides insight into novel pathogenic
mechanisms such as long-range regulation due to changes in chromosome topology.
Keywords: Cytogenetics, structural variation, balanced chromosomal abnormality, congenital anomaly,
intellectual disability, autism, translocation, inversion, chromothripsis, topologically associated domain
(TAD), Hi-C, MEF2C
5
1
23

Balanced chromosomal abnormalities (BCA) are a class of structural variation involving rearrangement
of chromosome structure that alters the orientation or localization of a genomic segment without a
concomitant large gain or loss of DNA. This class of variation includes inversions, translocations,
excisions/insertions, and more complex rearrangements consisting of combinations of such events.
Cytogenetic studies of unselected newborns and control adult males estimate a prevalence of 0.2-0.5%
for BCAs in the general population1-3. By contrast, an approximate five-fold increase in the prevalence
of BCAs detected by karyotyping has been reported among subjects with neurodevelopmental disorders,
particularly intellectual disability (1.5%)4 and autism spectrum disorder (ASD; 1.3%)5, suggesting that
BCAs may represent highly penetrant mutations in a meaningful fraction of subjects with associated
congenital anomalies or neurodevelopmental disorders.
Delineating the breakpoints of BCAs, and the genomic regions that they disrupt, has long been a fertile
area of novel gene discovery and has greatly contributed to the annotation of the morbid map of the
human genome6-8. Despite their significance in human disease, the clinical detection of this unique class
of rearrangements still relies upon conventional cytogenetic methods such as karyotyping that are
limited to microscopic resolution (~3-10 Mb)9. The absence of gross genomic imbalances renders BCAs
invisible to higher resolution techniques that currently serve as first-tier diagnostic screens for many
developmental anomalies of unknown etiology: chromosomal microarray (CMA), which can detect
microscopic and sub-microscopic copy number variants (CNVs), or whole-exome sequencing (WES),
which surveys single nucleotide variants within coding regions. Without access to precise breakpoint
localization, clinical interpretation of de novo BCAs has been limited to estimates of an untoward
outcome from population cytogenetic studies based solely on the presence of a rearrangement (6.1% of
de novo reciprocal translocations, 9.4% for de novo inversions)10. We have recently shown that
innovations in genomic technologies can efficiently reveal BCA breakpoints at nucleotide resolution
with a cost and timeframe comparable to clinical CMA or karyotyping; however, only a limited number
of BCAs have been evaluated to date7,10-15.
In this study, we explored several fundamental but previously intractable questions regarding de novo
BCAs associated with human developmental anomalies, such as the origins of their formation, the
genomic properties of the sequences that they disrupt, and the mechanisms by which they can act as
dominant pathogenic mutations. We evaluated 273 subjects ascertained based upon the presence of a
BCA discovered by karyotyping in a proband that presented with a developmental anomaly. We
6
4
5
6
7
8
9
10
11
12
13
14
15
16
17
18
19
20
21
22
23
24
25
26
27
28
29
30
31
32
33
34
35

localized these BCA breakpoints and created a framework to interpret their significance based on
convergent genomic datasets, including CNV and WES data in tens of thousands of individuals. We also
integrated data from high-resolution maps of chromosomal compartmentalization in the nucleus to
predict long-range regulatory effects, then confirm those predictions with functional validation16,17. Our
findings indicate that formation of BCAs involves a variety of mechanisms, that the end-result often
reflects substantial complexity invisible to cytogenetic assessment, that BCAs directly disrupt genes
likely to contribute to early developmental abnormalities in at least one-third of subjects, and that BCAs
can cause long-range regulatory changes due to alterations to the chromosome structure.
7
36
37
38
39
40
41
42
43

RESULTS
Sequencing BCAs reveals cryptic complexity
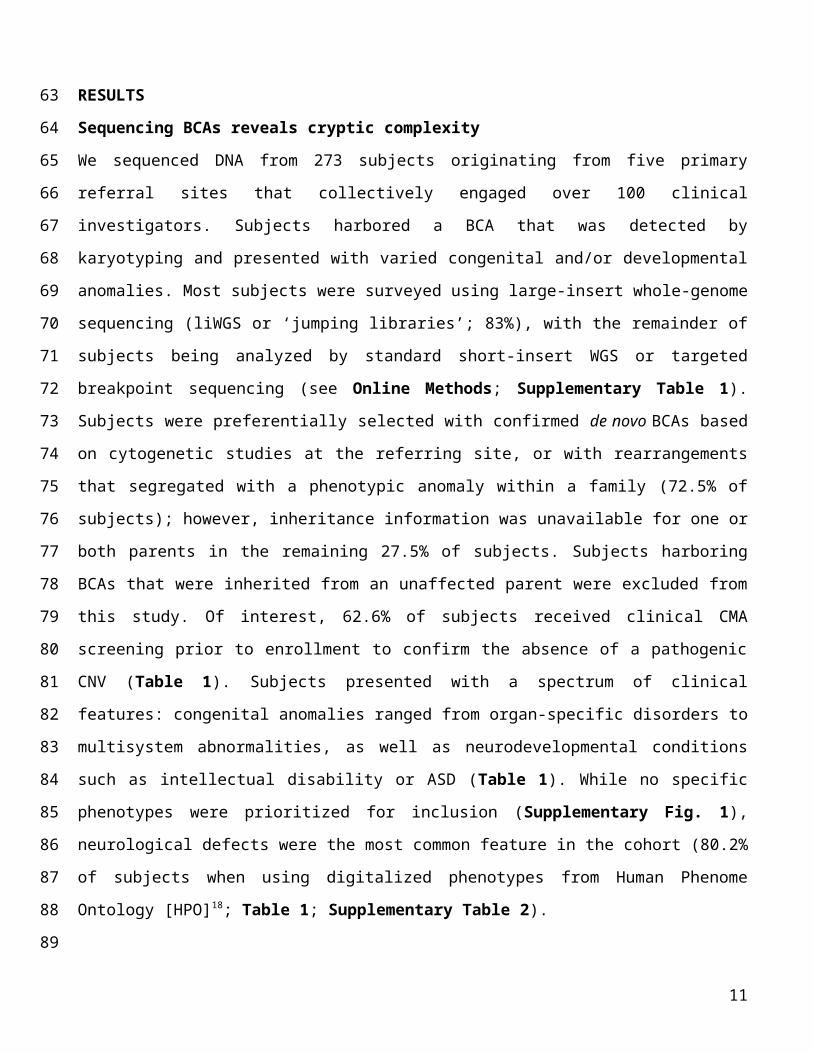
We sequenced DNA from 273 subjects originating from five primary referral sites that collectively
engaged over 100 clinical investigators. Subjects harbored a BCA that was detected by karyotyping and
presented with varied congenital and/or developmental anomalies. Most subjects were surveyed using
large-insert whole-genome sequencing (liWGS or ‘jumping libraries’; 83%), with the remainder of
subjects being analyzed by standard short-insert WGS or targeted breakpoint sequencing (see Online
Methods; Supplementary Table 1). Subjects were preferentially selected with confirmed de novo
BCAs based on cytogenetic studies at the referring site, or with rearrangements that segregated with a
phenotypic anomaly within a family (72.5% of subjects); however, inheritance information was
unavailable for one or both parents in the remaining 27.5% of subjects. Subjects harboring BCAs that
were inherited from an unaffected parent were excluded from this study. Of interest, 62.6% of subjects
received clinical CMA screening prior to enrollment to confirm the absence of a pathogenic CNV
(Table 1). Subjects presented with a spectrum of clinical features: congenital anomalies ranged from
organ-specific disorders to multisystem abnormalities, as well as neurodevelopmental conditions such as
intellectual disability or ASD (Table 1). While no specific phenotypes were prioritized for inclusion
(Supplementary Fig. 1), neurological defects were the most common feature in the cohort (80.2% of
subjects when using digitalized phenotypes from Human Phenome Ontology [HPO]18; Table 1;
Supplementary Table 2).
Breakpoints were identified in 248 of the 273 subjects (90.8%); all subsequent analyses were restricted
to these 248 subjects. This success rate was consistent with expectations, as simulation of one million
breakpoints in the genome suggested that 7.6% of breakpoints were localized within genomic segments
that cannot be confidently mapped by short-read sequencing (Supplementary Fig. 2). Sequencing
identified 876 breakpoints genome-wide (Fig. 1a) and revised the breakpoint localization by at least one
sub-band in 93% of subjects when compared to the karyotype interpretation (breakpoint positions
provided in Supplementary Table 3). Across all rearrangements, 26% (n=65) of BCAs were found to
be complex (i.e., involved three or more breakpoints; Supplementary Fig. 3-65), including 5% (n=13)
that were consistent with the phenomena of chromothripsis or chromoplexy (complex reorganization of
the chromosomes involving extensive shattering and random ligation of fragments from one or more
chromosomes) that was initially described in cancer genomes and later defined in the human germline19-
23. The most complex BCA involved 57 breakpoints (Supplementary Fig. 59). When analyses were
8
44
45
46
47
48
49
50
51
52
53
54
55
56
57
58
59
60
61
62
63
64
65
66
67
68
69
70
71
72
73
74
75
restricted to the 230 subjects for which the karyotype suggested a simple chromosomal exchange, 48
(21%) were determined to harbor complexity that was cryptic to the karyotype, emphasizing the insights
that are gained from nucleotide resolution. Across all BCAs, 80.7% resolved to less than ten kilobases of
total genomic imbalance, although several cases harbored large cryptic imbalances (mostly deletions) of
varied impact (Fig. 1b; Supplementary Table 4). Importantly, only 12.2% had imbalances of >100 kb
in this study (9.3% greater than 1 Mb), representing a significantly lower fraction than previous
cytogenetic estimates24. Genomic imbalances associated with BCAs were larger on average among
subjects without CMA pre-screening, with 15.5% harboring imbalances >1 Mb versus 5.9% in subjects
pre-screened by CMA (Fig. 1b; Supplementary Table 4). The total genomic imbalance generally
increased with the number of breakpoints, though there were chromothripsis and chromoplexy events
that were essentially balanced (e.g., subject NIJ19 involved 13 junctions across five chromosomes that
resolved to a final genomic imbalance of only 631 bases).
BCA formation is mediated by multiple molecular mechanisms
Extensive mechanistic studies have been performed on breakpoints of large CNV datasets; however, the
limited scale and resolution of BCA studies have precluded similar analyses for balanced
rearrangements. Using precise junction sequences from 662 breakpoints, we found that nearly half
displayed signatures of blunt-end ligation (45%), presumably driven by non-homologous end joining
(NHEJ) (Fig. 1c). A substantial fraction (29%) involved microhomology of 2-15 bp at the breakpoint
junction, indicating that template-switching coupled to DNA-replication mechanisms such as
microhomology-mediated break-induced replication (MMBIR) contribute to a substantial fraction of
BCAs25. A comparable fraction (25%) of junctions harbored micro-insertions of several basepairs,
consistent with NHEJ or fork stalling and template switching (FoSTeS) mechanisms (Fig. 1c). Only nine
junctions (1%) contained long stretches of homologous sequences (>100 bp) that would be consistent
with homology-mediated repair. This is certainly an underestimate given the limitations of short-read
sequencing to capture rearrangements localized within highly homologous sequences such as segmental
duplications or microsatellites. BCA breakpoint signatures from this study were also compared to 8,943
deletion breakpoints identified in 1,092 samples from the 1000 Genomes Project26, revealing that BCA
breakpoints were enriched for blunt-end signatures while depleted for microhomology and large
homology sequences compared to deletion breakpoints (Supplementary Fig. 66).
9
76
77
78
79
80
81
82
83
84
85
86
87
88
89
90
91
92
93
94
95
96
97
98
99
100
101
102
103
104
105
106

Comparison of the observed breakpoints to 100,000 sets of simulated breakpoints that retained the
properties of the observed dataset (see Online Methods) established nominal enrichment for repeat
elements (P=0.021) and fragile sites (P=0.043), while no significant enrichment for the other genomic
features tested (Supplementary Fig. 67). Incorporating Hi-C interaction data to explore the association
between nuclear organization of the chromosomes and BCA formation revealed that pairs of loci
comprising a BCA breakpoint did not stem from regions with significantly higher contact patterns in the
nucleus17; however, these pairs displayed genome-wide interaction patterns that were more correlated
than random pairings (P=0.046; Supplementary Note and Supplementary Fig. 68). These results
suggest that DNA fragments involved in BCA formation are more likely to be co-localized in the same
or neighboring sub-compartments prior to chromosomal reassembly, though at the sample sizes
available they did not necessarily harbor increased direct interactions.
BCA breakpoints associated with congenital anomalies are enriched for functionally relevant loci
While protein-coding sequences represent less than 2% of the human genome, the total genic space in
which a structural variation can disrupt a transcript is considerable as the cumulative coverage of
transcribed regions is over 60% from recent annotations27. Consistent with this expectation, 67%
(589/876) of breakpoints in this study disrupted a gene, and at least one gene was truncated in most
BCAs (75%, 186/248), which did not deviate from random expectations (observed n=408 genes,
expected n=392±20, P=0.220; Supplementary Fig. 69). The properties of the disrupted genes, however,
deviated significantly from randomly breakpoints for several key features, suggesting that the
pathogenic impact of BCAs in this cohort is not a consequence of their likelihood to disrupt genes but
rather a reflection of the gene(s) that they alter (disrupted genes provided in Supplementary Table 5).
We observed significant enrichment for disruption of genes highly intolerant to truncating mutations, as
defined by two independent groups (P=0.027 for Petrovski et al., P=0.0009 for Samocha et al.; Fig.
2a)28,29, embryonically expressed genes (P=0.001)30, and genes previously associated with autosomal
dominant disorders (P=0.002)31, whereas no enrichment was observed for genes associated with
autosomal recessive disorders (P=0.294; Fig. 2a)31. The strongest enrichment at breakpoints was
detected for genes previously associated with developmental disorders (≥2 de novo LoF mutations
[dnLoF]) as amalgamated from independent datasets (P=2x10⁻⁵; Supplementary Table 6). Significant
enrichment was also observed at breakpoints for FMRP-target genes and chromatin remodeling
genes32,33, consistent with the association of genes implicated in neurodevelopmental disorders (Fig.
10
107
108
109
110
111
112
113
114
115
116
117
118
119
120
121
122
123
124
125
126
127
128
129
130
131
132
133
134
135
136
137
138
2b)7,30,34-37, but not CHD8 target genes38,39. When further incorporating expression data of the developing
brain from BrainSpan40, truncated genes showed higher expression patterns during early developmental
stages than randomly simulated datasets (Supplementary Fig. 70). By contrast, there was no significant
enrichment of genes associated with schizophrenia41,42, or gene-sets associated with complex disorders
that were considered as negative controls such as type-II diabetes, cancer, or height. Indeed, subgroup
analyses revealed that most enrichment signals were driven by the predominance of neurological
abnormalities among the subjects (Supplementary Fig. 71).
BCAs predominantly contribute to developmental anomalies by direct gene truncation
We next asked the fundamental question: “How often does a BCA represent a likely pathogenic
mutation that contributes to the subject’s abnormal developmental phenotype?” We sought to interpret
the clinical significance of each BCA with reference to the phenotype reported in the proband and the
genomic region(s) altered. We built an interpretation framework using categories comparable to those
established by ClinVar and the Deciphering Developmental Disorders consortium (DDD)43; however,
we restricted interpretation of potential clinical relevance to Pathogenic or Likely Pathogenic, as
detailed below and in Supplementary Table 7. All other variants were interpreted as Variant of
Unknown Significance (VUS), as we lacked sufficient data to interpret variants as Benign or Likely
Benign (Supplementary Table 8).
Pathogenic: We compared loci disrupted by BCAs to genes that had been robustly associated with
dominant developmental disorders (≥3 reported cases with dnLoF in OMIM, DDD, and amalgamated
large-scale sequencing studies in neurodevelopmental disorders; see Supplementary Note and
Supplementary Table 6). In total, 66 subjects (26.6%) harbored Pathogenic BCAs that disrupted these
previously defined developmental loci either through direct gene disruption or genomic imbalance (Fig.
2c; Table 2; Supplementary Table 9). In the majority of these subjects (53/66), the rearrangement
truncated a high confidence syndromic locus. These included known drivers of recurrent microdeletion
syndromes (e.g., SATB2, MBD5, EHMT1, NFIA, ZBTB20)44-48, loci associated with imprinting disorders
(SNURF-SNRPN), and genes well-established as highly penetrant loci in developmental disorders (e.g.,
CHD7, CHD8, CDKL5, CUL3, DYRK1A, GRIN2B), as well as more recently implicated genes such as
AHDC1, CTNND2 and WAC (Fig. 2c; Table 2; Supplementary Table 9). Several genes were disrupted
in two or more subjects, further confirming their role in developmental anomalies (Table 2).
Importantly, ten subjects harbored BCAs that disrupted genes associated with dominant disorders for
11
139
140
141
142
143
144
145
146
147
148
149
150
151
152
153
154
155
156
157
158
159
160
161
162
163
164
165
166
167
168
169
170

which the expected phenotype was not observed in the proband (e.g. cardiovascular defects, childhood
or late-onset hearing loss, neurodegenerative disorder; Supplementary Table 9). In these subjects for
which we observed discordant genotype-phenotype correlations from expectations in the literature, the
rearrangements could represent pleiotropy in which disruption of the same locus can manifest in
multiple distinct phenotypes, or incidental findings, and were thus interpreted as VUS. In the remaining
13 subjects with Pathogenic BCAs (13/66), genomic imbalances at the breakpoints either overlapped
with known microdeletion/microduplication syndromes, or encompassed a gene associated with a
dominant developmental disorder (e.g., 12p12.1-p11.22 deletion encompassing SOX5; Table 2; Fig. 2c).
Likely Pathogenic: Each specific rearrangement effectively represents a private event, or an N-of-1,
which is a major challenge for interpretation in genomic studies. To interpret variants as Likely
Pathogenic, we relied on convergent genomic evidence from large-scale datasets, postulating that
candidate genes associated with congenital anomalies or early developmental defects would show
evidence of reduced reproductive fitness and intolerance to haploinsufficiency. Thirty-one subjects
harbored BCAs that were considered Likely Pathogenic (Table 2; Supplementary Tables 8, 10). In 25
subjects, the rearrangement directly disrupted a gene intolerant to dnLoF, and in which dnLoF mutations
had been previously reported in isolated cases (1 or 2 subjects, with an additional subject now
represented by the BCA in our study; e.g. CACNA2D3, ROBO2, NFIB), some of which had strong
biological support for involvement in developmental anomalies (EP400, STXBP5, NRXN3). There were
also several genes disrupted in multiple subjects from the cohort (NPAS3, PTPRZ1, SYNCRIP; Table 2,
Supplementary Tables 10-11). Two subjects had BCAs likely associated with genomic disorders: one
involved duplication of the 2p21-p13.3 encompassing NRXN1, and the other disrupted the imprinted
11p15 region associated with Silver-Russel syndrome (MIM#180860). In the remaining four subjects
with Likely Pathogenic BCAs, the rearrangement truncated genes that were associated with
developmental disorders, yet only activating or missense mutations had been previously reported (e.g.,
CACNA1C and GNB1)49,50, proposing a dosage sensitive model for these loci. Based on these results, we
interpreted that 12.5% (31/248) of subjects harbored a BCA that likely contributed to the developmental
phenotype by disrupting potentially novel candidate genes or disease mechanisms.
Taken together, these data suggest that 39.1% (97/248) of subjects have a phenotype that can be at least
partially explained by haploinsufficiency or dosage alteration of an individual gene or locus (Fig. 2c;
Supplementary Tables 8-10). Importantly, the overall diagnostic yield was significantly higher in
12
171
172
173
174
175
176
177
178
179
180
181
182
183
184
185
186
187
188
189
190
191
192
193
194
195
196
197
198
199
200
201
202

subsets of the group, such as among those subjects who harbored de novo or co-segregating BCAs
compared to subjects for whom inheritance was unknown (Fig. 2d), or among subjects who had not
been screened clinically by CMA prior to enrollment (Fig. 2e). Despite these substantial yields, the
marked increase in the frequency of BCAs associated with birth defects compared to the general
population still suggests that alternative mutational mechanisms, other than direct gene disruption, may
account for the developmental defects in a fraction of subjects for which the BCAs were interpreted as
VUS.
Positional effects via disruption of long-range regulatory interactions
Clusters of BCA breakpoints within intergenic regions may suggest disruption of strong regulatory
elements that contribute to disease manifestation via positional effects. Alternatively, this could reflect
recurrent rearrangements due to fragile sites and/or recombination hotspots. To isolate genomic regions
in which an unusual number of BCA breakpoints were localized, we partitioned the genome into 1 Mb
bins. Only one genomic segment, localized to 5q14.3, achieved genome-wide significance. Remarkably,
this genomic segment harbored eight independent BCAs (P=8×10⁻⁹; Fig. 3a).
All BCA breakpoints from the 5q14.3 cluster mapped to a region overlapping with the previously
described 5q14.3 microdeletion syndrome for which almost 100 subjects have been previously reported,
with MEF2C as the proposed genetic driver (Fig. 3b)51-57. However, there are reported deletions that do
not encompass MEF2C (Fig. 3b), and we now report seven BCAs distal to MEF2C in subjects with
comparable phenotypes to those harboring direct disruption of MEF2C, challenge the notion that direct
disruption of MEF2C is a necessary cause of the syndrome. When combining data from the literature, a
total of 11 subjects harbor balanced rearrangement breakpoints localized to the same 1 Mb region within
5q14.3 (Fig. 3b)14,51,56. One BCA directly disrupted MEF2C while the remaining 10 mapped to
intergenic regions distal to MEF2C; none included a breakpoint disrupting a locus of known significance
elsewhere in the genome, suggesting that an alternative mechanism to direct gene disruption was
operating in the 5q14.3 region. All 10 BCAs with intergenic breakpoints were predicted to disrupt a
topologically associated domain (TAD) containing MEF2C (Fig. 3b). TADs are structured chromatin
domains of increased interactions that typically define a local regulatory unit bridging regulatory
elements together with their target genes58. Their disruption by genomic rearrangements can lead to
impaired gene regulation and therefore disease pathogenesis59,60. Correspondingly, in four subjects that
harbored BCA breakpoints up to 860 kb distal to MEF2C, and for which RNA from lymphoblastoid cell
13
203
204
205
206
207
208
209
210
211
212
213
214
215
216
217
218
219
220
221
222
223
224
225
226
227
228
229
230
231
232
233
234

lines (LCLs) was available, MEF2C expression was significantly reduced compared to controls (Fig.
3d). These analyses indicate that alteration of the TAD architecture in this genomic disorder region can
disrupt normal MEF2C expression. When integrated with existing data, the converging clinical features
suggest that multiple distinct mutational mechanisms can result in presentation of 5q14.3 microdeletion
syndrome: (1) direct disruption of MEF2C via dnLoF mutations, (2) deletions including MEF2C, and (3)
long-range positional effects from deletions and BCAs that do not directly truncate MEF2C yet disrupt
its normal function via alteration to the physical orientation of the TAD structure (Fig. 3c).
Beyond 5q14.3, three other loci (2q33.1, 6q14.3 and 14q12) were suggestive of an accumulation of BCA
breakpoints, each containing BCA breakpoints from four independent subjects, although these regions
did not reach genome-wide significance (P=1x10⁻⁴; Fig. 3a). At 2q33.1, one BCA disrupted SATB2,
associated with Glass syndrome and recognized as the established driver of the 2q33.1 microdeletion
syndrome7,46, while the remaining three rearrangements were predicted to impact long-range interactions
between SATB2 and its regulatory elements (Supplementary Fig. 72). In the 14q12 cluster, all BCA
breakpoints were distal to FOXG1, which has been reported in atypical Rett syndrome61-64. The
phenotypes associated with all four of these subjects were highly correlated based upon analyses of HPO
reported terms (HPO-sim P-value=0.006; see Methods and Supplementary Table 11)65,66, and were
consistent with the multiple previous reports of subjects with dysregulation of FOXG1 (Supplementary
Fig. 73)61-64,67. At 6q14.3, four BCAs were localized in proximity to SYNCRIP, a highly constrained gene
in which dnLoF had been reported in two subjects with neurodevelopmental disorders68. In one subject
the BCA directly disrupted SYNCRIP, another subject harbored a breakpoint distal to SYNCRIP that was
part of a cryptic 6q14.3 deletion encompassing the full gene, though the impact of the other two BCAs
was unclear due to their localization to an adjacent contact domain (Supplementary Fig. 74). Finally, a
systematic screen identified four additional subjects in which a TAD disruption could represent a
positional effect on known syndromic loci associated with a developmental disorder that closely
matched the subject's phenotype (PITX2, SLC2A1, SOX9, SRCAP; Supplementary Fig. 75-77). In two
of these regions, LCLs were available from the corresponding subjects and expression of the proposed
driver gene was significantly reduced when compared to controls (SLC2A1 and SRCAP,
Supplementary Fig. 75 and 76).
Collectively, 7.3% of subjects harbored a BCA predicted to alter long-range regulatory interactions
involving an established syndromic locus with comparable phenotype, recurrently involving MEF2C,
14
235
236
237
238
239
240
241
242
243
244
245
246
247
248
249
250
251
252
253
254
255
256
257
258
259
260
261
262
263
264
265
266

SATB2, and FOXG1, while an additional four subjects harbored a BCA that may represent long-range
positional effects (two confirmed by expression studies), though our sample sizes precluded detection of
a significant accumulation of breakpoints in these latter four regions. These data suggest that alterations
to TAD structures likely represent a significant component of the deleterious impact of genomic
rearrangements.
DISCUSSION
This characterization of BCAs at nucleotide resolution offers new insights into their mechanisms of
formation, the properties connected to their rearrangement in the nucleus, and a substantial yield of
potentially novel genes associated with human development. These results also emphasize that neither
the mere presence of a BCA in a subject with developmental anomalies nor the number of genes it
disrupts (if any) provide sufficient prognostic power, but rather that the properties of the specific genes
and regions that are altered are the most informative in predicting resultant phenotypes. These data build
upon recent studies on genome topology and provide further evidence that alterations to chromosome
structure can lead to alternative, yet potentially predictable, pathogenic mechanisms by changing the
long-range regulatory architecture of physical interactions and chromatin looping in the nucleus59,60,65.
The yield of clinically meaningful results in this study, which ranged from 26.6% to 46.4% of the
subjects evaluated, was substantial. Nonetheless, the relative enrichment from cytogenetic studies of
BCAs in subjects with developmental abnormalities compared to controls suggests that there are yet
additional alternative pathogenic mechanisms associated with de novo chromosomal rearrangements that
remain to be discovered4,5.
These data provide an initial vantage of the potential utility of emerging datasets that characterize the
nuclear organization of the chromosomes. They propose novel pathogenic mechanisms by which BCAs
may operate, which appear to be a consequence of the disruption of long-range interactions between
regulatory elements and their target gene59,60,65. Structural variants can indeed easily scramble DNA
topology and contact domains with potentially dramatic regulatory consequences. TADs cover a
substantial fraction of the genome; therefore, the vast majority of structural variation will perturb one of
those domains and cannot constitute a predictive criterion for pathogenicity per se based merely on the
observation of a TAD structure and potentially relevant genes in which it encompasses. However, these
data propose that a conservative approach in which a TAD is recurrently disrupted beyond chance
expectations, it encompasses a high confidence locus with strong phenotypic overlap between the carrier
15
267
268
269
270
271
272
273
274
275
276
277
278
279
280
281
282
283
284
285
286
287
288
289
290
291
292
293
294
295
296
297
298

of the TAD disruption and haploinsufficiency of the locus in independent subjects, and there is a
demonstrated positional effect on gene expression, may represent a first step towards highlighting
putative positional effects in the human genome. There is clearly a need for sensitive and specific tools
to predict such positional effects caused by long-range regulatory perturbations, and to annotate further
the morbid genome with more expansive knowledge of these functional interactions. The fraction of
BCAs in this study that may be associated with this pathogenic mechanism is therefore just an entrée
into their likely significance as a component of the unexplained genetic contribution to human birth
defects.
In terms of evaluating diagnostic strategies, this study further highlights limitations of current diagnostic
tools such as karyotyping or CMA in interpreting and detecting BCAs10,12-15. While the capability to
visualize the chromosomes and detect de novo BCAs by traditional karyotyping represented a critical
leap in genetic diagnostics, as exemplified by the seminal population cytogenetic studies performed by
our late co-author, Dorothy Warburton69, the detection of gross chromosomal abnormalities provides
limited prognostic capability. Our data demonstrate that karyotyping significantly underestimates
complex rearrangements and is almost always revised by at least a sub-band. Karyotyping is also
insensitive to genomic imbalances that cannot be directly visualized (~5-10 Mb). By comparison, CMA
is generally recommended as a first-tier diagnostic screen given its sensitivity to detect submicroscopic
CNVs, yet it is blind to copy-neutral events such as those described herein. This study provides critical
new insights into the fraction of BCAs that can be ascertained by CMA analyses. Compared to
cytogenetic estimates suggesting that up to 40% of BCAs resolved as unbalanced rearrangements and
could therefore be ascertained using CMA24, whole-genome sequencing in this cohort suggests that,
even at the resolution of 100 kb, only about 12% of BCAs involved a genomic imbalance. If we consider
only the 102 subjects for whom no CMA was previously performed, this proportion increases to 18.8%
at 100 kb resolution and 17.6% at 500 kb resolution, suggesting that 81.2-82.4% of BCAs in this study
would be inaccessible to most CMA platforms routinely used in clinical diagnostics. Notably, there is
still benefit to an initial CMA screen, as is illustrated by the significantly lower yield of pathogenic
BCAs among subjects who had been pre-screened by CMA (19-37%) compared to those who had not
(41-64%; Fig. 2e), indicating that a fraction of pathogenic variation in these genomes was captured by
the CMA prescreen either in relation to or independent of the BCA.
16
299
300
301
302
303
304
305
306
307
308
309
310
311
312
313
314
315
316
317
318
319
320
321
322
323
324
325
326
327
328
329

These data strongly argue for the implementation of technologies capable of detecting both balanced and
unbalanced genomic rearrangements. This could be achieved by using a conventional cytogenetic test
followed by a reflex WGS analysis when an abnormality is detected, which we have previously
demonstrated can provide access to all classes of structural variation in the human genome in a relatively
rapid timeframe11,70. Despite its great promise, it is important to recognize the limitations of massively
parallel sequencing in routine cytogenetic practice. This study used large-insert jumping libraries to
maximize physical coverage and minimize cost per base of genome covered. Yet these analyses failed to
reveal breakpoints in 9% of BCAs tested, and our simulations indicate that at large sample sizes, we
would anticipate ~7-8% of breakpoints to be undetectable by short-read sequencing. As sequencing
technologies and analytical capabilities improve, this component of the variant spectrum that are
recalcitrant to short-read sequencing will become more tractable to genomic approaches, and the future
implementation of long-read sequencing may revolutionize the capacity to survey currently inaccessible
segments of the human genome71,72.
In conclusion, these data indicate that de novo BCAs represent a highly penetrant mutational class in
human disease, and that their delineation can provide prognostic insights not available at current
cytogenetic resolution. Although encouraging, this yield does not explain all of the developmental
anomalies in this cohort and suggests that additional pathogenic mechanisms await discovery. A
meaningful fraction may be attributable to novel genes or regulatory alterations, but additional
pathogenic mechanisms remain to be explored such as recessive modes of inheritance, gene fusions,
disruption of imprinted regions, enhancer adoption65,73, and more complex oligogenic models.
Evaluation of extremely large cohorts will be required to resolve further such mechanisms, and
characterization of BCAs in control populations would benefit annotation of the morbid human genome
and interpretation of the biological and clinical consequences of its structural rearrangement.
17
330
331
332
333
334
335
336
337
338
339
340
341
342
343
344
345
346
347
348
349
350
351
352
353

METHODS
Methods and any associated references are available in the online version of the paper.
Note: Supplementary material is available online and contains a Supplementary Note, 12
Supplementary Tables and 77 Supplementary Figures.
Data availability
All reported breakpoints and their clinical interpretation have been submitted to dbVar (accession
number: nstd133) and ClinVar (accession numbers: SCV000320745 to SCV000320992).
ACKNOWLEDGMENTS
We are infinitely grateful for the seminal work led by our co-author, Prof. Dorothy Warburton, who
passed away during review of this manuscript. Dr. Warburton was a pioneer in cytogenetic research and
a close colleague, mentor, and friend to so many in the cytogenetics community. We wish to thank all
subjects and families who have been enrolled in this study, as well as the countless genetic counselors
and clinical geneticists who contributed to the ascertainment of subjects. This study was supported by:
the National Institutes of Health (grant GM061354 to M.E.T., J.F.G., C.C.M. and E.L.; grants
MH095867 and HD081256 to M.E.T.), the March of Dimes (6-FY15-255 to M.E.T.), the European
Molecular Biology Organization and the Marie Curie Actions of the European Commission (fellowship
EMBO ALTF-183-2015 to C.R.), the Bettencourt-Schueller Foundation (young investigator award to
C.R.), the Philippe Foundation (award to C.R.), the Harvard Medical School–Portugal Program in
Translational and Clinical Research and Health Information (Fundação para a Ciência e a Tecnologia,
HMSP-ICT/0016/2013 to C.C.M and D.D.), the National Science Foundation (NSF Graduate Research
Fellowship DGE1144152 to S.L.P.S.), the Fund for Scientific Research – Flanders (B.C. and S.V. are
respectively a FWO senior clinical investigator and a FWO postdoctoral researcher), Clinical Medicine
Science and Technology Projects of Jiangsu Province (grant BL2013019 to Ha.L. and Ho.L.), the
Suzhou Key Medical Center (grant Szzx201505 to Ha.L. and Ho.L.), and the Royal Society of New
Zealand (Rutherford Discovery Fellowship to J.C.J.). This study was also supported by the Desmond
and Ann Heathwood MGH Research Scholars award to M.E.T
AUTHOR CONTRIBUTIONS
18
354
355
356
357
358
359
360
361
362
363
364
365
366
367
368
369
370
371
372
373
374
375
376
377
378
379
380
381
382
383
384

M.E.T, J.F.G, C.C.M, E.T., J.C.H., W.P.K., N.dL. and H.G.B designed the study. C.R., H.B., R.L.C.,
V.P., I.B., C.C., J.T.G., M.R.S., M.J.vR. and W.P.K., performed computational analyses. C.H., C.M.S.,
R.A., M-A.An., C.A., E.C., B.B.C., J.K., W.L., P.M., L.M., T.M., D.P., J.R., M.J.W. and A.W.
performed cellular, molecular or genomic experiments. T.K., E.M., J.C.H, M-A.Ab., O.A.A-R., E.A.,,
S.L.A-E., F.S.A, Y.A., K.A-Y., J.F.A., T.B., J.A.B., E.B., E.M.H.F.B., E.H.B, C.W.B., H.T.B., B.C.,
K.C., H.C., T.C., D.D., M.A.D., A.D., M.D'H., B.B.A.dV., D.L.E., H.L.F., H.F., D.R.F., P.G., D.G.,
T.G., M.G., B.H.G., C.G., K.W.G., A.L.G., A.H-K., D.J.H., M.A.H., R.Hi., R.Ho., J.D.H., R.J.H.,
M.W.H., A.M.I., Mi.I., Me.I., J.C.J., S.J., T.J., J.P.J., M.C.J., S.G.K, D.A.K., P.M.K., Y.L., E.L., K.L.,
A.V.L., Ha.L., Ho.L., E.C.L., C.L., E.J.L., D.L., M.J.M., G.M., C.L.M., D.M.F., M.W.M., C.Z.M.,
B.M., S.M., L.R.M., E.M., S.M., T.M., M.E.M., G.M., A.N., Z.O., S.P., S.P.P., S.P., K.P., R.E.P.A.,
P.J.P., G.P., S.R., L.R., W.R., D.R., I.R., F.R., P.R., S.L.P.S., R.Sh., R.Sp., E.S., B.S., J.T., J.V.T.,
B.W.vB., J.vdK., I.vDB., T.vE., C.M.vR-A, S.V., C.M.L.V-T., D.P.W., S.W., M.C.A.Y., R.T.Z., B.L.,
H.G.B., N.dL., W.P.K., E.C.T. C.C.M, and J.F.G. ascertained and enrolled subjects and provided
phenotypic information. C.R. and M.E.T. wrote the manuscript, which was approved by all authors.
COMPETING FINANCIAL INTERESTS
The authors have none to declare.
FIGURE TITLES AND LEGENDS
Figure 1. Characterization of BCAs detected by karyotyping at nucleotide resolutiona. Circos plot of all BCA breakpoints identified in the cohort by whole-genome sequencing74. One color is used per BCA to represent all rearrangement breakpoints in each individual subject. The scatter plot on the outside ring denotes breakpoint density per 1-Mb bin across the genome, with a blue arrow displaying the largest clustering of breakpoints at 5q14.3; b. Scatter plot summarizing the overall genomic imbalance associated with fully reconstructed BCAs at varying size thresholds. Curves represent the fraction of cases with final genomic imbalances greater than the corresponding size provided. Solid lines denote the final genomic imbalances for all BCAs, and are further delineated by deletions (red) or duplications (blue). The final genomic imbalances among fully mapped BCAs is also split between cases that have been pre-screened by chromosomal microarray (CMA; dashed line) versus cases without CMA data (dotted line); c. Sequence signatures of BCA breakpoints. Histogram representing nucleotide signatures at the junction of 662 Sanger-validated breakpoints: inserted nucleotides, blunt ends, microhomology, or longer stretches of homology.
Figure 2. De novo BCAs associated with congenital anomalies disrupt functionally relevant loci. a. Boxplots illustrate specific gene-set enrichments at BCA breakpoints in subjects with congenital anomalies. Each boxplot represents the expected distribution (median, first and third quartiles) based on total intersections between 100,000 sets of simulated breakpoints and a particular gene-set. Red diamonds indicate the observed intersection values. Empirical Monte-Carlo P-values are indicated; b.
19
385
386
387
388
389
390
391
392
393
394
395
396
397
398
399
400
401
402
403
404405406407408409410411412413414415416417418419420421422

Venn diagram showing the detailed overlap of disrupted genes previously associated with three neurodevelopmental phenotypes (intellectual disability, ASD, and epilepsy) in amalgamated exome and CNV studies. In black: high-confidence genes (3 or more de novo LoF mutations reported), in grey: low-confidence genes (two de novo LoF mutations). c-e) Pie charts illustrating diagnostic yields associated with the overall cohort and multiple subgroups of BCAs: c. Diagnostic yield associated with all 248 mapped BCAs from subjects with congenital or developmental anomalies; d. Diagnostic yields partitioned by inheritance status (confirmed de novo, segregating with a developmental anomaly, or unknown); e. Comparison of yields associated with BCAs in which large pathogenic CNVs had been excluded by a CMA pre-screen to the yield from BCAs that had not been pre-screened by CMA.
Figure 3. Recurrent disruption of long-range regulatory interactions at the 5q14.3 locus.a. Manhattan plot showing the genome-wide distribution of BCA breakpoints in the cohort across each 1-Mb bin. P-values were computed by comparing observed to expected cluster sizes after 100,000 Monte Carlo randomizations, and corrected for the number of windows interrogated. One cluster (localized to 5q14.3) achieved genome-wide significance (threshold demarcated by red line; b. Hi-C profile and contact domains at the 5q14.3 locus derived from human LCLs. Overlapping Hi-C data suggests that the topology of the MEF2C-contact domain is lost in subjects carrying BCAs17. Brain-expressed enhancers located in the region75, loops involving MEF2C (yellow circles)17 and CTCF binding sites (green: forward, red: reverse) are indicated. Multiple pathogenic mechanisms converge on a similar syndrome: multi-genic deletions that encompass MEF2C along with one or both TAD boundaries (n=68), MEF2C-intragenic deletions (n=12) or LoF mutations, deletions that do not encompass MEF2C but overlap one TAD boundary (n=13), and BCA breakpoints distal to MEF2C (breakpoints from seven subjects reported in this study and three previously reported subjects)14,51,56.; c. Proposed model of the chromatin folding in the region defining a regulatory unit for MEF2C. A loop is formed anchored at bidirectional CTCF binding sites resulting in distal enhancers being bridged in close proximity to MEF2C promoter regulating MEF2C expression; d. Significantly decreased expression of MEF2C was observed in subjects harboring BCAs distal to MEF2C compared to 16 age-matched controls Individual expression values, median, first and third quartiles are indicated. Differential gene expression was tested using a Wilcoxon Mann-Whitney test following normalization to three independent genes (ACTB, GAPDH and POLR2A; DGAP131, DGAP191, DGAP222: P=0.0085, DGAP218: P=0.0160).
Figure 4. Correlations between phenotypes and genes disrupted in subjects harboring pathogenic BCAs.Heatmap summarizing the correlation between disrupted genes at breakpoints of pathogenic BCAs and phenotypes reported in subjects from this study. For each gene, the phenotypes reported in the corresponding subject were digitalized using HPO18. One tile represents the normalized count of HPO terms belonging to each organ category reported in the subject(s). Genes clustered together when sharing similarly affected organs, from which five groups can be delineated: 1- genes associated with multiple nervous system and craniofacial abnormalities (dark blue); 2- genes connected to multiple neurological phenotypes (pink); 3- genes associated with craniofacial abnormalities and a few neurological symptoms (black); 4- genes associated with skeletal and limb abnormalities, and with limited neurological involvement (green); 5- genes without neurological involvement (light blue).
20
423424425426427428429430431432433434435436437438439440441442443444445446447448449450451452453454455456457458459460461462463464

TABLES
Table 1. Overview of clinical phenotypes for all 273 subjects
Affected subjects
Frequencyin cohort
GenderMale 159 58.2%Female 114 41.8%
Co-SegregationDe novo 184 67.4%Unknown 75 27.5%Inherited, segregating 14 5.1%
array-CGH analysesNormal 139 50.9%VUS 32 11.7%Not Performed 102 37.4%
Abdomen defects 54 19.8%Cardiovascular defects 41 15.0%Eye defects 54 19.8%Hearing defects 52 19.0%Genitourinary defects 50 18.3%Growth defects 64 23.4%Head/Neck/Craniofacial defects
140 51.3%Integument defects 50 18.3%Limb defects 57 20.9%Musculature defects 71 26.0%Neurological defects 219 80.2%
Behavior disorders 51 18.7%Developmental delay 159 58.2%Epilepsy 51 18.7%Hypotonia 41 15.0%ASD/autistic features 31 11.4%High functioning ASD 4 1.5%
Respiratory defects 30 11.0%Skeletal defects 116 42.4%
Clinical description was converted for all 273 subjects into standardized terms using Human Phenotype
Ontology (HPO)18, which allowed systematic association with broad phenotypic categories for each
enrolled subject.
21
465
466
467
468
469
470
471
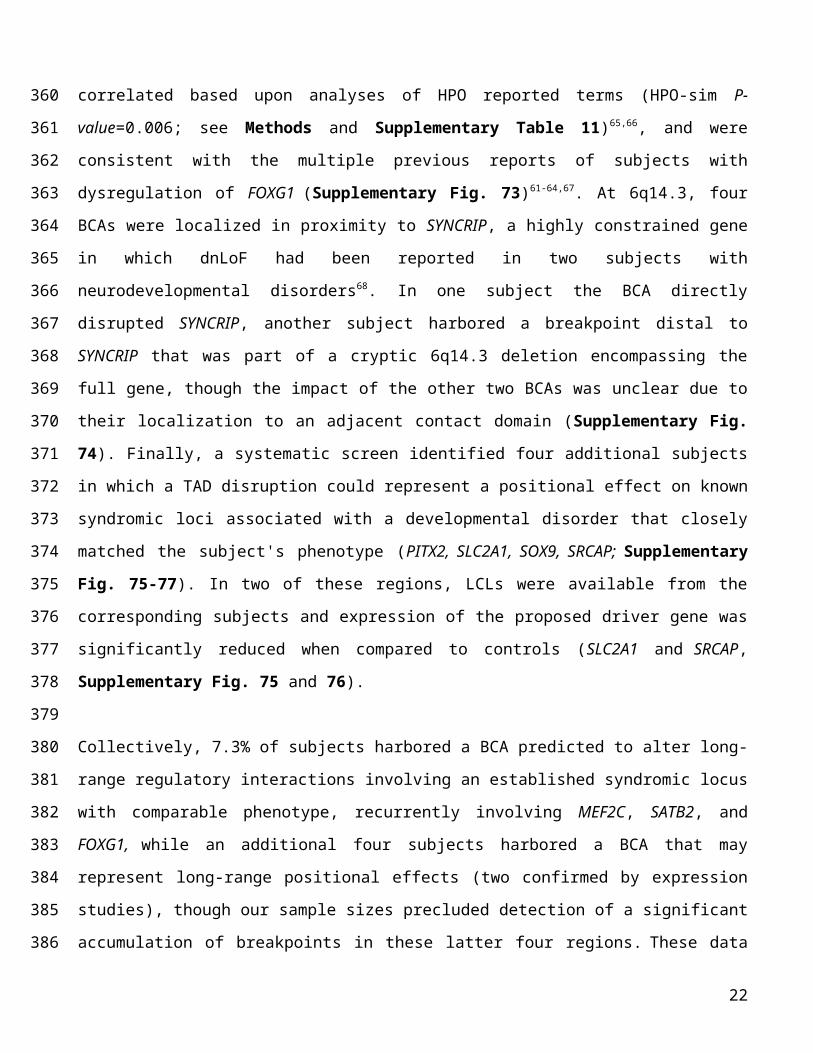
Table 2. Genes and loci disrupted by BCAs and likely associated with developmental disorders
Details on BCA interpretation are provided in Methods and Supplementary Table 7. Genes that have
been associated to dominant developmental disorders and encompassed by genomic imbalances at
breakpoints are indicated in brackets; lower-scripts indicate when a gene was disrupted by a BCA in
2q24
.3 d
elet
ion
(SC
N9A
); 4q
34 d
elet
ion;
6q1
3-q1
4.1
dele
tion
(PH
IP)a ; 6
q14.
1 de
letio
n (T
BX18
)b ; 6q2
2.1-
22.3
1 de
letio
n (G
JA1)
; 10p
15.3
-p14
del
etio
n (G
ATA3
); 11
p14.
2 de
letio
n; 1
2p12
.1-p
11.2
2 de
letio
n (S
OX5
, PTH
LH);
13q1
4.2
dele
tion;
14
q12-
q21.
1 de
letio
n (N
FKBI
A, N
KX2
-1)c ; 1
8p11
.32-
p11.
22 d
elet
iond ;
19q1
2-q1
3.11
del
etio
n; X
q25
dupl
icat
ion
AHD
C1;
AU
TS2 (
x2);
CAM
TA1;
CD
KL5
; CH
D7;
CH
D8;
CTN
ND
2; C
UL3
; D
YRK
1A; E
FTU
D2;
EH
MT1
; FG
FR1;
FO
XP1;
FO
XP2;
GRI
N2B
; IL1
RAPL
1;
KAT
6B; K
DM
6A(x
2); M
BD5 (
x3);
MEF
2C; M
TAP;
MYT
1L(x
2); M
YO6e ; N
ALC
N;
NFI
A; N
FIX;
NO
DAL
; NO
TCH
2; N
R2F1
; NR5
A1; N
RXN
1; N
SD1;
PAK
3;
PDE1
0A; P
HF2
1A(x
2)d ; P
HIP
e ; SAT
B2; S
CN
1A; S
MS;
SN
RPN
-SN
URF
(x3); S
OX5
(x2);
SPAS
T; T
CF1
2; T
CF4
; WAC
; ZBT
B20 (
x2)
2p21
-p13
.3 d
uplic
atio
n (N
RXN
1)
ARIH
1; B
BX; C
ACN
A2D
3; C
ACN
A1C
; CAD
PS2f C
DK
6 (x2
); C
ELSR
1; E
P400
g ; G
NB1
; GRM
1h ; KC
ND
2; M
DN
1; N
FIB;
NPA
S3(x
4)c,
i ; NRX
N3;
PRP
F40A
; PSD
3j ; PT
PRZ1
(x3)
a,f ; R
OBO
2; S
HRO
OM
4g ; SPT
BN1;
SYN
CRI
P (x2
)b,j ; S
TXBP
5h ; UPF
2;
11p1
5 re
gion
FOXG
1 (x4
)i ; MEF
2C(x
7); P
ITX2
; SAT
B2(x
3)j ; S
LC2A
1; S
OX9
; SRC
AP
Path
ogen
ic
Gen
omic
imba
lanc
es a
t br
eakp
oint
s
Gen
e di
srup
tion
Lik
ely
Path
ogen
ic
Gen
omic
imba
lanc
es a
t br
eakp
oint
s
Gen
e di
srup
tion
Posi
tiona
l eff
ect
22
472
473
474
475
476
477
478
479
480
481
482
483
484
485
486
487
488
489
490
491
492
493
494
495
496
497
498
499
500
501
502
503

multiple subjects; upper-scripts report subjects with a BCA disrupting multiple genes/loci that may each
contribute to their developmental phenotype and to distinct clinical features; a: Subject DGAP133; b:
Subject DGAP317, c: subject DGAP002, d: subject DGAP316, e: subject NIJ2, f: subject DGAP168, g:
subject DGAP172, h: DGPA196; i: DGAP246; j: DGAP237.
REFERENCES
1. Jacobs, P.A., Melville, M., Ratcliffe, S., Keay, A.J. & Syme, J. A cytogenetic survey of 11,680 newborn infants. Ann. Hum. Genet. 37, 359-376 (1974).
2. Nielsen, J. & Wohlert, M. Chromosome abnormalities found among 34,910 newborn children: results from a 13-year incidence study in Arhus, Denmark. Hum. Genet. 87, 81-83 (1991).
3. Ravel, C., Berthaut, I., Bresson, J.L., Siffroi, J.P. & Genetics Commission of the French Federation of, C. Prevalence of chromosomal abnormalities in phenotypically normal and fertile adult males: large-scale survey of over 10,000 sperm donor karyotypes. Hum. Reprod. 21, 1484-1489 (2006).
4. Funderburk, S.J., Spence, M.A. & Sparkes, R.S. Mental retardation associated with "balanced" chromosome rearrangements. Am. J. Hum. Genet. 29, 136-141 (1977).
5. Marshall, C.R. et al. Structural variation of chromosomes in autism spectrum disorder. Am. J. Hum. Genet. 82, 477-488 (2008).
6. McKusick, V.A. & Amberger, J.S. The morbid anatomy of the human genome: chromosomal location of mutations causing disease. J. Med. Genet. 30, 1-26 (1993).
7. Talkowski, M.E. et al. Sequencing chromosomal abnormalities reveals neurodevelopmental loci that confer risk across diagnostic boundaries. Cell 149, 525-537 (2012).
8. Weischenfeldt, J., Symmons, O., Spitz, F. & Korbel, J.O. Phenotypic impact of genomic structural variation: insights from and for human disease. Nat Rev Genet 14, 125-138 (2013).
9. Warburton, D. Current techniques in chromosome analysis. Pediatr. Clin. North Am. 27, 753-769 (1980).
10. Talkowski, M.E. et al. Next-generation sequencing strategies enable routine detection of balanced chromosome rearrangements for clinical diagnostics and genetic research. Am. J. Hum. Genet. 88, 469-481 (2011).
11. Talkowski, M.E. et al. Clinical diagnosis by whole-genome sequencing of a prenatal sample. N. Engl. J. Med. 367, 2226-2232 (2012).
12. Schluth-Bolard, C. et al. Breakpoint mapping by next generation sequencing reveals causative gene disruption in patients carrying apparently balanced chromosome rearrangements with intellectual deficiency and/or congenital malformations. J. Med. Genet. 50, 144-150 (2013).
13. Utami, K.H. et al. Detection of chromosomal breakpoints in patients with developmental delay and speech disorders. PLoS One 9, e90852 (2014).
14. Vergult, S. et al. Mate pair sequencing for the detection of chromosomal aberrations in patients with intellectual disability and congenital malformations. Eur. J. Hum. Genet. 22, 652-659 (2014).
23
504
505
506
507
508
509
510511512513514515516517518519520521522523524525526527528529530531532533534535536537538539540541542543544545546

15. Tabet, A.C. et al. Complex nature of apparently balanced chromosomal rearrangements in patients with autism spectrum disorder. Mol. Autism 6, 19 (2015).
16. Jin, F. et al. A high-resolution map of the three-dimensional chromatin interactome in human cells. Nature 503, 290-294 (2013).
17. Rao, S.S. et al. A 3D map of the human genome at kilobase resolution reveals principles of chromatin looping. Cell 159, 1665-1680 (2014).
18. Kohler, S. et al. The Human Phenotype Ontology project: linking molecular biology and disease through phenotype data. Nucleic Acids Res. 42, D966-974 (2014).
19. Meyerson, M. & Pellman, D. Cancer genomes evolve by pulverizing single chromosomes. Cell 144, 9-10 (2011).
20. Stephens, P.J. et al. Massive genomic rearrangement acquired in a single catastrophic event during cancer development. Cell 144, 27-40 (2011).
21. Kloosterman, W.P. et al. Chromothripsis as a mechanism driving complex de novo structural rearrangements in the germline. Hum. Mol. Genet. 20, 1916-1924 (2011).
22. Chiang, C. et al. Complex reorganization and predominant non-homologous repair following chromosomal breakage in karyotypically balanced germline rearrangements and transgenic integration. Nat. Genet. 44, 390-397, S391 (2012).
23. Baca, S.C. et al. Punctuated evolution of prostate cancer genomes. Cell 153, 666-677 (2013).24. De Gregori, M. et al. Cryptic deletions are a common finding in "balanced" reciprocal and
complex chromosome rearrangements: a study of 59 patients. J. Med. Genet. 44, 750-762 (2007).
25. Zhang, F. et al. The DNA replication FoSTeS/MMBIR mechanism can generate genomic, genic and exonic complex rearrangements in humans. Nat. Genet. 41, 849-853 (2009).
26. Abyzov, A. et al. Analysis of deletion breakpoints from 1,092 humans reveals details of mutation mechanisms. Nat Commun 6, 7256 (2015).
27. Djebali, S. et al. Landscape of transcription in human cells. Nature 489, 101-108 (2012).28. Petrovski, S., Wang, Q., Heinzen, E.L., Allen, A.S. & Goldstein, D.B. Genic intolerance to
functional variation and the interpretation of personal genomes. PLoS Genet 9, e1003709 (2013).
29. Samocha, K.E. et al. A framework for the interpretation of de novo mutation in human disease. Nat. Genet. 46, 944-950 (2014).
30. Iossifov, I. et al. The contribution of de novo coding mutations to autism spectrum disorder. Nature 515, 216-221 (2014).
31. Berg, J.S. et al. An informatics approach to analyzing the incidentalome. Genet. Med. 15, 36-44 (2013).
32. Darnell, J.C. et al. FMRP stalls ribosomal translocation on mRNAs linked to synaptic function and autism. Cell 146, 247-261 (2011).
33. Ascano, M., Jr. et al. FMRP targets distinct mRNA sequence elements to regulate protein expression. Nature 492, 382-386 (2012).
34. Iossifov, I. et al. De novo gene disruptions in children on the autistic spectrum. Neuron 74, 285-299 (2012).
35. O'Roak, B.J. et al. Sporadic autism exomes reveal a highly interconnected protein network of de novo mutations. Nature 485, 246-250 (2012).
36. Sanders, S.J. et al. De novo mutations revealed by whole-exome sequencing are strongly associated with autism. Nature 485, 237-241 (2012).
24
547548549550551552553554555556557558559560561562563564565566567568569570571572573574575576577578579580581582583584585586587588589590591

37. De Rubeis, S. et al. Synaptic, transcriptional and chromatin genes disrupted in autism. Nature 515, 209-215 (2014).
38. Cotney, J. et al. The autism-associated chromatin modifier CHD8 regulates other autism risk genes during human neurodevelopment. Nat Commun 6, 6404 (2015).
39. Sugathan, A. et al. CHD8 regulates neurodevelopmental pathways associated with autism spectrum disorder in neural progenitors. Proc. Natl. Acad. Sci. U. S. A. 111, E4468-4477 (2014).
40. Hawrylycz, M.J. et al. An anatomically comprehensive atlas of the adult human brain transcriptome. Nature 489, 391-399 (2012).
41. Fromer, M. et al. De novo mutations in schizophrenia implicate synaptic networks. Nature 506, 179-184 (2014).
42. Purcell, S.M. et al. A polygenic burden of rare disruptive mutations in schizophrenia. Nature 506, 185-190 (2014).
43. Landrum, M.J. et al. ClinVar: public archive of interpretations of clinically relevant variants. Nucleic Acids Res. 44, D862-868 (2016).
44. Kleefstra, T. et al. Loss-of-function mutations in euchromatin histone methyl transferase 1 (EHMT1) cause the 9q34 subtelomeric deletion syndrome. Am. J. Hum. Genet. 79, 370-377 (2006).
45. Lu, W. et al. NFIA haploinsufficiency is associated with a CNS malformation syndrome and urinary tract defects. PLoS Genet 3, e80 (2007).
46. Rosenfeld, J.A. et al. Small deletions of SATB2 cause some of the clinical features of the 2q33.1 microdeletion syndrome. PLoS One 4, e6568 (2009).
47. Talkowski, M.E. et al. Assessment of 2q23.1 microdeletion syndrome implicates MBD5 as a single causal locus of intellectual disability, epilepsy, and autism spectrum disorder. Am. J. Hum. Genet. 89, 551-563 (2011).
48. Rasmussen, M.B. et al. Neurodevelopmental disorders associated with dosage imbalance of ZBTB20 correlate with the morbidity spectrum of ZBTB20 candidate target genes. J. Med. Genet. 51, 605-613 (2014).
49. Splawski, I. et al. Severe arrhythmia disorder caused by cardiac L-type calcium channel mutations. Proc. Natl. Acad. Sci. U. S. A. 102, 8089-8096; discussion 8086-8088 (2005).
50. Petrovski, S. et al. Germline De Novo Mutations in GNB1 Cause Severe Neurodevelopmental Disability, Hypotonia, and Seizures. Am. J. Hum. Genet. 98, 1001-1010 (2016).
51. Floris, C. et al. Two patients with balanced translocations and autistic disorder: CSMD3 as a candidate gene for autism found in their common 8q23 breakpoint area. Eur. J. Hum. Genet. 16, 696-704 (2008).
52. Cardoso, C. et al. Periventricular heterotopia, mental retardation, and epilepsy associated with 5q14.3-q15 deletion. Neurology 72, 784-792 (2009).
53. Engels, H. et al. A novel microdeletion syndrome involving 5q14.3-q15: clinical and molecular cytogenetic characterization of three patients. Eur. J. Hum. Genet. 17, 1592-1599 (2009).
54. Le Meur, N. et al. MEF2C haploinsufficiency caused by either microdeletion of the 5q14.3 region or mutation is responsible for severe mental retardation with stereotypic movements, epilepsy and/or cerebral malformations. J. Med. Genet. 47, 22-29 (2010).
55. Zweier, M. et al. Mutations in MEF2C from the 5q14.3q15 microdeletion syndrome region are a frequent cause of severe mental retardation and diminish MECP2 and CDKL5 expression. Hum. Mutat. 31, 722-733 (2010).
25
592593594595596597598599600601602603604605606607608609610611612613614615616617618619620621622623624625626627628629630631632633634635636637

56. Saitsu, H. et al. De novo 5q14.3 translocation 121.5-kb upstream of MEF2C in a patient with severe intellectual disability and early-onset epileptic encephalopathy. Am. J. Med. Genet. A 155A, 2879-2884 (2011).
57. Zweier, M. & Rauch, A. TheMEF2C-Related and 5q14.3q15 Microdeletion Syndrome. Mol. Syndromol. 2, 164-170 (2012).
58. Dixon, J.R. et al. Topological domains in mammalian genomes identified by analysis of chromatin interactions. Nature 485, 376-380 (2012).
59. Lupianez, D.G. et al. Disruptions of topological chromatin domains cause pathogenic rewiring of gene-enhancer interactions. Cell 161, 1012-1025 (2015).
60. Lupianez, D.G., Spielmann, M. & Mundlos, S. Breaking TADs: How Alterations of Chromatin Domains Result in Disease. Trends Genet. 32, 225-237 (2016).
61. Mencarelli, M.A. et al. 14q12 Microdeletion syndrome and congenital variant of Rett syndrome. Eur. J. Med. Genet. 52, 148-152 (2009).
62. Ellaway, C.J. et al. 14q12 microdeletions excluding FOXG1 give rise to a congenital variant Rett syndrome-like phenotype. Eur. J. Hum. Genet. 21, 522-527 (2013).
63. Takagi, M. et al. A 2.0 Mb microdeletion in proximal chromosome 14q12, involving regulatory elements of FOXG1, with the coding region of FOXG1 being unaffected, results in severe developmental delay, microcephaly, and hypoplasia of the corpus callosum. Eur. J. Med. Genet. 56, 526-528 (2013).
64. Perche, O. et al. Dysregulation of FOXG1 pathway in a 14q12 microdeletion case. Am. J. Med. Genet. A 161A, 3072-3077 (2013).
65. Ibn-Salem, J. et al. Deletions of chromosomal regulatory boundaries are associated with congenital disease. Genome Biol. 15, 423 (2014).
66. Deng, Y., Gao, L., Wang, B. & Guo, X. HPOSim: an R package for phenotypic similarity measure and enrichment analysis based on the human phenotype ontology. PLoS One 10, e0115692 (2015).
67. Brunetti-Pierri, N. et al. Duplications of FOXG1 in 14q12 are associated with developmental epilepsy, mental retardation, and severe speech impairment. Eur. J. Hum. Genet. 19, 102-107 (2011).
68. McDermott, S.M. et al. Drosophila Syncrip modulates the expression of mRNAs encoding key synaptic proteins required for morphology at the neuromuscular junction. RNA 20, 1593-1606 (2014).
69. Warburton, D. De novo balanced chromosome rearrangements and extra marker chromosomes identified at prenatal diagnosis: clinical significance and distribution of breakpoints. Am. J. Hum. Genet. 49, 995-1013 (1991).
70. Brand, H. et al. Cryptic and complex chromosomal aberrations in early-onset neuropsychiatric disorders. Am. J. Hum. Genet. 95, 454-461 (2014).
71. Chaisson, M.J. et al. Resolving the complexity of the human genome using single-molecule sequencing. Nature 517, 608-611 (2015).
72. Huddleston, J. et al. Reconstructing complex regions of genomes using long-read sequencing technology. Genome Res. 24, 688-696 (2014).
73. Lettice, L.A. et al. Enhancer-adoption as a mechanism of human developmental disease. Hum. Mutat. 32, 1492-1499 (2011).
74. Krzywinski, M. et al. Circos: an information aesthetic for comparative genomics. Genome Res. 19, 1639-1645 (2009).
26
638639640641642643644645646647648649650651652653654655656657658659660661662663664665666667668669670671672673674675676677678679680681682
75. Andersson, R. et al. An atlas of active enhancers across human cell types and tissues. Nature 507, 455-461 (2014).
27
683684

ONLINE METHODS
Subject Ascertainment
Subjects were enrolled through cytogenetic reference centers including DGAP (the Developmental
Genome Anatomy Project) of Brigham and Women's Hospital and Massachusetts General Hospital,
Boston, MA; Mayo Clinic, Rochester, MN; University Medical Center, Utrecht, NL; Radboud
University Medical Center, Nijmegen, NL. Enrollment was based on the presence of a developmental
anomaly and concomitant BCA (de novo or that segregated with the abnormal phenotype) detected by
karyotyping, and exclusion of clinically significant genomic copy number imbalances using
chromosomal microarray analyses (SNP array or array-CGH) when possible (171/273 tested subjects;
Supplementary Fig. 1). In the majority of cases the BCA was confirmed to have arisen de novo by
karyotyping (184/273) or segregated with a developmental phenotype in the family (14/273). In a subset
of subjects: (1) the BCA was inherited but the phenotype of the transmitting parent was not available
(3/273); (2) one parent was available and did not harbor the BCA (4/273); or (3) neither parents were
available for testing (68/273). An informed consent was obtained from all subjects or their legal
representative for participation in the study. All studies were approved by respective Institutional
Review Boards.
Whole-genome sequencing using large-insert jumping libraries
Blood samples were collected from all subjects and their parents when available. DNA was extracted
from blood or from freshly derived LCLs. Samples were prepared using multiple sequencing methods
over several years (Supplementary Table 1). Most samples were sequenced using whole-genome large-
insert jumping library preparation protocols for subsequent Illumina sequencing: 149 using our 2x25-bp
EcoP15l protocol11,76, 59 using a variant of our jumping library protocol in which we randomly shear
circularized DNA, which enables longer reads (paired-end 50 bp, see Supplementary Note) and 19
using standard Illumina mate-pair protocols. All large-insert sequencing methods allowed generation of
paired-end reads with median insert size of 2.5-3.5 kb as opposed to 300 bp using conventional methods.
A subset of samples were prepared with standard short-insert paired-end protocols (n=12) or targeted
sequencing of the breakpoints based on previous positional cloning to narrow the breakpoint regions
(n=34), as previously described7,11,77. Of note, 87 BCAs had been initially reported in the literature,
though many had not been mapped to sequence resolution (Supplementary Table 1).
28
123
4
5
6
7
8
9
10
11
12
13
14
15
16
17
18
19
20
21
22
23
24
25
26
27
28
29
30
31
32

Digitalization and homogenization of reported phenotypes
Clinical description was converted for all 273 subjects into standardized terms using Human Phenotype
Ontology (HPO; Supplementary Table 2)18. Such digitalization allowed systematic comparison of
phenotypes between subjects carrying BCAs that disrupted the same gene, as well as between subjects
with a disrupted gene to previously described subjects using Phenomizer78. HPO-sim was used to
compute phenotypic similarity scores between subjects sharing the disruption of the same gene or locus
compared to random expectations (Supplementary Table 11). P-values were generated as the
proportion of simulated scores greater than the observed probands' score, alike described by the
authors66. HPO-digitalization also allowed the generation of heatmaps summarizing the correlation
between disrupted genes and phenotypes reported in subjects. For each gene, the number of HPO terms
belonging each broad HPO categories was computed18. The matrix was then z-score transformed by
gene, and clustering was performed using a distance matrix of correlation coefficients and average
agglomeration (Figure 4).
BCA discovery pipeline and breakpoint inference
All computational analyses have been previously described70,79. In brief, reads were reverse-
complemented and aligned using BWA80. Anomalous read-pairs in terms of insert size, mate mapping,
or mate orientation were extracted using Sambamba and clustered using ReadPairCluster, our single-
linkage clustering algorithm11,81. Anomalous read-pair clusters meeting our established thresholds of
structural variation were subsequently classified based on their read-pair orientation signature into the
following categories: deletions, insertions, inversions, and translocations79. When no clusters were found
that matched the proposed karyotype, BAM files were agnostically analyzed and manually inspected for
anomalous pairs or split reads. Breakpoints were successfully identified in 248 of 273 cases, leading to
an overall breakpoint fine-mapping yield of 91%. All subsequent counts and yields were computed
relative to mapped cases (n=248). For the remaining 25 unmapped cases, no breakpoints were identified
in proximity to the karyotype interpretation following extensive analyses and visual inspection. For the
majority of these latter unresolved cases, one or more breakpoints were interpreted by the karyotype to
localize near centromeres heterochromatic regions, or within segmental duplications, which are
recognized to be blind spots for short-read alignments. All large genomic imbalances predicted to be
connected to BCA breakpoints following rearrangement reconstruction were confirmed to have aberrant
depth of coverage using a custom R-script (CNView: https://github.com/RCollins13/CNView).
29
33
34
35
36
37
38
39
40
41
42
43
44
45
46
47
48
49
50
51
52
53
54
55
56
57
58
59
60
61
62
63

When additional DNA was available, precise breakpoint junctions were delineated at base-pair
resolution by Sanger sequencing and final breakpoints coordinates were reported; else the reported
coordinates reflect the closest breakpoint estimates based on the resolution of the jumping libraries
(Supplementary Table 3). A total of 82.7% (725/876) of the reported breakpoints could be tested by
Sanger sequencing given DNA availability, among which 662 were confirmed yielding a minimum
estimate of 91.3% (662/725) sensitivity for our mapping method.
Molecular signature of BCA breakpoints
As previously described22, we processed all Sanger sequences from validated breakpoints with the BWA
Smith-Waterman algorithm (modified parameters z 100 -t 3 -H -T 1) to retrieve precise breakpoint
coordinates as well as infer the associated microhomology, micro-insertions or blunt end signature. This
approach was sufficiently high-throughput to enable the direct comparison of BCA breakpoints with a
large set of deletion breakpoints published by Abyzov et al.26, at the cost of not allowing concomitant
microhomology and base insertions at breakpoints.
Monte-Carlo randomization tests and associated statistics
A Browser Extensible Data (BED) file containing GRCh37/hg19 genomic coordinates of all 876
breakpoints detected by WGS was used as the input. One simulation consisted of generating random
coordinates based on each pair of input coordinates, conserving the size of the feature as well as the
intra-chromosomal distance when several breakpoints were localized to the same chromosome in a
single individual. N-masked regions were excluded from simulations for consistency as they were
excluded from the initial alignment mapping. Simulations were repeated 100,000 times. The number of
unique intersections between the shuffled file and a BED-file containing features of interest (gene-sets,
regulatory elements, etc.) was retrieved for each simulation, and the final sets of simulations delineated
the expected distribution on intersections under the null hypothesis. The observed value of intersected
features in this study was compared to this expected distribution. Empirical Monte-Carlo P-values were
indicated, and were calculated as follows: P-value = (r + 1)/(n + 1), where r is the number of
observations within the set of simulations that are at least as extreme as the one observed, and n is the
total number of simulations82. References for all functional element datasets and genesets that were used
to test for enrichment at breakpoints in the cohort are detailed in Supplementary Table 12.
30
64
65
66
67
68
69
70
71
72
73
74
75
76
77
78
79
80
81
82
83
84
85
86
87
88
89
90
91
92
93
94

To isolate genomic regions in which an unusual number of BCA breakpoints were localized, we
partitioned the genome into 1 Mb bins using a sliding window of 100 kb, and counted the number of
BCA breakpoints coming from independent subjects. The same approach was performed for 100,000
sets of simulated breakpoints generated as detailed previously. P-values were computed by comparing
observed to expected cluster sizes after 100,000 Monte Carlo randomizations, and corrected for the total
number of windows interrogated. Genome-wide significance was achieved for clusters with P-values
below 1.6x10⁻⁶.
BCA outcome interpretation
To build reference lists of genes associated with dominant developmental disorders we amalgamated
data from multiple large-scale exome sequencing, genome sequencing, or CNV studies investigating
developmental (e.g. DDD consortium) and neurodevelopmental disorders (mostly intellectual disability,
autism, and epilepsy cohorts; see Supplementary Note and Supplementary Table 6 for detailed
references). We then built our interpretation using standard categories comparable to those established
by ClinVar and the Deciphering Developmental Disorders consortium (DDD)43, as detailed below and in
Supplementary Table 7.
Pathogenic: Confirmed Loci associated with developmental disorders. Any gene with three or more
de novo LoF mutations (frameshift, nonsense or splice mutation, CNV, or BCA) reported from
independent cases in those amalgamated studies or in OMIM was considered as high confidence for a
particular phenotype, and any BCA impacting one of those loci was therefore considered to be
Pathogenic (Supplementary Table 9).
Likely Pathogenic: Novel candidate genes or mechanisms. To evaluate the impact of the remaining
BCAs and the genes they likely impacted, we relied on convergent genomic evidence from other large-
scale datasets to prioritize which gene would most likely contribute to the subject’s phenotype. Multiple
BCAs were considered to be Likely Pathogenic, based on various evidences (Supplementary Table
10):
(1) Disruption of a likely risk factor: Disruption of one copy of a gene in which one or two dnLoF
mutations had been previously reported and which demonstrated significant constraint (top 10% of
constrained genes)28,29
(2) Novel mechanisms: Disruption of a gene established as associated with dominant developmental
disorders yet with a distinct mutation type (e.g. activating or missense mutations while we reported LoF)
31
95
96
97
98
99
100
101
102
103
104
105
106
107
108
109
110
111
112
113
114
115
116
117
118
119
120
121
122
123
124
125

(3) Disruption of long-range interactions: BCA breakpoints located in the vicinity of a gene associated
with dominant developmental disorders in a subject with a consistent phenotype, and predicted to impact
long-range regulatory interactions.
VUS: All BCAs impacting genes not fitting in any of the above-mentioned categories were considered
as VUS.
Predicted disruption of contact domains by BCAs
Topological associated domains (TADs) and predicted loops for lymphoblastoid cells were retrieved
from Dixon et al. and Rao et al.17,58, and genes contained within a domain for which at least one of its
insulating boundaries was disrupted by a BCA were assessed. Only genes that had been previously
robustly associated with dominant developmental disorders (i.e., with dnLoF reported in three or more
subjects) were considered for potential positional effects. A detailed comparison of the reported
phenotypes in the corresponding subjects to phenotypes associated with disrupted genes in the literature
was performed. For subjects identified with a BCA of plausible positional effect, the region was
visualized using Juicebox83 (Supplementary Fig. 72-77). Heatmaps represent observed
intrachromosomal interactions in GM12878 lymphoblastoid cells in a specific window; previously
reported contact domains (regions of increased contact, not necessarily materializing as loops) and loops
(sites of increased focal contacts indicating the presence of a loop) were indicated17,58, as well as the
RefSeq genes located in the region.
Measuring gene expression from lymphoblasts
In subjects for whom the BCA was suspected to result in positional effects and for whom LCLs derived
from blood were available, gene expression was investigated by quantitative RT-PCR. LCLs were not
tested for mycoplasma contamination. Total RNA was extracted from LCLs using TRIzol® (Invitrogen)
followed by RNeasy Mini Kit (Qiagen) column purification. cDNA was synthetized from 750 ng of
extracted RNA using SuperScript® II Reverse Transcriptase (ThermoFisher Scientific with oligo(dT),
random hexamers, and RNase inhibitor. Quantitative RT-PCR was performed for mRNA expression of
genes of interest in the following subjects (MEF2C: DGAP131, DGAP191, DGAP218, DGAP222;
SATB2: DGAP237; SLC2A1: DGAP170; SRCAP: DGAP134) using custom designed primers (see
Supplementary Note). ACTB, GAPDH and POLR2A were each used as independent endogenous
controls. Custom designed primers (0.75 μM final), cDNA (1:100 final) and nuclease-free water were
added to the LightCycler® 480 SYBR Green I Master Mix (Roche) for a final 10 μL reaction volume. A
32
126
127
128
129
130
131
132
133
134
135
136
137
138
139
140
141
142
143
144
145
146
147
148
149
150
151
152
153
154
155
156
157
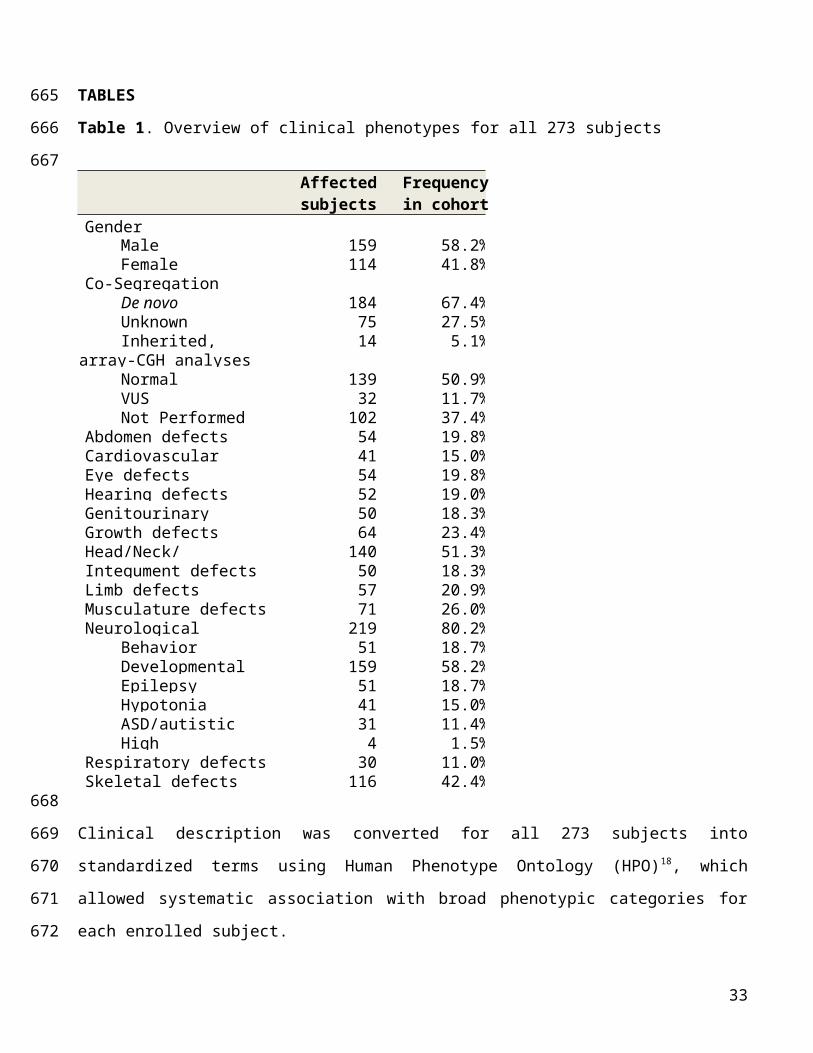
LightCycler® 480 (Roche) was used for data acquisition. Values of each individual (subject or control)
were obtained in triplicates of similar variance. Results of triplicates for each gene of interest were
normalized against the average of the three endogenous controls (ACTB, GAPDH and POLR2A).
Normalized expression levels were set in relation to eight age and sex-matched controls for the genes of
interest SATB2, SLC2A1 and SRCAP, or 16 (eight males, eight females) age-matched controls for the
gene of interest MEF2C, using the ΔΔCt method. Results are expressed as fold-change relative to the
averaged control individuals. The significance of differential gene expression from a subject in
comparison to controls was tested using a two-sided Wilcoxon Mann-Whitney test. All qRT-PCR results
were independently replicated twice in the laboratory.
METHODS-ONLY REFERENCES7. Talkowski, M.E. et al. Sequencing chromosomal abnormalities reveals neurodevelopmental
loci that confer risk across diagnostic boundaries. Cell 149, 525-537 (2012).11. Talkowski, M.E. et al. Clinical diagnosis by whole-genome sequencing of a prenatal sample.
N. Engl. J. Med. 367, 2226-2232 (2012).17. Rao, S.S. et al. A 3D map of the human genome at kilobase resolution reveals principles of
chromatin looping. Cell 159, 1665-1680 (2014).18. Kohler, S. et al. The Human Phenotype Ontology project: linking molecular biology and
disease through phenotype data. Nucleic Acids Res. 42, D966-974 (2014).22. Chiang, C. et al. Complex reorganization and predominant non-homologous repair
following chromosomal breakage in karyotypically balanced germline rearrangements and transgenic integration. Nat. Genet. 44, 390-397, S391 (2012).
26. Abyzov, A. et al. Analysis of deletion breakpoints from 1,092 humans reveals details of mutation mechanisms. Nat Commun 6, 7256 (2015).
28. Petrovski, S., Wang, Q., Heinzen, E.L., Allen, A.S. & Goldstein, D.B. Genic intolerance to functional variation and the interpretation of personal genomes. PLoS Genet 9, e1003709 (2013).
29. Samocha, K.E. et al. A framework for the interpretation of de novo mutation in human disease. Nat. Genet. 46, 944-950 (2014).
43. Landrum, M.J. et al. ClinVar: public archive of interpretations of clinically relevant variants. Nucleic Acids Res. 44, D862-868 (2016).
58. Dixon, J.R. et al. Topological domains in mammalian genomes identified by analysis of chromatin interactions. Nature 485, 376-380 (2012).
66. Deng, Y., Gao, L., Wang, B. & Guo, X. HPOSim: an R package for phenotypic similarity measure and enrichment analysis based on the human phenotype ontology. PLoS One 10, e0115692 (2015).
70. Brand, H. et al. Cryptic and complex chromosomal aberrations in early-onset neuropsychiatric disorders. Am. J. Hum. Genet. 95, 454-461 (2014).
76. Hanscom, C. & Talkowski, M. Design of large-insert jumping libraries for structural variant detection using illumina sequencing. Curr Protoc Hum Genet 80, 7 22 21-29 (2014).
77. Higgins, A.W. et al. Characterization of apparently balanced chromosomal rearrangements from the developmental genome anatomy project. Am. J. Hum. Genet. 82, 712-722 (2008).
33
158
159
160
161
162
163
164
165
166
167
168169170171172173174175176177178179180181182183184185186187188189190191192193194195196197198199
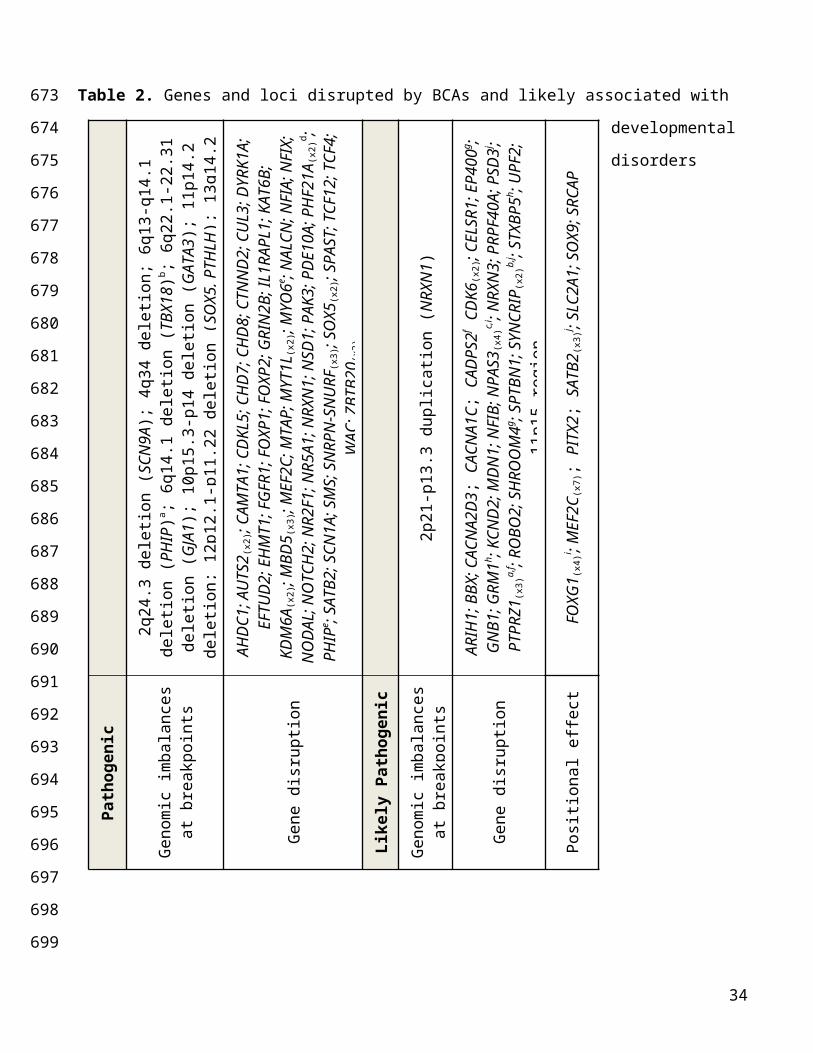
78. Kohler, S. et al. Clinical diagnostics in human genetics with semantic similarity searches in ontologies. Am. J. Hum. Genet. 85, 457-464 (2009).
79. Brand, H. et al. Paired-Duplication Signatures Mark Cryptic Inversions and Other Complex Structural Variation. Am. J. Hum. Genet. 97, 170-176 (2015).
80. Li, H. & Durbin, R. Fast and accurate short read alignment with Burrows-Wheeler transform. Bioinformatics 25, 1754-1760 (2009).
81. Tarasov, A., Vilella, A.J., Cuppen, E., Nijman, I.J. & Prins, P. Sambamba: fast processing of NGS alignment formats. Bioinformatics 31, 2032-2034 (2015).
82. North, B.V., Curtis, D. & Sham, P.C. A note on the calculation of empirical P values from Monte Carlo procedures. Am. J. Hum. Genet. 71, 439-441 (2002).
83. Durand, N.C. et al. Juicebox Provides a Visualization System for Hi-C Contact Maps with Unlimited Zoom. Cell Syst 3, 99-101 (2016).
34
200201202203204205206207208209210211212