UNITED Web viewSpecific requirements for inventories of equipment containing polychlorinated...
79
UNITED NATIONS BC UNEP/CHW.12/9/Add.1 Distr.: General 2 December 2014 Original: English Conference of the Parties to the Basel Convention on the Control of Transboundary Movements of Hazardous Wastes and Their Disposal Twelfth meeting Geneva, 4–15 May 2015 Item 4 (c) (i) of the provisional agenda Matters related to the implementation of the Convention: legal, compliance and governance matters: Committee for Administering the Mechanism for Promoting Implementation and Compliance of the Basel Convention Committee for Administering the Mechanism for Promoting Implementation and Compliance of the Basel Convention Methodological guide for the development of inventories of hazardous wastes and other wastes under the Basel Convention Note by the Secretariat As referred to in document UNEP/CHW.12/9, the annex to the present note sets out the methodological guide for the development of inventories of hazardous wastes and other wastes under the Basel Convention prepared by the Committee for Administering the Mechanism for Promoting Implementation and Compliance of the Basel Convention. UNEP/CHW.12/1. 180315
Transcript of UNITED Web viewSpecific requirements for inventories of equipment containing polychlorinated...
UNITEDNATIONS BC
UNEP/CHW.12/9/Add.1
Distr.: General2 December 2014
Original: English
Conference of the Parties to the Basel Conventionon the Control of Transboundary Movements ofHazardous Wastes and Their DisposalTwelfth meetingGeneva, 4–15 May 2015Item 4 (c) (i) of the provisional agenda
Matters related to the implementation of the Convention: legal, compliance and governance matters: Committee for Administering the Mechanism for Promoting Implementation and Compliance of the Basel Convention
Committee for Administering the Mechanism for Promoting Implementation and Compliance of the Basel Convention
Methodological guide for the development of inventories of hazardous wastes and other wastes under the Basel Convention
Note by the SecretariatAs referred to in document UNEP/CHW.12/9, the annex to the present note sets out the
methodological guide for the development of inventories of hazardous wastes and other wastes under the Basel Convention prepared by the Committee for Administering the Mechanism for Promoting Implementation and Compliance of the Basel Convention.
UNEP/CHW.12/1.
180315

UNEP/CHW.12/9/Add.1
Annex
Methodological guide for the development of inventories of hazardous wastes and other wastes under the Basel Convention
Contents
2

UNEP/CHW.12/9/Add.1
1. Introduction.................................................................................................................................................6
2. Objective and organization of the guide......................................................................................................6
3. National reporting under the Basel Convention..........................................................................................7
4. Roles and types of inventories.....................................................................................................................8
4.1 First generation inventories..................................................................................................................84.2 Second generation inventories.............................................................................................................84.3 Using inventory data for national reporting.......................................................................................11
5. Ten steps towards a national inventory....................................................................................................11
5.1 Step 1. Interpretation of definitions...................................................................................................13
5.1.1 Definition of waste.................................................................................................................145.1.2 Definition of hazardous waste................................................................................................145.1.3 Distinguishing between wastes and other releases.................................................................15
5.2 Step 2. Classification of waste streams.............................................................................................155.3 Step 3. Defining the scope of the inventory......................................................................................175.4 Step 4. Identifying major waste generators.......................................................................................175.5 Step 5. Collecting site-specific data..................................................................................................175.6 Step 6. Verifying site-specific data...................................................................................................185.7 Step 7. Calculating national summaries............................................................................................185.8 Step 8. Data on waste disposal and recovery....................................................................................185.9 Step 9. Data on import and export of hazardous wastes and other wastes.......................................195.10 Step 10. Assessment of results and conclusions...............................................................................20
6. Methods for calculating hazardous wastes generation in the manufacturing industry..............................20
7. Inventories of selected waste streams.......................................................................................................24
7.1 Introduction........................................................................................................................................247.2 Waste electrical and electronic equipment.........................................................................................257.3 Waste mineral oil and oily wastes......................................................................................................257.4 Household waste and residues from their incineration......................................................................25
7.4.1 Household wastes in the context of the Basel Convention....................................................257.4.2 Residues from the incineration of household waste...............................................................277.4.3 Household hazardous waste...................................................................................................27
7.5 Health-care waste...............................................................................................................................287.6 Small-scale industry and the informal sector.....................................................................................297.7 Accidental chemical or hazardous waste releases..............................................................................297.8 High volume, low hazard wastes.......................................................................................................30
8. Hazardous waste audits and case studies..................................................................................................30
8.1 Basic information...............................................................................................................................318.2 Input-output balances.........................................................................................................................318.3 Waste data..........................................................................................................................................318.4 Waste samples....................................................................................................................................318.5 Access to plant specific information..................................................................................................32
9. Inventories based on compliance monitoring...........................................................................................32
9.1 Challenges in inventories based on compliance monitoring..............................................................349.2 Challenges in quality control of hazardous waste databases.............................................................35
3
UNEP/CHW.12/9/Add.1
10. References..................................................................................................................................................35
AnnexesAnnex 1:Abstract of the revised format for national reporting ..........................................................................39
Annex 2: Examples of potentially hazardous waste streams..............................................................................40
Annex 3: Template for collecting waste data from generators in the industrial sector.......................................47
Annex 4: Case: PCB inventory from electric appliances....................................................................................51
Annex 5: Case: Household Survey and Waste Characterisation for Nukuhetulu, Tonga...................................54
List of figuresFigure 1: Role of first generation inventories in policy development...................................................................9
Figure 2: Interaction of second generation inventories with waste policy elements...........................................10
Figure 3: Ten steps towards a national inventory of hazardous and other wastes..............................................13
Figure 4: Roadmap for first generation inventories............................................................................................21
Figure 5: Roadmap for second generation inventories........................................................................................33
List of tablesTable 1: Examples of types of inventories..........................................................................................................10
Table 2: Examples of waste factors for some petrochemicals and plastic materials........Error! Bookmark not defined.Table 3: Other hazardous waste generating sectors............................................................................................24
Table 4: Waste generation factors for waste engine oils.....................................................................................25
Table 5: Current waste generation per capita and by region...............................................................................27
Table 6: Current waste generation per capita and by income level.....................................................................27
Table 7: Health-care wastes from a case study in Finland..................................................................................29
Table 8: Waste generation factors for tailings.....................................................................................................30
4

UNEP/CHW.12/9/Add.1
Acronyms and abbreviations
AMAP Arctic Monitoring and Assessment ProgrammeBREF Best Available Techniques Reference DocumentBCRC Basel Convention Regional CenterBCRC-SEA Basel Convention Regional Centre for South-East AsiaCOP Conference of the PartiesCPCB Central Pollution Control Board of IndiaDEFRA Department for Environment, Food & Rural Affairs of the United KingdomEPA Environmental Protection AgencyE-PRTR European Pollutant Release and Transfer RegisterESM Environmentally sound managementEU European UnionE-Waste Waste electrical and electronic equipmentGDP Gross domestic productGHS Globally Harmonized System of Classification and Labeling of ChemicalsHHW Household hazardous wasteHS Harmonized Commodity Description and Coding SystemICC Committee for Administering the Mechanism for Promoting Implementation and
Compliance with the Basel ConventionICT Information and communication technologyMAP Mediterranean Action PlanMSW Municipal solid wasteOECD Organisation for Economic Co-operation and DevelopmentOEWG Open-ended working groupPCB Polychlorinated biphenylPCT Polychlorinated terphenylPRTR Pollution release and transfer registerPVC Polyvinyl chlorideSBC Secretariat of the Basel ConventionUSA United States of AmericaMSDS Material safety sata sheetsWCO World Customs OrganizationWHO World Health Organization
5

UNEP/CHW.12/9/Add.1
1. Introduction1. Parties to the Basel Convention are required under Article 13, paragraph 3, of the Convention to transmit each year to the Conference of the Parties, through the Secretariat, information concerning the measures they have taken towards its implementation and certain other information related to the subject matter of the Convention. In order to assist parties to comply with their reporting obligations, the Committee for Administering the Mechanism for Promoting Implementation and Compliance with the Convention (hereinafter “the Committee”) has, over the years, been mandated by the Conference of the Parties to undertake a number of activities to encourage timely and complete national reporting. The present guidance, initiated under the 2012-2013 work programme of the Committee and finalized in the framework of the Committee’s 2014-2015 work programme (contained in annexes to Decisions BC-10/11 and BC-11/8, respectively), is intended to support and complement these activities.
2. In particular, this document, which supersedes the “Methodological Guide for Undertaking National Inventories under the Basel Convention” of May 2000, should be used in conjunction with the “Guidance Document on Improving National Reporting by Parties to the Basel Convention” (UNEP/CHW.10/INF/11), published by the Committee in September 2009. The “Guidance Document on Improving National Reporting”, which is aimed at assisting national technical officials with the preparation of the reports that are to be submitted annually to the Secretariat of the Basel Convention (hereinafter “SBC”), addresses the various elements that should be considered in establishing mechanisms for coordination and for gathering information for national reporting. One of these elements, and the subject of this guide, is the undertaking of inventories to get information on the status of the generation, transboundary movements and management of hazardous wastes and other wastes in the country.
3. The Conference of the Parties has noted that the level of reporting appears to be declining, and that lower levels of reporting occur in relation to data on the generation of hazardous and other wastes. The problem of non-reporting, incomplete reporting or late reporting, has been acknowledged by the Conference of the Parties as being all the more serious because of the close link between the core obligations of the Convention and the obligation to submit national reports in accordance with paragraph 3 of Article 13 of the Convention. Among the difficulties encountered by parties in submitting information is the lack of availability of data and information (e.g. lack of inventory). This guide therefore aims to provide guidance to the Basel Convention Competent Authorities and other stakeholders on the methods of developing national inventories for the preparation of the annual national reports.
4. This document takes into consideration the Guidance Document on the Preparation of Technical Guidelines for the Environmentally Sound Management of Wastes Subject to the Basel Convention (SBC, 1994). Also taken into account are the projects conducted by the Basel Convention Regional Centres (hereinafter “BCRC”), especially the outcomes of the National Inventories of Hazardous Waste Demonstration Project in the Philippines carried out by the BCRC for South-East Asia (BCRC-SEA, 2005; Hasanuddin Suraadiningrat, 2005) and the methodological guide produced by the BCRC-Egypt (2007). Comments from parties, the Secretariat and other stakeholders were also taken into consideration.
5. Inventories of hazardous and other wastes should be seen as a tool for implementing the objectives of the Basel Convention through a national or a regional waste strategy. The conducting of inventories should be streamlined with the process of developing national policies, legislation, planning and implementation of environmentally sound management of hazardous waste and hazardous chemicals.
6. The development of this guidance document was made possible thanks to the financial support provided by the European Union.
2. Objective and organization of the guide7. The main objective of the guide is to assist parties where no statistical data are collected for the purpose of fulfilling their reporting obligations under the Basel Convention, as regards national inventories of hazardous wastes and other wastes. This guide focuses on the actions required to develop national information systems that produce the information needed to fulfill national reporting obligations.
8. Conducting inventories of hazardous wastes and other wastes requires interplay between legislation development, compliance monitoring and enforcement, and the planning and implementation of disposal options to fulfil the principles of environmentally sound management of waste. The officials, consultants or academics who are conducting the practical work of compiling and interpreting the inventories are expected to benefit from the guide. Furthermore the document intends to promote the exchange of good methodological practices and the benchmarking of specific generation of waste from prioritized sectors between all Parties.
6

UNEP/CHW.12/9/Add.1
9. Those Parties to the Basel Convention that have not been able to report their waste inventory to the Secretariat can use this guide to produce the statistics that are needed to submit the first national report.
10. Chapter 3 of this document summarizes annual reporting requirements under the Basel Convention. Chapter 4 describes different types of inventories and suggests roles that the inventory findings can play in developing a national waste policy. The chapter discusses the policy elements that should be in place to enable credible inventories. Chapter 5 provides a road map for conducting a first national inventory of hazardous wastes and other wastes. It discusses some of the challenges commonly faced during each step, presents case stories from several countries, provides guidance and proposes good practices in overcoming the common obstacles. Chapter 6 goes deeper into the process of conducting a first generation inventory of wastes generated in the manufacturing industry and chapter 7 deals with other selected hazardous waste streams and briefly covers also the inventory and reporting of “other wastes” under the Basel Convention. Chapters 8 and 9 dip into the challenges of field work of waste inventories. Chapter 8 provides guidance in conducting waste audits in industrial facilities and chapter 9 focuses on compliance monitoring which is the basis of regularly updated inventories.
3. National reporting under the Basel Convention11. In order to enable monitoring of the implementation of the Basel Convention by its Parties, article 13, paragraph 3, of the Basel Convention establishes that the Parties shall transmit, through the Secretariat, before the end of each calendar year, to the Conference of the Parties, a report on the previous calendar year containing the following information:
(a) Competent authorities and focal points that have been designated by them pursuant to Article 5;
(b) Information regarding transboundary movements of hazardous wastes or other wastes in which they have been involved, including:
(i) The amount of hazardous wastes and other wastes exported, their category, characteristics, destination, any transit country and disposal method as stated on the response to notification;
(ii) The amount of hazardous wastes and other wastes imported their category, characteristics, origin, and disposal methods;
(iii) Disposals which did not proceed as intended;
(iv) Efforts to achieve a reduction of the amount of hazardous wastes or other wastes subject to transboundary movement;
(c) Information on the measures adopted by them in implementation of this Convention;
(d) Information on available qualified statistics which have been compiled by them on the effects on human health and the environment of the generation, transportation and disposal of hazardous wastes or other wastes;
(e) Information concerning bilateral, multilateral and regional agreements and arrangements entered into pursuant to Article 11 of this Convention;
(f) Information on accidents occurring during the transboundary movement and disposal of hazardous wastes and other wastes and on the measures undertaken to deal with them;
(g) Information on disposal options operated within the area of their national jurisdiction;
(h) Information on measures undertaken for development of technologies for the reduction and/or elimination of production of hazardous wastes and other wastes; and
(i) Such other matters as the Conference of the Parties shall deem relevant.
12. To facilitate the transmission of such information, the Conference of the Parties at its twelfth meeting, by its decision [BC-12/XX], adopted a revised format for national reporting
13. The format consists of [Note: short description of the format to be added by the ICC following COP12] This guide aims to assist Parties in building the information needed to complete the tables of the revised format for nationa reporting that pertain to the generation and the transboundary movements of wastes.
7

UNEP/CHW.12/9/Add.1
14. As national reporting has been a major concern by Parties in fulfilling the obligations of the Basel Convention, following its seventh session, and under the mandate provided by decision VIII/32, the Implementation and Compliance Committee adopted the “Guidance Document on Improving National Reporting” aimed at assisting with the preparation of the national reports that are to be submitted annually to the SBC (ICC, 2009). Subsequently, the Committee developed a "benchmark report” to demonstrate what a national report submitted in accordance with Article 13, paragraph 3, might ideally look like, and to give some advice on what to avoid when preparing the national report (ICC, 2011). The Conference of the Parties, during its tenth meeting, took note of the “benchmark report” and encouraged parties to use it (decision BC-10/11). These guidance documents are expected to be updated as appropriate in furtherance to the adoption of the revised format for national repoting by the twelfth meeting of the Conference of the Parties.
15. Implementation and compliance with the national reporting obligation under paragraph 3 of Article 13 of the Convention is linked to parties’ implementation and compliance of other obligations under the Basel Convention (e.g. those obligations set out in paragraph 4 of Article 4, paragraph 5 of Article 9 and Article 5). Improving implementation and compliance with the national reporting obligation thus requires adequate implementation and compliance with other provisions of the Convention. Whereas under some treaties, a party may fulfil its obligation to report without having fulfilled its other obligations under the treaty, this would be difficult in the case of the Basel Convention, because fulfilling the reporting obligation entails fulfilment of certain other key obligations under the Convention. For example, it is not possible to report on the quantities of hazardous materials that have been imported or exported unless a system has been put in place to monitor this. This close connection between the reporting obligation under Article 13 and the main substantive obligations under the Convention also raises the possibility that a Party’s failure to fulfil the reporting obligation may reflect a more general failure to implement the Convention.
4. Roles and types of inventories
4.1 First generation inventories16. The role of a national inventory of hazardous wastes and other wastes depends on the stage of development of national policies. In the early stages of development, inventories are often created using basic calculations of waste generation and a review of management practices aiming at identifying priority waste streams and sources, main risks, main players, service and investment needs etc. Such inventories are named first generation inventories in this document.
17. Before a system for collecting site specific data from the main hazardous waste generators is in place, such ad hoc studies and engineering calculations may be the only way of producing the information basis for setting priorities for waste policy and for the planning of the waste management infrastructure.
18. Experiences from first generation inventories should be used to identify development needs in the different elements of the national waste strategy. Figure 1 demonstrates how the outputs of inventories can feed into the development of national waste policy.
4.2 Second generation inventories19. In a more advanced stage when a national system is in place with detailed waste legislation, licensing and enforcement it is the self-monitoring and compliance monitoring system that produces data for annual inventories. These second generation inventories could be updated annually or compiled to answer specific questions. The basis for annually updated inventories could be the monitoring obligation of the nationally regulated stakeholders.
8

UNEP/CHW.12/9/Add.1
Figure 1: Role of first generation inventories in policy development
Inventory Outputs
Estimation of total quantity of hazardous wastes and other wastes generated per year, and number of hazardous waste generating sources and their associated risks.
Identification of main types of hazardous wastes and other wastes generated, and gaps in available services.
Identification of main sectors generating of hazardous wastes and other wastes.
Detection of problems with the identification and classification of hazardous wastes and other wastes.
Estimation of generation of the main waste categories.
Policy Elements
Development of legislation and administrative measures.
Development of waste management infrastructure.
Priority setting for regulation and inspection.
Development of legislation, guidelines and standards.
National compliance with reporting obligations under various international instruments.
Con
tribu
tion
to th
e de
velo
pmen
t and
impl
emen
tatio
n of
a n
atio
nal p
olic
y fo
rha
zard
ous w
aste
s and
oth
er w
aste
s
20. For example in the European Union (EU), waste installations are required to obtain permits for their operations (with certain possibilities for exemptions regarding non-hazardous waste and waste recovery). These waste installations as well as the generators, collectors, transporters, dealers and brokers of hazardous waste must keep chronological records of, inter alia, the quantity, nature and origin of the waste and make this information available on request to the Competent Authorities (Articles 23-26 and 35 of the EU Waste Framework Directive 2008/98/EC, OJ L 312, 22.11.2008, p. 3). For hazardous waste, the records shall be preserved for at least three years except in the case of establishments and undertakings transporting hazardous waste which must keep such records for at least 12 months. Documentary evidence that the management operations have been carried out shall be supplied at the request of the Competent Authorities or of a previous holder. Specific requirements for inventories of equipment containing polychlorinated biphenyls (PCBs) and polychlorinated Terphenyls (PCTs) are laid down in EU Directive 96/59/EC, OJ L 243, 24.9.1996, p. 31, including simplified inventories for equipment slightly contaminated by PCBs and PCTs.1
21. Chapter 5 presents the steps for second generation inventories. Certain elements of waste policy have to be in place to enable relevant inventories. On the other hand the findings of inventories can be used for the evaluation of policy interventions and to identify compliance gaps as shown in figure 2.
1 See submission of the EU and its member States, 13 August 2013, available at: http://www.basel.int/Implementation/LegalMatters/Compliance/GeneralIssuesActivities/Activities201213/GuidanceonInventories/tabid/3194/Default.aspx
9

UNEP/CHW.12/9/Add.1
Figure 2: Interaction of second generation inventories with waste policy elements
Preconditions for Second GenerationInventories
Hazardous waste legislation, waste classification, guidelines; regulations for hazardous materials.
Administrative procedures; system for registration, licensing and compliance monitoring.
Waste management infrastructure.
Industry awareness, motivation and training; self-monitoring practices and guidelines.
Assessment ofPolicy Interventions
Data from inspections.
Data on waste reception and disposal facilities.
Data on generation and disposal of hazardous and other wastes.
Feedback on Legislationand Enforcement
Inventories based on site-specific reporting and compliance monitoring.
22. In the intermediate phase, when moving from first to second generation inventories, a combination of both methodologies are used. In addition, project type surveys are needed to analyze specific waste streams or product chains.
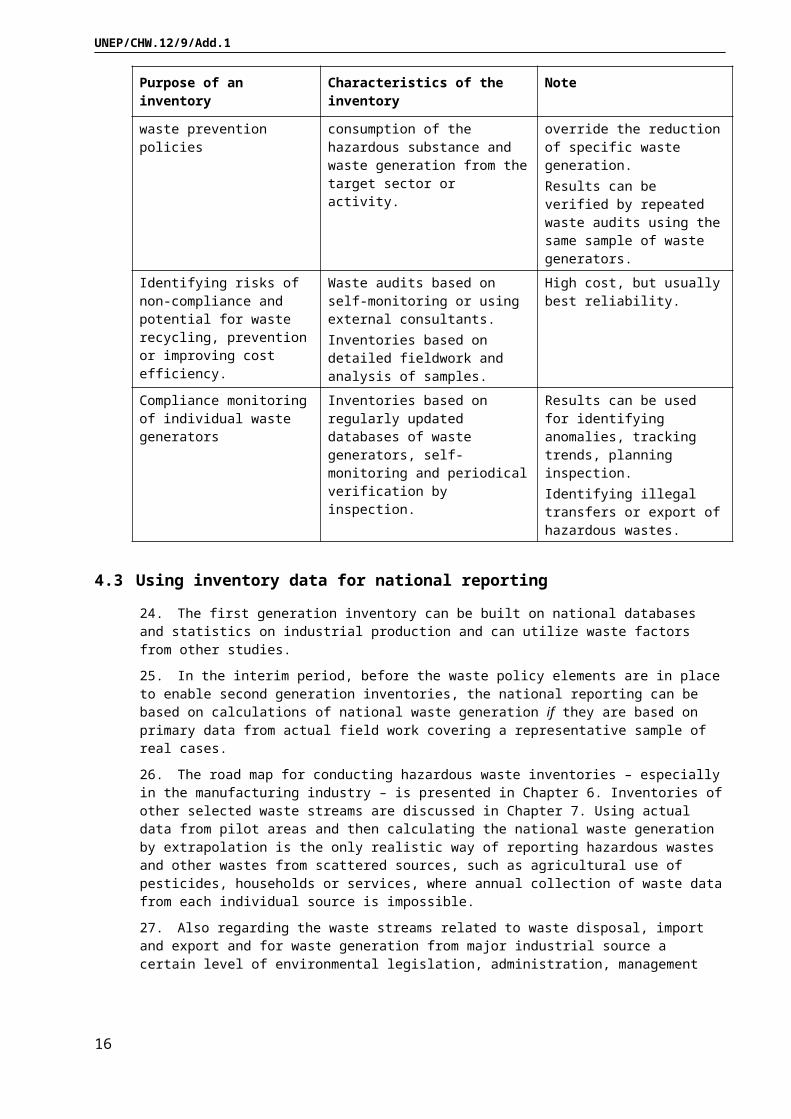
23. The methodology, scope, degree of detail and the format of presenting the results of a waste inventory depend on the intended use. This is reflected in table 1 with examples of typical motivations for commissioning waste inventories. The order of presentation also represents the typical evolutionary course of different types of inventories. The permanently updated database of annual waste reports, verified by regular inspections is the ultimate stage that is most detailed and can be used for multiple purposes, including enforcement actions.
Table 1: Examples of types of inventories
Purpose of an inventory Characteristics of the inventory Note
Justifying policy action on a general level
Order of magnitude estimates to verify that the problem exists and should be addressed
Classification of wastes can be on a very general level and estimates based on rough emission factors or only identifying the major waste groups.
Identifying priorities and policy gaps during the life cycle of hazardous waste. Planning of economic instruments e.g. polluter pays principle.
Screening of most significant waste streams and disposal sites.Identify waste groups imposing the most urgent risks.Tentative listing of the largest generators in each sector.Identify key stakeholders in the relevant sectors.
The inventory can reveal gaps in the legislation, in the classification of wastes as hazardous, management capacity, awareness of waste generators etc.Quantitative accuracy is not so relevant.
10
UNEP/CHW.12/9/Add.1
Purpose of an inventory Characteristics of the inventory Note
Planning of service and investment needs
Order of magnitude estimates of main waste groups.Rough geographical breakdown of generated waste quantities.Grouping of waste types by main disposal options (e.g. potentially treatable at landfills, incinerators, recyclable).
Inventories can be conducted in phases starting from regions with big or large numbers of waste generators or starting with wastes applicable for disposal or disposal of a specific type.
Planning of services for specific waste types
Inventories can be based on the consumption of products generating the specific waste type, such as e-waste, batteries, vehicles, PVC products, lubricating oil etc.
Import and export statistics are an important part of such inventories.
Evaluating the effectiveness of waste prevention policies
Inventories focusing on tracking the change in consumption of the hazardous substance and waste generation from the target sector or activity.
Growth of the target sector can easily override the reduction of specific waste generation.Results can be verified by repeated waste audits using the same sample of waste generators.
Identifying risks of non-compliance and potential for waste recycling, prevention or improving cost efficiency.
Waste audits based on self-monitoring or using external consultants.Inventories based on detailed fieldwork and analysis of samples.
High cost, but usually best reliability.
Compliance monitoring of individual waste generators
Inventories based on regularly updated databases of waste generators, self-monitoring and periodical verification by inspection.
Results can be used for identifying anomalies, tracking trends, planning inspection.Identifying illegal transfers or export of hazardous wastes.
4.3 Using inventory data for national reporting
24. The first generation inventory can be built on national databases and statistics on industrial production and can utilize waste factors from other studies.
25. In the interim period, before the waste policy elements are in place to enable second generation inventories, the national reporting can be based on calculations of national waste generation if they are based on primary data from actual field work covering a representative sample of real cases.
26. The road map for conducting hazardous waste inventories – especially in the manufacturing industry – is presented in Chapter 6. Inventories of other selected waste streams are discussed in Chapter 7. Using actual data from pilot areas and then calculating the national waste generation by extrapolation is the only realistic way of reporting hazardous wastes and other wastes from scattered sources, such as agricultural use of pesticides, households or services, where annual collection of waste data from each individual source is impossible.
27. Also regarding the waste streams related to waste disposal, import and export and for waste generation from major industrial source a certain level of environmental legislation, administration, management and control must be in place to produce the site and waste typed specific data that is necessary to fulfill the reporting requirements.
5. Ten steps towards a national inventory28. This chapter is intended to assist parties in the production of waste statistics for the purpose of national reporting under the Convention, guiding the reader through the usual challenges of preparing a national or regional inventory of hazardous and other wastes, and proposing solutions to some of the problems that might be encountered.
11
UNEP/CHW.12/9/Add.1
29. In cases where an inventory needs to be conducted at an early stage prior to the development of appropriate legislation or the adoption of a national definition for hazardous waste, the organization undertaking the preparation of the inventory will have to make certain assumptions that will influence the outcome of the inventory much more than the actual field work. It is advised that the development of the inventory be undertaken by an interagency task force bringing together representatives of key stakeholders. In addition survey teams will need to be established for the purpose of organizing the collection of primary data from generators. These teams should have a good level of understanding of the waste classification system under the Convention and of its relationship (correlation) with the national waste classification system if one is place.
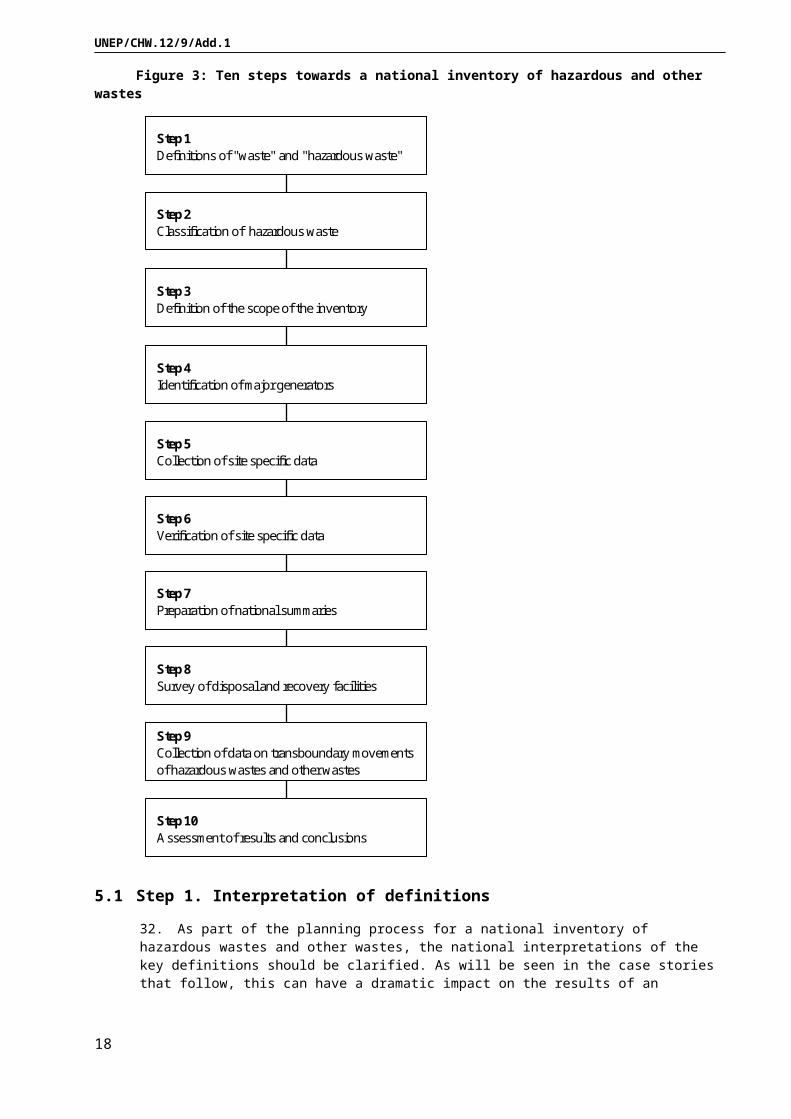
30. Depending on the national context, the steps toward building a national inventory (outlined in figure 3) will vary to some extent according to national legislation and enforcement policies, institutional capacities, and information management.
31. Although this chapter is mainly oriented towards inventories of hazardous waste from industrial sources, many of the steps can be applied to wastes from other sources as well.
12

UNEP/CHW.12/9/Add.1
Figure 3: Ten steps towards a national inventory of hazardous and other wastes
Step 10Assessment of results and conclusions
Step 1Definitions of "waste" and "hazardous waste"
Step 2Classification of hazardous waste
Step 3Definition of the scope of the inventory
Step 4Identification of major generators
Step 5Collection of site specific data
Step 6Verification of site specific data
Step 7Preparation of national summaries
Step 8Survey of disposal and recovery facilities
Step 9Collection of data on transboundary movements of hazardous wastes and other wastes
5.1 Step 1. Interpretation of definitions
32. As part of the planning process for a national inventory of hazardous wastes and other wastes, the national interpretations of the key definitions should be clarified. As will be seen in the case stories that follow, this can have a dramatic impact on the results of an inventory. The following basic questions must be answered before the survey can be launched:
(a) What substances or objects will be defined as wastes?
(b) How to determine whether a waste is hazardous or not?
13

UNEP/CHW.12/9/Add.1
(c) When to consider emissions to the wastewater as hazardous wastes?
5.1.1 Definition of waste
33. The Convention defines waste as “substances or objects which are disposed of or are intended to be disposed of or are required to be disposed of by the provisions of national law” (Article 2, paragraph 1). It defines disposal in Article 2, paragraph 4, as “any operation specified in Annex IV to this Convention”. It is important to note that national provisions concerning the definition of waste may differ and, therefore, the same material may be regarded as waste in one country but as non-waste in another country.
34. The interpretation of “waste/non-waste” is critical to determining whether a material is a hazardous waste, and thus subject to provisions of the Convention. However, determining whether a substance or object is or not a waste may not always be straightforward. Ultimately it is the responsibility of the national Competent Authority on waste (e.g. Ministry of Environment, Ministry of Health) to decide when a substance or object is to be defined as waste or non-waste. A substance or object may be considered a waste despite its economic value (e.g. used oil, used lead-acid batteries). Further work on clarifying this matter under the Basel Convention is in progress.1
35. The principles governing the definition of waste at the national level should be known and communicated before the field work towards the development of the inventory is initiated.
5.1.2 Definition of hazardous waste
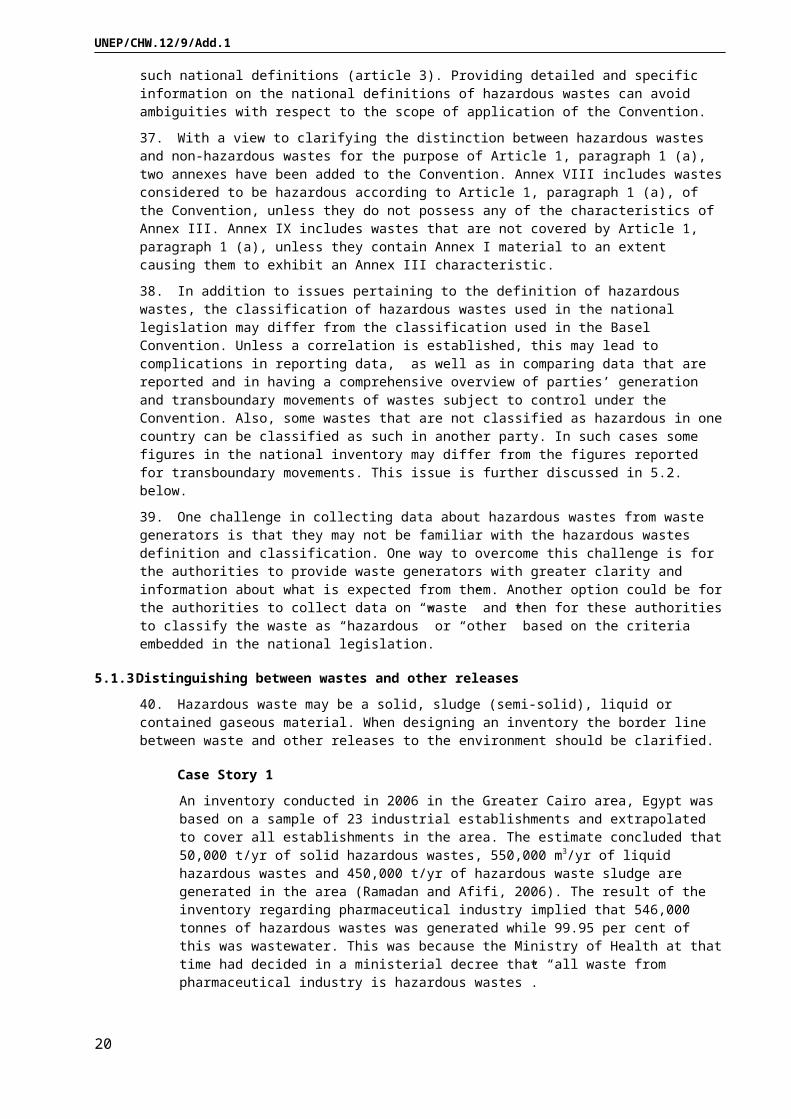
36. Hazardous wastes are defined in the Convention as “wastes that belong to any category contained in Annex I, unless they do not possess any of the characteristics contained in Annex III” (Article 1, paragraph 1(a)), and as “wastes that are not covered under paragraph 1(a) but are defined as, or considered to be, hazardous wastes by the domestic legislation of the party of export, import or transit” (Article 1, paragraph 1(b)). The definition of hazardous wastes therefore incorporates possible nationally defined or considered hazardous wastes, and the Convention requires that parties making use of this possibility inform the other parties, through the Secretariat of the Convention, of such national definitions (article 3). Providing detailed and specific information on the national definitions of hazardous wastes can avoid ambiguities with respect to the scope of application of the Convention.
37. With a view to clarifying the distinction between hazardous wastes and non-hazardous wastes for the purpose of Article 1, paragraph 1 (a), two annexes have been added to the Convention. Annex VIII includes wastes considered to be hazardous according to Article 1, paragraph 1 (a), of the Convention, unless they do not possess any of the characteristics of Annex III. Annex IX includes wastes that are not covered by Article 1, paragraph 1 (a), unless they contain Annex I material to an extent causing them to exhibit an Annex III characteristic.
38. In addition to issues pertaining to the definition of hazardous wastes, the classification of hazardous wastes used in the national legislation may differ from the classification used in the Basel Convention. Unless a correlation is established, this may lead to complications in reporting data, as well as in comparing data that are reported and in having a comprehensive overview of parties’ generation and transboundary movements of wastes subject to control under the Convention. Also, some wastes that are not classified as hazardous in one country can be classified as such in another party. In such cases some figures in the national inventory may differ from the figures reported for transboundary movements. This issue is further discussed in 5.2. below.
39. One challenge in collecting data about hazardous wastes from waste generators is that they may not be familiar with the hazardous wastes definition and classification. One way to overcome this challenge is for the authorities to provide waste generators with greater clarity and information about what is expected from them. Another option could be for the authorities to collect data on “waste” and then for these authorities to classify the waste as “hazardous” or “other” based on the criteria embedded in the national legislation.
5.1.3 Distinguishing between wastes and other releases
40. Hazardous waste may be a solid, sludge (semi-solid), liquid or contained gaseous material. When designing an inventory the border line between waste and other releases to the environment should be clarified.
1 Development of “technical guidelines on transboundary movements of e-waste and used electrical and electronic equipment, in particular regarding the distinction between waste and non-waste under the Basel Convention” (http://www.basel.int/Implementation/TechnicalMatters/DevelopmentofTechnicalGuidelines/Ewaste/tabid/2377/Default.aspx) and development of a glossary of terms to improve legal clarity (http://www.basel.int/Implementation/LegalMatters/LegalClarity/tabid/3621/Default.aspx)
14

UNEP/CHW.12/9/Add.1
Case Story 1
An inventory conducted in 2006 in the Greater Cairo area, Egypt was based on a sample of 23 industrial establishments and extrapolated to cover all establishments in the area. The estimate concluded that 50,000 t/yr of solid hazardous wastes, 550,000 m3/yr of liquid hazardous wastes and 450,000 t/yr of hazardous waste sludge are generated in the area (Ramadan and Afifi, 2006). The result of the inventory regarding pharmaceutical industry implied that 546,000 tonnes of hazardous wastes was generated while 99.95 per cent of this was wastewater. This was because the Ministry of Health at that time had decided in a ministerial decree that “all waste from pharmaceutical industry is hazardous wastes”.
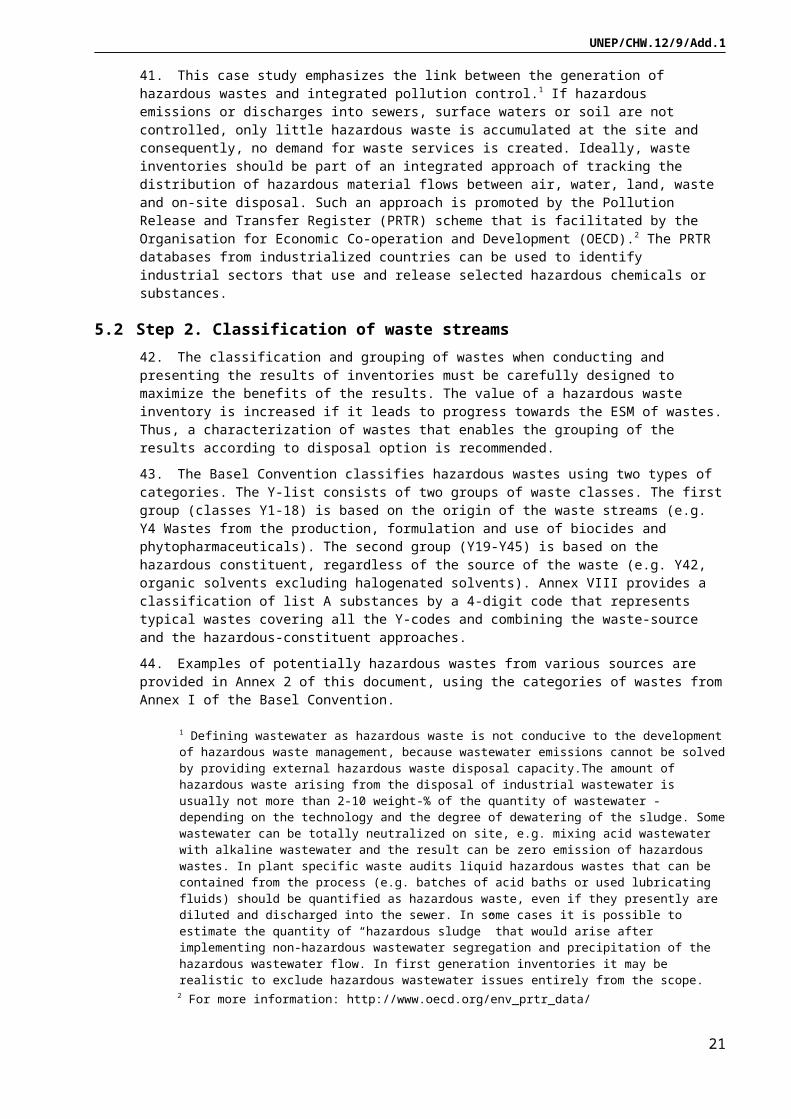
41. This case study emphasizes the link between the generation of hazardous wastes and integrated pollution control.1 If hazardous emissions or discharges into sewers, surface waters or soil are not controlled, only little hazardous waste is accumulated at the site and consequently, no demand for waste services is created. Ideally, waste inventories should be part of an integrated approach of tracking the distribution of hazardous material flows between air, water, land, waste and on-site disposal. Such an approach is promoted by the Pollution Release and Transfer Register (PRTR) scheme that is facilitated by the Organisation for Economic Co-operation and Development (OECD).2 The PRTR databases from industrialized countries can be used to identify industrial sectors that use and release selected hazardous chemicals or substances.
5.2 Step 2. Classification of waste streams42. The classification and grouping of wastes when conducting and presenting the results of inventories must be carefully designed to maximize the benefits of the results. The value of a hazardous waste inventory is increased if it leads to progress towards the ESM of wastes. Thus, a characterization of wastes that enables the grouping of the results according to disposal option is recommended.
43. The Basel Convention classifies hazardous wastes using two types of categories. The Y-list consists of two groups of waste classes. The first group (classes Y1-18) is based on the origin of the waste streams (e.g. Y4 Wastes from the production, formulation and use of biocides and phytopharmaceuticals). The second group (Y19-Y45) is based on the hazardous constituent, regardless of the source of the waste (e.g. Y42, organic solvents excluding halogenated solvents). Annex VIII provides a classification of list A substances by a 4-digit code that represents typical wastes covering all the Y-codes and combining the waste-source and the hazardous-constituent approaches.
44. Examples of potentially hazardous wastes from various sources are provided in Annex 2 of this document, using the categories of wastes from Annex I of the Basel Convention.
45. The Basel Convention, EU legislation and individual national classification systems use different systems in the classification of wastes and hazardous wastes. Most of the classes can find matching classes in the Basel Convention system, but in many cases a full match cannot be achieved. This is the reason why only few countries can report their hazardous wastes generation by Y-classes in [table 8B]. For example, in the EU system, the two and four digit level categories are based on the economic sectors that generate the waste. The hazardous wastes are distinguished from non-hazardous “mirror” wastes at the six digit level. Many of these hazardous wastes classes could match with at least two Y-codes: one matching with the class categorized by source and one with the matching hazardous constituent. Each Party should establish its practice of harmonizing its waste classification with the classification required in the revised reporting format. At its eleventh meeting, the Conference of the Parties requested the Secretariat and the Basel Convention regional and coordinating centres, by decision BC-11/8, to assist parties, upon request, in establishing compatibility between their national classification systems and the classification system of the Basel Convention. There may be alternative ways of matching a national waste class with the Basel Convention system, but the main principle is to be consistent in using the same interpretation from year to year. Justified changes in the
1 Defining wastewater as hazardous waste is not conducive to the development of hazardous waste management, because wastewater emissions cannot be solved by providing external hazardous waste disposal capacity.The amount of hazardous waste arising from the disposal of industrial wastewater is usually not more than 2-10 weight-% of the quantity of wastewater - depending on the technology and the degree of dewatering of the sludge. Some wastewater can be totally neutralized on site, e.g. mixing acid wastewater with alkaline wastewater and the result can be zero emission of hazardous wastes. In plant specific waste audits liquid hazardous wastes that can be contained from the process (e.g. batches of acid baths or used lubricating fluids) should be quantified as hazardous waste, even if they presently are diluted and discharged into the sewer. In some cases it is possible to estimate the quantity of “hazardous sludge” that would arise after implementing non-hazardous wastewater segregation and precipitation of the hazardous wastewater flow. In first generation inventories it may be realistic to exclude hazardous wastewater issues entirely from the scope.
2 For more information: http://www.oecd.org/env_prtr_data/
15
UNEP/CHW.12/9/Add.1
interpretation should be mentioned in the accompanying letter, or in the remarks transmitted with the national report.
46. If the inventory is planned before the national classification is enacted, the task force has to choose which international system to follow. The benefit of using a classification based on the economic sector is that emission factors can be calculated by combining the inventory results with economic statistics. This will provide an indicator of “waste intensity” (kg of waste per $ of GDP of the selected sector) that can be monitored as an indication of progress in waste prevention. Interventions are often most effective when targeting specific waste streams one at a time. On the other hand, if wastes are classified only by the source sector, then it would be difficult to group the results in a way that supports the planning of disposal capacity. For example a specific waste type (e.g. mineral waste, acid, oily waste or solvent) can arise from several industrial sectors, but can be disposed of or recycled together. Classification criteria should promote grouping the results into pragmatic groups. The difference is illustrated by comparing case stories 2 and 3.
Case Story 2
A national inventory conducted in Egypt classified hazardous wastes into three groups: solid hazardous wastes, sludge hazardous wastes and liquid hazardous wastes. Also the quantity of hazardous wastes packaging was estimated separately. The results could not be used for any estimation of the needed disposal capacity, because no distinction was made on whether the waste was mainly organic (usually suitable for incineration) or inorganic (mostly suitable for landfill disposal).
Case Story 3
The national inventory in India routinely uses grouping into three groups: “land disposable hazardous wastes”, “incinerable hazardous wastes” and “recyclable hazardous wastes”. In 2007-2008, 49.55 per cent of all hazardous wastes was recyclable according to the inventory, 6.67 per cent was incinerable and 43.78 per cent land disposable (Verma, 2009). Such a grouping is useful in estimating the regional need of hazardous wastes landfills and incineration capacity. The classification into the landfill disposable class is determined by analysis of the total organic content or volatile substance content. In practice it is not easy to assess if it is feasible to recycle a waste or not without conducting detailed analysis and market studies. However, this approach to classification is useful because it encourages conclusions and action about disposal capacity.
47. The Basel Convention classification system includes many cross-references to the list B wastes. All international and national classification systems require trained users. When collecting primary data from the industry it may be too challenging to require them to use the Basel Convention classification in reporting their wastes. As suggested earlier, it may be advisable that the experts in the inventory task force would be responsible of the classification, based on primary information provided by the informants. Any questionnaire for collecting waste data from generators should direct the respondents to provide enough information for the classification, e.g. by asking about the source of the waste and the hazardous substances in the waste. Unfortunately, the questionnaires cannot be very detailed and specific to different waste types. The questionnaire needs to be sufficiently detailed in order to be accurate but also needs to be practical in terms of work load requirements, as well as take into account the know-how required from the respondent. It is good practice to keep the questionnaires relatively simple and to amend the information through more detailed interviews of a sample of respondents.
48. When classifying waste generators according to their economic activities sector, the national statistical system is used. The use of the latest revision of the International Standard Industrial Classification (ISIC) of All Economic Activities is recommended when reporting to the SBC (United Nations, 2008). 4-digit classes should be used when possible because at this level there is some similarity in the industrial processes that generate waste (e.g. 2422 Manufacture of paints, varnishes and similar coatings, printing ink and mastics).
49. On the other hand, the number of waste factors needed to cover all 4-digit classes is easily overwhelming. In order-of-magnitude inventories the use of 2-digit or 3-digit classes (e.g. 241 Manufacture of basic chemicals or 24 Manufacture of chemicals and chemical products) may have to be used for pragmatic reasons.
50. The classification in Annex IV to the Basel Convention should be used in the classification of the disposal and recycling methods. In addition, national interpretations and subclasses may be needed.
5.3 Step 3. Defining the scope of the inventory51. Under the Basel Convention, Parties must report all hazardous wastes and others wastes generated. The scoping and implementation plan for the inventory should answer at least the following questions:
16

UNEP/CHW.12/9/Add.1
(a) Waste streams to be covered;
(b) Geographical area to be covered;
(c) Specific exclusions from the scope;
(d) Level of classification of waste generating facilities (level of ISIC code or corresponding);
(e) The system and the level of classification of hazardous wastes and other wastes, and harmonization between the national and Basel codes.
52. In a worst case scenario, the budget of the inventory project will be decisive in deciding the scope and depth of the survey. The existing information base and the support available from the compliance monitoring authorities are other major factors.
5.4 Step 4. Identifying major waste generators53. A database of industrial establishments and other generators of waste streams is at the core of the waste inventory development. In countries with advanced environmental administration the environmental licence and inspection databases provide the natural starting point for establishing hazardous wastes. In less developed countries other information systems can be utilized. The Ministry of Industry and its regional branches usually have lists of industrial establishments based on their mandate to register or issue licences to these establishments. The databases of sector ministries can be used to identify probable major sources of hazardous wastes which then can be targeted for environmental permitting procedures or waste inventory surveys. These databases can offer some basic data for hazardous wastes inventories such as location, industrial sector, the year of establishment, production capacity and number of employees. The information can be obsolete if it has not been updated since the first registration. Production capacity figures often do not reflect actual production rates.
54. Often, several ministries have to be consulted, because the mining, pharmaceutical, petroleum, energy, military industry and sometimes food processing sectors may be under the jurisdiction of the corresponding sector ministries or agencies. Information about the quantities of imported chemicals can provide a reference value for estimating the quantity of waste arising from the use of this substance. For example, the quantity of perchloroethylene imported can be used to estimate the quantity of hazardous sludge generated by dry cleaners.
55. Industrial associations can be valuable partners in hazardous wastes inventories as they can provide lists of their member companies and possible production data. Industrial associations, for example industrial chambers can also be considered as partners in distributing questionnaires and encouraging their members to participate in the survey. Such cooperation is likely in cases where the member companies can be offered some incentives such as government sponsored waste prevention consulting.
56. It is good practice to start up a waste generator database by listing the biggest establishments of those industrial sectors that are typically major hazardous wastes generators, such as chemical industry, mining and ore processing, basic metal industry, petroleum industry, fertilizer and pesticide production, chemical wood preservation, galvanic industry and waste or industrial wastewater processing. The next step is to proceed by sector, working from the biggest companies towards medium-scale industries. Small-scale and cottage industry should be approached at a later stage. Environmental authorities often wrongly attempt to target all sizes of industry and all types of industry in one phase. The administration is then easily overwhelmed with the paperwork and practical interventions and priorities will be lost in the mass of data.
57. Another option is to start working in a geographically limited area, preferably some of the most densely industrialized corridors in order to create the technical capacity for hazardous wastes inventories and then to gradually widen the geographical scope.
5.5 Step 5. Collecting site specific data58. This is the point where first and second generation inventories differ radically. Second generation inventories are mainly based on reporting obligations mandated by the law whereas the first generation inventory has to convince the target facilities to collaborate in providing the data or, following a less time consuming and less costly approach, estimate the amount of waste generated based on other factors or data (such as production, sales, etc.), as explained in Chapter 6.
59. For second generation inventories, data can be collected using a questionnaire sent to the target stakeholders. An example of a template for waste data collection is provided in annex 3 of this guide. A low reply percentage, missing data and wrong interpretations of the survey questions, definitions and
17
UNEP/CHW.12/9/Add.1
classifications are obvious risks in this approach. Also, although facility-level inventories can serve different purposes, their compilation to build a national inventory is not always possible because of issues such as differing metrics, confidential business information and waste categorization.
60. Data collected from environmental permits, applications, environmental impact assessment (EIA) reports, self-monitoring reports and from inspection reports is more reliable as these documents have passed the processing by environmental inspectors who are aware of the legal background and have training and authority in the subject. Specific guidance on the collection of data from industrial sectors is provided in chapter 6, while chapter 7 provides guidance on the collection of data from other specific hazardous wastes streams as well as “other wastes”. Challenges concerning information collection from compliance monitoring sources, for instance challenges associated with weak enforcement, low quality of environmental licensing documents or insufficient information about waste classification, are discussed in chapter 8.
5.6 Step 6. Verifying site specific data61. Verifying the data collected from questionnaires or monitoring reports is often the most resource intensive part of an inventory survey. Guidance is provided for conducting a waste audit in an industrial facility in chapter 8. Even in first generation inventories, verification can be helpful to validate the assumptions used in the calculations and can be made through visits to a number of facilities, comparisons to historical calculations, or comparisons to information from other countries. Questionnaires, if used, should always be tested in the field before being used in a wider context. Waste data provided by the waste generator should be critically assessed, compared with production data, data from previous years and with data from other facilities from the same sector. Suspicious and abnormal data should be confirmed through direct contact with the respondent.
5.7 Step 7. Calculating national summaries62. Compiling a national inventory from the data collected from the field is a complex task. Incomplete coverage of the waste generating sources may be the rule, not the exception. In first generation inventories national summaries are calculated using waste factors derived from a limited sample of real cases and extrapolated to correspond to the entire community of waste generators. For the extrapolation step, national statistics from the concerned sector are needed. It may be noted that in many countries the statistics are more focused on the monetary value of production than on the physical volume of production, which would be more useful for calculating waste streams. Different options for calculating national summaries using waste factors are presented in Chapter 6.
63. Also, second generation inventories may be incomplete, because mandatory reporting requirements cannot be extended to very small units, such as small enterprises, households and individual farms, construction and demolition projects, etc. In later revisions of national inventories these small generators can be included in the national summary by extrapolating findings from pilot projects.
5.8 Step 8. Data on waste disposal and recovery64. In countries where the government has not taken appropriate measures to ensure the availability of adequate waste disposal facilities, as required by the Convention and as further elaborated in other documents, for instance in the framework for the ESM of hazardous wastes and other wastes,1 much of the waste disposal business is operated by the informal sector. Hazardous waste with a market value, such as used oil, lead batteries, waste containers, scrap cable and contaminated metal scrap is intensively recycled. However, it is very difficult to collect relevant statistics from the informal sector.
65. If waste recycling facilities are registered and regulated, the records kept by these companies are a valuable source of waste data because they provide information about the waste actually generated from numerous sources. The waste input to the disposal facilities is usually categorized, weighed or otherwise measured, and also some quality indicators are analysed. Waste authorities should always ensure that commercial waste disposal and final disposal plants are obliged to submit annual reports that can be utilized in compiling national inventories. The plant owners should be instructed to use appropriate waste classification systems that are compatible with national waste inventory methods. It is important to avoid double counting of wastes. If a disposal plant acts only as a transfer station for some wastes, these should not
1 The framework for the environmentally sound management of hazardous wastes and other wastes is set out in document UNEP/CHW.11/3/Add.1/Rev.1 and was adopted by decision BC-11/1. See also the non-exhaustive list of actions that may be considered for the implementation of the framework for the environmentally sound management of hazardous wastes and other wastes in the short and medium term by parties, regional centres and other stakeholders, as set out in the Annex I to decision BC-11/1.
18

UNEP/CHW.12/9/Add.1
be registered as “wastes from waste disposal plants” when transported to the final destination. In addition to solid waste facilities also wastewater disposal plants can generate hazardous wastes. The quantities of wastewater disposal sludge can be quite massive because sludge often contains 50-90 per cent water depending on the dewatering technology. National standards for concentration limits of contaminants in wastewater sludge should be established to determine whether the sludge is actually hazardous waste or not.
66. A considerable gap is commonly observed when comparing the national sum of “generated hazardous wastes and other wastes” with the sum of “disposed hazardous wastes and other wastes”. This is due to numerous sources of inaccuracy, such as missing data, unreliable estimation methods or conversion factors, waste managed on site, illegal disposal, differences in classification, exclusion of data on imports and exports of waste, etc. Gradually the gap will be narrowed when the quality and coverage of data improves.
67. According to the Basel Convention national reporting requirements [Note: ICC to insert text as a follow up to COP12 on requirements pertaining to reporting of waste generated and disposal sites]
5.9 Step 9. Data on import and export of hazardous wastes and other wastes68. The Basel Convention controls transboundary movements of hazardous wastes and other wastes, as well as their import, transit and export. Each party has the obligation to designate one or more authorities for approving each transboundary movement – named the “Competent Authority”, and make certain that a control system is in place to ensure the prior consent to and traceability of such movements, including confirmation that the waste is, ultimately, disposed of in an environmental sound manner.
69. A summary of imported and exported wastes is to be reported annually to the SBC under tables [Note: ICC to insert text after COP12 about the requirements of the revised reporting format with respect to the codes to be used to report imports and exports.] of the revised format for national reporting (see annex 1 of this guide). In this system, the Basel Convention classification for wastes and disposal/recycling codes is used. In particular, with respect to the classification of waste, and although the revised format for national reporting to be used to submit a national report was adopted subsequently to the adoption of Annexes VIII and IX,1 [Note: ICC to insert text after COP12 about the requirements of the revised reporting format with respect to the codes to be used to report imports and exports.] Instances in which no Y code is applicable may result for instance from the fact that the party has a national definition of hazardous wastes under paragraph 1 (b) of Article 1 of the Convention.
70. The applicant seeking permission for export or import of hazardous waste regulated by the Basel Convention is required to fill in the classification of the waste in question by using both the Convention’s Y classification and the national classification (e.g. the European Waste Catalogue [EWC] code in EU member States). The intended disposal or recycling method for each waste type must be reported using the Basel Convention codes.
71. Other government authorities, such as Customs authorities, may also require the use of other codes that must be used for shipments of goods, including shipments of waste. The Harmonized Commodity Description and Coding System, generally referred to as “Harmonized System” or simply “HS,” is a multipurpose international product nomenclature developed by the World Customs Organization (WCO). It comprises about 5,000 commodity groups, each one being identified by a six digit code. It is used by countries as a basis for their Customs tariffs and for the collection of international trade statistics.
72. The WCO Secretariat, in collaboration with the Secretariats of certain international agreements, has developed a table with correlations between the HS and selected international agreements, including the Basel Convention.2 The table is non-exhaustive and has no legal or official status, but may be useful as a tool to assist in the administration of the Basel Convention.
73. Because of their central role in controlling transboundary movements of hazardous wastes and other wastes, national Competent Authorities for the Basel Convention are the principal source of information on imports and exports of hazardous wastes and other wastes. Customs authorities are also a source of data on imported and exported goods which may or actually contain hazardous substances or wastes. Additionally, data provided by waste generators (regarding waste that is intended to be exported) and by waste disposers (on wastes that have been received as a result of an import) should be used as a secondary source of information.
1 Annexes VIII (List A) and IX (List B) of the Basel Convention were adopted by COP-4 (decision IV/9) and further amended subsequently. 2 Available at: http://www.basel.int/Implementation/TechnicalMatters/WCOHarmonisedSystemCommittee/tabid/2390/Default.aspx
19
UNEP/CHW.12/9/Add.1
5.10 Step 10. Assessment of results and conclusions74. The inventory report should include a section on the reliability of the results. The report should point out the major changes compared to previous inventories and discuss the probable reasons for these changes. Findings regarding challenges related to the national legislation, classification and compliance monitoring should also be documented and communicated to the policy makers.
75. Comments regarding the scope of the inventory or any major gaps that may have been identified should be incorporated in the national report submitted to the SBC.
6. Methods for calculating hazardous wastes generation in the manufacturing industry76. In most countries the bulk of the volume of hazardous wastes is generated by the industry. Information is more easily collected from industrial production than from the more dispersed users of hazardous chemicals, such as agriculture and households. Industry should be seen as a partner as it can provide expertise and technology for hazardous wastes disposal services. Moreover, bilateral or regional cooperation could be considered as a means to obtain information and data that can be used to produce estimates. While there may be cases where some assumptions are case-specific, there may be other cases that are similar and assumptions can be made based on waste production values used in other countries.
77. Hazardous wastes surveys commonly follow an evolutionary history of estimations that gradually become more and more detailed, analytical and reliable. The first generation of hazardous wastes inventories can be described as calculations based on statistics of industrial production multiplied by the specific waste generation of each sector or process; this approach has been used in several countries and by some BCRCs. The methodology uses waste factors derived from field work and uses industrial statistics in interpolating the results from a sample of industrial establishments into national or subnational estimates. The waste factors are usually based either on the number of employees or the annual production rate, or the consumption of the main raw material input. Often, it is easier to acquire the data on production capacity than the actual production rate. Information of the value of production may be more easily acquired than the mass of production because the added value of various sectors can usually be found from national statistics. In the service sectors other units can be used (number of beds, production area, etc.).
78. The waste (generation) factor, i.e. the quantity of hazardous wastes generated per unit (employee, tonne of product, net sales, etc.) should be surveyed in a sample of companies from each target sector. The national inventory can then be computed by multiplying the waste factor with total number of units (i.e. of employees, production volume, value of production). In developing countries the figure that is most easily accessible is the number of employees, so this has been used in several case studies.
79. The roadmap for conducting such a survey project is presented in figure 4.
20
UNEP/CHW.12/9/Add.1
Figure 4: Roadmap for first generation inventories
Use secondary, sector specific data (if available) to estimate waste (generation) factors.
Select a sample for field work.
Conduct a survey using a questionnaire and on-site verification.
Combine primary data with secondary data and identify sources of uncertainty.
Establish waste (generation) factors for waste categories that are well represented in the data.
Collect production related data for the selected sectors (production volume, value, number of employees, etc.).
Review and summarize previous inventory reports if available.
Assess the significance of small and medium enterprises and that of the informal sector; assess trends (growth, cleaner production) in the target sectors.
Assess the state of enforcement of pollution control and its impact on the reliability of corporate reporting.
Select the industrial sectors for the inventory; consider the correspondence between the national classification and the international standard industrial classification (ISIC).
Define the waste categories to be surveyed; establish how these will be grouped for the purpose of the inventory and reporting under the Convention.
Collect available databases of industrial establishments; establish the database for the inventory.
Combine waste (generation) factors with production data and compute total quantities of hazardous and other wastes.
Interpret findings, assess reliability, present conclusions and recommendations.
Prepare the report and disseminate the results.
Source: Adapted from BCRC-SEA (2005).
80. As with any methodology, there are limitations to this particular methodology. The first problem is the variety of hazardous wastes generated in any industrial sector. If only the average for all wastes types is used in the waste factor, the results of the inventory cannot be used to assess the total quantities of different types of wastes to be managed (e.g. if organic and inorganic wastes are added up into one figure). Secondly, if
21

UNEP/CHW.12/9/Add.1
waste factors need to be determined for every class of wastes generated in each industrial branch this means an enormous task. International databanks are not available for extracting waste factors, but some factors are can be obtained from national inventory reports. For example, the Central Pollution Control Board (CPCB) of India has studied the petrochemical, dye, pharmaceutical and pesticide sectors, and has published information on various hazardous waste streams generated, quantified in terms of per tonne of product (CPCB, 2002, 2004a, 2004b, 2005).
Case Story 4
According to a study by CPCB India waste generation factors in the pesticide production vary between 1 kg and 436 kg of hazardous waste per tonne of product. Using the waste factor derived from one process may give a mistake up to 436 fold if used for a company producing another pesticide (CPCB, 2004b).
81. In the petrochemical industry the range of products and hazardous wastes is somewhat more limited. Examples of hazardous waste factors derived from the survey in India are provided in table 3. This table demonstrates the complexity of the classification of hazardous wastes even in one industrial branch and the huge variation of the emission factors. The overall estimate will largely depend on the choices of agglomerating different waste categories for calculating the waste factor.
82. The PRTR global portal managed by the OECD provides a gateway to public national databases of pollutant releases from the major emission sources.1 It includes information on disposal of wastes containing hazardous chemicals to landfills and transfers of hazardous wastes for recycling. The PRTR databases can be used in designing inventories to identify industrial sectors generating certain hazardous wastes classes (e.g. mercury containing wastes). Unfortunately, the information about hazardous wastes is scarce compared to air emissions and the waste classification is not compatible with that of the Basel Convention. The European Pollutant Release and Transfer Register (E-PRTR)2 is an important example of PRTR information sources. The production rate is usually not available in the PRTR data so the specific waste generation can only be calculated if the production rate can be found from other sources. Another source of information about waste factors are the Best Available Techniques Reference Documents (BREFs) developed for different industrial sectors by the European Integrated Pollution and Prevention Control Bureau (EIPPCB).3 BREFs provide an in-depth description of each industrial sector, including information on specific emissions. The information on specific waste generation from selected processes is scarcer than for water and air emissions, but this is expected to be gradually improved.
Table 2: Examples of waste factors for some petrochemicals and plastic materials (CPCB, 2002)
Product Waste stream Waste factor (kg/t)
Xylene Spent clay 0.500Ethylene/propylene Oil soaked carbonaceous coke 0.017
Spent caustic 0.056Spent palladium catalyst 0.007
Butadiene Butadiene polymer waste 0.058Solvent regeneration residue 0.39
Benzene Spent nickel catalyst 0.025Spent nickel molybdenum catalyst 0.0025
Spent cobalt molybdenum catalyst 0.007 Polypropylene Spent activated carbon 0.062
Spent activated alumina 0.007Spent molecular sieve 0.031
Powder waste 3.93Polymeric oil 1.10
Vinyl chloride monomer and Reactor waste 0.0141 For more information: http://www.oecd.org/env_prtr_data/2 For more information: http://prtr.ec.europa.eu/3 For more information: http://eippcb.jrc.ec.europa.eu/
22
UNEP/CHW.12/9/Add.1
Product Waste stream Waste factor (kg/t)
PVC
EDC bottom viscous 3.59Carbon waste 0.021
Surge pond sludge 0.43PVC wet resin 3.48
Acetone Distillation byproduct (tar waste) 7.83Phenol Solvent waste 4.77
Case Story 5
The BCRC for South-East Asia commissioned a demonstration project in the Philippines for conducting national hazardous wastes inventories (BCRC-SEA, 2005). This inventory focused on three major hazardous wastes streams: acids, alkalis and wastewater sludge from the chemicals industry, metal finishing industry (electroplating) and semi-conductor industry. Hazardous wastes factors were compiled from the annual reports of the regulated companies. Both kg/year/employee and kg/year/tonne of production indicators were calculated. For electroplating and semiconductor industry the indicator kg/year per 1000 pieces of product was used.
The following problems were encountered in this first generation hazardous wastes inventory exercise:
The “number of employees” could mean the number of permanent employees or the total number of actual operating employees. The difference between these two figures can significantly affect the accuracy of the hazardous waste estimate factors.
Statistical calculations to determine a systematic correlation between the number of employees and the annual production quantities failed.
Some data on production capacity are expressed in quantity units per day and there is no information on the number of workdays in a week and the number of work week per year.
Significant difference between production rate and production capacity.
Some data on production quantity unit and waste stream generation unit may be incorrectly used or incorrectly written, e.g. weight unit is written as kg while actually intended as metric ton. Production is expressed as pieces or units, not tonnes.
Variations of manufacturing process. Despite classified under the same group of manufacturing industrial subsector, different process technology and operations affect the generation of hazardous waste in terms of either type or quantities.
There is also a high possibility that some companies do not monitor or record their hazardous waste streams generation.
83. Waste factors from other countries should be used with caution as many products can be produced using different processes with widely differing waste intensities. For this reason good practice is to use waste factors in national inventories only after conducting actual national fieldwork where waste factors are derived from real cases. A minimum of three establishments from each target industrial branch is recommended to reveal differences between company practices. The reliability of national waste factors will eventually grow if the regulated industry is obliged to report their specific waste generation in their annual reports.
Case Story 6
In Finland, the Waste Act was amended in 2011 by obliging all generators of hazardous wastes to perform bookkeeping of the generated wastes, including the calculation of the specific waste generation in relation to the volume of the activity. The relevant ministry can give sector specific guidance on the calculation methods.
23

UNEP/CHW.12/9/Add.1
Case Story 7
The Helsinki Regional Waste Management Authority in Finland has established a benchmarking service for various industrial and service sectors. The company can voluntarily upload its waste generation and compare its waste factor with the average of other companies in the sector.
84. When attempting to compile national waste factors for industrial waste, it is advisable to limit the work to those industrial sectors where the number of plants is too large compared to the available resources to allow site visits to each of them. It is not practical to attempt to compute waste factors for every hazardous wastes type. It is more efficient to focus on the 3-5 main waste types in each sector. The classification of wastes should recognize the terminology used in the specific industry. Each waste type should also be classified using the national classification codes. The survey team should then translate these into Basel Convention waste codes.
85. There are alternative strategies that can lead step-wise to a national estimate of industrial hazardous wastes generation that can be reported to SBC. One strategy is to report the quantities of hazardous wastes streams that are received and reported by registered hazardous wastes disposal facilities. Another strategy is to conduct a field study in a limited geographical area and then extrapolate the national figures using waste factors as described in this chapter. A third approach is to focus on the relevant industrial sectors one at a time. The inventory can start with the major facilities and use waste factors derived from these to extrapolate the national figures. A sector-specific approach generates more reliable waste factors than a geographical approach. A sector-specific approach is more useful in building up the technical knowhow in the environmental administration by providing practical information about the range of waste streams and waste factors, good and bad practices and typical problems in each sector.
7. Inventories of selected waste streams
7.1 Introduction86. In addition to the manufacturing industry the following sectors of the national economy are typical sources of hazardous wastes.
Table 3: Other hazardous waste generating sectors
Sector Examples of hazardous wastes
Mining Tailings containing heavy metals or other hazardous constituents, mineral leaching or processing chemicals, drilling chemicals, etc.
Transport sector Used oils, brake fluids, cooling chemicals, batteries, used catalytic convertors, etc. Asbestos, corrosion prevention coatings from ships.
Energy sector Fuel tank bottoms, PCB transformers and capacitors, boiler chemicals, asbestos insulation, some types of fly ash and slag, etc.
Cottage industry and the informal sector Solvents, paints, pesticides, heavy metal waste etc. depending on the branch and raw material
Health-care Drugs, contagious biological waste, chemicals, mercury appliances, radioactive waste, etc.
Agriculture, horticulture, animal husbandry Obsolete or off-specs pesticides and fertilizers, their contaminated packages, drugs for animals, etc.
Households and service sector Cleaning chemicals, paint and solvent waste, drugs, batteries, e-waste, mercury lamps
87. The inventories of the above waste types are usually performed as separate studies which serve to prepare specific interventions. Experiences from other countries can more often be applicable to such specific waste types than to industrial inventories. Generation of hazardous wastes and other wastes can in some cases be estimated quite well through desk work based on consumption, sales and import statistics. In this chapter methodological aspects that are applicable to some specific waste streams are highlighted.
24
UNEP/CHW.12/9/Add.1
7.2 Waste electrical and electronic equipment88. Waste electrical and electronic equipment (e-waste) is one of the priority issues in implementing the Basel Convention because of the logarithmic growth of the generation of this waste. Inventories of e-waste have been conducted by many parties and BCRCs.
89. The BCRC-SEA has published guidelines for conducting e-waste inventories (BCRC-SEA, 2007). The guide and its annexes provide useful information for conducting e-waste inventories, including product group specific waste factors. The contents of this guide will not be replicated here.
90. The quantity of e-waste generated from households in the EU countries has been estimated as 15 kg/capita per year. Of this amount about 50 per cent or 7.5 kg consisted of large household appliances, 10 per cent or 1.5 kg small household appliances, 20 per cent or 3 kg information and communication technology (ICT) devices and 20 per cent or 3 kg other consumer electronic waste (Zoeteman et al., 2009).
91. PCB containing capacitors and transformers is a special kind of e-waste. PCB waste is also covered by the Stockholm Convention. An example of an inventory of PCB containing waste streams is given in annex 4.
7.3 Waste mineral oil and oily wastes92. Used mineral oil and other types of oily wastes (e.g. oily water, oily sludge, oil filters) are generated from numerous industrial and service activities. These types of waste are one of the best candidates for early action to guarantee ESM because the volumes are big, the disposal technology is fairly simple, and the value of oily wastes as fuel or re-use renders the operation commercially interesting.
93. Generation of used oil from the transport sector can be estimated based on waste generation rates specific to each vehicle type and using national statistics of registered vehicles. The same can be applied to transformer oil. In some developing countries, certain used oils are recycled directly as lubricant in motor engines. The volatile hazardous constituents in the waste oil are transformed into air emissions.
94. Yilmaz (2006) provides a demonstration of this methodology in his inventory from Turkey, and presented the following waste factors for vehicles:
Table 4: Waste generation factors for waste engine oils (Yilmaz, 2006)
Type of vehicle Waste generation rate (l/yr/vehicle)
Automobile 4.25Minibus 31.5
Bus 425Truck or pickup truck 92.5
Tractor 31
95. BCRC-Bratislava has conducted a study of used lubricating oils in Bosnia-Herzegovina (Huseljic et al., 2006). It demonstrates the elements of conducting the inventory and the use of inventory results in preparing a master plan for used oil management. They used an average of 18-20 kg for oil consumption per vehicle and assumed a 40 per cent collection rate for engine oils and 75 per cent for gear and hydraulic vehicle oils.
96. Oily wastewater generated from degreasing processes, oil separators from workshops, etc., are more dependent on local practices and has to be studied using other methods of assessment. The demand for oily waste management depends on the practices and enforcement of pollution control of oil emissions to the sewer and discharges to the environment.
7.4 Household waste and residues from their incineration
7.4.1 Household wastes in the context of the Basel Convention
97. In addition to hazardous wastes, the Basel Convention also controls “other wastes”, listed in annex 2, if they are subject to transboundary movement. Annex 2 lists wastes that would not normally be classified as hazardous, but require “special consideration”, namely:
(a) Y46 - Wastes collected from households; and
25
UNEP/CHW.12/9/Add.1
(b) Y47 - Residues arising from the incineration of household wastes.
98. With regards to wastes collected from households, the technical guidelines adopted by the second meeting of the Conference of the Parties recognize that there is a need to control and give special consideration to these wastes and that their ESM should be guaranteed (2000c).1 The guidelines also note that wastes collected from households consist almost entirely of materials which have been handled by individuals before being discarded, and would not normally be regarded as possessing hazard properties. However, care needs to be exercised over such wastes soon after they are discarded as small quantities of hazardous materials may be present. Also, the presence of biodegradable constituents in household waste demands care in their recovery, treatment and disposal. There is always the possibility of the waste presenting a threat to human health (toxicity) and the environment (ecotoxicity) by virtue of the presence of pathogens or other hazardous constituents.
99. These “other wastes” are included in the annual reporting requirements of the Convention. However, a challenge in determining which figures to report under Y46 and Y47 is that in many countries waste statistics do not distinguish household waste from other municipal solid wastes (e.g. waste from commerce and trade, office buildings, institutions and small businesses, yard and garden, street sweepings). The share of household waste in municipal solid waste (MSW) varies greatly depending on the pattern of settlement and housing. In urban core areas the proportion of services and institutions is high. In semi-urban and rural areas the share of wastes from services is low, but in rural settlements much of the organic household waste is used as animal feed or as organic fertilizer.
100. In most countries, estimates of household waste generation are available from other studies and can be used for a first generation inventory. Per capita waste generation rates from other countries can be used for computing rough estimates. The World Bank report, A Global Review of Solid Waste Management, provides useful consolidated data on MSW generation, collection, composition and disposal, by country and by region (Hoornweg and Bhada-Tata, 2012). The report also contains projections for 2025 on MSW generation and composition in order to allow decision makers to prepare plans and budgets for solid waste management in the coming years. Per capita waste generation rates, grouped by region and by income level, are presented in the following tables 5 and 6.
1 http://www.basel.int/TheConvention/Publications/TechnicalGuidelines/tabid/2362/Default.aspx
26
UNEP/CHW.12/9/Add.1
Table 5: Current waste generation per capita and by region (Hoornweg and Bhada-Tata, 2012)
Region Average waste generation per capita (kg/capita/day)
Africa 0.65
East Asia & Pacific 0.95Eastern & Central Asia 1.1
Latin America & the Caribbean 1.1Middle Asia & North America 1.1
OECD 2.2South Asia 0.45
Table 6: Current waste generation per capita and by income level (Hoornweg and Bhada-Tata, 2012)
Income Level Average waste generation per capita (kg/capita/day)
High 2.1
Upper Middle 1.2Lower Middle 0.79
Lower 0.60
101. The generation of household waste is usually determined indirectly using waste collectors or waste treatment operators as data sources.
102. An example of a field survey of household waste is given in annex 5.
7.4.2 Residues from the incineration of household waste
103. Residues from the incineration of household waste are relatively easy to quantify because the number of commercial incinerators is usually limited in any given country, and these facilities are usually under strict environmental control because of the health risks associated with air pollution. The quantity of residues arising from the incineration of household waste can be calculated quite reliably by using waste factors, as the percentage of non-combustible material in this type of waste is relatively constant.
104. The quantity of bottom ash or “slag” from MSW incineration in grate furnaces is between 20-30 per cent of the quantity of waste feed, and the quantity of fly ash is between 1 to 5 per cent (DEFRA, 2007; Petrlík and Ryder, 2005; World Bank, 1999). The percentage differs depending on the flue gas disposal method. Fly ash is in many cases mixed with the reaction products of dry or semidry flue gas disposal processes. Fly ash from incineration of MSW is usually classified nationally as hazardous waste because of the heavy metal content and the content of persistent organic pollutants. The classification for the bottom ash depends on the practices and efficiency of source separation and pre-treatment at the facility (e.g. magnetic separation of metals).
7.4.3 Househ-old hazardous waste
105. Waste collected from households includes items such as batteries and other electrical components (some of which may contain mercury), containers with residues of oils, paints, pool chemicals, caustic materials, sterilizing agents, bleaches, medicines, etc. There are several Y-codes that may be used for separately collected fractions of household wastes; for example compact fluorescent light bulbs or rechargeable nickel-cadmium batteries may be also described by Y29 and Y26 respectively. In case of a waste that is a mixture of different Y-codes, only the Y-code that corresponds most closely to the waste composition is to be used for national reporting.
106. The generation of household hazardous waste (HHW) is usually estimated based on the quantities of waste actually collected at designated collection points in industrialized countries. Typical hazardous waste generation per household is estimated to be in the range of 3 to5 kg/capita/year. Lakshmikantha and Lakshminarasimaiah (2007) estimated the household hazardous waste generation in Karnataka, India, to be 5
27
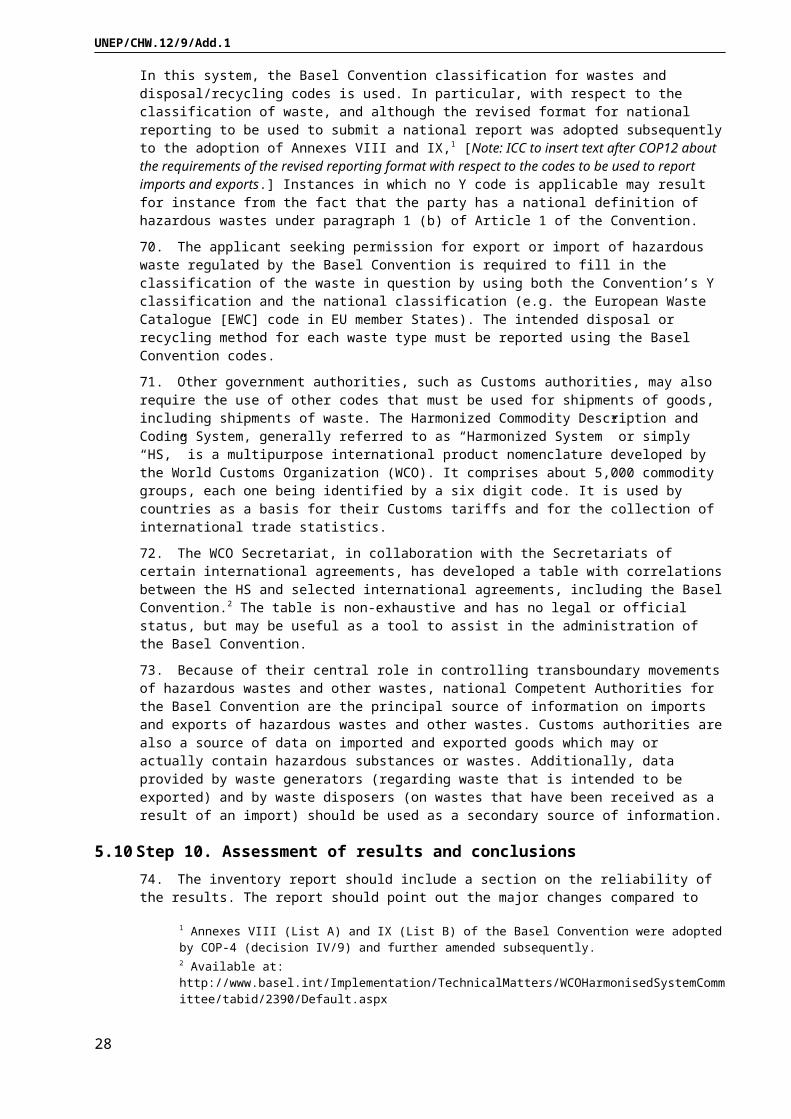
UNEP/CHW.12/9/Add.1
g/capita/day. Jones (1990) describes studies performed by examining the percentage and composition of HHW in solid waste destined for municipal landfills. In general, depending on whether empty containers are included as wastes or not, the per capita estimates were found to range from negligible quantities (Los Angeles and Puget Sound, USA) to 1.6 kg/year (Albuquerque, USA), and as high as 13.2 l/year (San Francisco Bay Area in California, USA).
107. The proportion of hazardous waste that is actually collected depends on the environmental awareness of consumers and the service level of waste reception.
7.5 Health-care waste108. Clinical wastes from medical care in hospitals, medical centres and clinics belong to category Y1 (Annex I); waste pharmaceuticals, including cytotoxic drugs, belong to category Y3. It is important to consider that clinical wastes are hazardous only if they possess one or more of the hazardous characteristics in Annex III to the Convention. The hazard characteristic that is known or suspected to be commonly associated with clinical wastes is H6.2, “infectious substances”, which is defined in Annex III as “substances or wastes containing viable micro-organisms or their toxins which are known or suspected to cause disease in animals or humans”. It is not uncommon for first generation inventories to classify all waste generated in health-care facilities as hazardous. However, with proper isolation of truly infectious patients and processes, and proper waste segregation, only a relatively small fraction of the total waste is in fact hazardous. Clinical waste not classified as hazardous waste can still be regulated with sector specific waste management standards and guidelines. For example human tissue is not normally considered to be hazardous, but it should not be disposed of together with other organic wastes due to ethical and religious reasons.
109. The World Health Organization (WHO) estimates that between 75 and 90 per cent (85 per cent) of the waste produced by health-care facilities is non-hazardous; the remaining 10-25 per cent of health-care waste is hazardous and may pose a variety of environmental and health risks (Prüss et al., 2013). Infectious waste represents about 10 per cent of the total waste, and chemical and radioactive waste can represent about 5 per cent of the total. Depending on the type of health-care facility, total waste generation in a high-income country, e.g. the United States, can range from 0.90 kg/occupied bed/day (in nursing homes) to 10.7 kg/occupied bed/day (in metropolitan general hospitals); infectious waste generation can range from 0.038 to 2.79 kg/occupied bed/day in the same type of facilities. In Pakistan total health-care waste generation can range from 0.3 kg/patient/day in nursing homes to 2.07 kg/bed/day in hospitals (Prüss et al., 2013).
110. Infectious waste includes waste contaminated with blood or other body fluids, cultures and stocks of infectious agents from laboratory work, and waste from infected patients in isolation wards. There is particular concern about infection with human immunodeficiency virus (HIV) and hepatitis viruses B and C, for which there is strong evidence of transmission from injury by syringe needles contaminated by human blood, which can occur when sharps waste is poorly managed. Sharps represent a double risk; they may not only cause physical injury but also infect these wounds if they are contaminated with pathogens. It is estimated that more than two million health-care workers are exposed to percutaneous injuries with infected sharps every year (Prüss et al., 2013).
111. Other hazardous waste generated in hospitals and clinics are:
(a) Pharmaceuticals that are expired or no longer needed; items contaminated by or containing pharmaceuticals.
(b) Cytotoxic waste containing substances with genotoxic properties (e.g. waste containing cytostatic drugs – often used in cancer therapy; genotoxic chemicals).
(c) Waste containing radioactive substances (e.g. unused liquids from radiotherapy or laboratory research; contaminated glassware, packages or absorbent paper; urine and excreta from patients treated or tested with unsealed radionuclides; sealed sources).
(d) Waste containing chemical substances (e.g. laboratory reagents; film developer; disinfectants that are expired or no longer needed; solvents; waste with high content of heavy metals, e.g. batteries; broken thermometers and blood-pressure gauges).
112. Technical guidelines on the ESM of healthcare wastes and mercury wastes1 have been published by the SBC (2003; 2012). In particular, with regards to the technical guidelines on the ESM of mercury wastes adopted by decision BC-10/7, these are currently being updated pursuant to decision BC-11/5 of the
1 Wastes consisting of, containing, or contaminated with mercury or mercury compounds.
28

UNEP/CHW.12/9/Add.1
Conference of the Parties, in light of the relationship between the Minamata Convention on Mercury2 and the Basel Convention.
113. The WHO guide on safe management of wastes from health-care activities provides additional guidance on defining infectious waste and managing it safely. Concentrated cultures of pathogens and contaminated sharps (particularly hypodermic needles) are probably the waste items that present the most acute potential hazards to health (Prüss et al., 2013). WHO has also published guidance for the transport of infectious substances (WHO, 2012). Medical or clinical wastes containing Category A infectious substances are assigned to UN 2814 or UN 2900 as appropriate; medical or clinical wastes containing infectious substances in Category B, or which are reasonably believed to have a low probability of containing infectious substances, are assigned to UN 3291.
Case Story 8
The Helsinki University Hospital in Helsinki, Finland is a frontrunner in environmental management. Through effective waste prevention and segregation practices it had reached a situation where only 6 per cent of the generated waste was classified as infectious or otherwise hazardous (Kaski, 2008). The results of a case study from this hospital are presented in table 7.
Table 7: Health-care wastes from a case study in Finland (Kaski, 2008)
Waste type tonne/year Percentage
kg/bed kg/employee
Hazardous health -care waste 289 4 79 14Other hazardous waste 139 2 38 7
Recycled waste 3548 51 966 174Non-hazardous waste for disposal 3033 43 826 149
Total waste 7009 100 1908 344
7.6 Small-scale industry and the informal sector114. Small-scale industries form a crucial segment of the economy in most developing countries. It is very challenging to assess hazardous waste generation from these enterprises because little or no public information is available. A high percentage of these workshops are unregistered, and their raw materials, production rates and labour force fluctuate annually.
115. Nevertheless, inventories and interventions involving small-scale industries and the informal sector are important as their waste practices can be especially harmful. This is because they are often located within residential areas and they do not have access or they do not use dedicated waste management services.
116. In first generation inventories it is probably unrealistic to target small-scale industries because of the very high workload required. Waste generation factors derived from larger facilities may not be applicable to small workshops. Often the informal sector plays a significant role in the disposal of hazardous waste. At some later stage of the inventory development process, it is feasible to launch separate surveys or campaigns for the inclusion of these enterprises. Providing better access to waste auditing, transport and disposal services, and using financial incentives to reduce the cost of these services, may be the only way to acquire real information of their waste streams. Small scale industries and workshops should also be gradually registered to facilitate data collection. It is good practice to implement this in a step-wise mode by establishing waste licensing and reporting requirements that differentiate between “small generators” and large ones.
7.7 Accidental chemical or hazardous waste releases117. Contamination of soil and buildings caused by chemical or hazardous waste spills/releases, or other such accidents, can lead to large volumes of hazardous waste being generated. Excavated soil and debris from such sites can comprise a high proportion of the hazardous waste that needs to be disposed of, so it is good practice to include all available information on contaminated sites in the waste inventory. Quantitative data should be based on site-specific surveys and waste generation factors cannot be used to estimate waste quantities. The volume of contaminated soil to be excavated and requiring off-site disposal is highly
2 For more information: http://www.mercuryconvention.org/
29
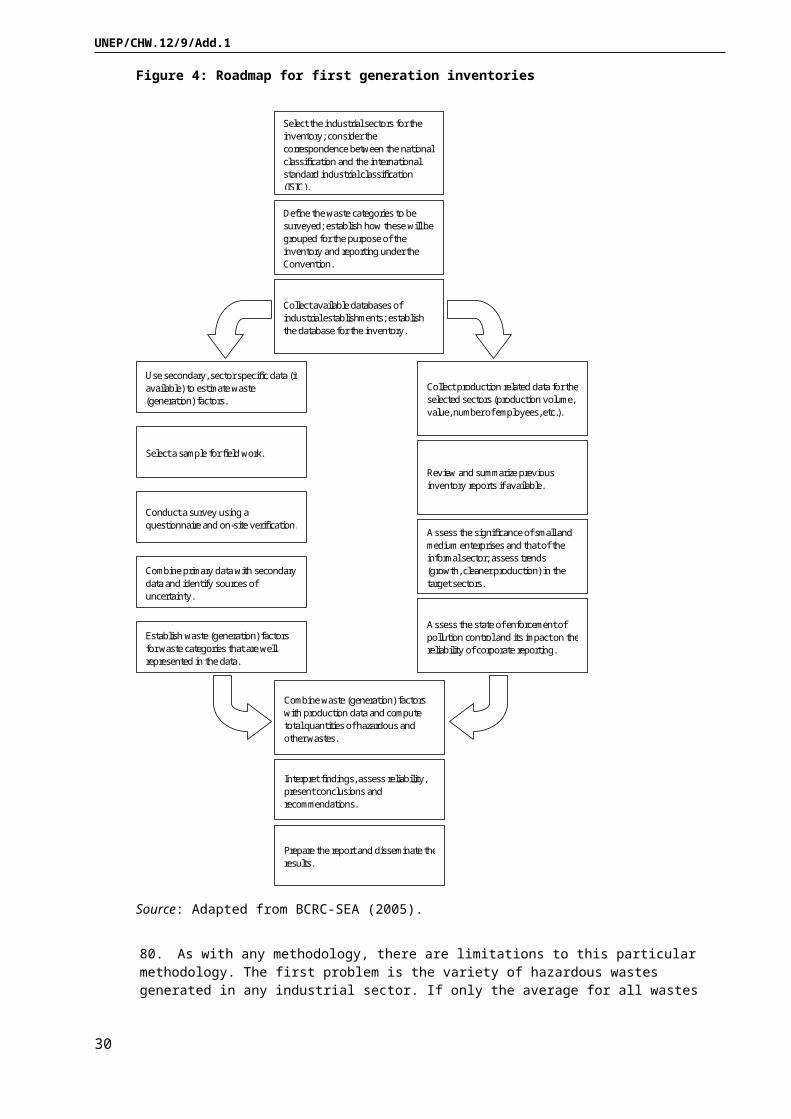
UNEP/CHW.12/9/Add.1
dependent on national legislation and guidelines, existing environmental and land use conditions, as well as potential environmental and health risks.
118. In developing countries and countries with economies in transition, storage of obsolete pesticides and abandoned industrial facilities are typical sources of contaminated soil. Other examples of risk sectors are wood preservation facilities, scrap yards, waste disposal facilities, oil and chemical storage sites, industrial dumping sites, etc. Contaminated site surveys provide information for the waste inventory regarding this waste type.
7.8 High volume, low hazard wastes119. Wastes that are generated in massive quantities from large scale operations, such as mining, may require special attention when undertaking an inventory or when developing policies. In many cases it will depend on the actual concentration of a single hazardous constituent whether such wastes can be classified as hazardous (List A waste) or non-hazardous (List B waste). Fly ash, phosphogypsum sludge waste, mine tailings, ferrochrome sludge, paper mill lime sludge, certain industrial wastewater sludges, and excavated contaminated soil are typical examples of wastes from large scale operations. If all such wastes are a priori classified as hazardous as a precautionary measure, the conclusions drawn from the inventory may be distorted. Sector-specific surveys are recommended to assess the range of hazardous constituents and their concentrations. The national legal framework should clarify the threshold for such wastes to be considered presumptively hazardous.
Case Story 9
A manual for conducting hazardous waste inventories for India recommended the exclusion of wastes with high volume and low effect wastes, such as fly-ash, red mud and phosphor-gypsum, from the list of hazardous wastes. Instead, specific guidelines for the management of each specific waste are proposed (Verma, 2009).
Case Story 10
Yilmaz (2006) collected hazardous waste generation factors from literature for several industrial sectors, including mining, and applied them to a national hazardous wastes inventory in Turkey. Some examples of waste factors from mining of metal ores are presented in table 8. A wide fluctuation of annual production is common in the mining sector due to changes in the market price of metals.
Table 8: Waste generation factors for tailings (Yilmaz, 2006)
Ore minerals Tailings per tonne of ore (tonnes)
Tailing per tonne of product (tonnes)
Copper 0.46 191.4Silver 0.99 1568
Gold 0.46 752380Iron 0.33 1.4
Lead 0.94 16Zinc 0.89 8
8. Hazardous waste audits and case studies120. Waste auditing is one of the useful and reliable sources of waste data. Primary data for inventories is often collected by performing waste audits. A waste audit is conducted through systematic surveys in an individual waste generating facility, carried out by either an in-house team or a consultant team in cooperation with the management of the facility. A waste audit is normally commissioned by the company as a voluntary activity aiming at identifying opportunities for cost efficiency, waste minimization and pointing out risks of non-compliance and damage liabilities. The objective of a waste audit differs from a waste inspection that is conducted by authorized inspectors with the sole objective of verifying compliance and which may lead to sanctions for non-compliance. The systematic methodology of waste audits can be used also in waste inspections, but the scope of waste audits is wider because the latter is concerned of cost impacts in addition to environmental impacts.
30
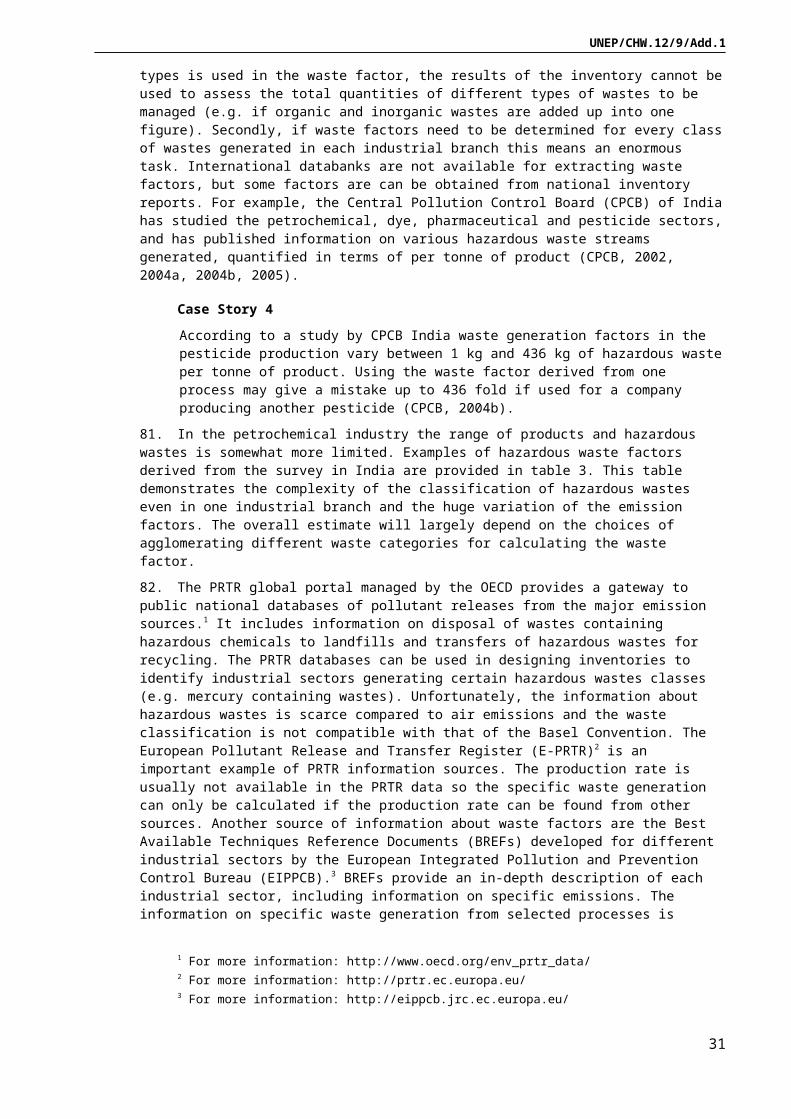
UNEP/CHW.12/9/Add.1
121. Ideally, waste audits are part of integrated environmental audits, performed by either internal or external experts. Some basic principles of conducting waste audits in individual industrial facilities are presented in this chapter. Waste prevention audits also follow these principles. The degree of detail in these audits can vary depending on the time and human resource allocation per site and the scope of the inventory (e.g. focusing on specified waste types only).
8.1 Basic information122. The basic information gathered from each case includes location, ownership, year of establishment, industrial sector, main products and main raw materials, production rates, working days per year, number of workers and contact information. Annex 3 to this guide can be used as a model for designing a template for collecting waste inventory data at an industrial plant level. It is to some extent based on the template used by BCRC-SEA in its pilot project (BCRC-SEA, 2005). The annex should be adapted to the specific scope of the inventory, avoiding too ambitious and complex information requirements.
123. Use of geographic information systems (GIS) to register the location of a facility is good practice. Taking photos of the establishment is also very useful if allowed by the company. Operating licences, environmental permits and maps of the location are other important sources of information.
8.2 Input-output balances124. A simple flow chart of the industrial process should be requested or sketched with the company representatives.
125. For the main production steps rough mass balances are compiled. If some of the raw materials can be considered as waste, this is recognized as a risk. It is essential to study wastewater discharges as hazardous wastes are commonly discharged deliberately into the sewer to avoid generating hazardous wastes in situations where the regulation and compliance monitoring of wastewater emissions are poor. Also, this is understandable in countries where no services for hazardous wastes transport and disposal are available.
126. The hazardous chemicals used in each main process are listed (excluding minor use, for example if annual consumption is less than 200 liters). In classifying the hazardous chemicals, use of the Globally Harmonized System (GHS) of Classification and Labeling of Chemicals is recommended. The GHS is a system for standardizing and harmonizing the classification and labeling of chemicals (United Nations, 2013).
8.3 Waste data127. The types of waste generated on a daily basis are obtained and listed from interviews of the responsible plant manager. Verification from the company’s own waste records and the waste transport and delivery reporting from the receivers of the waste is used, if available. Companies implementing a formal environmental management system according to an internationally recognized standard, such as ISO 14001, regularly monitor their waste generation so that they are usually better placed to provide reliable data.
128. The hazardousness of the wastes can be estimated based on the material safety data sheets (MSDS) that should be available for every hazardous chemical regularly used in the factory. Waste quantities monitored in volumes (m3 of waste containers multiplied by number of transports per year) are converted to tonnes using conversion factors (e.g. bulk densities) if available, or by estimation. Providers of waste transport and disposal services often have a better knowledge of waste quantities than the plant managers.
129. In the next step it is important to interview the plant representatives about periodical or intermittent procedures that generate wastes. End of shift, end of batch, change of product, end of day or week clean-up operations are typical examples. Wastes arising from the auxiliary processes such as wastewater disposal, oil separator clean-up, flue-gas disposal and on-site waste management processes are often forgotten in superficial waste audits. Questions about obsolete chemicals, off-specs products and past chemical spills may give further hints of waste generation.
130. During the site tour observations are made on waste segregation, accumulated waste, dumping sites, storage of large numbers of chemical drums etc. Interviews of process workers, if allowed by the company management can reveal relevant practical issues and the general awareness level.
131. It is good practice to collect data of all wastes, not only hazardous waste, as the plant representative can intentionally or unintentionally provide wrong interpretations on the classification of their waste.
31
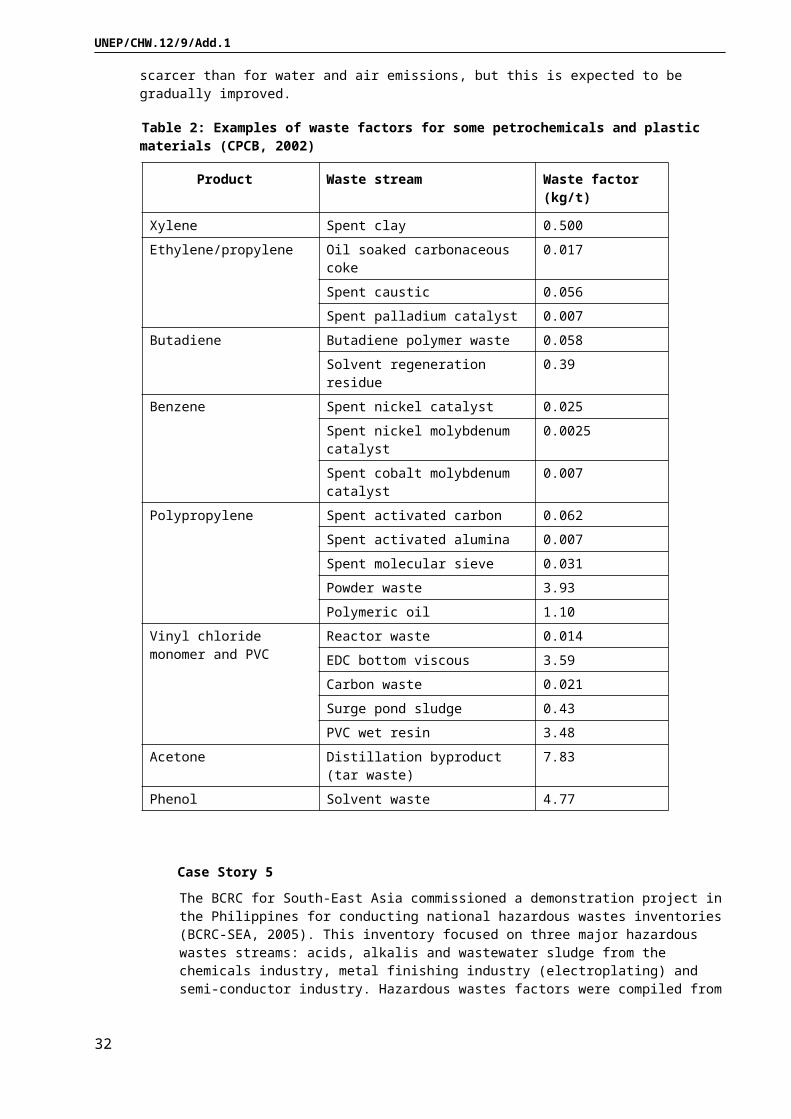
UNEP/CHW.12/9/Add.1
8.4 Waste samples132. In cases where there is uncertainty regarding the waste characteristics it may be necessary to take and analyse waste samples. Waste sampling requires a trained person and adequate protective measures. The factors affecting the hazardous constituents of the waste must be understood when determining the time of sampling. Representative samples from waste piles should be composite samples consisting of at least 10 subsamples. Classification of a waste as hazardous is not only a matter of verifying the existence of a hazardous constituent. National standards on concentration limits for the relevant chemical elements and compounds are necessary to ensure clarity. Not only that, standards are also needed to determine the ability of the toxic component to be released. Standard tests are used to simulate the potential of the hazardous constituent of a waste sample to be leached into water or acid or to be evaporated.
8.5 Access to plant specific information133. The authority commissioning the inventory must take decisions regarding the means of obtaining information and the confidentiality of the data. A consultant team cannot access industrial establishments or acquire company specific information without the voluntary participation of the plant management. Lack of cooperation may prevent the task force from entering a plant, even if it would be crucial to the goals of the inventory. On the other hand, environmental inspectors normally do have the mandate to access sites where wastes or other emissions are generated. It is good practice to engage environmental inspectors in the inventory, because the ultimate goal of conducting inventories is to identify problems and to take action to ensure environmentally safe management of hazardous wastes. Inventories can promote interaction between consultants, authorities and industrialists and should lead to a learning process. Inventories very often reveal gaps in the existing legislations and official guidelines and standards.
9. Inventories based on compliance monitoring134. When compiling first generation waste inventories the intention is to justify actions and to identify priorities for waste policies and to collect basic data for planning of waste disposal investments. At this point legislation on hazardous wastes and other wastes may still be incomplete, waste management infrastructure may be missing and institutional capacity is weak.
135. At a more advanced stage of implementing a waste strategy the constellation should be turned around: generators of hazardous wastes and other wastes are registered, they are delivering their waste to licenced disposal facilities and both the generating industry and the disposal facilities are regularly reporting their waste output and input to the regulating authority. In this scenario inventories will be based on the annual reports of the waste generators with periodical verification by means of site inspections or by comparing output reports with input reports of the waste receiving facilities.
136. The transition from the first stage to the advanced stage is a long process; it may take ten to twenty years to establish a reliable system of inventories based on self-monitoring and compliance monitoring. The road map for conducting regularly updated waste inventories is presented in figure 5.
32
UNEP/CHW.12/9/Add.1
Figure 5: Roadmap for second generation inventories
Collect data of HW import and exprt
Identify major industrial sectors
Identify major facilities in each sector
Instruct and enforce annual reporting obligations
Verify HW reports on site
Gradually widen scope and revise instructions
Identify disposal facilities
Instruct and enforce annual reporting obligations
Identify illegal disposal and discharges of HW
Gradually tighten enforcement and registration
HW generation and on-site treatment
HW flows and final disposal
Quality control of data. Comparison with secondary sources of data. Interpretation of waste classifications. Identifying information gaps and assessing reliability.
National HW inventory.
National reporting to SBC
137. It is good practice to build this system in phases, starting from the largest waste generators of the relevant industrial sectors and the disposal facilities. Gradually, the compliance monitoring is extended to medium-sized and finally to small waste generators. Industrial sectors can be classified into priority groups based on their environmental risks (e.g. red-amber-green).
138. For the sake of speeding up the transition and at the same time for fulfilling the reporting obligations of the Basel Convention, it is possible to couple first and second generation waste inventories in the transition stage. In this approach the inspection resources are focused on one geographic location known to have a variation of industrial activities. Supported by ad hoc expert teams with project type funding all significant industrial establishments are inspected in this area, wastes are categorized and estimated, annual production and employment figures are collected and current waste management practices assessed. The outputs of this intervention are a relatively reliable inventory of wastes in this geographical area and a boost for the institutional capacity that can be disseminated to other administrative districts. But also the national waste
33
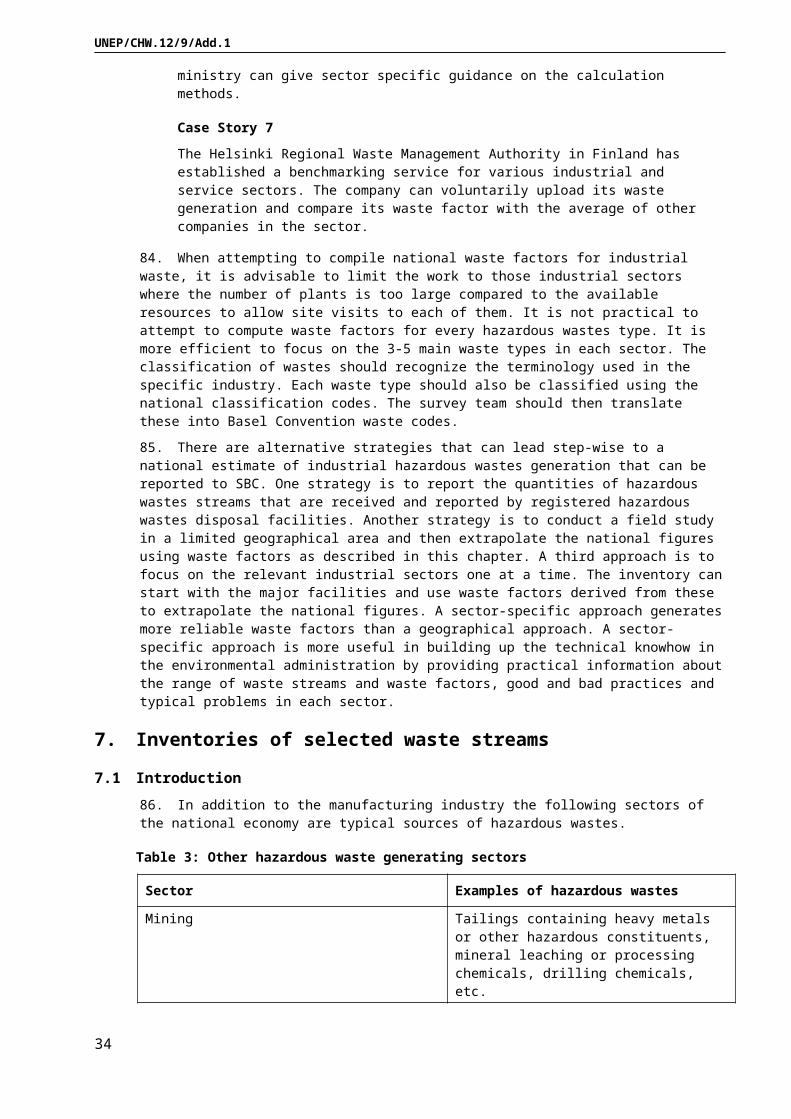
UNEP/CHW.12/9/Add.1
inventory can be built on this geographically limited data by extrapolating the result using rough waste factors, such as the value of industrial production and number of industrial workers. The result is not very reliable because of differences in the distribution of industrial sectors in different regions, but the result and the development impact is still likely to be better than only using waste factors derived from other countries.
9.1 Challenges in inventories based on compliance monitoring139. The obligation for bookkeeping and submitting information to the authorities should be enacted in the waste legislation, not forgetting sanctions for negligence. The mandate for defining the details of reporting should be left to the regulating authority. It is important to balance reporting obligations with the actual capacity of the administration to handle the incoming reports. A multi-tiered approach is again recommended. Reporting forms should not be too ambitious and detailed if they are to be used in all industrial sectors and both large and small establishments. It is good practice to define different levels of obligations for “large generator” and “small generator”.
Case Story 11In the United States a generator is defined as a large quantity generator if (U.S. EPA, 2010):
The generator generated in any single month 1,000 kg or more of hazardous waste; or
The generator generated in any single month or accumulated at any time, 1 kg of so called acute hazardous waste; or
The generator generated, or accumulated at any time, more than 100 kg of spill cleanup material contaminated with acute hazardous waste.
140. Countries are increasingly turning towards electronic data management in environmental reporting. Online registration of hazardous waste generators and reporting of annual hazardous waste generation can significantly increase the efficiency of compliance monitoring and allows many types of data searches that are not realistic in manual systems. It is important to recognize that computerized databases are as good as the data that is fed into the system. The coverage of the database of registered hazardous waste generators is one of the main bottlenecks. The quality and reliability of the reported data is the other main hurdle because of the complexity of the definition and classification of hazardous waste.
141. Electronic databases and online reporting will have their downsides. ICT experts need to interact efficiently with the waste experts. The database should be easily upgradable. Often the database plans are too ambitious and fail to be maintained. The database programmes should be transparent and simple to manage by the administration itself after the demonstration and training phase without relying on costly external service. Online connections in the country may be unreliable and data transmission too slow to provide reasonable service. Smaller companies may not have access to the internet.
142. Electronic reporting forms can alleviate data recording errors to some extent. Using menu bars with waste classes to select, providing links to explanation of terms and to additional guidelines and using alarms to indicate missing or illogical data can alleviate some of the quality assurance problems. For example the quantity of waste should not normally exceed the quantity of production in tonnes.
Case Story 12The hazardous waste inventory in the Philippines has been based on compliance monitoring since 2006. The following problems were encountered in compiling and using the hazardous waste database (Ruiz, 2012):
Sharp increase or decrease in hazardous waste generation which may be attributed to error in encoding data with different units (tonnes instead of kilograms or pieces);
Waste generated does not equal waste treated plus waste disposed plus waste stored;
Different interpretations of “treated” and “disposed”;
Present hazardous waste generation data does not reflect specific waste class but a lump sum of hazardous waste series.
143. Data exchange between the environmental administration and the national bureau of statistics is crucial and can avoid duplication of information gathering and controversies between reported data.
144. Even if it will take years before the hazardous waste generator database has reached full coverage it is possible to use the incomplete database to extract waste factors and to compile national summaries by
34

UNEP/CHW.12/9/Add.1
combining the primary data from the waste database with statistical data on industrial production by sector. Also the contribution of the small-scale industries that may be excluded from the database can be estimated based on surveys of their market share. Year by year the reliability of the database will improve and the need for extrapolation and estimation will diminish.
145. Changes in the classification of wastes are a source of complications in hazardous waste databases as the data from previous years is no longer comparable with the figures after the new classification. Such events are quite common due to changes in national or international guidelines. These must be observed when making conclusions on trends in the inventory results.
9.2 Challenges in quality control of hazardous waste databases146. The number of registered hazardous waste generators in industrialized countries can easily be thousands or tens of thousands. It is obvious that it is not possible to verify all annual reports on site. It is still essential that site visits of a sample of establishments are regularly performed to maintain a threat for revealing fraud and for the quality control of the self-monitoring reports submitted by the regulated companies or their consultants.
147. The data reported by the hazardous waste generators should pass a quality control before being fed into the national database. Comparing production figures with waste quantities can reveal errors in units. Comparison with the previous year’s figures can also reveal anomalies that need to be checked. Major deviations from sector-specific waste factors and gaps in the reporting can be criteria for choosing targets for site visits.
Case Story 13
A study in Finland verified that there were data quality problems in the Finnish waste information system. Most of the exceptional peaks in the trend of selected hazardous waste groups were explained by errors in the classification or recording of the hazardous waste amounts reported by one or few individual companies. The data of some waste generators was recorded twice or even three times (Lilja and Liukkonen, 2008).
148. A common problem in using the results from hazardous waste databases is the double counting of waste flows received at registered waste treatment facilities. Many facilities act as pre-treatment sites, where the received batches of hazardous waste are collected, merged, sorted, crushed or compacted and then delivered for further resource recovery or disposal. Outputs from storage or pre-treatment facilities should not be reported as waste generated from this facility.
10. ReferencesAMAP (Arctic Monitoring and Assessment Programme). 2000. PCB in the Russian Federation: Inventory and proposals for priority remedial actions. Executive Summary of the report on Phase I: Evaluation of the Current Status of the Problem with Respect to Environmental Impact and Development of Proposals for Priority Remedial Actions of the Multilateral Cooperative Project on Phase-out of PCB Use, and Management of PCB-contaminated Wastes in the Russian Federation. AMAP Report 2000:3. Arctic Monitoring and Assessment Programme (AMAP), Center for International Projects of the State Committee of the Russian Federation for Environmental Protection (CIP). Available at: http://www.amap.no/documents/download/1107 [Accessed on 16 March 2014].
BCRC-SEA (Basel Convention Regional Center of South-East Asia). 2005. National Inventories of Hazardous Waste: Demonstration Project in Philippines. Basel Convention Regional Centre of South-East Asia; PT Amar Binaya Karsa (AmbikA Consultants); Environmental Management Bureau (EMB), Department of Environment and Natural Resources, The Republic of the Philippines. Available at: http://www.bcrc-sea.org/?content=publication&cat=2 [Accessed on 16 March 2014].
BCRC-SEA (Basel Convention Regional Centre for South-East Asia). 2007. Regional Technical Guidelines for Inventory of Electrical and Electronic Waste. Available at: http://www.bcrc-sea.org/?content=publication&cat=2 [Accessed on 16 March 2014].
BCRC-Egypt (Basel Convention Regional Centre for Training and Technology Transfer for the Arab States). 2007. Adaptation of the Methodological Guide for the Undertaking of National Inventories of Hazardous Wastes Within the framework of the Basel Convention. Environics, Egypt.
35
UNEP/CHW.12/9/Add.1
CPCB (Central Pollution Control Board of India). 2002. Identification of Hazardous Wastes Streams, Their Characterization and Waste Minimization Options in Petrochemicals Sector. Hazardous Waste Management Series HAZWAMS/24/2002-03. Ministry of Environment & Forests, Government of India. New Delhi.
CPCB (Central Pollution Control Board of India). 2004a. Identification of Hazardous Waste Streams, Their Characterization and Waste Reduction Options in Dyes & Dye Intermediate Sector. Hazardous Waste Management Series HAZWAMS/27/2004-05. Ministry of Environment & Forests, Government of India. New Delhi.
CPCB (Central Pollution Control Board of India). 2004b. Identification of Hazardous Waste Streams, Their Characterization and Waste Minimization Options in Pesticides Sector. Hazardous Waste Management Series HAZWAMS/28/2004-05. Ministry of Environment & Forests, Government of India. New Delhi.
CPCB (Central Pollution Control Board of India). 2005. Identification of Hazardous Waste Strems, Their Characterisation and Management Options in Bulk Drugs & Pharmaceutical Sectors. Hazardous Waste Management Series HAZWAMS/29/2005-06. Ministry of Environment & Forests, Government of India. New Delhi.
DEFRA (U.K. Department for Environment, Food & Rural Affairs). 2007. Incineration of Municipal Solid Waste. Available at: http://archive.defra.gov.uk/environment/waste/residual/newtech/documents/incineration.pdf [Accessed on 16 March 2014].
Hasanuddin Suraadiningrat, D. W. 2005. Report of a Review on Methodological Guide for the Undertaking of National Inventories under Basel Convention Framework based on Existing Conditions and Case Study. Basel Convention Regional Centre for South-East Asia (BCRC-SEA); AmbikA Consultants, Indonesia.
Hoornweg, D. and Bhada-Tata, P. 2012. What a Waste: A Global Review of Solid Waste Management. Urban Development Series; Knowledge Papers No.15. Washington, DC: World Bank. Available from http://documents.worldbank.org/curated/en/2012/03/16537275/waste-global-review-solid-waste-management [Accessed on 16 March 2014]
Huseljic, V., Silajdzic, F., Kreso, E., Bacic, D., and Jovanovic, N. 2006. Background Analysis for Development and Establishment of a Lubricating Oil Management System – Final Project Report. Federal Ministry of Physical Planning and Environment; Ministry of Urbanism; Basel Convention Regional Centre Bratislava. Available at: http://archive.basel.int/centers/proj_activ/tctf_projects/003.pdf [Accessed on 16 March 2014]
ICC (Committee for Administering the Mechanism for Promoting Implementation and Compliance of the Basel Convention). 2009. Guidance Document on Improving National Reporting by Parties to the Basel Convention. Available at: http://www.basel.int/Portals/4/Basel%20Convention/docs/natreporting/guidfinal-22102009-e.pdf [Accessed on 16 March 2014].
ICC (Committee for Administering the Mechanism for Promoting Implementation and Compliance of the Basel Convention). 2011. Benchmark report aimed at facilitating reporting under paragraph 3 of Article 13 of the Basel Convention. Available at: http://www.basel.int/Portals/4/download.aspx?d=UNEP-CHW-NREP-REP-BenchmarkNationalReporting-1.English.pdf [Accessed on 16 March 2014].
Jones, E.L. 1990. Survey of Household Hazardous Waste Generation and Collection Preferences in the City of Vancouver, British Columbia. A Thesis Submitted in Partial Fulfilment of the Requirements for the Degreeof Masters of Applied Science. The Faculty of Graduate Studies, The University of British Columbia. Available at: https://circle.ubc.ca/bitstream/id/101543/UBC_1990_A7%20J66.pdf [Accessed on 16 March 2014]
Kaski A. 2008. TLE Consulting Oy. Finland. Presentation 28.2.2008.
Lakshmikantha, H. and Lakshminarasimaiah, N. 2007. Household Hazardous Waste Generation-Management. Proceedings of the International Conference on Sustainable Solid Waste Management, 5-7 September, Chennai, India. pp.163-168 Available at: http://www.swlf.ait.ac.th/IntlConf/Data/ICSSWM%20web/FullPaper/Session%20IV/4_05%20_Lakshmikantha%20H_.pdf [Accessed on 16 March 2014].
Lilja, R. and Liukkonen S. 2008. Industrial Hazardous Wastes in Finland – Trends Related to the Waste Prevention Goal. Journal of Cleaner Production 16 (3), p.343-349, Feb 2008.
Petrlík, J. and Ryder, R.A. 2005. After Incineration: The Toxic Ash Problem. “Keep the Promise, Eliminate POPs!” Campaign and Dioxin, PCBs and Waste Working Group of the International POPs Elimination Network (IPEN) Report. Available at: http://www.ipen.org/ipenweb/documents/work%20documents/incineration_ash.pdf [Accessed on 16 March 2014].
36
UNEP/CHW.12/9/Add.1
Prescott, N., Palaki, A., Tongia, S. and Niu, L. 2007. Household Survey and Waste Characterization for Nukuhetulu, Tonga. IWP-Pacific Technical Report (International Waters Project) No. 54. Secretariat of the Pacific Regional Environment Programme. Available at: http://www.globalislands.net/userfiles/tonga_4.pdf [Accessed on 16 March 2014]
Prüss, A., Emmanuel, J., Stringer, R., Pieper, U., Townend, W.,Wilburn, S. and Chartier, Y. (Eds.). 2013. Safe Management of Wastes from Health-Care Activities. 2nd Edition. World Health Organization. Available at: http://www.healthcarewaste.org/fileadmin/user_upload/resources/Safe-Management-of-Wastes-from-Health-Care-Activities-2.pdf [Accessed on 16 March 2014].
Ramadan, A. and Afifi, R. 2006. Industrial Hazardous Waste Survey in Greater Cairo Region. U.S. Trade and Development Agency, Egyptian Ministry of Environmental Affairs.
Ruiz, M.L.L.H. 2012. National Inventory of Hazardous Wastes in the Philippines. In: Workshop on National Reporting and Inventory of the Basel Convention for Asia, Banten, Indonesia, 24-26 April. BCRC South-East Asia. Available at: from http://www.bcrc-sea.org/?content=publication&cat=4 [Accessed on 16 March 2014]
SBC (Secretariat of the Basel Convention). 1994. Guidance Document on the Preparation of Technical Guidelines for the Environmentally Sound Management of Wastes Subject to the Basel Convention. Available at: http://www.basel.int/Implementation/TechnicalMatters/DevelopmentofTechnicalGuidelines/AdoptedTechnicalGuidelines/tabid/2376/Default.aspx [Accessed on 16 March 2014].
SBC (Secretariat of the Basel Convention) 2000a. Methodological guide for the undertaking of national inventories of hazardous wastes within the framework of the Basel Convention, First Version. Series/SBC No: 99/009 (E), Geneva. Available at: http://www.basel.int/Portals/4/Basel%20Convention/docs/natreporting/guidfinal-22102009-e.pdf [Accessed on 16 March 2014].
SBC (Secretariat of the Basel Convention). 2000b, Manual: Questionnaire on “Transmission of Information”, Technical Working Group, October 2000, Basel Convention Series No. 01/02. Geneva. Available at: http://www.basel.int/Portals/4/Basel%20Convention/docs/natreporting/manual/manual-e.pdf [Accessed on 16 March 2014].
SBC (Secretariat of the Basel Convention). 2000c. Technical guidelines on wastes collected from households (Y46). Series/SBC No: 02/08, Geneva. Available at: http://www.basel.int/Portals/4/Basel%20Convention/docs/meetings/sbc/workdoc/old%20docs/tech-y46.pdf [Accessed on 16 March 2014].
SBC (Secretariat of the Basel Convention). 2003. Technical guidelines on the environmentally sound management of biomedical and healthcare wastes (Y1; Y3). Series/SBC No: 2003/3, Geneva. Available at: http://www.basel.int/Portals/4/Basel%20Convention/docs/pub/techguid/tech-biomedical.pdf [Accessed on 16 March 2014].
SBC (Secretariat of the Basel Convention). 2012. Technical guidelines for the environmentally sound management of wastes consisting of elemental mercury and wastes containing or contaminated with mercury. UNEP/SBC/2012/7, Geneva. Available at: http://www.basel.int/Implementation/TechnicalMatters/DevelopmentofTechnicalGuidelines/AdoptedTechnicalGuidelines/tabid/2376/Default.aspx [Accessed on 16 March 2014].
United Nations. 2013. Globally Harmonized System of Classification and Labelling of Chemicals (GHS). Fifth revised edition. ST/SG/AC.10/30/Rev.5. United Nations. New York and Geneva. Available at: http://www.unece.org/trans/danger/publi/ghs/ghs_rev05/05files_e.html [Accessed on 16 March 2014].
United Nations. 2008. International Standard Industrial Classification of All Economic Activities. Revision 4. ST/ESA/STAT/SER.M/4/Rev.4. United Nations, New York. Available from https://unstats.un.org/unsd/cr/registry/isic-4.asp [Accessed on 16 March 2014]
U.S. EPA (U.S. Environmental Protection Agency). 2010. National Analysis: The National Biennial RCRA Hazardous Waste Report (Based on 2009 data). United States Environmental Protection Agency. EPA530-R-10-014. Available at: http://www.epa.gov/osw/inforesources/data/br09/national09.pdf [Accessed on 16 March 2014].
Verma N.K. 2009. Country Inventory Report for India. Report on Review of Hazardous Waste Management Regulations and Preparation of Training Module on Inventory of Hazardous Waste. Asian Development Bank. Available at http://www.adb.org/sites/default/files/projdocs/2009/38401-012-reg-tacr.pdf [Accessed on 16 March 2014].
WHO (World Health Organization). 2012. Guidance on Regulations for the Transport of Infectious Substances 2013-2014. WHO/HSE/GCR/2012.12. Available at:
37
UNEP/CHW.12/9/Add.1
http://apps.who.int/iris/bitstream/10665/78075/1/WHO_HSE_GCR_2012.12_eng.pdf [Accessed on 16 March 2014].
World Bank. 1999. Municipal Solid Waste Incineration. Technical Guidance Report. Washington, DC: World Bank. Available at: http://www.worldbank.org/urban/solid_wm/erm/CWG%20folder/Waste%20Incineration.pdf [Accessed on 16 March 2014].
Yılmaz, Ö. 2006. Hazardous Waste Inventory of Turkey. Thesis Submitted in Partial Fulfillment of the Requirements for the Degree of Master of Science in Environmental Engineering, Graduate School of Natural and Applied Sciences of Middle East Technical University, Turkey. Available at: http://etd.lib.metu.edu.tr/upload/12607041/index.pdf [Accessed on 16 March 2014].
Zoeteman, B.C.J., Krikke, H.R. and Venselaar, J. 2009. Handling WEEE Waste Flows: On the Effectiveness of Generator Responsibility in a Globalizing World. International Journal of Advanced Manufacturing Technology, 47, 415-436. Available at: http://arno.uvt.nl/show.cgi?fid=105665 [Accessed on 16 March 2014]
38

UNEP/CHW.12/9/Add.1
Annex 1: Abstract of the revised format for national reporting
[ Note: the abstract will be added by the ICC following the adoption by COP12 of the revised format for national reporting]
39

UNEP/CHW.12/9/Add.1
Annex 2: Examples of potentially hazardous waste streams
Annex I wastes Examples of potentially hazardous waste streams from various sources
Y1 Clinical wastes from medical care in hospitals, medical centers and clinics
Waste contaminated with blood and other body fluids; laboratory cultures and microbiological stocks; waste including excreta and other materials that have been in contact with patients infected with highly infectious diseases. Human pathological waste, including tissues, organs, and body parts and body fluids that are removed during surgery or autopsy, or other medical procedures, and specimens of body fluids and their containers. Sharps that have been used in patient care or treatment, including hypodermic needles, syringes, Pasteur pipettes, scalpel blades, blood vials, needles with attached tubing, and culture dishes. Pharmaceuticals that are expired or no longer needed; items contaminated by or containing pharmaceuticals. Cytotoxic waste containing substances with genotoxic properties (for example, waste containing cytostatic drugs; genotoxic chemicals). Waste containing chemical substances, such as laboratory reagents; film developer; disinfectants that are expired or no longer needed; solvents (for example methanol, acetone, and methylene chloride); waste with high content of heavy metals, such as batteries; broken thermometers and blood-pressure gauges.
Y2 Wastes from the production and preparation of pharmaceutical products
Off-specification or obsolete raw materials or products. Spent separation and purification solvents (for example, methanol, toluene, hexanes, acetone, etc.). Still bottoms and reaction residues (solvents, catalysts, and reactants; for example, benzene, chloroform, methylene chloride, toluene, methanol, ethylene glycol, methyl isobutyl ketone, xylenes, hydrochloric acid, etc.). Used filter media. Used chemical reagents. Dusts from filtration or air pollution control equipment. Raw material packaging wastes. Laboratory wastes. Spills, as well as wastes generated during packaging of the formulated product. Equipment cleaning washing liquids and mother liquors. Sludges from on-site wastewater treatment. Filter cakes from fermentation processes.
Y3 Waste pharmaceuticals, drugs and medicines
Potential hazardous waste pharmaceuticals include prescription drugs, chemotherapy agents (including cytotoxic, antineoplastic and cytostatic waste), controlled substances or over the counter items that are either expired, damaged or otherwise not usable for their intended purpose.
Y4 Wastes from the production, formulation and use of biocides and phytopharmaceuticals
Equipment washing liquids (aqueous or solvent) and mother liquors. Still bottoms and reaction residues. Filter cakes and spent absorbents. Sludges from on-site wastewater treatment. Containers and container liners potentially contaminated with biocides and phytopharmaceuticals. Off-specification products. Dust collected from emission control equipment, and product spills. Contaminated laboratory equipment and protective workers clothing.
Y5 Wastes from the manufacture, formulation and use of wood preserving chemicals
Equipment washing liquids and mother liquors. Still bottoms and reaction residues. Filter cakes and spent absorbents. Sludges from on-site wastewater treatment. Containers and container liners potentially contaminated with chemicals. Off-specification products. Wastewaters, process residuals, preservative drippage, and spent formulations from wood preserving processes at facilities that use chlorophenolic formulations, creosote formulations, and inorganic preservatives containing arsenic or chromium.
40

UNEP/CHW.12/9/Add.1
Annex I wastes Examples of potentially hazardous waste streams from various sources
Y6 Wastes from the production, formulation and use of organic solvents
Degreasing wastes containing solvents from the leather and fur industry. Cloth finishing wastes from the textile industry (halogenated solvents, usually perchloroethylene, is used in the scouring of fabrics and yarns). Washing liquids (halogenated and non-halogenated organic solvents) and mother liquors from organic chemical processes (manufacture of: basic organic chemicals; plastics, synthetic rubber and man-made fibres; organic dyes and pigments; organic plant protection products, wood preserving agents and other biocides; pharmaceuticals; fats, grease, soaps, detergents, disinfectants and cosmetics). Wastes from the manufacture, formulation and use of paint, varnish and ink (solvents used include hexane, cyclohexane, toluene and xylene). Waste paint or varnish remover (often contains dichloromethane). Waste adhesives and sealants containing organic solvents. Solvent-based developer solutions from the photographic industry. Waste crack-indicating agent from casting of ferrous pieces. Degreasing wastes from chemical surface treatment and coating of metals and other materials. Perchloroethylene wastes from dry cleaning facilities (cooked powder residues, still bottom residues, spent cartridges, and button/lint trap wastes). Wastes from solvent recovery.
Y7 Wastes from heat treatment and tempering operations containing cyanides
Spent cyanide solutions, quenching bath residues from oil baths and quenching wastewater treatment sludges from metal heat treating operations where cyanides are used in the process.
Y8 Waste mineral oils unfit for their originally intended use
Waste engine, gear and lubricating oils. Waste insulating and heat transmission oils. Waste hydraulic oils. Mineral oil-based brake fluid. Oil filters.
Y9 Waste oils/water, hydrocarbons/water mixtures, emulsions
Bilge oils. Oil, oily water and sludges from oil/water separators. Vehicle washwaters. Boiler blowdown sludge. Cooling tower washwaters. Cutting oils, soluble oils.
Y10 Waste substances and articles containing or contaminated with polychlorinated biphenyls (PCBs) and/or polychlorinated terphenyls (PCTs) and/or polybrominated biphenyls (PBBs)
Waste components containing PCBs from dismantling of end-of-life vehicles and vehicle maintenance. Transformers, capacitors and discarded equipment containing or contaminated by PCBs. Construction and demolition wastes containing PCB-containing sealants, resin-based floorings, or sealed glazing units. Waste hydraulic,insulating or heat transmission oils containing PCBs.
Y11 Waste tarry residues arising from refining, distillation and any pyrolytic treatment
Waste tarry residues.
Y12 Wastes from production, formulation and use of inks, dyes, pigments, paints, lacquers, varnish
Sludges, waste paint and varnish containing organic solvents (solvents used include hexane, cyclohexane, toluene and xylene), potentially hazardous metals (antimony, cadmium, chromium, lead, zinc) in the pigments or other dangerous substances. Waste paint or varnish remover (often contains dichloromethane). Waste printing toner. Waste etching solutions. Disperse oil. Waste isocyanates from the production of polyurethane paints. Waste ink and solvents from printing processes.
Y13 Wastes from production, formulation and use of resins, latex, plasticizers, glues/adhesives
Sludges, waste adhesives and sealants containing organic solvents or other dangerous substances (for example, urea formaldehyde resin)
41

UNEP/CHW.12/9/Add.1
Annex I wastes Examples of potentially hazardous waste streams from various sources
Y14 Waste chemical substances arising from research and development or teaching activities which are not identified and/or are new and whose effects on man and/or the environment are not known
Laboratory chemicals, consisting of or containing dangerous substances, including mixtures of laboratory chemicals. Discarded chemicals consisting of or containing dangerous substances.
Y15 Wastes of an explosive nature not subject to other legislation
Wastes that contain, consist of or are contaminated with, organic peroxides. Nitrocellulose waste. Picric acid waste from histology and forensic laboratories.
Y16 Wastes from production, formulation and use of photographic chemicals and processing materials
Water-based developer and activator solutions. Water-based offset plate developer solutions. Solvent-based developer solutions. Fixer solutions. Bleach solutions and bleach fixer solutions. Wastes from on-site treatment of photographic wastes.
Y17 Wastes resulting from surface treatment of metals and plastics
Pickling acids and bases. Phosphatizing sludges. Saturated or spent ion exchange resins. Sludges and filter cakes, aqueous rinsing liquids and degreasing wastes containing dangerous substances. Eluate and sludges from membrane systems or ion exchange systems containing dangerous substances. Sludges and solids from tempering processes. Wastes from hot galvanizing processes. Sludges, machining oils and emulsions from shaping and physical and mechanical surface treatment of metals and plastics. Spent waxes and fats. Spent grinding bodies, grinding materials and waste blasting material containing dangerous substances. Aqueous washing liquids. Steam degreasing wastes.
Y18 Residues arising from industrial waste disposal operations
Slag, ashes and gas cleaning wastes from incineration or pyrolysis of waste. Wastes from physico/chemical treatments of hazardous waste (for example, dechromatation, decyanidation, neutralisation). Solidified or partly stabilized hazardous wastes. Fly ash and other flue-gas treatment wastes from vitrification. Wastes from shredding of metal-containing wastes. Wastes from oil regeneration (spent filter clays, acid tars, aqueous liquid wastes, wastes from cleaning of fuel with bases, wastes from flue-gas cleaning). Wastes from the mechanical treatment of hazardous waste (for example sorting, crushing, compacting, pelletizing). Saturated or spent ion exchange resins. Grease and oil mixture from oil/water separation.
Y19 Metal carbonyls Wastes from nickel ore refining using nickel carbonyl as intermediate.Y20 Beryllium; beryllium
compoundsDiscarded beryllium powder, container residue and spill residue. Beryllium sulfate is used primarily for the production of beryllium oxide powder for ceramics.
Y21 Hexavalent chromium compounds
Wastes from hot galvanizing processes. Spent catalysts. Wastewater treatment sludges from electroplating operations. Wastewater treatment sludges from the chemical conversion coating of aluminum. Wastewaters, process residuals, preservative drippage, and spent formulations from wood preserving processes. Wastewater treatment sludge from the production of inorganic pigments (chrome yellow and orange pigments, molybdate orange pigments, zinc yellow pigments, chrome green pigments, chrome oxide green pigments, and iron blue pigments). Oven residue from the production of chrome oxide green pigments. Waste paint, varnish and ink containing potentially hazardous metals in the pigments (for example, lead chromate, strontium chromate). Wastes from manufacture of coloring glass and glass products. Glazing wastes from manufacture of ceramic goods, bricks, tiles and construction products.
42
UNEP/CHW.12/9/Add.1
Annex I wastes Examples of potentially hazardous waste streams from various sources
Y22 Copper compounds Wastes from physical and chemical processing of metalliferous and non-metalliferous minerals. Gas cleaning wastes from copper thermal metallurgy. Wastes from copper hydrometallurgical processes. Glazing wastes from manufacture of ceramic goods, bricks, tiles and construction products. Wastes from the manufacture, formulation, supply and use of salts and their solutions and metallic oxides. Waste etching solutions from the manufacture, formulation, supply and use of printing inks. Wastes from chemical surface treatment and coating of metals and other materials. Sludges and gas cleaning wastes from power stations and other combustion plants. Batteries and accumulators. Spent catalysts. Wastes from incineration or pyrolysis of waste. Wastes from vitrification of waste. Membrane system waste from wastewater treatment plants. Wastes from shredding of metal-containing wastes. Wastewaters, process residuals, preservative drippage, and spent formulations from wood preserving processes.
Y23 Zinc compounds Wastes from physical and chemical processing of metalliferous and non-metalliferous minerals. Glazing wastes from manufacture of ceramic goods, bricks, tiles and construction products. Wastes from the manufacture, formulation, supply and use of salts and their solutions and metallic oxides. Sludges and gas cleaning wastes from power stations and other combustion plants. Wastes from chemical surface treatment and coating of metals and other materials. Spent catalysts. Wastes from incineration or pyrolysis of waste. Wastes from vitrification of waste. Membrane system waste from wastewater treatment plants. Wastes from shredding of metal-containing wastes. Aqueous washing liquids and mother liquors from the manufacture of pharmaceuticals. Waste paint, varnish and ink containing potentially hazardous metals in the pigments. Wastes from zinc and other non-ferrous thermal metallurgy. Sludges from zinc hydrometallurgy (including jarosite, goethite). Wastes from hot galvanizing processes.
Y24 Arsenic; arsenic compounds
Wastes from physical and chemical processing of metalliferous and non-metalliferous minerals. Glazing wastes from manufacture of ceramic goods, bricks, tiles and construction products. Wastes from the manufacture, formulation, supply and use of salts and their solutions and metallic oxides. Sludges and gas cleaning wastes from power stations and other combustion plants. Wastes from chemical surface treatment and coating of metals and other materials. Batteries and accumulators. Wastes from incineration or pyrolysis of waste. Wastes from vitrification of waste. Membrane system waste from wastewater treatment plants. Wastes from shredding of metal-containing wastes. Wastes from lead, zinc and other non-ferrous thermal metallurgy. Wastewaters, process residuals, preservative drippage, and spent formulations from wood preserving processes. Spent catalysts. Antimony oxide production wastes
Y25 Selenium; selenium compounds
Coal combustion residues (fly ash, bottom ash, coal slag, and flue gas desulfurization residue).
Y26 Cadmium; cadmium compounds
Wastes from physical and chemical processing of metalliferous and non-metalliferous minerals. Wastes from manufacture of coloring glass and glass products. Glazing wastes from manufacture of ceramic goods, bricks, tiles and construction products. Wastes from the manufacture, formulation, supply and use of salts and their solutions and metallic oxides. Sludges and gas cleaning wastes from power stations and other combustion plants. Wastes from chemical surface treatment and coating of metals and other materials. Batteries and accumulators. Wastes from incineration or pyrolysis of waste. Wastes from vitrification of waste. Membrane system waste from wastewater treatment plants. Wastes from shredding of metal-containing wastes. Waste paint, varnish and ink containing potentially hazardous metals in the pigments. Wastes from lead, zinc and other non-ferrous thermal metallurgy. Wastes from on-site treatment of photographic wastes.
43
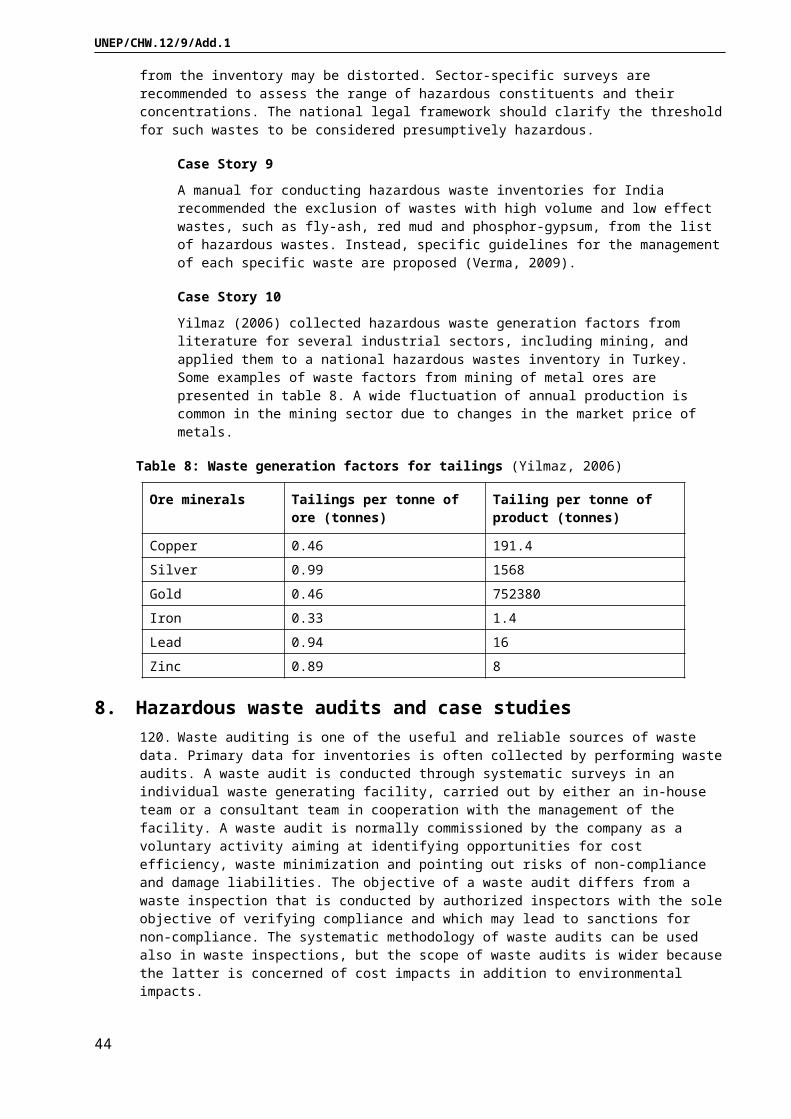
UNEP/CHW.12/9/Add.1
Annex I wastes Examples of potentially hazardous waste streams from various sources
Y27 Antimony; antimony compounds
Wastes from physical and chemical processing of metalliferous and non-metalliferous minerals. Wastes from the manufacture, formulation, supply and use of salts and their solutions and metallic oxides. Metal-containing wastes from inorganic chemical processes. Waste paint, varnish and ink containing potentially hazardous metals in the pigments (for example, antimony trioxide). Discarded electrical and electronic equipment. Sludges and gas cleaning wastes from power stations and other combustion plants. Oil and tar containing wastes from non-ferrous thermal metallurgy. Glazing wastes from manufacture of ceramic goods, bricks, tiles and construction products. Batteries and accumulators. Spent catalysts (for example from fluoromethanes production). Wastes from incineration or pyrolysis of waste. Wastes from vitrification of waste. Membrane system waste from wastewater treatment plants. Wastes from shredding of metal-containing wastes. Antimony oxide production wastes. Purification solids, bag house dust and floor sweepings from the production of dithiocarbamate acids and their salts.
Y28 Tellurium; tellurium compounds
Wastes from physical and chemical processing of metalliferous and non-metalliferous minerals. Wastes from the manufacture, formulation, supply and use of salts and their solutions and metallic oxides. Sludges and gas cleaning wastes from power stations and other combustion plants. Wastes from incineration or pyrolysis of waste. Wastes from vitrification of waste. Membrane system waste from wastewater treatment plants. Wastes from shredding of metal-containing wastes. Wastes from non-ferrous thermal metallurgy. Spent catalysts.
Y29 Mercury; mercury compounds
Wastes from physical and chemical processing of metalliferous and non-metalliferous minerals. Wastes from the manufacture, formulation, supply and use of salts and their solutions and metallic oxides. Sludges and gas cleaning wastes from power stations and other combustion plants. Batteries and accumulators. Wastes from incineration or pyrolysis of waste. Wastes from vitrification of waste. Membrane system waste from wastewater treatment plants. Wastes from shredding of metal-containing wastes. Wastes from non-ferrous thermal metallurgy. Wastes from natural gas purification. Barium sulphate sludge from halogen chemical processes. Gas cleaning waste from crematoria. Mercury switches. Amalgam waste from dental care. Fluorescent tubes.
Y30 Thallium; thallium compounds
Wastes from the production of titanium dioxide using the chloride-ilmenite process. Wastes from the manufacture of thallium-based high-temperature superconductors. Wastes from the processing of sulfide-bearing mineral deposits.
Y31 Lead; lead compounds Batteries and accumulators. Wastes from physical and chemical processing of metalliferous and non-metalliferous minerals. Waste paint, varnish and ink containing potentially hazardous metals in the pigments (for example, lead chromate). Glazing wastes from manufacture of ceramic goods, bricks, tiles and construction products. Wastes from the manufacture, formulation, supply and use of salts and their solutions and metallic oxides. Fly ash, sludges and gas cleaning wastes from power stations and other combustion plants. Gas cleaning wastes from copper thermal metallurgy. Wastes from chemical surface treatment and coating of metals and other materials. Wastes from incineration or pyrolysis of waste. Wastes from vitrification of waste. Membrane system waste from wastewater treatment plants. Wastes from shredding of metal-containing wastes. Wastes from lead, zinc and other non-ferrous thermal metallurgy. Spent catalysts. Wastes from on-site treatment of photographic wastes. Cathode ray tubes. Antimony oxide production wastes.
Y32 Inorganic fluorine compounds excluding calcium fluoride
Wastewater sludge from semiconductor plants.
44

UNEP/CHW.12/9/Add.1
Annex I wastes Examples of potentially hazardous waste streams from various sources
Y33 Inorganic cyanides Wastewater treatment sludges from electroplating operations. Spent cyanide plating bath solutions from electroplating operations. Plating bath residues, and spent stripping and cleaning bath solutions from the bottom of plating baths from electroplating operations where cyanides are used in the process. Spent cyanide solutions from salt bath pot cleaning from metal heat treating operations. Quenching bath residues from oil baths, and quenching wastewater treatment sludges from metal heat treating operations where cyanides are used in the process. Wastewater treatment sludge from the production of iron blue pigments.
Y34 Acidic solutions or acids in solid form
Acetic Acid. Chromic Acid. Hydrobromic Acid. Hydrochloric Acid. Hydrofluoric Acid. Nitric Acid. Perchloric Acid. Phosphoric Acid. Sulfuric Acid. Pickle liquor.
Y35 Basic solutions or bases in solid form
Potassium Hydroxide. Sodium Hydroxide. Ammonium Hydroxide. Alkaline cleaners.
Y36 Asbestos (dust and fibres)
Wastes containing asbestos from the manufacture of chlorine. Wastes from asbestos-cement manufacture containing asbestos. Metallic waste packaging containing asbestos. Brake pads containing asbestos. Discarded electrical and electronic equipment containing free asbestos. Insulation materials and asbestos-containing construction materials. Wastes from shredding of metal-containing wastes.
Y37 Organic phosphorus compounds
Waste of organophosphorous pesticides, including: azinphos methyl; bolstar; chlorpyrifos; coumaphos; demeton-O; demeton-S; diazinon; dichlorous, disulfoton; ethoprop; fensulfothion; fenthion; merphos; mevinphos; parathion methyl; phorate; ronnel; stirophos (tetrachloryinphos); tokuthion (prothiofos); trichloronate.
Y38 Organic cyanides Spent pot linings from aluminium smelting containing inorganic cyanides. Aqueous and aqueous-alcoholic acetonitrile wastes from liquid chromatography. Wastes from the production of acrylonitrile.
Y39 Phenols; phenol compounds including chlorophenols
Wastes from cleaning of fuels with bases (from petroleum refining). Wastes from the production of or manufacturing use of tri- or tetrachlorophenol, or of intermediates used to produce their pesticide derivatives. Wastes from the production of materials on equipment previously used for the production or manufacturing use of tri-and tetrachlorophenols. Separated aqueous stream from the reactor product washing step in the production of chlorobenzene. Waste from the production or manufacturing use of pentachlorophenol, or of intermediates used to produce its derivatives. Discarded formulations containing tri-, tetra-, pentachlorophenol or compounds derived from these chlorophenols. Residues resulting from the incineration or thermal treatment of soil contaminated with tri-, tetra-, or pentachlorophenol. Bottom sediment sludge from the treatment of wastewaters from wood preserving processes that use creosote and/or pentachlorophenol.
Y40 Ethers Brake fluids. Wastes from the production of or manufacturing use of tri- or tetrachlorophenol, or of intermediates used to produce their pesticide derivatives. Wastes from the production of materials on equipment previously used for the production or manufacturing useof tri-and tetrachlorophenols. Discarded unused formulations containing tri-, tetra- or pentachlorophenol or discarded unused formulation containing compounds derived from these chlorophenols. Still bottoms from the purification column in the production of epichlorohydrin.
Y41 Halogenated organic solvents
Solvent degreasers, vapor degreasers, dry cleaning solvents, brake cleaners, paint removers. Spent halogenated solvents: tetrachloroethylene, trichloroethylene, methylene chloride, 1,1,1-trichloroethane, carbon tetrachloride, chlorinated fluorocarbons, chlorobenzene, 1,1,2-trichloro-1,2,2-trifluoroethane, ortho-dichlorobenzene, trichlorofluoromethane, and 1,1,2-trichloroethane. Still bottoms from the recovery of these spent solvents and
45

UNEP/CHW.12/9/Add.1
Annex I wastes Examples of potentially hazardous waste streams from various sources
spent solvent mixtures.Y42 Organic solvents
excluding halogenated solvents
Paint thinners, lacquer thinners, alcohol cleaners. Spent non-halogenated solvents: xylene, acetone, ethyl acetate, ethyl benzene, ethyl ether, methyl isobutyl ketone, n-butyl alcohol, cyclohexanone, methanol, cresols, cresylic acid, nitrobenzene, toluene, methyl ethyl ketone, carbon disulfide, isobutanol, pyridine, benzene, 2-ethoxyethanol, and 2-nitropropane. Still bottoms from the recovery of these spent solvents and spent solvent mixtures.
Y43 Any congenor of polychlorinated dibenzo-furan
Waste from the production or manufacturing use of pentachlorophenol, or of intermediates used to produce its derivatives. Wastes from the production of or manufacturing use of tri- or tetrachlorophenol, or of intermediates used to produce their pesticide derivatives. Wastes from the manufacturing use of tetra-, penta, or hexachlorobenzenes under alkaline conditions. Discarded formulations containing tri-, tetra- or pentachlorophenol or discarded formulations containing compounds derived from these chlorophenols. Wastewaters, process residuals, preservative drippage, and spent formulations from wood preserving processes generated at plants that currently use or have previously used chlorophenolic formulations. Wastewater treatment sludges from the production of ethylene dichloride or vinyl chloride monomer.
Y44 Any congenor of polychlorinated dibenzo-p-dioxin
By-products of various industrial processes (for example, bleaching paper pulp, and chemical and pesticide manufacture) and combustion activities (for example, burning household trash, forest fires, and waste incineration). Waste from the production or manufacturing use of pentachlorophenol, or of intermediates used to produce its derivatives. Wastes from the production of or manufacturing use of tri- or tetrachlorophenol, or of intermediates used to produce their pesticide derivatives. Wastes from the manufacturing use of tetra-, penta, or hexachlorobenzenes under alkaline conditions. Discarded formulations containing tri-, tetra- or pentachlorophenol or discarded formulations containing compounds derived from these chlorophenols. Wastewaters, process residuals, preservative drippage, and spent formulations from wood preserving processes generated at plants that currently use or have previously used chlorophenolic formulations. Wastewater treatment sludges from the production of ethylene dichloride or vinyl chloride monomer.
Y45 Organohalogen compounds other than substances referred to in this Annex (e.g. Y39, Y41, Y42, Y43, Y44)
Chlorofluorocarbons and halons. Discarded equipment containing chlorofluorocarbons, HCFC, HFC. Gases in pressure containers containing CFCs and derivatives, including halons, as propellants.
46

UNEP/CHW.12/9/Add.1
Annex 3: Template for collecting waste data from generators in the industrial sector
47

UNEP/CHW.12/9/Add.1
48

UNEP/CHW.12/9/Add.1
49
UNEP/CHW.12/9/Add.1
Physical state: Liquid; Semi-liquid; Solid; GasR-Code: Recovery operations (R1 to R13, Annex IV, Section B, of the Basel Convention)D-Code: Disposal operations (D1 to D15, Annex IV, Section A, of the Basel Convention)
50
UNEP/CHW.12/9/Add.1
Annex 4: Case study: PCB inventory from electric appliances
This annex is a summary of a study conducted in the Russian Federation (AMAP, 2000). In addition, PCB concentration assumptions (i.e. concentrations that may be assumed without testing) applicable to transformers and capacitors are given based on United States regulations.
I. Methodology1. To ensure maximum completeness and reliability in assessing the total amount of PCB, and preparing the inventory of PCB containing equipment and waste in Russia, two independent sources of data collection were employed. The first were the territorial environmental protection authorities (covering the 89 administrative territories of Russian Federation) which collected information on a regional basis and submitted this to the State Committee for Environmental Protection. The second source of information was data collected by relevant ministries from industrial enterprises located throughout Russia in which inventory activities were conducted.
2. These requests for information on production, use and storage of PCB, were sent to the following ministries and organizations connected with various industrial activities: the State Committee for Statistics, Ministry of Economy, Ministry of Fuel and Energy, Ministry of Defense, the electric power network and several other companies. The electric power sector in Russia is divided into a number of enterprises responsible for production of electricity and the distribution networks. These are again divided into both federal and regional levels of subordination. The electric power network consists of the ‘Russian joint-stock company of joint electric energy systems’ (RAO ‘ES of Russia’) and 76 regional energy systems, all of whom were sent the request for information on PCBs. For technical reasons, equipment with PCB is not used in electricity production (only transformers filled with mineral transformer oil are used in electricity production). In the distribution network, however, capacitors containing PCB are used. The following industrial branches (according to the State Committee for Statistics classification) were excluded as not being users of equipment containing significant amounts of PCB:
(a) Food industry;
(b) Light industry;
(c) Production of building materials.
3. The Ministry of Defense officially replied that it would not take part in the inventory of PCB or PCB-containing equipment because PCB-containing equipment and materials are not in use anymore. For this reason, the use and disposal of PCB in the military sector was not assessed in the present project. In the major industrial sectors: chemical and petro-chemical sector, ferrous and non-ferrous metallurgical industries, mechanical engineering, and timber (including pulp and paper) industry, some 300 enterprises, which may utilize high power capacitors and transformers were selected by the Ministry of Economy of the Russian Federation. The same number of enterprises was selected in the electric energy sector. According to the State Committee for Statistics, the number of large enterprises in Russia in 1997 was 265, and the total number of enterprises included in the inventory (600) is approximately twice this number.
4. As of December 1999, data were submitted by 79 administrative territories of the Russian Federation to the State Committee for Environmental Protection, and information for the inventory was supplied to the ministries by a total of 950 large- and medium-sized enterprises. This, according to expert estimation, covered approximately 80 per cent of the total number of enterprises which may have PCB or PCB-containing equipment. The inventory conducted by territorial environmental protection authorities incorporates information concerning presence of capacitors and transformers in all enterprises, also including the food industry, light industry and the building industry.
II. Realization5. The State Committee of the Russian Federation for Environmental Protection prepared and issued a “Guide to conduct of the inventory of production, equipment and materials, using and containing PCB, and PCB-contaminated wastes in the territory of the Russian Federation” for use by the territorial environmental protection authorities and experts in the various industries. This guide contained information on the basic physic-chemical and toxic properties of PCBs, trademarks of PCB-containing materials manufactured in the former Soviet Union, fields of use of PCB, and also possible items and materials containing PCB. This information facilitated identification of PCB and PCB-containing equipment for inclusion in the responses to the distributed questionnaire. Official information submitted by governmental and economic organizations at
51

UNEP/CHW.12/9/Add.1
federal and regional levels was used during project implementation. The complete project was subdivided into six tasks covering:
(a) Information on production of PCB;
(b) Information on production of PCB-containing equipment;
(c) Information on use of PCB-containing equipment;
(d) Information on PCB-contaminated industrial waste;
(e) Information on releases of PCB from industrial waste;
(f) Recommendations.
6. Data were collected by employees of the relevant ministries and territorial environmental protection authorities. Data were then submitted to the State Committee of the Russian Federation for Environmental Protection, for processing by the Russian experts group that was established by order of the State Committee to carry out the project. The Center for International Projects of the State Committee of the Russian Federation for Environmental Protection (CIP) provided logistical support and prepared the reporting documentation for each task. This documentation was then submitted to the Arctic Monitoring and Assessment Programme (AMAP) Secretariat and to the project International Steering Group for review and eventual approval.
III. Use of PCB-containing equipment7. The questionnaires returned from industries where equipment containing PCB is used, included information on the numbers of transformers and capacitors (the major PCB sources) in use or held in reserve at the enterprises. From industrial enterprises 167 responses were received as of December 1999 (56 per cent return of the distributed questionnaires). According to this information base, the amount of transformer and capacitor PCB fluids totals some 11,700 tonnes. The responses from the energy and fuel sectors (168 responses, 56 per cent return) showed that the energy network accounts for the major part of the PCB containing equipment, and the major amount of PCB. The total amount of PCB contained in equipment in use or in reserve in the fuel and electric energy enterprises is approximately 3,140 tonnes, of which only about 100 tonnes is in the coal and petroleum industries. As of December 1999, data had been submitted from 79 of the 89 territorial environmental protection authorities (ca. 90 per cent response rate). Of these, 19 answered that no PCB-containing equipment was used in their regions. This primarily concerned regions of Siberia. The information received from the territorial environmental protection authorities includes additional data from smaller enterprises and non-industrial uses, which are not taken into account in the industrial sector based inventories. These uses add some 6,700 tonnes of PCB.
A. Transformers and capacitors8. The amount of PCB in transformers (if not stated explicitly in the questionnaire response) was estimated from data obtained from the Chirchik transformer plant. Ten types of PCB-containing transformers were produced with a Sovtol1 content ranging from 160 to 2,980 kg. The average amount (1,746 kg) was used to estimate PCB contained in transformers.
9. An average amount of PCB in capacitors was estimated from questionnaire responses where this information was provided. These capacitors had an average TCB content of 17.2 kg. This value was used to estimate TCB in capacitors in cases where questionnaire response only included information on the number of capacitors held.
B. Combined results10. According to results of the inventory of PCB in PCB-containing equipment in the Russian Federation, the total amount of PCB was 20,000 tonnes. The identified PCB, in PCB-containing equipment, is equivalent to about 11 per cent of the total PCB production of the former Soviet Union and the Russian Federation that took place between 1939 and 1993 (when production ceased).
1 PCB was produced under three brand-names: Sovol (a mixture of tetra- and pentachlorinated PCBs (used as a plasticiser in paints and varnishes); Sovtol: Sovol mixed with 1,2,4 trichlorobenzene; especially in the ratio 9:1, named Sovtol-10 (used in
transformers); Trichlorobiphenyl (TCB): Mixed isomers of trichlorobiphenyl (used in capacitors).
52
UNEP/CHW.12/9/Add.1
11. When the identified PCB in PCB-containing equipment is grouped according to regional distribution, a non-uniform distribution is observed. The largest amounts of PCB are located in the North, Central, Volga and Ural regions; these regions account for approximately 65 per cent of the total identified amount of PCB in the Russian Federation.
IV. Concentration assumptions applicable to transformers and capacitors2
A. PCB-contaminated electrical equipment12. PCB-contaminated electrical equipment includes, but is not limited to, transformers (including those used in railway locomotives and self-propelled cars), capacitors, circuit breakers, reclosers, voltage regulators, switches (including sectionalizers and motor starters), electromagnets, and cable, that contains PCBs at concentrations of ≥50 ppm and <500 ppm in the contaminating fluid. In the absence of liquids, electrical equipment is “PCB-Contaminated” if it has PCBs at >10 µg/100 cm2 and <100 µg/100 cm2 as measured by a standard wipe test of a non-porous surface.
13. Mineral oil-filled electrical equipment manufactured before 2 July 1979,3 and whose PCB concentration is not established should be assumed to be “PCB-Contaminated Electrical Equipment”. Electrical equipment manufactured after 2 July 1979, may be assumed to be non-PCB (i.e. <50 ppm PCBs). If the date of manufacture of mineral oil-filled electrical equipment is unknown, it should be assumed to be “PCB-Contaminated”.
14. Transformers with <1.36 kg of fluid, circuit breakers, reclosers, oil-filled cable, and rectifiers whose PCB concentration is not established, may be assumed to contain PCBs at <50 ppm. All pole-top and pad-mounted distribution transformers manufactured before 2 July 1979, should be assumed to be mineral-oil filled.
B. Transformers15. A “PCB Transformer” is any transformer that contains ≥500 ppm PCBs. A transformer manufactured prior to 2 July 1979, that contains 1.36 kg or more of fluid other than mineral oil and whose PCB concentration is not established, should be assumed to be a “PCB Transformer”. If the date of manufacture and the type of dielectric fluid are unknown, it should also be assumed that the transformer is a PCB “Transformer”.
C. Capacitors16. A “PCB Capacitor” is any capacitor that contains ≥500 ppm PCBs. A “small capacitor” is a capacitor which contains less than 1.36 kg of dielectric fluid. A capacitor whose total volume is less than 1,639 cm3 may be considered to contain less than 1.36 kgs of dielectric fluid and a capacitor whose total volume is more than 3,278 cm3 must be considered to contain more than 1.36 kg of dielectric fluid. A capacitor whose volume is between 1,639 and 3,278 cm3 may be considered to contain less then 1.36 kg of dielectric fluid if the total weight of the capacitor is less than 4.08 kg. A “large capacitor” is a capacitor which contains 1.36 kg or more of dielectric fluid.
17. A capacitor manufactured prior to July 2, 1979, whose PCB concentration is not established should be assumed to contain ≥500 ppm PCBs. A capacitor manufactured after July 2, 1979, may be assumed to be non-PCB (i.e., <50 ppm PCBs). If the date of manufacture is unknown, it should be assumed that the capacitor contains ≥500 ppm PCBs. A capacitor marked at the time of manufacture with the statement “No PCBs” may be assumed to be non-PCB.
22 Polychlorinated Biphenyls (PCBs) Manufacturing, Processing, Distribution in Commerce, and Use Prohibitions. Title 40 United States Code of Federal Regulations. Part 761. 2014 Ed.33 PCB production was banned by the United States Congress in 1979.
53

UNEP/CHW.12/9/Add.1
Annex 5: Case: Household survey and waste characterization for Nukuhetulu, Tonga
This annex is a summary of a simple household waste inventory conducted in Tonga (Prescott et al., 2007).
I. Methodology1. The survey involved qualitative and quantitative data collection, and was carried out in the Tongan language. The survey methodology consisted of face-to-face interviews and on-site weighing of waste. All answers and observations by the survey team were recorded immediately on the survey questionnaires. Most of the qualitative data collected was from the waste characterization component of the survey, generated through an on-site weighing of waste generated by each household. Each household was given empty 25-kg bags for waste collection, as well as instructions for classifying the waste for each (seven) day surveyed. All waste collected was emptied onto a tarpaulin sheet and weighed and recorded after confirming the type of waste (according to the classification table provided in the questionnaire).
2. All households in Nukuhetulu were surveyed, giving a response rate of 100 per cent (391 people). The data collected were entered and stored in an MS Excel spreadsheet for analysis and interpretation. A basic statistical program (used with MS Excel) was used for data analysis. Percentages (both in the socioeconomic survey and waste quantities generated) were also calculated.
II. Results3. The total quantity of waste being generated in Nukuhetulu daily is approximately half a tonne (502.4 kg), which equals 183 tonnes annually. The generation rate was calculated to be 1.29 kg of waste produced per person per day. Of 63 households in Nukuhetulu, 63 per cent disposed of their waste by burning. About 20% disposed of their waste by throwing into the lagoon or the bush, and 16% buried their waste. Only 1% was recorded as recycling or reusing waste.
III. Conclusions4. The half a ton of waste generated each day in Nukuhetulu is high and almost twice the quantity indicated by two previous studies conducted at the landfill site. The difference is most likely due to the high quantity of biodegradable garden and kitchen waste, however, much of which would not have been recorded by the earlier landfill-based study.
5. The implication of the survey results for International Waters Project (IWP) is clear. There is a fair amount of organic rubbish that is disposed of by each household into the environment, including the lagoon and mangrove areas. The majority of households in Nukuhetulu disposed of their waste by burning, although that creates further environmental problems. Persistent organic pollutants (POPs), such as dioxin and furan, are formed by incomplete combustion and burning of plastics; burning also produces methane, carbon monoxide and carbon dioxide. Recycling is not a common practice in Nukuhetulu, and households are probably unaware of recycling methods.
____________________
54