Views on Economic Inequality in the State of New...
49
Views on Economic Inequality in the State of New Jersey March 2016 Kelly E. Sloane Public Policy Researcher William J. Hughes Center for Public Policy Stockton University PhD. Candidate, Temple University 101 Vera King Farris Drive Galloway, NJ 08025
Transcript of Views on Economic Inequality in the State of New...
Views on Economic Inequality in the
State of New Jersey
March 2016
Kelly E. SloanePublic Policy Researcher
William J. Hughes Center for Public Policy Stockton University
PhD. Candidate, Temple University101 Vera King Farris Drive
Galloway, NJ 08025

Views on Economic Inequality in the State of New Jersey
I. Executive Summary
II. Introduction
III. Summary of Survey Findings
A. New Jersey and U.S. Economy
B. Lived Experience
C. Economic Futures
D. Policy Tolerance
E. Regional Differences
F. Comparing New Jersey with National Surveys
IV. Demographics
V. Survey Questions and Data
VI. References

Views on Economic Inequality in the State of New Jersey 2
I. Executive Summary
During the Great Recession, political scientists Benjamin Page (Northwestern University)
and Lawrence Jacobs (University of Minnesota) published Class War?: What Americans Really
Think About Economic Inequality (2009). Surveying opinion data from the 1930s forward, Page
and Jacobs concluded that no matter an individual’s political affiliation, “When [an American’s]
well-being (and that of people they care about) is threatened, or when their dreams are blocked
by forces beyond their control, they turn to concrete government programs for help — programs
that would greatly decrease economic inequality” (Page & Jacobs, 2009, xi). In November of
2015, the Stockton Polling Institute conducted a state-wide poll to learn if Page & Jacobs
conclusions and national opinions about economic inequality hold true in post-recession New
Jersey.
As economic inequality has emerged as one of the hottest topics of the 2016 presidential
campaign, the William J. Hughes Center for Public Policy at Stockton University is pleased to
present a new project that considers the views, policy preferences, and economic experiences of
New Jersey residents. Our poll offers opinions on policies such as the minimum wage, universal
pre-K funding, and student loan interest rates. We also ask New Jerseyans about significant
economic experiences like the loss of a job or purchase of a new home in addition to their
perspectives on the Great Recession and economic futures of New Jersey families.
Our key findings include:
State of the Economy
• The sense of economic vulnerability New Jersey residents are experiencing nearly seven years after the Great Recession is profound with 55% of our sample feeling as though their income is falling behind the cost of living and nearly 37% suggesting their income is just keeping pace.
• Only 20% believe economic conditions in the state are good (14%) or excellent (6%).
Views on Economic Inequality in the State of New Jersey 3
• Nearly 70% of New Jerseyans believe the U.S. economy is still in a recession.
Lived Experience
• During the last year, most of our respondents and their family members did not experience economic hardships like the loss of a job or deep food insecurity.
• Similarly, the majority of those polled also did not enjoy economic achievements like the purchase of a new home or job promotion.
• The majority (60%) of New Jersey residents we polled predicted that today’s children will be worse off financially than their parents.
Policy Tolerance
• Our poll finds overwhelming support for policy interventions designed to address poverty
and income inequality. • Poll respondents believe that government has the responsibility and capacity to disrupt
economic inequality. • New Jerseyans strongly favor (55.5%) or favor (24.2%) increasing the tax rate for
Americans earning more than $1 million annually. • The majority of those surveyed strongly favor or favor:
o Holding down interest rates on student loans; o Paid sick leave for full time employees; o Paid leave for the birth or adoption of a child; o State or federally funded pre-K; and, o Raising the minimum wage to $15 hourly.
• New Jersey residents identified jobs as the most important issue influencing their vote for president in 2016.
• Residents of South Jersey are especially downcast when evaluating the state of New Jersey’s economy, the condition of the national economy, and the persistence of the Great Recession.
The policy debates about economic inequality that are currently taking place at the state
and federal level in addition to the policy tolerance expressed by our sample highlight the
pressing post-recession needs and desires of New Jerseyans. The Great Recession may
technically be over but the majority of New Jersey residents we surveyed continue to feel
economically vulnerable and believe government intervention is warranted.
II. Introduction

Views on Economic Inequality in the State of New Jersey 4
In May 2015, The William J. Hughes Center for Public Policy published the
report Economic Indicators and Quality of Life in Southern New Jersey, which explored county-
level economic differences experienced by New Jersey residents. That project garnered interest
from the press and public as it was featured in print, radio and Internet news reports and
generated thousands of views of the accompanying Tableau Public data visualizations. More
importantly, the report prompted questions asking why Southern New Jersey counties do not fare
as well as those in the Central and Northern regions of the state. The findings also fostered
discussion about the consequences of economic inequality in the relatively affluent and well-
educated state of New Jersey.
Economic inequality has become an important research area because there is clear
evidence demonstrating that income, wages, and wealth are highly correlated with “quality of
life,” which includes education access and attainment, safe neighborhoods, economic mobility,
regional development, rates of civic engagement as well as concentrated affluence, poverty and
individual life outcomes (Sloane, 2015). Building on the Hughes Center exploratory research and
contributing to public opinion research on economic inequality, we are pleased to present a new
project that considers the views, policy preferences, and economic experiences of New Jersey
residents.
In November 2015, the Polling Institute at Stockton University conducted a state-wide
public opinion poll by telephone with 802 adults 18 years of age and older. We asked
respondents to share their perspective on the current state of the economy, as well as opinions on
public policies and their individual economic futures. The poll was based on several national
opinion surveys conducted within the last twenty-four months and we compare some of the
views and experiences of New Jersey residents with the perspectives of other Americans. The

Views on Economic Inequality in the State of New Jersey 5
survey questions we replicated for our research purposes were principally drawn from two
nation-wide surveys:
• The American Values Survey (2014), an annual survey conducted by the Public Religion
Research Institute and disseminated cooperatively with The Brookings Institute; and,
• The most recent iteration of the Pew Research Center’s Political Survey (2014)
conducted by the Pew Research Center’s U.S. Politics and Policy division and USA
TODAY.
We also considered The Opportunity Agenda’s Opportunity Survey (2014), a public
opinion poll regarding equality of opportunity created by Langer Research Associates, and Class
War?: What Americans Really Think About Economic Inequality, a pre-recession historical
survey (Page & Jacobs, 2007), and analysis (Page & Jacobs, 2009) of evolving views on
economic inequality in the United States. These polls take different approaches toward surveying
individual opinions on policies such as the minimum wage and education in addition to
economic experiences like the loss of a job or the purchase of a new home. The questions also
address individual perspectives on the Great Recession and economic futures of New Jersey
families.
In keeping with the Hughes Center mission to foster greater representation for South
Jersey, the analysis of the survey considers statistically significant geographic differences
between the New Jersey counties and regions. In addition to geographic differences, we also
consider similarities and differences between the New Jersey and national polls.
Views on Economic Inequality in the State of New Jersey 6
II. Summary of Survey Findings
A. New Jersey and U.S. Economy
Roughly one-third of our poll was devoted to surveying adult opinions about the New
Jersey and U.S. economy. Before the first 2016 presidential primary votes were cast, nearly sixty
percent (58%) of New Jersey residents surveyed disapproved of the way Chris Christie was
handling his job as governor.1 Further, 66% of New Jersey residents believe the state is on the
wrong track. President Barack Obama’s approval rating among New Jersey residents was higher
than Christie’s (47%) yet, the majority (60%) of those surveyed believe the country is “on the
wrong track.”
Table 1
New Jersey USA
Right Direction 25.9% 31.8%
Wrong Track 65.5% 60.4%
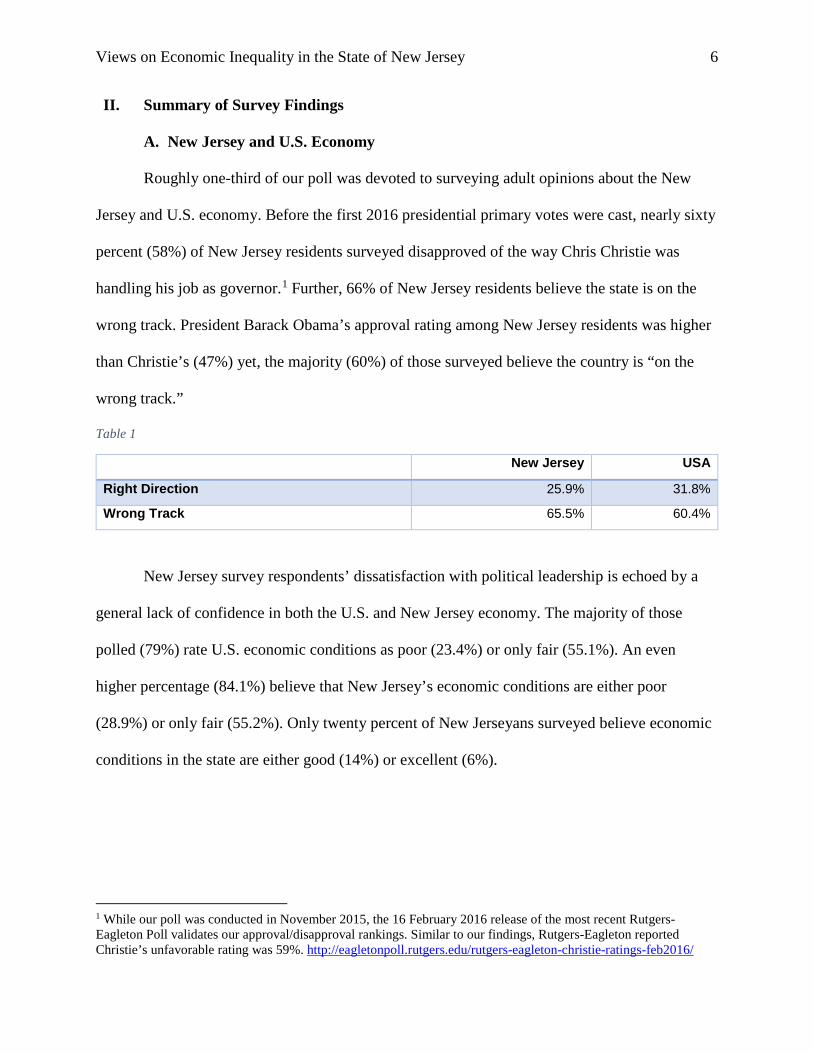
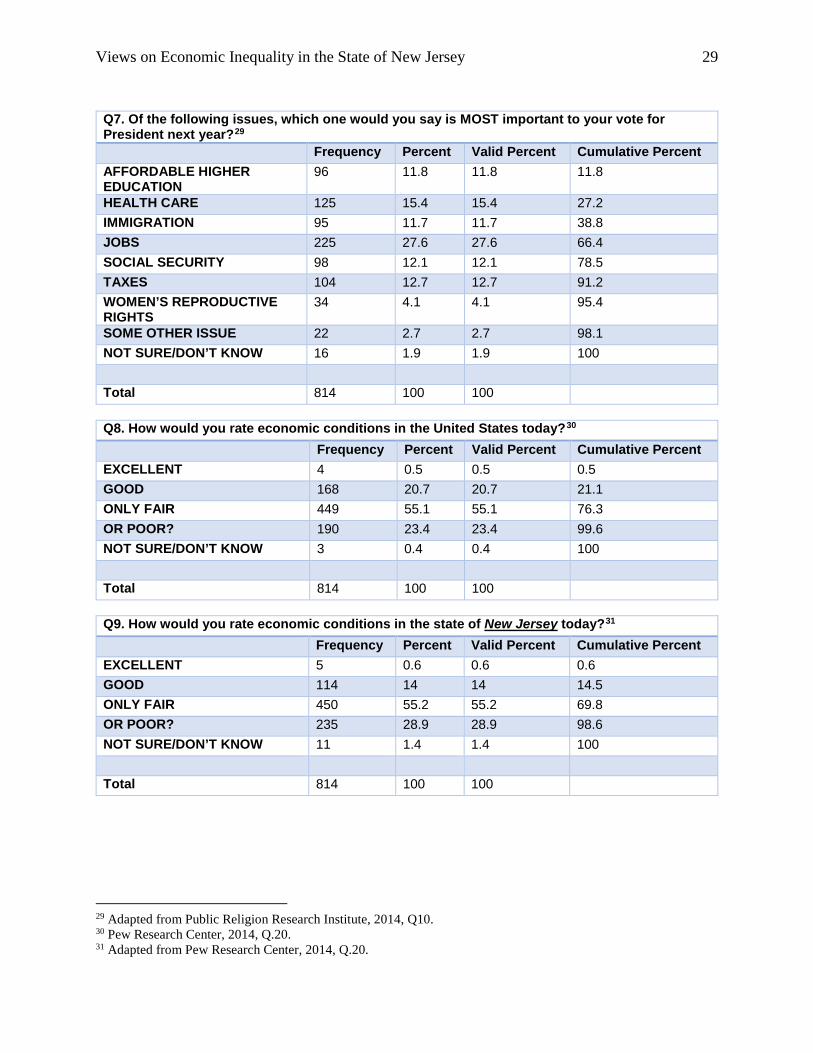
New Jersey survey respondents’ dissatisfaction with political leadership is echoed by a
general lack of confidence in both the U.S. and New Jersey economy. The majority of those
polled (79%) rate U.S. economic conditions as poor (23.4%) or only fair (55.1%). An even
higher percentage (84.1%) believe that New Jersey’s economic conditions are either poor
(28.9%) or only fair (55.2%). Only twenty percent of New Jerseyans surveyed believe economic
conditions in the state are either good (14%) or excellent (6%).
1 While our poll was conducted in November 2015, the 16 February 2016 release of the most recent Rutgers-Eagleton Poll validates our approval/disapproval rankings. Similar to our findings, Rutgers-Eagleton reported Christie’s unfavorable rating was 59%. http://eagletonpoll.rutgers.edu/rutgers-eagleton-christie-ratings-feb2016/
Views on Economic Inequality in the State of New Jersey 7
Figure 1. Economic conditions today.2
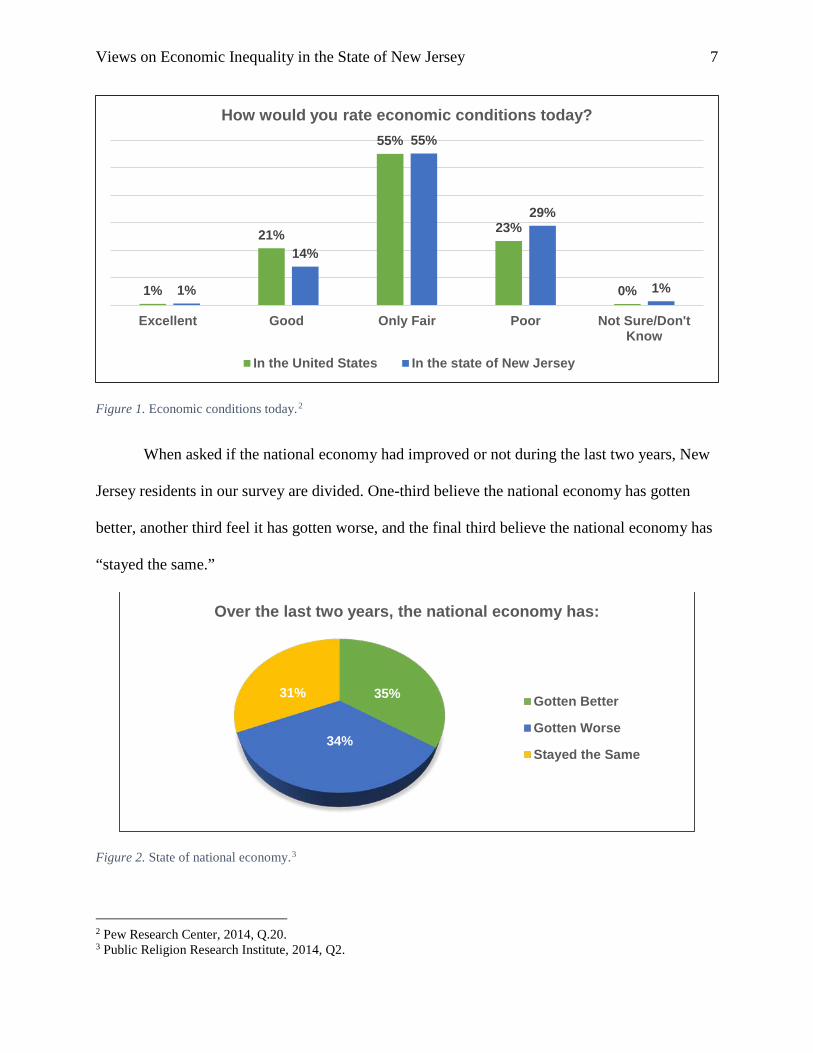
When asked if the national economy had improved or not during the last two years, New
Jersey residents in our survey are divided. One-third believe the national economy has gotten
better, another third feel it has gotten worse, and the final third believe the national economy has
“stayed the same.”
Figure 2. State of national economy.3
2 Pew Research Center, 2014, Q.20. 3 Public Religion Research Institute, 2014, Q2.
1%
21%
55%
23%
0%1%
14%
55%
29%
1%
Excellent Good Only Fair Poor Not Sure/Don'tKnow
How would you rate economic conditions today?
In the United States In the state of New Jersey
35%
34%
31%
Over the last two years, the national economy has:
Gotten Better
Gotten Worse
Stayed the Same
Views on Economic Inequality in the State of New Jersey 8
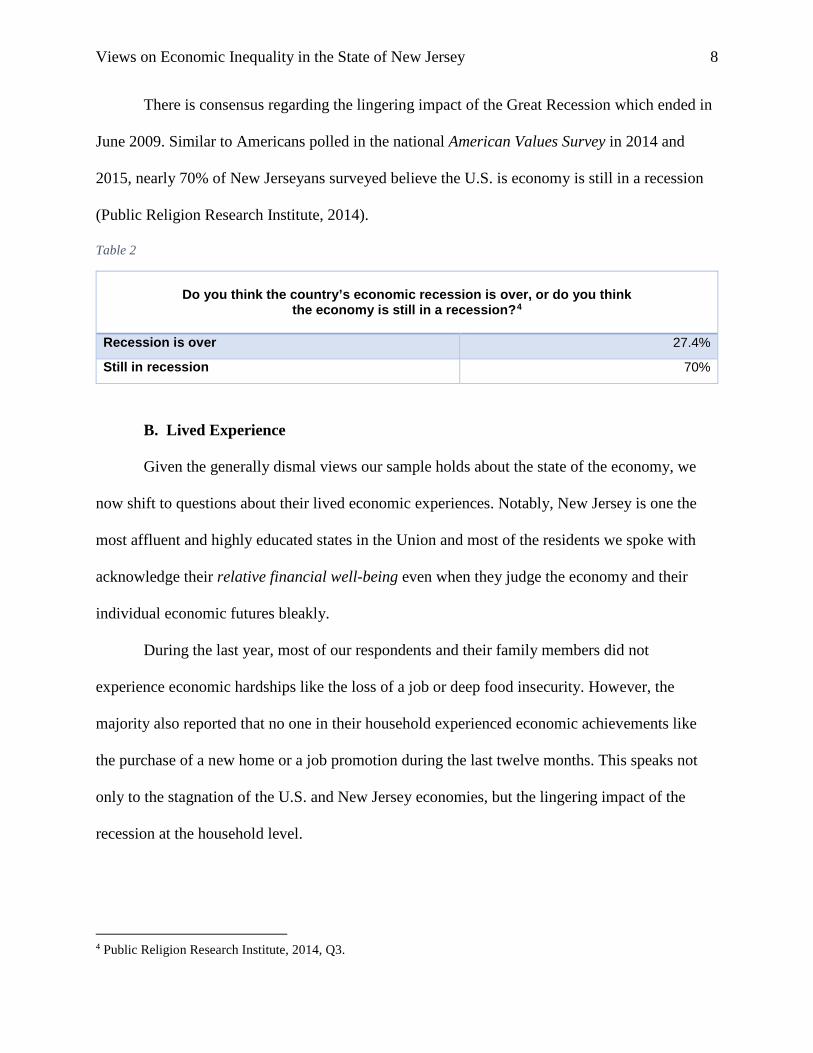
There is consensus regarding the lingering impact of the Great Recession which ended in
June 2009. Similar to Americans polled in the national American Values Survey in 2014 and
2015, nearly 70% of New Jerseyans surveyed believe the U.S. is economy is still in a recession
(Public Religion Research Institute, 2014).
Table 2
Do you think the country’s economic recession is over, or do you think
the economy is still in a recession?4
Recession is over 27.4%
Still in recession 70%
B. Lived Experience
Given the generally dismal views our sample holds about the state of the economy, we
now shift to questions about their lived economic experiences. Notably, New Jersey is one the
most affluent and highly educated states in the Union and most of the residents we spoke with
acknowledge their relative financial well-being even when they judge the economy and their
individual economic futures bleakly.
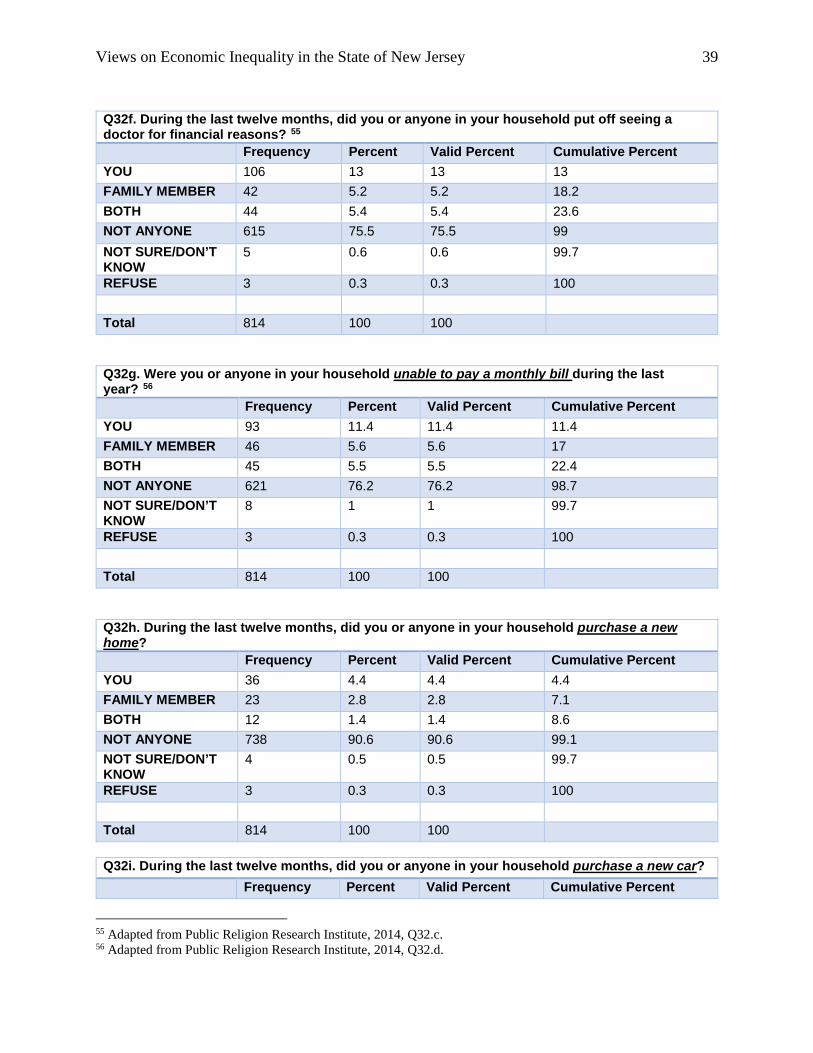
During the last year, most of our respondents and their family members did not
experience economic hardships like the loss of a job or deep food insecurity. However, the
majority also reported that no one in their household experienced economic achievements like
the purchase of a new home or a job promotion during the last twelve months. This speaks not
only to the stagnation of the U.S. and New Jersey economies, but the lingering impact of the
recession at the household level.
4 Public Religion Research Institute, 2014, Q3.

Views on Economic Inequality in the State of New Jersey 9
Figure 3. The last twelve months.5
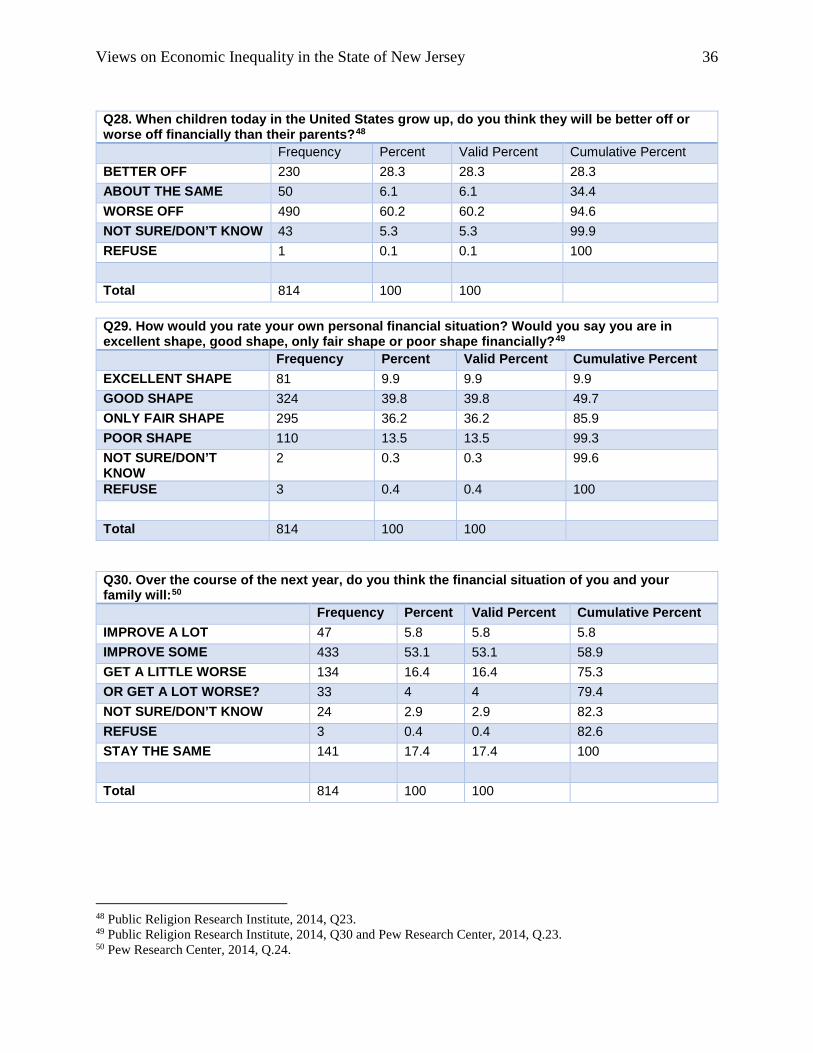
Overall, there appears to be a sense of economic vulnerability but also cautious optimism
about individual economic futures. Nearly half of our survey respondents said that their personal
financial situation is either in good or excellent shape, while another 36% stated they were only
in fair financial shape. Importantly, close to 14% reported their personal finances were poor.
5 Public Religion Research Institute, 2014, Q30.a, Q32.b, Q32.c, Q32.d, Q32.e, Q32.f, and Q32.g.
65%
69%
72%
73%
76%
76%
81%
81%
86%
91%
92%
No one received a raise or promotion
No one purchased a new car
No one got a new job
No one cut back on food to save money
No one put off seeing a doctor
No one was unable to pay a monthly bill
No one lost a job
No one had their work hours reduced
No one received unemployment benefits
No one purchased a new home
No one received foodstamps
During the last year, in my household...
Views on Economic Inequality in the State of New Jersey 10
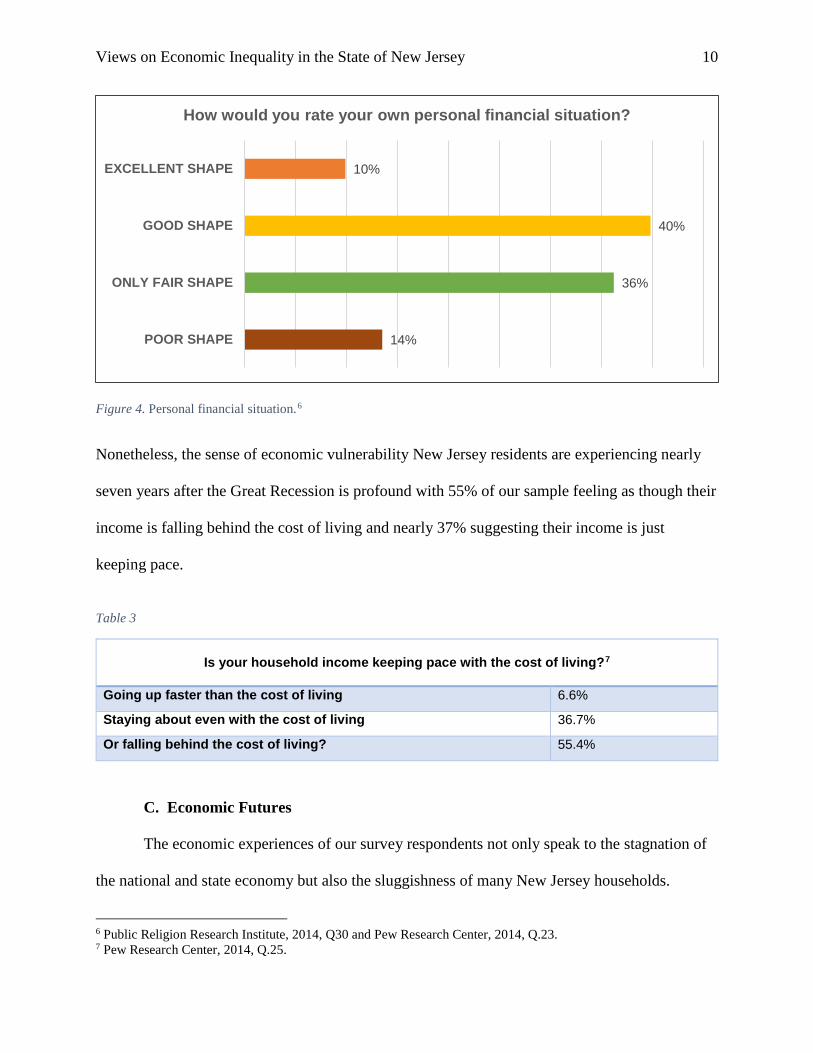
Figure 4. Personal financial situation.6
Nonetheless, the sense of economic vulnerability New Jersey residents are experiencing nearly
seven years after the Great Recession is profound with 55% of our sample feeling as though their
income is falling behind the cost of living and nearly 37% suggesting their income is just
keeping pace.
Table 3
Is your household income keeping pace with the cost of living?7
Going up faster than the cost of living 6.6%
Staying about even with the cost of living 36.7%
Or falling behind the cost of living? 55.4%
C. Economic Futures
The economic experiences of our survey respondents not only speak to the stagnation of
the national and state economy but also the sluggishness of many New Jersey households.
6 Public Religion Research Institute, 2014, Q30 and Pew Research Center, 2014, Q.23. 7 Pew Research Center, 2014, Q.25.
10%
40%
36%
14%
EXCELLENT SHAPE
GOOD SHAPE
ONLY FAIR SHAPE
POOR SHAPE
How would you rate your own personal financial situation?

Views on Economic Inequality in the State of New Jersey 11
Although people continue to feel anxious about the economy and their economic futures, there
are also glimmers of hopefulness. When we asked our respondents about their economic
“forecast,” in keeping with persistent American optimism, close to 60% of survey respondents
said their financial situation will improve “some” or “a lot” during the next year.
Figure 5. Financial situation.8
Compared with other Americans, the majority (82%) of New Jersey survey respondents feel they
are doing better (55%) or the same (26.8%) economically as others. Only 15% percent reported
doing worse than other Americans.
Figure 6. Better or same.9
8 Pew Research Center, 2014, Q.24. 9 Adapted from Public Religion Research Institute, 2014, Q.31.
6%
53%
16%
4%
17%
Improve a lot Improve some Get a little worse Get a lot worse Stay the same
During the next year, our financial situation will:
55%
15%27%
Are you doing better or worse than other Americans?
BETTER WORSE SAME
Views on Economic Inequality in the State of New Jersey 12
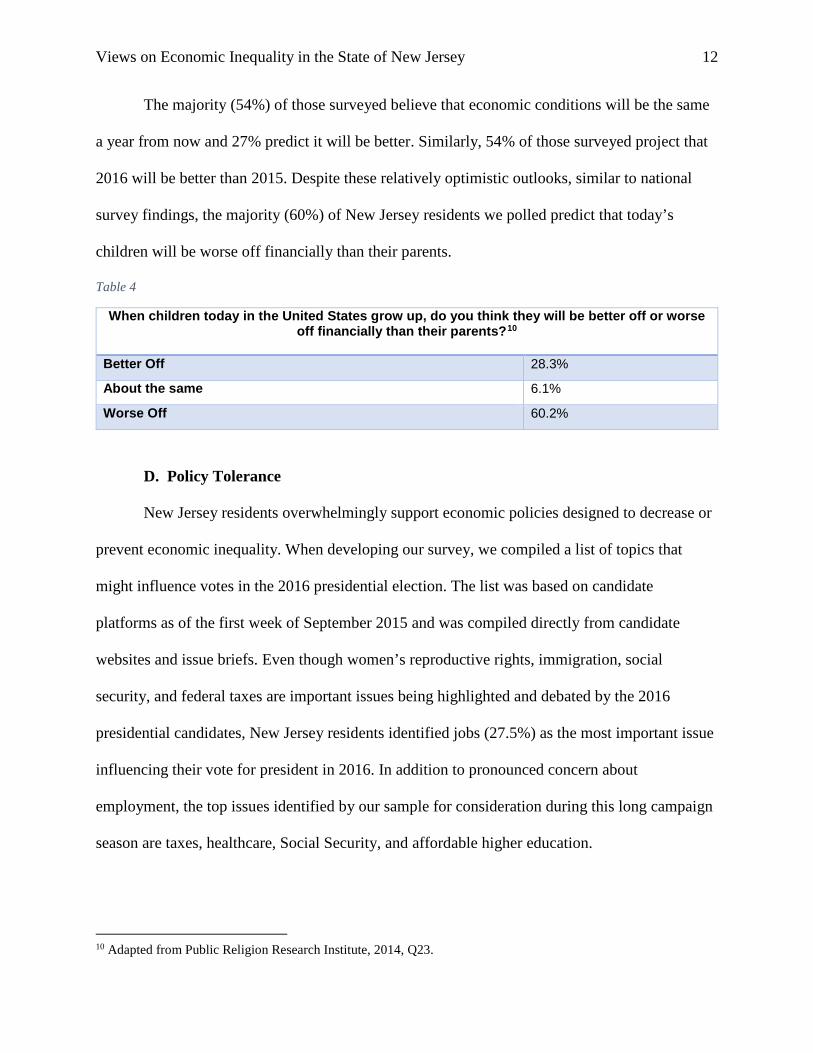
The majority (54%) of those surveyed believe that economic conditions will be the same
a year from now and 27% predict it will be better. Similarly, 54% of those surveyed project that
2016 will be better than 2015. Despite these relatively optimistic outlooks, similar to national
survey findings, the majority (60%) of New Jersey residents we polled predict that today’s
children will be worse off financially than their parents.
Table 4
When children today in the United States grow up, do you think they will be better off or worse off financially than their parents?10
Better Off 28.3%
About the same 6.1%
Worse Off 60.2%
D. Policy Tolerance
New Jersey residents overwhelmingly support economic policies designed to decrease or
prevent economic inequality. When developing our survey, we compiled a list of topics that
might influence votes in the 2016 presidential election. The list was based on candidate
platforms as of the first week of September 2015 and was compiled directly from candidate
websites and issue briefs. Even though women’s reproductive rights, immigration, social
security, and federal taxes are important issues being highlighted and debated by the 2016
presidential candidates, New Jersey residents identified jobs (27.5%) as the most important issue
influencing their vote for president in 2016. In addition to pronounced concern about
employment, the top issues identified by our sample for consideration during this long campaign
season are taxes, healthcare, Social Security, and affordable higher education.
10 Adapted from Public Religion Research Institute, 2014, Q23.
Views on Economic Inequality in the State of New Jersey 13
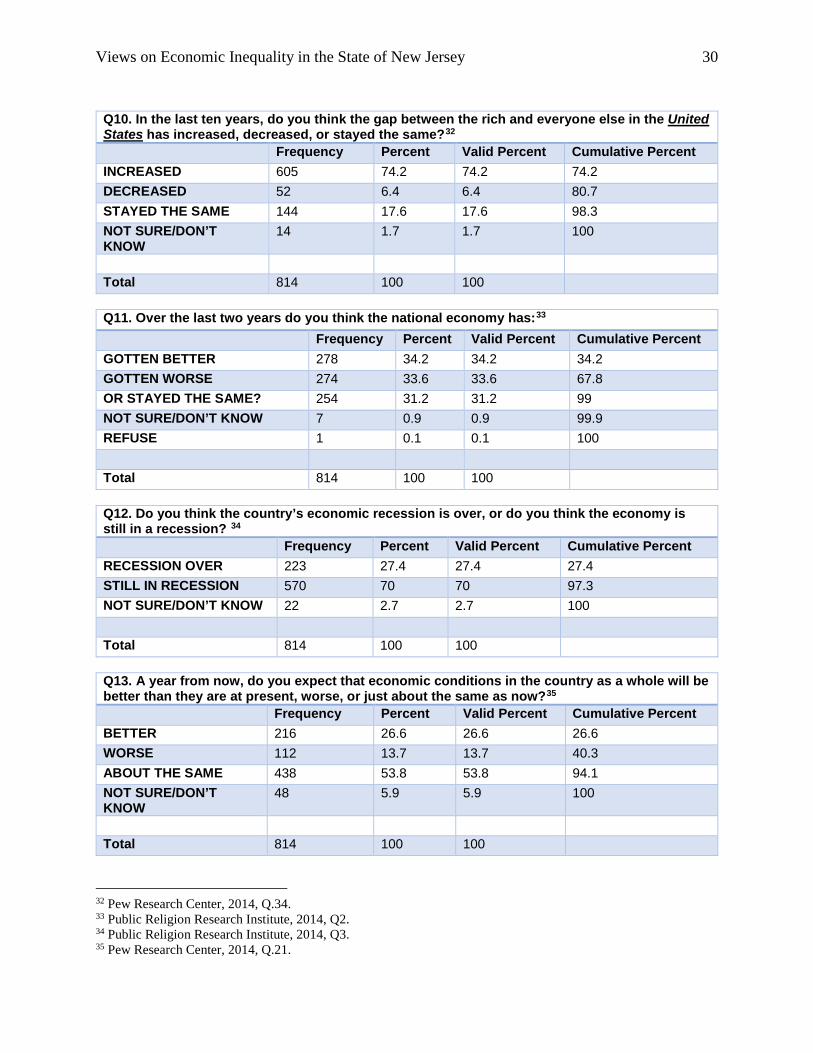
In addition to asking New Jerseyans their opinions on the state and national economy, we
also wanted to learn more about their views on specific economic policies. The individuals we
spoke with overwhelmingly support policy interventions designed to address poverty and income
inequality. With regard to tolerance for poverty policy, 88% percent of New Jersey residents
participating in our survey believe the government should do “a lot” or “some” to reduce
poverty. Further, 81% believe government policy can do “a lot” or some” to reduce poverty even
though government policies and programs “haven’t done much” as of November 2015. Forty-
three percent of those surveyed said the government hadn’t “done much” and 21% said the
government had done “nothing at all” to reduce poverty.
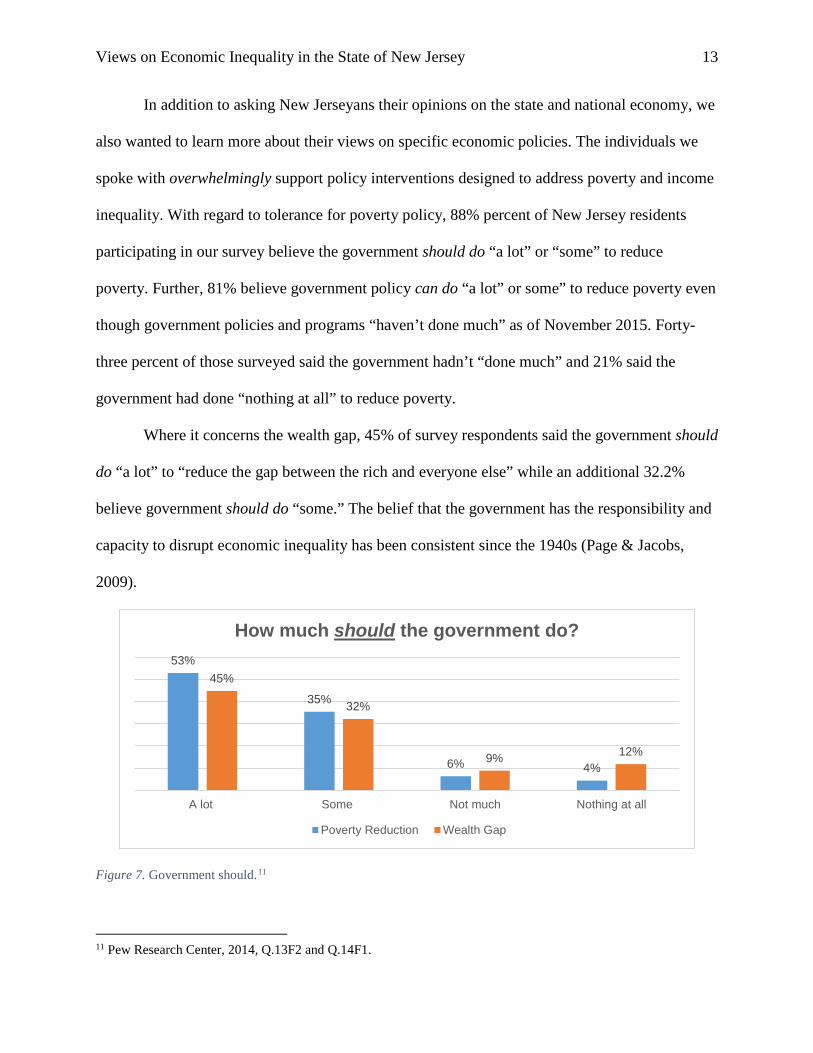
Where it concerns the wealth gap, 45% of survey respondents said the government should
do “a lot” to “reduce the gap between the rich and everyone else” while an additional 32.2%
believe government should do “some.” The belief that the government has the responsibility and
capacity to disrupt economic inequality has been consistent since the 1940s (Page & Jacobs,
2009).
Figure 7. Government should.11
11 Pew Research Center, 2014, Q.13F2 and Q.14F1.
53%
35%
6% 4%
45%
32%
9% 12%
A lot Some Not much Nothing at all
How much should the government do?
Poverty Reduction Wealth Gap
Views on Economic Inequality in the State of New Jersey 14
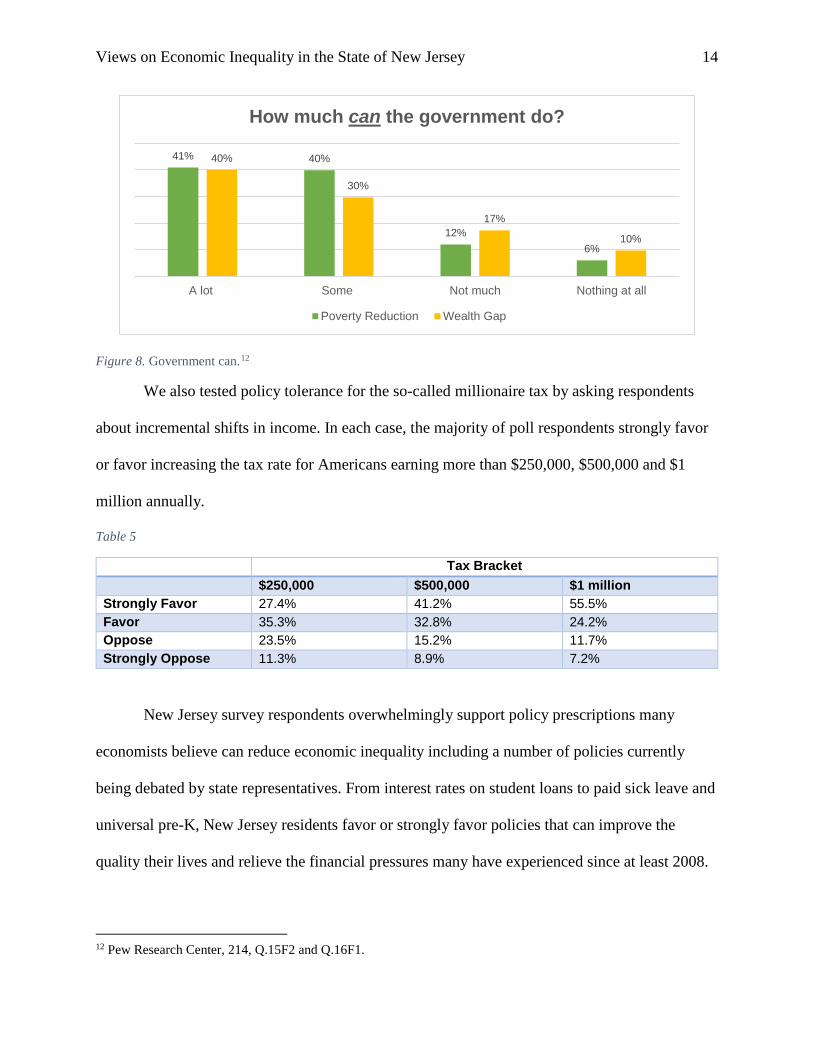
Figure 8. Government can.12
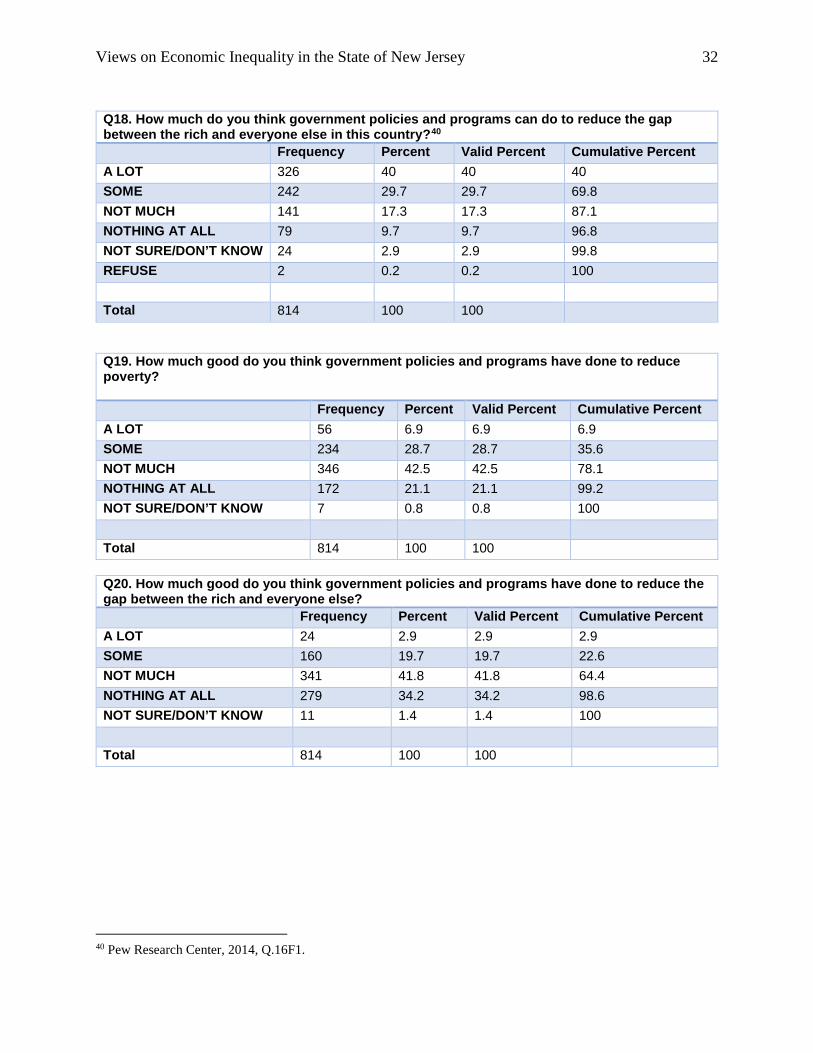
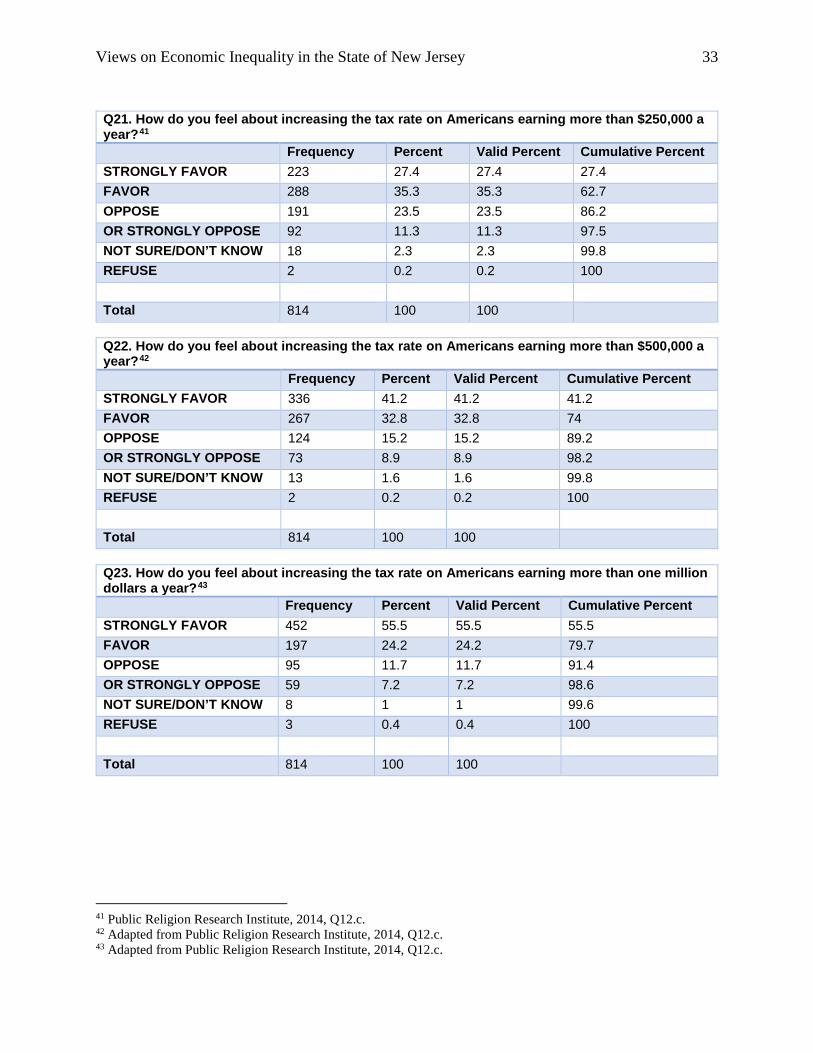
We also tested policy tolerance for the so-called millionaire tax by asking respondents
about incremental shifts in income. In each case, the majority of poll respondents strongly favor
or favor increasing the tax rate for Americans earning more than $250,000, $500,000 and $1
million annually.
Table 5
Tax Bracket $250,000 $500,000 $1 million Strongly Favor 27.4% 41.2% 55.5% Favor 35.3% 32.8% 24.2% Oppose 23.5% 15.2% 11.7% Strongly Oppose 11.3% 8.9% 7.2%
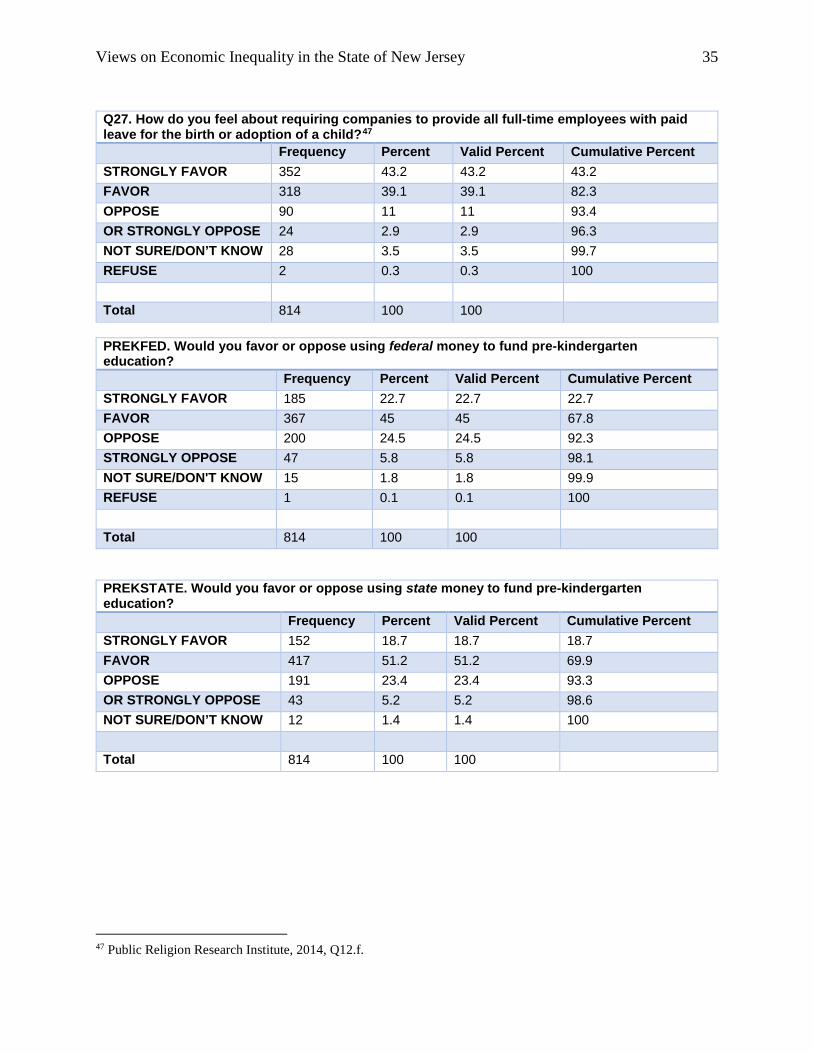
New Jersey survey respondents overwhelmingly support policy prescriptions many
economists believe can reduce economic inequality including a number of policies currently
being debated by state representatives. From interest rates on student loans to paid sick leave and
universal pre-K, New Jersey residents favor or strongly favor policies that can improve the
quality their lives and relieve the financial pressures many have experienced since at least 2008.
12 Pew Research Center, 214, Q.15F2 and Q.16F1.
41% 40%
12%6%
40%
30%
17%
10%
A lot Some Not much Nothing at all
How much can the government do?
Poverty Reduction Wealth Gap

Views on Economic Inequality in the State of New Jersey 15
Figure 9. Public policy tolerance.13
The Hughes Center has been monitoring state policy debates about economic inequality
and policy interventions during the last year. Media attention and discourse on inequality has
only grown as economic policy has become a primary source of debate in the 2016 presidential
contest. Since conducting our survey, there has been an increased sense of urgency in debates
about inequality, education and labor policy at the national and state level. Last month, New
Jersey Senate President Stephen Sweeney, Assembly Majority Leader Louis Greenwald,
Representative Donald Norcross and Senator Shirley K. Turner announced “collaborative plans
to introduce legislation to require a $15.00 per hour minimum wage.” (Wisniewski, 2016) In
response, the New Jersey Chamber of Commerce and other “business groups” are forming a
13 Adapted from Public Religion Research Institute, 2014, Q12 series; The Opportunity Agenda Survey, 2014, Q 29g; and Pew Research Center, 2014, Q.46.
63%
68%
69%
80%
82%
89%
Raising the minimum wage to $15 hourly
Federally financed pre-Kindergarten
State financed pre-Kinderegarten
Paid leave for the birth or adoption of a child
Paid sick days for all full time employees
Holding down interest rates on student loans
Strongly favor or favor economic public policy

Views on Economic Inequality in the State of New Jersey 16
coalition to block efforts to increase the minimum wage or the implementation of mandatory
paid sick leave which they argue will cause “suffering” for New Jersey businesses and
employees. (Marcus, 2016)
Similar debates are percolating on the education policy front. According to the National
Institute for Early Education Research, in 2014, only 19% of three year olds and 29% of four
year olds residing in the state of New Jersey were enrolled in preschool programs (National
Institute for Early Education Research, 2014). In early February 2016, Senate Education Chair
M. Teresa Ruiz introduced legislation to expand early childhood education in New Jersey (Clark,
2016). In Washington, D.C., higher education costs remain a hot legislative topic. A roundtable
including New Jersey Senator Bob Menendez was held in February to better understand the long-
term implications of student loan debt (Jackson, 2016). As we have previously reported, there is
a relationship between educational attainment, employment and life outcomes. These policy
debates and the tolerance expressed by our sample highlight the pressing post-recession needs
and desires of New Jerseyans.
E. Regional Differences
There were few statistically significant regional differences in our poll. This suggests that
no matter where New Jerseyans live, our respondents hold similar views regarding the economy
and display strong consensus in favor of economic policies designed to decrease inequality. The
Hughes Center and Stockton University Polling Institute define the Central, North and Southern
geographic regions by county clusters in Figure 10.
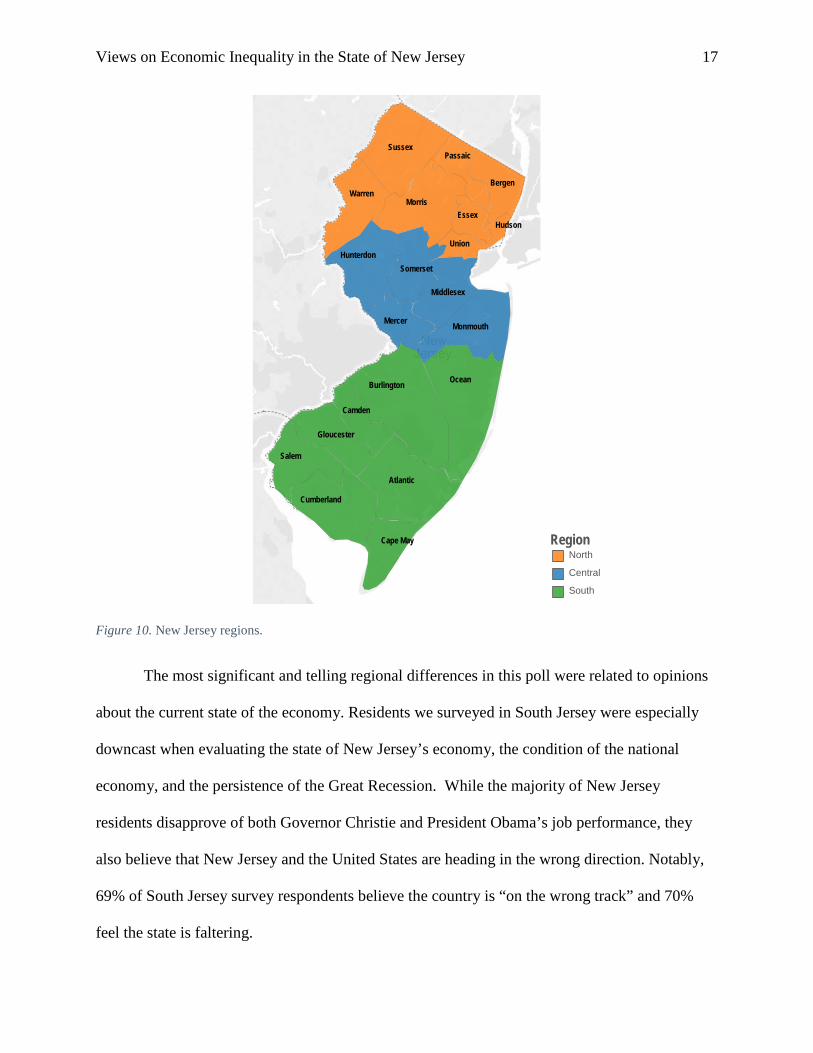
Views on Economic Inequality in the State of New Jersey 17
Figure 10. New Jersey regions.
The most significant and telling regional differences in this poll were related to opinions
about the current state of the economy. Residents we surveyed in South Jersey were especially
downcast when evaluating the state of New Jersey’s economy, the condition of the national
economy, and the persistence of the Great Recession. While the majority of New Jersey
residents disapprove of both Governor Christie and President Obama’s job performance, they
also believe that New Jersey and the United States are heading in the wrong direction. Notably,
69% of South Jersey survey respondents believe the country is “on the wrong track” and 70%
feel the state is faltering.
Salem
Ocean
Gloucester
Cumberland
Cape May
Camden
Burlington
Atlantic
Somerset
Monmouth
Middlesex
Hunterdon
WarrenMorris
Hudson
Bergen
PassaicSussex
Mercer
Essex
Union
RegionNorth
Central
South

Views on Economic Inequality in the State of New Jersey 18
Figure 11. United States wrong track.
Figure 12. New Jersey wrong track.
Considering the economic challenges many South Jersey residents have endured since the
recession, it is not surprising that our poll respondents exhibit some geographic differences with
regard to the state of New Jersey’s economy. Thirty-nine percent of South Jersey respondents
believe the national economy has gotten worse compared with 31% Central and 32% North
27%
68%
5%
32%
56%
12%
36%
57%
6%
Right Direction
Wrong Track
Not Sure/Don't Know
Is the country headed in the right direction,or is it on the wrong track?
South Central North
23%
70%
7%
26%
65%
9%
28%
63%
9%
Right Direction
Wrong Track
Not Sure/Don't Know
Is New Jersey headed in the right direction,or is it on the wrong track?
South Central North

Views on Economic Inequality in the State of New Jersey 19
Jersey residents. A testament to the lack of development and opportunity, 76% of South Jersey
residents believe the United States is still in economic recession compared with 65% in Central
and 68% in North Jersey. South Jersey residents have a similarly despondent view of the state
economy. Thirty-six percent of South Jersey respondents rated economic conditions in the state
of New Jersey “poor” and 51% “only fair.” See Dr. Oliver Cooke’s most recent edition of The
South Jersey Economic Review for in-depth analysis of South Jersey’s post-recession economy.
Figure 13. Economic conditions.14
F. New Jersey and National Surveys: Similarities and Differences
As noted in the introduction, we created our survey by reviewing and adapting questions
from several national polls investigating economic inequality. These polls helped define the
parameters of our survey as each took different approaches to consider knowledge, feelings, and
“lived experience” of economic inequality as well as public views regarding “opportunity”
policy interventions. The majority of questions we adapted or replicated come from the Pew
14 Pew Research Center, 2014, Q.20.
Excellent Good Only fair Poor Not sure/don'tknow
0%
11%
51%
36%
1%0%
19%
55%
25%
1%1%
13%
59%
25%
2%
How would you rate economic conditions in the stateof New Jersey today?
South Central North
Views on Economic Inequality in the State of New Jersey 20
Research Center/USA Today “Pew Political Survey” (January 2014) and the Public Religion
Research Institute/The Brookings Institution “American Values Survey” (September 2014).
The Pew Political Survey is a national survey (1500 adults, January 2014) that explores
opinions on economic inequality and is attentive to: partisan differences; policy
preferences/solutions; and, the ideological dispositions of survey respondents regarding fairness
and hard work. Similar to the Hughes Center, the Pew Research Center is non-partisan. The
Public Religion Research Institute’s American Values Survey is a national poll (4500 adults,
July-August 2014) that considers economic inequality from multiple angles. The survey
addresses opinions; partisanship; lived experience with emphasis on economic security;
ideological dispositions regarding fairness and equality of opportunity; outlook; and, policy
solutions. The Public Religion Research Institute partners with Brookings to conduct joint
studies. The Public Religion Research Institute is non-profit, non-partisan, and “dedicated to
research at the intersection of religion, values and public life”
(http://publicreligion.org/about/#.VXhWo89VhBc).
When comparing similarities and differences between the national survey findings and
our November 2015 poll of New Jersey residents, we learned:
• Like many New Jersey residents, most Americans believe the government “should do a
lot” (53%) or “some” (29%) to reduce poverty in the United States.15 Similarly, 69% of
Americans believe the government “should do a lot” or “some” to address the wealth
gap16 between the “rich and everyone else.”
• Americans continue to feel economically vulnerable in this post-recession period. Similar
to the majority of New Jerseyans we surveyed, the majority of Americans surveyed by
15 Pew Research Center, 2014, Q.12F2. 16 Pew Research Center, 2014, Q.14F1.
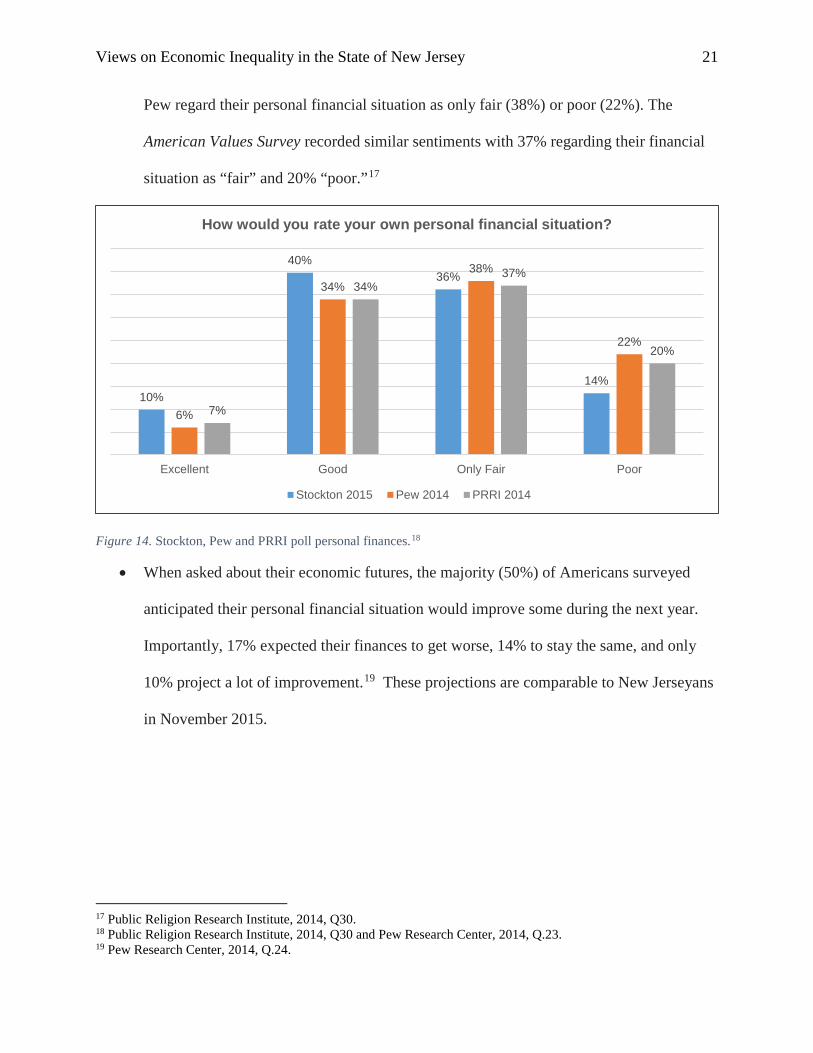
Views on Economic Inequality in the State of New Jersey 21
Pew regard their personal financial situation as only fair (38%) or poor (22%). The
American Values Survey recorded similar sentiments with 37% regarding their financial
situation as “fair” and 20% “poor.”17
Figure 14. Stockton, Pew and PRRI poll personal finances.18
• When asked about their economic futures, the majority (50%) of Americans surveyed
anticipated their personal financial situation would improve some during the next year.
Importantly, 17% expected their finances to get worse, 14% to stay the same, and only
10% project a lot of improvement.19 These projections are comparable to New Jerseyans
in November 2015.
17 Public Religion Research Institute, 2014, Q30. 18 Public Religion Research Institute, 2014, Q30 and Pew Research Center, 2014, Q.23. 19 Pew Research Center, 2014, Q.24.
10%
40%36%
14%
6%
34%38%
22%
7%
34%37%
20%
Excellent Good Only Fair Poor
How would you rate your own personal financial situation?
Stockton 2015 Pew 2014 PRRI 2014
Views on Economic Inequality in the State of New Jersey 22
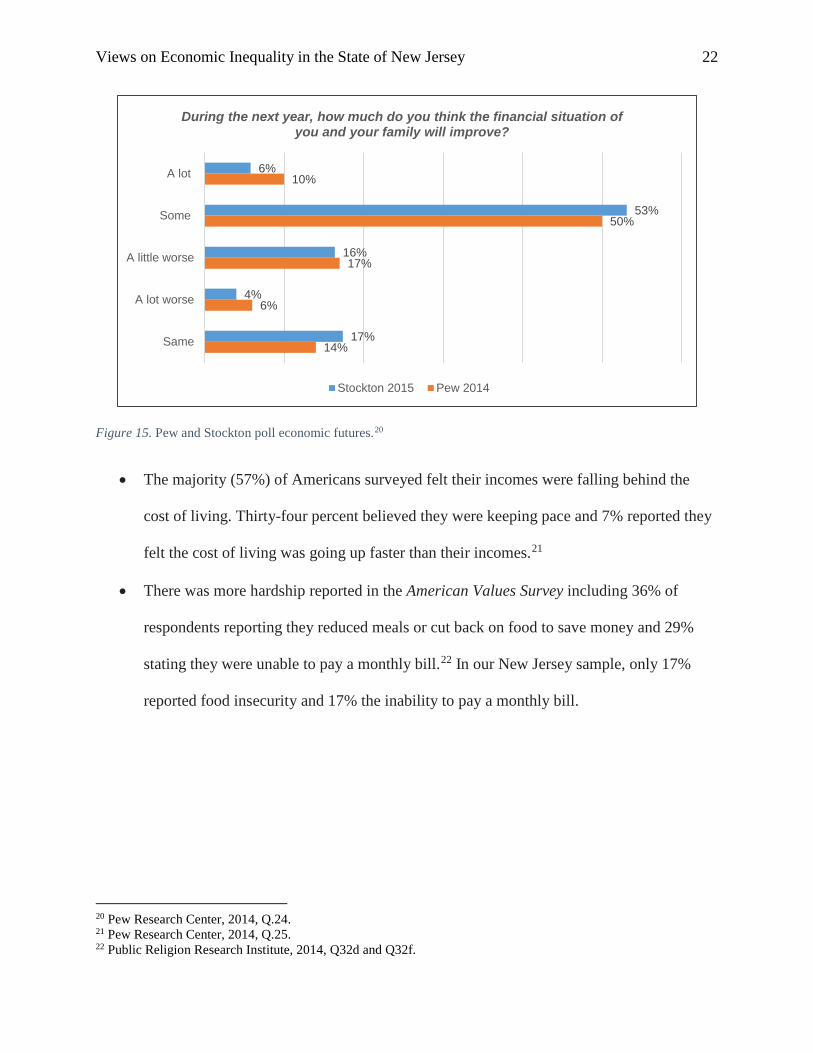
Figure 15. Pew and Stockton poll economic futures.20
• The majority (57%) of Americans surveyed felt their incomes were falling behind the
cost of living. Thirty-four percent believed they were keeping pace and 7% reported they
felt the cost of living was going up faster than their incomes.21
• There was more hardship reported in the American Values Survey including 36% of
respondents reporting they reduced meals or cut back on food to save money and 29%
stating they were unable to pay a monthly bill.22 In our New Jersey sample, only 17%
reported food insecurity and 17% the inability to pay a monthly bill.
20 Pew Research Center, 2014, Q.24. 21 Pew Research Center, 2014, Q.25. 22 Public Religion Research Institute, 2014, Q32d and Q32f.
6%
53%
16%
4%
17%
10%
50%
17%
6%
14%
A lot
Some
A little worse
A lot worse
Same
During the next year, how much do you think the financial situation of you and your family will improve?
Stockton 2015 Pew 2014

Views on Economic Inequality in the State of New Jersey 23
Figure 16. Stockton and PRRI poll economic hardship.23
• Similar to New Jerseyans, only 21% of Americans polled by the American Values Survey
believe the recession is over.24
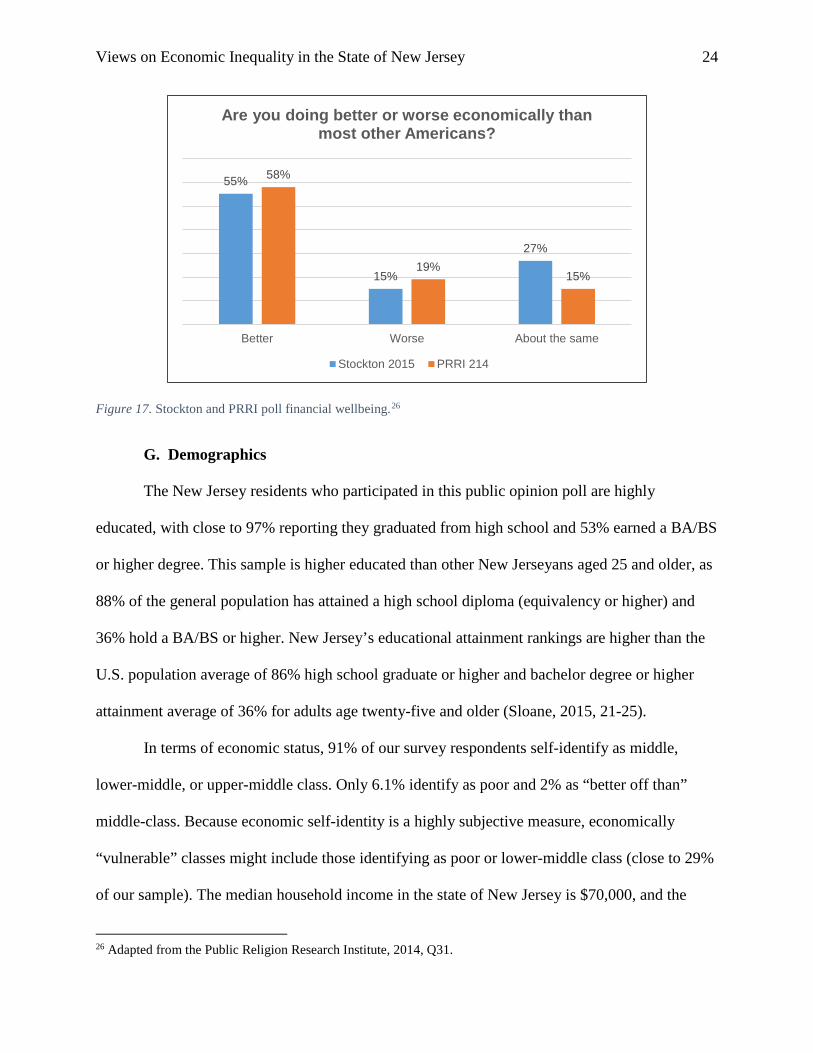
• And, the American Values Survey found that most (58%) of Americans believe they are
doing better financially than others. Fifteen percent of Americans surveyed report doing
the same while 19% feel they are doing worse.25 This is slightly lower than New Jersey
residents reporting 55% “better” and 27% the “same” as other Americans.
23 Public Religion Research Institute, 2014, Q.30.a, Q32.b, Q32.c, Q32.d, Q32.e, Q32.f, and Q32.g. 24 Public Religion Research Institute, 2014, Q3. 25 Public Religion Research Institute, 2014, Q31.
65%
73%
76%
76%
81%
86%
92%
68%
64%
71%
70%
72%
88%
80%
No one received a raise or promotion
No one cut back on food to save money
No one put off seeing a doctor
No one was unable to pay a monthly bill
No one lost a job or hours reduced
No one received unemployment benefits
No one received foodstamps
During the last year in my household:
PRRI 2014 Stockton 2015
Views on Economic Inequality in the State of New Jersey 24
Figure 17. Stockton and PRRI poll financial wellbeing.26
G. Demographics
The New Jersey residents who participated in this public opinion poll are highly
educated, with close to 97% reporting they graduated from high school and 53% earned a BA/BS
or higher degree. This sample is higher educated than other New Jerseyans aged 25 and older, as
88% of the general population has attained a high school diploma (equivalency or higher) and
36% hold a BA/BS or higher. New Jersey’s educational attainment rankings are higher than the
U.S. population average of 86% high school graduate or higher and bachelor degree or higher
attainment average of 36% for adults age twenty-five and older (Sloane, 2015, 21-25).
In terms of economic status, 91% of our survey respondents self-identify as middle,
lower-middle, or upper-middle class. Only 6.1% identify as poor and 2% as “better off than”
middle-class. Because economic self-identity is a highly subjective measure, economically
“vulnerable” classes might include those identifying as poor or lower-middle class (close to 29%
of our sample). The median household income in the state of New Jersey is $70,000, and the
26 Adapted from the Public Religion Research Institute, 2014, Q31.
55%
15%
27%
58%
19%15%
Better Worse About the same
Are you doing better or worse economically than most other Americans?
Stockton 2015 PRRI 214

Views on Economic Inequality in the State of New Jersey 25
majority of our sample reported earning between $50,000 and $100,000 annually (Sloane, 2015,
10).
The majority of our survey respondents are fifty years of age or over (67.1%) and
seventy-nine percent are white. Seven percent of our sample identify as Latina/o or Hispanic,
close to 10% percent are African American, and 6% identify as belonging to more than one race.
The party identification for our sample is well distributed with 23% identifying as Republican,
34% Democrat, and 31% Independent. The majority of those surveyed consider themselves
politically moderate. We achieved well-balanced geographic representation and close to a fifty-
fifty heteronormative gender balance. Our findings were weighted to account for educational
attainment, geography, age, income, race, and ethnicity.
Views on Economic Inequality in the State of New Jersey 26
IV. Survey Questions and Data
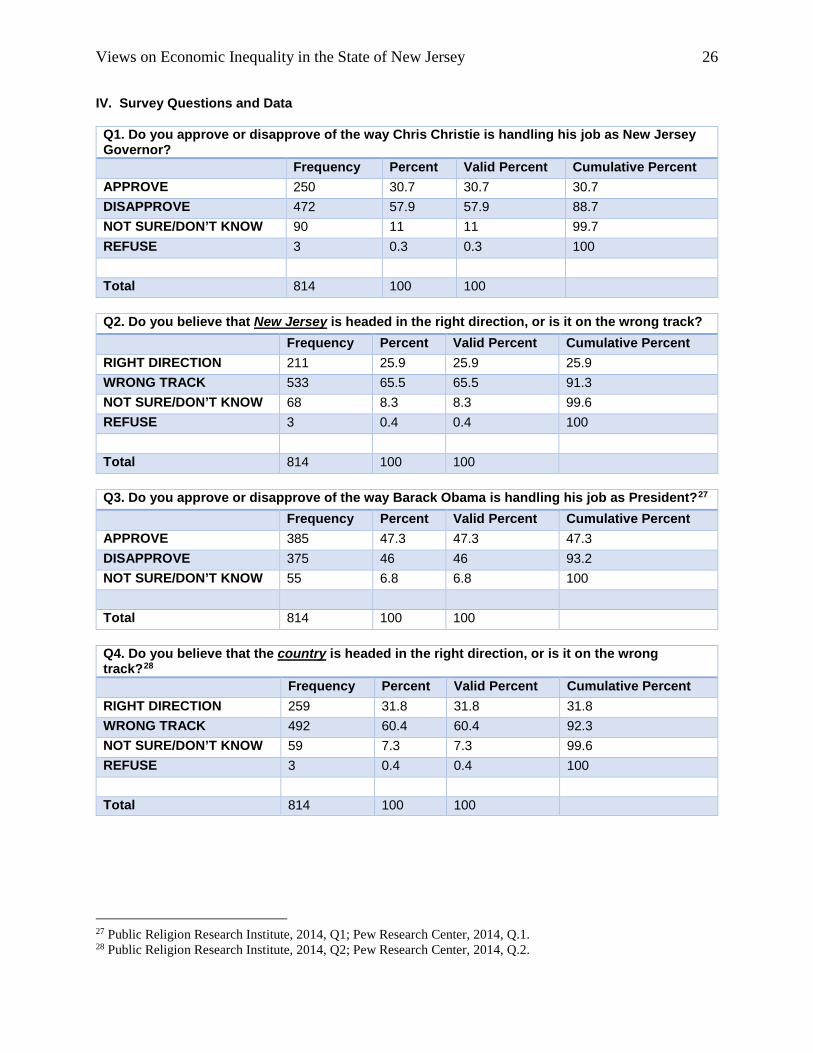
Q1. Do you approve or disapprove of the way Chris Christie is handling his job as New Jersey Governor? Frequency Percent Valid Percent Cumulative Percent APPROVE 250 30.7 30.7 30.7 DISAPPROVE 472 57.9 57.9 88.7 NOT SURE/DON’T KNOW 90 11 11 99.7 REFUSE 3 0.3 0.3 100 Total 814 100 100
Q2. Do you believe that New Jersey is headed in the right direction, or is it on the wrong track? Frequency Percent Valid Percent Cumulative Percent RIGHT DIRECTION 211 25.9 25.9 25.9 WRONG TRACK 533 65.5 65.5 91.3 NOT SURE/DON’T KNOW 68 8.3 8.3 99.6 REFUSE 3 0.4 0.4 100 Total 814 100 100
Q3. Do you approve or disapprove of the way Barack Obama is handling his job as President?27 Frequency Percent Valid Percent Cumulative Percent APPROVE 385 47.3 47.3 47.3 DISAPPROVE 375 46 46 93.2 NOT SURE/DON’T KNOW 55 6.8 6.8 100 Total 814 100 100
Q4. Do you believe that the country is headed in the right direction, or is it on the wrong track?28 Frequency Percent Valid Percent Cumulative Percent RIGHT DIRECTION 259 31.8 31.8 31.8 WRONG TRACK 492 60.4 60.4 92.3 NOT SURE/DON’T KNOW 59 7.3 7.3 99.6 REFUSE 3 0.4 0.4 100 Total 814 100 100
27 Public Religion Research Institute, 2014, Q1; Pew Research Center, 2014, Q.1. 28 Public Religion Research Institute, 2014, Q2; Pew Research Center, 2014, Q.2.

Views on Economic Inequality in the State of New Jersey 27
Q5. What do you think is the most important issue facing New Jersey? Frequency Percent Valid Percent Cumulative Percent OTHER ISSUE (SPECIFY) 139 17.1 17.1 17.1 ECONOMY 133 16.3 16.3 33.4 TAXES 131 16.1 16.1 49.5 JOBS 118 14.4 14.4 63.9 TAXES, PROPERTY 108 13.3 13.3 77.2 NOT SURE/DON’T KNOW 40 4.9 4.9 82.1 EDUCATION 37 4.5 4.5 86.6 EDUCATION (K-12) 19 2.4 2.4 89 HEALTH CARE 18 2.2 2.2 91.2 IMMIGRATION 12 1.4 1.4 92.6 PENSIONS/BENEFITS 11 1.3 1.3 94 GUN CONTROL 9 1 1 95 TAXES, INCOME 8 1 1 96 ENVIRONMENT 8 1 1 97 TRANSPORTATION 7 0.9 0.9 97.9 ROADS/INFRASTRUCTURE 5 0.6 0.6 98.5 ECONOMIC DEVELOPMENT 5 0.6 0.6 99.1 EDUCATION (HIGHER), COLLEGES
3 0.4 0.4 99.4
SANDY RECOVERY 2 0.3 0.3 99.7 BUSINESS TAXES 2 0.3 0.3 100 Total 814 100 100
Views on Economic Inequality in the State of New Jersey 28
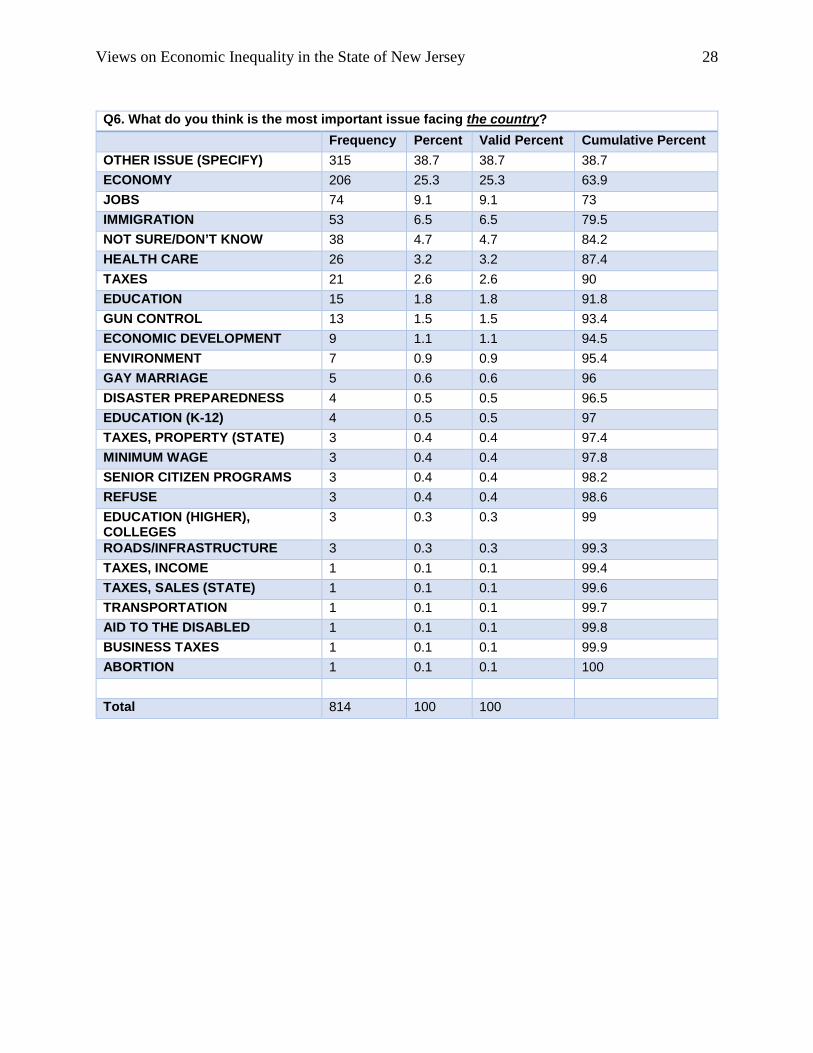
Q6. What do you think is the most important issue facing the country? Frequency Percent Valid Percent Cumulative Percent OTHER ISSUE (SPECIFY) 315 38.7 38.7 38.7 ECONOMY 206 25.3 25.3 63.9 JOBS 74 9.1 9.1 73 IMMIGRATION 53 6.5 6.5 79.5 NOT SURE/DON’T KNOW 38 4.7 4.7 84.2 HEALTH CARE 26 3.2 3.2 87.4 TAXES 21 2.6 2.6 90 EDUCATION 15 1.8 1.8 91.8 GUN CONTROL 13 1.5 1.5 93.4 ECONOMIC DEVELOPMENT 9 1.1 1.1 94.5 ENVIRONMENT 7 0.9 0.9 95.4 GAY MARRIAGE 5 0.6 0.6 96 DISASTER PREPAREDNESS 4 0.5 0.5 96.5 EDUCATION (K-12) 4 0.5 0.5 97 TAXES, PROPERTY (STATE) 3 0.4 0.4 97.4 MINIMUM WAGE 3 0.4 0.4 97.8 SENIOR CITIZEN PROGRAMS 3 0.4 0.4 98.2 REFUSE 3 0.4 0.4 98.6 EDUCATION (HIGHER), COLLEGES
3 0.3 0.3 99
ROADS/INFRASTRUCTURE 3 0.3 0.3 99.3 TAXES, INCOME 1 0.1 0.1 99.4 TAXES, SALES (STATE) 1 0.1 0.1 99.6 TRANSPORTATION 1 0.1 0.1 99.7 AID TO THE DISABLED 1 0.1 0.1 99.8 BUSINESS TAXES 1 0.1 0.1 99.9 ABORTION 1 0.1 0.1 100 Total 814 100 100
Views on Economic Inequality in the State of New Jersey 29
Q7. Of the following issues, which one would you say is MOST important to your vote for President next year?29 Frequency Percent Valid Percent Cumulative Percent AFFORDABLE HIGHER EDUCATION
96 11.8 11.8 11.8
HEALTH CARE 125 15.4 15.4 27.2 IMMIGRATION 95 11.7 11.7 38.8 JOBS 225 27.6 27.6 66.4 SOCIAL SECURITY 98 12.1 12.1 78.5 TAXES 104 12.7 12.7 91.2 WOMEN’S REPRODUCTIVE RIGHTS
34 4.1 4.1 95.4
SOME OTHER ISSUE 22 2.7 2.7 98.1 NOT SURE/DON’T KNOW 16 1.9 1.9 100 Total 814 100 100
Q8. How would you rate economic conditions in the United States today?30 Frequency Percent Valid Percent Cumulative Percent EXCELLENT 4 0.5 0.5 0.5 GOOD 168 20.7 20.7 21.1 ONLY FAIR 449 55.1 55.1 76.3 OR POOR? 190 23.4 23.4 99.6 NOT SURE/DON’T KNOW 3 0.4 0.4 100 Total 814 100 100
Q9. How would you rate economic conditions in the state of New Jersey today?31 Frequency Percent Valid Percent Cumulative Percent EXCELLENT 5 0.6 0.6 0.6 GOOD 114 14 14 14.5 ONLY FAIR 450 55.2 55.2 69.8 OR POOR? 235 28.9 28.9 98.6 NOT SURE/DON’T KNOW 11 1.4 1.4 100 Total 814 100 100
29 Adapted from Public Religion Research Institute, 2014, Q10. 30 Pew Research Center, 2014, Q.20. 31 Adapted from Pew Research Center, 2014, Q.20.
Views on Economic Inequality in the State of New Jersey 30
Q10. In the last ten years, do you think the gap between the rich and everyone else in the United States has increased, decreased, or stayed the same?32 Frequency Percent Valid Percent Cumulative Percent INCREASED 605 74.2 74.2 74.2 DECREASED 52 6.4 6.4 80.7 STAYED THE SAME 144 17.6 17.6 98.3 NOT SURE/DON’T KNOW
14 1.7 1.7 100
Total 814 100 100
Q11. Over the last two years do you think the national economy has:33 Frequency Percent Valid Percent Cumulative Percent GOTTEN BETTER 278 34.2 34.2 34.2 GOTTEN WORSE 274 33.6 33.6 67.8 OR STAYED THE SAME? 254 31.2 31.2 99 NOT SURE/DON’T KNOW 7 0.9 0.9 99.9 REFUSE 1 0.1 0.1 100 Total 814 100 100
Q12. Do you think the country’s economic recession is over, or do you think the economy is still in a recession? 34 Frequency Percent Valid Percent Cumulative Percent RECESSION OVER 223 27.4 27.4 27.4 STILL IN RECESSION 570 70 70 97.3 NOT SURE/DON’T KNOW 22 2.7 2.7 100 Total 814 100 100
Q13. A year from now, do you expect that economic conditions in the country as a whole will be better than they are at present, worse, or just about the same as now?35 Frequency Percent Valid Percent Cumulative Percent BETTER 216 26.6 26.6 26.6 WORSE 112 13.7 13.7 40.3 ABOUT THE SAME 438 53.8 53.8 94.1 NOT SURE/DON’T KNOW
48 5.9 5.9 100
Total 814 100 100
32 Pew Research Center, 2014, Q.34. 33 Public Religion Research Institute, 2014, Q2. 34 Public Religion Research Institute, 2014, Q3. 35 Pew Research Center, 2014, Q.21.

Views on Economic Inequality in the State of New Jersey 31
Q14. Looking ahead, so far as you are concerned, do you think that 2016 will be better or worse than 2015?36 Frequency Percent Valid Percent Cumulative Percent BETTER 440 54 54 54 WORSE 183 22.5 22.5 76.5 ABOUT THE SAME 145 17.8 17.8 94.3 NOT SURE/DON’T KNOW 46 5.7 5.7 100 Total 814 100 100
Q15. How much, if anything, should the government do to reduce poverty? 37 Frequency Percent Valid Percent Cumulative Percent A LOT 431 52.9 52.9 52.9 SOME 288 35.4 35.4 88.3 NOT MUCH 51 6.3 6.3 94.6 NOTHING AT ALL 36 4.4 4.4 99 NOT SURE/DON’T KNOW 8 1 1 100 Total 814 100 100
Q16. How much do you think government policies and programs can do to reduce poverty in this country?38 Frequency Percent Valid Percent Cumulative Percent A LOT 333 40.9 40.9 40.9 SOME 325 39.9 39.9 80.8 NOT MUCH 98 12 12 92.8 NOTHING AT ALL 49 6 6 98.8 NOT SURE/DON’T KNOW 10 1.2 1.2 100 Total 814 100 100
Q17. How much, if anything, should the government do to reduce the gap between the rich and everyone else? 39 Frequency Percent Valid Percent Cumulative Percent A LOT 365 44.8 44.8 44.8 SOME 262 32.2 32.2 77 NOT MUCH 72 8.8 8.8 85.8 NOTHING AT ALL 96 11.8 11.8 97.6 NOT SURE/DON’T KNOW 19 2.4 2.4 100 Total 814 100 100
36 Adapted from Pew Research Center, 2014, Q.3F1. 37 Pew Research Center, 2014, Q.13F2. 38 Pew Research Center, 2014, Q.15F2. 39 Pew Research Center, 2014, Q.14F1.
Views on Economic Inequality in the State of New Jersey 32
Q18. How much do you think government policies and programs can do to reduce the gap between the rich and everyone else in this country?40 Frequency Percent Valid Percent Cumulative Percent A LOT 326 40 40 40 SOME 242 29.7 29.7 69.8 NOT MUCH 141 17.3 17.3 87.1 NOTHING AT ALL 79 9.7 9.7 96.8 NOT SURE/DON’T KNOW 24 2.9 2.9 99.8 REFUSE 2 0.2 0.2 100 Total 814 100 100
Q19. How much good do you think government policies and programs have done to reduce poverty? Frequency Percent Valid Percent Cumulative Percent A LOT 56 6.9 6.9 6.9 SOME 234 28.7 28.7 35.6 NOT MUCH 346 42.5 42.5 78.1 NOTHING AT ALL 172 21.1 21.1 99.2 NOT SURE/DON’T KNOW 7 0.8 0.8 100 Total 814 100 100
Q20. How much good do you think government policies and programs have done to reduce the gap between the rich and everyone else? Frequency Percent Valid Percent Cumulative Percent A LOT 24 2.9 2.9 2.9 SOME 160 19.7 19.7 22.6 NOT MUCH 341 41.8 41.8 64.4 NOTHING AT ALL 279 34.2 34.2 98.6 NOT SURE/DON’T KNOW 11 1.4 1.4 100 Total 814 100 100
40 Pew Research Center, 2014, Q.16F1.
Views on Economic Inequality in the State of New Jersey 33
Q21. How do you feel about increasing the tax rate on Americans earning more than $250,000 a year?41 Frequency Percent Valid Percent Cumulative Percent STRONGLY FAVOR 223 27.4 27.4 27.4 FAVOR 288 35.3 35.3 62.7 OPPOSE 191 23.5 23.5 86.2 OR STRONGLY OPPOSE 92 11.3 11.3 97.5 NOT SURE/DON’T KNOW 18 2.3 2.3 99.8 REFUSE 2 0.2 0.2 100 Total 814 100 100
Q22. How do you feel about increasing the tax rate on Americans earning more than $500,000 a year?42 Frequency Percent Valid Percent Cumulative Percent STRONGLY FAVOR 336 41.2 41.2 41.2 FAVOR 267 32.8 32.8 74 OPPOSE 124 15.2 15.2 89.2 OR STRONGLY OPPOSE 73 8.9 8.9 98.2 NOT SURE/DON’T KNOW 13 1.6 1.6 99.8 REFUSE 2 0.2 0.2 100 Total 814 100 100
Q23. How do you feel about increasing the tax rate on Americans earning more than one million dollars a year?43 Frequency Percent Valid Percent Cumulative Percent STRONGLY FAVOR 452 55.5 55.5 55.5 FAVOR 197 24.2 24.2 79.7 OPPOSE 95 11.7 11.7 91.4 OR STRONGLY OPPOSE 59 7.2 7.2 98.6 NOT SURE/DON’T KNOW 8 1 1 99.6 REFUSE 3 0.4 0.4 100 Total 814 100 100
41 Public Religion Research Institute, 2014, Q12.c. 42 Adapted from Public Religion Research Institute, 2014, Q12.c. 43 Adapted from Public Religion Research Institute, 2014, Q12.c.

Views on Economic Inequality in the State of New Jersey 34
Q24. How do you feel about requiring companies to provide all full-time employees with paid sick days if they or an immediate family member gets sick?44 Frequency Percent Valid Percent Cumulative Percent STRONGLY FAVOR 385 47.3 47.3 47.3 FAVOR 285 34.9 34.9 82.2 OPPOSE 100 12.3 12.3 94.5 OR STRONGLY OPPOSE 26 3.2 3.2 97.8 NOT SURE/DON’T KNOW
15 1.9 1.9 99.7
REFUSE 3 0.3 0.3 100 Total 814 100 100
Q25. How do you feel about holding down interest rates on student loans?45 Frequency Percent Valid Percent Cumulative Percent STRONGLY FAVOR 480 58.9 58.9 58.9 FAVOR 246 30.2 30.2 89.1 OPPOSE 46 5.6 5.6 94.7 OR STRONGLY OPPOSE 26 3.1 3.1 97.8 NOT SURE/DON’T KNOW 17 2.1 2.1 99.9 REFUSE 1 0.1 0.1 100 Total 814 100 100
Q26. How do you feel about increasing the New Jersey minimum wage from $8.38 an hour to $15 an hour?46 Frequency Percent Valid Percent Cumulative Percent STRONGLY FAVOR 279 34.3 34.3 34.3 FAVOR 230 28.3 28.3 62.5 OPPOSE 180 22.1 22.1 84.6 OR STRONGLY OPPOSE 99 12.1 12.1 96.7 NOT SURE/DON’T KNOW 27 3.3 3.3 100 Total 814 100 100
44 Public Religion Research Institute, 2014, Q12.d. 45 The Opportunity Agenda, 2014, Q29.g. 46 Adapted Public Religion Research Institute, 2014, Q12.e.
Views on Economic Inequality in the State of New Jersey 35
Q27. How do you feel about requiring companies to provide all full-time employees with paid leave for the birth or adoption of a child?47 Frequency Percent Valid Percent Cumulative Percent STRONGLY FAVOR 352 43.2 43.2 43.2 FAVOR 318 39.1 39.1 82.3 OPPOSE 90 11 11 93.4 OR STRONGLY OPPOSE 24 2.9 2.9 96.3 NOT SURE/DON’T KNOW 28 3.5 3.5 99.7 REFUSE 2 0.3 0.3 100 Total 814 100 100
PREKFED. Would you favor or oppose using federal money to fund pre-kindergarten education? Frequency Percent Valid Percent Cumulative Percent STRONGLY FAVOR 185 22.7 22.7 22.7 FAVOR 367 45 45 67.8 OPPOSE 200 24.5 24.5 92.3 STRONGLY OPPOSE 47 5.8 5.8 98.1 NOT SURE/DON'T KNOW 15 1.8 1.8 99.9 REFUSE 1 0.1 0.1 100 Total 814 100 100
PREKSTATE. Would you favor or oppose using state money to fund pre-kindergarten education? Frequency Percent Valid Percent Cumulative Percent STRONGLY FAVOR 152 18.7 18.7 18.7 FAVOR 417 51.2 51.2 69.9 OPPOSE 191 23.4 23.4 93.3 OR STRONGLY OPPOSE 43 5.2 5.2 98.6 NOT SURE/DON’T KNOW 12 1.4 1.4 100 Total 814 100 100
47 Public Religion Research Institute, 2014, Q12.f.
Views on Economic Inequality in the State of New Jersey 36
Q28. When children today in the United States grow up, do you think they will be better off or worse off financially than their parents?48 Frequency Percent Valid Percent Cumulative Percent BETTER OFF 230 28.3 28.3 28.3 ABOUT THE SAME 50 6.1 6.1 34.4 WORSE OFF 490 60.2 60.2 94.6 NOT SURE/DON’T KNOW 43 5.3 5.3 99.9 REFUSE 1 0.1 0.1 100 Total 814 100 100
Q29. How would you rate your own personal financial situation? Would you say you are in excellent shape, good shape, only fair shape or poor shape financially?49 Frequency Percent Valid Percent Cumulative Percent EXCELLENT SHAPE 81 9.9 9.9 9.9 GOOD SHAPE 324 39.8 39.8 49.7 ONLY FAIR SHAPE 295 36.2 36.2 85.9 POOR SHAPE 110 13.5 13.5 99.3 NOT SURE/DON’T KNOW
2 0.3 0.3 99.6
REFUSE 3 0.4 0.4 100 Total 814 100 100
Q30. Over the course of the next year, do you think the financial situation of you and your family will:50 Frequency Percent Valid Percent Cumulative Percent IMPROVE A LOT 47 5.8 5.8 5.8 IMPROVE SOME 433 53.1 53.1 58.9 GET A LITTLE WORSE 134 16.4 16.4 75.3 OR GET A LOT WORSE? 33 4 4 79.4 NOT SURE/DON’T KNOW 24 2.9 2.9 82.3 REFUSE 3 0.4 0.4 82.6 STAY THE SAME 141 17.4 17.4 100 Total 814 100 100
48 Public Religion Research Institute, 2014, Q23. 49 Public Religion Research Institute, 2014, Q30 and Pew Research Center, 2014, Q.23. 50 Pew Research Center, 2014, Q.24.

Views on Economic Inequality in the State of New Jersey 37
Q31. Do you think your family's income is:51 Frequenc
y Percent
Valid Percent
Cumulative Percent
GOING UP FASTER THAN THE COST OF LIVING
54 6.6 6.6 6.6
STAYING ABOUT EVEN WITH THE COST OF LIVING
299 36.7 36.7 43.3
OR FALLING BEHIND THE COST OF LIVING?
451 55.4 55.4 98.8
NOT SURE/DON’T KNOW 8 1 1 99.8 REFUSE 2 0.2 0.2 100 Total 814 100 100
Q32a. Did you or anyone in your household receive a raise or promotion during the last 12 months?52 Frequency Percent Valid Percent Cumulative Percent YOU 141 17.3 17.3 17.3 FAMILY MEMBER 99 12.2 12.2 29.5 BOTH 32 4 4 33.5 NOT ANYONE 530 65 65 98.5 NOT SURE/DON’T KNOW
8 1 1 99.5
REFUSE 4 0.5 0.5 100 Total 814 100 100
Q32b. Did you or anyone in your household get a new job during the last 12 months? Frequency Percent Valid Percent Cumulative Percent YOU 99 12.1 12.1 12.1 FAMILY MEMBER 101 12.4 12.4 24.5 BOTH 21 2.5 2.5 27.1 NOT ANYONE 585 71.9 71.9 98.9 NOT SURE/DON’T KNOW
6 0.7 0.7 99.7
REFUSE 3 0.3 0.3 100 Total 814 100 100
51 Pew Research Center, 2014, Q.25. 52 Public Religion Research Institute, 2014, Q30.a.

Views on Economic Inequality in the State of New Jersey 38
Q32c. During the last year, did you or anyone in your household lose a job?53 Frequency Percent Valid Percent Cumulative Percent YOU 72 8.9 8.9 8.9 FAMILY MEMBER 58 7.2 7.2 16.1 BOTH 15 1.8 1.8 17.9 NOT ANYONE 660 81 81 98.9 NOT SURE/DON’T KNOW
6 0.7 0.7 99.7
REFUSE 3 0.3 0.3 100 Total 814 100 100
Q32d. During the last year, did you or anyone in your household have your work hours reduced? 54 Frequency Percent Valid Percent Cumulative Percent YOU 82 10 10 10 FAMILY MEMBER 44 5.4 5.4 15.4 BOTH 26 3.2 3.2 18.6 NOT ANYONE 653 80.2 80.2 98.8 NOT SURE/DON’T KNOW
7 0.8 0.8 99.7
REFUSE 3 0.3 0.3 100 Total 814 100 100
Q32e. Did you or anyone in your household pay off a debt during the last year? Frequency Percent Valid Percent Cumulative Percent YOU 228 28 28 28 FAMILY MEMBER 54 6.6 6.6 34.6 BOTH 95 11.6 11.6 46.3 NOT ANYONE 420 51.5 51.5 97.8 NOT SURE/DON’T KNOW
14 1.8 1.8 99.5
REFUSE 4 0.5 0.5 100 Total 814 100 100
53 Adapted from Public Religion Research Institute, 2014, Q32.b. 54 Adapted from Public Religion Research Institute, 2014, Q32.b.
Views on Economic Inequality in the State of New Jersey 39
Q32f. During the last twelve months, did you or anyone in your household put off seeing a doctor for financial reasons? 55 Frequency Percent Valid Percent Cumulative Percent YOU 106 13 13 13 FAMILY MEMBER 42 5.2 5.2 18.2 BOTH 44 5.4 5.4 23.6 NOT ANYONE 615 75.5 75.5 99 NOT SURE/DON’T KNOW
5 0.6 0.6 99.7
REFUSE 3 0.3 0.3 100 Total 814 100 100
Q32g. Were you or anyone in your household unable to pay a monthly bill during the last year? 56 Frequency Percent Valid Percent Cumulative Percent YOU 93 11.4 11.4 11.4 FAMILY MEMBER 46 5.6 5.6 17 BOTH 45 5.5 5.5 22.4 NOT ANYONE 621 76.2 76.2 98.7 NOT SURE/DON’T KNOW
8 1 1 99.7
REFUSE 3 0.3 0.3 100 Total 814 100 100
Q32h. During the last twelve months, did you or anyone in your household purchase a new home? Frequency Percent Valid Percent Cumulative Percent YOU 36 4.4 4.4 4.4 FAMILY MEMBER 23 2.8 2.8 7.1 BOTH 12 1.4 1.4 8.6 NOT ANYONE 738 90.6 90.6 99.1 NOT SURE/DON’T KNOW
4 0.5 0.5 99.7
REFUSE 3 0.3 0.3 100 Total 814 100 100
Q32i. During the last twelve months, did you or anyone in your household purchase a new car? Frequency Percent Valid Percent Cumulative Percent
55 Adapted from Public Religion Research Institute, 2014, Q32.c. 56 Adapted from Public Religion Research Institute, 2014, Q32.d.

Views on Economic Inequality in the State of New Jersey 40
YOU 128 15.7 15.7 15.7 FAMILY MEMBER 83 10.1 10.1 25.8 BOTH 35 4.4 4.4 30.2 NOT ANYONE 562 69 69 99.1 NOT SURE/DON’T KNOW
4 0.6 0.6 99.7
REFUSE 3 0.3 0.3 100 Total 814 100 100
Q32j. Did you or anyone in your household receive food stamps during the last year?57 Frequency Percent Valid Percent Cumulative Percent YOU 38 4.6 4.6 4.6 FAMILY MEMBER 18 2.2 2.2 6.8 BOTH 10 1.3 1.3 8 NOT ANYONE 743 91.2 91.2 99.3 NOT SURE/DON’T KNOW
3 0.4 0.4 99.7
REFUSE 3 0.3 0.3 100 Total 814 100 100
Q32k. Did you or anyone in your household reduce your meals or cut back on food to save money? 58 Frequency Percent Valid Percent Cumulative Percent YOU 119 14.7 14.7 14.7 FAMILY MEMBER 16 2 2 16.6 BOTH 75 9.3 9.3 25.9 NOT ANYONE 591 72.6 72.6 98.5 NOT SURE/DON’T KNOW
9 1.1 1.1 99.7
REFUSE 3 0.3 0.3 100 Total 814 100 100
57 Adapted from Public Religion Research Institute, 2014, Q32.e. 58 Adapted from Public Religion Research Institute, 2014, Q32.f.

Views on Economic Inequality in the State of New Jersey 41
Q32l. In the last year, did you or anyone in your household receive unemployment benefits? 59 Frequency Percent Valid Percent Cumulative Percent YOU 51 6.3 6.3 6.3 FAMILY MEMBER 47 5.7 5.7 12 BOTH 6 0.8 0.8 12.8 NOT ANYONE 700 86 86 98.8 NOT SURE/DON’T KNOW
7 0.9 0.9 99.7
REFUSE 3 0.3 0.3 100 Total 814 100 100
Q44. Overall, would you say you are doing better or worse economically than most other Americans?60 Frequency Percent Valid Percent Cumulative Percent BETTER 449 55.2 55.2 55.2 WORSE 122 15 15 70.2 ABOUT THE SAME 218 26.8 26.8 97 NOT SURE/DON’T KNOW 22 2.6 2.6 99.6 REFUSE 3 0.4 0.4 100 Total 814 100 100
59 Adapted from Public Religion Research Institute, 2014, Q32.g. 60 Adapted from Public Religion Research Institute, 2014, Q31.

Views on Economic Inequality in the State of New Jersey 42
V. References Clark, A. (9 February 2016). Does New Jersey need more public preschool? NJ.com. http://www.nj.com/education/2016/02/nj_lawmakers_want_110m_to_expand_public_preschool.html Cooke, O.D. (2016). The South Jersey Economic Review, 10, 1. Eagleton Center for Public Interest Polling. (16 February 2016). Welcome home, Governor?
Christie’s favorability hits lowest yet. Eagleton Institute of Politics. Rutgers University: Eagleton Institute of Politics. http://eagletonpoll.rutgers.edu/rutgers-eagleton-christie-ratings-feb2016/
Jackson, H. (3 February 2016). Congressional Democrats look at tackling student loan debt. NorthJersey.com http://www.northjersey.com/news/congressional-democrats-look-at-tackling-student-loan-debt-1.1505058
Jones, R.P., Cox, D., & Navarro-Rivera, J. (2014). Economic insecurity, rising inequality, and doubts about the future: Findings from the 2014 American Values Survey. Washington, D.C.: Public Religion Research Institute. www.publicreligion.org
Marcus, S. A fight is coming in N.J. over pensions, minimum wage, sick leave. NJ.com. http://www.nj.com/politics/index.ssf/2016/02/a_fight_is_coming_over_pensions_minimum_wage_sick.html National Institute for Early Education Research. (2014). The state of preschool 2014. New Brunswick, New Jersey: Rutgers University Graduate School of Education. http://www.nieer.org/sites/nieer/files/Yearbook2014_full3.pdf The Opportunity Agenda. (2014). The Opportunity Survey: Understanding the roots of attitudes
on inequality. Washington, D.C.: Tides Center. http://opportunity-survey.opportunityagenda.org/
Page, B. I., & Jacobs, L. R. (2009). Class war?: What Americans really think about economic inequality. Chicago: The University of Chicago Press.
Page, B.I., & Jacobs, L.R. (2007) The Inequality Survey. Chicago: The University of Chicago Press. http://www.press.uchicago.edu/books/page/index.html
Pew Research Center. (January 2014). Most see inequality growing, but partisans differ over solutions. Washington, D.C.: Pew Research Center. www.pewresearch.org
Pew Research Center and USA TODAY. (January 2014). “January 2014 Political Survey.” Pew Research Center for the People and the Press. Washington, D.C.: Pew Research Center. www.pewresearch.org
Public Religion Research Institute. (2014). American Values Survey 2014. Washington, D.C.: Public Religion Research Institute. www.publicreligion.org
Sloane, K. (2015). Economic indicators and quality of life in Southern New Jersey. Galloway, NJ: Stockton University.
Wisniewski, R. (9 Febraury 2016). Senator Turner announces support for legislation raising minimum wage to $15 an hour. New Jersey Senate Democrats. http://www.njsendems.org/senator-turner-announces-support-for-legislation-raising-minimum-wage-to-15-an-hour/
http://www.northjersey.com/news/congressional-democrats-look-at-tackling-student-loan-debt-1.1505058

Views on Economic Inequality in the State of New Jersey 43
VII. Acknowledgements
The author thanks Kevin Coopersmith of the William J. Hughes Center for Public Policy
(“Hughes Center”) for his assistance with data analysis, editing, and report design. Deep
appreciation is extended to Hughes Center researchers David Carr, PhD and Darryl Greer, PhD
for their enthusiastic support of a junior colleague. Thanks to John Froonjian, Senior Research
Associate, and the staff of the Stockton Polling Institute for their assistance in refining and
conducting our survey. Finally, thanks are due to Daniel J. Douglas, Director of the Hughes
Center, for facilitating this project.
Correspondence concerning this paper should be addressed to [email protected].


STEERING COMMITTEE
Dr. Edward H. Salmon, ChairmanAmbassador William J. Hughes Steve Batzer Mark L. Blum Yvonne Bonitto-Doggett Hon. Fred Butler Dr. Anne Harlan Ronald Johnson Vincent MaioneHon. Frank Minor Hon. Steven P. Perskie Charles Pessagno David Tilton Richard Tolson Michael Tuosto William Varley Jennifer Young Dr. Harvey Kesselman, President Dr. Susan Davenport, Interim Provost & Executive Vice President Dr. David L. Carr, Professor, Political Science Dr. Tina Zappile, Assistant Professor, Political Science Maryam Sarhan, Student Senate Government Affairs Committee Chair Sharon Schulman, Chief University Relations and Marketing Officer Daniel J. Douglas, Director

NATIONAL ADVISORY BOARD
Dean Luke Bierman Hon. Bill Bradley Hon. Brendan T. Byrne Hon. Robert DelTufo Hon. Mickey Edwards Ms. Kristen Grimm Ms. Ruth J. Katz Hon. Virginia A. Long Hon. Bill Richardson Hon. Lindsay Thomas Hon. John E. Wallace, Jr. Hon. Christine Todd Whitman

FOUNDING ENDOWMENTS
Mr. & Mrs. Stephen Chazen
Mr. & Mrs. William J. Hughes and Family
South Jersey Industries
New Jersey American Water Company
Atlantic City Electric Company
Mr. & Mrs. Steve Batzer
Exelon Corp.
Public Service Enterprise Group
Salmon Ventures Limited
Thomas H. Heist Family
Tribhuvan & Nandita Singh
Verizon

stockton.eduStockton is an AA/EO institution.