VIEWS ON ABORIGINALS IN CANADA CANADIAN RACE RELATIONS FOUNDATION AND THE ASSOCIATION FOR CANADIAN...
22
VIEWS ON ABORIGINALS IN CANADA CANADIAN RACE RELATIONS FOUNDATION AND THE ASSOCIATION FOR CANADIAN STUDIES MARCH, 2013
-
Upload
virgil-shields -
Category
Documents
-
view
218 -
download
1
Transcript of VIEWS ON ABORIGINALS IN CANADA CANADIAN RACE RELATIONS FOUNDATION AND THE ASSOCIATION FOR CANADIAN...

VIEWS ON ABORIGINALS IN CANADA
C A N A D I A N R A C E R E L AT I O N S F O U N D AT I O N A N D T H E A S S O C I AT I O N F O R C A N A D I A N S T U D I E S
M A R C H , 2 0 1 3

The findings were collected from a survey of 1800 Canadians which included an oversample of 500 respondents born outside of Canada. It was conducted by the firm Leger Marketing for the Canadian Race Relations Foundation and the Association for Canadian Studies during the week of March, 2013. Done via web panel, the probabilistic margin of error is 2.9 percent 19 times out of 20
METHODOLOGY
CONTACT WITH ABORIGINALS AND
TRENDS IN OPINION
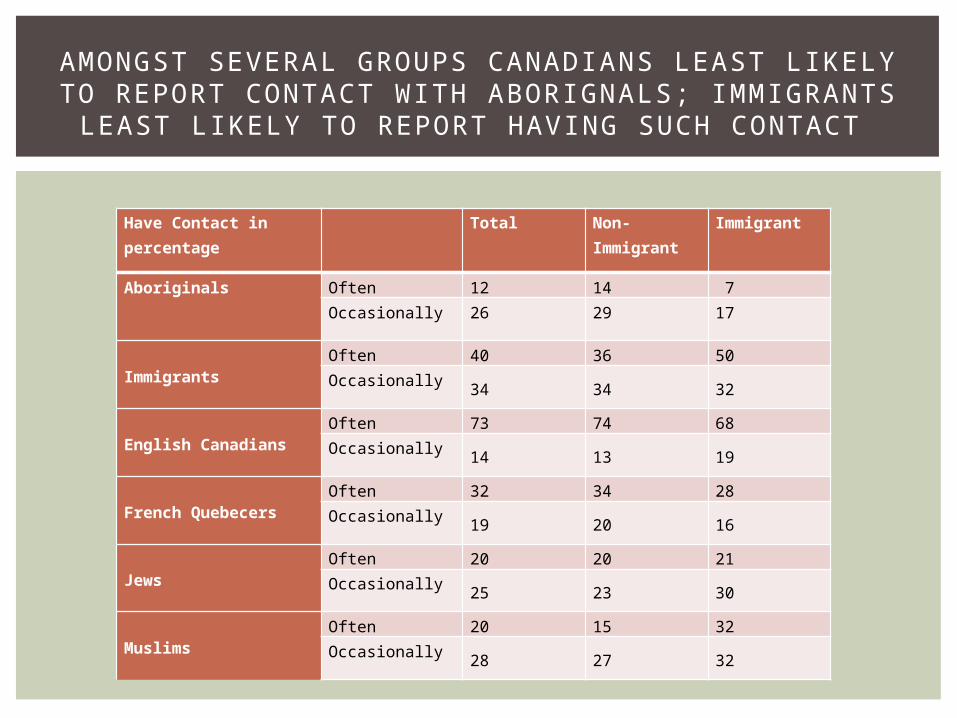
AMONGST SEVERAL GROUPS CANADIANS LEAST LIKELY TO REPORT CONTACT WITH ABORIGNALS; IMMIGRANTS
LEAST LIKELY TO REPORT HAVING SUCH CONTACT
Have Contact in percentage
Total Non-Immigrant
Immigrant
Aboriginals Often 12 14 7Occasionally 26 29 17
Immigrants Often 40 36 50Occasionally
34 34 32
English Canadians Often 73 74 68Occasionally
14 13 19
French QuebecersOften 32 34 28Occasionally
19 20 16
JewsOften 20 20 21Occasionally
25 23 30
Muslims Often 20 15 32Occasionally
28 27 32

BETWEEN 2012 AND 2013 SLIGHT DECLINE IN FAVORABLE VIEW OF ABORIGINALS WHICH IS MOST PRONOUNCED IN ENGLISH
CANADA AND MISTRUST ALSO RISES AMONGST SAME GROUP
Aboriginals Total French English Other March 2013 Very
Positive Opinion
12.8% 8.9% 13.6% 14.8%
Somewhat Positive Opinion
47.5% 54.1% 44.6% 48.8%
Total Positive
60.3%
63%
58.2%
63.3%
March 2012 Total Positive
64.9% 61.2% 67.9% 62.3%
Very Positive Opinion
19.7% 14.2% 21.6% 20.9%
Somewhat Positive
45.2% 47.0% 46.3% 41.4%
March 2013Low Trust 35.1% 29.6% 37.3% 35.5%
March 2012 Low Trust 36.4% 47.6% 29.8% 41.4%
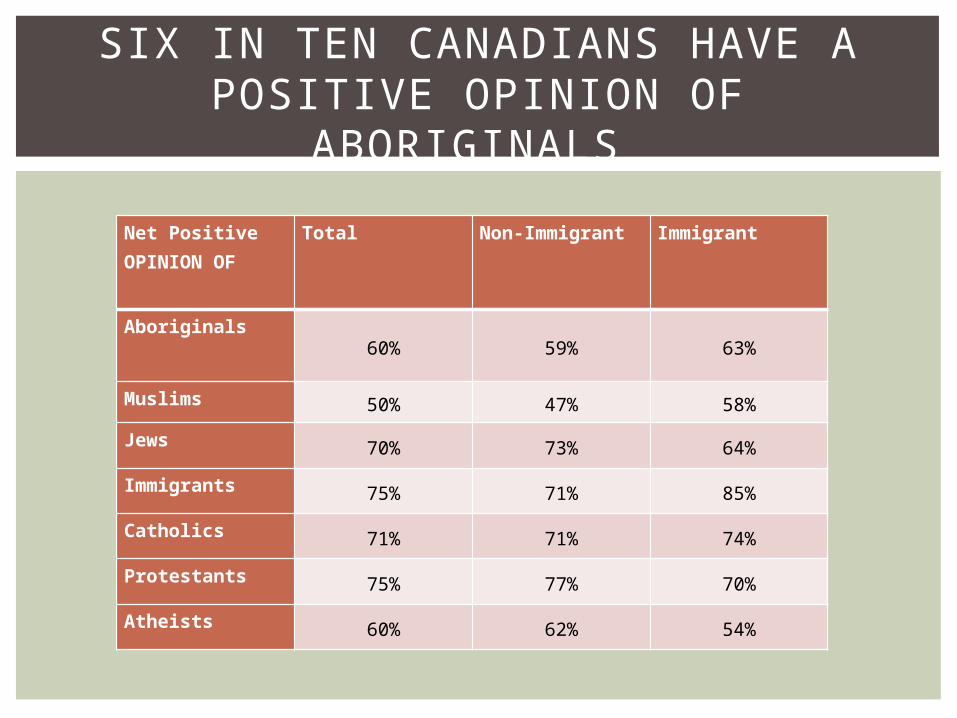
SIX IN TEN CANADIANS HAVE A POSITIVE OPINION OF ABORIGINALS
Net Positive OPINION OF
Total Non-Immigrant Immigrant
Aboriginals 60% 59% 63%
Muslims 50% 47% 58%
Jews 70% 73% 64%
Immigrants 75% 71% 85%
Catholics 71% 71% 74%
Protestants 75% 77% 70%
Atheists 60% 62% 54%

RELATIONS BETWEEN ABORIGINALS AND NON-ABORIGINALS
AND TRUST
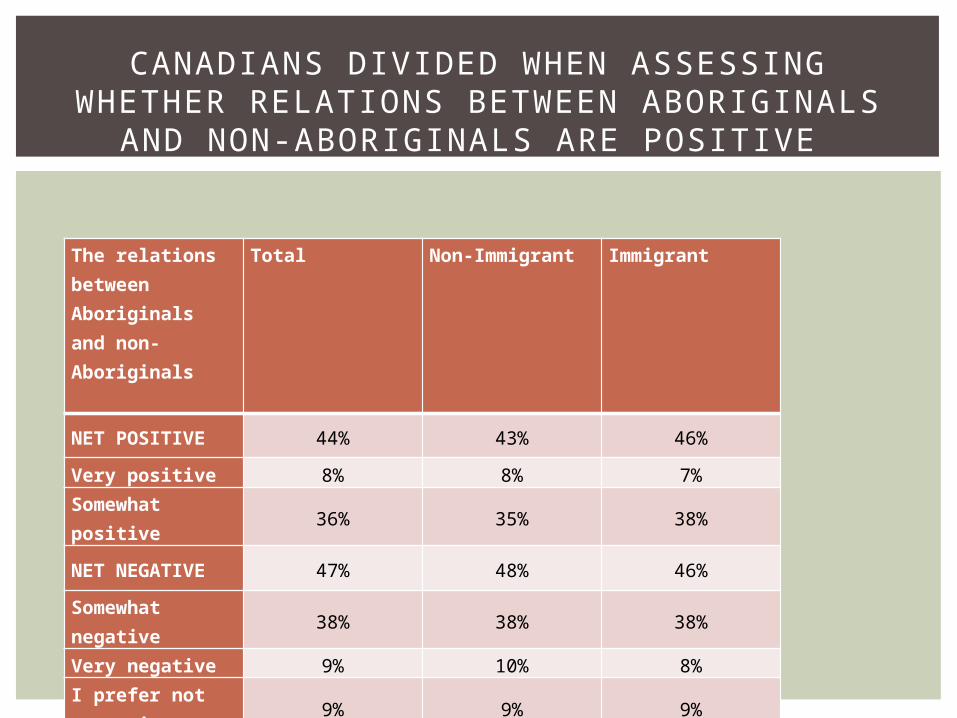
CANADIANS DIVIDED WHEN ASSESSING WHETHER RELATIONS BETWEEN ABORIGINALS
AND NON-ABORIGINALS ARE POSITIVE
The relations between Aboriginals and non-Aboriginals
Total Non-Immigrant Immigrant
NET POSITIVE 44% 43% 46%
Very positive 8% 8% 7%Somewhat positive
36% 35% 38%
NET NEGATIVE 47% 48% 46%
Somewhat negative
38% 38% 38%
Very negative 9% 10% 8%I prefer not answering
9% 9% 9%
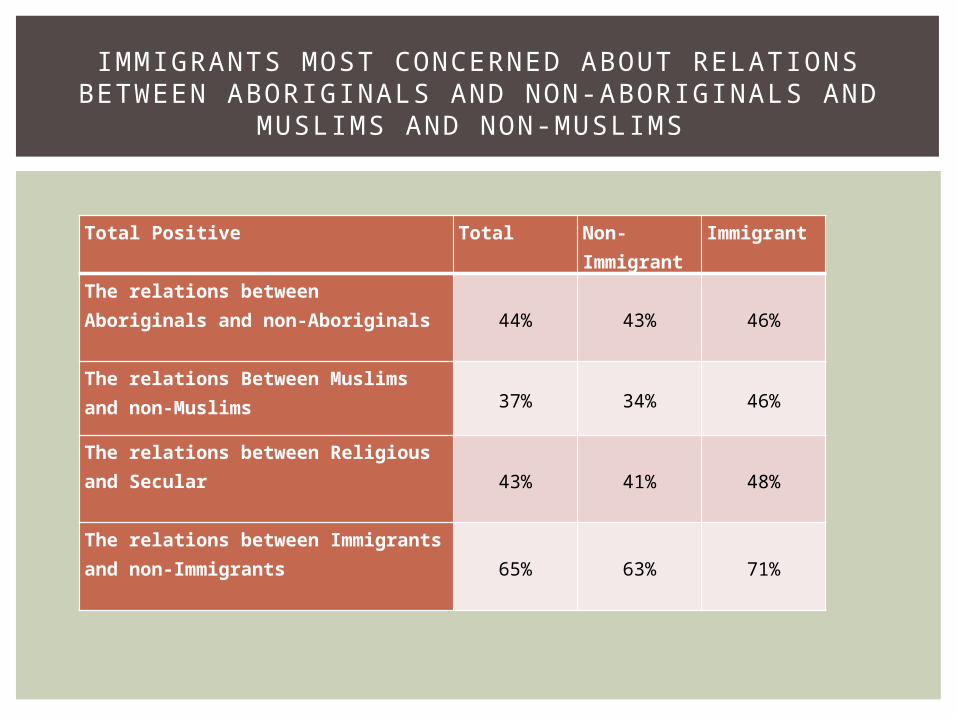
IMMIGRANTS MOST CONCERNED ABOUT RELATIONS BETWEEN ABORIGINALS AND NON-ABORIGINALS AND
MUSLIMS AND NON-MUSLIMS
Total Positive Total Non-Immigrant
Immigrant
The relations between Aboriginals and non-Aboriginals
44% 43% 46%
The relations Between Muslims and non-Muslims 37% 34% 46%
The relations between Religious and Secular
43% 41% 48%
The relations between Immigrants and non-Immigrants
65% 63% 71%
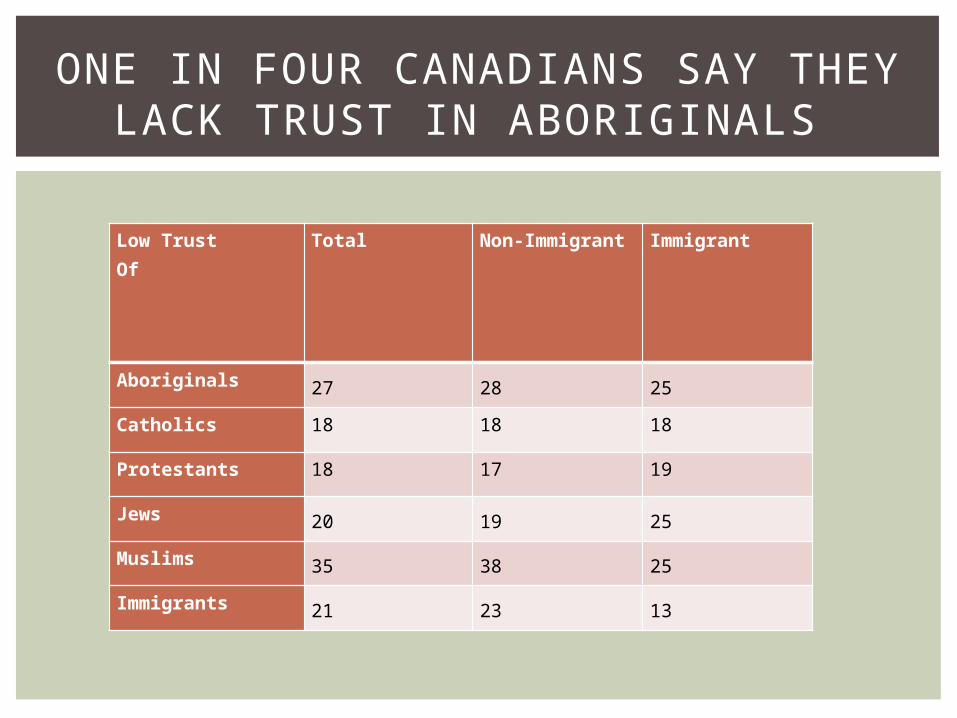
ONE IN FOUR CANADIANS SAY THEY LACK TRUST IN ABORIGINALS
Low Trust Of
Total Non-Immigrant
Immigrant
Aboriginals 27 28 25
Catholics 18 18 18
Protestants 18 17 19
Jews 20 19 25
Muslims 35 38 25
Immigrants 21 23 13

PRINCIPAL FACTORS CANADIANS
ATTRIBUTE TO ABORIGINAL
CHALLENGES

CANADIANS DIVIDED AROUND FACTORS THEY ATTRIBUTE TO SOCIAL AND ECONOMIC PROBLEMS
ENCOUNTERED BY ABORIGINALS
Please rank in order the factors contributing to the social and economic problems currently confronted by aboriginals in Canada.
Total Non-Immigrant Immigrant
The Role of the Federal Government
27% 26% 30%
Aboriginal Leaders 24% 25% 21%Historic and Societal Prejudice
26% 26% 25%
The areas of Canada they reside
10% 11% 10%
Our legislative and constitutional framework
12% 11% 14%

EASTERN CANADA MORE LIKELY TO BLAME GOVERNMENT FOR PROBLEMS WHILE PRAIRIES AND BC MORE LIKELY TO
HOLD LEADERS RESPONSIBLE
Please rank in order the factors contributing to the social and economic problems currently confronted by aboriginals in Canada. ATLANTIC QC ON MB/SK AB BCThe Role of the Federal Government
35% 30% 28% 13% 28% 25%
Aboriginal Leaders
20% 16% 23% 41% 24% 36%
Historic and Societal Prejudice
26% 29% 26% 21% 25% 22%
The areas of Canada they reside
13% 8% 12% 16% 10% 6%
Our legislative and constitutional framework
6% 17% 11% 10% 13% 11%

ABORIGINAL PROTEST:OPINION ON IDLE NO
MORE

NEARLY SEVEN IN TEN CANADIANS REPORT KNOWLEDGE OF IDLE NO
MORE
I am aware of the Aboriginal Movement Idle No More
Total Non-Immigrant Immigrant
NET AGREE 68% 70% 63%Strongly agree 28% 30% 22%Somewhat agree
40% 40% 41%
NET DISAGREE 14% 14% 15%
Somewhat disagree
8% 7% 8%
Strongly disagree
7% 7% 8%
I don't know 16% 14% 20%
I prefer not to answer
2% 1% 2%

WESTERN CANADA MORE FAMILIAR WITH ABORIGINAL PROTEST
MOVEMENT
I am aware of the Aboriginal Movement Idle No More
ATLANTIC QC ON MB/SK AB BCNET AGREE 71% 55% 69% 78% 76% 77%Strongly agree 34% 22% 29% 35% 32% 27%Somewhat agree
37% 34% 40% 43% 44% 51%
NET DISAGREE 12% 19% 13% 13% 15% 10%
Somewhat disagree
6% 9% 6% 10% 11% 6%
Strongly disagree
5% 10% 7% 3% 4% 4%
I don't know 14% 24% 16% 8% 7% 12%
I prefer not to answer
3% 1% 2% 1% 1% 1%
IMPACT OF CONTACT WITH ABORIGINALS

GREATER CONTACT WITH ABORIGINALS RESULTS IN MORE
POSITIVE VIEWS
Very positive, somewhat positive, somewhat negative or very negative opinion of Aboriginals
had contact with Aboriginals of CanadaOften Occasionally Rarely Never
Very positive
30.3% 14.4% 10.5% 6.7%
Somewhat positive
43.6% 55.1% 46.4% 46.3%
Somewhat negative
16.1% 20.3% 28.8% 25.8%
Very negative
6.0% 4.7% 7.1% 9.8%
I prefer not answering
4.1% 5.5% 7.1% 11.4%

THOSE REPORTING GREATER CONTACT WITH ABORIGINALS HAVE HIGHER DEGREE OF TRUST
Had contact with Aboriginals of Canada
Aboriginals Often Occasionally Rarely Never
Trusted a lot
34.9% 21.4% 18.2% 10.6%
Somewhat trusted
44.0% 58.5% 54.0% 53.3%
Trusted a little
12.4% 15.5% 21.4% 23.6%
Not trusted at all
8.7% 4.7% 6.4% 12.6%

THOSE REPORTING GREATER CONTACT WITH ABORIGINALS MORE LIKELY TO HOLD A FAVORABLE
VIEW OF RELATIONS
had contact with Aboriginals of Canada
Relations between Aboriginals and non-Aboriginals
Often Occasionally Rarely Never
Very positive
17.5% 7.8% 5.4% 5.5%
Somewhat positive
41.0% 44.3% 36.1% 28.0%
Somewhat negative
27.2% 35.6% 43.0% 41.3%
Very negative
10.1% 5.9% 9.1% 13.2%
I prefer not answering
4.1% 6.4% 6.4% 12.0%
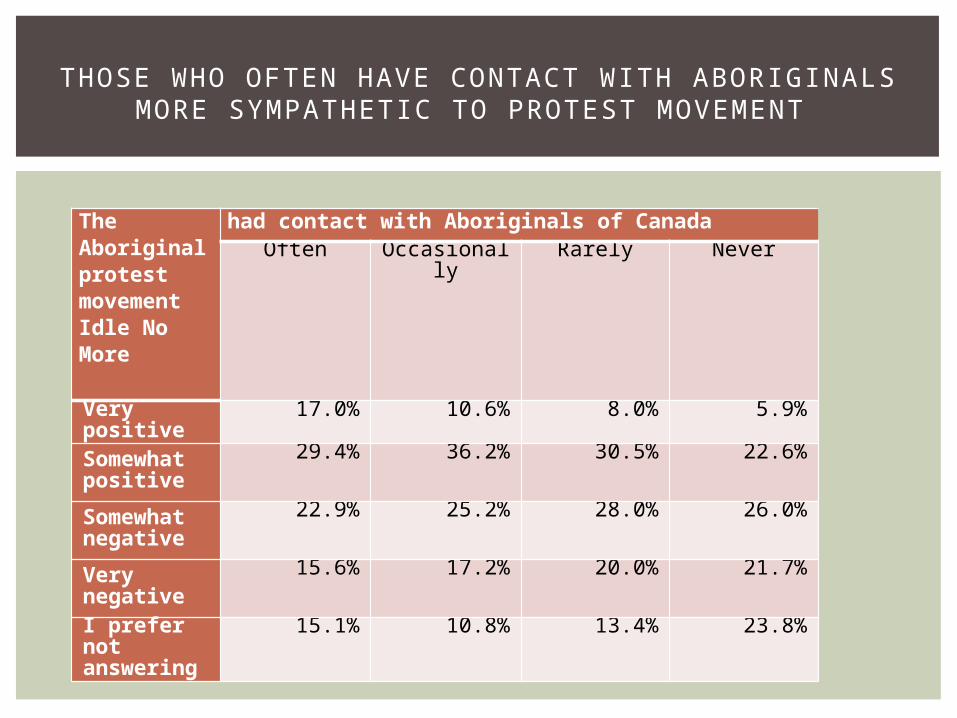
THOSE WHO OFTEN HAVE CONTACT WITH ABORIGINALS MORE SYMPATHETIC TO PROTEST
MOVEMENT
The Aboriginal protest movement Idle No More
had contact with Aboriginals of CanadaOften Occasionall
yRarely Never
Very positive
17.0% 10.6% 8.0% 5.9%
Somewhat positive
29.4% 36.2% 30.5% 22.6%
Somewhat negative
22.9% 25.2% 28.0% 26.0%
Very negative
15.6% 17.2% 20.0% 21.7%
I prefer not answering
15.1% 10.8% 13.4% 23.8%

CONTACT WITH ABORIGINALS HAS LITTLE IMPACT ON ASSESSMENT OF FACTORS INFLUENCING SOCIAL AND
ECONOMIC CHALLENGES
Had contact with Aboriginals of CanadaRank in order the factors contributing to the social and economic problems currently encountered by aboriginals in Canada.
Often Occasionally
Rarely Never
The Role of the Federal Government
27.9% 26.7% 25.5% 29.2%
Aboriginal Leaders 24.2% 22.7% 28.4% 22.9%Historic and Societal Prejudice
25.6% 30.1% 25.9% 23.7%
The areas of Canada 9.1% 8.1% 10.2% 11.8%Our legislative and constitutional framework
13.2% 12.5% 10.0% 12.4%