enigma.ini.usc.eduenigma.ini.usc.edu/wp-content/uploads/CORTEX/02_Quality... · Web viewIn the...
12
Written by Derrek Hibar, Neda Jahanshad, Roberto Toro, Jerod Rasmussen, Theo van Erp, Esther Walton, Stefan Ehrlich (last update May 4, 2014) Use this protocol for the analysis of mean cortical thickness and surface area data within FreeSurfer ROI's for the ENIGMA Bipolar, Schizophrenia, Major Depressive Disorder, ADHD, and Addiction working groups. If you have any questions or run into problems, please feel free to contact us (Derrek and Neda): [email protected] and [email protected] These protocols are offered with an unlimited license and without warranty. However, if you find these protocols useful in your research, please provide a link to the ENIGMA website in your work: www.enigma.ini.usc.edu Step 2: Quality Checking Cortical Measures (FreeSurfer) Highlighted portions of the instructions may require you to make changes so that the commands work on your system and data. There are three major steps for quality checking the cortical surface segmentations outputted from FreeSurfer: 1. Outlier Detection: This is a simple R script that will identify subjects with cortical thickness and surface area values that deviate from the rest of your subjects. 2. Internal Surface Method: This method uses a Matlab function to plot cortical surface segmentations directly on a subject’s scan and collates snapshots from internal slices of the brain into a webpage for easy checking. 3. External Surface Method: This is loosely based on the QATools for FreeSurfer. This creates a webpage with external views of the segmentations from different angles. 1
-
Upload
nguyennguyet -
Category
Documents
-
view
218 -
download
1
Transcript of enigma.ini.usc.eduenigma.ini.usc.edu/wp-content/uploads/CORTEX/02_Quality... · Web viewIn the...

Written by Derrek Hibar, Neda Jahanshad, Roberto Toro, Jerod Rasmussen, Theo van Erp, Esther Walton, Stefan Ehrlich (last update May 4, 2014)
Use this protocol for the analysis of mean cortical thickness and surface area data within FreeSurfer ROI's for the ENIGMA Bipolar, Schizophrenia, Major Depressive Disorder, ADHD, and Addiction working groups.
If you have any questions or run into problems, please feel free to contact us (Derrek and Neda): [email protected] and [email protected]
These protocols are offered with an unlimited license and without warranty. However, if you find these protocols useful in your research, please provide a link to the ENIGMA website in your work: www.enigma.ini.usc.edu
Step 2: Quality Checking Cortical Measures (FreeSurfer)
Highlighted portions of the instructions may require you to make changes so that the commands work on your system and data.
There are three major steps for quality checking the cortical surface segmentations outputted from FreeSurfer:
1. Outlier Detection: This is a simple R script that will identify subjects with cortical thickness and surface area values that deviate from the rest of your subjects.
2. Internal Surface Method: This method uses a Matlab function to plot cortical surface segmentations directly on a subject’s scan and collates snapshots from internal slices of the brain into a webpage for easy checking.
3. External Surface Method: This is loosely based on the QATools for FreeSurfer. This creates a webpage with external views of the segmentations from different angles.
Outlier Detection:
This step requires that you have R installed and that you have downloaded the outlier detection script found here.
Change directories to the location of your CorticalMeasuresENIGMA_ThickAvg.csv and CorticalMeasuresENIGMA_SurfAvg.csv generated in Step 1 of the protocols. Make sure the outliers.R script is also in that directory and run:
R --no-save --slave < outliers.R > outliers.log
1

Written by Derrek Hibar, Neda Jahanshad, Roberto Toro, Jerod Rasmussen, Theo van Erp, Esther Walton, Stefan Ehrlich (last update May 4, 2014)
This will generate a log file that will tell you which subjects are outliers and for which structures they are outliers for. Make sure you look at these subjects closely as you proceed with the quality check protocol to make sure they are segmented properly.
NB: Just because a subject is an outlier does not necessarily mean they should be excluded from the analysis. If a subject is segmented properly in FreeSurfer (which you will visually verify at later steps in this protocol) then please do keep them in the analysis.
The Internal Surface Method:
Matlab Download the QC_ENIGMA_Cortex.zip package here Download the script to wrap the output into a webpage here
Assuming that you have downloaded the collection of Matlab scripts found here (called QC_ENIGMA_Cortex.zip) and unzipped, change directories to that folder with the required Matlab *.m scripts. For simplicity, we assume you are working on a Linux machine with the base directory /enigma/QC_ENIGMA/.
Start Matlab: /usr/local/matlab/bin/matlab
Add the current folder containing all of the required scripts to Matlab’s path.
Select: File -> Set Path -> Add Folder -> {OK} -> {Save} -> {Close}
In the Matlab console window change directories to the folder with all of your FreeSurfer subject folders.
cd /enigma/subjects/
Make a directory to store all of the QC output.
mkdir /enigma/subjects/QC/
The script we want to run is called func_make_corticalpngs_ENIGMA_QC.m with the following parameters:
func_make_corticalpngs_ENIGMA_QC(output_QC_directory, subject_name, select_MRI_image, select_Segmented_image)
We want to set ‘subject_name’ such that ‘subject_name’ + ‘select_Segmented_image’ will form the full name of the segmentation label files (e.g. subj1/mri/aparc+aseg.mgz) and similarly for ‘select_MRI_image’ we want it to give the full name of the registered MRI scan outputted by FreeSurfer (e.g. subj1/mri/orig.mgz).
2

Written by Derrek Hibar, Neda Jahanshad, Roberto Toro, Jerod Rasmussen, Theo van Erp, Esther Walton, Stefan Ehrlich (last update May 4, 2014)
In the Matlab command window we can do:
QC_output_directory='/enigma/subjects/QC/';FS_directory='/enigma/subjects/';
a=dir(char(strcat(FS_directory,'/*')));%Choose this so that it selects only your %subject folders that contain FS output
for x = 3:size(a,1) [c,b,d]=fileparts(a(x,1).name); %b becomes the subject_name try func_make_corticalpngs_ENIGMA_QC(QC_output_directory, b, [FS_directory, '/', b, '/mri/orig.mgz'], [FS_directory,'/', b, '/mri/aparc+aseg.mgz']); end display(['Done with subject: ', b, ': ', num2str(x-2), ' of ', num2str(size(a,1)-2)]);end
The func_make_corticalpngs_ENIGMA_QC script should take approximately 7 seconds/subject and will output a series of *.png image files separated by individual subject folders.
NB: if you run into problems with this Matlab loop try removing the last “/” in the QC_output_directory variable. So, QC_output_directory='/enigma/subjects/QC/'; would become QC_output_directory='/enigma/subjects/QC';
Making the QC Webpage:
To create a webpage for easy viewing of the QC output you just generated in Matlab. Go to the directory where you stored the script make_ENIGMA_QC_webpage.sh and make sure it is executable:
chmod 777 make_ENIGMA_QC_webpage.sh
Now to run the script, just give the script the full path to the directory where you stored the Matlab QC output files:
./make_ENIGMA_QC_webpage.sh /enigma/subjects/QC/
NB: If you have trouble running this script, it’s possible that you need to fix the line endings in the script before running. You can do this by running this command: sed -i -e 's/\r$//' make_ENIGMA_QC_webpage.sh
This script will create a webpage called ENIGMA_Cortical_QC.html in the same folder as your QC output. To open the webpage in a browser in a Linux environment you can probably just type:
3

Written by Derrek Hibar, Neda Jahanshad, Roberto Toro, Jerod Rasmussen, Theo van Erp, Esther Walton, Stefan Ehrlich (last update May 4, 2014)
firefox /enigma/subjects/QC/ENIGMA_Cortical_QC.html
Note: if you want to check the segmentation on another computer, you can just copy over the whole /enigma/subjects/QC/ output folder to your computer and open the webpage from there.
Scroll through each set of images. Note that you can click on a subject’s files to see a larger version.
NOTE: you can use the legend.jpg file found in the ENIGMA_QC/ folder as a colored coded reference of each FreeSurfer ROI (split by left/right).
Here is an example of a good segmentation:
4

Written by Derrek Hibar, Neda Jahanshad, Roberto Toro, Jerod Rasmussen, Theo van Erp, Esther Walton, Stefan Ehrlich (last update May 4, 2014)
Here is an example of a BAD segmentation:
And a close-up shot of a good vs. bad segmentation:
Good:
5

Written by Derrek Hibar, Neda Jahanshad, Roberto Toro, Jerod Rasmussen, Theo van Erp, Esther Walton, Stefan Ehrlich (last update May 4, 2014)
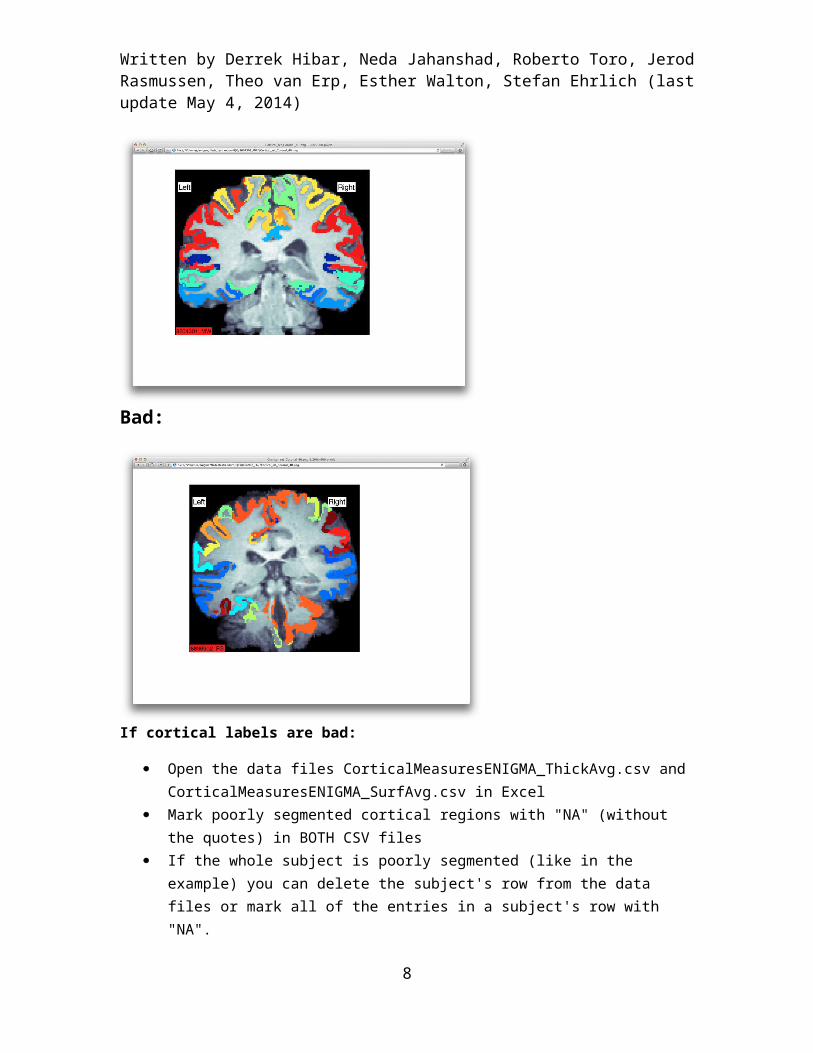
Bad:
If cortical labels are bad:
Open the data files CorticalMeasuresENIGMA_ThickAvg.csv and CorticalMeasuresENIGMA_SurfAvg.csv in Excel
Mark poorly segmented cortical regions with "NA" (without the quotes) in BOTH CSV files
If the whole subject is poorly segmented (like in the example) you can delete the subject's row from the data files or mark all of the entries in a subject's row with "NA".
Make sure to save the files back in CSV format!
6

Written by Derrek Hibar, Neda Jahanshad, Roberto Toro, Jerod Rasmussen, Theo van Erp, Esther Walton, Stefan Ehrlich (last update May 4, 2014)
The External Surface Method:
Download the script fsqc.sh: here
NB: FreeSurfer and its utilities need to be in your path or this script will not run properly. You can type tksurfer on the command line to make sure it is available.
The script fsqc.sh will create a webpage with lateral and medial snapshots of pial surface reconstructions colored with cortical labels. Clicking on the images will display a larger version. To run the script, first source FreeSurfer’s environment variable $SUBJECTS_DIR to point to your subjects directory. For example:
bash
export SUBJECTS_DIR=/enigma/Parent_Folder
Next create a directory to contain the snapshots (.tif image files), here we will call it fsqcdir/. Change the working directory to fsqcdir and run the fsqc.sh script from there:
cd fsqcdir
source /enigma/Parent_Folder/scripts/fsqc.sh
This script will call `tksurfer` in a loop for each subject and output a series of 4 images (.tif) files for each subject. It will also create a website called index.html so that you can easily view the images. You can open the index.html file in any browser, just make sure all of the .tif files are in the same folder if you decide to move the index.html file to a different location (like a local computer). If you are in a Linux environment you should be able to just type on the command line:
#while in the output fsqcdir output folder
firefox index.html
These are examples of successful reconstructions:
7
Written by Derrek Hibar, Neda Jahanshad, Roberto Toro, Jerod Rasmussen, Theo van Erp, Esther Walton, Stefan Ehrlich (last update May 4, 2014)
Make sure to:
Check that all lobes are present, especially the ventral part of the temporal lobe Check that labels positions are not different from the general case
Here is an example of a poor labeling:
If cortical labels are bad:
Open the data file CorticalMeasuresENIGMA_ThickAvg.csv and CorticalMeasuresENIGMA_SurfAvg.csv in Excel
Mark poorly segmented cortical regions with "NA" (without the quotes) in BOTH CSV files
If the whole subject is poorly segmented (like in the example) you can delete the subject's row from the data files or mark all of the entries in a subject's row with "NA".
Make sure to save the files back in CSV format!
8