· Web viewIf someone disagrees with a word have them share why. Allow for the person who...
44
Mathematics Alignment Lesson Grade 5 Quarter 4 Day 158 Common Core State Standard(s) 5.MD.2 Make a line plot to display a data set of measurements in fractions of a unit (1/2, 1/4, 1/8). Use operations on fractions for this grade to solve problems involving information presented in line plots. For example, different measurements of liquid in identical beakers, find the amount of liquid each beaker would contain if Vocabulary Line Plot – A diagram that shows the frequency of data on a number line. Materials Needed: Blackline Master- “Blue Crab Outlines”, “Crabby Line Plot,” “Line Plot Journal Plot,” “Practice Line Measuring,” “Crabby Line Plot Exit Ticket” Transparency- “How to Measure Crabs” Rulers Teacher Cardstock, “Math Alignment Lesson Crabby Line Plot Prior to Lesson: Cut out Teacher Cardstock “Math Group Talk Cards” for each group of students to be used in Step 6 below. 1. As an entrance ticket give each student a post-it and ask them to write three words that relate to line plots. Have them stick the post-it on the board. Once all students have posted their response read out the words and have students give thumbs up or thumbs down if they agree or disagree. If someone disagrees with a word have them share why. Allow for the person who posted the post-it to share their thinking. Make sure to review the vocabulary from yesterday 2. Tell students that you received a phone call from the NC Wildlife Commission yesterday and they had a special request. They asked if the class could help with some measuring of blue crabs that were caught in a trap found off of the coast of NC. Inside the trap were ten crabs. Explain to the students that NC law states that a Blue Crab must measure no less than 5 inches when measuring their carapace. If it measures less than 5 inches the crab must be released back into the ocean. The NC Wildlife commission has asked for the measurement data along with some conjectures about the data. 3. Show students Transparency “How to Measure Blue Crabs”. Explain that the carapace of a crab is the shell on the crab. In order to Homework Blackline Master- “Effects of Oil Spills on Assessment Observe students while they make their line plots and conjectures. Use the exit ticket to Standards for Mathematical Practice Standard 3: Construct viable arguments and critique reasoning of others Standard 4: Model with mathematics Standard 5: Use appropriate tools
Transcript of · Web viewIf someone disagrees with a word have them share why. Allow for the person who...

Mathematics Alignment LessonGrade 5 Quarter 4 Day 158
Common Core State Standard(s)
5.MD.2Make a line plot to display a data set of measurements in fractions of a unit (1/2, 1/4, 1/8). Use operations on fractions for this grade to solve problems involving information presented in line plots. For example, given different measurements of liquid in identical beakers, find the amount of liquid each beaker would contain if the total amount in all the beakers were redistributed equally.
Vocabulary
Line Plot – A diagram that shows the frequency of data on a number line.Outliers- Data points that are much larger or smaller than the majority of data points within the set
Materials Needed: Blackline Master- “Blue Crab
Outlines”, “Crabby Line Plot,” “Line Plot Journal Plot,” “Practice Line Measuring,” “Crabby Line Plot Exit Ticket”
Transparency- “How to Measure Crabs”
Rulers Teacher Cardstock, “Math Group Talk
Cards” Cut Up (1 set per group)
Alignment Lesson Crabby Line Plot
Prior to Lesson: Cut out Teacher Cardstock “Math Group Talk Cards” for each group of students to be used in Step 6 below.
1. As an entrance ticket give each student a post-it and ask them to write three words that relate to line plots. Have them stick the post-it on the board. Once all students have posted their response read out the words and have students give thumbs up or thumbs down if they agree or disagree. If someone disagrees with a word have them share why. Allow for the person who posted the post-it to share their thinking. Make sure to review the vocabulary from yesterday
2. Tell students that you received a phone call from the NC Wildlife Commission yesterday and they had a special request. They asked if the class could help with some measuring of blue crabs that were caught in a trap found off of the coast of NC. Inside the trap were ten crabs. Explain to the students that NC law states that a Blue Crab must measure no less than 5 inches when measuring their carapace. If it measures less than 5 inches the crab must be released back into the ocean. The NC Wildlife commission has asked for the measurement data along with some conjectures about the data.
3. Show students Transparency “How to Measure Blue Crabs”. Explain that the carapace of a crab is the shell on the crab. In order to measure you have to find the points on each side of the shell. On the transparency you will see a black dot that shows where the point ends. Ask students what tool they would use to measure the carapace of the Blue Crab. Show students using a transparent ruler or using a ruler with a document camera how to measure from one dot to the other. Make sure students understand that they will be measuring to the nearest eighth, fourth, and halves. (If students need practice measuring use Blackline Master “Practice Line Measuring.”)
Lesson Continued on Next Page…
Source: Teacher Created
Homework Blackline Master- “Effects of Oil Spills on Blue Crabs”
Assessment Observe students while they make
their line plots and conjectures. Use the exit ticket to ensure students
understand how to read data.
Standards for Mathematical PracticeStandard 3: Construct viable arguments and critique reasoning of othersStandard 4: Model with mathematicsStandard 5: Use appropriate tools strategically
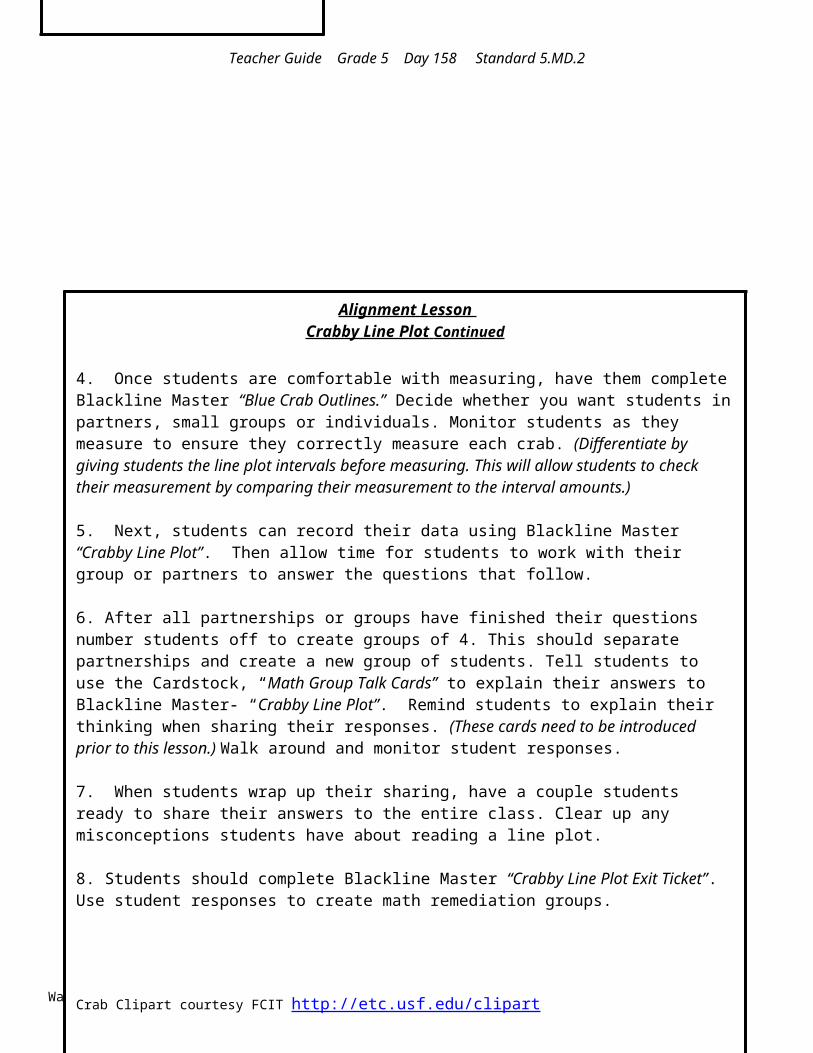
Teacher Guide Grade 5 Day 158 Standard 5.MD.2
Wake County Public School System, 2012
Source: Teacher CreatedAlignment Lesson
Crabby Line Plot Continued
4. Once students are comfortable with measuring, have them complete Blackline Master “Blue Crab Outlines.” Decide whether you want students in partners, small groups or individuals. Monitor students as they measure to ensure they correctly measure each crab. (Differentiate by giving students the line plot intervals before measuring. This will allow students to check their measurement by comparing their measurement to the interval amounts.)
5. Next, students can record their data using Blackline Master “Crabby Line Plot”. Then allow time for students to work with their group or partners to answer the questions that follow.
6. After all partnerships or groups have finished their questions number students off to create groups of 4. This should separate partnerships and create a new group of students. Tell students to use the Cardstock, “Math Group Talk Cards” to explain their answers to Blackline Master- “Crabby Line Plot”. Remind students to explain their thinking when sharing their responses. (These cards need to be introduced prior to this lesson.) Walk around and monitor student responses.
7. When students wrap up their sharing, have a couple students ready to share their answers to the entire class. Clear up any misconceptions students have about reading a line plot.
8. Students should complete Blackline Master “Crabby Line Plot Exit Ticket”. Use student responses to create math remediation groups.
Crab Clipart courtesy FCIT http://etc.usf.edu/clipart

Transparency Grade 5 Day 158 Standard 5.MD.2
How to Measure Blue Crabs
Wake County Public School System, 2012

BLUE CRAB OUTLINES Blackline Master Grade 5 Day 158 Standard 5.MD.2
Outlines-4 pages
Wake County Public School System, 2012

BLUE CRAB OUTLINES Blackline Master Grade 5 Day 158 Standard 5.MD.2
Wake County Public School System, 2012

BLUE CRAB OUTLINES Blackline Master Grade 5 Day 158 Standard 5.MD.2
Wake County Public School System, 2012

BLUE CRAB OUTLINES Blackline Master Grade 5 Day 158 Standard 5.MD.2
Wake County Public School System, 2012

Blackline Master Grade 5 Day 158 Standard 5.MD.2
Name_______________Crabby Line Plot
1. Measure the crabs and record the data on the line plot below.
2. How many crabs have to be released back into the ocean? __________How did you find your answer? ______________________________________________________________________________________
3. What is the average size of all the blue crabs caught? ___________________________________________
4. If the crabs were lined up side by side, about how long would their total length be? _________________
5. If a new crab was captured, about how long would their carapace be based off of your data? ___________
6. Are there any outliers within your data? ______ If so, how much smaller or larger are they from the average? ____________7. Based on your data, why do you believe NC has a law that does not allow the capture of crabs smaller than 5 inches? ________________________________________________________________________________________________________________________________________________________________________
Wake County Public School System, 2012

Blackline Master Grade 5 Day 158 Standard 5.MD.2
Practice Line Measuring
Wake County Public School System, 2012

Blackline Master Grade 5 Day 158 Standard 5.MD.2
Wake County Public School System, 2012
Name__________________________________ Crabby Line Plot Exit Ticket1. Below is a line plot of another trap found on the NC Coast. The line plot shows each crab’s carapace measurement. Use the data the answer the questions below.
X X X X X X
X X X X
2 ¼ 3 18 4 ½ 5 ¼ 5 ½
1. If the crabs were lined up side by side, how long would their total length be? _____________________
2. Is there an outlier in the data set? _______ If so how much smaller or larger is its size compared to the mode?
_______________
3. How many more crabs can be kept than the amount of crabs that have to be released? ___________________
4. How many total crabs were in this trap? ______________

Teacher Cardstock Math Group Talk Cards Grade 5 Day 158 Standard 5.MD.2
Revoice another group member’s
idea.
Ask another group member to restate
their thinking.
Agree or disagree with another group member’s thinking. Remember to explain your thinking.
Ask another group member to explain their
thinking.Add on to someone
else’s idea.Ask a question of
another group member.Wake County Public School System, 2012

Teacher Cardstock Math Group Talk Cards Grade 5 Day 158 Standard 5.MD.2
Wake County Public School System, 2012

Teacher Cardstock Math Group Talk Cards Grade 5 Day 158 Standard 5.MD.2
Revoice another group member’s
idea.
Ask another group member to restate
their thinking.
Agree or disagree with another group member’s thinking. Remember to explain your thinking.
Ask another group member to explain their
thinking.Add on to someone
else’s idea.Ask a question of
another group member.Wake County Public School System, 2012

Teacher Cardstock Math Group Talk Cards Grade 5 Day 158 Standard 5.MD.2
Wake County Public School System, 2012

Blackline Master Grade 5 Day 158 Standard 5.MD.2
Name____________________________
Effects of Oil Spills on Blue CrabsBelow is a line plot that shows measurements of 15 crabs born a year after an oil spill. Use the data to
answer the questions that follow.
XXX XX X X
X X X X X X X X X
1 ½ 1 ¼ 2 18 2 ¼ 2 ½ 3 ½ 4
1. What is the average size of the crabs caught? _____________________________________________________________________________
2. If the crabs were line up side by side, what would be the total length of the all the crabs? _________________________
3. If a new crab was measured from the same area, what do you predict their length would be? _________ Why do you think that?
_____________________________________________________________________________________________________________________
4. Is there an outlier within this data set? _______ What conjecture can be said about that outlier?
_____________________________________________________________________________________________________________________
5. Compared to the crabs you measured earlier today what effect do you believe the oil spill had on the size of the crabs? Explain your thinking.
_____________________________________________________________________________________________________________________
_____________________________________________________________________________________________________________________
_____________________________________________________________________________________________________________________
Wake County Public School System, 2012

Answer Key Grade 5 Day 158 Standard 5.MD.2
Crabby Line Plot Answer Key Name_______________1. Measure the crabs and record the data on the line plot below.
XX
X X X X X X X X X X X X X
1 ½ 1 ¾ 2 2 ¼ 2 ½ 2 ¾ 3 3 ¼ 3 ½ 3 ¾ 4 4 ¼ 4 ½
2. How many crabs have to be released back into the ocean? All of the crabs. How did you find your answer? Since all the crabs are less than five inches they all have to be released.
3. What is the average size of all the blue crabs caught? 38 ¼ /15= 2.55
4. If the crabs were lined up side by side, about how long would their total length be? 38 ¼
5. If a new crab was captured, about how long would their carapace be based off of your data? 2 ½
6. Are there any outliers within your data? 4 ½ If so, how much smaller or larger are they from the average? About two inches.
Wake County Public School System, 2012

Answer Key Grade 5 Day 158 Standard 5.MD.2
7. Based on your data, why do you believe NC has a law that does not allow the capture of crabs smaller than 5 inches? Answers may vary, but the reason is that smaller than 5 inches means the crab hasn’t fully grown yet and needs to grow some more before being caught.
Wake County Public School System, 2012

Answer Key Grade 5 Day 158 Standard 5.MD.2
Name__________________________________ Crabby Line Plot Exit Ticket
1. Below is a line plot of another trap found on the NC Coast. The line plot shows each crab’s carapace measurement. Use the data the answer the questions below.
X X X X X X
X X X X
2 ¼ 3 18 4 ½ 5 ¼ 5 ½
1. If the crabs were lined up side by side, how long would their total length be? 47 ¼
2. Is there an outlier in the data set? 2 ¼ If so how much smaller or larger is its size compared to the mode? 2 ¼
3. How many more crabs can be kept than the amount of crabs that have to be released? The same amount of crabs can be kept as the amount of crabs that have to be released.
4. How many total crabs were in this trap? 10 crabs
Wake County Public School System, 2012

Answer Key Grade 5 Day 158 Standard 5.MD.2
Wake County Public School System, 2012

Answer Key Grade 5 Day 158 Standard 5.MD.2
Effects of Oil Spills on Blue Crabs Answer KeyBelow is a line plot that shows measurements of 15 crabs born a year after an oil spill. Use the data to
answer the questions that follow.
XXX XX X X
X X X X X X X X X
1 ½ 1 ¼ 2 1/8 2 ¼ 2 ½ 3 ½ 4
1. What is the average size of the crabs caught? About 2 inches
2. If the crabs were line up side by side, what would be the total length of the all the crabs? 29 inches
3. If a new crab was measured from the same area, what do you predict their length would be? 1 ½ - 1 ¼ Why do you think that?
The crab would be around 1 ½ or 1 ¼ since the mode of the data is around those lengths.
4. Is there an outlier within this data set? Yes 4 What conjecture can be said about that outlier?
This crab was either not affected by the oil spill or was not in the same area as the other crabs.
5. Compared to the crabs you measured earlier today what effect do you believe the oil spill had on the size of the crabs? Explain your thinking.
The oil spill stunted the growth of the crabs. This data shows that these crabs are much smaller compared to the previous crabs. It is really important that we as humans understand our impact on the environment.
Wake County Public School System, 2012

Answer Key Grade 5 Day 158 Standard 5.MD.2
Practice Line Measuring Answer Key
6 ¼
4 ½
9 ¼
2 ½
7 ¾
5 ¾
¼
Wake County Public School System, 2012

Answer Key Grade 5 Day 158 Standard 5.MD.2
Outline of Crabs Answer Key
Wake County Public School System, 2012
2 ¼
2 ½
1 ¾
3 ½

Answer Key Grade 5 Day 158 Standard 5.MD.2
Wake County Public School System, 2012
3 ¾
1 ¾
2 ½
1 ½

Answer Key Grade 5 Day 158 Standard 5.MD.2
Wake County Public School System, 2012
3 ½
1 ½
2 ½
1 ¾
2 ½

Answer Key Grade 5 Day 158 Standard 5.MD.2
Wake County Public School System, 2012
4 ½
2 ½