· Web viewGraduate Student Satisfaction and Needs Survey. Results Relevant for the Division...
71
Graduate Student Satisfaction and Needs Survey Results Relevant for the Division Student Affairs Fall, 2015 Prepared by Jeremy Penn Office of Student Affairs Assessment Introduction The purpose of the Graduate Student Satisfaction and Needs Survey was to gather data on students’ thoughts and attitudes toward their graduate experiences at NDSU and to identify needs that could be addressed. The survey was developed jointly by the Office of Assessment in the Division of Student Affairs and the Graduate School. This version of the report includes only those survey items that were relevant to the Division of Student Affairs. Please contact Jeremy Penn or Brandy Randall if you have questions about these data. Response Rate The survey was sent to 2,128 graduate students. Three messages were sent through the graduate student listserv and two messages were sent directly through a mail-merge to each student’s NDSU email address. The direct emails were sent because a number of graduate students reported that the listserv messages were ending up in their clutter folders. A total of 691 responses were received for a response rate of 32%, although this may include students who started the survey more than once and students who did not answer all of the questions.
Transcript of · Web viewGraduate Student Satisfaction and Needs Survey. Results Relevant for the Division...

Graduate Student Satisfaction and Needs SurveyResults Relevant for the Division Student Affairs
Fall, 2015Prepared by Jeremy Penn
Office of Student Affairs AssessmentIntroductionThe purpose of the Graduate Student Satisfaction and Needs Survey was to gather data on students’ thoughts and attitudes toward their graduate experiences at NDSU and to identify needs that could be addressed. The survey was developed jointly by the Office of Assessment in the Division of Student Affairs and the Graduate School.
This version of the report includes only those survey items that were relevant to the Division of Student Affairs. Please contact Jeremy Penn or Brandy Randall if you have questions about these data.
Response RateThe survey was sent to 2,128 graduate students. Three messages were sent through the graduate student listserv and two messages were sent directly through a mail-merge to each student’s NDSU email address. The direct emails were sent because a number of graduate students reported that the listserv messages were ending up in their clutter folders. A total of 691 responses were received for a response rate of 32%, although this may include students who started the survey more than once and students who did not answer all of the questions.
Key FindingsNDSU graduate students are generally satisfied with their overall experiences at NDSU (89% somewhat satisfied, satisfied, or very satisfied). Students who were dissatisfied indicated a wide range of areas of dissatisfaction in open-ended comments, including advising, graduate student stipend rates, health insurance, quality of classes, and some support services. Specific results are described below. Students expressed the most interest in additional development opportunities in
finding jobs in non-academic settings (50% very interested), finding jobs in academic settings (47% very interested), writing (43%), college teaching (40%), and effective public speaking (39%). There was some interest in other topics as well.
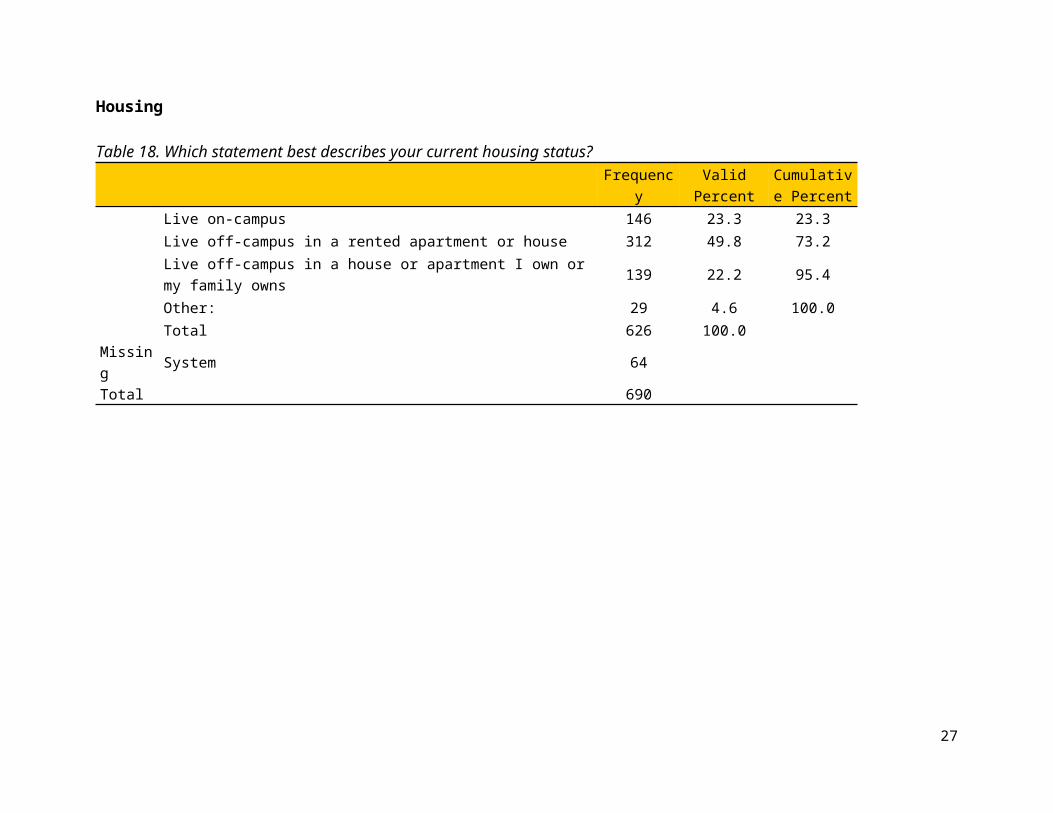
A large number of respondents lived on campus (23%) with the majority living in rented apartments or houses (50%). Students who lived on campus were less

satisfied with the value for the price (70%) than those who lived off-campus in a rented apartment or house (86%). 24% of students who lived off-campus in a rented apartment or house were very dissatisfied, dissatisfied, or somewhat dissatisfied in the ease in finding housing that met their needs. 47% of students who lived off-campus in a rented apartment or house were very dissatisfied, dissatisfied, or somewhat dissatisfied with the information provided by NDSU regarding housing options on- and off-campus prior to the start of classes.
Students were generally satisfied with social interactions, clubs, and relationships (88% somewhat satisfied, satisfied, or very satisfied). Students were most satisfied with their relationships with other students and with staff members.
Students expressed strong dissatisfaction with the value for the money of the NDUS health insurance plan available to students (57% very dissatisfied, dissatisfied, or somewhat dissatisfied). Students were satisfied with the access to health care on the NDSU campus (87%) and in the Fargo-Moorhead community (89%). Although 74% of students were satisfied with access to child care resources at NDSU, 12% were very dissatisfied. 90% were satisfied with recreation opportunities available on the NDSU campus.
29% of students working in a graduate assistantship, research assistantship, or teaching assistantship were very dissatisfied, dissatisfied, or somewhat dissatisfied with the fairness of the wage or salary for the work being performed. This is much higher than for students who had on-campus student employment (13% dissatisfied). 93% of students in a graduate assistantship, research assistantship, or teaching assistantship and 87% of those in on-campus student employment were somewhat satisfied, satisfied, or very satisfied with the relationship with their work supervisor.
77% of students were stressed about their finances in general and 60% worried about being able to pay their current monthly expenses.
84% agreed that services for students with disabilities were readily available. 68% knew who to contact for help with a personal issue and 79% knew who to
contact for academic help. 90% of international students who had attended international student orientation
found it very helpful or somewhat helpful for their graduate work at NDSU. 63% of international students were somewhat satisfied, satisfied, or very satisfied
with the support NDSU provided in navigating the U.S. job market for employment while a student.
2
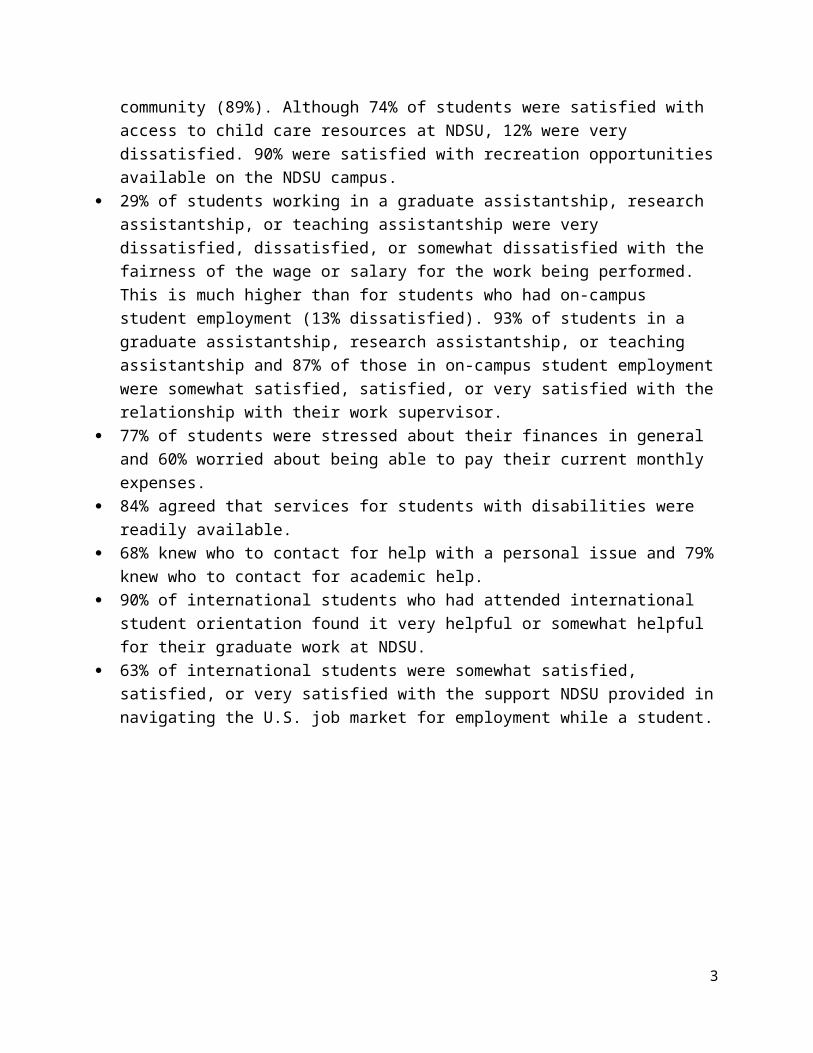
Table of ContentsResults.............................................................................................................................4
Satisfaction...................................................................................................................4
Participation and Interest in Training Sessions.............................................................5
Housing.......................................................................................................................18
Social Interactions.......................................................................................................24
Recreation, Health Care, and Child Care...................................................................29
Employment................................................................................................................34
Finances and Getting Help.........................................................................................44
Demographics................................................................................................................48
Degrees Pursued........................................................................................................48
International Status.....................................................................................................49
Enrollment Status, Ethnicity, Gender, and Sexual Orientation....................................51
Future Employment Plans...........................................................................................53
3

ResultsSatisfactionTable 1. Satisfaction statistics.
Student support services available (e.g., Wellness Center, Counseling Services, Student
Activities, etc.)Overall experience as a
graduate student at NDSUN 568 669Missing 122 21
Mean 5.03 4.79
Table 2. Student support services available (e.g., Wellness Center, Counseling Services, Student Activities, etc.).
Frequency Valid Percent Cumulative PercentVery Dissatisfied 8 1.4 1.4Dissatisfied 14 2.5 3.9Somewhat Dissatisfied 13 2.3 6.2Somewhat satisfied 73 12.9 19.0Satisfied 271 47.7 66.7Very satisfied 189 33.3 100.0Total 568 100.0
MissingDoes not apply 98System 24Total 122
Total 690
Table 3. Overall experience as a graduate student at NDSU. Frequency Valid Percent Cumulative Percent
Very Dissatisfied 18 2.7 2.7Dissatisfied 21 3.1 5.8Somewhat Dissatisfied 37 5.5 11.4Somewhat satisfied 99 14.8 26.2Satisfied 325 48.6 74.7Very satisfied 169 25.3 100.0Total 669 100.0
MissingDoes not apply 3System 18Total 21
Total 690
4

Participation and Interest in Training Sessions
Table 4. Plagiarism.Interest-Plagiarism
TotalNot at all interested Somewhat interested Very interested
Participation-Plagiarism
Have NOT participated in training
Count 129 128 57 314
% within Participation-Plagiarism 41.1% 40.8% 18.2% 100.0%
% within Interest-Plagiarism 65.8% 61.0% 52.8% 61.1%
Participated in training once
Count 28 57 34 119
% within Participation-Plagiarism 23.5% 47.9% 28.6% 100.0%
% within Interest-Plagiarism 14.3% 27.1% 31.5% 23.2%
Participated in training more than once
Count 39 25 17 81
% within Participation-Plagiarism 48.1% 30.9% 21.0% 100.0%
% within Interest-Plagiarism 19.9% 11.9% 15.7% 15.8%
Total
Count 196 210 108 514
% within Participation-Plagiarism 38.1% 40.9% 21.0% 100.0%
% within Interest-Plagiarism 100.0% 100.0% 100.0% 100.0%
5

Table 5. College Teaching. Interest-College teaching
TotalNot at all interested
Somewhat interested
Very interested
Participation-College teaching
Have NOT participated in training
Count 104 134 119 357
% within Participation-College teaching 29.1% 37.5% 33.3% 100.0%
% within Interest-College teaching 87.4% 69.4% 56.9% 68.5%
Participated in training once
Count 9 36 47 92
% within Participation-College teaching 9.8% 39.1% 51.1% 100.0%
% within Interest-College teaching 7.6% 18.7% 22.5% 17.7%
Participated in training more than once
Count 6 23 43 72
% within Participation-College teaching 8.3% 31.9% 59.7% 100.0%
% within Interest-College teaching 5.0% 11.9% 20.6% 13.8%
Total
Count 119 193 209 521
% within Participation-College teaching 22.8% 37.0% 40.1% 100.0%
% within Interest-College teaching 100.0% 100.0% 100.0% 100.0%
6
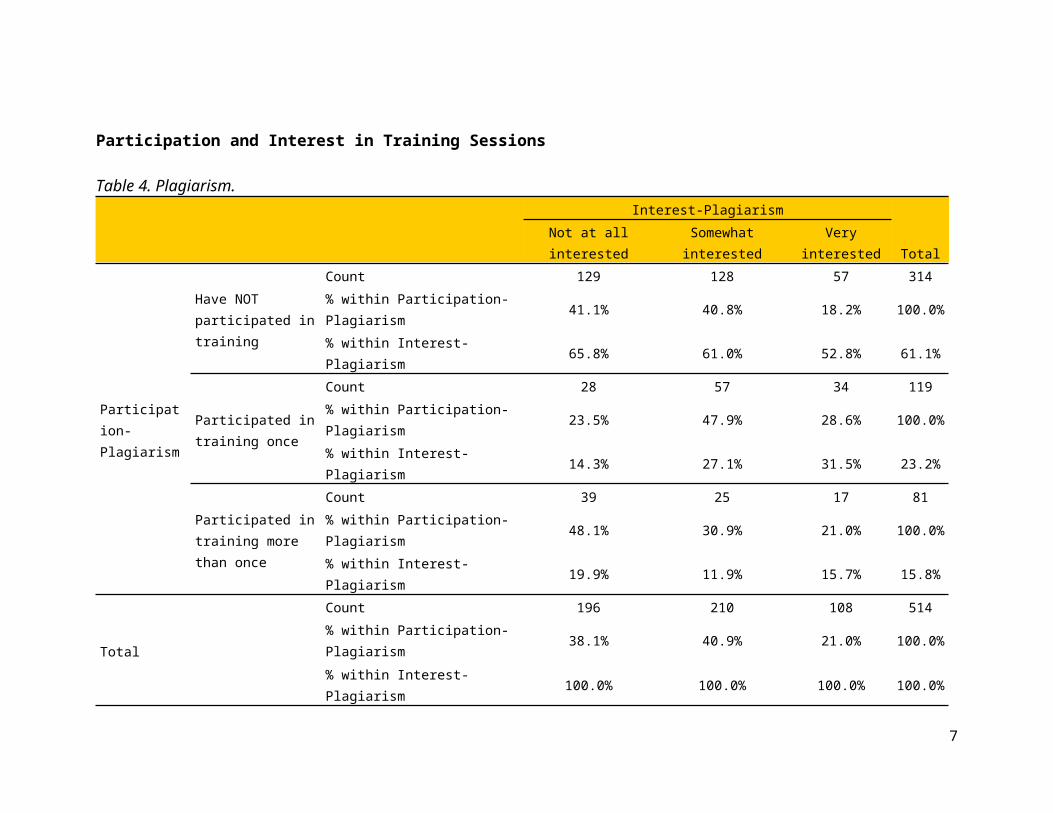
Table 6. Leadership. Interest-Leadership
TotalNot at all interested
Somewhat interested
Very interested
Participation-Leadership
Have NOT participated in training
Count 91 181 134 406
% within Participation-Leadership 22.4% 44.6% 33.0% 100.0%
% within Interest-Leadership 90.1% 79.4% 67.7% 77.0%
Participated in training once
Count 8 32 34 74
% within Participation-Leadership 10.8% 43.2% 45.9% 100.0%
% within Interest-Leadership 7.9% 14.0% 17.2% 14.0%
Participated in training more than once
Count 2 15 30 47
% within Participation-Leadership 4.3% 31.9% 63.8% 100.0%
% within Interest-Leadership 2.0% 6.6% 15.2% 8.9%
Total
Count 101 228 198 527
% within Participation-Leadership 19.2% 43.3% 37.6% 100.0%
% within Interest-Leadership 100.0% 100.0% 100.0% 100.0%
7

Table 7. Writing. Interest-Writing
TotalNot at all interested
Somewhat interested
Very interested
Participation-Writing
Have NOT participated in training
Count 73 129 104 306
% within Participation-Writing 23.9% 42.2% 34.0% 100.0%
% within Interest-Writing 84.9% 61.7% 46.6% 59.1%
Participated in training once
Count 6 50 54 110
% within Participation-Writing 5.5% 45.5% 49.1% 100.0%
% within Interest-Writing 7.0% 23.9% 24.2% 21.2%
Participated in training more than once
Count 7 30 65 102
% within Participation-Writing 6.9% 29.4% 63.7% 100.0%
% within Interest-Writing 8.1% 14.4% 29.1% 19.7%
Total
Count 86 209 223 518
% within Participation-Writing 16.6% 40.3% 43.1% 100.0%
% within Interest-Writing 100.0% 100.0% 100.0% 100.0%
8
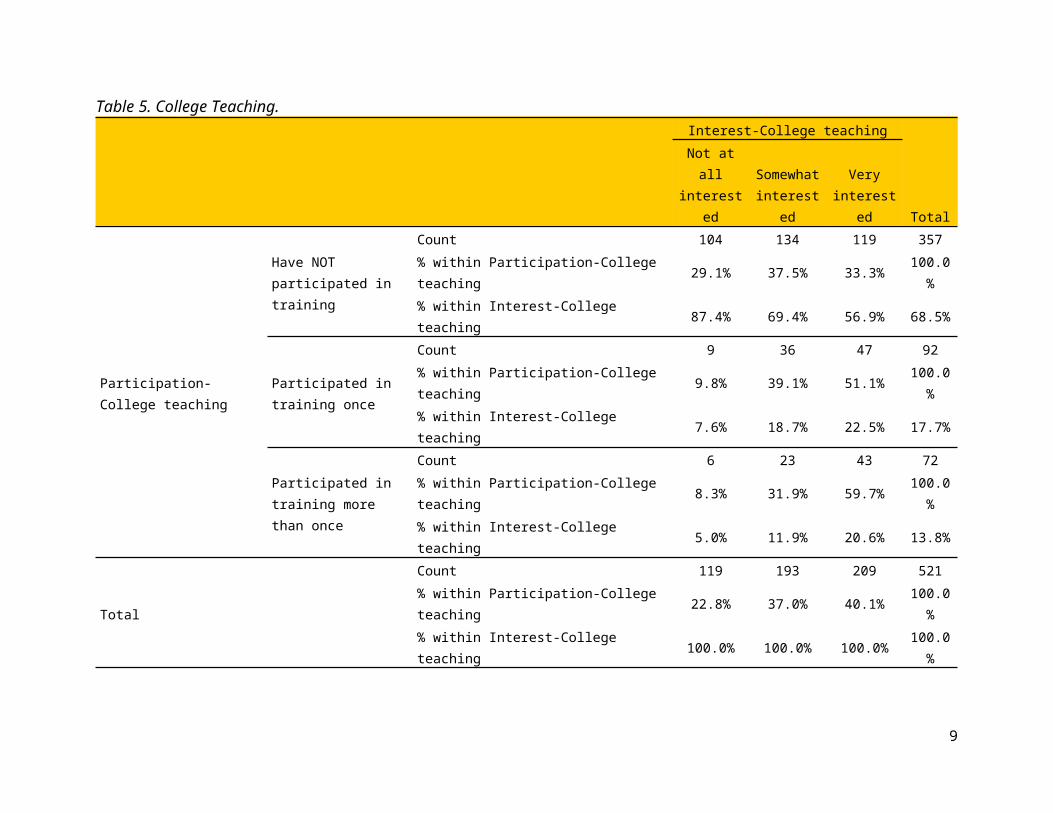
Table 8. Project management. Interest-Project management
TotalNot at all interested
Somewhat interested
Very interested
Participation-Project management
Have NOT participated in training
Count 107 171 152 430
% within Participation-Project management 24.9% 39.8% 35.3% 100.0%
% within Interest-Project management 92.2% 79.9% 77.9% 81.9%
Participated in training once
Count 8 31 23 62
% within Participation-Project management 12.9% 50.0% 37.1% 100.0%
% within Interest-Project management 6.9% 14.5% 11.8% 11.8%
Participated in training more than once
Count 1 12 20 33
% within Participation-Project management 3.0% 36.4% 60.6% 100.0%
% within Interest-Project management 0.9% 5.6% 10.3% 6.3%
Total
Count 116 214 195 525
% within Participation-Project management 22.1% 40.8% 37.1% 100.0%
% within Interest-Project management 100.0% 100.0% 100.0% 100.0%
9

Table 9. Networking. Interest-Networking
TotalNot at all interested
Somewhat interested
Very interested
Participation-Networking
Have NOT participated in training
Count 106 158 133 397
% within Participation-Networking 26.7% 39.8% 33.5% 100.0%
% within Interest-Networking 93.0% 71.5% 70.4% 75.8%
Participated in training once
Count 6 49 32 87
% within Participation-Networking 6.9% 56.3% 36.8% 100.0%
% within Interest-Networking 5.3% 22.2% 16.9% 16.6%
Participated in training more than once
Count 2 14 24 40
% within Participation-Networking 5.0% 35.0% 60.0% 100.0%
% within Interest-Networking 1.8% 6.3% 12.7% 7.6%
Total
Count 114 221 189 524
% within Participation-Networking 21.8% 42.2% 36.1% 100.0%
% within Interest-Networking 100.0% 100.0% 100.0% 100.0%
10

Table 10. Working in interdisciplinary teams. Interest-Working in interdisciplinary
teams
TotalNot at all interested
Somewhat interested
Very interested
Participation-Working in interdisciplinary teams
Have NOT participated in training
Count 106 169 137 412
% within Participation-Working in interdisciplinary teams 25.7% 41.0% 33.3% 100.0%
% within Interest-Working in interdisciplinary teams 88.3% 75.1% 76.1% 78.5%
Participated in training once
Count 8 41 27 76
% within Participation-Working in interdisciplinary teams 10.5% 53.9% 35.5% 100.0%
% within Interest-Working in interdisciplinary teams 6.7% 18.2% 15.0% 14.5%
Participated in training more than once
Count 6 15 16 37
% within Participation-Working in interdisciplinary teams 16.2% 40.5% 43.2% 100.0%
% within Interest-Working in interdisciplinary teams 5.0% 6.7% 8.9% 7.0%
Total
Count 120 225 180 525
% within Participation-Working in interdisciplinary teams 22.9% 42.9% 34.3% 100.0%
% within Interest-Working in interdisciplinary teams 100.0% 100.0% 100.0% 100.0%
11
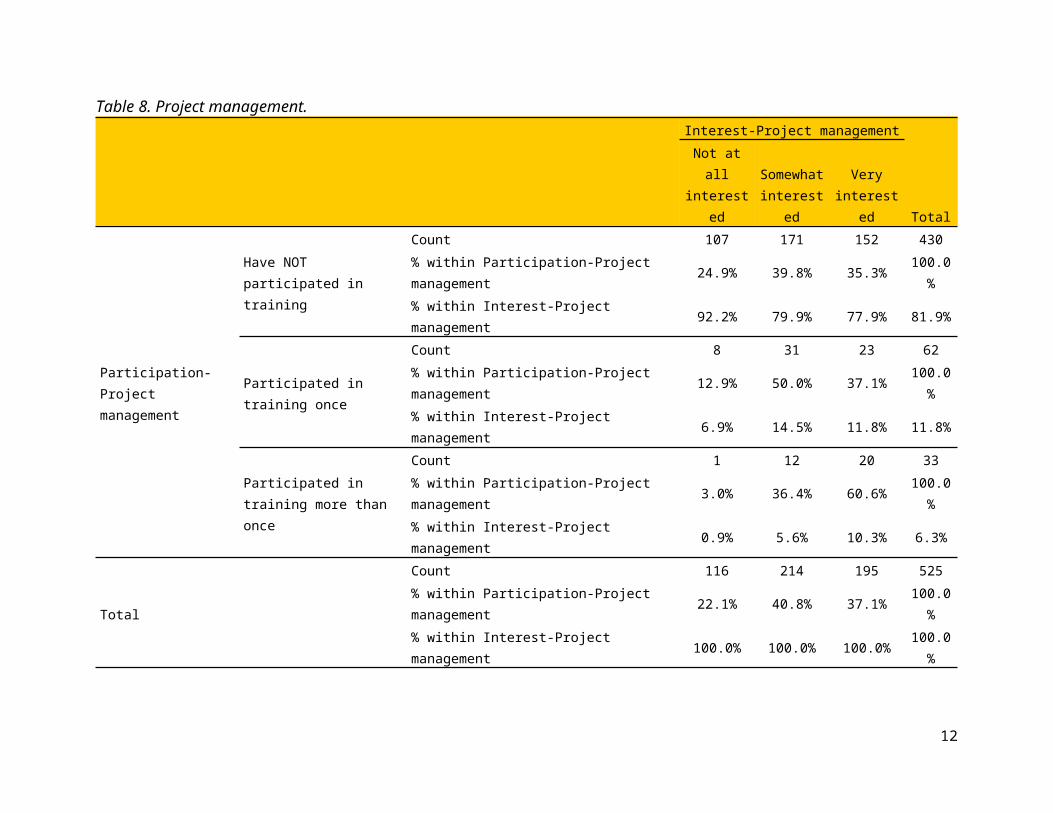
Table 11. Ethics. Interest-Ethics
TotalNot at all interested
Somewhat interested
Very interested
Participation-Ethics
Have NOT participated in training
Count 91 141 84 316
% within Participation-Ethics 28.8% 44.6% 26.6% 100.0%
% within Interest-Ethics 68.4% 55.7% 61.8% 60.5%
Participated in training once
Count 21 79 25 125
% within Participation-Ethics 16.8% 63.2% 20.0% 100.0%
% within Interest-Ethics 15.8% 31.2% 18.4% 23.9%
Participated in training more than once
Count 21 33 27 81
% within Participation-Ethics 25.9% 40.7% 33.3% 100.0%
% within Interest-Ethics 15.8% 13.0% 19.9% 15.5%
Total
Count 133 253 136 522
% within Participation-Ethics 25.5% 48.5% 26.1% 100.0%
% within Interest-Ethics 100.0% 100.0% 100.0% 100.0%
12

Table 12. Effective public speaking. Interest-Effective public speaking
TotalNot at all interested
Somewhat interested
Very interested
Participation-Effective public speaking
Have NOT participated in training
Count 82 156 134 372
% within Participation-Effective public speaking 22.0% 41.9% 36.0% 100.0%
% within Interest-Effective public speaking 82.8% 70.0% 64.1% 70.1%
Participated in training once
Count 5 45 35 85
% within Participation-Effective public speaking 5.9% 52.9% 41.2% 100.0%
% within Interest-Effective public speaking 5.1% 20.2% 16.7% 16.0%
Participated in training more than once
Count 12 22 40 74
% within Participation-Effective public speaking 16.2% 29.7% 54.1% 100.0%
% within Interest-Effective public speaking 12.1% 9.9% 19.1% 13.9%
Total
Count 99 223 209 531
% within Participation-Effective public speaking 18.6% 42.0% 39.4% 100.0%
% within Interest-Effective public speaking 100.0% 100.0% 100.0% 100.0%
13

Table 13. Finding jobs in academic settings. Interest-Finding jobs in academic
settings
TotalNot at all interested
Somewhat interested
Very interested
Participation-Finding jobs in academic settings
Have NOT participated in training
Count 110 132 182 424
% within Participation-Finding jobs in academic settings 25.9% 31.1% 42.9% 100.0%
% within Interest-Finding jobs in academic settings 95.7% 79.5% 73.4% 80.2%
Participated in training once
Count 5 27 42 74
% within Participation-Finding jobs in academic settings 6.8% 36.5% 56.8% 100.0%
% within Interest-Finding jobs in academic settings 4.3% 16.3% 16.9% 14.0%
Participated in training more than once
Count 0 7 24 31
% within Participation-Finding jobs in academic settings 0.0% 22.6% 77.4% 100.0%
% within Interest-Finding jobs in academic settings 0.0% 4.2% 9.7% 5.9%
Total
Count 115 166 248 529
% within Participation-Finding jobs in academic settings 21.7% 31.4% 46.9% 100.0%
% within Interest-Finding jobs in academic settings 100.0% 100.0% 100.0% 100.0%
14

Table 14. Finding jobs in non-academic settings. Interest-Finding jobs in nonacademic settings
TotalNot at all interested
Somewhat interested
Very interested
Participation-Finding jobs in nonacademic settings
Have NOT participated in training
Count 92 135 185 412
% within Participation-Finding jobs in nonacademic settings 22.3% 32.8% 44.9% 100.0%
% within Interest-Finding jobs in nonacademic settings 92.0% 84.9% 70.3% 78.9%
Participated in training once
Count 7 19 48 74
% within Participation-Finding jobs in nonacademic settings 9.5% 25.7% 64.9% 100.0%
% within Interest-Finding jobs in nonacademic settings 7.0% 11.9% 18.3% 14.2%
Participated in training more than once
Count 1 5 30 36
% within Participation-Finding jobs in nonacademic settings 2.8% 13.9% 83.3% 100.0%
% within Interest-Finding jobs in nonacademic settings 1.0% 3.1% 11.4% 6.9%
Total
Count 100 159 263 522
% within Participation-Finding jobs in nonacademic settings 19.2% 30.5% 50.4% 100.0%
% within Interest-Finding jobs in nonacademic settings 100.0% 100.0% 100.0% 100.0%
15

Table 15. Stress management. Interest-Stress management
TotalNot at all interested
Somewhat interested
Very interested
Participation-Stress management
Have NOT participated in training
Count 121 175 142 438
% within Participation-Stress management 27.6% 40.0% 32.4% 100.0%
% within Interest-Stress management 93.1% 85.0% 73.6% 82.8%
Participated in training once
Count 8 25 32 65
% within Participation-Stress management 12.3% 38.5% 49.2% 100.0%
% within Interest-Stress management 6.2% 12.1% 16.6% 12.3%
Participated in training more than once
Count 1 6 19 26
% within Participation-Stress management 3.8% 23.1% 73.1% 100.0%
% within Interest-Stress management 0.8% 2.9% 9.8% 4.9%
Total
Count 130 206 193 529
% within Participation-Stress management 24.6% 38.9% 36.5% 100.0%
% within Interest-Stress management 100.0% 100.0% 100.0% 100.0%
16

Table 16. Elevator speech. Interest-Elevator speech
TotalNot at all interested
Somewhat interested
Very interested
Participation-Elevator speech
Have NOT participated in training
Count 146 162 121 429
% within Participation-Elevator speech 34.0% 37.8% 28.2% 100.0%
% within Interest-Elevator speech 91.3% 80.2% 74.7% 81.9%
Participated in training once
Count 11 33 27 71
% within Participation-Elevator speech 15.5% 46.5% 38.0% 100.0%
% within Interest-Elevator speech 6.9% 16.3% 16.7% 13.5%
Participated in training more than once
Count 3 7 14 24
% within Participation-Elevator speech 12.5% 29.2% 58.3% 100.0%
% within Interest-Elevator speech 1.9% 3.5% 8.6% 4.6%
Total
Count 160 202 162 524
% within Participation-Elevator speech 30.5% 38.5% 30.9% 100.0%
% within Interest-Elevator speech 100.0% 100.0% 100.0% 100.0%
Table 17. Time preference for workshops (N = 609). Time n Valid percentMorning 198 33%Noon hour 160 26%Afternoon 243 40%Evening 296 49%Other 60 10%*Total adds to more than 100% since students were able to select more than one time preference.
17

Housing
Table 18. Which statement best describes your current housing status?
FrequencyValid
PercentCumulative
PercentLive on-campus 146 23.3 23.3Live off-campus in a rented apartment or house 312 49.8 73.2Live off-campus in a house or apartment I own or my family owns 139 22.2 95.4Other: 29 4.6 100.0Total 626 100.0
Missing System 64Total 690
18

Table 19. Housing: Value for the price. Value for the price
Total
Very Dissatisfie
dDissatisfie
d
Somewhat Dissatisfie
d
Somewhat
SatisfiedSatisfie
d
Very satisfie
d Mean
Live on-campus
Count 10 11 22 34 49 19 145
4.09% within housing status 6.9% 7.6% 15.2% 23.4% 33.8% 13.1%100.0
%% by satisfaction category 50.0% 40.7% 47.8% 25.4% 25.4% 13.5% 25.8%
Live off-campus in a rented apartment or house
Count 8 15 20 87 101 70 301
4.55% within housing status 2.7% 5.0% 6.6% 28.9% 33.6% 23.3%100.0
%% by satisfaction category 40.0% 55.6% 43.5% 64.9% 52.3% 49.6% 53.7%
Live off-campus in a house or apartment I own or my family owns
Count 1 0 4 10 42 52 109
5.28% within housing status 0.9% 0.0% 3.7% 9.2% 38.5% 47.7%100.0
%% by satisfaction category 5.0% 0.0% 8.7% 7.5% 21.8% 36.9% 19.4%
Other:
Count 1 1 0 3 1 0 6
3.33% within housing status 16.7% 16.7% 0.0% 50.0% 16.7% 0.0%100.0
%% by satisfaction category 5.0% 3.7% 0.0% 2.2% 0.5% 0.0% 1.1%
Total
Count 20 27 46 134 193 141 561
4.56% within housing status 3.6% 4.8% 8.2% 23.9% 34.4% 25.1%
100.0%
% by satisfaction category 100.0% 100.0% 100.0% 100.0% 100.0% 100.0%100.0
%
19

20

Table 20. Housing: Ease in finding housing that met my needs. Ease in finding housing that met my needs
Total
Very Dissatisfie
dDissatisfie
d
Somewhat Dissatisfie
d
Somewhat
SatisfiedSatisfie
d
Very satisfie
d Mean
Live on-campus
Count 7 13 10 35 56 21 142
4.29% within housing status 4.9% 9.2% 7.0% 24.6% 39.4% 14.8%
100.0%
% by satisfaction category
36.8% 37.1% 17.5% 28.9% 26.4% 23.3% 26.6%
Live off-campus in a rented apartment or house
Count 10 20 41 71 122 32 296
4.25% within housing status 3.4% 6.8% 13.9% 24.0% 41.2% 10.8%
100.0%
% by satisfaction category
52.6% 57.1% 71.9% 58.7% 57.5% 35.6% 55.4%
Live off-campus in a house or apartment I own or my family owns
Count 1 1 5 13 33 36 89
5.07% within housing status 1.1% 1.1% 5.6% 14.6% 37.1% 40.4%
100.0%
% by satisfaction category
5.3% 2.9% 8.8% 10.7% 15.6% 40.0% 16.7%
Other:
Count 1 1 1 2 1 1 7
3.57% within housing status 14.3% 14.3% 14.3% 28.6% 14.3% 14.3%
100.0%
% by satisfaction category
5.3% 2.9% 1.8% 1.7% 0.5% 1.1% 1.3%
Total Count 19 35 57 121 212 90 534 4.39% within housing status 3.6% 6.6% 10.7% 22.7% 39.7% 16.9% 100.0
%
21

% by satisfaction category
100.0% 100.0% 100.0% 100.0% 100.0% 100.0%100.0
%
22

Table 21. Housing: Ease in getting to campus. Ease in getting to campus
Total
Very Dissatisfie
dDissatisfie
d
Somewhat Dissatisfie
dSomewhat Satisfied
Satisfied
Very satisfie
d Mean
Live on-campus
Count 3 3 7 19 68 43 143
4.92% within housing status 2.1% 2.1% 4.9% 13.3% 47.6% 30.1%
100.0%
% by satisfaction category
27.3% 17.6% 22.6% 18.6% 30.5% 27.9% 26.6%
Live off-campus in a rented apartment or house
Count 3 9 18 65 118 78 291
4.79% within housing status 1.0% 3.1% 6.2% 22.3% 40.5% 26.8%
100.0%
% by satisfaction category
27.3% 52.9% 58.1% 63.7% 52.9% 50.6% 54.1%
Live off-campus in a house or apartment I own or my family owns
Count 3 5 6 18 37 33 102
4.76% within housing status 2.9% 4.9% 5.9% 17.6% 36.3% 32.4%
100.0%
% by satisfaction category
27.3% 29.4% 19.4% 17.6% 16.6% 21.4% 19.0%
Other:
Count 2 0 0 0 0 0 2
1.00% within housing status 100.0% 0.0% 0.0% 0.0% 0.0% 0.0%
100.0%
% by satisfaction category
18.2% 0.0% 0.0% 0.0% 0.0% 0.0% 0.4%
Total Count 11 17 31 102 223 154 538 4.80% within housing status 2.0% 3.2% 5.8% 19.0% 41.4% 28.6% 100.0
%
23

% by satisfaction category
100.0% 100.0% 100.0% 100.0% 100.0% 100.0%100.0
%
24

Table 22. Housing: Relationship with landlord. Relationship with landlord
Total
Very Dissatisfie
dDissatisfie
d
Somewhat Dissatisfie
dSomewhat Satisfied
Satisfied
Very satisfied Mean
Live on-campus
Count 2 5 4 24 62 18 115
4.68% within housing status 1.7% 4.3% 3.5% 20.9% 53.9% 15.7%100.0
%% by satisfaction category 33.3% 50.0% 20.0% 26.4% 32.5% 22.0% 28.7%
Live off-campus in a rented apartment or house
Count 4 5 16 67 129 64 285
4.77% within housing status 1.4% 1.8% 5.6% 23.5% 45.3% 22.5%100.0
%% by satisfaction category 66.7% 50.0% 80.0% 73.6% 67.5% 78.0% 71.3%
Total
Count 6 10 20 91 191 82 400
4.74% within housing status 1.5% 2.5% 5.0% 22.8% 47.8% 20.5%
100.0%
% by satisfaction category 100.0% 100.0% 100.0% 100.0% 100.0% 100.0%100.0
%
Table 23. Housing: Ease in finding roommates. Ease in finding roommates
TotalVery
DissatisfiedDissatisfie
dSomewhat Dissatisfied
Somewhat Satisfied Satisfied
Very satisfied Mean
Live off-campus in a rented apartment or house
Count 2 5 18 30 66 27 1484.58% within housing status 1.4% 3.4% 12.2% 20.3% 44.6% 18.2% 100.0%
% by satisfaction category 100.0% 100.0% 100.0% 100.0% 100.0% 100.0% 100.0%Total Count 2 5 18 30 66 27 148 4.58
% within housing status 1.4% 3.4% 12.2% 20.3% 44.6% 18.2% 100.0%
25

% by satisfaction category 100.0% 100.0% 100.0% 100.0% 100.0% 100.0% 100.0%
Table 24. Housing: Information provided by NDSU regarding housing options on- and off-campus prior to the start of classes.
Information provided by NDSU regarding housing options on- and off-campus prior to the start of classes
Total
Very Dissatisfie
dDissatisfie
d
Somewhat Dissatisfie
dSomewhat Satisfied
Satisfied
Very satisfie
d Mean
Live on-campus
Count 5 4 16 31 58 23 137
4.47% within housing status 3.6% 2.9% 11.7% 22.6% 42.3% 16.8%100.0
%% by satisfaction category 13.2% 9.5% 31.4% 34.8% 45.7% 59.0% 35.5%
Live off-campus in a rented apartment or house
Count 30 37 28 49 54 6 204
3.38% within housing status 14.7% 18.1% 13.7% 24.0% 26.5% 2.9%100.0
%% by satisfaction category 78.9% 88.1% 54.9% 55.1% 42.5% 15.4% 52.8%
Live off-campus in a house or apartment I own or my family owns
Count 2 0 7 9 14 10 42
4.50% within housing status 4.8% 0.0% 16.7% 21.4% 33.3% 23.8%100.0
%% by satisfaction category 5.3% 0.0% 13.7% 10.1% 11.0% 25.6% 10.9%
Other:
Count 1 1 0 0 1 0 3
2.67% within housing status 33.3% 33.3% 0.0% 0.0% 33.3% 0.0%100.0
%% by satisfaction category 2.6% 2.4% 0.0% 0.0% 0.8% 0.0% 0.8%
Total Count 38 42 51 89 127 39 386 3.89
26
% within housing status 9.8% 10.9% 13.2% 23.1% 32.9% 10.1%100.0
%
% by satisfaction category 100.0% 100.0% 100.0% 100.0% 100.0% 100.0%100.0
%
27

Social Interactions
Table 25. Satisfaction with social interactions, clubs, and relationships.
Student organization
and clubs
Academic-related social
groups
Ability to meet people with
similar interests
Relationships with faculty
Relationships with staff
Relationships with other students
Relationships with other
members of the Fargo-Moorhead community
N 430 444 504 584 562 567 491Missing 260 246 186 106 128 123 199
Mean 4.55 4.45 4.37 4.88 5.01 5.00 4.69
Table 26. Satisfaction with student organizations and clubs.
Frequency Valid PercentCumulative
PercentVery Dissatisfied 8 1.9 1.9Dissatisfied 11 2.6 4.4Somewhat Dissatisfied 33 7.7 12.1Somewhat Satisfied 119 27.7 39.8Satisfied 204 47.4 87.2Very Satisfied 55 12.8 100.0Total 430 100.0
MissingDoes not apply 175System 85Total 260
Total 690
28

Table 27. Satisfaction with academic-related social groups. Frequency Valid Percent Cumulative Percent
Very Dissatisfied 10 2.3 2.3Dissatisfied 16 3.6 5.9Somewhat Dissatisfied 33 7.4 13.3Somewhat Satisfied 133 30.0 43.2Satisfied 207 46.6 89.9Very Satisfied 45 10.1 100.0Total 444 100.0
MissingDoes not apply 161System 85Total 246
Total 690
29

Table 28. Satisfaction with ability to meet people with similar interests. Frequency Valid Percent Cumulative Percent
Very Dissatisfied 15 3.0 3.0Dissatisfied 20 4.0 6.9Somewhat Dissatisfied 53 10.5 17.5Somewhat Satisfied 145 28.8 46.2Satisfied 219 43.5 89.7Very Satisfied 52 10.3 100.0Total 504 100.0
MissingDoes not apply 99System 87Total 186
Total 690
Table 29. Relationships with faculty. Frequency Valid Percent Cumulative Percent
Very Dissatisfied 14 2.4 2.4Dissatisfied 11 1.9 4.3Somewhat Dissatisfied 29 5.0 9.2Somewhat Satisfied 101 17.3 26.5Satisfied 251 43.0 69.5Very Satisfied 178 30.5 100.0Total 584 100.0
MissingDoes not apply 23System 83Total 106
Total 690
30

Table 30. Relationships with staff. Frequency Valid Percent Cumulative Percent
Very Dissatisfied 9 1.6 1.6Dissatisfied 8 1.4 3.0Somewhat Dissatisfied 15 2.7 5.7Somewhat Satisfied 86 15.3 21.0Satisfied 262 46.6 67.6Very Satisfied 182 32.4 100.0Total 562 100.0
MissingDoes not apply 42System 86Total 128
Total 690
31

Table 31. Relationships with other students. Frequency Valid Percent Cumulative Percent
Very Dissatisfied 5 .9 .9Dissatisfied 3 .5 1.4Somewhat Dissatisfied 21 3.7 5.1Somewhat Satisfied 96 16.9 22.0Satisfied 273 48.1 70.2Very Satisfied 169 29.8 100.0Total 567 100.0
MissingDoes not apply 38System 85Total 123
Total 690
Table 32. Relationships with other members of the Fargo-Moorhead community. Frequency Valid Percent Cumulative Percent
Very Dissatisfied 11 2.2 2.2Dissatisfied 12 2.4 4.7Somewhat Dissatisfied 28 5.7 10.4Somewhat Satisfied 126 25.7 36.0Satisfied 204 41.5 77.6Very Satisfied 110 22.4 100.0Total 491 100.0
MissingDoes not apply 115System 84Total 199
Total 690
32

Recreation, Health Care, and Child CareTable 33. Satisfaction with recreation, health care, and child care.
Recreation opportunities available on the NDSU campus
Recreation opportunities available in the Fargo-Moorhead community
Access to health care on
the NDSU campus
Access to health care in
the Fargo-Moorhead community
Value for the money of the NDUS health
insurance plan available to
students
Access to child care
resources at NDSU
Access to child care resources in the Fargo-
Moorhead community
N 464 472 449 461 348 157 155Missing 226 218 241 229 342 533 535
Mean 4.63 4.57 4.57 4.70 3.02 4.01 4.20
Table 34. Recreation opportunities available on the NDSU campus. Frequency Valid Percent Cumulative Percent
Very Dissatisfied 10 2.2 2.2Dissatisfied 11 2.4 4.5Somewhat Dissatisfied 25 5.4 9.9Somewhat Satisfied 116 25.0 34.9Satisfied 234 50.4 85.3Very Satisfied 68 14.7 100.0Total 464 100.0
MissingDoes not apply 132System 94Total 226
Total 690
33

Table 35. Recreation opportunities available in the Fargo-Moorhead community. Frequency Valid Percent Cumulative Percent
Very Dissatisfied 6 1.3 1.3Dissatisfied 16 3.4 4.7Somewhat Dissatisfied 40 8.5 13.1Somewhat Satisfied 122 25.8 39.0Satisfied 218 46.2 85.2Very Satisfied 70 14.8 100.0Total 472 100.0
MissingDoes not apply 122System 96Total 218
Total 690
Table 36. Access to health care on the NDSU campus. Frequency Valid Percent Cumulative Percent
Very Dissatisfied 15 3.3 3.3Dissatisfied 17 3.8 7.1Somewhat Dissatisfied 28 6.2 13.4Somewhat Satisfied 111 24.7 38.1Satisfied 193 43.0 81.1Very Satisfied 85 18.9 100.0Total 449 100.0
MissingDoes not apply 147System 94Total 241
Total 690
34
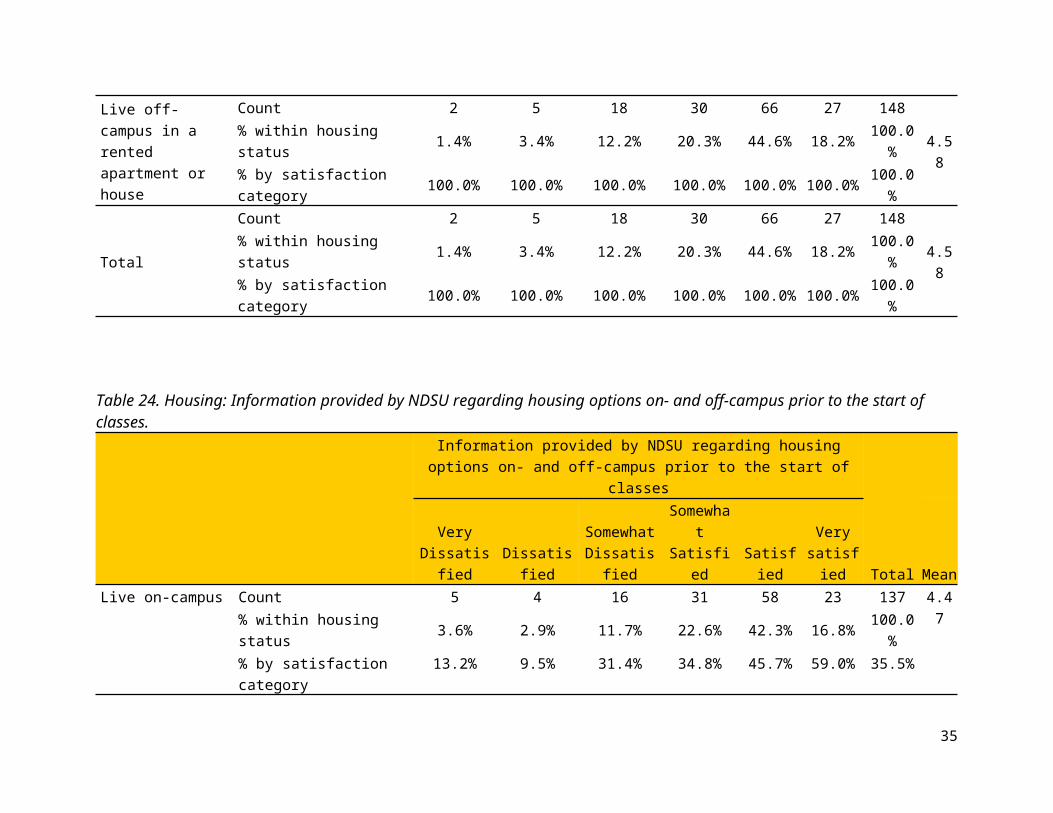
Table 37. Access to health care in the Fargo-Moorhead community. Frequency Valid Percent Cumulative Percent
Very Dissatisfied 12 2.6 2.6Dissatisfied 11 2.4 5.0Somewhat Dissatisfied 27 5.9 10.8Somewhat Satisfied 92 20.0 30.8Satisfied 229 49.7 80.5Very Satisfied 90 19.5 100.0Total 461 100.0
MissingDoes not apply 127System 102Total 229
Total 690
Table 38. Value for the money of the NDUS health insurance plan available to students. Frequency Valid Percent Cumulative Percent
Very Dissatisfied 104 29.9 29.9Dissatisfied 40 11.5 41.4Somewhat Dissatisfied 55 15.8 57.2Somewhat Satisfied 61 17.5 74.7Satisfied 70 20.1 94.8Very Satisfied 18 5.2 100.0Total 348 100.0
MissingDoes not apply 244System 98Total 342
Total 690
35

Table 39. Access to child care resources at NDSU. Frequency Valid Percent Cumulative Percent
Very Dissatisfied 19 12.1 12.1Dissatisfied 10 6.4 18.5Somewhat Dissatisfied 11 7.0 25.5Somewhat Satisfied 44 28.0 53.5Satisfied 57 36.3 89.8Very Satisfied 16 10.2 100.0Total 157 100.0
MissingDoes not apply 432System 101Total 533
Total 690
36

Table 40. Access to child care resources in the Fargo-Moorhead community. Frequency Valid Percent Cumulative Percent
Very Dissatisfied 12 7.7 7.7Dissatisfied 10 6.5 14.2Somewhat Dissatisfied 11 7.1 21.3Somewhat Satisfied 37 23.9 45.2Satisfied 72 46.5 91.6Very Satisfied 13 8.4 100.0Total 155 100.0
MissingDoes not apply 431System 104Total 535
Total 690
37

EmploymentTable 41. Employment categories (check all that apply). Employment status n Valid percentNot currently employed and not seeking employment 22 3.7%Not currently employed and seeking employment 36 6.0%Employed in a graduate assistantship, research assistantship, or teaching assistantship 372 62.0%Employed on-campus in student position 33 5.5%Employed at NDSU in regular staff or faculty position 52 8.7%Employed off-campus 152 25.3%*Total adds to more than 100% since students were able to select more than one employment category.
Satisfaction with graduate assistantship, research assistantship, or teaching assistantship
Table 42. Satisfaction with graduate assistantship, research assistantship, or teaching assistantship.
Fairness of the wage or salary
for the work being performed
Ability to pay for the things I need
to be a successful
student
Number of hours of work required
each week to reach an
acceptable level of performance
Match between stated position description and
the work actually performed
Relationship with my work
supervisorRelevance to my graduate studies
N 367 363 364 361 362 363Missing 323 327 326 329 328 327
Mean 4.04 3.88 4.37 4.64 5.12 5.00
38

Table 43. Fairness of the wage or salary for the work being performed: Graduate assistantship, research assistantship, or teaching assistantship.
Frequency Valid Percent Cumulative PercentVery Dissatisfied 32 8.7 8.7Dissatisfied 21 5.7 14.4Somewhat Dissatisfied 54 14.7 29.2Somewhat Satisfied 95 25.9 55.0Satisfied 124 33.8 88.8Very Satisfied 41 11.2 100.0Total 367 100.0
MissingDoes Not Apply 1System 322Total 323
Total 690
39

Table 44. Ability to pay for the things I need to be a successful student: Graduate assistantship, research assistantship, or teaching assistantship.
Frequency Valid Percent Cumulative PercentVery Dissatisfied 30 8.3 8.3Dissatisfied 31 8.5 16.8Somewhat Dissatisfied 56 15.4 32.2Somewhat Satisfied 108 29.8 62.0Satisfied 113 31.1 93.1Very Satisfied 25 6.9 100.0Total 363 100.0
MissingDoes Not Apply 3System 324Total 327
Total 690
40

Table 45. Number of hours of work required each week to reach an acceptable level of performance: Graduate assistantship, research assistantship, or teaching assistantship.
Frequency Valid Percent Cumulative PercentVery Dissatisfied 15 4.1 4.1Dissatisfied 17 4.7 8.8Somewhat Dissatisfied 32 8.8 17.6Somewhat Satisfied 95 26.1 43.7Satisfied 165 45.3 89.0Very Satisfied 40 11.0 100.0Total 364 100.0
MissingDoes Not Apply 4System 322Total 326
Total 690
41

Table 46. Match between stated position description and the work actually performed: Graduate assistantship, research assistantship, or teaching assistantship.
Frequency Valid Percent Cumulative PercentVery Dissatisfied 12 3.3 3.3Dissatisfied 9 2.5 5.8Somewhat Dissatisfied 19 5.3 11.1Somewhat Satisfied 82 22.7 33.8Satisfied 175 48.5 82.3Very Satisfied 64 17.7 100.0Total 361 100.0
MissingDoes Not Apply 5System 324Total 329
Total 690
42

Table 47. Relationship with my work supervisor: Graduate assistantship, research assistantship, or teaching assistantship.
Frequency Valid Percent Cumulative PercentVery Dissatisfied 4 1.1 1.1Dissatisfied 7 1.9 3.0Somewhat Dissatisfied 16 4.4 7.5Somewhat Satisfied 41 11.3 18.8Satisfied 141 39.0 57.7Very Satisfied 153 42.3 100.0Total 362 100.0
MissingDoes Not Apply 6System 322Total 328
Total 690
Table 48. Relevance to my graduate studies: Graduate assistantship, research assistantship, or teaching assistantship. Frequency Valid Percent Cumulative Percent
Very Dissatisfied 6 1.7 1.7Dissatisfied 6 1.7 3.3Somewhat Dissatisfied 13 3.6 6.9Somewhat Satisfied 56 15.4 22.3Satisfied 157 43.3 65.6Very Satisfied 125 34.4 100.0Total 363 100.0
MissingDoes Not Apply 5System 322Total 327
Total 690
43

Satisfaction with on-campus student employment.
Table 49. Satisfaction with on-campus student employment.
Fairness of the wage or salary
for the work being performed
Ability to pay for the things I need
to be a successful
student
Number of hours of work required
each week to reach an
acceptable level of performance
Match between stated position description and
the work actually performed
Relationship with my work
supervisorRelevance to my graduate studies
N 32 31 31 31 31 25
Missing 658 659 659 659 659 665Mean 4.63 4.29 4.81 5.10 5.19 4.60
Table 50. Fairness of the wage or salary for the work being performed: On-campus student employment.
Frequency Valid PercentCumulative
PercentVery Dissatisfied 1 3.1 3.1Dissatisfied 2 6.3 9.4Somewhat Dissatisfied 1 3.1 12.5Somewhat Satisfied 7 21.9 34.4Satisfied 14 43.8 78.1Very Satisfied 7 21.9 100.0Total 32 100.0
Missing System 658Total 690
44

Table 51. Ability to pay for the things I need to be a successful student: On-campus student employment. Frequency Valid Percent Cumulative Percent
Very Dissatisfied 1 3.2 3.2Dissatisfied 1 3.2 6.5Somewhat Dissatisfied 7 22.6 29.0Somewhat Satisfied 6 19.4 48.4Satisfied 11 35.5 83.9Very Satisfied 5 16.1 100.0Total 31 100.0
Missing System 659Total 690
Table 52. Number of hours of work required each week to reach an acceptable level of performance: On-campus student employment.
Frequency Valid Percent Cumulative PercentVery Dissatisfied 1 3.2 3.2Somewhat Dissatisfied 2 6.5 9.7Somewhat Satisfied 6 19.4 29.0Satisfied 14 45.2 74.2Very Satisfied 8 25.8 100.0Total 31 100.0
Missing System 659Total 690
45

Table 53. Match between stated position description and the work actually performed: On-campus student employment. Frequency Valid Percent Cumulative Percent
Very Dissatisfied 1 3.2 3.2Somewhat Dissatisfied 3 9.7 12.9Somewhat Satisfied 2 6.5 19.4Satisfied 10 32.3 51.6Very Satisfied 15 48.4 100.0Total 31 100.0
Missing System 659Total 690
Table 54. Relationship with my work supervisor: On-campus student employment. Frequency Valid Percent Cumulative Percent
Very Dissatisfied 1 3.2 3.2Somewhat Dissatisfied 3 9.7 12.9Somewhat Satisfied 2 6.5 19.4Satisfied 7 22.6 41.9Very Satisfied 18 58.1 100.0Total 31 100.0
MissingDoes Not Apply 1System 658Total 659
Total 690
46

Table 55. Relevance to my graduate studies: On-campus student employment. Frequency Valid Percent Cumulative Percent
Very Dissatisfied 3 12.0 12.0Somewhat Dissatisfied 2 8.0 20.0Somewhat Satisfied 4 16.0 36.0Satisfied 6 24.0 60.0Very Satisfied 10 40.0 100.0Total 25 100.0
MissingDoes Not Apply 7System 658Total 665
Total 690
47

Finances and Getting HelpTable 56. Finances and getting help.
I feel stressed about my personal finances in general.
I worry about being able to pay my current monthly
expenses.
Services for students with disabilities are
readily available
I know who to contact at NDSU if I need academic help
I know who to contact at NDSU if I
need help with a personal issue
N 576 572 202 557 538Missing 114 118 488 133 152
Mean 4.37 3.79 4.58 4.38 4.07
Table 57. I feel stressed about my personal finances in general. Frequency Valid Percent Cumulative Percent
Strongly Disagree 22 3.8 3.8Disagree 70 12.2 16.0Disagree Slightly 40 6.9 22.9Agree Slightly 129 22.4 45.3Agree 170 29.5 74.8Strongly Agree 145 25.2 100.0Total 576 100.0
MissingDoes Not Apply 20System 94Total 114
Total 690
48

Table 58. I worry about being able to pay my current monthly expenses. Frequency Valid Percent Cumulative Percent
Strongly Disagree 39 6.8 6.8Disagree 120 21.0 27.8Disagree Slightly 71 12.4 40.2Agree Slightly 127 22.2 62.4Agree 124 21.7 84.1Strongly Agree 91 15.9 100.0Total 572 100.0
MissingDoes Not Apply 23System 95Total 118
Total 690
Table 59. Services for students with disabilities are readily available. Frequency Valid Percent Cumulative Percent
Strongly Disagree 7 3.5 3.5Disagree 13 6.4 9.9Disagree Slightly 13 6.4 16.3Agree Slightly 29 14.4 30.7Agree 102 50.5 81.2Strongly Agree 38 18.8 100.0Total 202 100.0
MissingDoes Not Apply 388System 100Total 488
Total 690
49

Table 60. I know who to contact at NDSU if I need academic help. Frequency Valid Percent Cumulative Percent
Strongly Disagree 24 4.3 4.3Disagree 46 8.3 12.6Disagree Slightly 50 9.0 21.5Agree Slightly 93 16.7 38.2Agree 260 46.7 84.9Strongly Agree 84 15.1 100.0Total 557 100.0
MissingDoes Not Apply 35System 98Total 133
Total 690
50

Table 61. I know who to contact at NDSU if I need help with a personal issue. Frequency Valid Percent Cumulative Percent
Strongly Disagree 35 6.5 6.5Disagree 68 12.6 19.1Disagree Slightly 68 12.6 31.8Agree Slightly 85 15.8 47.6Agree 220 40.9 88.5Strongly Agree 62 11.5 100.0Total 538 100.0
MissingDoes Not Apply 58System 94Total 152
Total 690
51

DemographicsDegrees Pursued
Table 62. Degrees enrolled. (Check all that apply.)Degree n Valid percentNon-degree or not pursuing graduate degree 10 1.7%Certificate program 11 1.8%Master’s degree program (including professional master’s degrees) 318 53.3%Doctoral degree program (including professional doctoral degrees) 277 46.4%*Total adds to more than 100% since students were able to select more than one degree choice.
Table 63. Please identify the college in which you are enrolled for your primary graduate degree program.
FrequencyValid
PercentCumulative
PercentAgriculture, Food Systems, and Natural Resources 113 19.4 19.4Arts, Humanities, and Social Sciences 79 13.6 32.9Business 13 2.2 35.2Engineering 110 18.9 54.0Human Development and Education 77 13.2 67.2Health Professions 41 7.0 74.3Science and Mathematics 120 20.6 94.9Graduate & Interdisciplinary Studies 30 5.1 100.0Total 583 100.0
Missing System 107Total 690
52

International Status
Table 64. How would you describe your international student status?
Frequency Valid PercentCumulative
PercentInternational student 234 39.3 39.3Domestic student 362 60.7 100.0Total 596 100.0
Missing System 94Total 690
Table 65. How helpful was international student orientation in preparing you for your graduate work at NDSU? (Asked to international students only.)
FrequencyValid
PercentCumulative
PercentVery helpful 71 34.8 34.8Somewhat helpful 112 54.9 89.7Somewhat unhelpful 11 5.4 95.1Not at all helpful 10 4.9 100.0Total 204 100.0
MissingI did not attend international student orientation at NDSU 30System 456Total 486
Total 690
53
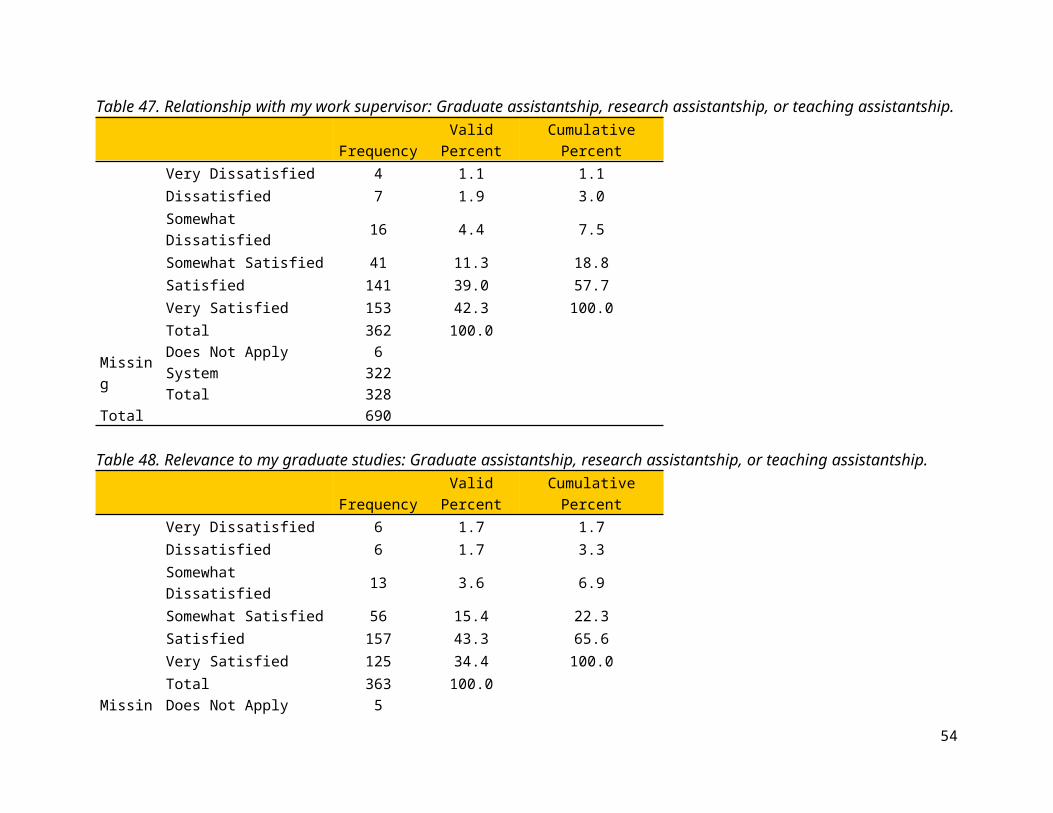
Table 66. How satisfied were you with the support NDSU provided to you in navigating the U.S. job market for your employment while a student? (Asked to international students only.)
FrequencyValid
PercentCumulative
PercentVery Dissatisfied 14 7.8 7.8Dissatisfied 17 9.5 17.3Somewhat Dissatisfied 35 19.6 36.9Somewhat Satisfied 70 39.1 76.0Satisfied 40 22.3 98.3Very Satisfied 3 1.7 100.0Total 179 100.0
MissingI already had a job lined up / I was not seeking employment while I am a student 50System 461Total 511
Total 690
54

Enrollment Status, Ethnicity, Gender, and Sexual Orientation
Table 67. Enrollment status: Full-time or part-time.
Frequency Valid PercentCumulative
PercentEnrolled full-time 443 75.3 75.3Enrolled part-time 145 24.7 100.0Total 588 100.0
Missing System 102Total 690
Table 68. How would you describe your ethnicity?
Frequency Valid PercentCumulative
PercentHispanic or Latino 27 4.7 4.7Not Hispanic or Latino 546 95.3 100.0Total 573 100.0
Missing System 117Total 690
Table 69. What is your race? (Check all that apply.)Race n Valid percentWhite 365 64.8%Black or African American 23 4.1%Asian 179 31.8%American Indian or Alaska Native 13 2.3%Native Hawaiian or Other Pacific Islander 3 5.3%*Total adds to more than 100% since students were able to select more than one race.
55

Table 70. What is your sex or current gender? (Select all that apply.)Gender n Valid percentMale 263 45.2%Female 314 54.0%TransMale / Transman 0 0%TransFemale / Transwoman 1 0.1%Genderqueer 2 0.3%Additional category (please state) 5 0.9%*Total adds to more than 100% since students were able to select more than one option.
Table 71. Sexual orientationFrequency Valid Percent Cumulative Percent
Heterosexual or straight 523 95.3 95.3Gay or lesbian 9 1.6 96.9Bisexual 17 3.1 100.0Total 549 100.0
Missing System 141Total 690
56

Future Employment Plans
Table 72. What type of job will you pursue upon graduation? (If you are planning on continuing in your current job, select the descriptor that best matches your current position.)
FrequencyValid
PercentCumulative
PercentWill not pursue employment upon graduation 12 2.1 2.1Business / Industry 197 34.0 36.0Non-profit 29 5.0 41.0Peace Corps or volunteer work 4 .7 41.7University / College (teaching / research tenure-track) 163 28.1 69.8University / College (teaching, non-tenure track) 32 5.5 75.3University / College (research, non-tenure track) 26 4.5 79.8University / College (other) 45 7.8 87.6Not planning on graduating 6 1.0 88.6Other: 66 11.4 100.0Total 580 100.0
Missing System 110Total 690
57