· Web viewACKNOWLEDGEMENTS The KEMA team would like to thank Bernard Chabot and Paul Gipe for...
125
CONSULTANT REPORT FEED-IN TARIFF DESIGNS FOR CALIFORNIA: IMPLICATIONS FOR PROJECT FINANCE, COMPETITIVE RENEWABLE ENERGY ZONES, AND DATA REQUIREMENTS AUGUST 2010 CEC-300-2010-006 Prepared for: California Energy Commission Prepared by: KEMA, Incorporated
Transcript of · Web viewACKNOWLEDGEMENTS The KEMA team would like to thank Bernard Chabot and Paul Gipe for...

CONSULTANT REPORT
FEED-IN TARIFF DESIGNS FOR CALIFORNIA: IMPLICATIONS FOR PROJECT FINANCE, COMPETITIVE RENEWABLE ENERGY ZONES, AND DATA REQUIREMENTS
AUGUST 2010CEC-300-2010-006
Prepared for: California Energy CommissionPrepared by: KEMA, Incorporated

Prepared by:
KEMA, IncorporatedPrimary Authors
Karin Corfee, KEMA Inc., Project ManagerMatt Karcher, KEMA Inc.Hans Cleijne, KEMA Inc.Jitske Burgers, KEMA Inc.Caroline Faasen, KEMA Inc.Nellie Tong, KEMA Inc.Wilson Rickerson, Meister Consultants Group, Inc.Robert Grace, Sustainable Energy Advantage, LLCJason Gifford, Sustainable Energy Advantage, LLC
KEMA Inc.155 Grand Avenue, Suite 500Oakland, California 94612
Contract No: 400-07-030
Prepared for:
California Energy Commission
Rachel Salazar Contract Manager
Pamela Doughman Project Manager
Tony Goncalves Office ManagerRenewable Energy Office
Valerie HallDeputy DirectorEfficiency and Renewable Energy Division
Melissa JonesExecutive Director
DISCLAIMER
This report was prepared as the result of work sponsored by the California Energy Commission. It does not necessarily represent the views of the Energy Commission, its employees or the State of California. The Energy Commission, the State of California, its employees, contractors and subcontractors make no warrant, express or implied, and assume no legal liability for the information in this report; nor does any party represent that the uses of this information will not infringe upon privately owned rights. This report has not been approved or disapproved by the California Energy Commission nor has the California Energy Commission passed upon the accuracy or adequacy of the information in this report.

ACKNOWLEDGEMENTS
The KEMA team would like to thank Bernard Chabot and Paul Gipe for their insights into feed-in tariff rate setting methods in the United States and Europe, and to Ed Reagan and Jon Crider from the Gainesville Regional Utility for providing in-depth information about Gainesville’s feed-in tariff rate setting process. The KEMA team would also like to thank Jon Crowe, R. Wilson Hambrick, Jeff Snell, and Andy Belden for their contributions.
i

PREFACE
This report brings together three work products that were used in support of the 2009 Integrated Energy Policy Report topic “Exploring Feed-in Tariffs for Renewable Energy Projects Over 20 MW.” The report analyzes the following three topics: implications of project finance on feed-in tariffs, feed-in tariffs application to competitive renewable energy zones and data requirements to determine a cost-based feed-in tariff.
The information and data contained in this report was current as of October 2009.
ii

ABSTRACT
A feed-in tariff is typically a tariff that guarantees: (1) to pay a renewable project for the electricity produced, (2) access to the grid, and (3) stable long-term contracts (15-20 years). Feed-in tariffs are globally the most prevalent policy mechanism to promote renewable energy and have driven rapid renewable energy market growth. California has been actively investigating feed-in tariffs during the past several years as a policy mechanism that could help the state achieve its goal of 33 percent renewable electricity by 2020. This report focuses on utility-scale, building-scale, and community-scale renewable energy projects and addresses the following topics: feed-in tariff design implications for financing renewable energy projects, conceptual design issues for feed-in tariffs in competitive renewable energy zones, and data requirements for cost-based feed-in tariff price setting. The report provides a recent history of renewable energy financing, examining the various risk factors that lead to higher cost of capital. The report recommends feed-in tariff design characteristics that address the identified risk factors and therefore may lead to the lowest-cost of capital for renewable energy projects. Building on the research that has been done under the California Renewable Energy Transmission Initiative, the report also examines ways feed-in tariffs could be used to stimulate timely use of transmission developed in regions that have high densities of renewable resources called competitive renewable energy zones (CREZ). Competitive renewable energy zone-based feed-in tariffs can be tailored to facilitate development of specific quantities of renewable technologies, (biomass, geothermal, solar, and wind), to achieve diversity of resource supply, and/or minimize ratepayer cost. The Energy Commission has recommended a feed-in tariff based on the generation costs of specific technologies, an approach based on successful European policy models. Tariff-setting methodologies are examined for the Netherlands, Germany, France, and Gainesville, Florida. This report compares the data inputs used in European cost-setting models with the data that is available in the Energy Commission’s Renewable Energy Cost of Generation Update Study.
Keywords: Feed-in tariff, tariff design, energy policy, Renewables Portfolio Standard (RPS), renewable resources, renewable energy policy, project finance, competitive renewable energy zone (CREZ), data requirements, tariff degression, cost of generation, fixed-price payments, tariff price setting and adjustment, greenhouse gas emissions
Please cite this report as follows:
Corfee, Karin, W. Rickerson, M. Karcher, B. Grace, J. Burgers, C. Faasen, H. Cleijne, J. Gifford, and N. Tong. KEMA. Feed-In Tariff Designs for California: Implications for Project Finance, Competitive Renewable Energy Zones, and Data Requirements. California Energy Commission. Publication Number: CEC-300-2010-006. Sacramento, Calif.
iii
TABLE OF CONTENTS
ACKNOWLEDGEMENTS iPREFACE iiABSTRACT iii
TABLE OF CONTENTS vEXECUTIVE SUMMARY 1
Feed-In Tariff Design Implications for Financing Renewable Energy Projects...1Conceptual Design Issues for CREZ-Based Feed-In Tariffs.................................2Data Requirements for Cost-Based Feed-In Tariff Price Setting.........................4
CHAPTER 1: Introduction 5CHAPTER 2: Feed-In Tariff Design Implications for Financing Renewable
Energy Projects 8A Recent History of Renewable Energy Financing.................................................9Renewable Energy Financing and Feed-In Tariffs................................................12
Renewable Energy Financing Risks..................................................................14Development (Timing) Risk...............................................................................16Development (Contracting) Risk.......................................................................16Contract Price....................................................................................................16Revenue Risk.....................................................................................................17Operating Risk...................................................................................................17Regulatory Risk.................................................................................................18Transmission and Interconnection Risk............................................................18Credit Risk.........................................................................................................18Legal Risk..........................................................................................................19Construction Risk..............................................................................................19Resource Risk....................................................................................................19Technology Risk.................................................................................................20
High-Level Policy Characteristics.........................................................................20Regulatory Stability...........................................................................................21Long-Term Political and Societal Support.........................................................22Simplicity...........................................................................................................22Transparency.....................................................................................................23Price and Contract Certainty.............................................................................23Curtailment........................................................................................................23
Feed-In Tariff Design Options and Risk................................................................24
iv

Setting the Price................................................................................................25Tariff Structure..................................................................................................26What Is Being Sold?...........................................................................................26Program Quantity and Cost Limits....................................................................26Queuing Procedures..........................................................................................27Counterparty Considerations............................................................................28Contract Duration..............................................................................................28(Preoperational) Development Credit and Performance...................................29Operational Collateral or Security....................................................................30Contract Breakage Penalty................................................................................30Price Adjustment Approach, Timing, and Magnitude........................................31
CHAPTER 3: Conceptual Design Issues for CREZ-Based Feed-In Tariffs33
Conceptual Design Issues for CREZ-Based Feed-In Tariff...................................34Timing: Coordination Between Feed-In Tariffs and Transmission Expansion...36Quantity Issues Associated With CREZs...........................................................37Pricing/Rates.....................................................................................................39Allocation of Available Transmission Capacity Among Technologies................40Interaction of CREZ-Based Feed-In Tariff and RPS Solicitations......................40
Illustration of CREZ-Based Feed-In Tariff Pricing and Quantity Issues...............41CHAPTER 4: Data Requirements for Cost-Based Feed-In Tariff Price
Setting 47The Netherlands: Feed-In Tariff Rate Setting......................................................48
Feed-In Tariff Overview.....................................................................................48Technology Differentiation................................................................................49Key Inputs and Assumptions.............................................................................49Financial Gap.....................................................................................................49Data Collection and Stakeholder Consultation Process....................................51Advantages and Disadvantages of the Dutch Feed-In Tariff System.................52
Germany: Feed-In Tariff Rate Setting..................................................................52Feed-In Tariff Overview.....................................................................................52Tariff Degression...............................................................................................53Technology Differentiation................................................................................53Key Inputs and Assumptions.............................................................................54Financial Gap.....................................................................................................55Data Collection and Stakeholder Consultation Process....................................55Advantages and Disadvantages of the German Feed-In Tariff System.............56
v

France: Feed-In Tariff Rate Setting......................................................................57Feed-In Tariff Overview.....................................................................................57Technology Differentiation................................................................................57Key Inputs and Key Assumptions......................................................................58Financial Gap.....................................................................................................58Data Collection and Stakeholder Consultation Process....................................58Advantages and Disadvantages of the French Feed-In Tariff System...............59
Gainesville, Florida: Feed-In Tariff Rate Setting..................................................59Feed-In Tariff Overview.....................................................................................59Technology Differentiation................................................................................60Key Inputs and Key Assumptions......................................................................60Financial Gap.....................................................................................................60Data Collection and Stakeholder Consultation Process....................................60Advantages and Disadvantages of the Gainesville Feed-In Tariff System.........61
California Renewable Energy Cost of Generation Update Study.........................62Technology Differentiation................................................................................62Key Inputs and Key Assumptions......................................................................63
Next Step Considerations For Feed-In Tariff Program.........................................67Policy Design Details Influencing Feed-In Tariff Rate Levels...........................67Transmission, Distribution, and Interconnection Cost Allocations...................67Differentiation of Cost by Ownership Type.......................................................70Setting Tariff Level Within Range of Costs.......................................................71Tariff Differentiation by Resource Characteristics............................................72Adopting a Feed-In Tariff Price Setting Method and Process...........................72Spreadsheet Models..........................................................................................72Stakeholder Engagement..................................................................................73Confidentiality of Stakeholder Data..................................................................73
GLOSSARY 75APPENDIX A: The Netherlands 77
APPENDIX B: Germany79APPENDIX C: France 83
APPENDIX D: Gainesville, Florida 85APPENDIX E: California 87
vi
EXECUTIVE SUMMARY
Assembly Bill 32 (Núñez Chapter 488, Statutes of 2006) sets an ambitious goal for California to reduce greenhouse gas emissions to 1990 levels by 2020. The statewide Renewables Portfolio Standard represents a critical component to the state’s strategy to reduce greenhouse gas emissions. The California Air Resources Board’s Assembly Bill 32 Scoping Plan anticipates that increasing renewable energy from existing renewables in 2007 to 33 percent by 2020 has the potential to reduce greenhouse gas emissions in 2020 by an estimated 21.3 million metric tons of carbon dioxide (CO2)-equivalent.1 This is roughly equivalent to the savings that could result from energy efficiency, combined heat and power, and rooftop solar photovoltaics combined.
The 2007 Integrated Energy Policy Report noted that California was not on track to meet its goal of 33 percent renewable electricity by 2020 and that feed-in tariffs could help accelerate market growth, lower Renewables Portfolio Standard compliance costs, and protect against collusion by energy generators to inflate renewable energy prices. The 2008 Integrated Energy Policy Report Update recommended immediate implementation of technology-specific, cost-based feed-in tariffs for Renewables Portfolio Standard-eligible projects up to 20 megawatts (MW) in size and continued exploration of feed-in tariffs for projects larger than 20 MW.
Prepared for the California Energy Commission in support of the 2009 Integrated Energy Policy Report, this report explores three aspects of feed-in tariffs for renewable energy projects as follows:
Feed-in tariff design implications for financing renewable energy projects. Conceptual design issues for feed-in tariffs in competitive renewable energy
zones. Data requirements for cost-based feed-in tariff price setting.
Feed-In Tariff Design Implications for Financing Renewable Energy Projects The policy design characteristics that are important to capital providers are simplicity and stability.2 In general, the lower the risk profile of a project the lower the required rate of return, so reducing risk is important. Also of value to the financing market is a simple and transparent incentive structure. This allows investors to clearly identify and evaluate risk relative to the expected rate of return. A known risk can be reduced or priced for, but unknown risks, increased by a lack of long-term policy or structure clarity, can be a barrier to financing. As a 1 California Air Resources Board. October 2008. Climate Change Proposed Scoping Plan Appendices, Volume I: Supporting Documents and Measure Detail. http://www.arb.ca.gov/cc/scopingplan/document/scopingplandocument.htm2 Guillet, J. and M. Midden. February 2009. Financing Renewable Energy: Feed-in Tariffs Compared to Other Regulatory Regimes. Proceedings of the Florida Alliance for Renewable Energy Effective Renewable Energy Policies Conference, Gainesville, Florida.
1

general rule, lower risk translates into a lower required return for investors and a lower cost of energy from a project. Lower risk also increases the likelihood that the project will be able to obtain financing during periods of tight credit.
The report identifies feed-in tariff design characteristics that may lead to the lowest-cost of capital for renewable energy projects. It is important to note that these recommendations are made purely from a financing perspective. There may be inherent tensions between feed-in tariffs designed to optimize lowest-cost financing and feed-in tariffs designed to match the policy objectives of the state and of other stakeholders. The recommended design characteristics are as follows:
Long-term contracts (20 years) accounting for fuel price risk where applicable.
Cost-based fixed price tariff (including adequate return on capital),3 differentiated by technology, for the sale of bundled energy and renewable energy credits,4 offered by a credit-worthy counterparty (most likely the interconnecting utility).
Must-take provisions5 without pre-operational, operating performance requirements, or credit requirements (other than as needed to address queuing issues related to quantity caps and rate changes).
Ideally, no limits or caps on total capacity, generation, or cost to reduce uncertainty and risk.
Periodic market-based adjustments to tariff levels to place pressure on manufacturers to lower costs of generation over time, while maintaining a sufficient rate of return for each technology category.
Conceptual Design Issues for CREZ-Based Feed-In TariffsInsufficient transmission is listed in the 2007 Integrated Energy Policy Report as one of the principal reasons for the Renewables Portfolio Standard’s failure to keep pace with a trajectory to achieve the 20 percent and 33 percent targets by 2010 and 2020, respectively.6 California has been actively pursuing solutions to insufficient transmission infrastructure for renewable energy. Central among these activities, the Energy Commission, California Public Utilities Commission, California Independent System Operator, and publicly owned utilities created a new statewide interagency initiative, the California Renewable Energy
3 A cost-based approach to feed-in tariffs has recently been highlighted by the National Renewable Energy Laboratory as a best practice. For further information, see Couture, T. and K. Cory. 2009. State Clean Energy Policies Analysis (SCEPA) Project: An Analysis of Renewable Energy Feed-in Tariffs in The United States. National Renewable Energy Laboratory. NREL/TP-6A2-45551. Golden, Colo.4 Energy and renewable energy credits sold together on a cent per kWh basis.5 The requirement that a utility must purchase the power if it is offered by a generator.6 California Energy Commission. 2008. 2007 Integrated Energy Policy Report. CEC-100-2007-008-CMF. Sacramento, Calif. p. 5.
2

Transmission Initiative (RETI).7 The RETI seeks to assess competitive renewable energy zones8 in California and neighboring states, identify the zones that can be developed most cost effectively and with the least environmental impact, identify top priority competitive renewable energy zones and conceptual transmission plans for those zones, and initiate permitting processes for projects identified in RETI transmission plans.9
Although feed-in tariffs are not a solution to transmission constraints, feed-in tariffs can be designed to work in parallel with transmission planning and competitive renewable energy zones development. Renewables Portfolio Standard solicitations do not currently target specific competitive renewable energy zones, nor do they take proposed competitive renewable energy zones transmission limits into account. In contrast, a feed-in tariff can be implemented in such a manner as to coordinate timing with competitive renewable energy zone related transmission facilities. An appealing approach would be to offer a competitive renewable energy zone-based feed-in tariff once such transmission is permitted and construction funding is committed, with the explicit objective of stimulating usage of the transmission facilities with feed-in tariff rates available once the transmission is commissioned.
Feed-in tariffs targeting renewable energy located in a priority competitive renewable energy zone with proximity to a permitted transmission line would be offered only in a limited footprint (the competitive renewable energy zone) and would be subject to a maximum quantity of generation sought (that is the physical capacity limits of the transmission line). A competitive renewable energy zone-based feed-in tariff design needs to be measured against the need to use new transmission capacity efficiently, quickly, and at least societal cost. Other factors to be considered include feed-in tariff timing, quantity, pricing (rates), and allocation of available transmission capacity among technologies and projects.
Under a feed-in tariff, developers are guaranteed a certain price under prenegotiated contract terms and thus have a shortened development cycle. Because feed-in tariffs provide more flexible timing for developers than the periodic Request For Offers solicitation cycle, if designed to attract low-cost financing, competitive renewable energy zone-based feed-in tariffs can be expected to unleash a faster pace of development than the rate of renewable energy
7 The California Renewable Energy Transmission Initiative (RETI) brings together all of the renewable transmission and generation stakeholders in the state of California to participate in a consensus-based process to identify, plan, and establish a rigorous analytical basis for regulatory approvals of the next major transmission projects needed to access renewable resources in California and adjacent areas. Among other things, the RETI process will help tie together the renewable procurement process with the development of generation and transmission so that one does not lag behind the others.8 Competitive Renewable Energy Zones (CREZs) are locations having densities of developable resources that best justify building transmission infrastructure. “Developable resources” are those resources without significant unmitigable barriers to development, such as locations within national parks, engineering feasibility, etc., that would preclude these resources from consideration. 9 California Renewable Energy Transmission Initiative Mission Statement. September 17, 2007. <http://www.energy.ca.gov/reti/Mission_Statement.pdf >.
3

facilities coming on-line under the current Renewables Portfolio Standard Request For Offers process.
Competitive renewable energy zone-based feed-in tariffs can be designed to seek specific quantities of supply, achieve technology diversity, and/or minimize ratepayer cost. However, effective implementation of such feed-in tariffs is highly dependent on the accuracy of the supply curve data. If policy makers do not know the price needed to achieve a certain level of supply, the feed-in tariff may stimulate greater (or smaller) supply of renewable energy than anticipated.
Data Requirements for Cost-Based Feed-In Tariff Price SettingThe report examines data prepared by KEMA for the Energy Commission’s cost of generation update compared to data collected for setting feed-in tariff price levels in Germany, The Netherlands, France, and Gainesville, Florida. For the most part, the report concludes that data contained in the cost of generation update is sufficient to use as a starting point to develop feed-in tariffs in California. However, policy decisions will be required to direct the use of this data to derive feed-in tariff rates. This involves making policy decisions regarding the appropriate investment returns and financing structure to use in establishing a feed-in tariff rate. Specifically, assumptions must be made for each of the following parameters:
Ownership structure or structures (if there is to be differentiation by type of owner), which will in turn determine the applicable government incentives.
The degree of leverage (debt versus equity). The threshold equity return and debt interest rate consistent with the risk
profile of the specific technologies and associated feed-in tariff.
4

CHAPTER 1:IntroductionFeed-in tariffs are the most prevalent national renewable energy policy globally10 and have driven rapid renewable energy market growth in countries.11 Although feed-in tariffs have not been widely adopted in North America to date,12 California has been actively investigating feed-in tariff designs during the past several years.
In 2006, Assembly Bill 1969 (Yee, Chapter 731, Statutes of 2006) established a limited feed-in tariff for generators with capacity of 1 megawatt (MW) and below located at public water and wastewater facilities, with a statewide cap of 250 MW. AB 1969 stated that if approved by the California Public Utilities Commission (CPUC), feed-in tariffs could be made available for eligible facilities 1.5 MW and below in size. In 2008, Senate Bill 380 (Kehoe, Chapter 544, Statutes of 2008) formally extended the feed-in tariff to facilities 1.5 MW and below for all Renewables Portfolio Standard (RPS) eligible technologies and expanded the program cap to 500 MW. Currently, the CPUC has implemented a feed-in tariff under which generators are eligible for 10-, 15-, or 20-year contracts with prices that reflect the time-of-delivery value of the market price referent. In 2009, Senate Bill 32 (McLeod, Chapter 328, Statutes of 2009) extended the feed-in tariff offering to projects no greater than 3 MW. It also increased the program cap to 750 MW and required publicly owned utilities to offer the feed-in tariff. CPUC Energy Division staff has recommended that the feed-in tariff be extended to generators 10 MW and below. CPUC staff also recommended that the program cap be expanded by an additional 1000 MW.13 This proceeding is ongoing.
In June 2009, the Sacramento Municipal Utility District (SMUD) established a customer-sited distributed generation feed-in tariff for projects that are no greater than 5 MW, connected to SMUD’s local distribution grid, and use either combined heat and power or eligible renewable technologies. The feed-in tariff program, effective January 2010, provides a fair market price for every kilowatt hour generated differentiated by technology and will be capped at 100 MW.14. 10 Martinot, E. 2008. Renewables 2007 Global Status Report. Paris, France and Washington, DC: Renewable Energy Policy Network for the 21st Century (REN21) and Worldwatch Institute.11 Held, A., M. Ragwitz, C. Huber, G. Resch, T. Faber, and K. Vertin 2007. Feed-In Systems in Germany, Spain and Slovenia: A Comparison. Karlsruhe, Germany: Fraunhofer Institut für Systemtechnik und Innovationsforschung.12 In 2009, feed-in tariffs were established in Gainesville, Florida (PV only), in the state of Vermont (H. 466), in the state of Oregon for solar (H. 3039) and San Antonio, Texas (PV only); in Canada, the Green Energy Law created a feed-in tariff very similar in structure to Germany’s as a replacement for its 2006 standard offer contract program.13 CPUC Energy Division Staff. March 27, 2009. Feed-in tariff for Renewable Generators Greater Than 1.5 MW. (Energy Division Staff Proposal). San Francisco. Available online from: http://docs.cpuc.ca.gov/efile/RULINGS/99105.pdf.14 SMUD News Release. “SMUD Establishes Feed-in Tariff for Customer-Sited Distributed Generation.” July 17, 2009. http://www.smud.org/en/news/documents/09archive/07-17-
5

In parallel to the CPUC proceedings, the California Energy Commission has also been exploring feed-in tariff design. The 2007 Integrated Energy Policy Report (2007 IEPR) recommended that the Energy Commission collaborate with the CPUC to develop feed-in tariffs for projects larger than 20 MW. The 2007 IEPR stated that the feed-in tariffs should “incorporate the value of a diverse mix of renewables as well as features of the most successful European feed-in tariffs.”15 The 2007 IEPR noted that California was not on track to meet its goal of 33 percent renewable electricity by 2020, and that feed-in tariffs could be used as a mechanisms to accelerate market growth. The 2007 IEPR also noted that transparent, fixed-price feed-in tariffs could be used to lower RPS compliance costs and protect against collusion by energy generators to inflate renewable energy prices.16
Following the 2007 IEPR, the Energy Commission authorized two studies on feed-in tariff design17 and conducted a series of workshops with the goal of recommending a feed-in tariff design for California.18 Although the initial intent of the Energy Commission’s feed-in tariff study was to explore feed-in tariffs for generators larger than 20 MW, the focus of the proceedings shifted to an exploration of a policy for generators 20 MW and under in response to stakeholder input. The California Feed-in Tariff Design and Policy Options, Consultant Final Report recommended the following feed-in tariff design characteristics: The feed-in tariff should be available to all renewable energy resource types, apply to new projects constructed after the creation of the tariff (but with a separate price for repowered facilities), and apply to facilities 20 MW or smaller, without an overall program cap. The report recommended that the tariff offer should be long-term (e.g. 15 to 20 years) and the price should be administratively determined and cost-based. It was also recommended that pricing should be differentiated by the project’s technology and size. The report indicated that federal legislative changes
09_smud_feed-in-tariff.pdf. Also, Mark Rawson in a presentation for the July 23 IEPR Committee Workshop on Combined Heat and Power. http://www.energy.ca.gov/2009_energypolicy/documents/2009-07-23_workshop/presentations/06_SMUD_Rawson_CEC_CHP_Workshopl.pdf, Slide 14. For updated information see SMUD’s web page, http://www.smud.org/en/community-environment/solar-renewables/Pages/feed-in-tariff.aspx.15 California Energy Commission. 2008. 2007 Integrated Energy Policy Report. CEC-100-2007-008-CMF. Sacramento, Calif. p. 6.16 California Energy Commission. 2008. 2007 Integrated Energy Policy Report. CEC-100-2007-008-CMF. Sacramento, Calif. p. 14717 Grace, Robert, W. Rickerson, K. Porter, J. DeCesaro, K. Corfee, M. Wingate and J. Lesser (KEMA). November 2008. Exploring Feed‐in Tariffs for California. California Energy Commission. CEC‐300‐2008‐003‐F. Sacramento, Calif.; Grace, R., W. Rickerson, K. Corfee, K. Porter, and H. Cleijne. KEMA. May 2009. California Feed-in Tariff Design and Policy Options. California Energy Commission. CEC-300-2008-009F. Sacramento, Calif.18 See: http://www.energy.ca.gov/portfolio/documents/index.html
6

may be needed to clarify the CPUC authority to implement cost-based feed-in tariffs instead of value-based feed-in tariffs.19, 20
The 2008 Integrated Energy Policy Report Update stated that it is “essential for the CPUC and the Energy Commission to continue to evaluate the value of feed-in tariffs for renewable projects larger than 20 MW, using the Energy Commission’s report on feed-in tariffs expected in early 2009.”21 The 2009 Integrated Energy Policy Report recommended focusing on feed-in tariffs for 20 MW and smaller as an interim step toward broader development of feed-in tariffs. Current programs to support renewable energy have resulted in relatively few community-scale projects (larger than 1 MW, but not greater than 20 MW), yet projects at this scale require less lengthy permitting and siting timeframes, can be located closer to load than utility-scale projects, and do not require new transmission lines.
This report explores three aspects of feed-in tariffs for renewable energy projects:
Feed-in tariff design implications for financing renewable energy projects. Conceptual design issues for Competitive Renewable Energy Zone (CREZ)-
based feed-in tariffs. Data requirements for cost-based feed-in tariff price setting.
The principles developed here can be applied to utility-scale, building-scale, and community-scale projects.
19 Proposed federal legislative changes are currently included in the Waxman-Markey Bill, H.R. 2454: American Clean Energy and Security Act of 2009, Section 102, http://www.govtrack.us/congress/billtext.xpd?bill=h111-2454.
Section 102 of HR 2524 specifically provides as follows:
SEC. 102. CLARIFYING STATE AUTHORITY TO ADOPT RENEWABLE ENERGY INCENTIVES.
Section 210 of the Public Utility and Regulatory Policy Act is amended by adding at the end thereof:
CLARIFICATION OF STATE AUTHORITY TO ADOPT RENEWABLE ENERGY INCENTIVES.-Notwithstanding any other provision of this Act or the Federal Power Act, a State legislature or regulatory authority may set the rates for a sale of electric energy by a facility generating electric energy from renewable energy sources pursuant to a State-approved production incentive program under which the facility voluntarily sells electric energy. For purposes of this subsection, 'State-approved production incentive program' means a requirement imposed pursuant to State law, or by a State regulatory authority acting within its authority under State law, that an electric utility purchase renewable energy (as defined in section 609 of this Act) at a specified rate. 20 Grace, R., W. Rickerson, K. Corfee, K. Porter, and H. Cleijne. KEMA. May 2009. California Feed-in Tariff Design and Policy Options. California Energy Commission. CEC-300-2008-009F. Sacramento, Calif. p. 79.21 California Energy Commission. 2008. 2008 Integrated Energy Policy Report Update. CEC-100-2008-008-CMF. Sacramento, Calif. Available online from: http://www.energy.ca.gov/2008publications/CEC-100-2008-008/CEC-100-2008-008-CMF.PDF. p. 24.
7

CHAPTER 2:Feed-In Tariff Design Implications for Financing Renewable Energy ProjectsThis chapter focuses on the issue of financing and investor security for renewable energy projects. Issues for further investigation are identified at the end of this chapter. The impact of renewable energy policy design on financing costs has been well documented in recent studies.22 The International Energy Agency, for example, conducted a survey of renewable energy policies and concluded that designs which minimize investor risk can reduce renewable electricity costs by 10-30 percent.23 In California, the Energy Commission identified market certainty and investor security as key policy objectives for implementing a feed-in tariff,24 and the CPUC has identified project financing as one of the key risk factors for renewable energy development in California.25 The focus on financing has been made even timelier, however, by the financial crisis and the inability of many renewable energy project developers to attract capital to their projects.
This chapter reviews the current renewable energy financing environment, and discusses feed-in tariff design options from the financial community’s perspective, focusing on the following topics:
A recent history of renewable energy financing. Renewable energy financing and feed-in tariffs. Feed-in tariff design options and risk.
22 Gross, R., P. Heptonstall. and W. Blyth. 2007. Investment in Electricity Generation: The Role of Costs, Incentives and Risks. Imperial College Centre for Energy Policy and Technology. London. Prepared for the Technology and Policy Assessment Function of the UK Energy Research Centre. 23 de Jager, D., and M. Rathmann 2008. Policy Instrument Design to Reduce Financing Costs in Renewable Energy Eechnology Projects. Utrecht, the Netherlands: Ecofys International BV. Prepared for the International Energy Agency, Renewable Energy Technology Development24 Grace, Robert, W. Rickerson, K. Porter, J. DeCesaro, K. Corfee, M. Wingate and J. Lesser. KEMA. November 2008. Exploring Feed‐in Tariffs for California. California Energy Commission. CEC‐300‐2008‐003‐F. Sacramento, Calif.25 CPUC. July 2008. Renewables Portfolio Standard Quarterly Report to the Legislature. San Francisco, Calif. Available online from: http://docs.cpuc.ca.gov/word_pdf/REPORT/85936.pdf
8

A Recent History of Renewable Energy Financing
The ability of feed-in tariffs to attract investment has been brought into sharp focus by the recent financial crisis and its negative impact on the financing of renewable energy projects. To get a better understanding of why this sector has been so severely affected, it is important to look at how the market has evolved. The primary incentive mechanisms in the United States used to make renewable energy projects cost competitive have been federal tax incentives. These incentives have taken the form of a production tax credit (PTC), investment tax credit (ITC), and accelerated depreciation (five-year Modified Accelerated Cost Recovery System). The first two credits are dollar-for-dollar reductions in the tax liability payable to the federal government, while the accelerated depreciation creates near-term tax losses from the project that can be used by an investor to offset income from its other operations (collectively these incentives are “tax benefits”).
Tax benefits provide significant value for renewable energy projects.26 However, most project developers lack sufficient federal tax liability to efficiently utilize the full value of the incentives. In response, financing structures were developed to allocate the tax-based incentives to a class of equity investors that could efficiently utilize them (tax investors). Historically, these tax investors have been large banks, financial institutions, and insurance companies, all with capital to invest and sufficient tax liability (also known as “tax appetite”) to make use of the incentives.27 In addition to tax-based equity investment, the growth in renewable energy has been fueled by debt. Lenders have added a great deal of value to developers by providing construction as well as turbine payment financing (but not as much project-level debt – see discussion below). European commercial banks, with a history of lending to renewable energy projects, have been the leading debt providers in this market.28
Prior to the financing crisis, the renewable energy debt and tax equity markets were well capitalized and very liquid. In 2007-2008, there were roughly 18 large institutions that invested in the tax equity markets.29 These tax investors had the capital to invest and the tax liability to utilize a significant amount of tax benefits being generated by renewable energy projects. The large number of investors led to a competitive situation that drove down the cost of capital (in the form of lower required rates of return) for new projects securing financing. In recent years, a
26 Harper, John, Matt Karcher, and Mark Bolinger. 2007. Wind Project Financing Structures: A Review & Comparative Analysis. Lawrence Berkeley National Laboratory.LBNL-63434. Berkeley, Calif. 27 Bolinger, Mark, Karlynn Cory, Ted James, and Ryan Wiser. 2009. PTC, ITC, or Cash Grant? An Analysis of the Choice Facing Renewable Power Projects in the United States. Lawrence Berkeley National Laboratory. LBNL-1642E. National Renewable Energy Laboratory. NREL/TP-6A2-45359.Golden, Colo.28 Harper, John, Matt Karcher, and Mark Bolinger. 2007. Wind Project Financing Structures: A Review & Comparative Analysis. Lawrence Berkeley National Laboratory LBNL-63434. 29 Chadbourne and Parke. “Trends in Tax Equity for Renewable Energy.” Project Finance Newswire, January 2009. pp. 27-34.
9

class of tax investors emerged that for cost, timing, and security reasons, preferred an all-equity financing structure, where no project-level debt is used.30 This migration served to further increase competition between investors. In trying to secure more project investments, debt providers began to lessen terms offered to projects, including lowering their interest rates. In sum, this competitive environment, fueled by an excess of capital relative to the number of potential investments, led to an overall decline in financing costs for new projects.
The downward trend in financing costs was reversed when the effects of the financial crisis began to be felt in the third quarter of 2008. The tax equity markets were based on (1) an ample amount of capital to invest and (2) sufficient expected long-term tax liability (that is 10 years) to utilize all the tax benefits. The large institutions (that is banks, insurance companies) that had historically been renewable energy tax investors saw a decrease in profitability and an overall contraction of available capital. In addition, many of the tax-based investors became insolvent or were acquired, reducing the number of entities in the market.31 This increased level of uncertainty associated with tax investor profitability, a reduction in the amount of capital available for investment, and consolidation of participants led to a gradual freeze in the tax equity market for renewable energy.32 Similar events occurred in the debt markets as banks, both European and the United States-based, experienced a restriction on capital supplies and market failure/consolidation.
In response to the lack of liquidity in the renewable energy financing markets, the United States Congress included a number of provisions in the American Recovery and Reinvestment Act of 2009 (ARRA) aimed at increasing investment. Included in the ARRA were extensions of the current deadlines for the production and ITC,33 and the ability for projects receiving the PTC to instead elect an ITC (which, for some project cost structures and capacity factors, would prove financially superior to the PTC).34 Another important provision allows for the ITC value to be taken in the form of a cash grant. The ability for projects to choose the ITC cash grant is seen as an important step away from tax-based incentives. However, it does not
30 Chadbourne and Parke. “State to the Tax Equity Market.” Project Finance Newswire. November 2008. pp. 22-36.31 Fritz-Morgenthal, S., C. Greenwood, C. Menzel, M. Mironjuk, and V. Sonntag-O’Brien. 2009. The Global Financial Crisis and Its Impact on Renewable Energy Finance. Paris, France. United Nations Environment Programme, Sustainable Energy Finance Initiative. Prepared in collaboration with Frankfurt School of Finance and Management and New Energy Finance Limited; see also Karcher, Matt. 2009. “The Financial Crisis and Renewable Energy.” Briefing from Deacon Harbor Financial. October 17, 2008.32 Karcher, Matt. 2009. “The Financial Crisis and Renewable Energy.” Briefing from Deacon Harbor Financial. October 17, 2008.33 The PTC in-service date was extended through 2012 for wind, and 2013 for other qualified technologies. PTC-qualified facilities can elect the ITC during those periods. The Emergency Economic Stabilization Act of 2008 had previously extended the solar ITC in service deadline through 2016.34 Bolinger, Mark, Karlynn Cory, Ted James, and Ryan Wiser. 2009. PTC, ITC, or Cash Grant? An Analysis of the Choice Facing Renewable Power Projects in the United States. Lawrence Berkeley National Laboratory LBNL-1642E. Berkeley, Calif. National Renewable Energy Laboratory. NREL/TP-6A2-45359. Golden, Colo.
10

completely do away with the need for tax investors given the significant value associated with the project’s accelerated depreciation. Also, the cash grant program, unless extended, is a short-term option because eligible projects must start construction by the end of 2010 and be placed in service prior to 2013 (wind), 2017 (solar), and 2014 for other qualified technologies.
The ARRA legislation also includes an expansion of the existing Department of Energy loan guarantee program. The original program, established by the Energy Policy Act of 2005, was designed for projects using “innovative non-commercial” technology.35 The new program, which will be funded with $6 billion to cover the costs of providing the guarantees, has been expanded to include commercially proven technologies.
The current market conditions discussed above have led to a situation where the demand for project capital (that is demand driven by the number of projects being developed) exceeds the supply of available investment. This has led to an increased cost of capital with more restrictive terms and a decrease in the number of projects being developed and financed. In brief, the supply of project financing capital at present is severely limited, and what is available is becoming increasingly expensive.36 As of October 2009, the ARRA incentives have not yet had a tangible impact on the market because many of the program rules have not yet been written or have been recently clarified. In addition to waiting for commencement of these new incentives, the market is still experiencing profitability uncertainty and a general capital shortage.
There appears to be some recent movement in the market. On September 1, 2009, the U. S. Department of the Treasury issued a press release announcing that $502 million in cash grants has been awarded to twelve renewable energy projects.37 This is an encouraging sign for the clean energy sector, but the market as a whole remains sluggish. Project development and financing have been largely dormant for the past year, and it will take time for momentum to build. Progress should continue, but the current situation is likely to remain until the underlying economic issues begin to correct, and companies regain profitability, and there is liquidity in the capital markets.
The lack of available financing has impacted both development and project capital markets, discussed in greater detail later in this chapter. Development capital markets, used to fund early stage costs necessary to develop projects and secure necessary contracts (e.g. off-take arrangements, equipment supply, etc.), are seen as a risky investment, because there is a high natural failure rate in the development process. As the finance markets in general have become increasingly
35 Bolinger, Mark, Karlynn Cory, Ted James, and Ryan Wiser. 2009. PTC, ITC, or Cash Grant? An Analysis of the Choice Facing Renewable Power Projects in the United States. Lawrence Berkeley National Laboratory. LBNL-1642E. Berkeley, Calif. National Renewable Energy Laboratory. NREL/TP-6A2-45359. Golden, Colo.36 It should be noted, however, that utilities are beginning to emerge as significant wind energy investors. Although few utilities have owned wind turbines historically, investor owned utility wind projects rose to 19 percent of 208 installations in 2008. See Wiser, R. 2009. Tracking the U.S. Wind Industry: Annual Report on U.S. Wind Energy Markets – 2008. Proceedings of the WINDPOWER 2009 Conference, Chicago, Ill.37 The press release can be found at: http://www.treas.gov/press/releases/tg271.htm.
11
risk averse, this type of capital is becoming more difficult and costly to secure. It is important to also note that there is a relationship between the project capital and development financing sectors. As the availability of project capital has decreased, there has been a decline in the demand for development funds. In short, if fewer projects are being funded, there will be a corresponding slowdown in the number of projects being developed. Early-stage development funding is important especially for smaller project companies that have limited resources with which to develop new opportunities. Without this type of capital, it is difficult for smaller developers to complete the preliminary work necessary to secure the required permits and major contracts.
Project capital generally refers to funds that are used to construct a project and begin commercial operations. This type of financing includes both construction financing, the money actually used to pay for the cost and installation of equipment, and term financing, which is used to pay off the construction capital when the project becomes operational. As a result of the financing crisis, the supply of project capital, including tax equity, has decreased significantly. This has lead to an imbalance in the market, with the demand of projects seeking funding far outpacing the supply of capital available. Such a situation serves not only to increase the cost of financing for projects, but also to increase development risk. With fewer projects being able to secure financing, development schedules are delayed, stressing the resources of smaller companies, possibly until the project becomes infeasible. The primary focus of this report will be on the project financing sector (that is capital used for building the project), but it will also touch on the current limitations for development funding.
Renewable Energy Financing and Feed-In Tariffs
The near-term outlook for renewable energy financing may be guarded, but it is expected that in time the financial markets will recover and that renewable energy investment will thaw. Current discussions about whether the United States projects can secure financing at all should therefore be accompanied by discussions about how to structure policies to encourage the lowest-cost financing available in both the near and long term.
In Europe, the policy solution to low-cost financing appears conclusively to be feed-in tariffs. A series of recent European studies38 concluded that feed-in tariffs create the conditions for lower financing costs better than do other types of renewable energy policies because feed-in tariffs create “investor security.” Investor security is a broad term, however, and not all feed-in tariffs are designed the same way. Nor do the alternatives to feed-in tariffs universally fail to create such investor security. For example, RPS requirements with long-term contracting (or tendering schemes, as referred to in Europe) provide greater investor security than RPS
38 Commission of the European Communities. 2005. “The Support of Electricity from Renewable Energy Sources.” Brussels; Stern Review. 2006. “Policy Responses for Mitigation: Accelerating Technological Innovation (Part IV, Chapter 16).” The Economics of Climate Change. Cambridge, UK: Cambridge University Press; Ölz, S. 2008. Deploying Renewables: Principles for Effective Policies. Paris, France. International Energy Agency.
12

policies which require projects to fend for themselves in the commodity and tradable renewable energy credit (REC) markets.39
When analyzing financing for feed-in tariffs in the United States, it is also important to acknowledge that the policy landscapes in the United States and Europe lead to different renewable energy financial structures that have different financing implications.40 As discussed above, the existence of the federal tax benefits has meant that the United States renewable energy projects have relied primarily on equity as the key driver, rather than debt, for project-level financing. This is because these tax-based incentives (that is non-cash) are more efficiently utilized by equity investors than debt providers. In most of the existing and proposed feed-in tariff laws and regulations in the United States, the feed-in tariff rates assume that developers will continue to take advantage of the federal tax benefits. This means that – unless federal policy changes – the United States renewable energy financing will continue to rely heavily on equity even if feed-in tariffs are widely introduced. In leading European markets such as Germany, by contrast, feed-in tariffs do not operate in parallel with tax credits. As a result, European renewable energy projects are structured to leverage far more debt than projects in the United States.41 Debt is generally cheaper than equity,42 and so financing costs under European feed-in tariffs are typically lower than under other policy regimes. Therefore, although it will be argued below that feed-in tariffs can create conditions for lower-cost renewable financing in the United States, U.S. reliance on tax credits means that financing costs under the United States feed-in tariffs are unlikely to be as low as financing costs under European feed-in tariffs.
This section explores the notion of investor security by reviewing the relationship between risk and policy design and by discussing general policy characteristics that can decrease risk and lower project financing costs. The following section then examines specific feed-in tariff design options in California and discusses their implications for risk and both development and project financing cost.
39 de Jager, D., and M. Rathmann. 2008. Policy Instrument Design to Reduce Financing Costs in Renewable Energy Technology Projects. Utrecht, the Netherlands. Ecofys International BV. Prepared for the International Energy Agency, Renewable Energy Technology Development.40 This was noted by stakeholders during the CPUC’s California Solar Initiative design proceedings. See e.g. Litteneker, R. J., and S. W. Walter. 2006. Pacific Gas and Electric Company's proposal for a performance based incentive for the California Solar Initiative for discussion at the workshop on March 16, 2006 (Rulemaking 04-03-017). San Francisco, Calif. CPUC. Nelson, L. 2006. Comments of the California Solar Energy Industries Association for consideration in the performance-based incentive workshop proceedings commencing March 16, 2006 (Rulemaking 04-03-017). Sacramento, Calif. CPUC41 Guillet, J., and M. Midden. February 3, 2009. Financing Renewable Energy: Feed-In Tariffs Compared to Other Regulatory Regimes Proceedings of the Florida Alliance for Renewable Energy Effective Renewable Energy Policies Conference, Tallahassee, Fla.42 Kahn, E. (1996). “The PTC for Wind Turbine Power Plants is an Ineffective Incentive.” Energy Policy. 24(5), 427-435
13

Renewable Energy Financing Risks Providing financing for a renewable energy project requires the funding entities to identify and manage a series of preconstruction, construction, and operating risks. The number and magnitude of risks identified, which are highly project-specific, will impact the amount of capital required by, and accessible to a project, and the premium at which that capital is available. To the extent that one or more of these risks and uncertainties can be mitigated, the opportunity arises to reduce the amount and cost of capital. As a general rule lower risk results in a lower cost of capital, which translates into a lower cost of energy from the project.
As previously discussed, the capital invested in renewable energy projects can be divided into two primary categories. The first is development-stage capital, which is used for siting, feasibility analyses, permitting, and securing off-take contracts, and is typically provided by equity investors seeking a cash-on-cash return. This category of capital providers (that is cash-on-cash) require a cash-based return and are not interested in the tax benefits from a project once it begins operations. The second is project financing, which is used to repay construction loans or otherwise fund the full amount of a project’s installed cost and is provided by a combination of tax investors, cash-equity, and debt.43 The tax investor earns its return by monetizing a project’s tax credit (or grant in lieu thereof) and depreciation benefits, while debt is provided in exchange for a predefined schedule of cash-based principal and interest payments, and the cash-equity return is based on project free cash flow not allocated to other, more senior investors. While these different investors may prioritize risks differently, all capital providers to renewable energy projects face the same set of primary risk factors, which are presented chronologically, along the development life cycle, below.
Table 1 lists the primary risks that investors analyze when evaluating development-stage or project financing opportunities, and typical strategies for mitigating those risks. Table 1 is organized chronologically according to the project development life cycle. Each of these risks is explained in greater detail in the following section. As can be seen in the last column of Table 1, the majority of these risks can be addressed through policy design, while those related to technology performance, resource availability, and construction are generally policy independent.
43 This report does not focus on construction financing or equipment financing, as they are generally independent of the policy framework.
14

Table 1: Risks Associated With Renewable Energy Financing
Risk Description Mitigation StrategyPolicy Maker Influence
Development (Timing)
Project will be delayed or not be completed at all
Missed milestones increase (1) cost of development capital, risk of achieving permanent financing; (2) exposure to contractual penalties (liquidated damages), loss of security, off-take contract termination risk
Clearly defined process for siting, permitting and interconnection
Off-take contract (contract for the sale of electricity and/or RECs) flexibility in commercial operation date
High
Development (Contracting)
Investment in development, proposal development, contract negotiations without yielding off-take agreement
Assured access to off-take contract High
Contract Price Risk
Setting a firm power purchase price before development contingencies are resolved and project costs fully known
Minimize time gap between finalizing contract and financial closing (e.g. reduce permitting time)
Allowing for pricing adjustment between when the contract is signed and when costs are finalized
High
Revenue Adequacy of revenues to provide target returns
Revenue volatility
Long-term fixed-price contract for both energy and RECs
High
Operating Min. availability, performance penalties
Project curtailment (adds volume risk)
O&M contract guarantees Off-take contract operational
performance flexibility Priority dispatch or curtailment
limitations/compensation
High
Regulatory Incentive structure that is short-term focused, unstable, and not transparent
Long-term, stable and transparent incentive structure
High
Transmission & Interconnection
Cost allocation exceeds pro forma
Fix cost allocation Provide contract provisions that
enable cost adjustment if allocation is higher than expected
High
Credit Off take counterparty is unable or unwilling to pay
Entering into contract with investment grade counterparty or securing a like guarantee
High
Legal Time and cost of contract negotiations
Appeals/lawsuits challenging procurement results
Price incentive policy with a defined process and standardized contract
High
Construction Delays and cost overruns Fixed-price date-certain construction contract
Low
Resource Resource (that is sun, wind) is not available as predicted
Third party independent assessments
Low
Technology Technology does not perform as expected
Contractual damages for performance failures
Equipment & construction contractual guarantees and warranties
Low
Source: KEMA, Inc.
15

Development (Timing) RiskAt worst, development risk represents the possibility that a project has one or more fatal flaws, (e.g. fails to secure the required permits, insufficient resource, or the cost is too high), and is therefore unable to proceed to financing and construction. More subtly, development risk also includes unexpected project delays and increases in funding requirements to complete the permitting process. Project delays become relevant to the extent there is a contractually set milestone schedule or commercial operations date. Missed milestones may result in fines, loss of security (that is deposit), or even contract termination. Development risk is reduced in states with clearly defined siting, permitting, and interconnection processes. To this end, policy design choices will have a significant impact on the development risks, time to completion, and costs faced by investors.
Development (Contracting) RiskProjects enter into a myriad of contracts as part of the development process, arguably the most important of which is an off-take agreement (that is Power Purchase Agreement or PPA or other purchase guarantee). Increased uncertainty surrounding a project’s ability to secure a PPA will add to its risk profile, increasing development risk. In a competitive bid situation, the developer will progress a project only so far while the bid is outstanding. If the bid is successful, the project proponent will reinstate development and move forward on all the necessary contracts, permits, etc. Relative to an environment where an off-take contract is assured, a competitive bid situation adds cost through preparation of a bid package and contract negotiations, as well as increasing the overall development life cycle. This increased up-front cost and uncertainty can act as a barrier to entry for thinly capitalized developers and lead potential investors to either (1) increase their cost of capital to compensate for the added risk or (2) hold back investment until a PPA is secured.
Contract Price Contract price risk denotes the situation in which a firm power purchase price has been set before the project proponent has resolved all development contingencies and locked down the project’s total installed costs. Clearly, this situation exposes the project financier to changes in market conditions for the equipment and labor required to complete the project. If other contingencies exist at the time a firm PPA is signed (such as finalization of a major equipment supply contract), this risk increases, as equipment pricing may shift dramatically due to commodity cost increases or adverse movements in the foreign exchange markets. Contract price risk is reduced by (1) minimizing the time gap in between contract signing and the developer’s finalization of project costs and/or (2) allowing for pricing adjustments to account for cost changes after the purchase agreement has been signed. Regulators can decrease contract price risk associated with the former by decreasing permitting time and the latter by allowing for a price adjustment to account for cost changes.
16

Revenue RiskRevenue risk is the exposure of a renewable energy project’s revenues to fluctuations in wholesale market prices. If revenues are inadequate, the project will fail to meet its investors’ required returns. Almost universally, investors seek to mitigate this risk by entering into long-term, fixed-price contracts for the sale of both energy and RECs. In limited circumstances, and before the recent credit crunch, a limited number of equity investors were willing to take a modest amount of market price risk (also called merchant risk), or at least keep some output available for contracting after the facility came on-line. Even those projects were not strictly merchant plants because there was usually a mid-term financial hedge against market price risk. Today, renewable energy developers must have long-term revenue certainty in order to attract financing. Policy makers can significantly influence the success of new renewable energy project development by creating stable programs that fill this industry demand for long-term contracts.
Contract terms for projects with short-term fuel price exposure, such as biomass, may be shorter, corresponding to the length of the underlying fuel supply contract. Historically, it has been difficult for biomass projects to secure long-term fuel agreements because (1) suppliers are typically smaller companies that are reluctant to enter into such contracts and (2) the amount of fuel tends to be uncertain in the long term (e.g. construction waste as a fuel is dependent on building cycles). These factors have lead to the use of short-term (that is 1-5 years) supply contracts, which increases fuel price risk. In general, longer-term power purchase contracts are preferable for financing, but given the fuel price uncertainty associated with short-term contracts it may preferable from a financing perspective to have a sales agreement with a corresponding term. However, short-term PPAs will usually lead to short-term financing because of the increased fuel price and availability, and power purchase recontracting, risks.
Operating RiskOperating risk refers to the impact of grid operation policies on generator run time. This includes the risk that a project’s operations will be curtailed in an unknown set of hours throughout the year. Different countries have taken different approaches to curtailment under renewable energy policies.44 In countries where renewable generators are subject to curtailment, but are not entitled to compensation for curtailed electricity, this adds the element of volumetric risk to the project’s economics because a curtailed generator is not compensated for the production it expected to deliver to the grid during the curtailment period. In addition, many PPAs include minimum availability requirements and penalties for underperformance. This risk can be eliminated by providing renewable energy projects with priority dispatch. In other words, grid operation policies can be designed to ensure that all renewable energy production has guaranteed access to the grid. For this reason, policy structure can have a significant impact on operating risk.
44 See e.g. Ackermann, T. 2008. The European Wind Integration Experience. Proceedings of the North East Region System Operators' Wind Integration Seminar. Montréal, Quebec.
17

Regulatory RiskWhen policy makers adopt incentives or other programs to encourage new development, they introduce regulatory risk to renewable energy project investors. This is because the project is receiving an incentive that is mandated by a governmental agency, which may choose to terminate or alter the program at some point in the future. Additional regulatory risk is added any time a public policy is created on a pilot or short-term basis or has one or more elements that are unstable or not transparent. Any non-binding policy that is subject to periodic and ambiguous review and adjustment will be a significant barrier to project financing. Any policy allowing the adjustment of pricing for existing contracts will preclude financing altogether. Regulatory risk is mitigated by the adoption of public policy that avoids these pitfalls and focuses on long-term, stable, and transparent incentives.
Transmission and Interconnection RiskIn the U.S. electricity market, all generators are afforded the opportunity to interconnect to the grid if they meet all of the reliability, safety, and operating procedures of the interconnecting utility. Meeting these requirements does not, however, come at equal cost to all generators. The system impacts – and therefore system enhancement requirements – are different for each generator depending on its proposed location, technology, and size, among other factors. Transmission and interconnection risk typically refers to the scenario in which the portion of the cost of interconnection and transmission enhancements exceeds developer and utility pro forma estimates. This risk is best mitigated by making the cost allocation process fixed and transparent. In addition, this risk can be managed by establishing contract provisions that enable a cost adjustment if the allocation to the proposed generator is higher than expected. Due to regulators’ heavy involvement in grid operation and utility regulation, transmission and interconnection risk is highly influenced by public policy.
Credit RiskCredit risk is defined as the electricity purchaser’s inability or unwillingness to pay for the contracted commodity. A renewable energy generator mitigates credit risk either by only contracting with counterparties that have an investment grade credit rating or by requiring financial security in an amount that protects the generator against the buyer’s potential non-payment. The latter could also take the form of a guarantee by a creditworthy entity that is willing to undertake the purchaser obligation in the event of non-payment. By allowing regulated utilities to enter long-term contracts with renewable energy generators, and guaranteeing cost recovery for those contracts, policy makers can significantly reduce the extent to which credit risk inhibits the financing of new renewable energy projects.
Legal RiskEven where a competitive bid is successful, the renewable energy project faces two related, but nonetheless additional, legal risks. First, after reaching an agreement in principle to sell its output to a willing buyer, the developer must navigate a time- and cost-intensive contract negotiation process. During this
18
process, each of the contract terms is expanded into detailed contractual language explaining the parties’ individual rights and obligations. This translation can morph into an extended negotiation, possibly causing project delays, cost increases, or even a failure to reach agreement.45 Second, despite their open and inclusive process, competitive bid results can be challenged by unsuccessful bidders through appeals and lawsuits. The legal challenge of public procurement results can delay the final contract award by months, which poses a substantial risk to both development-stage and project finance investors. Legal risks are mitigated through incentive policies that provide a clearly defined process from application to final award and include the required use of standardized contracts, with limited exceptions taken for project-specific needs.
The final three risks have limited direct exposure from policy maker influence. These risks are usually handled contractually or with the use of third party subject experts.
Construction RiskSchedule delays and cost overruns are the primary construction risks. Investors providing construction financing, which is its own niche within renewable energy project finance, attempt to mitigate this risk by seeking fixed-price, date-certain contracts with equipment providers and installers. Policy design has relatively little influence on these risks, since they are commercial (that is they are based in large part on contractor performance) and since the mitigation strategies are contractual in nature.
Resource RiskResource risk represents the circumstance in which the renewable fuel (that is wind, sun, or wood) is not available in the quantity predicted in a project’s feasibility studies. This leads to lower annual production and therefore lower revenue, relative to expectations. This may prolong the time it takes for tax-equity to achieve its targeted rate of return, cause a reduction in the cash-equity investors’ realized return or, in severe circumstances, cause the project to default on its debt service obligation. Unlike operating risk, resource risk cannot be affected by policy design. The financier best mitigates this risk by retaining one or more third parties to conduct an independent resource assessment as part of the evaluation process.
Technology RiskTechnology risk describes the extent to which the generation equipment does not perform as expected, resulting in a reduced amount of energy production. This can severely impact investors, as the project’s PPA usually contains performance provisions in the form of contractual damages for production under a minimum 45 These circumstances are applicable not only to PPAs, but also to other contractual events such as equipment purchase and installation contracts.
19

level. Similar to construction risk, the risk of underperformance of the physical equipment is mitigated through equipment warranties and other contractual guarantees. Therefore, like resource risk, technology risk is not influenced by policy design.
The aforementioned risks are a renewable energy investor’s primary focus as part of the overall investment decision. Capital providers will evaluate a project’s overall risk profile relative to an expected return and proceed with investment if the return is sufficient. In many cases, policy design can have a significant mitigating, or exacerbating, impact on these issues.
High-Level Policy Characteristics
This section examines how the renewable energy project financing risks previously discussed translate into policy design characteristics of a feed-in tariff. At a high level, the policy design characteristics that are important to capital providers are simplicity and stability.46 In general, the lower the risk profile of a project the lower the required rate of return, so risk mitigation is important. Also of value to the financing market is a simple and transparent incentive structure. This allows investors to clearly identify and evaluate risk relative to the expected return. A known risk can be mitigated or priced for, but unknown risks, increased by a lack of policy or structure clarity, can be a barrier to financing. Table 2 provides a summary of policy characteristics associated with achieving low-cost financing.
46 Guillet, J. and M. Midden. February 3, 2009. Financing Renewable Energy: Feed-In Tariffs Compared to Other Regulatory Regimes. Proceedings of the Florida Alliance for Renewable Energy Effective Renewable Energy Policies Conference. Gainesville, Fla.
20

Table 2: Overview of Policy Characteristics That Achieve Lowest Cost Financing
General Characteristic Financing Perspective
Regulatory Stability
Avoid boom-bust cycles (that is PTC)
Policy adjustments should be limited in frequency and market-based
No adjustments (other than inflationary) for operating projects
Long-Term Political and Societal Support
Long-term contracts are a financing necessity
Pricing that provides a fair rate of return will attract a broader pool of investors
Necessary government guarantees and support
Simplicity Incentive structure simplicity lowers cost and decreases time
to completion
Complexity acts as a barrier to entry for many investors
Transparency A clearly defined policy feed-in tariff allows for assessment of risk
Price and Contract Certainty
Mitigating contracting risks reduces development financing cost magnitude and risk exposure (cost)
Investors will not take market price risk
Creditworthy contract counterparty
Curtailment Minimize curtailment (eliminate volume risk)
Clarity on interconnection cost allocation
Source: KEMA, Inc.
Regulatory StabilityThe introduction of renewable energy policies inherently creates policy and regulatory risk. The stability of any regulatory incentive program, therefore, is critical for investors. Designing a policy structure with short-term availability or uncertainty adds to the overall risk of a project and will create a barrier to entry for many developers and potential capital providers. A good example of the negative impacts associated with historical regulatory instability is the federal PTC incentive. A series of short-term extensions created a boom-bust cycle for wind project developers and investors.47 The investment community was unwilling to take the regulatory risk, and as a result project developers had to clearly 47 Wiser, R. 2007. Wind Power and the PTC: An Overview of Research Results. Lawrence Berkeley National Laboratory. LBNL/PUB-971. Testimony prepared for a Senate Finance Committee hearing on "Clean Energy: From the Margins to the Mainstream.”
21

demonstrate they were going to be operating prior to the next PTC deadline in order to obtain financing. As the deadline approached, project development stopped, and investors discontinued making commitments. Once the expiration date was extended, the industry started to move again. This uncertainty associated with the PTC has kept developers, investors, and even equipment suppliers from making long-term investments in the market.48
Another important aspect of regulatory stability relates to adjustments of incentive policies. The financing market is not necessarily opposed to periodic evaluations of any program (e.g. price adjustment for new projects under a feed-in tariff). However, any potential change introduces uncertainty and increases risk. To mitigate those risks, the policy adjustment process needs to be well-defined, transparent, limited in frequency, and based on market conditions such that developers and investors can continue to be assured an acceptable return.
Long-Term Political and Societal SupportLong-term political and societal support creates an investing environment that attracts capital by reducing perceived regulatory risk. Historically, and especially in today’s market, long-term contracts (20-years) are necessary for financing as investors are unwilling to take market price risk. Providing projects with longer contracts and setting fixed prices at levels that provide a sufficient rate of return will attract a broad pool of capital providers. The contracts will also need to be with a credit-worthy counterparty or have the necessary payment guarantees in order to be financeable.
SimplicityAn overly complex policy program can create a barrier to entry, while a simple regulatory incentive structure can lead to broader market participation. For developers, an incentive policy that is clearly defined and easy to understand will decrease the duration and cost of completing a project. From an investment standpoint, simple and clearly defined structures allow for more complete risk identification and a reduction of regulatory ambiguity, leading to a greater number of capital providers and a lower cost of capital. The current federal renewable energy incentives are an example of how a complex structure impacts financing markets. The use of tax-based incentives reduces the universe of potential investors to only those with sufficient tax liability. This excludes traditional sources of project capital such as pension plans and endowments, which do not pay federal income taxes. It also means that most developers must find a tax investor to monetize the full value of projects, as they lack sufficient tax appetite. This has lead to the creation of very complex financing structures that add cost and increase development times for projects.
48 Karcher, Matt. 2009. “The Financial Crisis and Renewable Energy.” Briefing from Deacon Harbor Financial, October 17, 2008.
22

TransparencyTo attract the lowest cost capital, a regulatory policy needs to be transparent, allowing investors to fully assess the risk profile of a project. Incentive structure ambiguity will limit the number of capital providers and also increase the cost of the capital that is available. The newly established ITC cash grant is an illustration of how regulatory ambiguity can impact the renewable energy financing and development markets. The program, established by the ARRA, allows projects to take the ITC value in the form of a cash grant. This serves to reduce the amount of tax benefits from a project to only the amount of loss created by the accelerated depreciation, which is very attractive to the financing market given the limited tax equity available. However, the rules governing this program have yet to be written, so the market is in a holding pattern until the necessary definition and transparency are established. California’s current competitive RPS solicitation process may provide another example of an incentive that could benefit from greater transparency. Under the current system, a project selected in the solicitation process is nonetheless exposed to the uncertainty of a subsequent contract negotiation process. Identifying the fundamental contract terms at the outset reduces risk (and the associated required return) by increasing transparency.
Price and Contract CertaintyPrice certainty is important for project financing because investors are intolerant of market price risk. A feed-in tariff policy design that provides a long-term, price-certain contract both eliminates that risk and reduces revenue volatility to the operating or resource level. Counterparty risk (that is non-payment) is another key focus for investors. Power purchase contracts will need to be with a creditworthy entity (that is investment-grade rating) or have the necessary payment guarantees. Decreased price and counterparty risks allow a project to secure long-term and less expensive financing.
Contract certainty is also important, especially from the standpoint of development capital. Currently there is a high risk factor associated with competitive bid situations. Developers have to incur costs and time advancing a project that will not be financeable without an off-take agreement. This level of uncertainty creates a barrier to entry for early-stage capital providers. Mitigating contracting risk, by assuring purchase agreements for eligible projects, reduces development expenses, as well as development financing cost and availability.
CurtailmentThe ability of a project to sell its full production output is essential as it eliminates an important aspect of revenue volatility, volume risk. Therefore, a feed-in tariff policy should minimize or even eliminate the possibility of curtailment. Clarity on allocation of interconnection costs is also important to investors. However, which party is allocated the costs is not necessarily important as long as it is considered in feed-in tariff pricing and the overall rate of return is maintained.
23

Feed-In Tariff Design Options and Risk
This section will discuss specific feed-in tariff design characteristics as they relate to risk and financing, and provide a recommendation on an incentive structure that will attract the lowest cost of capital.49
Tables 3 and 4 in this section outline the characteristics that the authors feel will have the biggest impact on financing. These characteristics are grouped into three sets of issues: feed-in tariff structural issues, contract terms and conditions, and changes to the available tariff over time. The design options which are listed in each of the tables are explained in greater detail in the feed-in tariff design papers prepared for the Energy Commission in 2008 and 2009.50 To assist projects with securing the lowest cost capital, the main goal of a feed-in tariff program will be to clarify and minimize risk factors, ultimately increasing investor security. As a general rule, lower risk translates into a lower required return for investors and a lower cost of energy from a project. Lower risk also increases the likelihood that the project will be able to obtain financing during periods of tight credit.
The first set of feed-in tariff characteristics (Table 3) is related to feed-in tariff structure and includes price setting and tariff differentiation, tariff structure, the commodities being sold, generator eligibility, quantity and cost limits, and queuing procedures.
49 The feed-in tariff design issues list was taken from, Grace, Robert, W. Rickerson, K. Porter, J. DeCesaro, K. Corfee, M. Wingate and J. Lesser (KEMA). November 2008. Exploring Feed-In Tariffs for California. California Energy Commission. CEC-300-2008-003-F. Sacramento, Calif.50 Grace, Robert, W. Rickerson, K. Porter, J. DeCesaro, K. Corfee, M. Wingate and J. Lesser (KEMA). November 2008. Exploring Feed‐In Tariffs for California. California Energy Commission. CEC‐300‐2008‐003‐F. Sacramento, Calif.; Grace, R., W. Rickerson, K. Corfee, K. Porter, and H. Cleijne. KEMA. May 2009. California Feed-In Tariff Design and Policy Options. California Energy Commission. CEC-300-2008-009F. Sacramento, Calif.
24

Table 3: Feed-In Tariff Design Characteristics and Financing: Structure
Characteristic Options Financing Preference
Setting Price & Tariff Differentiation
Value
Cost of Generation
Competitive Bench Marks
Cost-based pricing designed to ensure reasonable profitability
Tariff Structure Fixed,
Stepped Fixed
Fixed Premium
Hybrid
Contract for Differences
Options fixing all revenues are preferable to those fixing part of revenue (e.g. fixed premium)
(consider inflation indexing O&M portion)
What is Being Sold
Bundled
Unbundled
Bundled
Quantity and Cost Limits
Capacity Cap
Generation Cap
Cost Cap
No limits, or ample notice of changes
Queuing Application fee
Performance Milestones
Fee for Extensions
Only as needed to address quantity/cost limits or declining tariff rates
Source: KEMA, Inc.
Setting the PricePrice setting is critical to the success of the feed-in tariff policy in attracting the lowest cost capital because accurate price setting reduces market price risk and increases revenue certainty. Of the price setting options listed in Table 3, a price setting method based on the cost of generation is the preferred option from a financing perspective. Cost-based pricing ensures a reasonable rate of return that will help to attract a broad base of investors.51 Decisions about how to differentiate cost-based tariffs (e.g. by size, resource, technology, etc.) are a function of government policy objectives, rather than financial evaluation. It is important that the target return for any renewable energy project is considered reasonable by investors, relative to the overall project risks, but investors are indifferent as to which types of projects are supported by feed-in tariffs. In general, it is difficult to say what would be considered a reasonable return because (1) it is based on each 51 It should be noted that, although a competitive benchmark method can result in generation cost-based pricing, this approach could also increase development risk depending on how the benchmarking process is structured and implemented.
25

project’s individual set of risks and (2) current market liquidity and transparency have not been sufficient (that is there are very few financings taking place) to provide further details due to the recent financial crisis.52
Tariff StructureThe tariff structure is important for mitigating market price and revenue risks. Under these conditions the fixed-price options (e.g. fixed-price tariffs, stepped tariffs, and contracts for differences) are preferable for attracting financing. The contracted price does not have to be constant and can include changes over time, but those changes must be contractually set and certain. Price certainty, even if there is a price reduction, such as under a stepped tariff, is valuable for financing.
What Is Being Sold? Closely related to tariff structure is the issue of which commodities are bought and sold in a feed-in tariff transaction. In a hybrid structure, for example, generators sell one commodity at a fixed price (e.g. electricity) and another commodity (e.g. RECs) in the market. From the financing perspective, the preferred option is that all commodities are bundled under a single transaction. Bundled contracts mitigate price risk for investors, while providing the purchaser with a means to meet current or future renewable energy and/or environmental requirements. In the event that a project is able to keep the RECs and needs to sell them to achieve the target return, a long-term contract is necessary because capital providers will not take unmitigated REC price risk. Also, as it relates to credit risk, a bundled long-term contract is less costly and less risky than multiple long-term contracts for different commodities because having a single contract counterparty is less risky, assuming an investment grade rating, than having multiple contract counterparties.
Program Quantity and Cost LimitsQuantity limits refer to limitations on renewable energy that can be developed within the geographic area targeted by the feed-in tariff. These could include limitations on renewable capacity, renewable generation, and/or ratepayer impact and could either apply to the program overall or only to annual additions. In California, for example, the current feed-in tariff program is capped at 500 MW total, whereas the commercial photovoltaic feed-in tariff in Gainesville, Florida, is capped at 4 MW each year.53 The preferred option is not to have limits since this
52 Guillet, J. and M. Midden. February 3 2009. Financing Renewable Energy: Feed-in Tariffs Compared to Other Regulatory Regimes. Proceedings of the Florida Alliance for Renewable Energy Effective Renewable Energy Policies Conference. Gainesville, Fla. Guillet and Midden estimate that investors has increased investment margins from 60-100 basis points to 170-200 basis points under feed-in tariff regimes and from 90-120 basis points to 200-250 basis points under REC systems.53 Gainesville Regional Utility. Solar feed-in tariff. Available online from: http://www.gru.com/OurCommunity/Environment/GreenEnergy/solar.jsp
26

reduces policy transparency and increases development risk. If there are quantity limits, they need to be clearly defined, transparent, and stable.
Queuing ProceduresQueuing procedures should be implemented only if there are quantity limits, a capacity-based schedule of declining feed-in tariff payment levels, or other limitations on supply eligibility. If queuing procedures identified in Table 3 are necessary, they should be clearly defined and structured to discourage speculative queuing and ensure that eligibility requirements remain stable.
The second set of feed-in tariff characteristics (Table 4) relate to contract terms and conditions and include counterparty considerations, contract duration, preoperational development credit and performance, operational collateral or security, and penalties for contract breakage.
27

Table 4: Feed-In Tariff Design Characteristics and Financing: Contract Terms and Conditions
Characteristic Options Financing Preference
Counterparty
(follows from cost allocation policy decision)
Who Buys
Who Pays
Cost Recovery
Creditworthy entity and collection mechanism not exposed to revision during contract term
Contract Duration
Short-Term (1-7 yrs)
Medium-Term (10-14 yrs)
Long-Term (15-20 yrs)
Long-term , accounting for fuel price risk where applicable
(Pre-Operational) Development Credit and Performance
Deposit Requirements
Financial Information
Development Security
No credit, security or development milestone performance requirements
Operational Collateral or Security
Operational Collateral and Liquidated Damages
Must-take: no minimum performance requirements or associated liquidated damages/collateral
Contract Breakage Penalty
Explicit contract language
Collateral and Liquidated Damages
Explicit contract language; otherwise, collateral as low as possible to achieve buyer protection
Source: KEMA, Inc.
Counterparty ConsiderationsCounterparty considerations include which entity is responsible for making feed-in tariff payments (e.g. utilities, transmission system operators, or the government) and how costs are recovered. It is likely that the financing market will require the contracting entity to have an investment grade credit rating or have sufficient guarantees from a creditworthy entity. Counterparty risk (that is payment default risk) will not be accepted by investors. Policy design should also ensure that the terms of the contract not be exposed to revision during the life of the contract.
Contract DurationFor projects with no fuel price risk (that is wind, solar), long-term (e.g. 20 year) contracts are preferred. This provides investors with security and stability relative to future market price, and reduces recontracting risk. For projects with fuel price risk, the feed-in tariff contract duration should be commensurate with the term of underlying supply contracts. For example, market experience suggests it is difficult
28

to get long-term biomass supply contracts because wood fuel suppliers are reluctant to give up expected future increases in wood fuel prices and because these suppliers often operate on leased land and therefore cannot guarantee specified quantities over time54. As a result, a medium-term feed-in tariff is good for matching the risk that fuel supply prices may go up in the future. The project can use future power sales contracts to account for changes in fuel price. There is some recontracting risk for these projects, but that risk is generally outweighed by fuel price cost risk.
(Preoperational) Development Credit and PerformancePreoperational development credit and/or performance requirements55 may adversely impact smaller, thinly capitalized developers. In addition, most small developers will not have sufficient financial information given their size and funding status, if there is a requirement such as the submission of audited financials for the company. The ability of a developer to successfully complete a project is vitally important, but as they are most likely using project financing, their financial wherewithal should focus on the ability to fund development costs and secure permanent financing, and not necessarily the total project cost. Milestone schedules are also important56 and can be used to manage queuing issues, but immovable deadlines may not take into account the variability of the development process. Overall, material security and milestone requirements increase development risk and impair a project’s ability to secure the lowest cost capital. In general, fewer regulatory imposed milestones are preferable for financing, but those associated with major events (e.g. all permits secured, all major equipment contracts signed) may be acceptable to investors. It is important that these milestones be flexible within a policy framework as the development process is dynamic.
Another important factor relative to proposed milestone schedules is the assurance that the feed-in tariff contract counterparty, or any regulatory agency, will not take control of the project if a milestone is not met. It is customary that development capital providers, as a security mechanism, have first lien on all the assets of the company in which they invest, including all projects in development. Therefore, a policy structure designed so that the projects can be taken by an outside entity if there are delays will severely limit the availability of early stage capital.
Operational Collateral or SecurityThe financial security associated with a must-take contract, with no minimum performance requirements or penalties, will significantly increase investor
54 Establishing Long-Term Supply Agreements for Wood Energy Facilities. June 2008. A Project of the Empire State Forest Products Association.55 These items include development bonds or cash payments, financial information requirements and/or development milestone schedules with penalties for delays.56 Milestone schedules are important for both project developers and regulators. For the former it is used to ensure the project continues forward and continues to be viable, and for the latter it can be used to demonstrate the project’s likelihood of completion.
29

security. As many renewable resources are inherently variable, the level of performance requirements will be a concern for investors. Mitigating timing and performance requirements will decrease operating risk and thus decrease the cost of capital.
Contract Breakage PenaltyThere is power purchaser concern surrounding a project’s ability to break an existing contract to pursue another paying a higher price. This risk may be mitigated either through (1) explicit contract language forbidding such a termination or (2) some form of collateral or increased security (that is liquidated damages payments). As long as the payment performance under the original contract is being met, there should not be a need to pursue another contract. Overall, the financing market is comfortable with providing the buyer a reasonable level of security.
The third set of feed-in tariff characteristics (Table 5) are related to changes in the available tariff over time and include the approach to price adjustment, the timing of the price adjustments, and the magnitude of price adjustments.
Table 5: Feed-In Tariff Design Characteristics and Financing: Changes in Available Tariff Over Time
Characteristic Options Financing Preference
Price Adjustment Approach
No Adjustment
Fixed With Inflation
Degression
Indexed to Value
If degression required, it is subject to periodic adjustments based on current market conditions (supply & demand, capital cost, financing cost, etc.)
Price Adjustment Timing
Scheduled Reductions
Capacity-Dependent
Administrative Review
Administrative review
Price Adjustment Magnitude
Experience Curves
Uniform Steps
No preference, as long as periodic adjustment possible to assure sufficient revenue to support financing
Source: KEMA, Inc.
Price Adjustment Approach, Timing, and MagnitudeThe price adjustment approach in feed-in tariff design is critical to low-cost financing. Periodic adjustments, or “refresh” of rates based on market conditions
30

(equipment cost, financing cost, etc.) that maintain a sufficient rate of return are preferable.
Automatic reductions do not account for market conditions, and if underlying fundamentals have changed (that is turbine price increase due to demand), this could lead to a situation where the return for capital providers is insufficient to incent investment.57 Price adjustments taken out of the context of conditions faced by developers may create a barrier to financing. It is important for any adjustment policy to be extremely stable and transparent. Guidelines for timing of these adjustments, whether capacity-dependent or administrative review, need to be well-established so developers and investors can assess future risks caused by possible price changes. It is also important, however, that the price revision process not occur too frequently because revisions can cause developers to suspend development activity in advance of the new rates, and overly frequent revisions can create the perception of policy instability.58 Finally, there is no financing preference as to the magnitude of the price adjustment as long as the adjustment assures sufficient revenue to support financing.
Table 6 contains a summary of feed-in tariff design characteristics that should lead to the availability of lowest-cost capital for renewable energy projects. Please note these recommendations are made purely from a financing perspective. It is acknowledged that there may be inherent tensions between feed-in tariffs designed to optimized lowest-cost financing and feed-in tariffs designed to match the policy objectives of the state and of other stakeholders.
57 Recently, both Germany and Spain have instituted new conditional degression schedules, wherein the price decreases or increases based on annual market growth. If the market grows more than expected in a certain year, then the schedule will decrease by a preset amount. If the market grows less than expected in a certain year, then the price schedule will increase by a preset amount. See e.g. Jacobs, D. and C. Pfeiffer. May 2009. “Combining Tariff Payment and Market Growth.” PV Magazine. 20-24.58 Gross, R., P. Heptonstall, and W. Blyth. 2007. Investment in Electricity Generation: The Role of Costs, Incentives and Risks. London: Imperial College Centre for Energy Policy and Technology. Prepared for the Technology and Policy Assessment Function of the UK Energy Research Centre. “Expected Tariff Revisions in Germany Put a Six Month ‘Chill’ on Investment.”; see also Rutschmann, I. (July 2008). “The Paralyzed Market: Spain’s PV Industry Is Concerned About Deep Subsidy Cuts and Is Upset With Its Own Association.” PHOTON International, 44-49.
31

Table 6: Feed-In Tariff Design Recommendations Based on Financing
Characteristic Recommendation
Tariff StructureFixed revenue
(consider inflation indexing O&M portion)
Setting Price & Tariff Differentiation Cost-based
Contract Duration 20 years, accounting for fuel price risk where applicable
Counterparty (Cost Allocation) Credit-worthy counterparty; Not exposed to revision during term
What Is Being Sold Bundled energy & RECs
Operational Collateral or Security Must take; no minimum performance
Price Adjustment Approach Periodic market-based adjustment
Price Adjustment Timing Administrative review
Price Adjustment Magnitude No preference as long as revenue supports financing
Development Credit and Performance (Pre-Op) No credit or performance requirements
Quantity and Cost Limits No limits
Queuing To address caps & rate changes only
Contract Breakage Penalty Explicit contract language
Eligibility No preference
Source: KEMA, Inc.
32
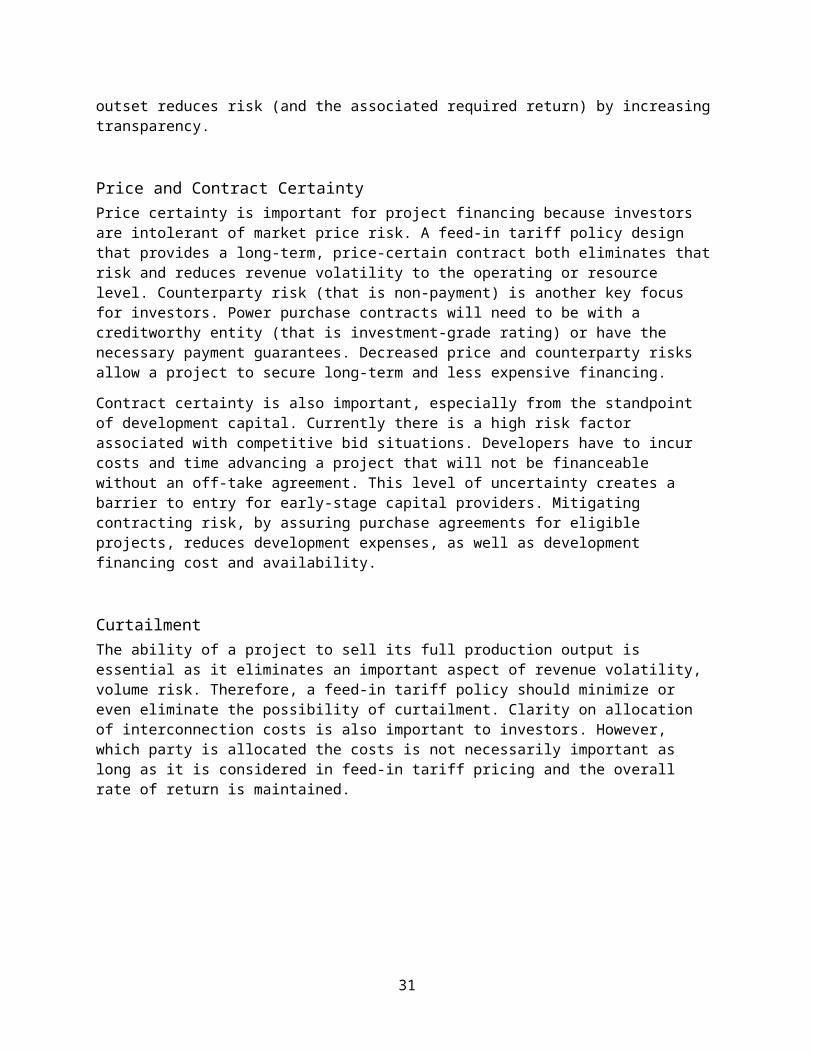
CHAPTER 3:Conceptual Design Issues for CREZ-BasedFeed-In TariffsThe Energy Commission 2007 IEPR noted that California is currently not on track to meet its goal of meeting 33 percent of its electricity needs from renewable energy sources by 2020.59 To date, the state has relied primarily on competitive utility solicitations and bilateral contracts to meet its Renewables Portfolio Standard (RPS)60 – a requirement placed on California’s investor-owned utilities, electric service providers, and community choice aggregators to supply at least 20 percent of retail electricity sales from renewable energy sources by 2010. The 2007 IEPR notes that the principal reasons for RPS failure to keep pace with these targets include insufficient transmission and complex administration.61
Although feed-in tariffs are being explored as a tool for accelerating market growth, stakeholders in both CPUC and Energy Commission feed-in tariff proceedings have raised concerns that feed-in tariffs will not address several significant barriers to renewable energy development in California. One such barrier is transmission constraints. Substantial renewable energy resource potential within California is in locations requiring new transmission in order to access this potential, and the Energy Commission has noted that “deliverability of electricity from eligible renewable energy resources to end users and any needed additions or upgrades to the transmission grid system” is one of the primary barriers to meeting California’s 33 percent renewable energy goal.62 California has been actively pursuing solutions to insufficient transmission infrastructure for renewable energy. Central among these activities, the Energy Commission, CPUC, California Independent System Operator (California ISO), and publicly owned utilities (POUs) created a new statewide interagency initiative, the California Renewable Energy Transmission Initiative (RETI). RETI seeks to assess 59 California Energy Commission. 2008. 2007 Integrated Energy Policy Report. CEC-100-2007-008-CMF. Sacramento, Calif. p. 101: “Increasing renewable energy to 20 percent of electricity sales by 2010 and 33 percent by 2020 is an essential part of reducing California’s greenhouse gas emissions. Renewables currently account for only 11 percent of electricity generation, a course that is not on track to meet RPS or AB 32 goals. Meeting the 33 percent goal in 2020 is feasible, but it will require significant changes in infrastructure and significant changes in program structure.”60 May 16, 2009, version of the IOU Contract Database (found at http://www.energy.ca.gov/portfolio/contracts_database.html) indicates that of 13,310 MW of signed contracts (based on maximum MW under contract), 8465 MW (63.6 percent) have originated via utility RPS solicitations, compared with 3434 MW (25.8 percent) through bilateral contracts, 1410 MW (10.6 percent) through interim procurements, and 1.5 MW through all source procurements.61 California Energy Commission. 2008. 2007 Integrated Energy Policy Report. CEC-100-2007-008-CMF. Sacramento, Calif. p. 5.62 California Energy Commission. 2008. 2007 Integrated Energy Policy Report. CEC-100-2007-008-CMF. Sacramento, Calif. p 109
33

Competitive Renewable Energy Zones (CREZs) in California and neighboring states, identify the zones that can be developed most cost-effectively and with the least environmental impact, identify top priority CREZs and conceptual transmission plans for those zones, and initiate permitting processes for projects identified in RETI transmission plans.63
Although feed-in tariffs are not a solution to transmission constraints, this chapter explores how feed-in tariff design can work in parallel with transmission planning and CREZ development. Specifically, the purpose of this chapter is to explore whether and how time-limited, cost-based, differentiated feed-in tariffs could be structured to expeditiously, efficiently, and effectively utilize transmission built to access CREZ resources. The chapter also explores the implications for allowing utilities to plan for the price paid, location and quantity of renewable energy generation, particularly where there is a balance of objectives at play. These objectives include fully utilizing transmission built to support CREZ renewables (and thus support the cost of the line) without oversubscribing the transmission line. This chapter does not attempt to explore or resolve all of the questions associated with the topic, but rather offers a starting point for consideration of feed-in tariffs in a CREZ-driven application.64
This chapter addresses the following topics:
Conceptual design issues for CREZ-based feed-in tariff. Illustration of CREZ-based feed-in tariff pricing and quantity issues.
Conceptual Design Issues for CREZ-Based Feed-In Tariff
As a starting point for CREZ-based feed-in tariff design, it is useful to review the other feed-in tariff designs that have recently been recommended during Energy Commission proceedings and the policy objectives. As previously discussed, the Energy Commission recommended a feed-in tariff design for generators under 20 MW that would be differentiated by technology and size, would include long-term contracts, and would set payment rates based on generation cost. The recommended feed-in tariff was developed to achieve a series of objectives articulated by the Energy Commission, including policy stability, transparency, simplicity, and revenue and contract certainty.65
The previous chapter explored feed-in tariff design characteristics that would attract the lowest-cost financing. The results were presented at the Energy
63 California Renewable Energy Transmission Initiative Mission Statement, September 17, 2007, < http://www.energy.ca.gov/reti/Mission_Statement.pdf>.64 The interaction between feed-in tariffs and efficient transmission and distribution planning, including the experience of European system operators with planning for feed-in tariffs, is also discussed in Grace , R., W. Rickerson, K. Corfee, K. Porter, and H. Cleijne. KEMA. May 2009. California Feed-In Tariff Design and Policy Options. California Energy Commission. CEC-300-2008-009F. Sacramento, Calif., pp. 73-75. 65 Grace, R., W. Rickerson, K. Corfee, K. Porter, and H. Cleijne. KEMA. May 2009. California Feed-In Tariff Design and Policy Options. California Energy Commission. CEC-300-2008-009F. Sacramento, Calif.
34

Commission’s May 28, 2009, Joint IEPR and Renewables Committee Workshop.66 The conceptual design identified in this presentation, which the authors will refer hereafter as the “lowest-cost financing design feed-in tariff” (LCFD feed-in tariff), closely matched the feed-in tariff design recommended to the Energy Commission for generation facilities 20 MW and under. The key characteristics of the LCFD feed-in tariff include:
Long-term (20 years, accounting for fuel price risk where applicable), fixed price, cost-based (including adequate return on capital) tariff for the sale of bundled energy and RECs, offered by a creditworthy counterparty (most likely the interconnecting utility).
Must-take, without preoperational or operating performance requirements or credit requirements (other than as needed to address queuing issues related to quantity caps and rate changes).
Price levels for future feed-in tariff contracts differentiated by technology and adjusted periodically to maintain a sufficient rate of return. Adjustments should be based on market conditions affecting the cost of generation.
In considering the interaction between feed-in tariffs and CREZ, this chapter builds off of the work of both the feed-in tariffs design recommendations developed for generation facilities 20 MW and under and for attracting the lowest-cost financing. However, in the context of feed-in tariffs targeting renewable energy located in a priority CREZ with proximity to a permitted transmission line (hereafter referred to as a ”CREZ-based feed-in tariff”), additional constraints come into play: The tariff would only be offered in a limited footprint (the CREZ) and would be subject to a maximum quantity of generation sought (that is the physical capacity limits of the transmission line). As such, CREZ-based feed-in tariff design needs to be measured against additional objectives, such as the need to utilize new transmission capacity efficiently, quickly, and at least societal cost.
The potential implementation of a CREZ-based feed-in tariff also raises design considerations that are distinct from those pertaining to the designs recommended for generation facilities under 20 MW and for lowest-cost financing. These include feed-in tariff timing, quantity, pricing (rates), and allocation of available transmission capacity among technologies and projects. Each of these issues is explored in greater detail in the sections below including an illustrative example of how they might interact.
66 Joint IEPR and Renewables Committee Workshop. May 28, 2009. "Exploring Feed-in Tariffs for Renewable Energy Projects over 20 Megawatts". Available online at: http://www.energy.ca.gov/2009_energypolicy/documents/index.html
35

Timing: Coordination Between Feed-In Tariffs and Transmission ExpansionRPS solicitations do not currently target specific CREZs nor do they take proposed CREZ transmission limits into account. To date, request for offers (RFOs) have not been timed to coincide in any way with the permitting or construction of transmission expansions or extensions required to access resources within a CREZ. Generation facilities located in areas without any, or without sufficient, transmission may respond to a utility RPS RFO, but if selected they are dependent on transmission expansion that may or may not be actively pursued in a reasonable time frame.
In contrast, a feed-in tariff can be implemented in such a manner as to coordinate timing with CREZ-related transmission facilities. An appealing approach would be to offer a CREZ-based feed-in tariff once such transmission is permitted and construction funding is committed, with the explicit objective of stimulating utilization of the transmission facilities, with feed-in tariff rates available once the transmission is commissioned.67 In this manner, development of the transmission and generation facilities can be set in motion in parallel, once the major transmission uncertainty – permitting – has been removed.
Under the current RPS RFOs, generation facilities have little incentive to invest in active development prior to being selected for and executing a contract, and would bear substantial risk in pursuing such investments prior to having a long-term contract. In contrast, under a feed-in tariff, developers are guaranteed a certain price under prenegotiated contract terms and thus have a shortened development cycle. In addition, because feed-in tariffs provide more flexible timing for developers than the periodic RFO solicitation cycle, and because far less risk is placed on developers under the LCFD feed-in tariff, a feed-in tariff can be expected to unleash a faster pace of development than under the RPS RFO process. Moreover, as stakeholders commented in the Energy Commission’s 2008 feed-in tariff workshop process,68 participation in the RPS solicitation process imposes material costs (bid preparation and development, contract negotiation, transaction costs, etc.) on bidders, which can be a barrier to entry. With development risk reduced (due to certainty surrounding tariff revenues, contract terms and conditions and transmission access), the authors would expect participation from a wider range of market participants than might participate in a utility RPS solicitation (that is not limited to those developers sufficiently capitalized and risk-tolerant to incur the costs and risks associated with the RPS solicitations). These might include parties that are more thinly capitalized and/or less sophisticated than the typical RFO respondent, or developers whose timing was not well-synchronized with the RFO cycle.
67 It may not be practical or desirable to place a purchase obligation in the interconnecting utility prior to commercial operation of the transmission facilities. This risk is likely to remain with the generators; however, once permitting and funding decisions are made, generation developers are far better able to assess the risk of completion than at earlier stages.68 Grace , R., W. Rickerson, K. Corfee, K. Porter, and H. Cleijne. KEMA. May 2009. California Feed-In Tariff Design and Policy Options. California Energy Commission. CEC-300-2008-009F. Sacramento, Calif. Appendices B, C, and D.
36
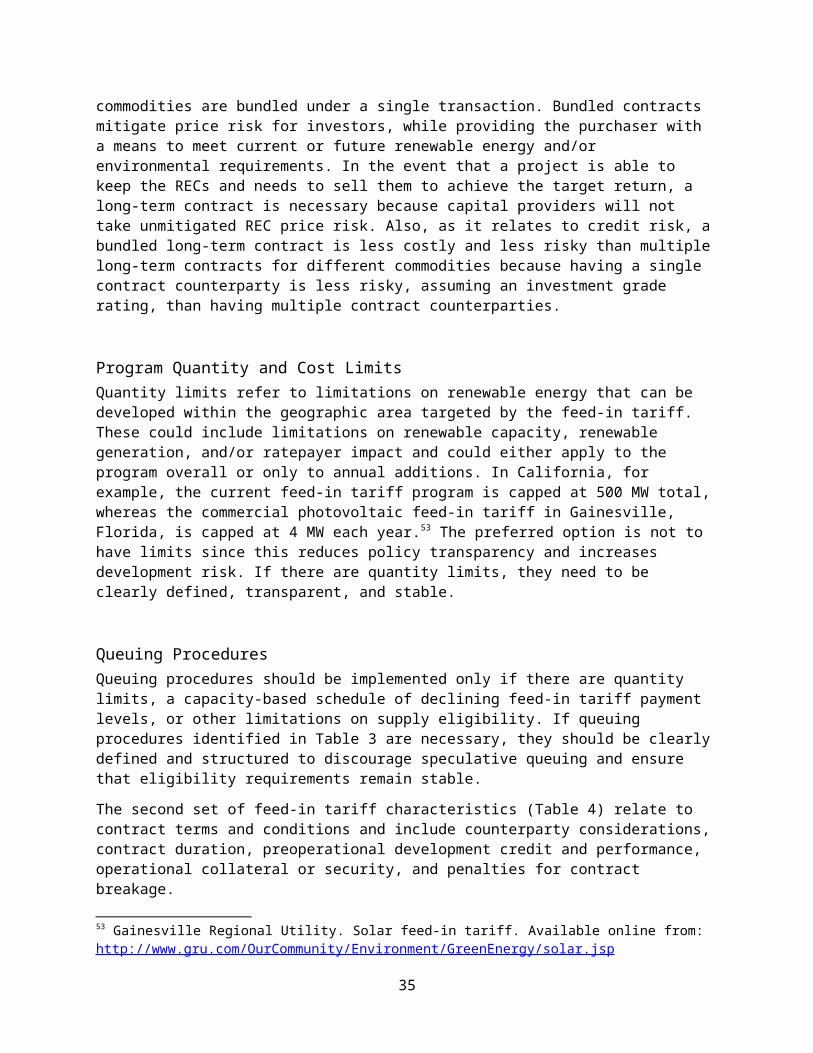
Quantity Issues Associated With CREZsOne aspect of the lack of targeting RPS RFOs to specific CREZ-related transmission is that the quantity of MW associated with contracts executed by the utilities could easily be envisioned to leave CREZ-related transmission undersubscribed. Even if a sufficient quantity of generation were placed under contract as a result of RPS RFOs to fully subscribe CREZ-related transmission, contract failures – which have been common to date69 – may still leave CREZ-related transmission undersubscribed. In any event, because the RFOs are not designed to match generation to the transfer capacity of a CREZ-related transmission line, it is highly unlikely that RFOs would result in a rapid filling of such transmission capacity.
Under a CREZ-based feed-in tariff, technology-specific rates (and perhaps size-related or resource-strength-related rates) could in theory be set with reference to data on resource potential embodied in a CREZ supply curve70 to yield quantities of capacity expected to fill (but not oversubscribe) the new CREZ-related transmission lines. An example of using supply curves to predict the quantity of renewables that will respond to a feed-in tariff within one or more CREZ is provided later in this chapter in Figure 1.
Because the transfer capacity of a CREZ-related transmission line is finite, there is a strong argument to limit the quantity of generation availing itself of the feed-in tariff. While one CREZ-based feed-in tariff design option would be to limit generation by the imposition of a quantity cap, imposing such a cap would increase developer risk by undermining guaranteed access to the feed-in tariff’s known revenue stream for those projects unable to come online well before the cap would be reached, thereby eroding somewhat an important part of the feed-in tariff’s expected benefit. Instead, the supply curves can, in theory, be utilized to predict the quantity of generation able to profitably respond to the feed-in tariff, guiding policy makers in setting tariff rates at a high enough level to attract the desired investment in generation but sufficiently low so as to avoid oversubscription of the transmission line. The actual level of the feed-in tariff rate would depend in part on whether the projects pay for the CREZ-related transmission or the transmission cost is supported broadly by ratepayers. Regardless, the feed-in tariff rate must not only cover the cost of generation, but also the generator’s share of the cost of the CREZ-related transmission upgrade. The use of supply curve data in this manner
69 The May 16, 2009, version of the IOU Contract Database (found at http://www.energy.ca.gov/portfolio/contracts_database.html) indicates that 33 percent of all IOU renewable energy contracts entered into since 2002, representing 19 percent of contracted MW and 21 percent of expected energy under contract, have either been cancelled or are classified as ”delayed/not on-line.” Additional delays for projects currently classified as ”on track/not on-line” could increase these figures.70 A supply curve is a representation of resource potential parameters of quantity and price, sorted from least to highest cost, or in the case of renewable energy, least to highest cost premium. Preliminary supply curves have been derived for CREZ-based renewable energy supply in the RETI Phase 1B process, as discussed further below. See, for instance, Black & Veatch, January 2009, Renewable Energy Transmission Initiative RETI Phase 1B – Economic Analysis of Competitive Renewable Energy Zones – Final Report, prepared for RETI Stakeholder Steering Committee.
37
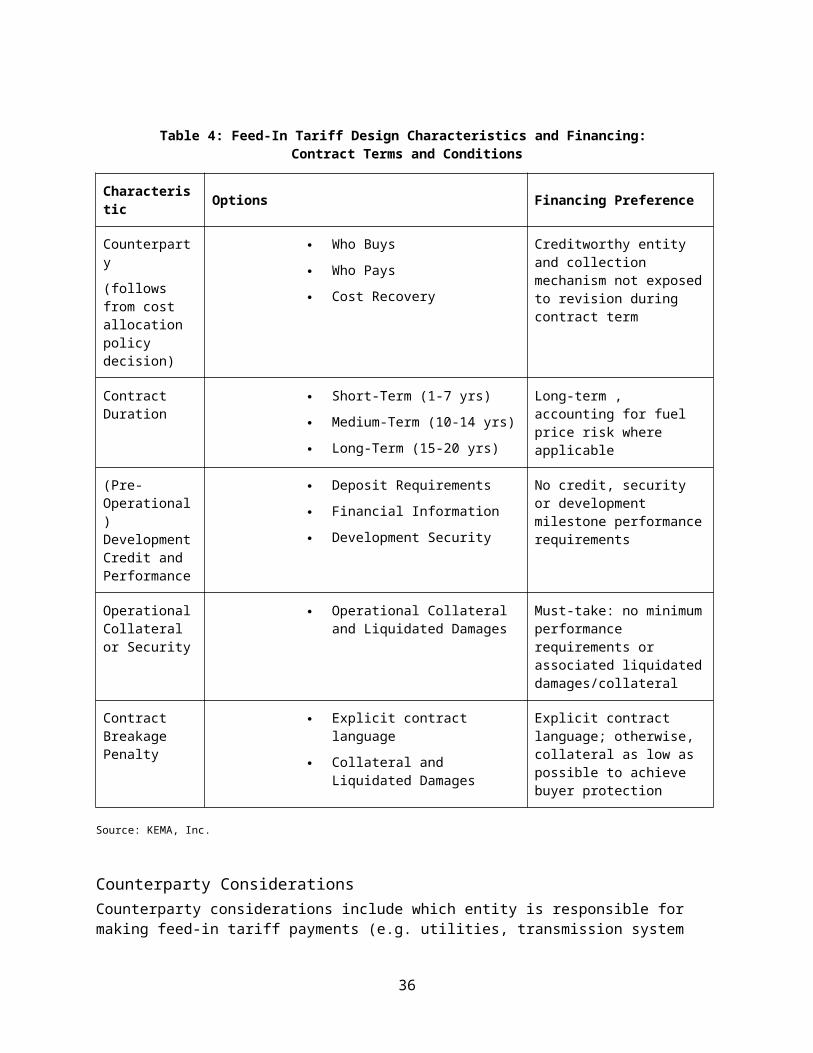
represents a conceptual framework, but care must be taken in applying these concepts in practice, as the level of precision with which these concepts could be accurately applied is proportional to one’s confidence in the underlying supply curve data.71 The less confidence one has in the supply curve data72, the more conservatively a feed-in tariff rate would have to be set to avoid oversubscription of the transmission lines. Due to the inherent uncertainty in the supply curves, if the initial feed-in tariff rate ultimately undersubscribes the line, it may be necessary to adjust the policy mechanism to more fully subscribe the line – that is by either increasing the feed-in tariff rate in concert with imposing a quantity cap, or retiring the feed-in tariff and creating a capacity-limited RFO.73
The authors are not aware of any feed-in tariff designs that are directly analogous to the use of a feed-in tariff to target a specific transmission zone, although there are also no counter-examples to demonstrate why it should not be done. In Europe, several countries, including Germany, Spain, and France, have created specific feed-in tariffs to specifically target a specific location and a specific technology. Under Germany’s feed-in tariff, offshore wind developers receive more generous incentives for developing in deeper waters and further from shore.74 China is beginning to employ a geographic approach to feed-in tariff development under which competitive bidding is used to establish feed-in tariff prices for a specific area. In June 2009, for example, a bid for USD 0.16 per kilowatt hour (kWh) for a 10 MW solar project in Dunhuang will likely be used to set the feed-in tariff for the city.75
71 Black & Veatch, January 2009, Renewable Energy Transmission Initiative RETI Phase 1B – Economic Analysis of Competitive Renewable Energy Zones – Final Report. RETI Stakeholder Steering Committee. See, for example, a discussion of the uncertainty underlying the RETI Phase 1B supply curves pp. 5-19 through 5-24. 72 The supply curves used herein were developed for a different purpose; it is an open question as to whether supply curves could be developed with enough precision to apply a feed-in tariff without a cap.73 Note that this discussion, for simplicity, presumes that feed-in tariffs would replace utility RFOs within the applicable CREZ. If utility RFOs were also open to generation in the CREZ concurrently, the interaction of these policies and recognition of their impact must be considered. 74 Bundesministerium für Umwelt Naturschutz und Reaktorsicherheit. (2008). 2009 EEG payment provisions: Payment provisions in the future EEG for the year 2009, as adopted by the German Bundestag Parliamentary Decision from June 6, 2008. Berlin.; Avia Aranda, F. (2007). Offshore Wind Energy in Spain. Proceedings of the European Offshore Wind Conference and Exhibition, Berlin, Germany. 75 New Energy Finance. June 25, 2009. “Chinese Consortium Wins Bid for Solar Project.” Available online from: http://www.newenergymatters.com/index.php?p=list&t=newsitems&id=32031.
38

Pricing/RatesThe RPS solicitation process, as typically applied, is designed to yield some level of price discrimination and has in fact yielded some differences in bids (some higher than others among those projects selected for contracting). However, the very existence of the Market Price Referent (MPR), and transparency of the method by which the MPR is calculated, has allowed some level of strategic bidding, in which lower-cost projects whose cost (including appropriate returns on investment) is below the MPR ultimately bid closer to the MPR.76 Even if the MPR were to be removed as an RFP pricing benchmark, the past strategic bidding behavior reinforces the authors’ expectation that the presence of publically available CREZ supply curves through the RETI process could likely yield strategic pricing in a competitive solicitation, with bids clustering around the supply curve’s indicated clearing price (where the supply curve intersects the transmission line capacity limit).
Setting the payment rate for a CREZ-based feed-in tariff differs somewhat from the typical feed-in tariff rate-setting exercise. In a traditional feed-in tariff, rates are set to yield a reasonable return on generation on a differentiated basis. While policy makers may decide to set a rate more aggressively77 (to support a broader range of generation facilities) or more conservatively (to support only the most cost-effective generation facilities) within a particular technology or size category, there is limited attention to selecting the price with a particular MW target in mind. In contrast, the exercise of setting CREZ-based feed-in tariff rates would involve setting rates for each technology just high enough to yield a reasonable return on enough generation in aggregate to subscribe the transmission line, without oversubscribing the line.
Policy choices would remain for how differentiated the tariffs might be (that is one per resource type, or also establish size and/or resource strength differentiation), as well as how aggressive or conservative to make the rate for each differentiated rate. Different feed-in tariff rate choices can achieve different combinations of technology/size/resource strength diversity and cost minimization objectives. And, as shown in the illustrative example below, if low-cost renewables are available, feed-in tariffs may be designed to yield generation at prices below the MPR.
76 See, for example: San Diego Gas & Electric 2007–2016 Long-Term Procurement Proceeding, Vol. 1, part 2, p. 211: “If natural gas prices rise, the MPR rises and the offers from renewable providers also tend to rise. Renewable developers tend to offer their projects at the costs avoided by the utility…” found at http://www.sdge.com/regulatory/documents/r-06-02-013/2007-2016SDGELTPPVolume1PUBLIC.pdf. Greg Morris of Green Power Institute also stated at the May 28, 2009 feed-in tariff workshop (transcript, p. 203, found at http://www.energy.ca.gov/2009_energypolicy/documents/2009-05-28_workshop/2009-05-28_TRANSCRIPT.PDF): "It's even worth mentioning that, on the one hand, while many of the utilities, for example, are proponents of the competitive process ... they themselves complained that because of the MPR, people are bidding to the MPR. So that's already interfering with the competitive process of an open bid for electric contracts."77 One reason to set prices aggressively is as a hedge against future carbon prices.
39

Allocation of Available Transmission Capacity Among TechnologiesBy design, RPS solicitations favor large (projects with scale economies), least-cost, best fit generation projects.78 As a result, RPS solicitations, to the extent they are able to fully subscribe a new CREZ-driven transmission expansion, will do so without any proscribed allocation among renewables; rather, the generation types that are best able to compete in the RPS solicitation will dominate.79 In contrast, if a CREZ-based feed-in tariff is specifically designed to fully subscribe such CREZ-driven transmission, the allocation of transmission capacity to different technologies will be a result of the feed-in tariff rate setting and design, based on underlying policy decision. The rationale for this outcome is described in the preceding sections on price and quantity and an example of alternative outcomes under different sets of policy objectives follows. The implication of utilizing differentiated feed-in tariffs is a greater diversity of project technology, size, and type of developer than might be expected under the RPS solicitation process.
Interaction of CREZ-Based Feed-In Tariff and RPS SolicitationsFor simplicity, the preceding discussion is laid out with the implicit understanding that a CREZ-based feed-in tariff and utility RPS solicitations are mutually exclusive. This is consistent with the assumption that once a feed-in tariff was established for particular CREZ-based transmission, then generation in the CREZ reliant on that transmission would be ineligible for subsequent RPS solicitations. However, the approaches need not be mutually exclusive. In fact, some contracts from past solicitations are with facilities located in CREZ that might later become subject to a CREZ-based feed-in tariff. If this were the case, such CREZ-based feed-in tariffs would need to take into account the presence of legacy RPS contracts in setting prices to target the remaining available transmission capacity after accounting for the prior RPS contracts.
If subsequent RPS solicitations did not treat facilities in CREZ subject to CREZ-based feed-in tariffs as ineligible, the interactions would be more complex. While some more costly technologies that may be unable to compete in the RPS solicitations would be unlikely to participate in the procurements (thus having no impact), some projects using technologies for which a feed-in tariff price might be 78 A description of the utility least-cost, best-feed-in tariff procedures can be found on the CPUC’s website at http://www.cpuc.ca.gov/PUC/energy/Renewables/procurement.htm. The investor-owned utilities as well as the LADWP utilize variations of this evaluation approach. For more information, see: PG&E at http://www.pge.com/b2b/energysupply/wholesaleelectricsuppliersolicitation/renewables2009/; SCE at http://www.sce.com/NR/rdonlyres/54FA54C2-3E1B-402D-9CBF-170B6ACD0BF9/0/20090629_RFP_Procurement_Protocol.pdf; SDG&E at http://www.sdge.com/documents/rfo/renewable2009/RFO.pdf; and LADWP: http://www.ladwp.com/ladwp/cms/ladwp006066.jsp. The procurement results reinforce the advantages that accrue to large projects in this process: "…the vast majority of responses to and contracts resulting from RPS solicitations have been from projects larger than 20 MW." Grace et al (2009) p.59. 79 May 16, 2009, version of the IOU Contract Database (found at http://www.energy.ca.gov/portfolio/contracts_database.html) indicates that signed IOU contracts are dominated by wind power (39.6%) and solar thermal (40.9%) installations, and for POUs, wind constitutes 73.6% of signed contracts.
40

below the level of successful RPS bids may gravitate toward the RPS solicitations. In doing so, the cost-minimizing benefits of the CREZ-based feed-in tariff (as illustrated in the following section) may be negated, and the ability to target the feed-in tariff price to elicit a quantity of generation sufficient to fill the transmission line without overcommitting it may be confounded. For these reasons, excluding generation within the applicable CREZ from future RPS solicitations may be preferable if a CREZ-based feed-in tariff is adopted.
Illustration of CREZ-Based Feed-In Tariff Pricing and Quantity Issues
In this section, the authors present a simplified example of a hypothetical CREZ-based feed-in tariff applied to a permitted transmission expansion in order to illustrate the implications of design choices discussed above. The example can also be used to contrast potential feed-in tariff outcomes with RPS solicitation-driven outcomes. The example is based loosely on supply curve data from the RETI Phase 1B study80 in order to assure that the data is fundamentally realistic. However, the supply available in several CREZ areas was combined for this analysis.81
Figure 1 shows the illustrative supply curve in aggregate (that is, all generation types shown together in one curve regardless of type), in two formats. The dashed line labeled ”Total G&T Cost”82 represents the total cost in dollars per MWh, including the cost of transmission; it represents the bundled energy plus REC value. The solid line labeled ”Cost Premium” represents the same generation and transmission cost as represented in the dashed line, less the market value of electricity as represented by the MPR. As such, it is the cost premium, or the cost to create a REC. Note that the solid line starts below zero on the vertical axis, representing the presence of some generation that requires no premium above the MRP. In this example, the authors consider a transmission extension to reach the CREZ areas capable of carrying 4,000 MW.83 This maximum demand is represented by the vertical line that includes points A and C.
Figure 1: CREZ Aggregate Supply Curve Illustration
80 Black & Veatch, January 2009, Renewable Energy Transmission Initiative RETI Phase 1B – Economic Analysis of Competitive Renewable Energy Zones – Final Report, prepared for RETI Stakeholder Steering Committee. The data was provided to the authors in spreadsheet form corresponding to the data used in the Phase 1B study.81 For purposes of the example, the authors assumed that generation is allocated the cost of the necessary transmission expansion, and therefore, the level of feed-in tariff payments must support both generation and transmission costs including revenue sufficient to provide investors with the necessary return on investment. However, in doing so the authors are not taking any position on transmission cost allocation.82 G&T stands for generation and transmission.83 For purposes of this example, the authors assume that all generation peaks production at the same time. In practice, there may be some diversity of generation which allows the sum of non-coincident peak production of all generators at various times to exceed the sum of coincident peak generation.
41

Source: Sustainable Energy Advantage, LLC
Several observations can be made with respect to Figure 1. Points A and C represent the prices necessary to clear the market, that is to yield enough generation to fully utilize the 4000 MW transmission limit. Point C shows the bundled price necessary to clear the market; Point A shows the clearing price premium, the intersection of supply and demand on the premium supply curve. The intersection at Point A corresponds to a price of about $26, corresponding to Point B on the vertical axis. As discussed above84, experience suggests that in the presence of publicly available price data (in California’s case, the RETI supply curves), the resulting bids from an RPS solicitation may cluster near this value. Note also that at Point E, the premium supply curve crosses the line indicating zero premium. This means that in this example, roughly 1600 MW of supply (represented by Point E) may be available at less than or equal to the MPR; put another way, this quantity of generation may be capable of attracting investment if
84. See, for example: San Diego Gas & Electric 2007–2016 Long-Term Procurement Proceeding, Vol. 1, part 2, p. 211: “If natural gas prices rise, the MPR rises and the offers from renewable providers also tend to rise. Renewable developers tend to offer their projects at the costs avoided by the utility…” found at http://www.sdge.com/regulatory/documents/r-06-02-013/2007-2016SDGELTPPVolume1PUBLIC.pdf. Greg Morris of Green Power Institute also stated at the May 28, 2009, feed-in tariff workshop (transcript, p. 203, found at http://www.energy.ca.gov/2009_energypolicy/documents/2009-05-28_workshop/2009-05-28_TRANSCRIPT.PDF): "It's even worth mentioning that, on the one hand, while many of the utilities, for example, are proponents of the competitive process ... they themselves complained that because of the MPR, people are bidding to the MPR. So that's already interfering with the competitive process of an open bid for electric contracts."
42

paid the revenue associated with the supply curve, requiring no premium over the MPR.
Figure 2 and Table 7 should be considered together. Figure 2 represents the same premium supply curve shown in Figure 1, broken up into four technology-specific supply curves, one each for biomass, geothermal, concentrating solar thermal power (CSP), and wind. The horizontal line intersecting the vertical axis at Point PE
represents the same price as point B in Figure 1 (that is $26/MWh).
Figure 2: Technology-Specific Supply Curves and Feed-In Tariff Implications
Source: Sustainable Energy Advantage, LLC
PE in this case stands for ”equal premium,” and represents the setting of feed-in tariff rates at an equivalent level to that which would approximately fill the transmission line based on the aggregate supply curve shown in Figure 1. In other words, a competitive solicitation that procured enough supply from the supply curve to yield about 4000 MW would have to pay up to a premium of $26 per MWh over MPR. The quantities expected from each type of renewable energy generation are indicated by the intersection the selected price premium with the applicable technology-specific supply curve. The predicted quantities expected from each type of renewable energy generation associated with a $26/MWh premium are shown as the three stars ( ) in Figure 2. The top portion of Table 7 (Equal Premium) shows the predicted quantity (in MW) from each type of renewable energy generation in this situation. The equivalent result could be expected from establishing differentiated feed-in tariffs for the purchase of energy plus RECs at a level
43

sufficient to cover the full generation and associated transmission cost. In this illustration, the feed-in tariff rate would be set equal to the figures in the row labeled ”FIT Rate (G&T Cost),” corresponding in each case to a $26/MWh premium over MPR.85 It can be seen that the entire biomass supply curve is above the $26/MWh premium, so no biomass is predicted in this scenario. However, 1800 MW of CSP, 1400 MW of geothermal, and 850 MW of wind86 would be expected to be supported at feed-in tariffs set at the indicated levels. This represents one potential policy choice in setting feed-in tariffs. Table 7 shows two other alternative groups of feed-in tariff rates, indicated as “Diversified” and “Cost Minimizing.”
85 The differences between these feed-in tariff rates correspond with the different production-weighted values of MPR for generators with different production profiles.86 In these examples, the totals add to approximately 4000 MW; figures are rounded for purposes of the illustration.
44

Table 7: Alternative Feed-In Tariff Pricing Designs and Implications
PE
"Equal Premium" Solar Geo Bio Wind Total
Premium ($/MWh) 26.00$ 26.00$ 26.00$ 26.00$
FIT Rate (G&T Cost) ($/MWh) 183.00$ 101.00$ -$ 137.00$
Expected MW 1,800 1,400 - 850 4,050
"Diversified" Solar Geo Bio Wind Total
Premium ($/MWh) $25.00 (11.00)$ 56.00$ 34.00$
FIT Rate (G&T Cost) ($/MWh) $182.00 101.00$ 171.00$ 143.00$
Expected MW 1,400 1,400 70 1,030 3,900
"Cost Minimizing" Solar Geo BioWind c.f. > 31%
Wind c.f. < 31% Total
Premium ($/MWh) 26.00$ (11.00)$ -$ 17.00$ 23.00$
FIT Rate (G&T Cost) ($/MWh) 183.00$ 101.00$ -$ 125.00$ 137.00$
Expected MW 1,800 1,400 - 630 210 4,040
Source: KEMA, Inc.
If policy makers selected alternative priorities, they could establish different feed-in tariff rates to fill the transmission line with different supply mixes with different costs. For example, a more diversified approach intended to yield some biomass might increase the feed-in tariff for biomass and could at the same time reduce the feed-in tariff for geothermal while still yielding the same expected quantity of geothermal supply. A hypothetical “diversified” feed-in tariff case is shown in the middle portion of Table 7, with intersections indicated by the lightning bolts ( ) in Figure 2. A third feed-in tariff example is provided, whose objective would be cost minimization. The feed-in tariff rates for this example are shown in the bottom portion of Table 7, with supply curve intersections indicated by the dashed circles (
) in Figure 2. In the “Cost Minimization” example, no feed-in tariff rate is set for biomass, and the wind rate is differentiated (in this case by capacity factor), with lower cost generation receiving a lower price. Here it can be seen that 1400 MW of geothermal is expected for well below the MPR, while 630 MW of wind can be secured at the $17/MWh rate and another 210 MW at the $23/MWh rate.
These hypothetical examples illustrate the levers available to policy makers to establish feed-in tariff rates serving multiple objectives, including seeking specific quantities of supply, achieving technology diversity, and minimizing ratepayer cost. One important caveat, however, is that the effective implementation of such feed-in tariffs, and in particular the precision with which quantities that would be
45

built under a specific feed-in tariff rate can be predicted, is heavily dependent on the level of confidence one has in the supply curve data.87 RETI Phase 1B supply curves are preliminary and general in nature and, for the most part, utilize source data that is dated by at least a year if not more. In any event, uncertainty can be addressed through either additional research and analysis or using supply curve data with an appropriate margin for error.
87 In general, in the absence of quantity limits, this process differs from the manner in which feed-in tariff rates have been developed elsewhere. However, when setting a cap, supply curves can sometimes be used. For example, the Netherlands uses supply curves to determine appropriate feed-in tariff cap levels by technology and for the overall feed-in tariff program. (See KEMA, Inc. 2009. HECO Feed-In Tariff Program Plan. Prepared for Hawaiian Electric Company, Inc., Maui Electric Company, Limited and Hawaii Electric Light Company, Inc. December 23, 2008. P. 72: “Using supply curves, production can be projected for the different technology categories. By establishing a ceiling on the production volumes by technology, a maximum budget is set for each feed-in tariff category and for the complete feed-in tariff system.”)
46

CHAPTER 4:Data Requirements for Cost-Based Feed-In Tariff Price SettingThe Energy Commission has recommended a feed-in tariff based on the generation costs of specific technologies.88 This approach is based on successful European policy models and has recently been highlighted by the National Renewable Energy Laboratory as a best practice.89
It is not clear whether states can set feed-in tariff prices based on cost.90 However, data used to set cost-based feed-in tariffs can also be used to assess whether other types of feed-in tariffs are likely to be successful.
Countries with cost-based feed-in tariffs differ in the process used to gather cost-of-generation data, the process through which rates are calculated, the degree to which stakeholders can participate in the rate-setting process, and the quantitative method used to determine the appropriate feed-in tariff rate.
The purpose of this chapter is to compare the inputs utilized in European cost-setting models with the data that is currently available within California. This chapter discusses the following topics:
The Netherlands feed-in tariff rate setting. German feed-in tariff rate setting. French feed-in tariff rate setting. Gainesville, Florida, feed-in tariff rate setting. California renewable energy cost of generation update study.
88 California Energy Commission. 2008. 2007 Integrated Energy Policy Report. CEC-100-2007-008-CMF. Sacramento, Calif. p. 29.89 Couture, T. and K. Cory. 2009. State Clean Energy Policies Analysis (SCEPA) Project: An Analysis of Renewable Energy Feed-In Tariffs in the United States. National Renewable Energy Laboratory. NREL/TP-6A2-45551. Golden, Colo. 90 The CPUC is exploring whether the federal government has preempted legal authority to set cost-based feed-in tariffs. See CPUC Rulemaking 08-08-009.
47

The Netherlands: Feed-In Tariff Rate Setting
Feed-In Tariff OverviewThe original Dutch feed-in tariff, which was established in 2003, was a 10-year premium rate that was paid on top of the market price for power. The system was abandoned in August 2006,91 and a new system was introduced in October 2007. The 2007 feed-in tariff92 employs a unique approach to feed-in tariff rate setting. As can be seen in Figure 3 below, unlike in Germany, where generators receive the full feed-in tariff payment, generators in the
Figure 3: SDE Premium System in the Netherlands
Long-term average electricity price (estimation)
If market prices fall below a given floor(represented by the red line), no additional feed-in tariff premium will be paid to the generator
Basic amount: average cost price for the RE-option.
Feed-in tariff amount; isthe difference betweenthe basic and the adjust-ment amount (represented by blue bars)
Basic electricity/gas price: estimated minimum price that will be realized at the market the next few years; this is determined by the Ministry of Economic Affairs.
When market price rises above basic amount, the renewable generator receives market price (green bars represent an extra profit for the generator).
Adjustment amount: the basicelectricity/gas price that is paid at the market, corrected for severalother factors that have an impact on this price.
Source: KEMA, Inc.
Netherlands sell their power at the market price (represented by the orange line) and receive only the difference between the market price and the feed-in tariff rate 91 The original feed-in tariff, Environmental Quality Electricity Production, also known as the “MEP premium” (which stands for “Milieukwaliteit Elektriciteitsproduktie”), was abolished in August 2006. It was abolished mainly because the total subsidy budget was unlimited and that the subsidy amount was independent of the electricity price –resulting in overpayment to generators when electricity price was high, and rendering projects financially unfeasible when electricity price was low. Additionally, it was judged by the previous Minister for Economic Affairs that the EU-approved target for the Netherlands of 9 percent renewable power consumed by 2010 would be met anyway. In 2007, a new and improved feed-in tariff was established, the Stimulering Duurzame Energieproductie, or SDE, to support future policy target.92 The 2007 feed-in tariff is called the Sustainable Energy Production Stimulus (Stimuleringsregeling Duurzame Energieproductie or SDE)
48

as an incentive (represented by the blue bars). If the market price rises above the basic amount rate (that is the average cost price for a RE-option), then the generator receives the full market price, with no feed-in tariff premium (green bars). The Dutch feed-in tariff also includes a payment cap. If market prices fall below a given floor, represented by the red line (in this case, approximately 0.45 €/MWh), no additional feed-in tariff premium will be paid to the generator (represented by the red bars).
Unlike other countries, the Dutch feed-in tariff is limited by a budget that is set for each technology. In 2009, the budget was €2.5 billion,93 of which €1.5 billion was allocated for wind energy specifically. The budget is distributed on a first-come, first-served basis, which can create uncertainty regarding access to the tariffs as the budget limit is approached.
Technology Differentiation The Dutch feed-in tariff rates are differentiated primarily by technology, as can be seen in Appendix A. Some of the technologies, such as onshore wind,94 are not differentiated, whereas others, such as solar, hydropower, and biomass combustion, are differentiated by size (e.g. capacity). Biomass sources are also differentiated by fuel type (e.g. liquid, solid, and manure), efficiency, and/or by conversion technology (e.g. combustion or digestion). Uniquely, the Dutch feed-in tariff system also encourages the use of renewable gas from anaerobic digestion to directly displace natural gas. In this case, renewable gas generators are paid a premium on a €/cubic foot basis.
Key Inputs and AssumptionsDutch feed-in tariff rates are determined through a public stakeholder process that uses an open source spreadsheet. The key input parameters for the spreadsheet are contained in Table 8 below. The table uses onshore wind as an illustrative case, but the other tables utilize fairly similar inputs, including systems size, investment cost, operating costs, tax rate, and basic financing assumptions such as the cost of capital.
Financial GapUnder the Environmental Quality Electricity Production (MEP) system (which ended in 2006), a key objective of the tariff setting process was to determine the “financial gap.” The financial gap is the difference between the required electricity price for a profitable project and the assumed cost of generation. The financial gap was calculated for each technology, using a cash-flow analysis that took into account a large set of technology-specific factors. Using a net-present value approach, with a fixed required return on equity, the required revenues from
93 This budget excludes funds for offshore wind energy development. 94 Note that, unlike California, the Netherlands has little remaining opportunity for large wind farms, and hence there is relatively little value in differentiating feed-in tariffs for onshore wind.
49

electricity were calculated. For each category, the financial gap is calculated, and a sensitivity analysis is performed. 95
With the new Sustainable Energy Production Stimulus (SDE) scheme the financial gap is no longer an output of the study but only the total tariff (refer to Table 8). The e-price is only important to determine the subsidies paid to generators (estimated beforehand and paid afterwards). 96
Table 8: Sample Fact Sheet for the Onshore Wind Category in the Netherlands
INPUT PARAMETERS Value UnitUnit size 15,00097 kWeOperational time/ Full load hours 2,200 Hours/YearEconomic life 15 Year
Investment costs 1,32598 Euro/kWeMaintenance costs fixed 25 Euro/kWeMaintenance costs variable 0.011 Euro/kWe Energy Investment Deduction applies? Yes Energy Investment Deduction 44% Energy Investment Deduction max 48,840 EuroPart of the investment that applies for Energy Investment Deduction 85% Inflation 2%Return on debt 5% Required return on equity 15% Equity share incl. Energy Investment Deduction effect 20% Debt share incl. Energy Investment Deduction effect 80% Corporate (profit) tax 25.5% Loan duration 15 YearDepreciation period 15 YearPolicy period 15 YearOUTPUTS Value UnitProduction costs99 9.1 Eurocent/kWhTransaction costs 0.09 Eurocent/kWhBasic price premium 0.15 Eurocent/kWh
95 For each feed-in tariff rate, a partial sensitivity analysis is conducted for key inputs, and a spider diagram is produced. For biogas, for example, sensitivity analyses are conducted for the prices of manure, co-substrate, and digestate, as well as for interest rates. 96 The full Dutch spreadsheets are available online at: http://www.ecn.nl/nl/units/ps/themas/hernieuwbare-energie/projecten/sde/sde-2010/97 As reference-installation a hypothetical 15 MW park is taken.98 Investment costs = turbine price (incl. transportation, construction, cranes: 900-1,500 €/kW) + extra costs (foundation, connection, etc: a certain percentage)99 Production Costs =100*(equity share - NCW net income)/ discounted electricity profit
50

Basic amount 9.4 Eurocent/kWh
Source: KEMA, Inc.
Data Collection and Stakeholder Consultation Process In the Netherlands, data is initially gathered through an independent research effort managed by a non-profit organization (the Energy Centre of the Netherlands, ECN) and an independent consulting company (KEMA). In this phase, as much information as possible is collected based on publicly available data, market surveys, and international references. This information is compiled in a draft report, which gives an overview of the assumptions and the derived cost of renewable electricity. The cost calculation is performed using a public domain cash flow model, which is available to all the stakeholders, enabling them to check the calculations.
In the consultation phase, reactions to the report are actively sought on the technical-economic and financial parameters of the model. Stakeholders are asked to comment and send information. This information is required to be based on actual data such as contracts, quotations, fuel price references, etc. If needed, more information can be exchanged in meetings or workshops. The consultation focuses on the basic research assumptions, rather than the calculation assumptions used by the consultant.
Based on the draft report and information collected during consultation, an advice notice is formulated, which is then sent to the government (the Ministry of Economic Affairs). In response to stakeholder feedback, a consultation-response document is prepared, which systematically addresses how each identified concern was considered. The Ministry makes a final feed-in tariff or feed-in premium (FIP) proposal, which is then considered for legislation by the Parliament.
Figure 4: Tariff Setting in the Netherlands
Proposes FIP tariffECN
Ministry of Economic
Affairs
Advises on FIP tariff
Producers of Renewable Electricity
Parliament
Consultation Can set tariff by law
Source: KEMA, Inc.
Advantages and Disadvantages of the Dutch Feed-In Tariff System
Advantages The original Dutch feed-in tariff established a fixed premium amount for 10
years; even though the electricity price increased in the meantime. This resulted in very high costs for the government and “windfall profits” for the producers. An advantage of the new SDE system is that the real electricity
51
price is taken into consideration: If the electricity price increases (adjustment amount), less subsidy is provided.
Disadvantages However, the process of setting renewable energy tariffs is quite lengthy
and data-intensive. The process can take up to six months. The quality and reliability of the cost data gathered are crucial. Tariffs set at the right level are needed to make a feed-in premium or tariff both efficient and effective. If the tariffs are set too low, the deployment rate of renewables will remain too low, but if the tariffs are set too high, society will pay a high price for renewable development, and energy developers will receive excess payments.
The effectiveness of this approach in maintaining budget limits is highly dependent on how accurate the production volume can be estimated for the different feed-in tariff categories. For highly developed and homogeneous technologies, accuracy is typically quite high. For heterogeneous technology categories such as biomass, or for emerging technologies that contain high development risk, the accuracy level can be lower.
Germany: Feed-In Tariff Rate Setting
Feed-In Tariff OverviewAs described in earlier Energy Commission consultant reports, Germany has used feed-in tariffs to support renewable energy since 1991.100 The German feed-in tariff has evolved from a technology-neutral payment that was pegged to the retail price of electricity to a highly differentiated, technology-specific system of incentives based on generation cost. The current German feed-in tariff is a 20-year,101 fixed-price payment. The German feed-in tariff includes a schedule of “degression,” under which payments decline over time such that a generator that comes on-line in 2010 would get a lower payment than a generator that comes on-line in 2009. The feed-in tariff system is also reviewed once every four years to evaluate the accuracy of the payment levels and the appropriateness of the rate decrease schedule. In 2008, the feed-in tariffs were revised and implemented in 2009. The next revision will be January 1, 2013.
Tariff DegressionThe tariffs for electricity from renewable energy sources are reduced annually. Depending on the type of technology, the feed-in tariffs for new installations decrease by 1 percent for small hydro plants and by up to 10 percent for PV systems. In this way, cost reductions due to the experience curve effect are 100 Grace, Robert, W. Rickerson, K. Corfee, K. Porter, and H. Cleijne. KEMA. May 2009, California Feed‐In Tariff Design and Policy Options. California Energy Commission. CEC-300-2008-009F. Sacramento, Calif.101 The exception to this is hydropower, which can have a contract of up to 30 years.
52

included in the policy, and a continuous incentive is offered for efficiency improvements and cost reductions for new plants (Bundesministerium für Umwelt, Naturschutz und Reaktorsicherheit, 2004).
Setting a degression rate is a measure to encourage technology learning, leading to a lower burden on the electricity consumer. It has some advantages and disadvantages as follows in Table 9.
Table 9: Designing a Feed-In Tariff With Degression
Advantages Disadvantages
Incentive for technological improvement Investment security due to long term price
signal Transparency Incentives to build early because the level
of remuneration decreases along with the plant prices
Lower burden on electricity consumers
If the degression rate is set for a long period, the system is not very flexible to respond to technology price changes due to structural changes.
Mature technologies may not be able to drive down costs
Source: KEMA, Inc.
It is difficult to set an appropriate degression rate due to the difficulties in predicting technological learning, which is, for example, related to the cumulative amount of installed capacity.
Technology DifferentiationThe German feed-in tariff is highly differentiated, and individual tariffs are included in Appendix B. There are distinct rates for hydropower, biomass, landfill and wastewater treatment plant digester gas, geothermal energy, onshore wind energy, offshore wind energy, and photovoltaics. Almost all of the technologies are further differentiated by size, and some are further differentiated by application type (e.g. ground-mounted vs. roof-mounted PV). Similar to France, wind under the German feed-in tariff is differentiated by resource quality. The feed-in tariff law defines a national average “reference” wind turbine against which project performance is benchmarked. All wind generators receive the same fixed price during the initial five years of operation. After five years, the feed-in tariff payment level is adjusted according to its performance vis-à-vis the reference turbine. If the wind turbine output is at least 150 percent of the reference turbine’s yield, the tariff level is reduced for the remaining 15 years of the policy. For each 0.75 percent that actual generation is below 150 percent of the reference turbine’s yield, the initial (that is higher) payment level is extended for two months. A similar differentiation strategy is used to encourage offshore wind development in deeper water and farther from the coast. In addition to differentiating according to generation cost, the German feed-in tariff also employs bonus payments to encourage certain types of fuel usage (e.g. agricultural waste) and innovative conversion technologies (e.g. Stirling engines and organic Rankine cycles).
53

Key Inputs and AssumptionsThe German feed-in tariff rates are estimated by taking into account the investment costs and operating costs of each technology. A model with representative values is developed for each generation type, based on data from commercially available technologies.102
The capital investment costs include all costs that are needed for a complete operational facility, including costs for planning, approval, construction interest, and more. This comprises investment costs for:
Engineering Electrical and control systems Architecture (building, outer layers, etc.) Grid connection (including grid connection transformers, water supply, etc.) Consulting, planning, obtaining permitting, construction, and commissioning Financing, including interest during the construction period
The operating costs for renewable energy installations are mostly determined by:
Fuel costs for biomass, mine gas, landfill and wastewater treatment plant gas
Costs of maintenance (maintenance and repairs) Personnel costs for the technical management Cost of insurance, management, and leasing Other variable costs for equipment (e.g., additional water, lubricant, means
for water purification, etc.), waste disposal, etc.
The operating cost for each technology is calculated as an average over the life span of the applications. Although individual operating experience might differ, the effect is usually not sufficiently quantifiable, and therefore, such differences are excluded from the calculation. The exception to this is for wind, where there is a sharp increase in maintenance costs that occur as a result of equipment replacements (e.g. blades, etc.) in the second half of the project life.103
Financial GapThe cost of electricity is determined using the annuity method in which upfront costs and recurring operating costs are converted into equivalent constant
102 Vorbereitung und Begleitung bei der Erstellung eines Erfahrungsberichts gemäß § 20 EEG Forschungsbericht, November 2007103 Vorbereitung und Begleitung bei der Erstellung eines Erfahrungsberichts gemäß § 20 EEG Forschungsbericht, November 2007; personal communication with Maike Schmidt, Zentrum für Sonnenenergie- und Wasserstoff-Forschung.
54

payments per period. In the case of wind power however, a net present value calculation is used in order to enable a more flexible accounting of the highly variable cash flows. All costs are initially determined on the basis of real costs.
Appendix B provides a summary of the input parameters used to estimate the feed-in tariff payments for the various renewable energy resources.
Data Collection and Stakeholder Consultation ProcessIn Germany, the Ministry of Environment104 is required to draft an evaluation report every four years. This report is written by a project group, headed by the Center for Solar Energy and Hydrogen Research 105 as shown in the figure below. The last feed-in tariff evaluation report was drafted at the end of 2007 in Germany.106 The report assesses generation costs for new projects. Generators are obliged to provide relevant information to help determine the costs, while other stakeholder involvement is limited to comments.
Once the evaluation report is filed, the Parliament decides whether to modify the tariffs further. Just as in the Netherlands, stakeholder organizations in Germany can share their views with the Parliament. The German Parliament decided in June 2008 to pass the proposal with several amendments, such as increasing the wind payment level.
104 The Bundesministerium für Umwelt, Naturschutz und Reaktorsicherheit, or BMU.105 Zentrum für Sonnenenergie und Wasserstoff-Forschung, or ZSW.106 Bundesministerium für Umwelt Naturschutz und Reaktorsicherheit. (2007). Erfahrungsbericht 2007 zum Erneuerbaren-Energien-Gesetz (EEG). Berlin, Germany.
55

Figure 5: Tariff Setting in Germany
Source: KEMA, Inc.
Advantages and Disadvantages of the German Feed-In Tariff System
Advantages Setting a degression rate puts downward pressure on prices, encourages
innovation, and decreases the burden on ratepayers. The transparent degression schedule increases investor security and puts a premium on rapid renewable energy development.
The advantage of the wind resource differentiation is that a geographically diverse range of wind turbines can be developed, the risk of oversubsidizing turbines in good wind regimes is minimized, and producer profit is kept at a moderate level.
Disadvantages A disadvantage of the degression system is that it cannot flexibly respond to
dramatic technology price changes. Additionally, it is difficult to set an appropriate degression rate due to the difficulties in predicting experience curves.
The disadvantage of the size differentiation is that it can lead to high administrative complexity and can also lead to gaming. If the tariffs for low-capacity plants are significantly higher than those for larger plants, for example, it might be economically feasible for developers to construct two small plants instead of one large one, even though larger plants may be more efficient due to economies of scale.
The disadvantage of paying a higher feed-in tariff rate for lower quality wind resources is that it can increase the cost of a feed-in tariff program. If the lowest cost to ratepayers is the most important goal, then the incentives should benefit the highest resource potential.
56
Advises on FIT tariffZSW BMU Parliament
Evaluates and proposes FIT tariff Determines FIT tariff

France: Feed-In Tariff Rate Setting
Feed-In Tariff OverviewThe French feed-in tariff is based on generation cost and uses a flat, fixed rate, similar to Germany’s, with contract lengths that range from 15 to 20 years.107 The original feed-in tariff, which was introduced in 2001, limited the size of wind projects to 12 MW. Under a 2006 revision, however, this size restriction was lifted for systems in designated wind energy development zones. The 2006 revision also raised the base rate for photovoltaic systems from €0.15/kWh to €0.30/kWh, and created a €0.25/kWh adder for building-integrated systems. In 2008, the French government announced a €0.45/kWh rate for building-integrated commercial systems, and is currently considering specific rates for standard roof-mounted systems as well.108 The feed-in tariffs will be subject to a review process in 2012.109
Technology DifferentiationAs with the Netherlands and Germany, the French feed-in tariff is highly differentiated by technology. As can be seen in Appendix C, there are distinct rates for geothermal, PV, hydropower, wind, biogas, waste to energy, and biomass. As described above, PV is further differentiated by application. Biogas is differentiated by size, and there are adders for on-farm fuel and for efficiency. Wind energy is differentiated by wind resource such that each generator receives the same payment for the first 10 years and an adjusted payment for the remaining five years based on the wind resource quality. Similar to the wind tariff in Germany, generators with better wind resources receive lower payments. Finally, the French feed-in tariff includes geographic differentiation in that there are different wind and PV rates for systems on the mainland and systems built in off-shore French territories.
107 20 for hydropower and PV, 15 for wind, biomass, and geothermal, and 12 for combined heat and power. 108 There are indications that the French government is currently considering a 20 year PV incentive of between 40 and 45 euro cents per kWh for non-BIPV commercial systems, set across three irradiation zones on the mainland, with a separate tariff for off-shore French territories. See Hirshman, W.P. 2009. “France May Fix Problems with Intermediate PV Feed-in Tariff.” PHOTON International. p. 56.109 Gipe, P. July 26, 2006. “France Implements New Renewable Tariffs for Solar, Wind, and Biogas.” Available online at: http://www.wind-works.org/
57
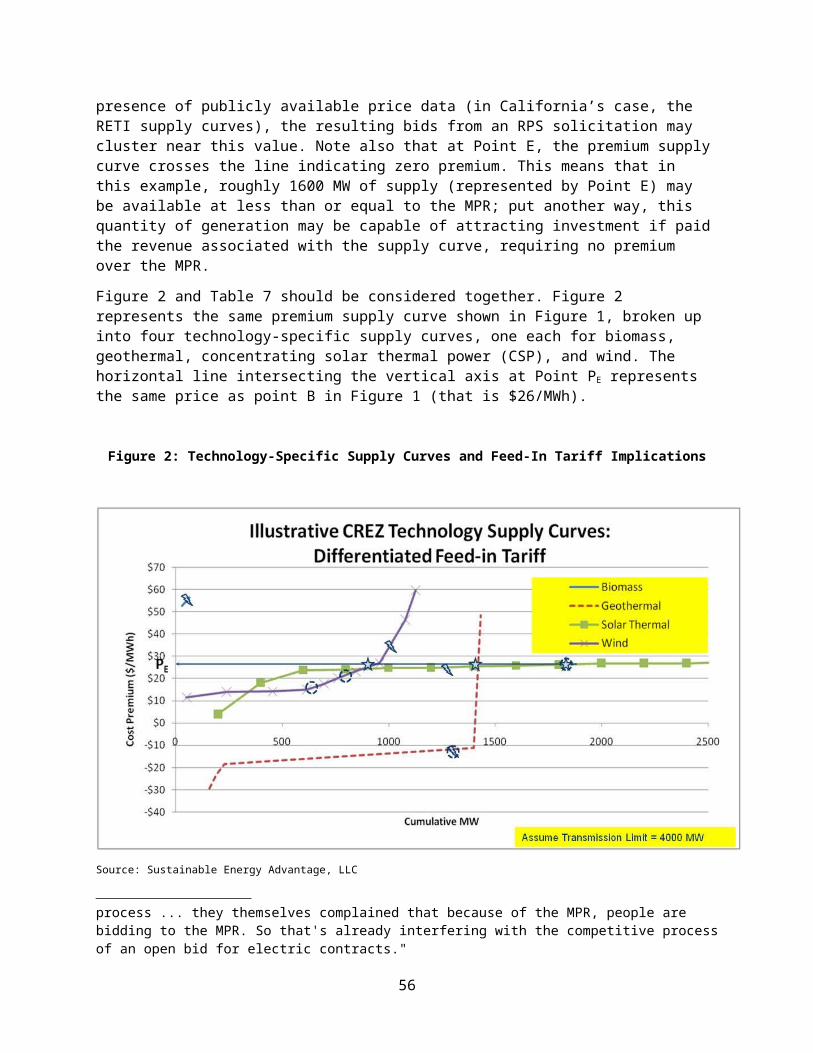
Key Inputs and Key AssumptionsThe key inputs for the French feed-in tariff are not publicly available and were not provided by the French government at the time this report was written.110
Financial GapTo determine the financial gap, the Ministry of Ecology, Energy, Sustainable Development and the Sea111 (MEEDM) uses a discounted cash-flow model based on the profitability of reference projects before income tax. Profitability is calculated using a real internal rate of return (IRR) of 8 percent.112 Unlike the Netherlands, where the model is posted online, the French cash-flow model is not publicly available, nor is it available to stakeholders during the consultation process.
Data Collection and Stakeholder Consultation ProcessUnlike in the Netherlands, where the process is driven by non-governmental consultants, the French process is driven by the Ministry of Ecology, Energy, Sustainable Development, and the Sea (MEEDM). MEEDM is responsible for deriving and publishing the proposed feed-in tariff rates. Before publication, MEEDM is required to circulate the draft rates to the Energy Regulation Commission113 (CRE) for review, but the CRE’s comments are not binding. At the outset of the process, MEEDM generally convenes a series of working groups focusing on technology specific generation costs and on broader issues of feed-in tariff design. Participants include relevant government agencies (e.g. the Ministry of Agriculture in the biogas working group), utilities, and renewable energy industry stakeholders. Participants in the working groups have an opportunity to submit both generation cost data and propose calculation methods. Like the CRE comments, the working group process informs MEEDM’s rate setting efforts, but its recommendations are not binding.
110 Interviews with staff from the French Environment and Energy Management Agency? (ADEME), however, revealed that a publicly available model known as the Profitability Index Methodology? (PIM) was utilized to inform the tariff setting process for wind energy in 2001 and biogas in 2006. In order to provide another data point for the Energy Commission’s consideration, a version of the PIM model can be found online at: http://www.wind-works.org/FeedLaws/Canada/Chabot-Gipe%20PIM%20Ontario%20Wind%20T1-T2%20%202009%20Tariffs-825-V90-2900-Rev%20PI.xls111 Ministère de l’Écologie, de l’Énergie, du Développement durable et de la Mer.112 Chabot, Bernard (2009). France’s Advanced Renewable Tariffs. Proceedings of the Green Energy Act Alliance Design Elements of Feed-In Tariffs: Spain, Germany, France and Ontario Workshop.113 Commission de Régulation de l’Énergie.
58

Advantages and Disadvantages of the French Feed-In Tariff System
Advantages An advantage of the French approach to tariff setting is that the process has
the potential to move forward more quickly because there is less opportunity for stakeholder intervention than there is in other countries, such as the Netherlands.
Disadvantages The stakeholder process is not iterative, and stakeholders do not have a
chance to comment on the cost model itself. A comparatively opaque cost methodology process that minimizes stakeholder involvement can raise concerns over whether the tariff setting method accurately reflects policy objectives.
Using a pre-tax model may not be appropriate in the U.S. context because of the availability of significant federal tax incentives, such as the PTC, the ITC, and the accelerated depreciation schedule.
Gainesville, Florida: Feed-In Tariff Rate Setting
Feed-In Tariff OverviewIn February the 2009, Gainesville City Commission approved a feed-in-tariff for photovoltaic systems installed in the Gainesville Regional Utility (GRU) service area. This was the first generation-cost based feed-in tariff implemented in the United States. The city had previously offered utility customers a $1.50/kW rebate along with net-metering.114 The city’s policy goal was, in part, to replace its rebate with a production-based incentive that would encourage high-quality installation and allow more innovative system ownership arrangements.115 Gainesville set an initial 20-year tariff of $0.32 per kWh for structure-mounted and small-scale greenfield systems and a $0.26 tariff for utility-scale projects. Tariff values decline for systems installed in future years with no tariff offered to installations after 2016. The city has discontinued its rebate program for non-residential customers but has given residential customers the option of taking the rebate in lieu of the feed-in tariff. System owners under the feed-in tariff program relinquish all rights to any environmental attributes associated with the PV system’s output. The authorizing ordinance set a citywide 4 MW program limit. It was originally 114 Net-metering was discontinued for all new commercial and industrial PV systems. Residential systems 10kW or smaller are still eligible to net meter if they do not take the FIT. The FIT covers all production and not just excess generation.115 Gainesville Regional Utility. 2008. Proposal to replace non-residential solar photovoltaic rebate and net metering financial incentives with a solar feed-in tariff. Gainesville, Fla. Available online at: http://www.gru.com/Pdf/futurePower/Solar%20Tariff%20Doc.pdf
59

believed that this cap would take several years to reach; however the program installation queue has already reached the 4 MW limit.
Technology DifferentiationGainesville adopted a two-tiered photovoltaic feed-in tariff that has separate incentive rates for projects on existing structures and pavement ($0.32/kWh) and for “free-standing” greenfield projects over 25 kW ($0.26/kWh). As in other jurisdictions, Gainesville recognizes that large projects require lower incentives because developers are typically able to leverage economies of scale and can access lower-cost capital. Through its stakeholder engagement process, however, the city determined that small (<25 kW) greenfield projects require an incentive level similar to building-mounted systems and so these systems are eligible for the higher feed-in tariff payment tier.
Key Inputs and Key AssumptionsThe city evaluated a number of financial models from stakeholder groups and settled on an after-tax cash-flow model. This model includes cost assumptions derived from publicly-available market data including installed-cost data from Florida’s solar rebate programs and future cost-assumptions based on U.S. Department of Energy’s Energy Information Administration predictions. The city’s base-year assumed installed cost was $7.50/kW, based on a survey of installed costs for existing systems statewide. The final model included existing federal solar incentives including the ITC and five-year depreciation, but did not include the state rebate program as it is currently oversubscribed. The city’s model includes standard assumptions about corporate tax rates, electricity cost inflation and system production. These assumptions are outlined in Appendix D. The rate-setting model did not include information about cost of capital and assumed that participants would pay the full price of the system at installation. The model also does not account for inflation.
Financial Gap As discussed above, GRU used a discounted cash flow model, with a target of 2.93 percent after-tax internal rate of return.
Data Collection and Stakeholder Consultation ProcessThe Gainesville data collection and rate proposal process was driven and managed by the GRU’s staff, with ultimate approval granted by the Gainesville City Commission. In order to gather data, GRU referred to historical installed costs for systems installed both within Gainesville and within Florida in order to estimate generation cost and used performance data from systems that GRU has been monitoring in order to determine the capacity factor. The assumptions developed by the GRU staff are available in a white paper posted on the GRU website.116 116 Gainesville Regional Utility. Solar feed-in tariff. Available online from. http://www.gru.com/OurCommunity/Environment/GreenEnergy/solar.jsp
60

GRU staff presented its proposed rates and assumptions to the City Commission in a televised workshop and then posted the white paper on the Web. The spreadsheet model was not posted online but was made available to stakeholders upon request. Stakeholders were then permitted to comment on the proposed rates, and the assumptions used. Stakeholder comments resulted in the initial solar feed-in tariff rate being raised from $0.28/kWh to $0.32/kWh.
In order to continue to accurately adjust the feed-in tariff over time, GRU requires that generators provide the utility with final installed cost data after the PV system is interconnected and operational.
Advantages and Disadvantages of the Gainesville Feed-In Tariff System
Advantages The input cells for the GRU feed-in tariff are comparatively uncomplicated,
and the model is therefore more conducive to expedited, broad-based stakeholder discussion in comparison to more complicated models.
The after-tax analysis embedded in the model allows federal tax incentives to be taken into account when calculating the feed-in tariff.
Disadvantages There are a wide range of costs that are included in aggregated installed
cost numbers, including materials, labor, interconnection costs, permitting costs, site preparation, etc. The choice to aggregate these costs into a single installed cost input essentially means that policy decisions have been made about the range of each of these individual cost line items. To the extent that the transparency of such policy decisions is desirable, it might be useful to disaggregate some of the input cells. As discussed above, however, there are trade-offs between complexity and ease of use.
61

California Renewable Energy Cost of Generation Update Study
In 2009, KEMA, under an Energy Commission Public Interest Energy Research (PIER) contract, developed the Renewable Energy Cost of Generation Update report that examines major components of the cost of renewable electricity generation.117 The research focused on developing robust cost of generation estimates, backed by a focused assessment of published literature on the costs of generation. The report examines cost drivers and trends for each technology and provides a range (high, average, low) of expected costs spanning a range of project sizes and variety of financing approaches. The results of this study provide inputs to support the Energy Commission’s Cost of Generation Model. This section reviews KEMA’s data gathering methodology. For the most part, the Renewable Energy Cost of Generation Update report, combined with the Energy Commission’s Comparative Costs of California Central Station Electricity Generation Technologies report,118 provides sufficient data detail to satisfy the feed-in tariff price-setting methods used by the jurisdictions examined in this report.
Technology DifferentiationThe Renewable Energy Cost of Generation Update report examines the cost of renewable electricity generation in California for utility-scale, building-scale and community-scale applications. For the utility-scale technologies, the report examines 15 renewable technology categories as well as integrated gasification combined cycle and nuclear power generation alternatives. Some resources are differentiated as follows:
Biomass is differentiated by fluidized bed boiler, stoker boiler, co-firing, and co-gasification integrated gasification combined cycle.
Geothermal is differentiated by binary and flash systems. Solar is differentiated by parabolic trough and photovoltaic systems. Hydropower is differentiated by whether it is a new facility or an upgrade of
existing facility. Wind is differentiated by resource type (e.g., Class, 3, 4 or 5), and whether it
is on-shore or off-shore. For each of the utility-scale technologies, the Energy Commission’s Cost of Generation Model also differentiated the resource by financing type (Merchant, IOU, and Municipal). The complete list of utility-scale technologies examined in the Renewable Energy Cost of Generation Update report is provided in Appendix E, Table E1.117 O’Donnell, Charles, Pete Baumstark, Valerie Nibler, Karin Corfee, and Kevin Sullivan (KEMA). 2009. Renewable Energy Cost of Generation Update, PIER Interim Project Report. California Energy Commission. CEC‐500‐2009‐084. Sacramento, Calif. Available online at: http://www.energy.ca.gov/2009publications/CEC-500-2009-084/CEC-500-2009-084.PDF118 Klein, Joel. 2009. Comparative Costs of California Central Station Electricity Generation Technologies, California Energy Commission, CEC-200-2009-017-SF. Sacramento, Calif. http://www.energy.ca.gov/2009publications/CEC-200-2009-017/CEC-200-2009-017-SF.PDF
62

For the building-scale and community-scale technologies, KEMA examined 11 technology categories,119 including electric generation and thermal heating and cooling technologies. The main selection screening criteria was identifying current or future (within 20 years) commercial availability of the technology and applicability of the technology to California. The building- and community-scale technologies selected for cost modeling are outlined in Appendix E, Table E2.
Key Inputs and Key AssumptionsFor each of the utility-scale technologies, KEMA identified the nominal 2009 assumptions for plausible minimum, average, and maximum cost of generation components. To the extent possible, plausible maximum is defined as a cost more than one competitive player would be willing to pay, and plausible minimum is defined as the least cost recorded absent hidden subsidies. In some cases, unique site characteristics were also considered. Establishing ranges between minimum, average, and maximum costs circumscribes the range of market costs that would reasonably be encountered in the actual development, construction, and operation within each technology. The cost of generation component data is provided to the Energy Commission in the format required for the Cost of Generation Model that produces levelized cost of generation estimates by technology and size category.
For each technology, size ranges were identified for total plant capacity to determine minimum, average, and maximum plant capacities in MW. Plant capacity factors and forced outage rates were also defined using minimum, average, and maximum values, reflecting the ranges identified through researched values. North American Energy Reliability Corporation (NERC)/Generating Availability Data System (GADS) fleet reliability data were used for technologies where data was available, and in the case of wind, solar, and biomass technologies, other research sources were identified. Plant heat rates and fuel usage data were similarly modeled for low/average/high cases, based on actual operating plant characteristics; data was compiled for each fossil fuel technology usage reflecting in-service values for generating plants. Fuel cost estimates were derived with ranges for each fuel type, based on published studies and data from coal, natural gas, uranium, and biomass.
Overnight and installed capital cost values for minimum, average, and maximum costs were defined through two approaches. For overnight costs, capital cost ranges were developed through documented plant cost histories and adjusted for capacity scaling effects, noting that the overnight cost per kilowatt depends on the total capacity of the plant. Changes to the overnight cost over time were projected based on the cost driver analysis, accounting for both inflationary impacts as well as experience curve effects (driven by technological advance and scale economies of manufacturing). These experience-curve effects were reflected on the year-to-year overnight costs within the generation technology dataset.
For installed capital cost values, the low/average/high cases were developed primarily through the use of differing construction time durations, where such data
119 http://www.energy.ca.gov/2009_energypolicy/documents/2009-08-25_workshop/presentations/05_KEMA_Building_and_Community_Scale_Renewable_Technology_Costs.PDF
63

could be verified by the research team. This data reflects the uncertainty in concept-to-completion time for each technology and results in cost impact due to additional interest costs and allowance for funds used during construction charges (AFUDC).
The use and application of renewable energy and other tax incentives were also considered and modeled with the input dataset to develop low/average/high cost data values. These tax incentives were applied for each technology, based on their current validity and specific application for each technology.
The dataset contains cells for low/average/high values for each input to the cost of generation model, and each specific input is modeled with its own low/average/high cost range. One may not draw the conclusion that these costs are specific to a particular size project—for example, the low plant capacity automatically generates the highest operating cost. Instead, the datasets were compiled so that each technology dimension (e.g., capacity, forced outage rate, heat rate, overnight cost) has its own low/average/high range and is not associated with a relative capacity or size project. In that way, the data is modeled such that the range of inputs defining low/average/high costs reflect boundaries for each technology; and the minimum cost represents the lowest plausible range of cost, and the maximum cost represents the highest plausible range on a commercial basis of cost for each technology.
For building-scale and community-scale technologies, average system sizes and average costs were modeled. High, low, and average values were estimated, but only costs for the average case were considered. The following specific inputs were used:
Rated system size Cost per installed kW Cost driver and experience curve effects in four stages (years 2009, 2015, 2020, and 2029) Fixed operation and maintenance (O&M) costs System capacity factor Outage rate (percent/yr) Performance degradation (percent/yr) Transmission losses (percent) Auxiliary energy costs and fuel costs (if applicable) System life (years) Interest rate Inflation rate
These inputs were placed into a cost model to determine estimates from 2009 through 2029 for the following:
Investment cost trajectories Annual investment costs
64

O&M costs Annual energy costs Annual energy output.
The Energy Commission’s Cost of Generation Model can be used to calculate the levelized cost of generation for building-scale and community-scale technologies. Utilizing this model would provide consistency in calculation method used to evaluate the levelized cost of utility scale and building-scale and community-scale technologies. The use of the cost of generation data developed for the Renewable Energy Cost of Generation Update report as inputs to the Energy Commission’s Cost of Generation Model would provide added consistency for comparative analysis.
The cost of generation information developed for the Renewable Energy Cost of Generation Update report compares favorably to the data used to develop feed-in tariffs for the other countries and regions examined in this chapter. However, policy decisions will be required to direct the use of this data in order to derive feed-in tariff rates. This involves making policy decisions regarding the appropriate investment returns and financing structure to utilize in establishing a feed-in tariff rate. Specifically, assumptions must be made for each of the following parameters:
Ownership structure or structures (if there is to be differentiation by type of owner), which will in turn determine the applicable government incentives.
The degree of leverage (debt versus equity). The threshold equity return and debt interest rate consistent with the risk
profile of the specific technologies and associated feed-in tariff.
As noted in this chapter, the Renewable Energy Cost of Generation Update report developed projected cost trajectories for each technology, driven by experience curves, technological advancements and scale economies of manufacturing. If the policy decision is made to adjust feed-in tariff rates available to generators downward over time, consistent with the German-style degression described earlier in the report, the Renewable Energy Cost of Generation Update report cost trajectories can be used to guide development of appropriate degression trajectory rates. The Renewable Energy Cost of Generation Update report cost trajectories suggest that less mature technologies subject to greater expected future technological advance and scale economies of manufacturing would have a more steeply declining degression rate than more mature technologies.
65

Next Step Considerations For Feed-In Tariff Program
Policy Design Details Influencing Feed-In Tariff Rate LevelsEven with all of the data available from the KEMA Renewable Energy Cost of Generation Update report and the Energy Commission’s 2009 Cost of Generation Study, there are a number of aspects involved in establishing cost-based feed-in tariff rates that should be examined more closely from a policy perspective. These aspects ultimately reflect policy decision points. While this list is not exhaustive, some of the key policy decisions necessary to translate policy directives into feed-in tariff rates include:
Transmission, cost allocations
Differentiation of cost by ownership type
Setting level within transmission, distribution and interconnection cost allocations
Differentiation of cost by ownership type
Setting tariff level within range of costs
Tariff differentiation by resource characteristics
Adopting a feed-in tariff price method and process
Stakeholder engagement and confidentiality of stakeholder data.
Transmission, Distribution, and Interconnection Cost AllocationsSo that feed-in tariff rates can be set at levels sufficient to support the targeted generation, they must consider not only the costs of building the generation, but also the transmission, distribution, and interconnection and costs likely to be borne by generators. The KEMA Renewable Energy Cost of Generation Update report includes only interconnection costs associated with high voltage busbar connection at the nearest point of interconnection to the plant. In addition, the Energy Commission’s Cost of Generation Model adds transmission costs associated with bringing utility-scale renewable generation to the nearest load center.120 The method for assigning these costs needs to be examined further to assess whether the costs associated with integration and transmission and distribution are being applied in a consistent and equitable manner across both renewable and conventional generation resources. Categories of costs other than generation costs that should be examined further include:
Direct physical interconnection (which may include transmission or distribution lines to reach the nearest point of connection to the existing network, as well as substation costs)
120 O’Donnell, Charles, Pete Baumstark, Valerie Nibler, Karin Corfee, and Kevin Sullivan (KEMA). 2009. Renewable Energy Cost of Generation Update, PIER Interim Project Report. California Energy Commission. CEC‐500‐2009‐084. Sacramento, Calif.
66

“Upstream” upgrades and grid reinforcements to the distribution and/or transmission networks necessary to accommodate adding the plant to the network
Line extension (this could include building or regional, shared transmission such as facilities considered in the RETI for accessing a CREZ)
Transmission integration costs (could also include costs such as wind forecasting costs)
Transmission usage charges (sometimes referred to as wheeling).
In the context of EU feed-in tariffs, connection charges are commonly categorized as “shallow charges,” generally the costs of direct physical interconnection, or “deep charges,” which include both the direct physical interconnection and costs for grid reinforcements necessary to accommodate adding the plant to the network. Costs allocated to the renewable generators vary widely across EU countries. In some countries, generators must pay (1) shallow charges, (2) deep charges, (3) a hybrid of shallow and deep charges, or (4) “true” costs defined as the equivalent cost of connecting the generator to the nearest point on the grid system at which the grid capacity is sufficient to incorporate the plant into the network without reinforcement.121 In California, precedent is already established as it pertains to direct physical interconnection and upstream upgrade and grid reinforcement charges. In addition, line extension costs associated with a California ISO renewable energy zone – which have few parallels in the EU – will ultimately be allocated to generators.122 Whatever the allocation method, transmission interconnection costs that are charged to generators should be factored into feed-in tariff rates.123
Transmission interconnection costs vary widely from generator to generator. By setting the pass-through cost at the average cost of transmission interconnection, generators with lower than average transmission interconnection costs will have a larger profit margin than other generators. This will encourage generators to locate near existing transmission infrastructure to the extent possible.
Transmission usage or wheeling costs are fees imposed by transmission and distribution utilities on generators in order to reach the power purchaser. Such charges have typically not been considered in setting of feed-in tariff rates, 121 KEMA, Inc. 2009. HECO Feed-In Tariff Program Plan. Prepared for Hawaiian Electric Company, Inc., Maui Electric Company, Limited and Hawaii Electric Light Company, Inc. December 23, 2008, pp. 86-90.122 Grace, Robert, W. Rickerson, K. Porter, J. DeCesaro, K. Corfee, M. Wingate and J. Lesser. KEMA. November 2008. Exploring Feed-In Tariffs for California. California Energy Commission. CEC-300-2008-003-F. Sacramento, Calif. Chapter 11.123 Grace, Robert, W. Rickerson, K. Porter, J. DeCesaro, K. Corfee, M. Wingate and J. Lesser. KEMA. November 2008. Exploring Feed-In Tariffs for California. California Energy Commission. CEC-300-2008-003-F. Sacramento, Calif. P. 59. “If the California ISO designates a renewable energy zone, then the ISO will pay for upgrade costs initially and subsequently spread a share of these costs to load until generation comes on-line; thereafter, generators pay their pro-rata share of these costs. Current California ISO policy is to allocate transmission upgrades above 200 kV across all customers; upgrades below 200 kV are allocated to the transmission owner where the upgrades are located.”
67

because in virtually all cases the entity offering the feed-in tariff is the interconnecting utility and the point of purchase is at the point of injection to the purchaser’s system. Hence, there is no intervening transmission usage to pay for. However, feed-in tariff policy design and implementation choices could arise that might impose such costs on generators, and if so, it would be appropriate to consider such costs in setting feed-in tariff rates. Such a situation may arise, for instance, in a case in which policymakers desire to allocate costs broadly across all utilities in the state. Such an allocation could be accomplished by a simple reallocation of dollars, which would not impose any transmission usage charges. Alternatively, cost allocation could be accomplished by either (a) divvying up individual generation output and transmitting a share of each generator’s output to other utilities, or (b) having a party other than the interconnecting utilities offering the tariffs in the role of an aggregator, this party then reallocating and transmitting the aggregate supply to utilities (a role proposed by some for the California ISO).124 FERC-jurisdictional transmission wheeling charges are applied in some but not all cases; likewise, if a generator interconnects to the distribution system of an intervening utility, sometimes distribution up-wheeling charges are imposed.
The applicability of transmission or distribution wheeling charges to feed-in tariff generators has recently come up and continues to be debated in Vermont Public Service Board (PSB) Dockets 7523 and 7533,125 which involve the implementation of a cost-based feed-in tariff under the state’s SPEED (Vermont's Sustainably Priced Energy Development Program) program. Historically, Vermont has utilized an independent entity, Vermont Electric Power Producers, Inc., (VEPPI)126 to aggregate purchases from small renewables under Public Utility Regulatory Policy Act, (PURPA), and reallocate the power to 20 Vermont utilities. Under the SPEED program, VEPPI has been designated as the SPEED Facilitator, to play a similar aggregation role. In its recent comments filed in the context of establishing cost-based feed-in tariff rates, Central Vermont Public Service Company127 discusses the transition from PURPA to FERC Open Access Transmission Tariff (OATT) rules, and the relationship to SPEED rules. The issue of attributing wheeling costs to feed-in tariff generators seems to stem from Vermont’s attempt to allocate the output from feed-in tariff facilities across utilities. If a utility other than the interconnecting utility is buying the power, Central Vermont Public Service (CVPS) argues that the interconnecting utility can arguably charge for wheeling. Other parties disagree or argue that such application is discretional and such charges should not be applied
124 Grace, Robert, W. Rickerson, K. Porter, J. DeCesaro, K. Corfee, M. Wingate and J. Lesser (KEMA). November 2008. Exploring Feed In Tariffs for California. California Energy Commission. CEC‐300‐2008‐003‐F. Sacramento, Calif. pp. 53-57125 Vermont PSB (2009). Dockets 7523 and 7533 Information Page Implementation of Standard Offer Prices for SPEED. Available online at: http://psb.vermont.gov/docketsandprojects/electric/7523126 See: http://www.veppi.org/ 127 CVPS Comments of July 2, 2009 in PSB Docket 7523 (pg. 8), available at: http://www.state.vt.us/psb/document/7523Feed-InTariff/July2Filings/2009%2007%2002%20CVPS%20Preliminary%20Statement%20on%20Issues%20List%20(07-02-09).pdf
68
to feed-in tariff generators.128, 129 Parties in the Vermont dockets have established a Wheeling and Interconnection Subgroup to resolve these issues; the subgroup is considering three “wheeling proposals,” including
Facilitator arranges for all wheeling. Include the cost for wheeling in the rate and charge the producer. Composite utility system treatment (e.g. continue PURPA treatment).130
Differentiation of Cost by Ownership Type One key policy decision is whether to make a tariff lower or higher for certain types of owners because of underlying differences in cost. Investor-owned owners with tax appetites, for example, differ dramatically from owners that may be governmental entities (federal, state, or municipal customers), non-profit customers, or POUs. The former are able to utilize tax-based incentives such as PTCs and accelerated depreciation. On the other hand, the latter may in some cases be able to access lower cost public financing, as well as certain incentives specifically limited to such entities such as Federal Clean Renewable Energy Bonds.
Another dimension relates to investor-owned utilities (IOUs) ownership compared to independent power producer (IPP) ownership (particularly one using “project” finance) – while both may be taxable, they may have different costs of capital due to different risk profiles, capitalization, and credit ratings.
In deciding whether to differentiate tariffs by ownership types, two considerations come into play: practicality and the implications of the policy decision. From a practical standpoint, the Renewable Energy Cost of Generation Update report identifies a range of subsidies that may or may not apply to a particular generator based on a number of factors, including ownership type, technology type, and 128 In its comments, the Burlington Electric Department (BED) observes that the resolution of issues affecting the acquisition of power under standard offer contract implicates the need for distribution wheeling terms and condition. BED suggests that no utilities in Vermont have distribution level wheeling tariffs. CVPS advises that its wheeling tariff does contain some terms and conditions that govern wheeling over distribution facilities. See: http://www.iso-ne.com/regulatory/tariff/sect_2/sch21/sched_21-cv-clean.pdf. Renewable Energy Development (RED) in its comments of July 2, 2009, argues that feed-in tariff resources should be treated like PURPA resources and notes that VEPPI has continued to purchase and redistribute power after FERC 888 without wheeling charges.129 CVPS reply comments of July 9, 2009, include the following: Distribution Wheeling Tariff. Waiver of Wheeling Charges. “Renewable Energy Development, LLC (“RED”) suggest that since the existing Rule 4.100 contracts between producers and the purchasing agent do not include charges to producers for project wheeling no wheeling on the standard offer contracts should be required. See RED comments at 1. CVPS has noted that the existing arrangements remain grandfathered but that there has been a sea change in the regulation of wheeling since the time that these arrangements were entered. The company reiterates its belief that a working group should develop a recommendation that best serves the interest of customers and meets existing wheeling requirements and notes that RED has expressed a willingness to work towards the resolution of this matter.”130 See http://www.state.vt.us/psb/document/7523Feed-InTariff/Wheeling/Wheeling_main.htm
69

location. Additionally, the Energy Commission’s Cost of Generation Model takes into account ownership structure by IOU, POU, and merchant facilities.
There may also be local incentives, such as tax increment financing, which might differ from project to project. A recent German study of cost methodology concluded that subsidies “can vary from project to project but cannot be generalized in cost study methodology.”131 Ultimately, neither German nor Dutch feed-in tariffs are varied by type of investor; instead, with tariffs set at particular rates, tariffs will attract different types of investors, those able to choose their desired return commensurate with the risk associated with the applicable tariff structure. The implications of differentiating a tariff by ownership structure include added complexity and varied profitability. If a single rate is applied (based on a single assumption of cost of capital and available subsidies), the developers with the most cost-effective ownership and capital structure will be most likely to participate in the feed-in tariff program. Alternatively, if rates are differentiated by ownership structure, a greater diversity of projects and owners may be achieved but at potentially higher cost.132
Setting Tariff Level Within Range of CostsFor any technology, actual project costs will span a range, which may vary based on resource intensity, scale economies, local site preparation and permitting costs, or varying interconnection costs, to name a few. An example of the range is reflected in the Renewable Energy Cost of Generation Update report’s designation of high, average, and low estimates. In practice, the range of costs is more of a continuum rather than discrete steps. This fact presents the challenge for policy makers to determine at what level within a range to establish a tariff rate. The higher the rate within the range, the more generation will result, but the lower-cost generators will be more profitable at a higher overall cost to ratepayers. Of course, the converse is also true: The more conservatively the rate is set, the lower the ratepayer cost, but the fewer plants will be developed because fewer will be
131 Studies commissioned by the Federal Ministry of Economics and Technology from http://www.wind-works.org/FeedLaws/Germany/EEG%20Cost%20Calculations%20methodologies%20BMU.pdf) 132 “The calculation does not include any tax charges or benefits as the resultant estimations of the (individual and significantly varying) rates of taxation would give rise to a potentially substantial source of errors. All calculated production costs therefore portray the pre-tax operating results of the plants. Regardless of how the investor is subject to taxation at a later date (with or without depreciation or amortization possibilities), operating results thus cannot be improved by special tax benefits or by offsetting profits and losses for tax purposes. In the best-case scenario, the calculated operating result is untaxed and retained in full, and in the worst-case scenario the profit achieved, from the perspective of the operator, is taxed at the full rate payable by the operator and therefore reduced. In the wind power sector, opportunities for tax write-off have become an important factor in the investment decisions of many investors in recent years. In terms of the model cases calculated, this means that where favorable tax write-off opportunities are available, all or most of the operating result is retained as profit.” (from http://www.wind-works.org/FeedLaws/Germany/EEG%20Cost%20Calculations%20methodologies%20BMU.pdf)
70

sufficiently profitable. The balance between these competing objectives is a policy decision that can only be guided by cost analysis.
Tariff Differentiation by Resource CharacteristicsAs noted above, costs for projects of a specific technology may vary over continuum, with the breadth of that continuum being much wider for some technology types (wind, as a function of scale and wind speed and distance from transmission, for instance) than others (rooftop solar, where scale economies are important but the slope of the curve may be less dramatic). The questions posed here, again, can be guided by cost analysis such as the Renewable Energy Cost of Generation Update report but are ultimately policy decisions trading off complexity, ratepayer cost, and market penetration.
Adopting a Feed-In Tariff Price Setting Method and ProcessAs outlined in this chapter, different jurisdictions have taken widely different approaches to the feed-in tariff rate setting process. If California successfully moves forward with developing cost-based feed-in tariff rates,133 the Energy Commission will have to consider the pros and cons of using different spreadsheet models and different levels of stakeholder engagement.
Spreadsheet ModelsThere has been a proliferation of different feed-in tariff spreadsheet models as countries around the world have developed their feed-in tariff rates. These models have ranged from fairly basic pre-tax models that do not include a cash flow analysis, to rigorous financial analyses of the kind that project developers develop for prospective investors. To some extent, the complexity of the model is dictated by the degree to which stakeholders are engaged in the process. A more complex model can be difficult for a wide range of stakeholders to work with and can lead to a lengthier rate setting process.
Stakeholder EngagementTo a certain extent, the level of stakeholder engagement is dictated and constrained by the regulatory structure of a given jurisdiction. California, however, can take a variety of approaches to stakeholder engagement in the rate setting process. It is conceivable that the rate setting entity (government or government consultants) could take data from the Renewable Energy Cost of Generation Update report and enter it into a “black box” calculation model in order to determine rates. Under this scenario, stakeholder engagement might only be limited to a single round of comments, for example. This government-driven approach is similar to that used in Germany and France. At the other end of the 133 As of October 2009, it is unclear whether California has the authority to implement cost-based feed-in tariffs. A change in federal law may be required to clarify state authority on this issue. For more information, see CPUC proceeding: http://docs.cpuc.ca.gov/efile/RULINGS/99105.pdf
71

spectrum, stakeholders could be invited to help drive the process through an iterative process of comment and revision. Such a process might involve a publicly available spreadsheet model, such as the one used in the Netherlands.
Confidentiality of Stakeholder DataClosely related to the issue of stakeholder engagement is the issue of confidentiality. In Germany and in Gainesville, generators are required to provide generation cost data in order to be eligible for the feed-in tariff. In the Netherlands, generators must provide actual cost data if they wish to be able to participate in the formal comment process. In other jurisdictions, such as Vermont, for example, generators have stated their opposition to supplying any proprietary data to the process at all.134
Different countries and jurisdictions around the world have used a range of different approaches to setting feed-in tariff rates. Based on a comparative survey of the feed-in tariff calculation models employed in the Netherlands, Germany, France, and Gainesville, Florida, it is clear that the recently completed Renewable Energy Cost of Generation Update report and the Energy Commission’s Cost of Generation Study provide the majority of the data necessary to construct a robust feed-in tariff cost model.
As indicated in this section, there are several specific policy questions that will need to be taken into account before moving forward in developing feed-in tariff rates. Moreover, there are issues related to the process by which the rates are set and the specific tools employed that will need to be resolved. The experience of other countries, and of other jurisdictions in the United States (e.g. Vermont, Hawaii, and Gainesville) should provide a useful benchmark for development and application of feed-in tariffs in California.
134 Renewable Energy Vermont. (2009). Docket 7523 Comments on Issue List. Available online at: http://www.state.vt.us/psb/document/7523Feed-InTariff/July2Filings/REV%2007-02-09%20comments.pdf
72

73

GLOSSARYARRA American Recovery and Reinvestment
Act
California ISO California Independent System Operator
CPUC California Public Utilities Commission
CREZ Competitive Renewable Energy Zone
CSP Concentrating solar power
IEPR Integrated Energy Policy Report
IOU Investor owned utility
ITC Investment Tax Credit
LADWP Los Angeles Department of Water and Power
LCFD Lowest-cost financing design
MPR Market Price Referent
MW Megawatt(s)
MWh Megawatt hours
PPA Power purchase agreement
PTC Production tax credit
REC Renewable Energy Credit
RETI California Renewable Energy Transmission Initiative
RFO Request for offers
RPS Renewables Portfolio Standard
SMUD Sacramento Municipal Utility District
74
75

APPENDIX A: The NetherlandsTable A1: Dutch 2009 Feed-In Tariffs
Resource 2009 [€ct/kWh]135
2010 draft [€ct/kWh]
Green Gas Options 2009 [€ct/Nm3]
2010 draft advice [€ct/Nm3]
Onshore wind 9.4 9.5 Landfill
Sewage and wastewater treatment
37.1
28.7
37.1
28.7
Landfill
Sewage and wastewater treatment
8.3
6.0
8.3
6.0
Fermentation of animal manure
90.5 90.5
Fermentation of animal manure
20.1 20.1 Fermentation of other biomass
74.1 74.1
Fermentation of other biomass
15.8 15.8
Combustion of solid biomass < 10 MWe
20.0 20.0
Combustion of solid biomass 10-50 MWe
12.3 12.4
Combustion of liquid biomass < 10 MWe
16.7 16.1
Combustion of liquid biomass 10-50 MWe
12.9 12.4
Waste Incineration
- standard efficiency
- upgraded
- high efficiency
5.2
5.6
6.2
5.2
5.6
6.2
Hydro, height < 5 meter 12.5 12.2
Hydro, height > 5 meter 7.3 7.1
Hydro, tidal energy 13.0 13.8
Solar PV 0.6-15 kWp 52.6 46.6
Solar PV 15-100 kWp 45.9 40.0
Source: KEMA, Inc.
135 1 Euro = US $1.4590 (October 2, 2009). Federal Reserve Statistical Release Foreign Exchange Rates. Release Date: October 5, 2009.
76

77

APPENDIX B: GermanyTable B1: 2009 Feed-In Tariffs
Resource Category Feed-in tariff
Term Degression Bonus
(€ct/kWh)136
(Years) (%/Year)
Hydro power Installations < 5 MW :Output < 500kW 12.67 20 0Output: 500kW-2MW 8.65 20 0Output: 2MW-5MW 7.65 20 0Modernised installations < 5 MW:Output < 500kW 11.67 20 0Output: 500kW-5MW 8.65 20 0Installations > 5MW:Output <500kW 7.29 15 1.0Output 500kW-10MW 6.32 15 1.0Output 10MW-20MW 5.8 15 1.0Output 20MW-50MW 4.34 15 1.0Output > 50MW 3.5 15 1.0
Biomass <150kW 11.67 20 1.0 Bonus A+B+C
150kW-500kW 9.18 20 1.0 Bonus A+B+C
500kW-5MW 8.25 20 1.0 Bonus A+B+C
5MW-20MW 7.79 20 1.0 Bonus A+B+C
Geothermal < 10 MW 16.00 20 1.0 Bonus D< 10 MW and commissioned before Jan 1, 2016
20.0 20 1.0 Bonus D
> 10MW 10.5 20 1.0 Wind Base tariff 5.02 20 1.0Onshore wind Initial tariff (first 5 years) 9.2 1.0 Note 1+2
Repowering in the first 5 years (which were commissioned at least ten years after the installations they replace, and whose capacity amounts to at least two times, at most five times that of the installations they replace)
9.52 1.0 Note 1+2
Repowering (base tariff) 5.02 20Offshore wind Base tariff 3.5 20 1.0; from 2015
onwards: 5.0Initial tariff (first 12 years) 13.0 1.0; from 2015
onwards: 5.0Note 3
Initial tariff, commissioned before Jan 1, 2016
15.0 1.0; from 2015 onwards: 5.0
Note 3
Source: KEMA, Inc.
Table B1: 2009 Feed-In Tariffs (cont.)136 1 Euro = US $1.4590 (October 2, 2009). Federal Reserve Statistical Release Foreign Exchange Rates. Release Date: October 5, 2009.
78
Resource Category Feed-in tariff
Term Degression Bonus
(€ct/kWh)137
(Years) (%/Year)
Solar-PV Base Tariff 31.94 20 10.0; from 2011 onwards: 9.0
Ground-mounted 31.94 20 10.0; from 2011 onwards: 9.0
Roof-mounted< 30kW
43.01 20 8.0; from 2011 onwards: 9.0
Roof-mounted30kW-100kW
40.91 20 8.0; from 2011 onwards: 9.0
Roof-mounted100kW -1 MW
39.58 20 10.0; from 2011 onwards: 9.0
Roof-mounted> 1 MW
33.0 20 10.0; from 2011 onwards: 9.0
Bonus ConditionBonus A(Technology bonus)
2.0 €ct/kWh When gas has been processed by innovative technologies to the quality of natural gas with a maximum capacity of 350 standard cubic meters of processed crude gas per hour
1,0 €ct/kWh For a gas processing installation with a maximum capacity of 700 standard cubic meters of processed crude gas per hour.
Bonus B (Bonus for electricity from energy crops)
6.0 €ct/kWh Up to 500kW; using renewable biomass
4.0 €ct/kWh 500kW-5MW, using renewable biomass, no wood combustion
2,5 €ct/kWh 500kW-5MW, wood combustion
Bonus C (CHP-Bonus)
3.0 €ct/kWh CHP installation
Bonus D(heat use bonus)
3.0 €ct/kWh At least 20 percent of the available heat capacity is decoupled, and the heat use demonstrably replaces fossil energies with an energy equivalent comparable to the quantity of fossil heat used.
Note 1: (system services bonus)
0.5 €ct/kWh The initial tariff shall increase for electricity from wind-powered installations commissioned prior to January 1, 2014 by 0.5 cents per kilowatt-hour (system services bonus) if it demonstrably fulfils the requirements of the Ordinance in accordance with section 64(1) EEG from the date of commissioning.
Note 2: Extension of initial tariff The 5 year period shall be extended by two months for each 0.75 per cent of the reference yield by which the yield of the installation falls short of 150 per cent of the reference yield.
Note 3: Extension of initial tariff Initial tariff shall be extended in the case of electricity from installations located at least twelve nautical miles seawards and in a water depth of at least 20 meters by 0.5 months for each full nautical mile beyond 12 nautical and by 1.7 months for each additional full meter of water depth.
Source: KEMA, Inc.
137 1 Euro = US $1.4590 (October 2, 2009). Federal Reserve Statistical Release Foreign Exchange Rates. Release Date: October 5, 2009.
79
Table B2: German Input Parameters for the Feed-In Tariff
Hydro power
Biomass Landfill, sewage, mine gas
Geothermal energy
Wind energy
PV
Imputed period
30 /15 yr 20 yr Base case: 20 yr. Variant landfill: 6 yr
20 yr Base case: 20
yr. (variant: 16 yr)
20 yr
Nominal interest rates
Small plants: 7%/yr
Large plants: 8%/yr
8 %/yr 8 %/yr 8 %/yr Variation in the range
5-8%/ yrInflation rate 2%/yr
Heat compensatio
n (with cogeneration)
Base case: 25 € / MWh (Variation in the range 10 - 40 € / MWh)
Special staff costs
50T€ per man year
# hours electricity plant is
operational
Depending on the size
7,700 h/yr Landfill:7,700 h/yr
Sewage and mine gas: 7,000
h/yr
7,700 h/yr Depending on site conditions
# hours heat plant is
operational
- Depending on
application
- - -
Source: KEMA, Inc.
80

81

APPENDIX C: FranceTable C1: French 2009 Feed-In Tariffs138
Resource Support level (€cents / kWh) 139 Contract duration
Base rate
Hydropower
6.07 c€/kWh
+ Between 0.5 and 2.5 c€/kWh premium for small installations
+ Between 0 and 1.68 c€/kWh premium by seasonal production20 years
Onshore Wind
8.20 c€/kWh during 10 years
+ Between 2.8 et 8.2 c€/kWh premium during 5 years depending on the location's productivity
15 years
OffshoreWind
13 c€/kWh during 10 years
+ Between 3 and 13 c€/kWh premium during 10 years depending on the location's productivity
20 years
Biogas
Between 7,5 and 9 c€/kWh according to capacity
+ Between 0 and 3 c€/kWh premium depending on efficiency
+ 2c€/kWh premium for methanisation 15 years
PV30 c€/kWh
+ 25 c€/kWh premium for building integration20 years
Overseas PV
40 c€/kWh,
+ 15 c€/kWh premium for building integration20 years
Geothermal12 c€/kWh
+ Between 0 and 3 c€/kWh premium depending on energy efficiency 15 years
Overseas Geothermal
10 c€/kWh
+ Between 0 and 3 c€/kWh premium depending on energy efficiency 15 years
Source: KEMA, Inc.
138 Renewable Energy Policy Review – France, EREC, available here: http://www.erec.org/fileadmin/erec_docs/Projcet_Documents/RES2020/FRANCE_RES_Policy_Review_09_Final.pdf; Les tarifs d'achat de l’électricité produite par les énergies renouvelables et la cogénération, available here: http://www.developpement-durable.gouv.fr/energie/renou/se_ren_a4.htm139 1 Euro = US $1.4590 (October 2, 2009). Federal Reserve Statistical Release Foreign Exchange Rates. Release Date: October 5, 2009.
82

83

APPENDIX D: Gainesville, Florida
Table D1: 2009 Feed-In Tariffs
COSTSSystem Size (kW) 25 Installed Cost/Watt $8.50 System Installed Cost $212,500.00ADJUSTMENTSState Rebate/W $0.00 State Rebate Total $0.00GRU Rebate/W $0.00 GRU Rebate Total $0.00Total Install less rebates $212,500.00Federal ITC Rate 30.00% Federal ITC Total -$63,750.00IRS Tax Rate 35.00% IRS 179 Depreciation -$63,218.75Years of Depreciation 5RATESGRU Discount Rate 6.00%Base Energy Rate/kW 0.32Annual Energy Rate escalation 0.00% Internal Rate of Return (10) -6.40%Internal Rate of Return (20) 2.93%ROI 8.01%
Base Capacity Factor 17.00%(PV Watts reference 15.5-19.5 depending on ac/dc efficiency)
Annual Degradation 0.80% (from California PUC and EIA )Maximum Federal 250000Maximum State 100000Maximum GRU 1000000Maximum Depreciation 250000Production Tax Credit $0.000 first 5 yearsNet Installed Cost $148,750.00Total with NPV O&M $127,970.43Grid Parity Base 0.14Grid Parity Escalator 0.03
Source: KEMA, Inc.
84

85

APPENDIX E: California
Table E1: Utility-Scale Technology List for Renewable Energy Cost of Generation Update Study
Technology List Gross Capacity (MW)
Biomass
Biomass Combustion - Fluidized Bed Boiler 28
Biomass Combustion - Stoker Boiler 38
Biomass Co-firing 20
Biomass Co-Gasification IGCC 30
Geothermal
Geothermal - Binary 15
Geothermal - Flash 30
Hydropower
Hydro - Small Scale (developed sites without power) 15
Hydro - Capacity upgrade for developed sites with power 80
Solar
Solar - Parabolic Trough 250
Solar - Photovoltaic (Single Axis) 25
Wind
Onshore Wind - Class 5 100
Onshore Wind - Class 3/4 50
Offshore Wind - Class 5 100
Wave
Ocean Wave 40
Integrated Gasification Combined-Cycle
IGCC without carbon capture 300
Nuclear
Westinghouse - AP1000 960
Source: KEMA, Inc.
86

Table E2: Community-Scale and Building-Scale Technology List for Renewable Energy
Cost of Generation Update Study
Technology List Average Capacity
Biomass – Dairy or Swine Manure
Biomass – Advanced Digester (Food Industry – Biogas Application)
550 kW electric
Biomass –Landfill Gas (LFG) Up to 2,000 kW electric
Biomass – Waste Water Treatment Plant (WWTP) 5,000 kW electric (5 MW)
Geothermal
Geothermal – Heat Pumps 150 tons cooling
Hydropower
Hydro – In Conduit 1100 kW electric
Solar
Solar – Photovoltaic Residential Fixed Tilt 5.3 kW electric
Solar - Photovoltaic Commercial Fixed Tilt 138 kW electric
Solar – Photovoltaic Ground-Based Tracking 1500 kW electric
Solar – Integrated Space and Water Heating 4.4 kW thermal
Solar – Residential Water Heating 116 therms/year
Wind
Wind – Community Scale 5,000 kW (5 MW)
Source: KEMA, Inc.
87