View Points of Tata Steel on Revision of Threshold Value...
27
View Points of Tata Steel on Revision of Threshold Value of Iron Ore Workshop on Threshold Value of Minerals for Eastern States Organised by Indian Bureau of Mines, Ministry of Mines, Government of India at Noamundi, Jharkhand Presenter: Asim Chatterjee Principal Geologist (Iron Ore - OMQ) Date : 21.08.2017
Transcript of View Points of Tata Steel on Revision of Threshold Value...

View Points of Tata Steel on Revision of Threshold Value of Iron Ore
Workshop on Threshold Value of Minerals for Eastern States Organised by Indian Bureau of Mines, Ministry of Mines, Government of India at Noamundi, Jharkhand
Presenter: Asim Chatterjee Principal Geologist (Iron Ore - OMQ)
Date : 21.08.2017

Statements in this presentation describing the company’s performance may be
“forward looking statements” within the meaning of applicable securities laws and
regulations. Actual results may differ materially from those directly or indirectly
expressed, inferred or implied. Important factors that could make a difference to the
company’s operations include, among others, economic conditions affecting
demand/supply and price conditions in the domestic and overseas markets in which
the Company operates, changes in or due to the environment, Government
regulations, laws, statutes, judicial pronouncements and/or other incidental factors.
Disclaimer
2

1 Background & need for revision of Threshold value of minerals
2 Iron ore resources of India & their geographical distribution
3 Iron ore production and end use: Implications on low grade ore
beneficiation
4 Case studies on beneficiation test works conducted by NML-Tata Steel
collaboration for low grade ore
5 Discussion on Tata Steel’s perspective
6 Summary & Recommendations
Outline of Presentation
3

Background & need for revision of Threshold value of minerals
4

Background & Need for revision of Threshold Value of Iron Ore
Tata Steel welcomes IBM’s invitation for suggestions from all stakeholders for revision of threshold value of minerals vide notification no C-284/3/CMG/2017, dated 24/03/2017.
In view of the changing market dynamics and availability of new technologies for upgrading the low grade resources, it is essential to review the threshold value of minerals from time to time.
“Threshold value of minerals” means limit prescribed by the Indian Bureau of Mines from time to time based on the beneficiability and or marketabiity of a mineral for a given region and given time, below which a mineral obtained after mining can be discarded as waste.
Current threshold 45% Fe (Min) for hematitic iron ore & 35% Fe for Siliceous Iron Ore of Goan region (Ref. IBM Notification No. T-45031/CGBM/2007(PF) dtd. 16-Oct-2009.
5

Revision of Threshold Value of Iron Ore : Important Considerations
Ores delineated based on detailed exploration and resource modelling can be included in recoverable/extractable reserves only when they satisfy all three key parameters as per the UNFC classification and fulfills Mineral Resources as per Part IVA of Mineral Evidence rules, 2015
Geological Proving under Measured category
Feasibility of the Mineral Deposit for a given application
Economic viability
Therefore, revision of threshold value for minerals should take into account the “end use” to satisfy feasibility as well as economic viability of any deposit
For end users, not only the ‘Tenor Value’, but also the deleterious constituents e.g. Alumina, Silica, Phosphorous and even Alkali (K2O, Na2O), Sulphur are equally important so as other mineralogical & metallurgical considerations
6

Iron ore resources of India & their geographical distribution
7
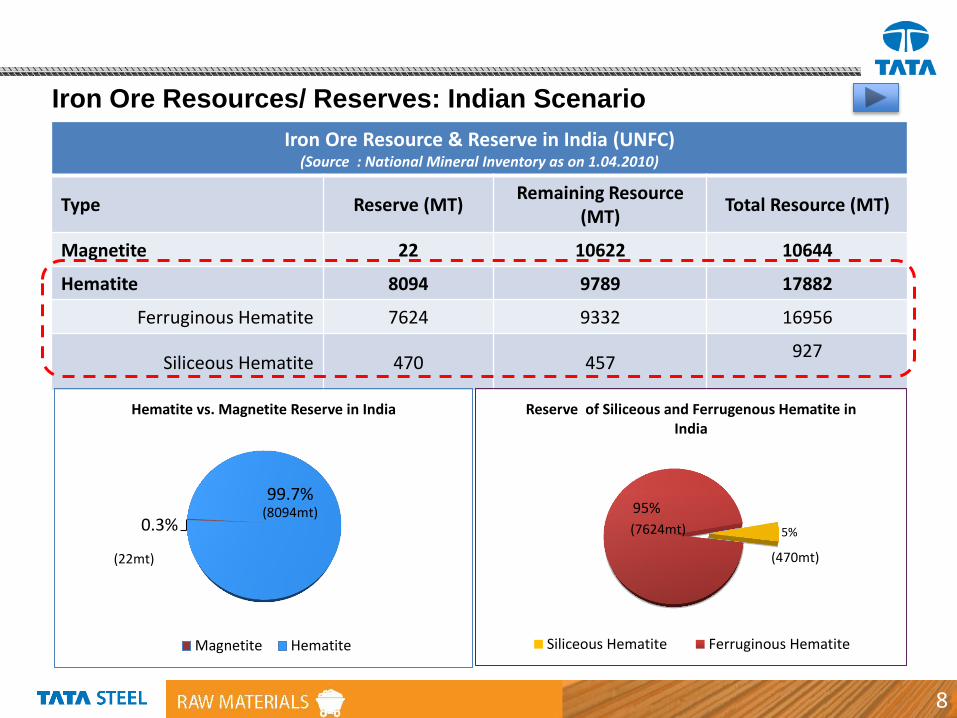
Iron Ore Resources/ Reserves: Indian Scenario
Iron Ore Resource & Reserve in India (UNFC) (Source : National Mineral Inventory as on 1.04.2010)
Type Reserve (MT) Remaining Resource
(MT) Total Resource (MT)
Magnetite 22 10622 10644
Hematite 8094 9789 17882
Ferruginous Hematite 7624 9332 16956
Siliceous Hematite 470 457 927
0.3%
99.7%
Hematite vs. Magnetite Reserve in India
Magnetite Hematite
(8094mt)
(22mt)
5%
95%
Reserve of Siliceous and Ferrugenous Hematite in India
Siliceous Hematite Ferruginous Hematite
(7624mt)
(470mt)
8

Iron Ore Occurrences in India: Geographical Distribution
Iron ore Deposits- Ferruginous nature Iron ore Deposits- Siliceous nature
Iron ore
Odisha-Jharkhand Belt
Durg-Bastar Chandrapur Belt
Bellary-Chitradurga-Chikmangalur-Tumkur Belt
Maharashtra-Goa Belt
Occurrence of Hematitic Ore- Statewise
State Reserve
(MT) Wt%
Odisha 3313 41
Jharkhand 2304 29
Chhattisgarh 900 11
Karnataka 877 11
Andhra Pradesh
152 2
Goa 470 6
Total 8016 100
(Source: National Mineral Inventory as on 1.04.2010 presented in IBM Mineral Year Book, 2014)
(Modified after map published in DID, Geological Survey of India, 2011) 70% of hematitic iron ore reserve is from
Odisha-Jharkhand
9

Iron ore production and end use: Implications on low grade ore beneficiation
10

Iron Ore Production in India and End Users
0.002% 1.343% 0.003% 0.030%
72%
27%
0.004%
Alloy steel
Cement
Ferro-alloys
Coal washery
Iron & steel
Sponge iron
Others
Iron & Steel including Sponge Iron industries accounts for
over 99% of iron ore consumption
Source : Mineral Year Book, 2014
* Iron ore Production include Captive use, Export as well as inventory at Mine head. 2016 data only available, 4.5mt ore exported
Source : Ministry of Mines
(derived figures)
0
50
100
150
200
2013-14 2014-15 2015-16
152 129
156 130 141 142
82 89 90
In m
illio
n t
on
ne
s
Production of Iron Ore and Crude Steel
Iron ore Production Iron Ore used in Steel Plants Crude Steel production
11

Growth projection for Indian Steel (National Steel Policy 2017-Draft)
68.3
122 147
236
300
0
50
100
150
200
250
300
350
FY '10 FY '16 FY'16 toFY'21
FY'21 toFY'26
FY'26 toFY'31
Cru
de
Ste
el P
rod
uct
ion
(In
MT)
Financial Year
Projection of Crude Steel Production (In MT)
+25
+89
+64
72
128 154
248
315
+26
+93
+67
0
50
100
150
200
250
300
350
FY '10 FY '16 FY'16 toFY'21
FY'21 toFY'26
FY'26 toFY'31
Ho
t M
eta
l Pro
du
ctio
n (
In M
T)
Financial Year
Projection of Hot Metal Production (In MT)
Actual production
90 mt
Further exploration and scientific investigations including beneficiation and metallurgical tests are required to ascertain suitability of ore for steel making, accordingly reserve-resource statistics of the country may be updated
207 159
244
392
498
0
100
200
300
400
500
600
FY'10 FY '16 FY '21 FY '26 FY '31
Iro
n O
re R
eq
uir
em
en
t (I
n M
T)
Financial Year
Projection of Iron ore Requirement (In MT) @1.58 tonnes iron ore / thm with a grade of 63% Fe (t), 2.6% SiO2 & 2.5% Al2O3
(derived from IBM Mineral Year Book 2012 & 2014)
12

Quality of Iron Ore used in different Steel Plants of India
(2012-13 to 2013-14)
13
Steel Plant Lump Fines Average Quality
Fe% SiO2% Al2O3% Fe% SiO2% Al2O3% Lump:Fines Fe% SiO2% Al2O3%
Bokaro Steel Plant 63.4 2.25 2.39 62.2 3.4 3.5 1.27 62.9 2.74 2.86
Durgapur Steel Plant 62.5 NA 2.42 62.8 2.3 NA 0.54 62.7 2.42 2.28
IISCO, Burnpur 62.9 2.56 2.56 - - - 1.00 62.9 2.56 2.56
Rourkela Steel Plant 63.5 1.78 2.48 62.2 3.0 3.0 0.42 62.6 2.61 2.85
Visvesarya Iron ore 63.0 2.85 2.43 - - - 1.00 63.0 2.85 2.43
Vishakhapatnam Steel Plant 65.5 2.25 1.60 64.5 3.0 3.0 1.58 65.1 2.54 2.14
Tata Steel Ltd* 65.2 1.90 2.00 63.9 2.9 2.4 0.24 64.2 2.70 2.30
Indian Steel Plants typically uses - Lumps in much higher proportion
- Lump Ore with 64.0% Fe, 2.20% SiO2, 2.20% Al2O3 and
- Fines Ore with 63.5% Fe, 2.70% SiO2, 2.90% Al2O3
- Overall Metallics with 63.0% Fe, 2.6% SiO2, 2.5% Al2O3
Source: IBM Mineral Year Book 2012 & 2014 * Fy17 data
Processing of High Grade ore
Beneficiation of Low Grade Ore
Corresponding ROM quality for these products not available in public domain to compare
Tata Steel uses 24:76 Lumps: Fines aided by its
Pelletisation and Sintering facilities

General characteristic of hematitic iron ore of different region :
what makes them really different …
14
General Characteristics of ferruginous iron ore
Odisha – Jharkhand Belt
High Fe, High Alumina, Moderate to low silica, occasionally high P content & high Alkali
Very fine liberation size, low beneficiability (lesser yield (<40%) for ~50% Fe(t) in feed
Limited response in magnetic separation
Durg-Bastar -Chandrapur-Dalli Rajhara Belt
High Fe, Medium Alumina, Moderate to High silica, Occasionally high P content
Moderate beneficiabilty (medium yield (~60%) for ~50% Fe(t) in feed
Bellary - Chitradurga - Chikmagalur- Tumkur Belt
Moderate to High Fe, Low Alumina, High Silica
Amenable to beneficiation, reports >60% yield with <50% Fe in feed
General Characteristics of Siliceous Iron Ore
Goan Ore Low to medium Fe, Low Alumina, High Silica Amenable to beneficiation, almost naturally liberated; reports >70% yield with <50% Fe in feed Responds to magnetic separation to a great extent
A common Threshold limit in terms of Fe(t), Alumina or Silica may not be applicable for
ores of all region …
Hematite Ore
Ferruginous Ore (Iron Ore other than Goan Origin)
Siliceous Ore (Iron Ore Goan Origin)
Odisha - Jharkhand Belt
Maharashtra - Goa Belt Durg-Bastar - Chandrapur Belt
Bellary - Chitradurga - Chikmagalur- Tumkur Belt

Nature of Iron Ore:
First impressions can sometimes mislead why Eastern India ores are more difficult…
15
Western region ores Eastern region ores
Ore type
Grade, % Fe
Friable, Soft
52-58
Hard, Friable, Blue dust, Soft
58-65
Mineral make up
major…
minor…
Hematite, Goethite
Gibbsite, Kaolinite, Quartz
Hematite, Goethite
Gibbsite, Kaolinite, Quartz
Textural Association Gangue as void filling Gangue as very fine inclusions
Alumina Deportment
Alumina mainly contributed by
Gibbsite and Kaolinite (~75%)
Alumina contributed by Goethite is
low (~25%)
Al substitution for Fe in Goethite
lattice is 8% max
Alumina mainly contributed by
Goethite(~65%) - Goethite is
ocherous
Alumina contributed by Gibbsite
and Kaolinite (~35%)
Al substitution for Fe in Goethite
lattice is ~ 18%

Case studies on beneficiation test works conducted by NML-TSL collaboration for low grade ore
16

Results of Beneficiation studies conducted in National Metallurgical
Laboratory (NML), Jamshedpur on Iron ore from Noamundi-Katamti
Mines of Tata Steel
17
Case Study - II Beneficiation Studies on Low grade Iron ore from Katamati Mines of Tata Steel
Case Study - I Process Mineralogical and energy characteristics of low grade iron ore from Tata Steel
Samples were derived from available ore types in the deposit ratio within 50-55% Fe classes (and corresponding 7-10% Al2O3)

Case Study 1: Results of characterization of Low Grade Ore from
Tata Steel Mines
18
Gross mineralogy of low grade ore; Goethite clay interlocking at <10micron
Liberation characteristics based on optical microscopy
Liberation of hematite in various sizes crushed to 710micron
Low grade (50.5% Fe) ore from Tata Steel (Noamundi Mines) exhibits liberation size <63 micron
QEMSCAN results suggest beneficiable high grade materials in the sample are hardly 18% and beneficiable minerals are 50% for 2.8% product alumina
Theoretical assessment indicate <25% recovery for ~62.5% Fe & 2.8-3.0% Alumina in product

Case Study 1 contd…
19
Feed Sample (Low grade Iron Ore) Feed Grade
(Fe 50.6%, Al2O3 9.5%, SiO2 5.2%)
-3.3 mm Yield = 26.3 %
Grade ( Fe 46.67%, Al2O3 9.49%, SiO2 6.85%)
Liberation possible at - 63 micron size (revealed from Optical observation method) Product can be up graded to ~ 63.5 6% Fe , 2.5 % Al2O3 @ ~20% recovery Large storage volume is required to handle slimes/reject/tailings - Environmental impact
-25+13 mm Yield = 36.4 %
Grade ( Fe 51.13%, Al2O3 10.32%, SiO2 5.38%)
-13+3.3 mm Yield = 37.3 %
Grade ( Fe 52.89%, Al2O3 8.51%, SiO2 3.72%)
Sized to -710 micron, subjected to chemical analysis and liberation
study
Final Product Yield = 52.6%
Grade ( Fe 58%, Al2O3 6.70%, )
Reject/Tailings Yield = 47.4%
Grade ( Fe <40%, Al2O3 >15.%, )
@ 52.6% Product Yield
Final Product Yield = 11.5%
Grade ( Fe 66%, Al2O3 1.8%, )
Reject/Tailings Yield = 88.5%
Grade ( Fe <45%, Al2O3 >10.%, )
@ 11.5% Product Yield

Case Study-II: Beneficiation response of low grade ore (51% Fe) from
Katamati Mines, Tata Steel tested by NML, Jsr (Pilot Plant Scale)
20
Fe%(T) Al2O3% SiO2% P% LOI% CaO% MgO% TiO2 % S%
51.4 7.8 8.7 0.09 8.62 0.01 0.09 0.47 0.012
Head Sample
Modal analysis using optical microscopy
Size Wt% Mineral modal %
Hematite Goethite Clay Quartz
-1.68+0.5
mm 33.8 27.0 43.0 28.7 1.3
-0.5 mm+45
µm 35.5 25.3 33.1 39.5 2.1
-45 µm 30.7 Not determined
Sample contains overall 45% iron bearing minerals.
Recovery of iron bearing minerals from extreme fine size fraction is difficult through physical route.
01020304050607080
Mo
dal
%
Size Fractions
Free IronMinerals
InterlockedGrains
Liberation of Fe-minerals starts at <1mm. But fine crystallites liberate at ~75 microns
Size in mm Wt%
-100+75 1.7
-75+50 3.4
-50+30 13.4
-30+20 14.5
-20+10 13.9
-10+8 4.8
-8+6 11.2
-6+1.68 16.6
-1.68+1.0 4.1
-1.0+0.5 6.9
-0.5+0.250 3.8
-0.25+0.150 1.5
-0.150+0.075 1.2
-0.075+0.045 1.4
-0.045 1.6
Total 100.0
Size Analysis

Results obtained from Bench Scale Beneficiation studies
21

Flow sheet developed from Pilot Scale testworks
22
Summary
Description Wt% Fe% (T) Al203% SiO2%
HEAD GRADE 100 51.4 7.8 8.7
PR
OD
UC
T Sinter Fines 14.4 63.1 3.1 2.2
Pellet Conc 17.4 61.5 3.4 2.8
Total Conc 31.8 62.2 3.3 2.5
REJ
ECT
Intermediate (Spiral Reject)
28.4 51.9 8.5 6.6
Reject/Tailing 39.8 40.2 12.8 17.2
Final Reject 68.2 45.1 11.0 12.8
Ex-mine cost of product 160% higher than usual ~70% material is Reject- space for disposal/mode??

Discussion on Tata Steel’s perspective
23

Revision of Threshold Value of Iron : Tata Steel’s Perspective
24
• Sub grade material generated during the course of mining is stacked separately considering poor beneficiability of such ore and limitation in end use due to low Fe, higher Alumina & Silica
• Recent test works suggest 50-58% Fe material still have a scope for beneficiation in future, although with poor recovery (~30%), and has usage in steel making provided economics works, 45-50% Fe material is still worse.
• Interestingly, corresponding alumina content of the ROM ore that can still be used after beneficiation is upto ~10% (for iron ore of Odisha-Singhbhum region)
• Presently, pitshell is designed with 45% Fe threshold and then a cut off grade on Fe 58% decides the plant feed. Sub-grade material which incidentally gets generated during the course of mining needs to be excavated and stacked separately which has an impact on the mining operation (efficiency, cost) and stacking.
• Further, if such ore can not be economically used due to limitation of gangue content (especially alumina for ore of Singhbhum-Odisha region), it is always better to redefine the pit shell upto maximum usable gangue content (~10% Al2O3) and leave this material in-situ, and thereby bring a positive impact on operations as well as on environment.

Summary & Recommendations
25

Summary & Recommendations
26
Available beneficiation testswork results indicate that only 50-58% Fe ore (upto a corresponding alumina of 10%) can be upgraded through various beneficiation process in order to make it suitable for use in steel industry.
It is not only Fe(t), Alumina & Silica in iron ore plays important role in Blast Furnace operations and sintering Processes.
Even if concentrate quality is compromised, poor yield on beneficiation of 50-55% Fe ore stress upon economics; disposal of tailings (~70%) is a concern (handling, space, environment). All these would adversely impact production cost by many fold.
The current 45% Fe threshold limit is far lower than practicable, particularly w.r.t. Odisha-Jharkhand ore. However, an upper limit of alumina content may still help the industry.
If it is further lowered, Steel makers might be pushed to evaluate other option like import of ore at lower cost as raw material quality impacts techno-commercial performance of a steel plant to a great extent.
Inferior iron ore quality may even lead to increase import of coking coal, low alkali dolomite, limestone etc.
Therefore, if an upward revision of Threshold value from existing 45% is not possible, we suggest an alumina cap of 10% in ROM ore while revising Threshold value of Iron Ore.

27