
View Online / Journal Homepage / Table of Contents for …agodec/JMC_2012_vdW_transport.pdfpanel)...
9
Guest–host van der Waals interactions decisively affect the molecular transport in mesoporous media† Tina Ukmar, a Uro s Maver, a Odon Planin sek, b Albin Pintar, a Ven ceslav Kau ci c, ac Alja z Godec * a and Miran Gaber s cek * ac Received 22nd July 2011, Accepted 18th October 2011 DOI: 10.1039/c1jm13493k We present clear evidence that the global (macroscopic) transport from/to mesoporous materials is significantly affected by the interactions between the mesoporous host and the guest molecules. The problem is considered in a most general way so the solutions apply for a variety of cases such as the release of a guest from porous matrices, catalysis occurring in porous materials or processes taking place in separation techniques. The concept is proved on the experimentally determined release profiles of a model drug (indomethacin) from accurately designed SBA-15 and MCM-41 mesoporous silicates. In order to allow for a full quantitative analysis, a very high frequency of sampling was carried out at short release times. The agreement between the experimentally determined and the theoretically predicted curves is excellent not only in shape but also in all major trends. In the broadest sense, one might say that the host–guest interactions change the effective cross-section of pores through which the transport of guest occurs. In addition, the interactions lower the efficiency of utilization of the guest. In drug release this is observed as a decrease of released matter at long times, in catalysis this would correspond to a decrease of global turnover efficiency etc. However, it is not only the final outcome that is affected but also the transport pattern (e.g. the shape of release curves) during a wide range of timescales. Our finding might have a profound influence on the design of various devices based on meso- or macroporous materials. 1 Introduction Molecular transport in or across porous media plays a key role in very diverse fields such as rheology, composite materials, poly- mer and colloidal science, geology, catalysis, separation science, biophysics and drug delivery. As with regards to the molecular motion inside the pores, many interesting phenomena have been reported. 1–6 For example, in the case of pore sizes up to 1 nm, such as typically found in zeolites, the molecular dynamics are characterized by single file diffusion, 7 incommensurate diffu- sion 8,9 and loading dependent diffusion path control. 10 In such cases, the transport is determined by a complex interplay between adsorbent–adsorbate and adsorbate–adsorbate inter- actions. In the case of zeolites the role of guest–host interactions is conventionally termed the ‘thermodynamic factor’ 11 and was also found to be important for transport in molecular framework microporous materials. 12 When the pore size is increased up to 2 nm, features of classical Brownian dynamics appear, but the conventional mobility-dependent free volume relationship still does not apply. 3 Meanwhile, as we enter the domain of meso- porous materials (with pore sizes between 2.5 and 30 nm), the transport occurs in terms of regular Brownian motion, man- ifested as Knudsen diffusion established via collisions with pore walls in the case of gases 13 and regular diffusion at liquid densities. Recently it was shown that transport of gases in the case of strong guest–host attractions does not follow the Knudsen prediction because strong adsorptions creates highly conducting paths in small pores that compete with large pores and leads to a reduction in tortuosity with molecular size. 14 Also, the attractions to host walls were shown to intimately determine the nature of the mechanism of wall reflections and in particular the momentum exchange at a collision (see ref. 15 and 16 for an in-depth review of the subject). It remains questionable, however, to what extent all these interesting phenomena that occur inside micro, meso and macro pores, affect the macroscopic (also termed large scale) transport. Namely, it is the latter that is actually probed in basically all applications mentioned above. For example, in separation, 17 catalysis, 18–21 drug delivery 22–32 and other applications any changes (e.g. in concentration of active species) are probed ‘far a National Institute of Chemistry, Hajdrihova 19, Ljubljana, Slovenia. E-mail: [email protected]; [email protected]; Fax: +386-1-4760- 300; Tel: +386-1-4760-316 b Faculty of Pharmacy, University of Ljubljana, Ljubljana, Slovenia c Faculty of Chemistry and Chemical Technology, University of Ljubljana, Ljubljana, Slovenia † Electronic Supplementary Information (ESI) available: See DOI: 10.1039/c1jm13493k/ 1112 | J. Mater. Chem., 2012, 22, 1112–1120 This journal is ª The Royal Society of Chemistry 2012 Dynamic Article Links C < Journal of Materials Chemistry Cite this: J. Mater. Chem., 2012, 22, 1112 www.rsc.org/materials PAPER Downloaded by Ruprecht-Karls Universitat Heidelberg on 23 April 2012 Published on 18 November 2011 on http://pubs.rsc.org | doi:10.1039/C1JM13493K View Online / Journal Homepage / Table of Contents for this issue
Transcript of View Online / Journal Homepage / Table of Contents for …agodec/JMC_2012_vdW_transport.pdfpanel)...
Dynamic Article LinksC<Journal ofMaterials Chemistry
Cite this: J. Mater. Chem., 2012, 22, 1112
www.rsc.org/materials PAPER
Dow
nloa
ded
by R
upre
cht-
Kar
ls U
nive
rsita
t Hei
delb
erg
on 2
3 A
pril
2012
Publ
ishe
d on
18
Nov
embe
r 20
11 o
n ht
tp://
pubs
.rsc
.org
| do
i:10.
1039
/C1J
M13
493K
View Online / Journal Homepage / Table of Contents for this issue
Guest–host van der Waals interactions decisively affect the moleculartransport in mesoporous media†
Tina Ukmar,a Uro�s Maver,a Odon Planin�sek,b Albin Pintar,a Ven�ceslav Kau�ci�c,ac Alja�z Godec*a
and Miran Gaber�s�cek*ac
Received 22nd July 2011, Accepted 18th October 2011
DOI: 10.1039/c1jm13493k
We present clear evidence that the global (macroscopic) transport from/to mesoporous materials is
significantly affected by the interactions between the mesoporous host and the guest molecules. The
problem is considered in a most general way so the solutions apply for a variety of cases such as the
release of a guest from porous matrices, catalysis occurring in porous materials or processes taking
place in separation techniques. The concept is proved on the experimentally determined release profiles
of a model drug (indomethacin) from accurately designed SBA-15 and MCM-41 mesoporous silicates.
In order to allow for a full quantitative analysis, a very high frequency of sampling was carried out at
short release times. The agreement between the experimentally determined and the theoretically
predicted curves is excellent not only in shape but also in all major trends. In the broadest sense, one
might say that the host–guest interactions change the effective cross-section of pores through which the
transport of guest occurs. In addition, the interactions lower the efficiency of utilization of the guest. In
drug release this is observed as a decrease of released matter at long times, in catalysis this would
correspond to a decrease of global turnover efficiency etc.However, it is not only the final outcome that
is affected but also the transport pattern (e.g. the shape of release curves) during a wide range of
timescales. Our finding might have a profound influence on the design of various devices based on
meso- or macroporous materials.
1 Introduction
Molecular transport in or across porous media plays a key role in
very diverse fields such as rheology, composite materials, poly-
mer and colloidal science, geology, catalysis, separation science,
biophysics and drug delivery. As with regards to the molecular
motion inside the pores, many interesting phenomena have been
reported.1–6 For example, in the case of pore sizes up to 1 nm,
such as typically found in zeolites, the molecular dynamics are
characterized by single file diffusion,7 incommensurate diffu-
sion8,9 and loading dependent diffusion path control.10 In such
cases, the transport is determined by a complex interplay
between adsorbent–adsorbate and adsorbate–adsorbate inter-
actions. In the case of zeolites the role of guest–host interactions
is conventionally termed the ‘thermodynamic factor’11 and was
also found to be important for transport in molecular framework
aNational Institute of Chemistry, Hajdrihova 19, Ljubljana, Slovenia.E-mail: [email protected]; [email protected]; Fax: +386-1-4760-300; Tel: +386-1-4760-316bFaculty of Pharmacy, University of Ljubljana, Ljubljana, SloveniacFaculty of Chemistry and Chemical Technology, University of Ljubljana,Ljubljana, Slovenia
† Electronic Supplementary Information (ESI) available: See DOI:10.1039/c1jm13493k/
1112 | J. Mater. Chem., 2012, 22, 1112–1120
microporous materials.12 When the pore size is increased up to
2 nm, features of classical Brownian dynamics appear, but the
conventional mobility-dependent free volume relationship still
does not apply.3 Meanwhile, as we enter the domain of meso-
porous materials (with pore sizes between 2.5 and 30 nm), the
transport occurs in terms of regular Brownian motion, man-
ifested as Knudsen diffusion established via collisions with pore
walls in the case of gases13 and regular diffusion at liquid
densities. Recently it was shown that transport of gases in the
case of strong guest–host attractions does not follow the
Knudsen prediction because strong adsorptions creates highly
conducting paths in small pores that compete with large pores
and leads to a reduction in tortuosity with molecular size.14 Also,
the attractions to host walls were shown to intimately determine
the nature of the mechanism of wall reflections and in particular
the momentum exchange at a collision (see ref. 15 and 16 for an
in-depth review of the subject).
It remains questionable, however, to what extent all these
interesting phenomena that occur inside micro, meso and macro
pores, affect the macroscopic (also termed large scale) transport.
Namely, it is the latter that is actually probed in basically all
applications mentioned above. For example, in separation,17
catalysis,18–21 drug delivery22–32 and other applications any
changes (e.g. in concentration of active species) are probed ‘far
This journal is ª The Royal Society of Chemistry 2012

Fig. 1 Schematic of the scales involved in typical experiments: the
measurements are performed on a macroscopic scale (left) while the
transport phenomenon involves the microscopic scale (right).
Fig. 2 (a) Top panel: Schematics of 2-dimensional model porous
matrices. The pore volume, Vp ¼ L(L � na) ¼ const., and pore entrance
area, Ap ¼ 2(n� 1)d¼ const. are held constant while varying n, d and a in
a way that preserves L ¼ na + (n � 1)d. Specifically we take the following
values of d (a): d0 (18D), 4d0/5 (15D), d0/2 (10D) and 2d0/5 (9D) with d0 ¼10D, L¼ 130D and LB ¼ 175D. The thickness of the outermost two walls
in the last parameter set is 1D larger than those of inner walls (that is 10D
instead of 9D), which is necessary to preserve constant L, Vp and Ap in all
cases. Bottom panel: Types of initial conditions used in the calculations.
Type I correspond to a homogeneous concentration inside the pores,
Type II to an internal concentration proportional to the local Boltzmann
factor and Type III to a thin homogeneous adlayer at the internal pore
walls. To assess its influence on release kinetics an additional thin
homogeneous surface adlayer was added on the external matrix surface.
(b) Various effective pair interaction potentials (top panel) and (bottom
panel) resulting average contact potentials, hVconti (dotted lines), and
average potentials in the center of pores, hVcenti (full lines).
Dow
nloa
ded
by R
upre
cht-
Kar
ls U
nive
rsita
t Hei
delb
erg
on 2
3 A
pril
2012
Publ
ishe
d on
18
Nov
embe
r 20
11 o
n ht
tp://
pubs
.rsc
.org
| do
i:10.
1039
/C1J
M13
493K
View Online
away’ from the porous media (Fig. 1). Thus, even if inside the
pores very complex phenomena may occur, does the probe feel
these local changes at distances that are many orders larger than
the typical dimensions of pores? Similarly, can we probe changes
inside the pores that, by nature, are much faster (adsorption,
chemical or electrochemical reaction etc.) than the macroscopic
transport towards the probe?What one needs, therefore, is a clear
coupling between the local processes (i.e. processes inside the
pores) and large-scale transport, that is, the transport from the
porousmedium to the probe positioned in bulk system (seeFig. 1).
An attempt of such a quantitative coupling has been made in our
previous work33 where it was found that a decrease in pore size
leads to significant enhancement ofmacroscopic transport, within
a certain timescale. However, in that preliminary work we
neglected the interactions between the porous system and the
guest which is a rather non-realistic situation, so the results were
mainly interesting from the conceptual point of view.
In the present work we demonstrate, for the first time on
a basis of realistic experiment, a quantitative coupling between
the local dynamics in a porous system and the large scale
transport. In particular, we show how a general interaction
between the porous matrix and the guest matter affects the
macroscopic transport of the guest to a probe positioned outside
the porous matrix at relatively large distances, as found in most
of the applications. As a model system we chose a drug release
system, although the results are valid for any other porous
system with considerable guest–matrix interaction (most systems
of practical interest). The drug system is chosen mainly due to the
fact that during the recent years very precise nanoarchitecturing
of certain porous matrixes has been developed. Thus, not only
the pore composition, but also its size, distribution of sizes, shape
etc. can effectively be tailored. In the present paper we have been
able to control, very accurately, another crucial parameter
needed for quantitative treatment—the particle size of different
mesoporous hosts. In particular we preparedMCM-41 and SBA-
15, which have an equal particle size and show no intergrowth
aggregation. For an easier comparison with our related work34
we have selected indomethacin as a model guest (solute).
Considering the fact that the large scale molecular transport in
most systems studied experimentally occurs on the time scale of
several (tens of) hours while the transport inside the pores is
several orders of magnitude faster, any theoretical approach
must inherently be able to capture the features of the system
dynamics on such a wide span of time and length scales.
Unfortunately, most molecular techniques such as classical or ab
initioMolecular Dynamics, Langevin Dynamics simulations, etc.
are inapplicable due to the fact that a simulation of the system
This journal is ª The Royal Society of Chemistry 2012
with several pores on an experimentally relevant time scale is
simply infeasible. Therefore, we chose a mesoscopic continuum
description which describes molecular transport in terms of the
dynamics of the dimensionless solute concentration field. As we
show in continuation, such a model is able to capture and explain
the most essential features observed experimentally.
Hexagonal porous matrices of size L are modeled as
2-dimensional arrays of channels with diameter d and pore wall
thickness a (see Fig. 2(a) top panel). The matrix is surrounded by
a buffer zone of thickness LB, which is chosen to be large enough
to assure that the interactions with pore walls vanish and that the
concentrations never reach appreciable values at large distances
from the matrix. While varying the pore size and attractions to
pore walls the total pore volume, pore entrance area along with L
and LB are kept constant in all cases (see Fig. 2(a) and the
Methods section for further details).
When guest molecules enter a mesoporous host, one expects at
least the development of van der Waals (vdW) type interactions
between both phases. The essential and fundamental questions
that we want to address in the present paper are the following:
Do local interactions (of vdW type) between the porous host and
guest molecules affect the macroscopic transport from the pores
to a large distant probe? If yes, how important is the strength of
these local interactions? And finally, does the pore size matter?
J. Mater. Chem., 2012, 22, 1112–1120 | 1113

Dow
nloa
ded
by R
upre
cht-
Kar
ls U
nive
rsita
t Hei
delb
erg
on 2
3 A
pril
2012
Publ
ishe
d on
18
Nov
embe
r 20
11 o
n ht
tp://
pubs
.rsc
.org
| do
i:10.
1039
/C1J
M13
493K
View Online
Needless to say, any progress in understanding these correlations
could lead to a significant optimization of devices and materials
used in drug release, separation techniques, catalysis, etc.
2 Methods
2.1 Synthesis of SBA-15 matrix
SBA-15 with the average pore size of 9 nm was prepared with
a hydrothermal synthesis using the structure directing agent
Pluronic P123 (a PEG-PPG-PEG block copolymer, Aldrich) and
tetraethyl orthosilicate (98% TEOS, Aldrich) as a silica
precursor. The material was prepared closely along the lines
reported in ref. 35 but with slight modifications to achieve the
desired particle size and morphology. First, 4.0 g of triblock
copolymer Pluronic P123 was added to a mixture of 30 g of water
and 120 g of 2 M HCl aqueous solution, which was stirred at
room temperature for 3–4 h until Pluronic P123 was dissolved.
Then, 8.50 g of TEOS was added to this solution under vigorous
stirring. After 10 min, the mixture was kept under static condi-
tions at 312 K (instead of 308 K) for 20 h, followed by a hydro-
thermal synthesis in a Teflon-lined autoclave for 24 h at 373 K.
The solid products were collected by filtration, washed with
water, dried, and calcined at 823 K in flowing air. A comparison
of material characteristics with those reported in the literature35
confirmed that the prepared material was in fact of SBA-15 type,
thus the sample was denoted SBA-15.
2.2 Synthesis of MCM-41 matrix
MCM-41 with a mean pore diameter of 3 nm was synthesized
using the structure directing agent hexadecyl-
trimethylammonium bromide (CTAB, Aldrich) and tetraethyl
orthosilicate (98% TEOS, Aldrich) as a silica source. The mate-
rial was prepared along the lines reported in ref. 36 but with
slight modifications of the synthesis conditions. First, 26.7 g of
ammonia solution (25% NH4OH, Merck) was mixed with 105 g
of distilled water and then 0.5 g of CTAB was added to the
solution. The mixture was placed in an oil bath under stirring and
heated to a homogeneous solution. When the solution had
become clear, 2.35 g of TEOS was added dropwise. After 3 h of
stirring and heating at 348 K, the obtained white powder was
washed on a filter and calcined at 823 K for 6 h in an air flow to
remove the CTAB from the pores. A comparison of material
characteristics with those reported in the literature36 confirmed
that the prepared material was in fact of MCM-41 type, thus the
sample was denoted MCM-41.
2.3 Guest molecule loading
Loading with the model guest molecule indomethacin was per-
formed as follows. First a solution of indomethacin (g-IMC,
Sigma) in tetrahydrofuran (THF, Sigma-Aldrich) was prepared
with the IMC solution at a concentration of 75 mg g�1. THF was
added drop-wise to a fine layer of calcined samples of SBA-15
andMCM-41, allowing the powder to soak the added drops. The
prepared samples were then dried, first at 313 K for 24 h in
a ventilation dryer and then, additionally, for 24 h at 313 K in
a vacuum dryer. The first step is supposed to remove the majority
of the solvent while the second step removes the residual solvent
1114 | J. Mater. Chem., 2012, 22, 1112–1120
which is adsorbed more strongly to the pore walls or capillary
condensed. Immediately after drying, the samples were placed in
an desiccator under an inert Ar atmosphere to avoid exposure to
moisture and kept under such conditions until right before the
measurements. It was found that such pretreatment decisively
improved the repeatability and enabled one to avoid the other-
wise very prominent effects of residual loading of solvent and/or
water.
2.4 Scanning (SEM) and transmission (TEM) electron
microscopy
SEM micrographs were obtained by a Zeiss SupraTM 35VP
Scanning Electron Microscope (SEM) operated at 1 keV. TEM
analysis was performed on a 200-kV field-emission gun (FEG)
microscope JEOL JEM 2100. For TEM studies, a drop of an
ethanol-diluted nanoparticle solution was placed on a copper
grid and dried at room temperature. The specimens were addi-
tionally coated with carbon in order to prevent excessive
charging and decomposition of the sample under the electron
beam.
2.5 X-Ray powder diffraction (XRPD)
XRPD patterns were recorded on a PANalytical X-Pert PRO
high-resolution diffractometer with a1 configuration using
CuKa1 radiation (1.5406 �A) in the range from 0.5 to 10� 2q, usinga step of 0.017� per 100 s and separately in the range from
5 to 35� 2q, using a step of 0.033� per 100 s under air conditions.
2.6 N2 adsorption–desorption analysis
Adsorption and desorption isotherms of nitrogen were measured
on a Micromeritics ASAP 2020 volumetric adsorption analyzer
at 77 K. Before the sorption analysis, the calcined samples were
outgassed under vacuum for 2 h at 473 K and the loaded samples
for 2 h at 333 K. The specific surface area (SBET) was determined
using the BET (Brunauer–Emmett–Teller) equation. The total
pore volume (Vt) was estimated from the amount adsorbed at
a relative pressure of 0.989, converting it to the volume of liquid
nitrogen at 77 K. The microporosity of SBA-15 (Vmi) was
calculated by the t-plot method from the adsorption data. The
calculation of pore size distribution (PSD) was performed by
analyzing the adsorption data of the N2 isotherm using the
Barrett–Joyner–Halenda (BJH) method with a Halsey–Faas
correction for bare calcined and loaded SBA-15, and the BJH
method with a Halsey–Kruk–Jaroniec–Sayari correction for
bare calcined and loaded MCM-41. The average pore diameter,�dme corresponds to the peak value of the BJH distribution.
2.7 Quantification of loading fraction
The quantification of the relative amount of the loaded guest
molecules was carried out by means of thermogravimetric anal-
ysis (TGA) coupled with differential scanning calorimetry
(DSC). Measurements were carried out between 303 and 1073 K
with a heating rate of 20 K min�1 using a Mettler Toledo
(Schwerzenbach, Switzerland) thermogravimetric analyzer
model TGA/DSC 1 under a constant gas flow rate (oxygen,
This journal is ª The Royal Society of Chemistry 2012

Dow
nloa
ded
by R
upre
cht-
Kar
ls U
nive
rsita
t Hei
delb
erg
on 2
3 A
pril
2012
Publ
ishe
d on
18
Nov
embe
r 20
11 o
n ht
tp://
pubs
.rsc
.org
| do
i:10.
1039
/C1J
M13
493K
View Online
50 mLmin�1). The initial sample mass ranged from 5–10 mg. The
measurements were repeated three times.
The weight loss accompanying the combustion of IMC was
used to determine the fraction of loaded IMC (for details see the
ESI).† The temperature interval of the IMC combustion was
determined from the first derivative of the weight loss with
respect to temperature. The absence of IMC particles located
outside the pores was confirmed with a combination of X-ray
powder diffraction and solid-state NMR, both performed at
several temperatures. Further details of the characterization
procedures are given elsewhere.34
2.8 Guest release experiments
Release experiments were performed in highly purified water
using a standard dissolution apparatus (USP Dissolution
Apparatus 1, Vankel Dissolution apparatus, model VK 7000,
USA) equipped with a wire-mesh basked attached to a rotation
shaft adjusted to 50 rpm at 298 K. The approach (Apparatus 1
and slow rotation) was chosen specifically to avoid the intrinsic
hydrodynamic issues arising in the rotating paddle method (USP
Dissolution Apparatus 2),37 which is usually used for these sorts
of experiments, and to minimize all hydrodynamic effects in
general. Samples were collected in triplet replicas at frequent,
predetermined time intervals and filtered through 0.45 mm filters.
The concentration was determined spectrophotometrically at 268
nm using a HP diode array UV-VIS spectrophotometer (8453,
Germany). At this wavelength the THF absorption does not
interfere with the IMC absorption (for details see the ESI).† The
collected volumes were replaced by equal volumes of the disso-
lution medium (highly purified water) to maintain a constant
volume. These replacements were considered when determining
actual concentrations at different time intervals. The release
experiments were carried out in five-fold replicas to minimize the
statistical error.
2.9 Model and computational methods
Porous matrices were modeled as 2-dimensional arrays of
channels with diameter d and wall thickness a (see Fig. 2(a) top
panel). This structure should describe well the geometry of the
porous network in mesoporous silicates with an hexagonal pore
arrangement, such as SBA-15, MCM-41 and related materials.
For a discussion of the geometrical relations between these 2D
models and real matrices see ref. 33. We denote the size of the
porous matrix with L and the thickness of the surrounding buffer
zone by LB. LB is chosen to be large enough to assure that the
interactions with pore walls vanish and that the concentrations
never reach appreciable values at large distances from the matrix.
L and LB are kept constant in all cases. We fix the total pore
volume and the total pore entrance area and consider various
pore sizes (see Fig. 2(a)).
As they move through the porous matrix, solute molecules
experience an external force due to interactions with pore walls.
The total external interaction potential experienced by
a diffusing solute molecule at a given position r is equal to the
sum of interactions with all molecules constituting pore walls.
We describe the attractive part of these effective intermolecular
interactions using the attractive part of a pairwise additive
This journal is ª The Royal Society of Chemistry 2012
interaction potential of the Morse type and the repulsive part
simply with a hard repulsive core (see Fig. 2(b)) Thus, the local
external potential is defined as
VðrÞ ¼ðR
rðr0Þupðjr� r0jÞd2r0; (1)
where the pair potential is defined as
upðRÞ ¼qmin
�e2sðz�RÞ � 2esðz�RÞ� if R$D
N otherwise:
((2)
where r(r) is the local density of the matrix at position r ¼ (x, y)
and is equal to 1 if r lies inside a pore wall and zero otherwise.
qmin and z are the depth and position of the pair potential
minimum, s describes the width of the potential well and thereby
also its range and D is a lower cut-off distance, which will be
explicitly defined later.
The dynamics of the dimensionless solute concentration fieldC
(r) are assumed to be governed by drift due to the local forces
exerted on diffusing molecules by pore walls and diffusion due to
the presence of local concentration gradients. We consider a low
Reynolds number environment (overdamped regime) and
isotropic mobility, m ¼ D/kBT, and thus we assume a linear
relationship between force and velocity, v ¼ mF. The system
evolves according to the 2-dimensional Fokker–Planck equation
(FPE):
vCðrÞvt
¼ DVxy$
�CðrÞkBT
VxyVðrÞ þ VxyCðrÞ�h� Vxy$j (3)
where Vxy represents the 2-dimensional gradient operator, Vxy ¼v/vxx + v/vyy, D is the diffusion coefficient, kB is the Boltzmann
constant, T is the temperature, and j the generalized flux. Since
the impenetrability conditions simply reflect the absence of an
effective driving force for solute transport into the pore walls, we
can replace the repulsive part of the external potential by
reflecting boundary conditions (BCs) for C and V at the walls,
VxyC$n¼ 0 and VxyV$n¼ 0, where n is the unit surface normal of
pore walls. Such a choice of BCs is accurate in the overdamped
regime while this would not be the case if inertial effects would be
important. In the latter case the appropriate choice would
instead be the point of zero velocity in the normal direction of
pore walls. In the present case, however, the temporal resolution
of the model is longer than the typical time scale of momentum
relaxation. Note that the assumption of the mobility being
isotropic is likely not to hold rigorously (see for example ref. 16)
but is expected to differ in the axial and normal directions mainly
due to molecular packing and boundary-layer hydrodynamic
effects. A self-consistent inclusion of the pore size dependence of
the anisotropic diffusion tensor is not manageable within the
present theoretical framework and is therefore omitted. Such
a simplification is not expected to affect the qualitative nature of
the dynamics on the scales of interest.
All calculations are performed numerically on a square grid
with spacing D. First we evaluate the integral in 1 using the
attractive part of up with z¼ D and s¼ 1 and then solve the FPE
under reflecting boundary conditions for C and V at pore walls
and external borders of the grid. Further computational details
and formal definitions of average potential characteristics hVcentiand hVconti are presented elsewhere.6
J. Mater. Chem., 2012, 22, 1112–1120 | 1115

Fig. 3 SEM and TEM images of prepared (a) SBA-15 and (b) MCM-41.
Dow
nloa
ded
by R
upre
cht-
Kar
ls U
nive
rsita
t Hei
delb
erg
on 2
3 A
pril
2012
Publ
ishe
d on
18
Nov
embe
r 20
11 o
n ht
tp://
pubs
.rsc
.org
| do
i:10.
1039
/C1J
M13
493K
View Online
We consider different types of initial conditions (IC), which
are most likely to be met in experimental studies (see Fig. 2(a)
bottom panel). The basic types of IC (I–III) represent situations
where no guest molecules are initially located on the external
surface. Specifically, type I corresponds to a homogeneous
concentration inside the pores, type II to a concentration
proportional to the local Boltzmann factor, exp(�V(r)/kBT), and
type III to a thin adlayer of equal concentration as in type I. In
a separate set of calculations we additionally introduce a thin
adlayer of various concentrations on the external surface of the
matrix.
Along with complete absence of solute–wall attractions
(qmin ¼ 0) we consider several strengths of attraction with qmin
between 0.05 and 0.5 kBT (see Fig. 2(b)). We perform 280 � 103
integration steps with increment Dt taking the dimensionless
parameter a h DDt/D2 ¼ 0.2.
The large-scale transport kinetics are quantified by means of
two effective parameters. One is the mean release time (or mean
transport time in the case of separation and catalysis), t1/2,
defined as the time in which half of guest molecules are trans-
ported into the bulk solution (for details see the ESI)† and is
obtained simply by integration of the total flux across the outer
surface of the so-called diffusion layer, O:ðt1=20
ds#Ojðr; sÞ$dS ¼ 1
2
ðR
Cðr; s ¼ 0Þd2r; (4)
where dS is the differential of the surface normal of O. The other
is the effective large-scale diffusion coefficient, Deff, describing
intrinsic large-scale transport behavior on large (‘macroscopic’)
time scales. The calculation of the latter is based on fitting the
numerical solution for the time evolution of the guest fraction
outside the porous host to an effective 1-dimensional model,
which is somewhat tedious and details are given in the ESI.†
Fig. 4 Top panel: N2 sorption isotherms of empty and loaded meso-
porous (a) SBA-15 and (b) MCM-41. Bottom panel: the corresponding
XRPD diffraction patterns. The inset shows corresponding pore size
distributions. The black lines correspond to bare silicates and red lines to
drug-loaded silicates.
3 Results and discussion
As mentioned in the Introduction section, a precondition for any
quantitative treatment of experimental data is that the samples
are extremely well defined. This was the reason that we selected
release porous systems based on silicates which can be tailored
very precisely on the nanoscale. Ideally, if different samples are
probed, it is desired that only one experimental variable is
changed. For example, SBA-15 andMCM-41 can be prepared so
that the only significant difference is in pore sizes, as shown in
continuation.
SEM images of the obtained calcined mesoporous silicates
show well defined polyhedral particles without intergrowth
aggregation for both SBA-15 and MCM-41. For both samples
the sizes of mesoporous silica particles range from 400 nm to
1000 nm with an average size around 600 nm (see Fig. 3). In both
cases TEM images clearly show hexagonal arrangements of the
porous system and the uniformity of the cylindrical pores (Fig. 3
inset). The average pore diameter of the silicates is in good
agreement with XRPD patterns and N2 sorption measurements.
In conjunction with TEM images, a high degree of order in the
pore arrangement is also observed from XRPD patterns exhib-
iting three well resolved peaks, which are assigned to reflections
from the (100), (110) and (200) planes of a hexagonal well
ordered structure with p6mm space group. Equal particle size is
1116 | J. Mater. Chem., 2012, 22, 1112–1120
particularly important, since it eliminates particle-size effects on
large-scale transport kinetics and at the same time allows a direct
comparison of experimentally determined release kinetics with
theoretical predictions. The N2 adsorption–desorption isotherms
(shown in Fig. 4 top panel) are found to be of type IV sorption
isotherms according to the IUPAC classification and exhibit
well-defined H1 hysteresis loops, typical for SBA-15 and MCM-
41 silicates. The presence of H1 hysteresis type confirms that they
have open-ended cylindrical mesopores. Both isotherms have
hysteresis loops with sharp adsorption–desorption branches,
which indicates a narrow pore size distribution in both silicates.
The corresponding pore size distributions are shown in Fig. 4
(inset in bottom panel). The specific surface areas, pore volumes
and average pore diameters are given Table 1. Note that the
discrepancy in the total pore volume between SBA-15 and
MCM-41 is only around 28%, which in principle should allow
a direct qualitative comparison with theoretical predictions. As
expected, upon guest loading the specific surface area and the
total pore volume decrease significantly. This suggests that most
of the nanometre channels of the silicates are still open, although
a portion of the voids are filled with guest molecules. The guest
molecules embedded inside the pores do not fully occupy the
This journal is ª The Royal Society of Chemistry 2012

Table 1 Specific surface area, total and micropore volumes and porediameter of prepared mesoporous silicates
sample S [m2 g�1] Vt [cm3 g�1] Vmi [cm
3 g�1]
�dme
[nm]
SBA-15 776 1.075 0.058 9.2MCM-41 1036 0.776 — 3.1SBA-15 + IMC 320 0.5929 0.002 8.4MCM-41 + IMC 224 0.2024 — 2.9
Fig. 5 Experimentally determined release profiles from SBA-15 (red
symbols) and MCM-41 (blue symbols) with average pore diameters 9.2
and 3.1 nm, respectively. Inset: Theoretically predicted release profiles for
type I initial conditions in the case of d ¼ d0 ( ) and d ¼ d0/2( ):
diffusion in the absence of guest–wall attractions (full lines) and in the
case of attractions with qmin ¼ 0.4kBT (dashed lines). Note that the
theoretical results are given in numerical time units Dt ¼ aD2/D.
Dow
nloa
ded
by R
upre
cht-
Kar
ls U
nive
rsita
t Hei
delb
erg
on 2
3 A
pril
2012
Publ
ishe
d on
18
Nov
embe
r 20
11 o
n ht
tp://
pubs
.rsc
.org
| do
i:10.
1039
/C1J
M13
493K
View Online
available space, such that there is still some space for N2
adsorption. The effect of loading is also nicely seen in the pore
size distributions (Fig. 4 red lines). Note that in the case of SBA-
15, the average pore size decreases upon loading, which suggests
that besides fully loaded pore segments, one also finds regions of
thin adlayers. From the diffraction patterns one observes that the
hexagonal pore arrangement is not disrupted upon drug loading.
In agreement with the change in the average pore diameter, the
positions of the (110) and (200) peaks are shifted slightly towards
larger 2q values upon drug loading in the case of SBA-15.
Note also that in the case of SBA-15 at small pore diameters,
the tail in the pore size distribution corresponding to traces of
micropores vanishes, which suggests either filling of micropores
or an extensively obstructed access to the micropores, for
example, due to the presence of a larger guest particle. The
various effects of loading are quantified in Table 1. The relative
fraction of loaded IMC, as determined from TGA/DSC (see
ESI),† is 32% in SBA-15 and 33% inMCM-41. Thus, both model
systems are sufficiently similar and comply with the assumptions
made in the theoretical approach, which allows a direct quali-
tative comparison between the experimental results of the release
kinetics with the theoretical predictions. Note that the well
defined PFG NMR self-diffusion measurements in MCM-41
type materials have revealed that these materials can exhibit
significant deviations from an ideal, uniform structure.38 In other
cases they were also found to form homogeneous ‘single crys-
tals’,39 which is highly likely to hold for materials prepared and
investigated in the present study.
The results of release experiments, presented in terms of the
fraction of released guest as a function of time, are given in
Fig. 5, where one observes two important facts. First, the overall
release is faster from SBA-15, the matrix with larger pores, and
second, the total fraction of released guest is also larger in the
case of SBA-15. This behavior, as well as similar observations in
the literature,23 are unexpected on the basis of the conventional
picture about the molecular release from pores of matrices. In
particular, the difference in total fraction released obtained from
measurements after 5 days (0.44 vs. 0.39 for SBA-15 and MCM-
41, respectively) cannot be explained by the geometrical effect of
the difference in pore size of both samples; the only apparent
difference as inferred from the characterization above. Namely,
it is easy to show that in conventional experimental setups such
as those used here (the volume of the release medium is constant
and the volume of the porous particles is negligible with respect
to the volume of the release medium), the curves for both samples
should converge to the same point (as calculated in inset of
Fig. 5, solid line). Even more, the conventional (diffusion
controlled release) picture predicts that the kinetics of release
from porous matrices are in fact faster in the case of smaller
This journal is ª The Royal Society of Chemistry 2012
pores.33 In other words, the curve for MCM-41 with smaller
pores is expected to have higher values than that for SBA-15 at
all times, as indeed shown in the inset of Fig. 5 (solid curves).
This feature is a direct consequence of the coupling of the
transport in/from several nearby channels which renders single-
channel models inappropriate. In the case of smaller pores, the
lateral volume per unit pore exit area into which the molecules
can diffuse is larger. As a result, the coupling of fluxes from
nearby pores is less obstructive and the flux from the pores is
therefore larger, which can be formulated approximately as more
efficient draining. One may conclude that the classical predic-
tions fail even to reproduce the qualitative trends observed in real
experiments (Fig. 5).
Analyzing many similar measurements one inevitably comes to
a conclusion that in the conventional treatment a crucial ingre-
dient is missing, which leads to systematic errors when one tries
to replicate experiments in a quantitative way. Careful inspection
of literature data shows, quite surprisingly, that one such ingre-
dient that would be expected but is obviously missing is the
interaction between the host matrix and the guest molecules.
Namely, one intuitively expects at least a vdW type interaction
between the two phases that otherwise do not interact via
chemical bonding. Aside from the fact that the inclusion of such
an interaction introduces significant complications in the calcu-
lations, it was also shown that the role of local interactions in the
effective transport on large scales (in particular the coupling of
local and macroscopic fluxes) is far from trivial,6 such that
intuitive ideas about molecular binding to the surface of pore
walls are by far not sufficient to rationalize experimental obser-
vations. These are probably the main reasons for the lack of such
a description in the literature. In an ideal case the role of guest–
wall interactions in transport on all length scales would be best
described with some method with molecular resolution, which is
unfortunately infeasible due to obvious numerical limitations.
Even on a continuum level there arise several technical issues
which we solved by developing a hybrid 4-step operator-splitting
discretization scheme, where we differentiated the diffusive and
drift terms of the FPE on separate grids each with the
J. Mater. Chem., 2012, 22, 1112–1120 | 1117

Dow
nloa
ded
by R
upre
cht-
Kar
ls U
nive
rsita
t Hei
delb
erg
on 2
3 A
pril
2012
Publ
ishe
d on
18
Nov
embe
r 20
11 o
n ht
tp://
pubs
.rsc
.org
| do
i:10.
1039
/C1J
M13
493K
View Online
‘alternating-direction fully implicit method’ (for details refer to
ref. 6). Furthermore, an unambiguous evaluation of the effective
large-scale transport (intrinsic and cumulative) with respect to
matrix parameters is difficult by itself, because of the highly non-
trivial relation between local (in pores) and large-scale transport,
whereby a 1-dimensional effective diffusion process is observed
only for asymptotic times.6 With regards to the intrinsic large-
scale transport, i.e. the effective diffusion coefficient, Deff, one
must additionally assure the absence of finite size-effects, either
by achieving a separation of scales or by assuming a sufficient
symmetry of the porous matrix.40
Quite surprisingly, such an inclusion of a vdW interaction into
the classical transport equations for porous media, immediately
removes all the inconsistencies discussed above. A comparison of
experimental and simulation data (Fig. 5 and Fig. 5, inset,
dashed lines) shows complete reproduction of both important
features, that is, the significant difference in the total fraction and
the faster release from bigger pores (red curves have higher
values at all times). In continuation we explain why the inclusion
of the vdW interaction completely changes the release patterns
and their dependence on selected materials parameters.
Attractions of guest molecules to host walls cause accumula-
tion of the guest at the pore walls, which can be understood as
a multilayer adsorption process (see Fig. 6). Here it should be
stressed that the relaxation towards this transient quasi-equilib-
rium state is very fast and leads to a local distribution, which is
proportional to the Boltzmann factor, exp(�V(r)/kBT) (see ref.
6). As a consequence, the time scales of local (in pores) and large
scale transport are decoupled. To understand this fast local
quasi-equilibration first recall that the first moment of the
incremental molecular motion (the average displacement), hDx(r)i, is zero for diffusion and hDx(r)if �mVV(r)Dt in the case of
drift due to the presence of an external potential V(r)41 (recall
that low Reynolds numbers were assumed). Being a random
motion, the first non-vanishing moment of a diffusive motion is
the variance related to the diffusion coefficient via h(Dx)2i ¼DDt.
In other words, the average displacement of a molecule is influ-
enced only by the local drift whereas its mean square displace-
ment is due to both drift and diffusion. Hence, on a continuum
Fig. 6 Simulation snap-shots in the case of different strengths of
attractions to pore walls.
1118 | J. Mater. Chem., 2012, 22, 1112–1120
scale the concentration field will be displaced by the local drift
and at the same time disperse due to diffusion in a concentration
gradient. Due to the geometry of the porous network V(r) inside
each pore is almost axially symmetric. Thus, to a very good
approximation, the only non-vanishing component of the local
drift will be in the direction normal to pore walls. On the
contrary, due to the large scale concentration gradient between
the interior of the porous matrix and the surrounding bulk
solution the large scale transport will be determined only by the
magnitude of the axial flux component, which, as we show in
continuation, depends greatly on the pores size and strength of
guest–wall attraction. Consequently, the drift displacement,
which depends on the variation of the external potential across
the cross section of pores, causes a quasi-equilibration in the
direction normal to pore walls, the result of which is readily
observed in Fig. 6.
In turn, the transient concentration difference across the cross
section of pores, more specifically the concentration difference
between the center of the pores and the adlayer at pore walls,
depends on the corresponding potential difference. Naturally,
since the interactions between guest and host molecules are short
ranged, the aforementioned potential difference is larger in the
case of larger qmin. The external potential directly at pore walls is
almost independent of pore size, while the potential in the center
of pores is less favorable in larger pores (see Fig. 2(b)), which
means that the aforementioned concentration difference is larger
in larger pores.
The local dynamics depend on the local forces (the drift
component mF(r) ¼ �mVV(r)) and the local concentration
gradient. The net effect is a larger total local flux, but with
a smaller axial component (i.e. a larger component towards the
pore walls), which is readily observed in Fig. 7. Since only the
axial component contributes to large scale release, the effective
release kinetics become depleted. This is shown in Fig. 7.
One can see that the relative cross section of pores, where the
local flux has a non-zero axial component, is smaller in the case
of stronger solute–matrix attractions. Because of the pore size
Fig. 7 Calculated local flux fields in the case of: qmin ¼ 0 (left), qmin ¼0.2kBT (middle) and qmin ¼ 0.4kBT (right). For visual convenience the
magnitude of vectors was scaled up to the ratio (left):(middle):(right) ¼7 : 6 : 1.
This journal is ª The Royal Society of Chemistry 2012
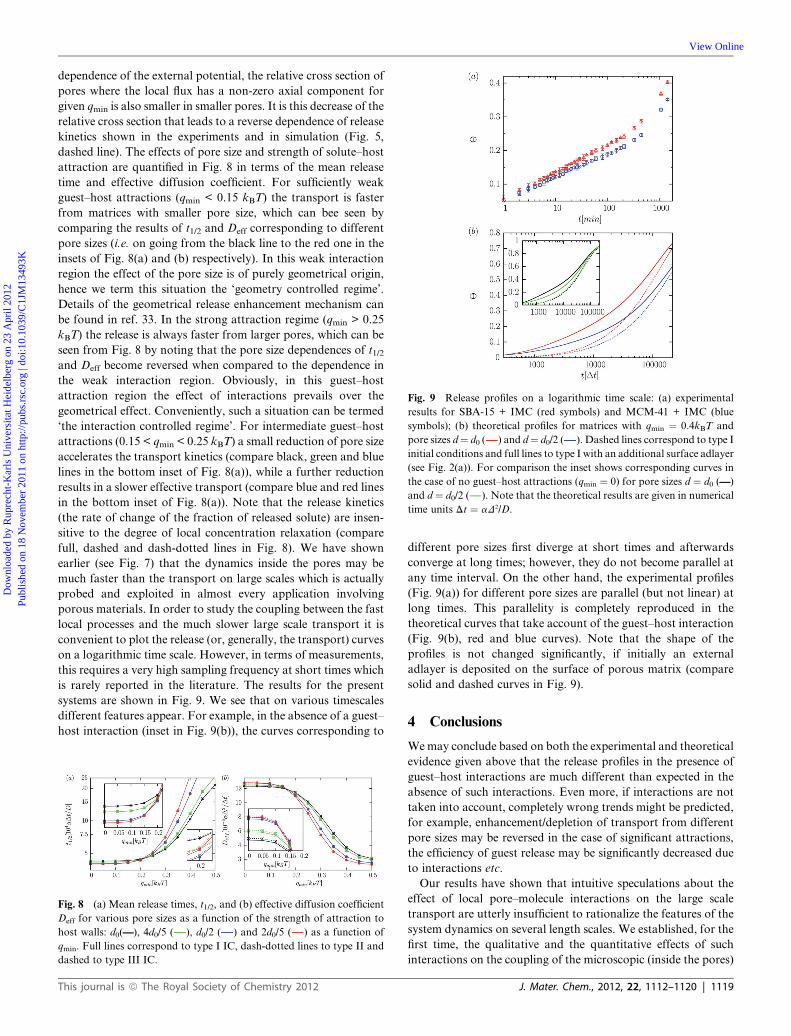
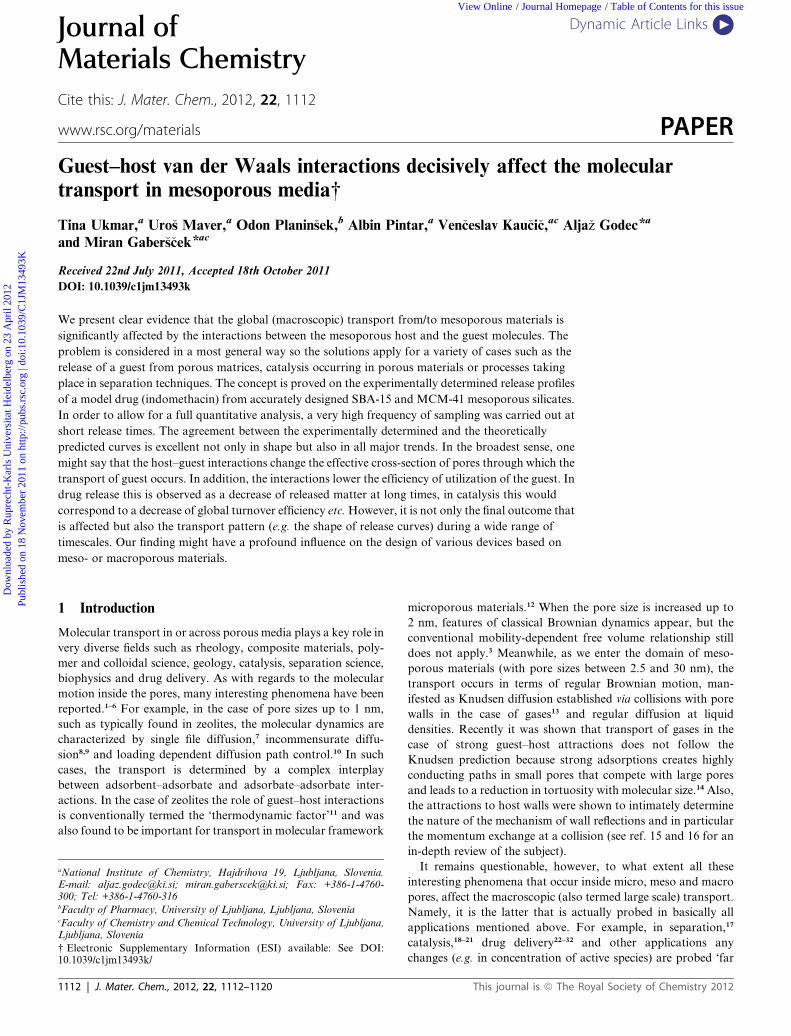
Fig. 9 Release profiles on a logarithmic time scale: (a) experimental
results for SBA-15 + IMC (red symbols) and MCM-41 + IMC (blue
symbols); (b) theoretical profiles for matrices with qmin ¼ 0.4kBT and
pore sizes d¼ d0 ( ) and d¼ d0/2 ( ). Dashed lines correspond to type I
initial conditions and full lines to type I with an additional surface adlayer
(see Fig. 2(a)). For comparison the inset shows corresponding curves in
the case of no guest–host attractions (qmin ¼ 0) for pore sizes d ¼ d0 (——)
and d ¼ d0/2 ( ). Note that the theoretical results are given in numerical
time units Dt ¼ aD2/D.
Dow
nloa
ded
by R
upre
cht-
Kar
ls U
nive
rsita
t Hei
delb
erg
on 2
3 A
pril
2012
Publ
ishe
d on
18
Nov
embe
r 20
11 o
n ht
tp://
pubs
.rsc
.org
| do
i:10.
1039
/C1J
M13
493K
View Online
dependence of the external potential, the relative cross section of
pores where the local flux has a non-zero axial component for
given qmin is also smaller in smaller pores. It is this decrease of the
relative cross section that leads to a reverse dependence of release
kinetics shown in the experiments and in simulation (Fig. 5,
dashed line). The effects of pore size and strength of solute–host
attraction are quantified in Fig. 8 in terms of the mean release
time and effective diffusion coefficient. For sufficiently weak
guest–host attractions (qmin < 0.15 kBT) the transport is faster
from matrices with smaller pore size, which can bee seen by
comparing the results of t1/2 and Deff corresponding to different
pore sizes (i.e. on going from the black line to the red one in the
insets of Fig. 8(a) and (b) respectively). In this weak interaction
region the effect of the pore size is of purely geometrical origin,
hence we term this situation the ‘geometry controlled regime’.
Details of the geometrical release enhancement mechanism can
be found in ref. 33. In the strong attraction regime (qmin > 0.25
kBT) the release is always faster from larger pores, which can be
seen from Fig. 8 by noting that the pore size dependences of t1/2and Deff become reversed when compared to the dependence in
the weak interaction region. Obviously, in this guest–host
attraction region the effect of interactions prevails over the
geometrical effect. Conveniently, such a situation can be termed
‘the interaction controlled regime’. For intermediate guest–host
attractions (0.15 < qmin < 0.25 kBT) a small reduction of pore size
accelerates the transport kinetics (compare black, green and blue
lines in the bottom inset of Fig. 8(a)), while a further reduction
results in a slower effective transport (compare blue and red lines
in the bottom inset of Fig. 8(a)). Note that the release kinetics
(the rate of change of the fraction of released solute) are insen-
sitive to the degree of local concentration relaxation (compare
full, dashed and dash-dotted lines in Fig. 8). We have shown
earlier (see Fig. 7) that the dynamics inside the pores may be
much faster than the transport on large scales which is actually
probed and exploited in almost every application involving
porous materials. In order to study the coupling between the fast
local processes and the much slower large scale transport it is
convenient to plot the release (or, generally, the transport) curves
on a logarithmic time scale. However, in terms of measurements,
this requires a very high sampling frequency at short times which
is rarely reported in the literature. The results for the present
systems are shown in Fig. 9. We see that on various timescales
different features appear. For example, in the absence of a guest–
host interaction (inset in Fig. 9(b)), the curves corresponding to
Fig. 8 (a) Mean release times, t1/2, and (b) effective diffusion coefficient
Deff for various pore sizes as a function of the strength of attraction to
host walls: d0(——), 4d0/5 ( ), d0/2 ( ) and 2d0/5 ( ) as a function of
qmin. Full lines correspond to type I IC, dash-dotted lines to type II and
dashed to type III IC.
This journal is ª The Royal Society of Chemistry 2012
different pore sizes first diverge at short times and afterwards
converge at long times; however, they do not become parallel at
any time interval. On the other hand, the experimental profiles
(Fig. 9(a)) for different pore sizes are parallel (but not linear) at
long times. This parallelity is completely reproduced in the
theoretical curves that take account of the guest–host interaction
(Fig. 9(b), red and blue curves). Note that the shape of the
profiles is not changed significantly, if initially an external
adlayer is deposited on the surface of porous matrix (compare
solid and dashed curves in Fig. 9).
4 Conclusions
Wemay conclude based on both the experimental and theoretical
evidence given above that the release profiles in the presence of
guest–host interactions are much different than expected in the
absence of such interactions. Even more, if interactions are not
taken into account, completely wrong trends might be predicted,
for example, enhancement/depletion of transport from different
pore sizes may be reversed in the case of significant attractions,
the efficiency of guest release may be significantly decreased due
to interactions etc.
Our results have shown that intuitive speculations about the
effect of local pore–molecule interactions on the large scale
transport are utterly insufficient to rationalize the features of the
system dynamics on several length scales. We established, for the
first time, the qualitative and the quantitative effects of such
interactions on the coupling of the microscopic (inside the pores)
J. Mater. Chem., 2012, 22, 1112–1120 | 1119

Dow
nloa
ded
by R
upre
cht-
Kar
ls U
nive
rsita
t Hei
delb
erg
on 2
3 A
pril
2012
Publ
ishe
d on
18
Nov
embe
r 20
11 o
n ht
tp://
pubs
.rsc
.org
| do
i:10.
1039
/C1J
M13
493K
View Online
and macroscopic (experimental scale) transport in the presence
of a macroscopic concentration gradient.
It is worth stressing that the present theoretical treatment is
completely general and does not only apply for release systems
(such as drug release, dissolution from matrices etc.) but for any
transport involving porous systems (down to the lower limit of
mesoporosity), involving various degrees of interactions between
host and guest substances. As regards the drug release, our
results clearly suggest that maximization of the specific surface
area of host (minimization of pore size) will lead not only to
slower release kinetics but also to a decrease of drug utilization,
that is, a significant amount of drug will remain captured inside
the pores due to an attractive vdW interaction.
Thus, in order to efficiently maximize the transport in devices
exploiting meso- or macroporous materials, it is of primary
significance that the interactions between the host and guest be
appropriately controlled (e.g. by selecting appropriate compo-
sitions of both components, by surface modification of host or by
appropriately optimizing the size of pores etc.).
Acknowledgements
The authors acknowledge support from the National programs
P2-0148 and P1-0021.
References
1 J. Kurzidim, D. Coslovich and G. Kahl, Phys. Rev. Lett., 2009, 103,138303.
2 K. Kim, K. Miyazaki and S. Saito, Europhys. Lett., 2009, 88, 36002.3 T.-S. Kim and R. H. Dauskardt, Nano Lett., 2010, 10, 1955.4 J. Russo, J. Horbach, F. Sciortino and S. Succi, Europhys. Lett., 2010,89, 44001.
5 B. J. Sung and A. Yethiraj, J. Chem. Phys., 2008, 128, 054702.6 A. Godec, T. Ukmar, M. Gaber�s�cek and F. Merzel, Europhys. Lett.,2010, 92, 60011.
7 K. Hahn, J. Karger and V. Kukla, Phys. Rev. Lett., 1996, 76, 2762.8 R. L. Gorring, J. Catal., 1993, 31, 13.9 D. Dubbeldam, S. Calero, T. L. M. Maesen and B. Smit, Phys. Rev.Lett., 2003, 90, 245901.
10 D. Dubbeldam, E. Beerdsen, S. Calero and B. Smit, Proc. Natl. Acad.Sci. U. S. A., 2005, 102, 12317.
11 J. K€arger and D. M. Ruthven, Diffusion in Zeolites and OtherMicroporous Solids, John Wiley, New York, 1992.
12 M.Wehring, J. Gascon, D. Dubbeldam, F. Kapteijn, R. Q. Snurr andF. Stallmach, J. Phys. Chem. C, 2010, 114, 10527.
13 K. Malek and M.-O. Coppens, J. Chem. Phys., 2003, 119, 2801.
1120 | J. Mater. Chem., 2012, 22, 1112–1120
14 S. K. Bhatia and D. Nicholson, Chem. Eng. Sci., 2011, 66, 284.15 S. K. Bhatia and D. Nicholson, Phys. Rev. Lett., 2008, 100, 236103.16 S. K. Bhatia, M. Rincon Bonilla and D. Nicholson, Phys. Chem.
Chem. Phys., 2011, 13, 15350.17 T. L. Chew, A. L. Ahmad and S. Bhatia, Adv. Colloid Interface Sci.,
2010, 15, 43.18 Y.Wan, H. Wang, Q. Zhao,M. Klingstedt, O. Terasaki and D. Zhao,
J. Am. Chem. Soc., 2009, 131, 4541.19 K. Feng, R.-Y. Zhang, L.-Z. Wu, B. Tu, M.-L. Peng, L.-P. Zhang,
D. Zhao and C.-H. Tung, J. Am. Chem. Soc., 2006, 128, 14685.20 F. Jiao and H. Frei, Angew. Chem., Int. Ed., 2009, 48, 1841.21 H. Ikemoto, Q. Chi and J. Ulstrup, J. Phys. Chem. C, 2010, 114,
16174.22 M. Vallet-Reg�ı, F. Balas and D. Arcos, Angew. Chem., Int. Ed., 2007,
46, 7548.23 P. Horcajada, A. R�amila, J. P�erez-Pariente and M. Vallet-Reg�ı,
Microporous Mesoporous Mater., 2004, 68, 105.24 I. Izquierdo-Barba, �A.Martinez, A. L. Doadrio, J. P�erez-Pariente and
M. Vallet-Reg�ı, Eur. J. Pharm. Sci., 2005, 26, 365.25 J. Andersson, J. Rosenholm, S. Areva and M. Lind�en, Chem. Mater.,
2004, 16, 4160.26 J.M.RosenholmandM.Lind�en, J. ControlledRelease, 2008, 128, 157.27 F. Qu, G. Zhu, S. Huang, S. Li, J. Sun, D. Zhang and S. Qiu,
Microporous Mesoporous Mater., 2006, 92, 1.28 A. Bernardos, E. Anzar, C. Coll, R. Mart�ınez-Ma~nez, J. M. Barat,
M. D. Marcos, F. Sancen�on, A. Benito and J. Soto, J. ControlledRelease, 2008, 131, 181.
29 C. Y. Lai, B. G. Trewyn, D. M. Jeftinija, K. Jeftinija, S. Xu,S. Jeftinija and V. S. Y. Lin, J. Am. Chem. Soc., 2003, 125, 4451.
30 M. Van Speybroeck, V. Barillaro, T. D. Thi, R. Mellaerts, J. Martens,J. Van Humbeeck, J. Vermant, P. Annaert, G. Van den Mooter andP. Augustijns, J. Pharm. Sci., 2009, 98, 2648.
31 S. W. Song, K. Hidajat and S. Kawi, Langmuir, 2005, 21, 9568.32 J. C. Doadrio, E. M. B. Sousa, I. Izquierdo-Barba, A. L. Doadrio,
J. Perez-Pariente and M. Vallet-Reg�ı, J. Mater. Chem., 2006, 16, 462.33 A. Godec, M. Gaber�s�cek, J. Jamnik and F. Merzel, J. Chem. Phys.,
2009, 131, 234106.34 T. Ukmar, A. Godec, O. Planin�sek, V. Kau�ci�c, G. Mali and
M. Gaber�s�cek, Phys. Chem. Chem. Phys., 2011, 13, 16046.35 A. Sayari, B.-H. Han and Y. Yang, J. Am. Chem. Soc., 2004, 126,
14348.36 Q. Cai, Z.-S. Luo,W.-Q. Pang, Y.-W. Fan, X.-H. Chen and F.-Z. Cui,
Chem. Mater., 2001, 13, 258.37 V. Gray, G. Kelly, M. Xia, C. Butler, S. Thomas and S. Mayock,
Pharm. Res., 2009, 26, 1289.38 F. Stallmach, A. Gr€aser, J. K€arger, C. Krause, M. Jeschke,
U. Oberhagemann and S. Spange, Microporous Mesoporous Mater.,2001, 44–45, 745.
39 F. Stallmach, J. K€arger, C. Krause, C. Krause, M. Jeschke andU. Oberhagemann, J. Am. Chem. Soc., 2000, 122, 9237.
40 J.-L. Auriault and J. Lewandowska, Transp. Porous Media, 2001, 43,473.
41 N. G. Van Kampen, Stochastic Processes in Physics and Chemistry,3rd ed.; North Holland, Amsterdam, 2007.
This journal is ª The Royal Society of Chemistry 2012


![Bill Conti-Rocky [Theme]](https://static.fdocuments.in/doc/165x107/544cb1c5af795903148b47e3/bill-conti-rocky-theme.jpg)