View Eaton's 2016 CDP Response
78
CDP CDP 2016 Climate Change 2016 Information Request Eaton Corporation Module: Introduction Page: Introduction CC0.1 Introduction Please give a general description and introduction to your organization. As a power management company, Eaton develops innovative solutions that help our customers achieve economic growth in a sustainable way. Each year, the majority of our R&D budget is dedicated to that mission. Our engineers design and develop products that improve energy efficiency, conserve fuel, and reduce the carbon footprints of customers worldwide, including: • LED lighting that reduces power consumption and heat while improving optical performance, • Fuel and pneumatic systems that help decrease jet fuel consumption and greenhouse gas (GHG) emissions, and • Innovative filtration technologies that reduce the need for disposable material while providing finer debris filtration in critical manufacturing processes. Eaton was an early leader in onboard refueling vapor recovery (ORVR) systems that reduce GHG emissions by about 95 percent during refueling. Such systems have been in use in the U.S. for some time, and now China—the world’s largest market for passenger and commercial vehicles—is implementing ORVR in early 2017 for cities between Beijing and Guangzhou. We apply Eaton technology to our own sustainability efforts. A comprehensive LED lighting project at our electrical facility in Arden, NC reduced annual carbon emissions by 2.5 million pounds and nitrogen oxides by nearly 22,000 pounds. The facility replaced 600 fluorescent bulbs with Eaton’s award-winning lighting products and a new programmable lighting system. Since 2010, Eaton has cut global GHG emissions by 276,000 metric tons —a 24.5 percent reduction. These results are scalable well beyond Eaton. For example, we can use our learnings to help states and utilities comply with EPA’s Clean Power Plan requirements. Innovation doesn’t always come from a laboratory. Embodying Eaton’s philosophy of “doing business right,” more than 10,000 employees across the globe participated in World Environment Month in June 2015, proving to be key innovators in their communities through projects that raised environmental awareness and reduced environmental footprints. We’re now taking that commitment a step forward by examining the full equation—how our actions and products affect the environment by putting more back into society, the environment and the global economy than we take out. Through our partnership with Harvard’s Sustainability an d Health Initiative for NetPositive Enterprise (SHINE), we’re working with other thought leaders to focus on the “net positive” impact our business, technologies and people can make on the world.
Transcript of View Eaton's 2016 CDP Response
CDP CDP 2016 Climate Change 2016 Information Request
Eaton Corporation
Module: Introduction
Page: Introduction
CC0.1
Introduction
Please give a general description and introduction to your organization. As a power management company, Eaton develops innovative solutions that help our customers achieve economic growth in a sustainable way. Each year, the majority of our R&D budget is dedicated to that mission. Our engineers design and develop products that improve energy efficiency, conserve fuel, and reduce the carbon footprints of customers worldwide, including: • LED lighting that reduces power consumption and heat while improving optical performance, • Fuel and pneumatic systems that help decrease jet fuel consumption and greenhouse gas (GHG) emissions, and • Innovative filtration technologies that reduce the need for disposable material while providing finer debris filtration in critical manufacturing processes. Eaton was an early leader in onboard refueling vapor recovery (ORVR) systems that reduce GHG emissions by about 95 percent during refueling. Such systems have been in use in the U.S. for some time, and now China—the world’s largest market for passenger and commercial vehicles—is implementing ORVR in early 2017 for cities between Beijing and Guangzhou. We apply Eaton technology to our own sustainability efforts. A comprehensive LED lighting project at our electrical facility in Arden, NC reduced annual carbon emissions by 2.5 million pounds and nitrogen oxides by nearly 22,000 pounds. The facility replaced 600 fluorescent bulbs with Eaton’s award-winning lighting products and a new programmable lighting system. Since 2010, Eaton has cut global GHG emissions by 276,000 metric tons—a 24.5 percent reduction. These results are scalable well beyond Eaton. For example, we can use our learnings to help states and utilities comply with EPA’s Clean Power Plan requirements. Innovation doesn’t always come from a laboratory. Embodying Eaton’s philosophy of “doing business right,” more than 10,000 employees across the globe participated in World Environment Month in June 2015, proving to be key innovators in their communities through projects that raised environmental awareness and reduced environmental footprints. We’re now taking that commitment a step forward by examining the full equation—how our actions and products affect the environment by putting more back into society, the environment and the global economy than we take out. Through our partnership with Harvard’s Sustainability and Health Initiative for NetPositive Enterprise (SHINE), we’re working with other thought leaders to focus on the “net positive” impact our business, technologies and people can make on the world.
Craig Arnold Chairman and Chief Executive Officer Eaton Corporation
CC0.2
Reporting Year
Please state the start and end date of the year for which you are reporting data. The current reporting year is the latest/most recent 12-month period for which data is reported. Enter the dates of this year first. We request data for more than one reporting period for some emission accounting questions. Please provide data for the three years prior to the current reporting year if you have not provided this information before, or if this is the first time you have answered a CDP information request. (This does not apply if you have been offered and selected the option of answering the shorter questionnaire). If you are going to provide additional years of data, please give the dates of those reporting periods here. Work backwards from the most recent reporting year. Please enter dates in following format: day(DD)/month(MM)/year(YYYY) (i.e. 31/01/2001).
Enter Periods that will be disclosed
Wed 01 Oct 2014 - Wed 30 Sep 2015
CC0.3
Country list configuration
Please select the countries for which you will be supplying data. If you are responding to the Electric Utilities module, this selection will be carried forward to assist you in completing your response.

Select country
United States of America
CC0.4
Currency selection
Please select the currency in which you would like to submit your response. All financial information contained in the response should be in this currency. USD($)
CC0.6
Modules
As part of the request for information on behalf of investors, electric utilities, companies with electric utility activities or assets, companies in the automobile or auto component manufacture sub-industries, companies in the oil and gas sub-industries, companies in the information technology and telecommunications sectors and companies in the food, beverage and tobacco industry group should complete supplementary questions in addition to the main questionnaire. If you are in these sector groupings (according to the Global Industry Classification Standard (GICS)), the corresponding sector modules will not appear below but will automatically appear in the navigation bar when you save this page. If you want to query your classification, please email [email protected]. If you have not been presented with a sector module that you consider would be appropriate for your company to answer, please select the module below. If you wish to view the questions first, please see https://www.cdp.net/en-US/Programmes/Pages/More-questionnaires.aspx.
Further Information
Module: Management
Page: CC1. Governance
CC1.1

Where is the highest level of direct responsibility for climate change within your organization?
Board or individual/sub-set of the Board or other committee appointed by the Board
CC1.1a
Please identify the position of the individual or name of the committee with this responsibility
The senior vice president of Environment, Health & Safety (EHS), who reports to the executive vice president of Eaton Business System (EBS) , manages our EHS program, including activities associated with climate change. Together, these executives ensure linkage to all critical company practices, processes, and operations. Every 18 months, the SVP reports to the Governance Committee of our Board of Directors. The SVP also reports to the CEO, who provides quarterly updates to the Board about EHS progress.
CC1.2
Do you provide incentives for the management of climate change issues, including the attainment of targets?
Yes
CC1.2a
Please provide further details on the incentives provided for the management of climate change issues
Who is entitled to
benefit from these
incentives?
The type of incentives
Incentivized performance
indicator
Comment
Corporate executive team
Monetary reward
Emissions reduction target
For 2015 - Meet or exceed the following emissions reduction targets (on both an absolute and indexed basis): achieve a 3 percent reduction in GHG emissions, reduce waste to landfill by 3 percent, and reduce water consumption by 3 percent.
All employees Recognition Energy Eaton provides a variety of awards programs that celebrate excellence in the workplace, including energy
Who is entitled to
benefit from these
incentives?
The type of incentives
Incentivized performance
indicator
Comment
(non-monetary) reduction project Efficiency project
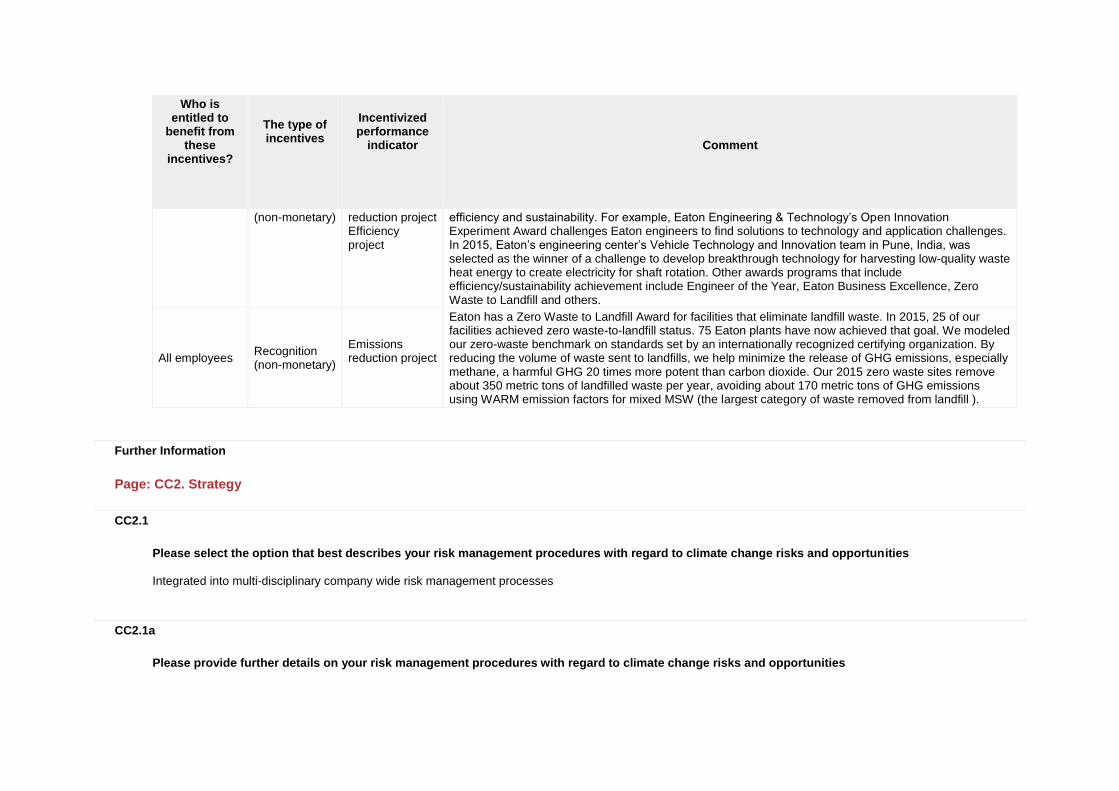
efficiency and sustainability. For example, Eaton Engineering & Technology’s Open Innovation Experiment Award challenges Eaton engineers to find solutions to technology and application challenges. In 2015, Eaton’s engineering center’s Vehicle Technology and Innovation team in Pune, India, was selected as the winner of a challenge to develop breakthrough technology for harvesting low-quality waste heat energy to create electricity for shaft rotation. Other awards programs that include efficiency/sustainability achievement include Engineer of the Year, Eaton Business Excellence, Zero Waste to Landfill and others.
All employees Recognition (non-monetary)
Emissions reduction project
Eaton has a Zero Waste to Landfill Award for facilities that eliminate landfill waste. In 2015, 25 of our facilities achieved zero waste-to-landfill status. 75 Eaton plants have now achieved that goal. We modeled our zero-waste benchmark on standards set by an internationally recognized certifying organization. By reducing the volume of waste sent to landfills, we help minimize the release of GHG emissions, especially methane, a harmful GHG 20 times more potent than carbon dioxide. Our 2015 zero waste sites remove about 350 metric tons of landfilled waste per year, avoiding about 170 metric tons of GHG emissions using WARM emission factors for mixed MSW (the largest category of waste removed from landfill ).
Further Information
Page: CC2. Strategy
CC2.1
Please select the option that best describes your risk management procedures with regard to climate change risks and opportunities
Integrated into multi-disciplinary company wide risk management processes
CC2.1a
Please provide further details on your risk management procedures with regard to climate change risks and opportunities

Frequency of monitoring
To whom are results reported?
Geographical areas considered
How far into the future are risks
considered?
Comment
Six-monthly or more frequently
Board or individual/sub-set of the Board or committee appointed by the Board
North and South America, Europe, Asia and the Middle East
> 6 years
CC2.1b
Please describe how your risk and opportunity identification processes are applied at both company and asset level
Company level: Under the direct supervision of the Board of Directors, risks/opportunities are assessed at the company level by Eaton’s Senior Leadership Committee (SLC), which is the most senior management committee within the corporation. Risk is managed on an enterprise-wide basis using a unified risk management framework. Eaton typically identifies 10-14 major risks each year that could materially affect the company’s businesses, financial condition or results of operations. The SLC appoints company task forces (led by SLC members) to manage these risks, including those influenced by climate change. Results are reported to the Board of Directors on an annual basis or more frequently in a crisis situation. Asset level: Eaton conducts strategic planning and risk analysis at all of its facilities and associated businesses. One of the factors considered involves potential environmental impacts to the business. Physical risks such as changing weather patterns, rising temperatures and other natural disasters are reviewed. An outcome of these meetings is the development of local response plans designed to address catastrophic occurrences. Voluntary projects to reduce carbon emissions and contribute to climate change mitigation are also assessed, along with mandatory projects for environmental remediation and/or regulation. For opportunities at both the company and asset level, Eaton uses the Eaton Business System (EBS), which provides internal processes and tools that ensure enterprise-wide alignment and compliance, collection and reporting information to influence various business opportunities, strategies and priorities, and rapid recognition and transfer of best practices. EBS encompasses Eaton’s core values, policies and processes used to conduct business and measure, assess and improve performance, including factors influenced by climate change.
CC2.1c
How do you prioritize the risks and opportunities identified?
Factors used to systematically define and prioritize risks and opportunities at all levels of the company, including those related to climate change, are: probability (likeliness that an event will actually occur); magnitude of damage (financial, reputational, societal); time horizon (how long Eaton will be exposed to the risk); correlation (how various risks might be related to each other); litigation; environmental regulation and remediation; and volatility of end markets that Eaton serves. For environmental and safety risks, issues planning, and prioritizing, Eaton uses MESH (Management of Environment, Safety, Security and Health), a globally

deployed, unified system that consolidates all EHS and compliance programs into one integrated management system. MESH has three components: Process & Compliance; Culture; and Results. Process & Compliance sets requirements in 10 EHS categories and drives regulatory compliance at the facility. Culture relates to how well each facility demonstrates EHS engagement at all levels. The Results component focuses on achieving performance metrics. Targets, objectives, priorities and performance goals are set for each component. Eaton facilities conduct self-assessments each year, and undergo a corporate MESH assessment every three years. Results are reported each year to Senior VP, EHS and, if necessary, to the chief executive of the appropriate Eaton business, and the Board of Directors. To prioritize climate change opportunities, Eaton uses the Eaton Business System (EBS), which provides internal processes and tools that ensure enterprise-wide alignment and compliance, collection and reporting information to influence various business opportunities, strategies and priorities, and rapid recognition and transfer of best practices. EBS encompasses Eaton’s core values, policies and processes used to conduct business and measure, assess and improve performance, including factors influenced by climate change.
CC2.1d
Please explain why you do not have a process in place for assessing and managing risks and opportunities from climate change, and whether you plan to introduce such a process in future
Main reason for not having a process
Do you plan to introduce a process?
Comment
CC2.2
Is climate change integrated into your business strategy?
Yes
CC2.2a
Please describe the process of how climate change is integrated into your business strategy and any outcomes of this process
(i) Internal process for collecting and reporting information to influence the strategy: We use the Eaton Business System (EBS), which provides a disciplined set of internal processes and tools that ensure enterprise-wide alignment and compliance, collection and reporting information to influence various business strategies, and rapid recognition and transfer of best practices. EBS encompasses Eaton’s core values, policies and processes used to conduct business and measure, assess

and improve performance, including factors influenced by climate change. For example, EBS provides these processes: • Eaton Lean Six Sigma – ELSS eliminates waste, simplifies processes, reduces cycle times and enables us to more effectively deploy resources within quality-intensive systems. • PROLaunch – a set of integrated processes designed to guide our program and project management processes, including product development from concept through production launch. Climate change has influenced this strategy by prompting the company to establish its “Design for the Environment” (DFE) program as part of this process. Using DFE, we are looking at our products to determine the environmental impact throughout the life of the product, and developing ways to minimize impact and help mitigate climate change. • Supply Chain Management – a comprehensive set of tactics to strengthen and diversify supplier relationships worldwide, while achieving maximum value in commodity management, global logistics and sourcing, while seeking to minimize the impact on climate change. (ii) Climate change aspects influencing this strategy include: • The pressure on global energy costs and availability leading to ever-increasing costs of extraction, processing, distribution and utilization; • An evolving regulatory regime focusing on carbon reduction, • Eaton customers are demanding new carbon reduction technologies to respond to the potential impact of climate change; • The continuing efforts of local, state, federal and international governments to jump start robust “green energy” industries through credits, grants, and other incentives. (iii) Climate change has influenced our short-term (1-5 years) strategy by leading Eaton to develop emissions reduction targets and energy-saving activities to achieve them. More than five years ago we committed to meeting several environmental goals by 2015—and we have already exceeded them. We reduced waste to landfill by 30 percent and water consumption by 20 percent (both compared to our 2010 baseline). We reduced GHG emissions by 25 percent (compared to a 2006 baseline). And we’ve already met our commitment to the U.S. Department of Energy’s “Better Buildings, Better Plants” program to reduce our energy use by 25 percent by 2016 (compared to our 2006 baseline). We are achieving our goals through investments in worldwide energy-saving projects that include LED lighting upgrades, renewable energy installations, building shell insulation, equipment upgrades, new energy efficient facilities, and more. Also, Eaton devoted $625 million to R&D in 2015, the majority of which was spent to develop products and solutions that reduce the carbon footprints of customers and consumers as the world seeks ways to mitigate climate change. (iv) Climate change has influenced our long-term strategy (> 5 years) as we confront future pressure on global energy costs and availability. As a result, the ever-increasing cost of extraction, processing, distribution and utilization will continue to power our business. Our customers have and will continue to respond to the strong economic, sustainability and regulatory forces occasioned by this energy megatrend. They need new technologies to reduce their use of energy and improve their own carbon footprints. That’s what Eaton does. Now, and in the foreseeable future, our strategy is to invest heavily in leading-edge technologies that improve the energy efficiency of buildings, vehicles and machinery, help to conserve natural resources, shrink the carbon footprints of our customers, and reduce the environmental impact of everyday life. Through R&D, acquisition, manufacturing and services, along with our balanced business strategy, Eaton continues to focus on our customers' growing demand for safe, reliable, efficient and sustainable power management solutions in a world influenced by the potential threat of climate change. (v) Competitive advantage: Eaton has many advanced technologies and a strong reputation for applying that technology to commercial advantage for our customers. As the world becomes more focused on energy conservation and reducing GHG emissions, Eaton is very well-positioned. Our largest business – Electrical – utilizes a broad array of applications that helps our customers conserve energy and reduce carbon footprints. One of the major concerns today is energy efficiency in buildings, where Eaton provides many products and solutions that contribute to LEED points. Also, Eaton spent $625 million for R&D to continue to launch innovative products and solutions that help our customers meet their most demanding energy and emissions requirements. Eaton’s sustained R&D investments contribute to our improved profitability. These technology advancements will play a key role in meeting or exceeding Eaton's projected growth of segment margins from 15.2% in 2015 to 17-18% in 2020. (vi) Eaton’s most substantial business decisions based on climate change aspects include: Investment in emissions reduction: energy-saving activities in our plants to reduce GHG emissions an additional 25 percent, indexed for sales, by 2015, which the company has surpassed. Eaton also pledged to reduce global energy use by 25 percent, indexed to sales, between 2006 and 2016, thereby reducing our GHG emissions to help mitigate our own impact on climate change. Eaton reached this goal one year early (2015). Climate change aspect: the evolving regulatory regime focusing on carbon reduction. R&D - Eaton spent $625 million for R&D in 2015. The majority of research dollars are spent on products and solutions that minimize carbon footprints of our customers and consumers. Aspect: customer demand for new carbon reduction technologies.

Acquisition - In 2015, we continued the integration of electrical equipment supplier Cooper Industries purchased by Eaton. Cooper provides complementary technologies that further accelerate Eaton’s growth as a global integrated power management company focused on one of the most challenging megatrends of our time: the rising costs and increasing environmental impact of the world’s growing energy use. In 2015, Eaton achieved $135 million in incremental synergy profits from the Cooper integration. Aspect: customer demand for new carbon reduction technologies, and evolving regulatory regime focusing on carbon reduction.
CC2.2b
Please explain why climate change is not integrated into your business strategy
CC2.2c
Does your company use an internal price of carbon?
No, and we currently don't anticipate doing so in the next 2 years
CC2.2d
Please provide details and examples of how your company uses an internal price of carbon
CC2.3
Do you engage in activities that could either directly or indirectly influence public policy on climate change through any of the following? (tick all that apply)
Direct engagement with policy makers Trade associations

Other
CC2.3a
On what issues have you been engaging directly with policy makers?
Focus of legislation
Corporate Position
Details of engagement
Proposed legislative solution
Other: Corporate Average Fuel Economy standards
Support
Eaton endorses the EPA’s new Corporate Average Fuel Economy (CAFÉ) and GHG standards for automotive passenger vehicles which mandate that vehicle fleets achieve an average of 54.5 mpg by 2025, thereby reducing fuel use and carbon emissions. Eaton is now meeting with the US EPA and other stakeholders on phase two of the CAFE and GHG rule for commercial trucks that will set standards for 2018 thru 2025. Our work relates to testing, compliance and incentives to drive adoption of fuel efficient technologies through aggressive GHG and CAFÉ standards. We worked with stakeholders and the agencies to identify technologies that will help OEM's meet the standards with improved performance in the next phase of rulemaking.
Approve the CAFE standards for automotive passenger vehicles which mandate that vehicle fleets achieve an average of 54.5 mpg by 2025, thereby reducing fuel use and carbon emissions. Also, propose rules in the commercial vehicle segment that drive adoption of fuel efficient technologies, improve performance, and reduce costs for truck fleets.
CC2.3b
Are you on the Board of any trade associations or provide funding beyond membership?
Yes
CC2.3c
Please enter the details of those trade associations that are likely to take a position on climate change legislation

Trade association
Is your position
on climate change
consistent with
theirs?
Please explain the trade association's position
How have you, or are you attempting to, influence the position?
National Electrical Manufacturers Assoc.
Consistent
NEMA strongly supports a climate policy that achieves meaningful greenhouse gas reductions at the lowest practicable costs. NEMA members are leaders in providing demand management and energy-efficient products and technologies to the market. These technologies, if deployed and utilized, lead to far more efficient use of energy sources, be they fossil fuels or other, and, in turn, reduce the amount of greenhouse gases across all sectors of our economy. NEMA’s member companies stand committed to incorporating the energy-efficient products and equipment that our members manufacture, all as part of our industry's efforts to reduce GHGs.
Eaton has worked with advocates at the State level to promote the adoption of legislation, regulations, codes and standards for energy efficient measures that reduce GHG emissions and facility operational costs. Topic: Eaton supports public policies that encourage schools and public buildings to follow Leadership in Energy and Environmental Design (LEED) practices. We believe that LEED serves as a vital blueprint for building design, construction, operation, and maintenance, providing cost-effective, best practice specifications that ensure that public buildings are utilizing the energy efficient technologies that provide operational savings and reduce emissions. Method: we are working through trade organizations and government (DOE). Actions advocating: develop rule-making and products/technologies strategies for reasonable LEED practices in public buildings as a means of meeting requirements of the EPA’s Clean Power Plan. Nature of engagement: meet with legislators; provide information on Eaton’s energy efficiency products.
Business Roundtable
Consistent
The Business Roundtable believes that improving energy efficiency, increasing utilization of renewables, continuing to advance technology and engaging globally are essential in order to reduce world-wide GHG emissions and mitigate climate change while ensuring economic growth. Three strategies that are likely to form the foundation of a successful sustainable growth: (1) more efficiently consume electricity and heating fuels in homes and businesses; (2) leverage domestic resources to produce cost- effective, low-carbon electricity; and (3) modernize the transportation fleet and diversify the transportation fuel mix.
Eaton supports legislation (S. 2012) in which programs related to energy cybersecurity, efficiency, infrastructure and supply management would be established, expanded or modified. The bill would also reauthorize Energy Department science programs, the Advanced Research Projects Agency-Energy, the Land and Water Conservation Fund, and grants to promote efficiency in commercial and residential buildings. The measure would repeal the requirement that new federal buildings and those undergoing major renovations phase out the use of energy derived from fossil fuels by 2030. Method: We are working with government agencies (DOE, GSA) and trade associations. Topic: promote energy efficiencies as exemplified by Eaton’s products/technologies which can help reduce energy use by up to 30 percent. Nature of engagement: we have hosted product/technology forums for public officials, and we have engaged in consultation and interaction with DOE and GSA. Actions advocating: approval of legislation (S. 2012).

CC2.3d
Do you publicly disclose a list of all the research organizations that you fund?
CC2.3e
Please provide details of the other engagement activities that you undertake
Eaton works with the American Wind Energy Association to promote extension of the U.S. production tax credits and energy standards for wind energy. Method: We are working with government agencies (DOE, GSA) and trade associations. Topic: promote incentives for wind energy production as exemplified by Eaton’s products/technologies for construction and operation of wind turbines. Nature of engagement: we have hosted product/technology forums for public officials, and we have engaged in consultation and interaction with state and federal legislators, DOE and GSA. Actions advocating: extension of tax credit for wind energy production.
CC2.3f
What processes do you have in place to ensure that all of your direct and indirect activities that influence policy are consistent with your overall climate change strategy?
Eaton's executive level Sustainability Guidance and Management Team leads our sustainability strategy, optimizes our resources, and ensures that we are focusing on the issues that are most important to our customers, investors, communities and employees. Led by Eaton’s senior vice pres ident of Environment, Health and Safety, and composed of leaders from across Eaton businesses and functions, the team plays a key role in the development of our future sustainability goals and activities, and ensures that all of our direct and indirect activities that influence policy are consistent with our overall climate change strategy. The team reports directly to Eaton’s Senior Leadership Committee (headed by Eaton's chairman and CEO) and Board of Directors.
CC2.3g
Please explain why you do not engage with policy makers

Further Information
Page: CC3. Targets and Initiatives
CC3.1
Did you have an emissions reduction or renewable energy consumption or production target that was active (ongoing or reached completion) in the reporting year?
Absolute target Intensity target
CC3.1a
Please provide details of your absolute target
ID
Scope
% of emissions in
scope
% reduction from base
year
Base year
Base year emissions covered by
target (metric tonnes CO2e)
Target year
Is this a science-based target?
Comment
Abs1 Scope 1+2 (location-based)
100% 3% 2014 1029000 2015 No, but we anticipate setting one in the next 2 years
CC3.1b
Please provide details of your intensity target

ID
Scope
% of emissions in scope
% reduction from base
year
Metric
Base year
Normalized base year emissions covered by
target
Target year
Is this a science-based target?
Comment
Int1 Scope 1+2 (location-based)
100% 3% Metric tonnes CO2e per unit revenue
2014 45.0 2015
No, but we anticipate setting one in the next 2 years
The indexed emission rate for 2014 was 45.0 metric tons of carbon dioxide per million dollars of sales.
Int2 Scope 1+2 (location-based)
100% 25% Metric tonnes CO2e per unit revenue
2006 71.7 2015
No, but we anticipate setting one in the next 2 years
The indexed emission rate for 2006 was 71.7 metric tons of carbon dioxide per million dollars of sales.
CC3.1c
Please also indicate what change in absolute emissions this intensity target reflects
ID
Direction of change anticipated in
absolute Scope 1+2 emissions at target
completion?
% change anticipated in absolute Scope 1+2
emissions
Direction of change anticipated in
absolute Scope 3 emissions at target
completion?
% change anticipated in absolute Scope 3
emissions
Comment
Int1 Decrease 1.0 No change 0 Scope 3 emissions are not included in Eaton's target.
Int2 Decrease 25.5 No change 0 Scope 3 emissions are not included in Eaton's target.
CC3.1d
Please provide details of your renewable energy consumption and/or production target

ID
Energy types
covered by target
Base year
Base year energy for energy type covered
(MWh)
% renewable
energy in base year
Target year
% renewable
energy in target year
Comment
CC3.1e
For all of your targets, please provide details on the progress made in the reporting year
ID
% complete (time)
% complete (emissions or
renewable energy)
Comment
Abs1 100% 33.3% Eaton missed the goal. Our absolute emissions decreased 1,029,000 to 1,019,000 which is a decrease of 1.0%.
Int1 100% 0% Eaton missed the goal. Our year over year indexed emissions increased.
Int2 100% 98% Eaton virtually met our 2015 target established in 2006.
CC3.1f
Please explain (i) why you do not have a target; and (ii) forecast how your emissions will change over the next five years

CC3.2
Do you classify any of your existing goods and/or services as low carbon products or do they enable a third party to avoid GHG emissions?
Yes
CC3.2a
Please provide details of your products and/or services that you classify as low carbon products or that enable a third party to avoid GHG emissions
Level of
aggregation
Description of product/Group of
products
Are you
reporting low carbon product/s or avoided emissions?
Taxonomy, project
or methodology used to classify product/s as low
carbon or to calculate avoided
emissions
%
revenue from low carbon
product/s in the
reporting year
% R&D in
low carbon product/s
in the reporting
year
Comment
Company-wide
As a power management company, Eaton has long focused on developing innovative technologies, products and solutions that help our customers meet challenging sustainability regulations and guidelines. During 2015, we invested $625 million in research and development, helping answer the needs of our global customers now and in the future. Our cylinder deactivation system is the most direct way to reduce emissions and improve fuel economy through the driving cycle. Eaton was an early leader in the research and development of
Avoided emissions
Other: Lifecycle Assessment using ISO 14040 and 14044 guidelines. The method used to determine the GHG footprint for all the products was IPCC GWP 100a
More than 60% but less than or equal to 80%
Examples of Eaton's innovative products, their function and the amount of GHG emissions that are eliminated by product use: The APR48-ES Energy Saver Rectifier helps communications network operators cut energy costs across the network through greater operating efficiency and to meet aggressive carbon footprint reduction targets. The Energy Saver rectifier operates with over 96% efficiency (4% waste), reducing waste energy by at least 50% compared to normal industry efficiencies of 89-92%. It offers potential global annual savings of one

Level of
aggregation
Description of product/Group of
products
Are you
reporting low carbon product/s or avoided emissions?
Taxonomy, project
or methodology used to classify product/s as low
carbon or to calculate avoided
emissions
%
revenue from low carbon
product/s in the
reporting year
% R&D in
low carbon product/s
in the reporting
year
Comment
onboard refueling vapor recovery (ORVR) systems, which reduce hydrocarbon emissions by about 95 percent during refueling. China—the world's largest market for passenger and commercial vehicles—is implementing ORVR in early 2017. Eaton’s electrical power control systems reduce power use and carbon emissions in buildings and homes. Our acquisition of Cooper Industries in 2012 expanded our portfolio of electrical solutions with products such as LED lighting and critical smart-grid technologies for modern, sustainable electricity-delivery systems. Our product portfolio also includes hybrid powertrains that boost fuel economy and reduce emissions in commercial vehicles; hydraulic aircraft systems that reduce weight and save fuel; automotive superchargers for enhanced fuel economy; electrical and hydraulic products for solar power and wind turbine systems; and thousands more.
million metric tons of CO2 emissions for the telecom sector. Protection Station 650 and 800 are combined Uninterruptible Power System (UPS), surge suppressor, and multiple socket devices with improved energy efficiency provided by an EcoControl function that automatically disables peripherals when the master drive is turned off. Laboratory testing of a typical home computer system demonstrated annual power consumption of 165 kWh for the Protection Station compared to 231 kWh for similar products without the EcoControl function. For 100,000 computers, the annual savings of 6,600,000 kWh reduces carbon emissions by 4,551 metric tons. Eaton Electrical Solutions combine several energy saving products into the most energy efficient package to address specific customer needs. Michigan’s Detroit Metropolitan Airport selected Eaton’s Cooper Lighting business to replace 6,050 existing parking garage fixtures with Eaton’s energy-saving lighting products (from 210 watts to 60 watts). The conversion – using Eaton’s McGraw-Edison Valet and Ventus light-emitting diode (LED) luminaires – will result in a 66 percent

Level of
aggregation
Description of product/Group of
products
Are you
reporting low carbon product/s or avoided emissions?
Taxonomy, project
or methodology used to classify product/s as low
carbon or to calculate avoided
emissions
%
revenue from low carbon
product/s in the
reporting year
% R&D in
low carbon product/s
in the reporting
year
Comment
reduction in power consumption. The LED products also incorporate Eaton’s Cooper Lighting LumaWatt Outdoor Wireless Control and Monitoring System to make it easier for the airport to effectively manage its lighting levels. The system reduces power usage by approx. 5 million kWh, resulting in a reduction of 35,000 metric tons of carbon dioxide in a five-year period.
CC3.3
Did you have emissions reduction initiatives that were active within the reporting year (this can include those in the planning and/or implementation phases)
Yes
CC3.3a
Please identify the total number of projects at each stage of development, and for those in the implementation stages, the estimated CO2e savings

Stage of development
Number of projects
Total estimated annual CO2e savings in metric tonnes CO2e (only for rows marked *)
Under investigation 127 10092
To be implemented* 24 1119
Implementation commenced* 14 1210
Implemented* 64 7763
Not to be implemented 0 0
CC3.3b
For those initiatives implemented in the reporting year, please provide details in the table below
Activity type
Description of activity
Estimated annual CO2e
savings (metric tonnes CO2e)
Scope
Voluntary/ Mandatory
Annual monetary savings
(unit currency -
as specified in CC0.4)
Investment required
(unit currency -
as specified in
CC0.4)
Payback period
Estimated lifetime of
the initiative
Comment
Fugitive emissions reductions
In 2015, 25 of our facilities achieved zero waste-to-landfill status. 75 Eaton plants have now achieved that goal. We modeled our zero-waste benchmark on standards set by an internationally recognized certifying organization. By reducing the volume of waste sent to landfills, we help minimize the release of GHG emissions, especially methane, a harmful GHG 20 times more potent than
170
Scope 2 (location-based) Scope 3
Voluntary
0 0 <1 year >30 years

Activity type
Description of activity
Estimated annual CO2e
savings (metric tonnes CO2e)
Scope
Voluntary/ Mandatory
Annual monetary savings
(unit currency -
as specified in CC0.4)
Investment required
(unit currency -
as specified in
CC0.4)
Payback period
Estimated lifetime of
the initiative
Comment
carbon dioxide. Our 2015 zero waste sites remove about 350 metric tons of landfilled waste per year, avoiding about 170 metric tons of GHG emissions using WARM emission factors for mixed MSW (the largest category of waste removed from landfill ).
Energy efficiency: Processes
Eaton facilities reported 49 energy efficiency projects, including boilers, equipment upgrades, HVAC design, process improvements, compressed air, heat recovery and others.
6518 Scope 1
Voluntary
1167000 1870000 1-3 years
21-30 years
Energy efficiency: Building services
15 Eaton facilities completed lighting optimization programs that replaced inefficient lighting with cutting edge LED lights manufactured at company plants acquired during Eaton's purchase of Cooper Industries in 2012.
1075
Scope 2 (location-based)
Voluntary
313000 454000 1-3 years
6-10 years
CC3.3c
What methods do you use to drive investment in emissions reduction activities?
Method
Comment

Method
Comment
Dedicated budget for energy efficiency
Energy/GHG reduction projects budgeted: We’re using new technologies and processes to make our manufacturing plants around the world more energy efficient. In 2015, many of our aerospace, hydraulics, electrical and vehicle plants upgraded their facilities with energy-saving projects. Overall, Eaton completed 64 projects that included lighting optimization, building shell insulation, equipment upgrades, heat recovery, compressed air installation, ventilator control and energy management. which reduced GHG emissions by 7,502 metric tons at a cost of $2,330,000. Potential Financial implications: annual energy savings projected at $1,480,000.
Dedicated budget for low carbon product R&D
Eaton’s R&D efforts are focused on our customers’ needs for innovative products and solutions that improve energy efficiency and reduce carbon emissions. We estimate that new technologies being developed at Eaton’s innovation centers have the potential to reduce the CO2 emissions of our applications by up to 60 percent by 2050. Eaton spent $625 million in 2015 for R&D, the majority of which was used to develop power management products and solutions that improve energy efficiency and reduce carbon emissions.
Partnering with governments on technology development
Eaton received a $2.4 million research grant from the U.S. Department of Energy (DOE) to explore the development of energy efficient lighting products that reduce GHG emissions. Eaton’s research aims to improve the manufacturing speed of light-emitting diode (LED) fixtures by three times over the typical rate, reduce LED light engine costs and efficiency by five times and reduce assembly costs by approximately 50 percent. “This partnership with industry to produce affordable, efficient lighting will save consumers money and create American jobs,” said Energy Secretary Ernest Moniz. “It’s another example of how energy efficiency is a win-win proposition for our economy.”
Employee engagement
Eaton lets employees at our local facilities determine where we donate a large share of our contributions, based on the needs in their communities, including sustainability projects. We engage our employees in all aspects of our approach, from design and manufacturing, customer support, internal footprint reduction through Green Teams and other programs, and communications both internally and externally. In 2015, more than 10,000 employees participated in our World Environment Month program and we expect even more participation this year.
CC3.3d
If you do not have any emissions reduction initiatives, please explain why not
Further Information
Page: CC4. Communication
CC4.1
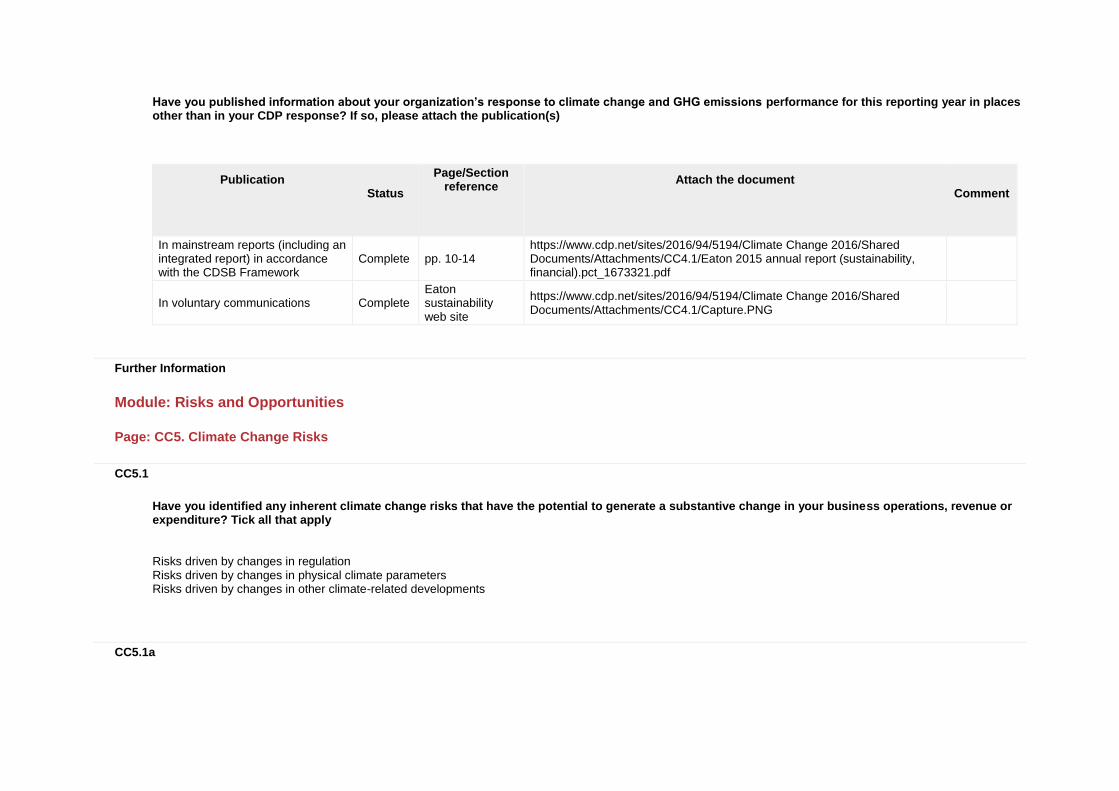
Have you published information about your organization’s response to climate change and GHG emissions performance for this reporting year in places other than in your CDP response? If so, please attach the publication(s)
Publication
Status
Page/Section reference
Attach the document
Comment
In mainstream reports (including an integrated report) in accordance with the CDSB Framework
Complete pp. 10-14 https://www.cdp.net/sites/2016/94/5194/Climate Change 2016/Shared Documents/Attachments/CC4.1/Eaton 2015 annual report (sustainability, financial).pct_1673321.pdf
In voluntary communications Complete Eaton sustainability web site
https://www.cdp.net/sites/2016/94/5194/Climate Change 2016/Shared Documents/Attachments/CC4.1/Capture.PNG
Further Information
Module: Risks and Opportunities
Page: CC5. Climate Change Risks
CC5.1
Have you identified any inherent climate change risks that have the potential to generate a substantive change in your business operations, revenue or expenditure? Tick all that apply
Risks driven by changes in regulation Risks driven by changes in physical climate parameters Risks driven by changes in other climate-related developments
CC5.1a

Please describe your inherent risks that are driven by changes in regulation
Risk driver
Description
Potential impact
Timeframe
Direct/ Indirect
Likelihood
Magnitude of impact
Estimated financial
implications
Management
method
Cost of
management
Air pollution limits
Recently, the US EPA issued final Carbon Pollution Standards for new, modified and reconstructed power plants, and proposed a federal plan to assist states in implementing the Clean Power Plan. These are the first-ever national standards that address carbon pollution from power plants. By providing states and utilities ample flexibility and the time needed to achieve these pollution reductions while maintaining a reliable and affordable supply of electricity for rate payers and businesses. However, there is a short-term risk
Increased operational cost
3 to 6 years
Indirect (Client)
Unlikely Low
Without Eaton's efficiency improvements, the company would pay an estimated $1.48 million more per year in energy costs.
To address potential price spikes, improve energy efficiency and reduce GHG, Eaton is focused on energy efficiency improvements in our facilities worldwide. In 2015 Eaton completed or commenced than 78 projects including lighting optimization, building shell insulation, equipment upgrades, heat recovery, compressed air installation, ventilator control and energy management. These projects cost approximately $$2.3 million which will save
Eaton spent about $2.3 million in 2015 for energy efficiency improvements at company facilities. For example, a comprehensive LED lighting project at our electrical facility in Arden, NC reduced annual carbon emissions by 2.5 million pounds and nitrogen oxides by nearly 22,000 pounds. The facility replaced 600 fluorescent bulbs with Eaton’s award-winning lighting products and a new programmable lighting system. Since 2010, Eaton has cut global GHG emissions by

Risk driver
Description
Potential impact
Timeframe
Direct/ Indirect
Likelihood
Magnitude of impact
Estimated financial
implications
Management
method
Cost of
management
that shutting down coal plants, while making new plant construction virtually impossible, could threaten the national power grid's ability to supply peak power to prevent brownouts in the near-term, causing business disruptions and price spikes that may temporarily interrupt Eaton production, as well as that of our customers. The regulation could have a negative impact on Eaton’s Electrical business which provides products and services for plant construction and maintenance. Also, power supply interruptions could impact operations at our manufacturing
more than 4.3 million KwH of electricity per year, eliminate about 7933 metric tons of GHG emissions per year, and save more than $1,480,000 million in energy costs.
276,000 metric tons—a 24.5 percent reduction. These results are scalable well beyond Eaton. For example, we can use our learnings to help states and utilities comply with EPA’s Clean Power Plan requirements.

Risk driver
Description
Potential impact
Timeframe
Direct/ Indirect
Likelihood
Magnitude of impact
Estimated financial
implications
Management
method
Cost of
management
plants, as well as those of our suppliers, while the cost of electricity steadily increases due to reliance on more expensive and less reliable renewable sources of power. However, risk impacts can be offset by new economic opportunities for Eaton, including products and services for plant retrofits to accommodate natural gas fuel; electrical power control systems for the efficient use of power and lower carbon emissions; wind and solar installations; and more.
Fuel/energy taxes and regulations
EPA's proposed 2017-2025 LD CAFÉ/GHG standards
Reduced demand for goods/services
>6 years Direct More likely than not
Low-medium
Eaton’s Vehicle business represents about 18% of Eaton’s
Eaton conducts R&D to continue to launch innovative
Eaton spent $625 million for R&D in 2015. For example, For

Risk driver
Description
Potential impact
Timeframe
Direct/ Indirect
Likelihood
Magnitude of impact
Estimated financial
implications
Management
method
Cost of
management
represent an aggressive target of 4-5% improvement per year from a baseline of about 35 mpg (2016) for the national automotive fleet. This will challenge the OEM’s in terms of commercializing the necessary technologies while balancing against consumer preferences in size, weight, safety, and performance features. Likely scenarios are a combination of solutions involving vehicle mix, powertrain alternatives, optimizing electronic controls and intelligence, innovative weight reduction, fuel source options, and major infrastructure
annual sales, or $3.68 billion in 2015. We estimate that new products and technologies will add $250 million of annual revenue by 2020. Without appropriate R&D to develop new products and update current products, Eaton would lose out on approximately $250 million in annual revenue going forward.
products and solutions that help our customers meet their most demanding energy and emissions requirements. For example, Eaton's Vehicle business offers the world's most complete line-up of fuel-saving hybrid systems for commercial vehicle applications. In 2015, customers using the company's hybrid systems on delivery trucks, buses, refuse and utility vehicles and other commercial applications surpassed 900 million miles of clean, reliable service and helped save more than 23
example, Eaton offers the world's most complete line-up of fuel-saving hybrid systems for commercial vehicle applications. Customers using the company's hybrid systems on delivery trucks, buses, refuse and utility vehicles and other commercial applications have collectively accumulated more than 900 million miles of clean, reliable service and helped save more than 23 million gallons of fuel while reducing GHG emissions by >235,000 metric tons (using EPA conversion factor) over the past 10 years. Eaton hybrid electric, plug-in
Risk driver
Description
Potential impact
Timeframe
Direct/ Indirect
Likelihood
Magnitude of impact
Estimated financial
implications
Management
method
Cost of
management
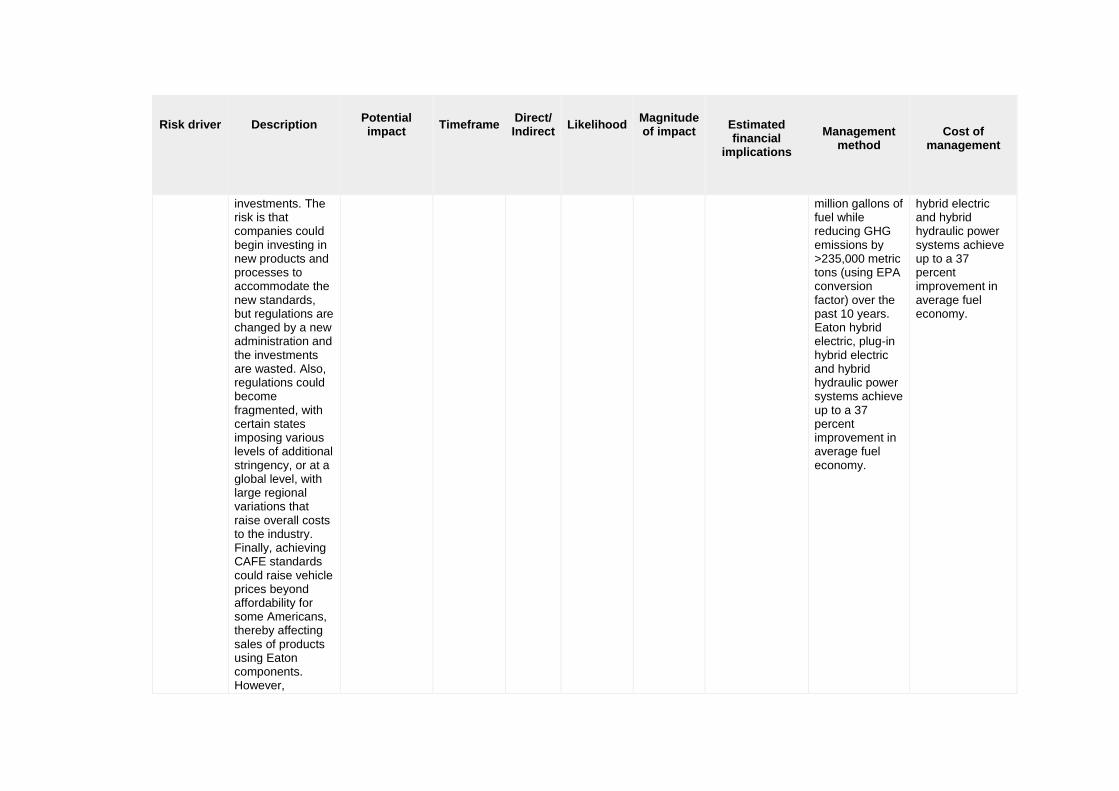
investments. The risk is that companies could begin investing in new products and processes to accommodate the new standards, but regulations are changed by a new administration and the investments are wasted. Also, regulations could become fragmented, with certain states imposing various levels of additional stringency, or at a global level, with large regional variations that raise overall costs to the industry. Finally, achieving CAFE standards could raise vehicle prices beyond affordability for some Americans, thereby affecting sales of products using Eaton components. However,
million gallons of fuel while reducing GHG emissions by >235,000 metric tons (using EPA conversion factor) over the past 10 years. Eaton hybrid electric, plug-in hybrid electric and hybrid hydraulic power systems achieve up to a 37 percent improvement in average fuel economy.
hybrid electric and hybrid hydraulic power systems achieve up to a 37 percent improvement in average fuel economy.

Risk driver
Description
Potential impact
Timeframe
Direct/ Indirect
Likelihood
Magnitude of impact
Estimated financial
implications
Management
method
Cost of
management
consistent CAFE standards would also strengthen demand for Eaton products such as superchargers and other fuel-saving products for cars, and help minimize this risk.
CC5.1b
Please describe your inherent risks that are driven by changes in physical climate parameters
Risk driver
Description
Potential impact
Timeframe
Direct/ Indirect
Likelihood
Magnitude of impact
Estimated financial
implications
Management
method
Cost of
management
Change in precipitation extremes and droughts
The physical risks of increased storm and hurricane activity, as well as flooding and droughts, may place a temporary financial burden on Eaton facilities and supply chain to sustain operations
Inability to do business
3 to 6 years
Direct About as likely as not
Low-medium
Estimated financial implications before taking action depend on the severity of an incident, but can approach $10-$15 million for significant damage to a
Eaton conducts strategic planning at all of its facilities and associated businesses. The factors considered include potential environmental impacts, physical risks such as changing weather
Costs associated with these actions are included in the annual budgets for the businesses and facilities, and represent <$3 million per year.

Risk driver
Description
Potential impact
Timeframe
Direct/ Indirect
Likelihood
Magnitude of impact
Estimated financial
implications
Management
method
Cost of
management
and protect our employees and communities. For example, in 2015, a series of blizzards in the southeast US shutdown transportation lines at Eaton's Roanoke VA warehouse facility. Shipping and receiving was delayed or shutdown for three days putting about $1 million per day at risk in contracts. Climate change would increase these risks for Eaton and the company's 200+ facilities around the globe resulting higher costs and increased threats to employee safety.
manufacturing plant due to flooding or high wind velocity incidents.
patterns, rising temperatures and other natural disasters, new regulations, waste minimization and many other factors. An outcome of these meetings is the development of local response plans designed to address catastrophic occurrences, including humanitarian demands of employees and communities. As a result, Eaton has enhanced its emergency response capabilities through the company’s Enterprise Risk Management (ERM) governance structure to deal with physical risks. This system includes an emergency response Hotline. A call to the Eaton Hotline immediately engages the Corporate Emergency Response Team which can

Risk driver
Description
Potential impact
Timeframe
Direct/ Indirect
Likelihood
Magnitude of impact
Estimated financial
implications
Management
method
Cost of
management
provide resources to help a facility deal with emergencies and also assist in communications and decision-making. Other programs that support ERM include business continuity, travel and employee security, information technology disaster recovery, intellectual property protection and pandemic preparedness. For example, in 2015, a series of blizzards in the southeast US shutdown transportation lines at Eaton's Roanoke VA warehouse facility. Shipping and receiving was delayed or shut down for three days putting about $1 million per day at risk in contracts. The ERM, along with facility planning helped minimize the impact.
CC5.1c

Please describe your inherent risks that are driven by changes in other climate-related developments
Risk driver
Description
Potential impact
Timeframe
Direct/ Indirect
Likelihood
Magnitude of impact
Estimated financial
implications
Management
method
Cost of
management
Increasing humanitarian demands
In the event of changing climate conditions, e.g. droughts, or other extreme weather events, Eaton could be called upon (and expected) to do more to address the increasing humanitarian demands, particularly if the extreme weather events are severe and widespread. These events could place increasing burdens on Eaton's charitable contributions budget as we seek to repair damages and help victims survive and return to normal lives. For example, after Hurricane Odile battered Mexico's Baja California peninsula, employees of Eaton's aerospace
Increased operational cost
>6 years Indirect (Client)
Unlikely Low
Financial help for increasing humanitarian demands would come from the Eaton Charitable Trust contributions budget. In 2015, Eaton's budget was $10.2 million. Eaton could redirect money from its traditional recipients to affected populations, or raise its budget to address growing humanitarian needs. Redirection of 10 percent of its budget would lead to $1.2 million less to traditional recipients. Raising its budget by10 percent would provide an additional $1.2 million for humanitarian demands. If Eaton does nothing, the affected population could
Increase contributions budget to address additional humanitarian needs as they occur. Eaton conducts strategic planning at all of its facilities and associated businesses. The factors considered include potential environmental impacts, physical risks such as changing weather patterns, rising temperatures and other natural disasters, new regulations, waste minimization and many other factors. An outcome of these meetings is the development of local response plans designed to address catastrophic occurrences, including humanitarian demands of
Adding 10% to Eaton's contributions budget to address additional humanitarian needs would cost approx. $1.2 million.

Risk driver
Description
Potential impact
Timeframe
Direct/ Indirect
Likelihood
Magnitude of impact
Estimated financial
implications
Management
method
Cost of
management
facility in Tijuana provided emergency supplies for storm victims. Hurricane Odile leveled cities, communities and resort areas – leaving many residents and about 15,000 vacationers stranded without water, food, electricity and medical care. It was one of the most destructive storms in modern history to strike the peninsula. In the days following the storm, Eaton organized a supply drive and collected 500 kilograms (more than 1,100 pounds) of donated supplies from employees – including bottled water, canned food, rice, beans, cereal, powdered milk, toothpaste,
be deprived of an additional $1.2 million in humanitarian assistance.
employees and communities. For example, after Hurricane Odile battered Mexico's Baja California peninsula, employees of Eaton's aerospace facility in Tijuana provided emergency supplies for storm victims. Hurricane Odile leveled cities, communities and resort areas – leaving many residents and about 15,000 vacationers stranded without water, food, electricity and medical care. It was one of the most destructive storms in modern history to strike the peninsula. In the days following the storm, Eaton organized a supply drive and collected 500 kilograms (more than 1,100 pounds) of donated supplies from

Risk driver
Description
Potential impact
Timeframe
Direct/ Indirect
Likelihood
Magnitude of impact
Estimated financial
implications
Management
method
Cost of
management
soap, toilet paper and diapers. Also, to support humanitarian efforts, Eaton corporate contributions matched employee gifts of $25 or more to the Mexican Red Cross. Climate change would increase these risks for Eaton by causing our contributions budget to grow beyond company parameters.
employees – including bottled water, canned food, rice, beans, cereal, powdered milk, toothpaste, soap, toilet paper and diapers. Also, to support humanitarian efforts, Eaton corporate contributions matched employee gifts of $25 or more to the Mexican Red Cross.
CC5.1d
Please explain why you do not consider your company to be exposed to inherent risks driven by changes in regulation that have the potential to generate a substantive change in your business operations, revenue or expenditure
CC5.1e
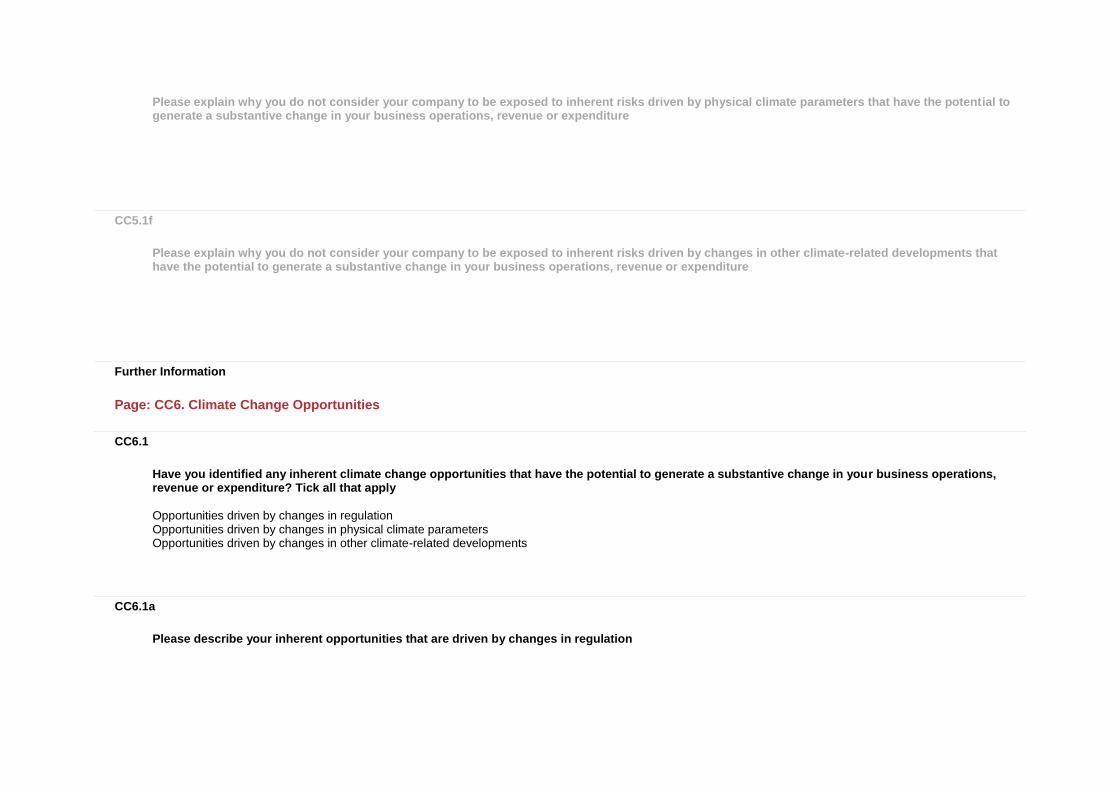
Please explain why you do not consider your company to be exposed to inherent risks driven by physical climate parameters that have the potential to generate a substantive change in your business operations, revenue or expenditure
CC5.1f
Please explain why you do not consider your company to be exposed to inherent risks driven by changes in other climate-related developments that have the potential to generate a substantive change in your business operations, revenue or expenditure
Further Information
Page: CC6. Climate Change Opportunities
CC6.1
Have you identified any inherent climate change opportunities that have the potential to generate a substantive change in your business operations, revenue or expenditure? Tick all that apply
Opportunities driven by changes in regulation Opportunities driven by changes in physical climate parameters Opportunities driven by changes in other climate-related developments
CC6.1a
Please describe your inherent opportunities that are driven by changes in regulation

Opportunity driver
Description
Potential impact
Timeframe
Direct/Indirect
Likelihood
Magnitude of impact
Estimated financial
implications
Management
method
Cost of
management
Renewable energy regulation
After years of uncertainty about the survival of tax credits for renewable energy, legislation has been approved extending credits for wind and solar power. Wind projects are eligible for a credit of 2.3 cents for each kilowatt-hour of electricity they generate, which will be in effect through 2016, then fall each year until it expires in 2020. Solar power companies can keep claiming federal tax credits at 30% of the price of a solar array. The credits, which apply to home solar kits, as well as big commercial installations, will
Increased demand for existing products/services
>6 years Direct Virtually certain
Medium-high
Eaton achieved $135 million of year-over-year synergy profits in 2015 from our Cooper acquisition, and $95 million of additional profits in 2014. This multi-year profit growth represents a powerful accelerator to the organic growth that emanates from our expanded set of global power management capabilities. We estimate that Cooper's acquisition and R&D investments will help raise segment margins from 16.9% in 2015 to 17.0-17.6% despite economic headwinds in
Acquisition of Cooper Industries, along with new products and processes from our R&D efforts, and organic growth will combine to provide the power management products and solutions required to address this opportunity. For example, in 2015, our electrical distribution equipment and engineering services helped power more than 1,600 homes with five community solar installations in Colorado. And California's Redwood
$13.79 billion acquisition of Cooper, plus $625 million in R&D investments in 2015.

Opportunity driver
Description
Potential impact
Timeframe
Direct/Indirect
Likelihood
Magnitude of impact
Estimated financial
implications
Management
method
Cost of
management
be good through 2019. After that, the credit will begin to drop, declining to 10% by 2022 where it will remain. These actions provide market certainty for Eaton, and offer the opportunity for the company’s portfolio of wind and solar energy products. In the wind energy market, Eaton is combining our hydraulics and electrical expertise to develop smaller, more reliable components that improve the performance and uptime of giant turbines and reduce expensive operating costs. We’re also able to provide integrated global
certain electrical markets.
Solar Farm relies on our solar inverters, distribution equipment and services to power 9,200 homes, helping local utilities meet the California Renewables Portfolio standard of generating 33 percent of energy from renewable sources by 2020. By acquiring Cooper, we add to our capabilities of smooth conversion of renewable energy into clean electric power through inverters, power distribution transformers and other innovative

Opportunity driver
Description
Potential impact
Timeframe
Direct/Indirect
Likelihood
Magnitude of impact
Estimated financial
implications
Management
method
Cost of
management
support, helping us to win new contracts from turbine manufacturers of all sizes. And in solar power, Eaton is also a major supplier for complete solar PV electrical BOS solutions. Eaton is a single-source BOS supplier for residential, commercial and utility installations. We offer support services provided by hundreds of Eaton’s application and field service engineers, as well as comprehensive, hands-on training.
products and services.
Fuel/energy taxes and regulations
EPA's proposed 2017-2025 LD CAFÉ/GHG standards
Increased demand for existing products/services
>6 years Direct Virtually certain
Medium
Eaton expects an additional $250 million in annual
Eaton invests in development of innovative
$625 million spent on R&D in 2015.

Opportunity driver
Description
Potential impact
Timeframe
Direct/Indirect
Likelihood
Magnitude of impact
Estimated financial
implications
Management
method
Cost of
management
represent an aggressive target of 4-5% improvement per year from a baseline of about 35 mpg (2016) for the national automotive fleet. This will challenge the OEM’s in terms of commercializing the necessary technologies while balancing against consumer preferences in size, weight, safety, and performance features. Likely scenarios are a combination of solutions involving vehicle mix, powertrain alternatives, optimizing electronic controls and intelligence, innovative weight
revenue by 2020 from new products in our Vehicles Business that help customers lower fuel consumption, improve efficiency and solve customers' need to meet regulations.
products and solutions, along with improvements in existing technology that help our customers meet their most demanding energy and emissions requirements. For example, our cylinder deactivation system is the most direct way to reduce emissions and improve fuel economy through the driving cycle. Eaton was an early leader in the research and development of onboard refueling vapor recovery (ORVR) systems, which reduce

Opportunity driver
Description
Potential impact
Timeframe
Direct/Indirect
Likelihood
Magnitude of impact
Estimated financial
implications
Management
method
Cost of
management
reduction, fuel source options, and major infrastructure investments. Eaton provides products to address our customer needs, including superchargers and other fuel-saving products for vehicles. Therefore, this regulation could increase demand for these relevant Eaton products.
hydrocarbon emissions by about 95 percent during refueling. In 2015, China—the world's largest market for passenger and commercial vehicles—committed to implementing ORVR in early 2017 creating a new market for Eaton.
Air pollution limits
Recently, the US EPA issued final Carbon Pollution Standards for new, modified and reconstructed power plants, and proposed a federal plan to assist states in implementing the Clean Power Plan (CPL). These are the
Increased demand for existing products/services
>6 years Direct Very likely Medium-high
Eaton's technology advancements will play a key role in meeting or exceeding Eaton's projected growth of segment margins from 15.2% in 2015 to 17-18% in 2020.
Eaton invests in development of innovative products and solutions, along with improvements in existing technology that help our customers meet their most demanding energy and
$625 million spent on R&D in 2015.

Opportunity driver
Description
Potential impact
Timeframe
Direct/Indirect
Likelihood
Magnitude of impact
Estimated financial
implications
Management
method
Cost of
management
first-ever national standards that address carbon pollution from power plants. By providing states and utilities ample flexibility and the time needed to achieve these pollution reductions while maintaining a reliable and affordable supply of electricity for rate payers and businesses. The CPL cuts significant amounts of power plant carbon pollution and the pollutants that cause soot and smog that harm health, while advancing clean energy innovation, development and deployment, and laying the
emissions requirements. The vast majority of our R&D budget is allocated to power management solutions that reduce and manage energy use, improve fuel economy and reduce GHG emissions. In 2015, working hand-in-hand with Portland General Electric power company, we pioneered a solution that leverages first-of-its-kind lithium-ion battery storage technology. Eaton engineers devised a modification to enable bi-directional energy current

Opportunity driver
Description
Potential impact
Timeframe
Direct/Indirect
Likelihood
Magnitude of impact
Estimated financial
implications
Management
method
Cost of
management
foundation for the long-term strategy needed to tackle the threat of climate change. Given these circumstances, the CPL can provide new economic opportunities for Eaton, including products and services for plant retrofits to accommodate natural gas fuel; electrical power control systems for the efficient use of power and lower carbon emissions; wind and solar installations; and more. Our breakthrough PowerChain™ Management solutions allow customers to take a system-wide life-cycle approach to managing their
operation. With customized Eaton Power Xpert inverters, the system can convert direct to alternating current and vice versa. Maximizing harvested renewable energy resources efficiently and cost effectively. Eaton’s sophisticated control interface enables the storage system to perform in multiple modes. It intelligently coordinates the operation of the inverters and balances demand among the

Opportunity driver
Description
Potential impact
Timeframe
Direct/Indirect
Likelihood
Magnitude of impact
Estimated financial
implications
Management
method
Cost of
management
electrical systems to increase reliability, improve capital efficiency, reduce operating costs, minimize carbon emissions and enhance safety.
battery blocks. The facility can respond to both real-time and reactive power commands to achieve seamless power support and energy efficiency and carbon emissions reduction.
CC6.1b
Please describe the inherent opportunities that are driven by changes in physical climate parameters
Opportunity driver
Description
Potential impact
Timeframe
Direct/ Indirect
Likelihood
Magnitude of impact
Estimated financial
implications
Management
method
Cost of
management
Change in temperature extremes
Changes in temperature extremes can lead to serious weather events such as tornadoes and hurricanes, or
Increased demand for existing products/services
>6 years Direct Likely Low-medium
Despite continuing headwinds that could constrain growth, Eaton's technology advancements will play a key
To manage this opportunity, Eaton develops comprehensive solutions to customers for combating their physical risks.
$625 million spent on R&D in 2015, the vast majority for products and solutions that improve energy

Opportunity driver
Description
Potential impact
Timeframe
Direct/ Indirect
Likelihood
Magnitude of impact
Estimated financial
implications
Management
method
Cost of
management
melting sea ice causing flooding in coastal areas. Eaton can offer customers comprehensive solutions for minimizing their own physical risks. For example, high atop a 6,288-foot mountain—home to some of the most dangerous and unpredictable weather in the world—the Mount Washington Observatory in New Hampshire conducts research and collects real-time data for the U.S. National Weather Service. Demanding uninterrupted power for critical 24/7 observations, this nonprofit educational institution, in 2015, chose our rugged 9355
role in meeting the high end of Eaton's projected growth of segment margins from 15.2% in 2015 to 17-18% in 2020.
Our Electrical group is a leading provider of distribution and control solutions that increase energy efficiency and improve power quality, safety and reliability. Our PowerChain™ Management solutions offer a growing portfolio of “green” products and services, such as energy audits and real-time energy consumption monitoring. Eaton’s Uninterruptible Power System (UPS) products, variable speed drives and lighting controls provide greater reliability, improved operational efficiencies and enhanced safety, making power outages from the
efficiency, reduce fuel consumption, and mitigate GHG emissions.

Opportunity driver
Description
Potential impact
Timeframe
Direct/ Indirect
Likelihood
Magnitude of impact
Estimated financial
implications
Management
method
Cost of
management
Uninterruptible Power System (UPS) to support its entire IT infrastructure.
physical risk of unstable weather patterns less of a threat. For example, high atop a 6,288-foot mountain—home to some of the most dangerous and unpredictable weather in the world—the Mount Washington Observatory in New Hampshire conducts research and collects real-time data for the U.S. National Weather Service. Demanding uninterrupted power for critical 24/7 observations, this nonprofit educational institution, in 2015, chose our rugged 9355 Uninterruptible Power System (UPS) to support its entire IT infrastructure.
CC6.1c
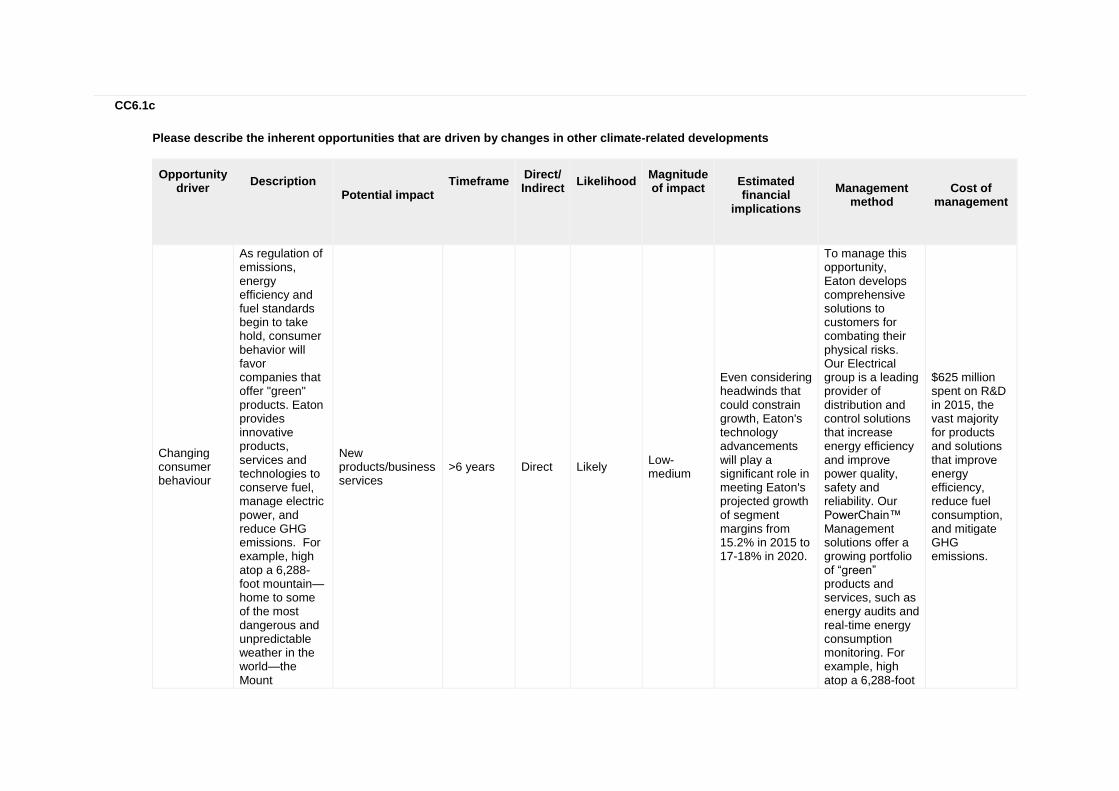
Please describe the inherent opportunities that are driven by changes in other climate-related developments
Opportunity driver
Description
Potential impact
Timeframe
Direct/ Indirect
Likelihood
Magnitude of impact
Estimated financial
implications
Management
method
Cost of
management
Changing consumer behaviour
As regulation of emissions, energy efficiency and fuel standards begin to take hold, consumer behavior will favor companies that offer "green" products. Eaton provides innovative products, services and technologies to conserve fuel, manage electric power, and reduce GHG emissions. For example, high atop a 6,288-foot mountain—home to some of the most dangerous and unpredictable weather in the world—the Mount
New products/business services
>6 years Direct Likely Low-medium
Even considering headwinds that could constrain growth, Eaton's technology advancements will play a significant role in meeting Eaton's projected growth of segment margins from 15.2% in 2015 to 17-18% in 2020.
To manage this opportunity, Eaton develops comprehensive solutions to customers for combating their physical risks. Our Electrical group is a leading provider of distribution and control solutions that increase energy efficiency and improve power quality, safety and reliability. Our PowerChain™ Management solutions offer a growing portfolio of “green” products and services, such as energy audits and real-time energy consumption monitoring. For example, high atop a 6,288-foot
$625 million spent on R&D in 2015, the vast majority for products and solutions that improve energy efficiency, reduce fuel consumption, and mitigate GHG emissions.
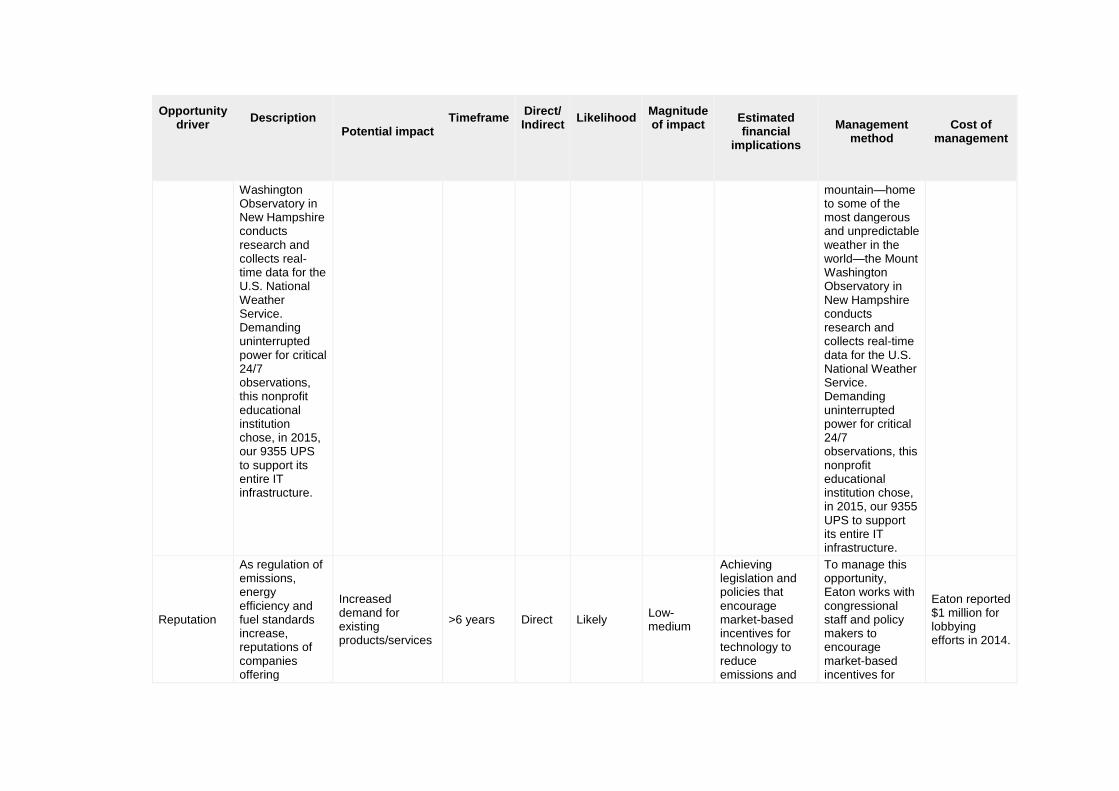
Opportunity driver
Description
Potential impact
Timeframe
Direct/ Indirect
Likelihood
Magnitude of impact
Estimated financial
implications
Management
method
Cost of
management
Washington Observatory in New Hampshire conducts research and collects real-time data for the U.S. National Weather Service. Demanding uninterrupted power for critical 24/7 observations, this nonprofit educational institution chose, in 2015, our 9355 UPS to support its entire IT infrastructure.
mountain—home to some of the most dangerous and unpredictable weather in the world—the Mount Washington Observatory in New Hampshire conducts research and collects real-time data for the U.S. National Weather Service. Demanding uninterrupted power for critical 24/7 observations, this nonprofit educational institution chose, in 2015, our 9355 UPS to support its entire IT infrastructure.
Reputation
As regulation of emissions, energy efficiency and fuel standards increase, reputations of companies offering
Increased demand for existing products/services
>6 years Direct Likely Low-medium
Achieving legislation and policies that encourage market-based incentives for technology to reduce emissions and
To manage this opportunity, Eaton works with congressional staff and policy makers to encourage market-based incentives for
Eaton reported $1 million for lobbying efforts in 2014.

Opportunity driver
Description
Potential impact
Timeframe
Direct/ Indirect
Likelihood
Magnitude of impact
Estimated financial
implications
Management
method
Cost of
management
sustainable products will trend positive. Eaton provides innovative products, services and technologies to conserve fuel, manage electrical power, and reduce GHG emissions. For example, our cylinder deactivation system is the most direct way to reduce emissions and improve fuel economy through the driving cycle. Eaton was an early leader in the research and development of onboard refueling vapor recovery (ORVR) systems, which reduce hydrocarbon emissions by
improve fuel economy and energy efficiency will increase markets for Eaton's technology. For example, Eaton expects an additional $250 million in annual revenue by 2020 from new products in our Vehicles Business that help customers lower fuel consumption, improve efficiency and solve customers' need to meet regulations.
technology development and deployment that will reduce emissions and improve fuel efficiency. For example, Eaton endorses the EPA’s new Corporate Average Fuel Economy (CAFÉ) and GHG standards for automotive passenger vehicles which mandate that vehicle fleets achieve an average of 54.5 mpg by 2025, thereby reducing fuel use and carbon emissions. Eaton is now meeting with the US EPA and other stakeholders on phase two of the CAFE and GHG rule for commercial trucks that will set standards for

Opportunity driver
Description
Potential impact
Timeframe
Direct/ Indirect
Likelihood
Magnitude of impact
Estimated financial
implications
Management
method
Cost of
management
about 95 percent during refueling. In 2015, China—the world's largest market for passenger and commercial vehicles—committed to implementing ORVR in early 2017, thereby opening up markets for Eaton's sustainable products which will provide new opportunities add to Eaton's reputation as a sustainable company.
2018 thru 2025. Our work related to testing, compliance and incentives to drive adoption of fuel efficient technologies through aggressive GHG and CAFÉ standards. In 2015, we worked with stakeholders and the agencies to identify technologies that will help OEM's meet the standards with improved performance in the next phase of rulemaking.
CC6.1d
Please explain why you do not consider your company to be exposed to inherent opportunities driven by changes in regulation that have the potential to generate a substantive change in your business operations, revenue or expenditure
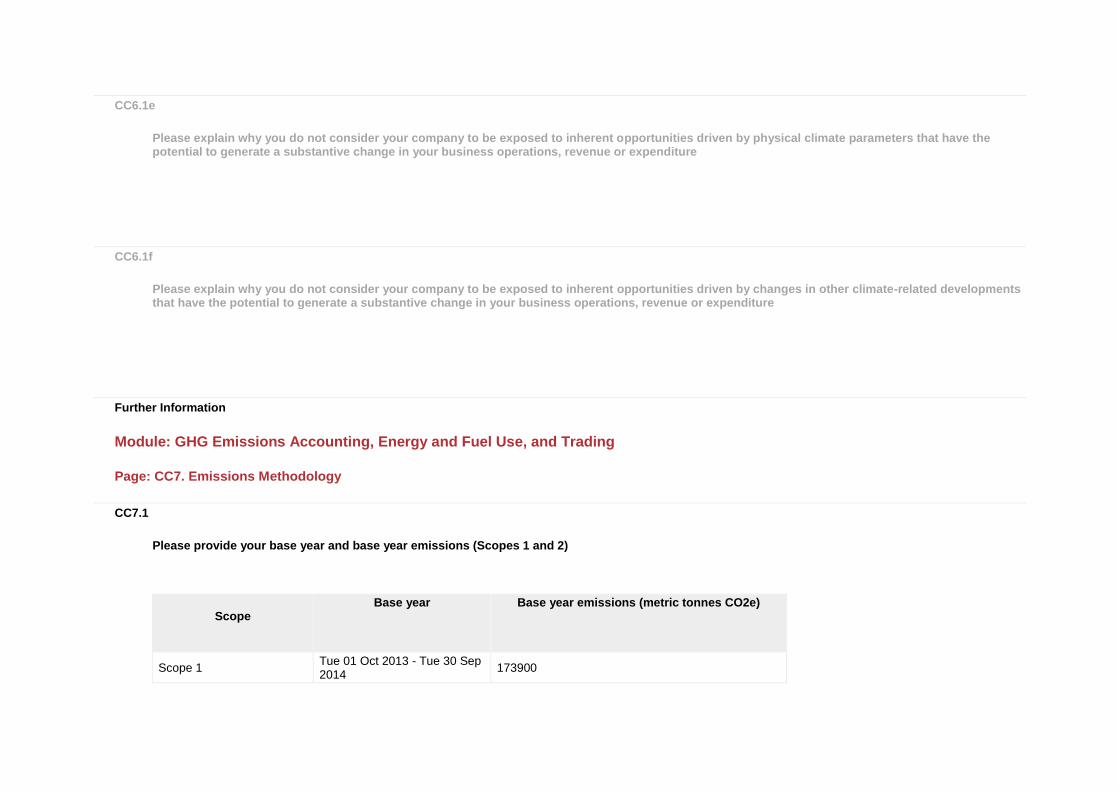
CC6.1e
Please explain why you do not consider your company to be exposed to inherent opportunities driven by physical climate parameters that have the potential to generate a substantive change in your business operations, revenue or expenditure
CC6.1f
Please explain why you do not consider your company to be exposed to inherent opportunities driven by changes in other climate-related developments that have the potential to generate a substantive change in your business operations, revenue or expenditure
Further Information
Module: GHG Emissions Accounting, Energy and Fuel Use, and Trading
Page: CC7. Emissions Methodology
CC7.1
Please provide your base year and base year emissions (Scopes 1 and 2)
Scope
Base year
Base year emissions (metric tonnes CO2e)
Scope 1 Tue 01 Oct 2013 - Tue 30 Sep 2014
173900

Scope
Base year
Base year emissions (metric tonnes CO2e)
Scope 2 (location-based) Tue 01 Oct 2013 - Tue 30 Sep 2014
854800
Scope 2 (market-based)
CC7.2
Please give the name of the standard, protocol or methodology you have used to collect activity data and calculate Scope 1 and Scope 2 emissions
Please select the published methodologies that you use
The Greenhouse Gas Protocol: A Corporate Accounting and Reporting Standard (Revised Edition)
CC7.2a
If you have selected "Other" in CC7.2 please provide details of the standard, protocol or methodology you have used to collect activity data and calculate Scope 1 and Scope 2 emissions
CC7.3
Please give the source for the global warming potentials you have used

Gas
Reference
CO2 IPCC Second Assessment Report (SAR - 100 year)
CH4 IPCC Second Assessment Report (SAR - 100 year)
N2O IPCC Second Assessment Report (SAR - 100 year)
NF3 IPCC Second Assessment Report (SAR - 100 year)
CC7.4
Please give the emissions factors you have applied and their origin; alternatively, please attach an Excel spreadsheet with this data at the bottom of this page
Fuel/Material/Energy
Emission Factor
Unit
Reference
Natural gas 117.09 lb CO2e per million BTU
The Climate Registry - General Reporting Protocol USA Industrial Sector 2015
Electricity 1106 lb CO2e per MWh Please see attached Excel workbook
Further Information
Attachments
https://www.cdp.net/sites/2016/94/5194/Climate Change 2016/Shared Documents/Attachments/ClimateChange2016/CC7.EmissionsMethodology/Electrical Power Emission Factors 2015.xlsx
Page: CC8. Emissions Data - (1 Oct 2014 - 30 Sep 2015)
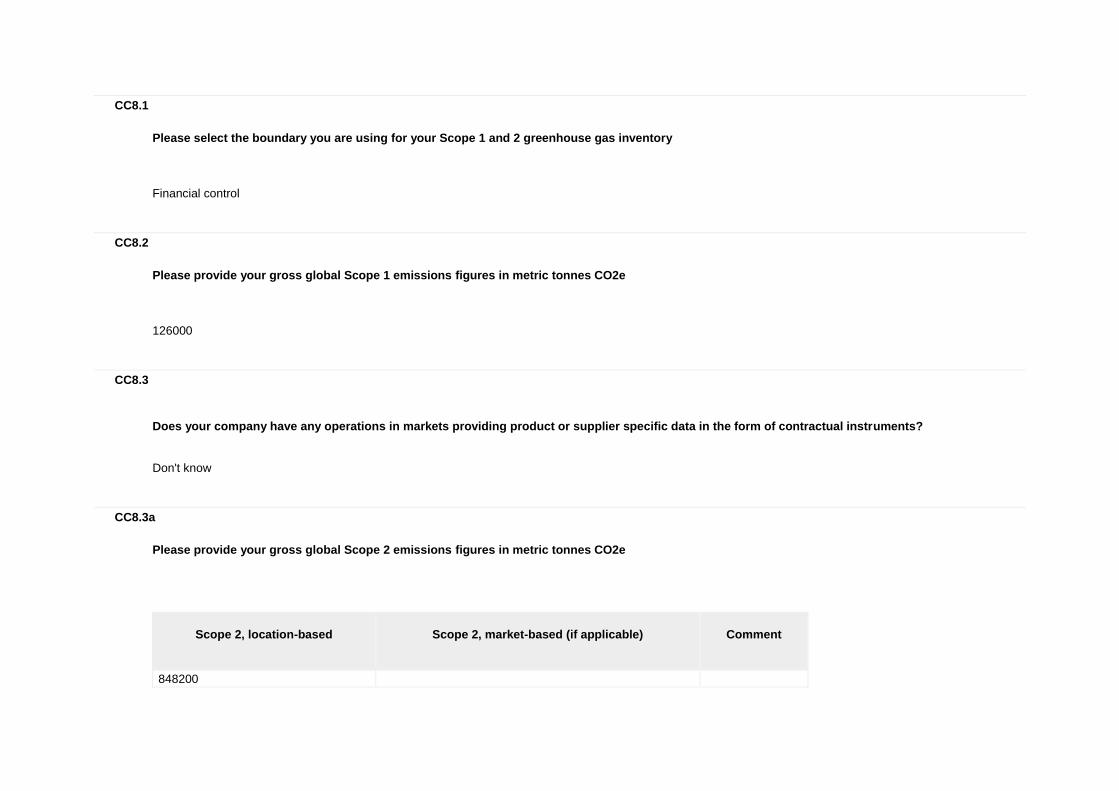
CC8.1
Please select the boundary you are using for your Scope 1 and 2 greenhouse gas inventory
Financial control
CC8.2
Please provide your gross global Scope 1 emissions figures in metric tonnes CO2e
126000
CC8.3
Does your company have any operations in markets providing product or supplier specific data in the form of contractual instruments?
Don't know
CC8.3a
Please provide your gross global Scope 2 emissions figures in metric tonnes CO2e
Scope 2, location-based
Scope 2, market-based (if applicable)
Comment
848200

CC8.4
Are there are any sources (e.g. facilities, specific GHGs, activities, geographies, etc.) of Scope 1 and Scope 2 emissions that are within your selected reporting boundary which are not included in your disclosure?
Yes
CC8.4a
Please provide details of the sources of Scope 1 and Scope 2 emissions that are within your selected reporting boundary which are not included in your disclosure
Source
Relevance of
Scope 1 emissions from this source
Relevance of
location-based Scope 2 emissions
from this source
Relevance of market-based
Scope 2 emissions from this source (if
applicable)
Explain why the source is excluded
Sales and administrative offices
Emissions are not relevant
Emissions are not relevant
Eaton excludes its sales and administrative offices from its Scope 2 emissions calculations. Sales and administrative offices account for about 200 of Eaton’s 400 locations. The average usage from a representative sample of 40 excluded sites was multiplied by the average emission factor for all 200 excluded sites to calculate a percentage estimate of the total Scope 2 emissions unaccounted for in current calculations. The excluded sites, 50% of Eaton’s locations, account for less than 10% of its total Scope 2 emissions. Eaton will continue to only account for its manufacturing locations when calculating Scope 2 emissions, as they have a footprint more than 9 times the size of sales offices.
Fuels other than natural gas
Emissions are not relevant
No emissions from this source
Eaton excludes fuels other than natural gas from its Scope 1 emissions calculations. On a survey asking sites to report fuel oil, bunker oil, coal, and propane use, 55% of sites reported that they do not use these fuels. After applying the average annual usage from sites that reported it to the sites that were unsure or had no response, fuel oil and propane accounted for less than 5% of total reported and calculated Scope 1 emissions,

Source
Relevance of
Scope 1 emissions from this source
Relevance of
location-based Scope 2 emissions
from this source
Relevance of market-based
Scope 2 emissions from this source (if
applicable)
Explain why the source is excluded
and are therefore irrelevant. No sites reported using bunker oil or coal.
CC8.5
Please estimate the level of uncertainty of the total gross global Scope 1 and 2 emissions figures that you have supplied and specify the sources of uncertainty in your data gathering, handling and calculations
Scope
Uncertainty range
Main sources of
uncertainty
Please expand on the uncertainty in your data
Scope 1 More than 5% but less than or equal to 10%
Data Gaps Assumptions Extrapolation
Data received from sources outside of the standard process, like natural gas bills from India.
Scope 2 (location-based)
More than 5% but less than or equal to 10%
Data Gaps Assumptions Extrapolation
Data received from sources outside of the standard process, like electric bills from joint ventures in India.
Scope 2 (market-based)
CC8.6

Please indicate the verification/assurance status that applies to your reported Scope 1 emissions
Third party verification or assurance process in place
CC8.6a
Please provide further details of the verification/assurance undertaken for your Scope 1 emissions, and attach the relevant statements
Verification
or assurance cycle in
place
Status in
the current reporting
year
Type of verification
or assurance
Attach the statement
Page/section
reference
Relevant standard
Proportion of reported
Scope 1 emissions verified (%)
Annual process
Complete Reasonable assurance
https://www.cdp.net/sites/2016/94/5194/Climate Change 2016/Shared Documents/Attachments/CC8.6a/Eaton FY2015 Scope1_2 GHG Verification Statement_CDP Format_final.pdf
Page 1-3 ISO14064-3
100
CC8.6b
Please provide further details of the regulatory regime to which you are complying that specifies the use of Continuous Emissions Monitoring Systems (CEMS)
Regulation
% of emissions covered by the system
Compliance period
Evidence of submission
CC8.7
Please indicate the verification/assurance status that applies to at least one of your reported Scope 2 emissions figures

Third party verification or assurance process in place
CC8.7a
Please provide further details of the verification/assurance undertaken for your location-based and/or market-based Scope 2 emissions, and attach the relevant statements
Location-based or market-based figure?
Verification
or assurance
cycle in place
Status in
the current
reporting year
Type of verification
or assurance
Attach the statement
Page/Section reference
Relevant standard
Proportion
of reported Scope 2
emissions verified
(%)
Location-based
Annual process
Complete Reasonable assurance
https://www.cdp.net/sites/2016/94/5194/Climate Change 2016/Shared Documents/Attachments/CC8.7a/Eaton FY2015 Scope1_2 GHG Verification Statement_CDP Format_final.pdf
Page 1-3 ISO14064-3
100
CC8.8
Please identify if any data points have been verified as part of the third party verification work undertaken, other than the verification of emissions figures reported in CC8.6, CC8.7 and CC14.2
Additional data points verified
Comment
Year on year change in emissions (Scope 1 and 2) See page 2 of verification report

CC8.9
Are carbon dioxide emissions from biologically sequestered carbon relevant to your organization?
No
CC8.9a
Please provide the emissions from biologically sequestered carbon relevant to your organization in metric tonnes CO2
Further Information
Page: CC9. Scope 1 Emissions Breakdown - (1 Oct 2014 - 30 Sep 2015)
CC9.1
Do you have Scope 1 emissions sources in more than one country?
Yes
CC9.1a
Please break down your total gross global Scope 1 emissions by country/region
Country/Region
Scope 1 metric tonnes CO2e

Country/Region
Scope 1 metric tonnes CO2e
North America 88800
South America 4300
Europe, Middle East and Africa (EMEA) 32200
Asia, Australasia 700
CC9.2
Please indicate which other Scope 1 emissions breakdowns you are able to provide (tick all that apply)
By business division
CC9.2a
Please break down your total gross global Scope 1 emissions by business division
Business division
Scope 1 emissions (metric tonnes CO2e)
Electrical Americas 20500
Electrical EMEA 5200
Electrical APAC 200
Hydraulics Segment 41100
Aerospace Segment 12200
Vehicle Segment 46800

CC9.2b
Please break down your total gross global Scope 1 emissions by facility
Facility
Scope 1 emissions (metric tonnes CO2e)
Latitude
Longitude
CC9.2c
Please break down your total gross global Scope 1 emissions by GHG type
GHG type
Scope 1 emissions (metric tonnes CO2e)
CC9.2d
Please break down your total gross global Scope 1 emissions by activity
Activity
Scope 1 emissions (metric tonnes CO2e)
Further Information
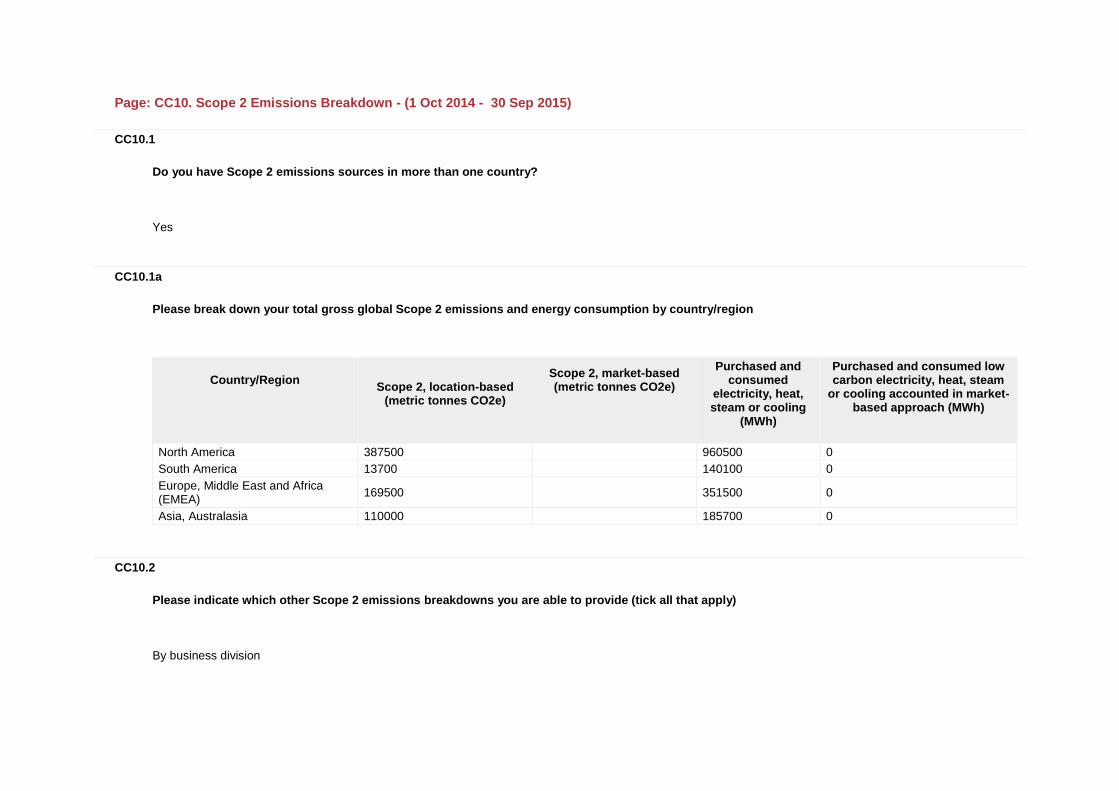
Page: CC10. Scope 2 Emissions Breakdown - (1 Oct 2014 - 30 Sep 2015)
CC10.1
Do you have Scope 2 emissions sources in more than one country?
Yes
CC10.1a
Please break down your total gross global Scope 2 emissions and energy consumption by country/region
Country/Region
Scope 2, location-based
(metric tonnes CO2e)
Scope 2, market-based (metric tonnes CO2e)
Purchased and consumed
electricity, heat, steam or cooling
(MWh)
Purchased and consumed low carbon electricity, heat, steam
or cooling accounted in market-based approach (MWh)
North America 387500
960500 0
South America 13700
140100 0
Europe, Middle East and Africa (EMEA)
169500
351500 0
Asia, Australasia 110000
185700 0
CC10.2
Please indicate which other Scope 2 emissions breakdowns you are able to provide (tick all that apply)
By business division

CC10.2a
Please break down your total gross global Scope 2 emissions by business division
Business division
Scope 2 emissions, location based (metric tonnes CO2e)
Scope 2 emissions, market-based
(metric tonnes CO2e)
Electrical Americas 81800
Electrical EMEA 27000
Electrical APAC 27300
Hydraulics Segment 175500
Aerospace Segment 52100
Vehicle Segment 317000
CC10.2b
Please break down your total gross global Scope 2 emissions by facility
Facility
Scope 2 emissions, location based (metric tonnes CO2e)
Scope 2 emissions, market-based
(metric tonnes CO2e)
CC10.2c
Please break down your total gross global Scope 2 emissions by activity

Activity
Scope 2 emissions, location based (metric tonnes CO2e)
Scope 2 emissions, market-based
(metric tonnes CO2e)
Further Information
Page: CC11. Energy
CC11.1
What percentage of your total operational spend in the reporting year was on energy?
More than 0% but less than or equal to 5%
CC11.2
Please state how much heat, steam, and cooling in MWh your organization has purchased and consumed during the reporting year
Energy type
Energy purchased and consumed (MWh)
Heat 0
Steam 0
Cooling 0
CC11.3
Please state how much fuel in MWh your organization has consumed (for energy purposes) during the reporting year

941200
CC11.3a
Please complete the table by breaking down the total "Fuel" figure entered above by fuel type
Fuels
MWh
Natural gas 941200
CC11.4
Please provide details of the electricity, heat, steam or cooling amounts that were accounted at a low carbon emission factor in the market-based Scope 2 figure reported in CC8.3a
Basis for applying a low carbon emission factor
MWh consumed associated with low carbon electricity, heat, steam or
cooling
Comment
No purchases or generation of low carbon electricity, heat, steam or cooling accounted with a low carbon emissions factor
0
CC11.5
Please report how much electricity you produce in MWh, and how much electricity you consume in MWh

Total electricity consumed
(MWh)
Consumed
electricity that is purchased (MWh)
Total electricity produced
(MWh)
Total renewable
electricity produced (MWh)
Consumed renewable
electricity that is produced by company (MWh)
Comment
1637800 1637800 0 0 0
Further Information
Page: CC12. Emissions Performance
CC12.1
How do your gross global emissions (Scope 1 and 2 combined) for the reporting year compare to the previous year?
Decreased
CC12.1a
Please identify the reasons for any change in your gross global emissions (Scope 1 and 2 combined) and for each of them specify how your emissions compare to the previous year
Reason
Emissions value
(percentage)
Direction of change
Please explain and include calculation
Emissions reduction activities
0.7 Decrease
Eaton’s emissions reduction activities in 2015 (re-lighting, HVAC upgrades, compressor optimization, etc.) have resulted in S1 & S2 emissions reductions of 7593 mtCO2e. Our total global emissions in 2014 were 1,028,700 mtCO2e. Therefore, we arrived at 0.7% reduction through: 7593 mtCO2e/1,028,700 mtCO2e*100.
Divestment
Acquisitions

Reason
Emissions value
(percentage)
Direction of change
Please explain and include calculation
Mergers
Change in output 1.2 Decrease
In 2015, Eaton's sales, adjusted for foreign exchange rates, were down by 1.2 percent compared to 2014, resulting in decreased factory activity and energy use. Our global S1 & S2 emissions in 2014 were 1028700 mtCO2e, and our decrease due to change in output in 2015 was 12344 mtCO2e. We arrived at the 1.2% decrease through: 12344 mtCO2e/ 1028700mtCO2e*100.
Change in methodology
Change in boundary
Change in physical operating conditions
Unidentified 0.9 Increase
Overall, Eaton's total emissions decreased by 1.0 percent from 2014 to 2015, or 9,800 mtCO2e. 9800mtCO2e/ 1028700mtCO2e*100 = 1.0% We can account for a total decrease of 1.9% through emissions reduction activities and changes in output. This leaves an unaccounted-for 0.9% increase in emissions. This increase could be due to a more unfavorable electricity mix, reducing Scope 2 emissions more than Scope 1 emissions, or rounding errors.
Other
CC12.1b
Is your emissions performance calculations in CC12.1 and CC12.1a based on a location-based Scope 2 emissions figure or a market-based Scope 2 emissions figure?
Location-based
CC12.2
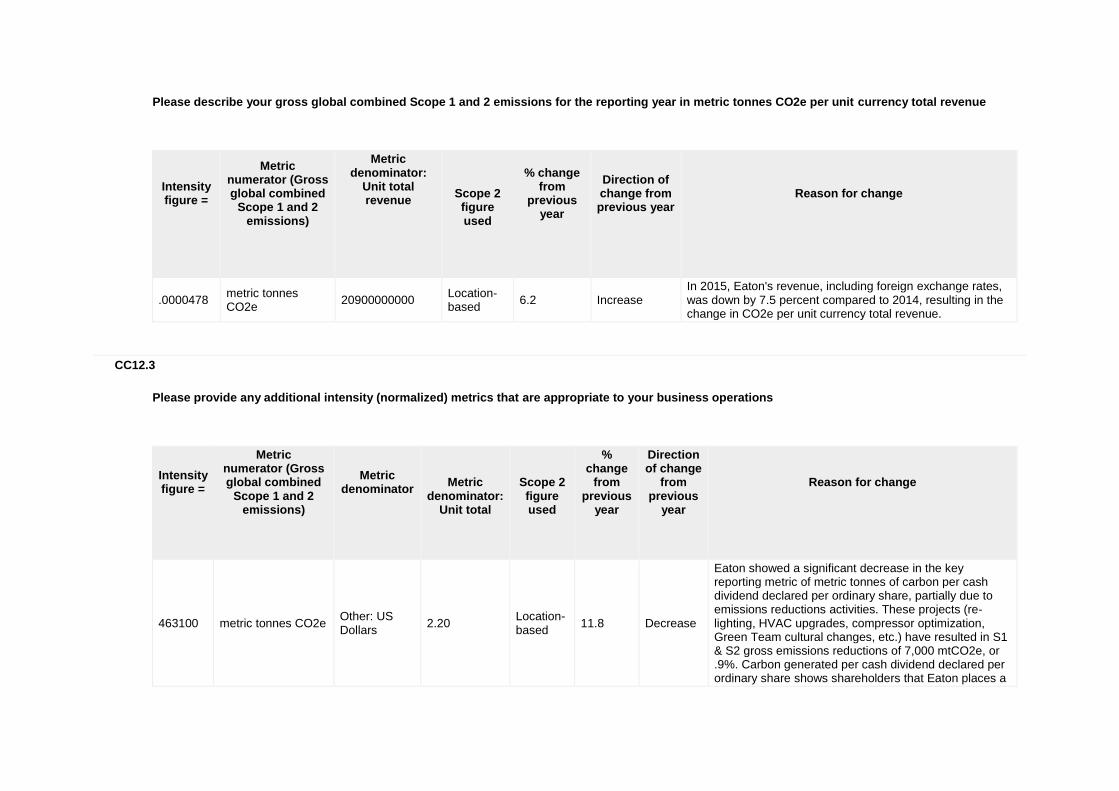
Please describe your gross global combined Scope 1 and 2 emissions for the reporting year in metric tonnes CO2e per unit currency total revenue
Intensity figure =
Metric numerator (Gross global combined
Scope 1 and 2 emissions)
Metric denominator:
Unit total revenue
Scope 2 figure used
% change from
previous year
Direction of change from previous year
Reason for change
.0000478 metric tonnes CO2e
20900000000 Location-based
6.2 Increase In 2015, Eaton's revenue, including foreign exchange rates, was down by 7.5 percent compared to 2014, resulting in the change in CO2e per unit currency total revenue.
CC12.3
Please provide any additional intensity (normalized) metrics that are appropriate to your business operations
Intensity figure =
Metric numerator (Gross global combined
Scope 1 and 2 emissions)
Metric denominator
Metric
denominator: Unit total
Scope 2 figure used
% change
from previous
year
Direction of change
from previous
year
Reason for change
463100 metric tonnes CO2e Other: US Dollars
2.20 Location-based
11.8 Decrease
Eaton showed a significant decrease in the key reporting metric of metric tonnes of carbon per cash dividend declared per ordinary share, partially due to emissions reductions activities. These projects (re-lighting, HVAC upgrades, compressor optimization, Green Team cultural changes, etc.) have resulted in S1 & S2 gross emissions reductions of 7,000 mtCO2e, or .9%. Carbon generated per cash dividend declared per ordinary share shows shareholders that Eaton places a

Intensity figure =
Metric numerator (Gross global combined
Scope 1 and 2 emissions)
Metric denominator
Metric
denominator: Unit total
Scope 2 figure used
% change
from previous
year
Direction of change
from previous
year
Reason for change
high value on efficiency when managing carbon.
Further Information
Page: CC13. Emissions Trading
CC13.1
Do you participate in any emissions trading schemes?
No, and we do not currently anticipate doing so in the next 2 years
CC13.1a
Please complete the following table for each of the emission trading schemes in which you participate
Scheme name
Period for which data is supplied
Allowances allocated
Allowances purchased
Verified emissions in metric tonnes CO2e
Details of ownership
CC13.1b
What is your strategy for complying with the schemes in which you participate or anticipate participating?

CC13.2
Has your organization originated any project-based carbon credits or purchased any within the reporting period?
No
CC13.2a
Please provide details on the project-based carbon credits originated or purchased by your organization in the reporting period
Credit origination
or credit purchase
Project type
Project identification
Verified to which standard
Number of credits (metric
tonnes of CO2e)
Number of credits (metric tonnes
CO2e): Risk adjusted volume
Credits cancelled
Purpose, e.g. compliance
Further Information
Page: CC14. Scope 3 Emissions
CC14.1
Please account for your organization’s Scope 3 emissions, disclosing and explaining any exclusions

Sources of Scope 3
emissions
Evaluation status
metric tonnes CO2e
Emissions calculation methodology
Percentage of
emissions calculated using data obtained
from suppliers or value chain
partners
Explanation
Purchased goods and services
Relevant, calculated
2160000
To calculate an average emission factor for purchased goods, Eaton utilizes the CDP Reporter Services Supply Chain Analytics portal. Indexed emissions data is sourced from CDP responses of our purchased goods supply chain partners, and corrected to accurately reflect emissions per unit revenue. These emission factors are multiplied by our annual spend on each supplier to determine our purchased goods emissions from this subset of suppliers, and then extrapolated by total annual purchased goods spend to represent the whole corporation. Intercompany sales are excluded so as to avoid double counting between scopes.
4.00%
Capital goods Not relevant, explanation provided
To calculate an average emission factor for capital goods, Eaton utilizes the CDP Reporter Services Supply Chain Analytics portal. Indexed emissions data is sourced from CDP responses of our capital goods supply chain partners, and corrected to accurately reflect emissions per unit revenue. These emission factors are multiplied by our annual spend on each supplier to determine our capital goods emissions from this subset of suppliers, and then extrapolated by total annual capital goods spend to represent the whole corporation. Intercompany sales are excluded so as to avoid double counting between scopes.
72.00% Calculated capital goods emissions represent 1% of our total emissions impact and are not relevant.
Fuel-and-energy- Not relevant,
Fuel- and energy-related activities (including
Calculated upstream fuel emissions represent

Sources of Scope 3
emissions
Evaluation status
metric tonnes CO2e
Emissions calculation methodology
Percentage of
emissions calculated using data obtained
from suppliers or value chain
partners
Explanation
related activities (not included in Scope 1 or 2)
explanation provided
upstream emissions and transportation and distribution losses) are estimated using online lifecycle databases (% breakdown by life cycle phase) and Eaton’s scope 1 and scope 2 data (CO2e emissions). Online databases estimate upstream emissions for electricity use as 6% of total emissions, and upstream emissions for natural gas use as 60% of total emissions. Category 3 emissions are extrapolated from Eaton’s Scope 1 and Scope 2 calculations using these percentages.
less than 1% of our total emissions impact and are not relevant.
Upstream transportation and distribution
Not relevant, explanation provided
Transportation and distribution emissions data is received from FedEx, who manages Eaton’s logistics. Assumptions based on weight, volume, distance, and mode of shipment are applied to mass and distance information from truck, air, and small package shipments. These modes combined account for 97% of all shipments. Other modes comprising 3% of shipments are not included. Upstream and downstream shipments are categorized based on payment method. FedEx provides data from the North America region, which accounts for about 65% of Eaton’s total sales. Emissions are therefore extrapolated by 35% to account for excluded global shipments. It is assumed that approximately 15% of shipments are paid by customers or suppliers and are not included in the dataset, so emissions are extrapolated to include these as well.
56.00% Calculated upstream T&D emissions represent less than 1% of our total emissions impact and are not relevant.
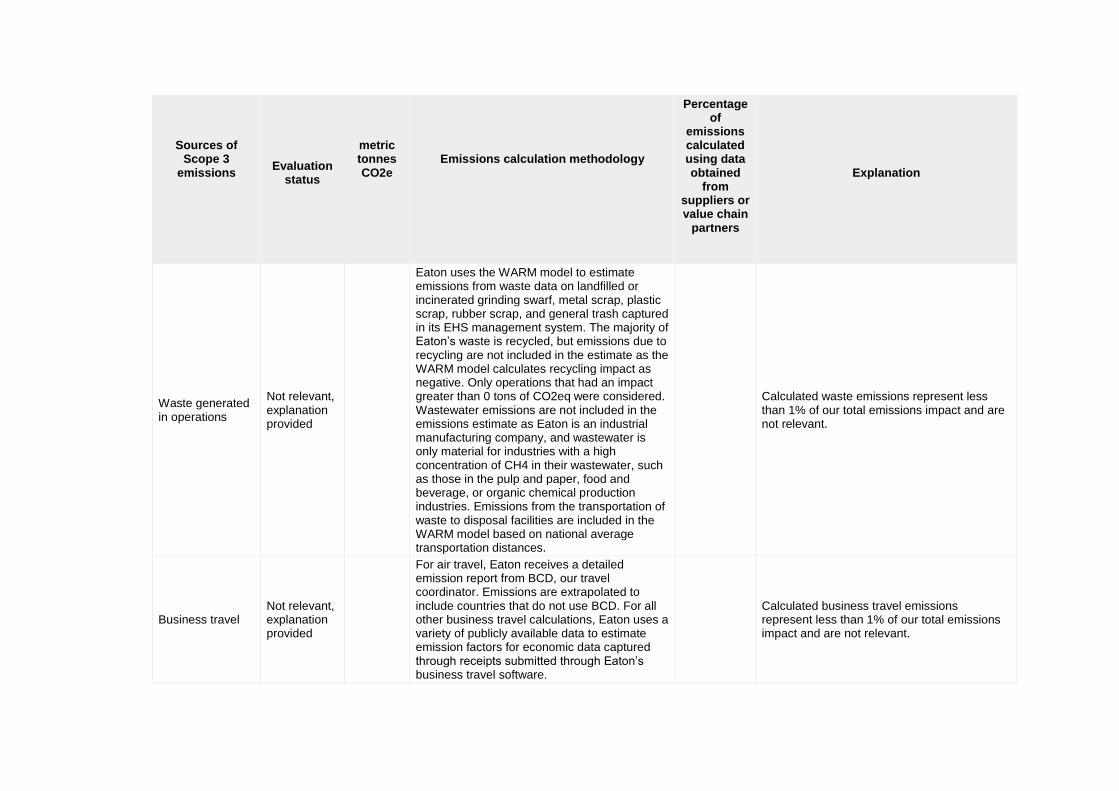
Sources of Scope 3
emissions
Evaluation status
metric tonnes CO2e
Emissions calculation methodology
Percentage of
emissions calculated using data obtained
from suppliers or value chain
partners
Explanation
Waste generated in operations
Not relevant, explanation provided
Eaton uses the WARM model to estimate emissions from waste data on landfilled or incinerated grinding swarf, metal scrap, plastic scrap, rubber scrap, and general trash captured in its EHS management system. The majority of Eaton’s waste is recycled, but emissions due to recycling are not included in the estimate as the WARM model calculates recycling impact as negative. Only operations that had an impact greater than 0 tons of CO2eq were considered. Wastewater emissions are not included in the emissions estimate as Eaton is an industrial manufacturing company, and wastewater is only material for industries with a high concentration of CH4 in their wastewater, such as those in the pulp and paper, food and beverage, or organic chemical production industries. Emissions from the transportation of waste to disposal facilities are included in the WARM model based on national average transportation distances.
Calculated waste emissions represent less than 1% of our total emissions impact and are not relevant.
Business travel Not relevant, explanation provided
For air travel, Eaton receives a detailed emission report from BCD, our travel coordinator. Emissions are extrapolated to include countries that do not use BCD. For all other business travel calculations, Eaton uses a variety of publicly available data to estimate emission factors for economic data captured through receipts submitted through Eaton’s business travel software.
Calculated business travel emissions represent less than 1% of our total emissions impact and are not relevant.
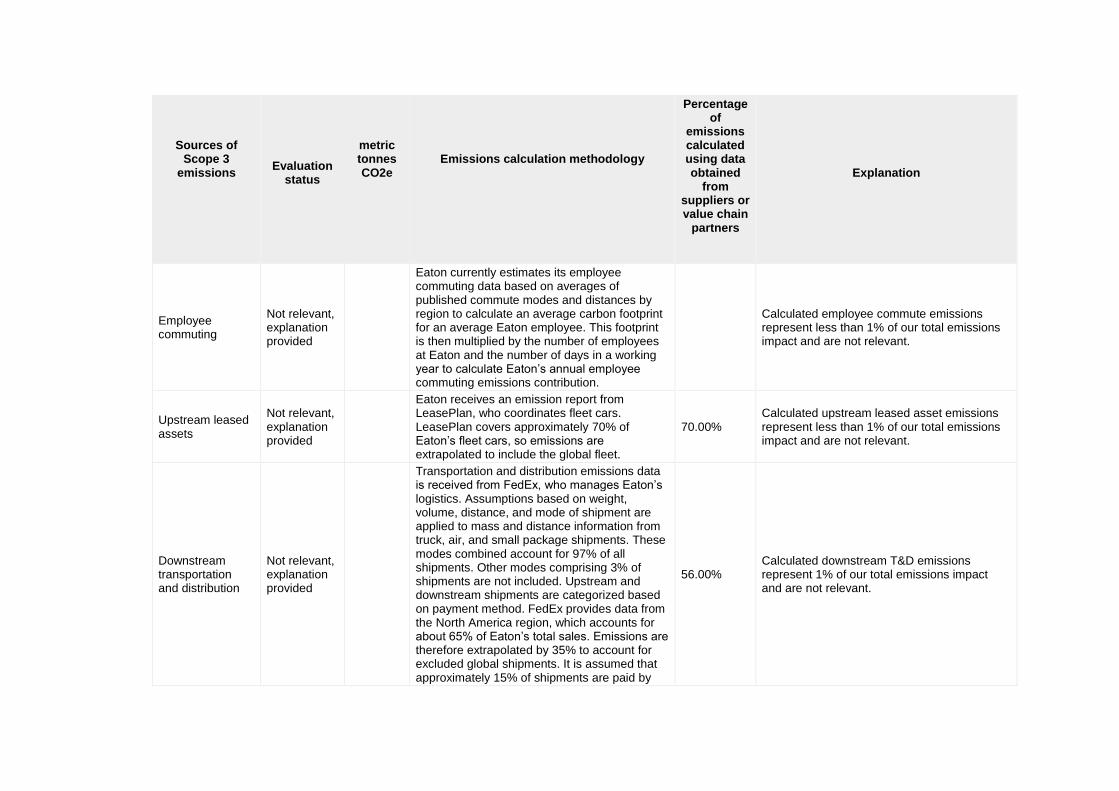
Sources of Scope 3
emissions
Evaluation status
metric tonnes CO2e
Emissions calculation methodology
Percentage of
emissions calculated using data obtained
from suppliers or value chain
partners
Explanation
Employee commuting
Not relevant, explanation provided
Eaton currently estimates its employee commuting data based on averages of published commute modes and distances by region to calculate an average carbon footprint for an average Eaton employee. This footprint is then multiplied by the number of employees at Eaton and the number of days in a working year to calculate Eaton’s annual employee commuting emissions contribution.
Calculated employee commute emissions represent less than 1% of our total emissions impact and are not relevant.
Upstream leased assets
Not relevant, explanation provided
Eaton receives an emission report from LeasePlan, who coordinates fleet cars. LeasePlan covers approximately 70% of Eaton’s fleet cars, so emissions are extrapolated to include the global fleet.
70.00% Calculated upstream leased asset emissions represent less than 1% of our total emissions impact and are not relevant.
Downstream transportation and distribution
Not relevant, explanation provided
Transportation and distribution emissions data is received from FedEx, who manages Eaton’s logistics. Assumptions based on weight, volume, distance, and mode of shipment are applied to mass and distance information from truck, air, and small package shipments. These modes combined account for 97% of all shipments. Other modes comprising 3% of shipments are not included. Upstream and downstream shipments are categorized based on payment method. FedEx provides data from the North America region, which accounts for about 65% of Eaton’s total sales. Emissions are therefore extrapolated by 35% to account for excluded global shipments. It is assumed that approximately 15% of shipments are paid by
56.00% Calculated downstream T&D emissions represent 1% of our total emissions impact and are not relevant.

Sources of Scope 3
emissions
Evaluation status
metric tonnes CO2e
Emissions calculation methodology
Percentage of
emissions calculated using data obtained
from suppliers or value chain
partners
Explanation
customers or suppliers and are not included in the dataset, so emissions are extrapolated to include these as well.
Processing of sold products
Not relevant, explanation provided
Emissions related to the processing of sold products are irrelevant. Eaton manufactures highly engineered products. Customers integrate our products and systems into their platforms or sell them directly to consumers. We do not produce products that act as raw materials that require further processing.
Use of sold products
Relevant, calculated
30000000
Using the data from LCAs Eaton has completed, the average emissions contribution from use of Eaton products is about 87%, while manufacturing and material use account for 11.5%. Eaton’s Scope 1 and 2 emissions, added to the calculated Scope 3 purchased goods, capital goods, and category 3 emissions, are extrapolated from 11.5% to 87% to estimate annual use impact.
0.00%
End of life treatment of sold products
Not relevant, explanation provided
Using the data from LCAs Eaton has completed, the average emissions contribution from disposal of Eaton products is about 0.5%, while manufacturing and material use account for 11.5%. Eaton’s Scope 1 and 2 emissions, added to the calculated Scope 3 purchased goods, capital goods, and category 3 emissions, are extrapolated from 11.5% to 0.5% to estimate annual end of life emissions.
Calculated EOL emissions represent less than 1% of our total emissions impact and are not relevant.
Downstream leased assets
Not relevant, explanation
Emissions related to downstream leased assets are irrelevant. Eaton Corporation does

Sources of Scope 3
emissions
Evaluation status
metric tonnes CO2e
Emissions calculation methodology
Percentage of
emissions calculated using data obtained
from suppliers or value chain
partners
Explanation
provided not lease company-owned assets to customers.
Franchises Not relevant, explanation provided
Emissions related to franchises are irrelevant. Eaton Corporation manufactures highly engineered products. We sell these products directly to customers without the use of a franchised network.
Investments Not relevant, explanation provided
Emissions related to investments are irrelevant. This category is designed primarily for private financial institutions (e.g., commercial banks), but is also relevant to public financial institutions (e.g., multilateral development banks, export credit agencies) and other entities with investments not included in scope 1 and scope 2. As a manufacturer of highly engineered products, Eaton Corporation does not meet these criteria and therefore, this category does not apply.
Other (upstream)
Other (downstream)
CC14.2
Please indicate the verification/assurance status that applies to your reported Scope 3 emissions
Third party verification or assurance process in place

CC14.2a
Please provide further details of the verification/assurance undertaken, and attach the relevant statements
Verification
or assurance cycle in place
Status in
the current reporting
year
Type of
verification or
assurance
Attach the statement
Page/Section
reference
Relevant standard
Proportion of
reported Scope 3 emissions verified (%)
Annual process
Complete Limited assurance
https://www.cdp.net/sites/2016/94/5194/Climate Change 2016/Shared Documents/Attachments/CC14.2a/Eaton 2015 Scope 3 GHG Verification Statement_CDP Format_final.pdf
Pages 1-3 ISO14064-3
100
CC14.3
Are you able to compare your Scope 3 emissions for the reporting year with those for the previous year for any sources?
Yes
CC14.3a
Please identify the reasons for any change in your Scope 3 emissions and for each of them specify how your emissions compare to the previous year

Sources of
Scope 3 emissions
Reason for
change
Emissions value
(percentage)
Direction of
change
Comment
Business travel Emissions reduction activities
21 Decrease Eaton has achieved a 21% reduction over last year’s emissions due to a reduction in business travel reflecting in part the slowdown of the global economy as well as the use of more environmentally friendly telecommunications options.
CC14.4
Do you engage with any of the elements of your value chain on GHG emissions and climate change strategies? (Tick all that apply)
Yes, our suppliers Yes, our customers Yes, other partners in the value chain
CC14.4a
Please give details of methods of engagement, your strategy for prioritizing engagement and measures of success
Eaton Corporation is committed to improving our environmental footprint – not only around our own emissions, energy and water consumption but also by helping our suppliers reduce theirs. Method of engagement: In 2015 we asked our most strategic suppliers to join us in our sustainability efforts by working with our partner CDP and completing the Supplier Questionnaire. Prioritizing engagement: Suppliers are prioritized and selected based on a variety of risk-based criteria including top spend and carbon emissions intensity of supplied products or operations, among others. In 2014, we began to expand our requests to include more suppliers from the metals industry. The targeted suppliers are strategic to our operations representing over 20% of Eaton’s total upstream spend on goods and services. Eaton engaged GZA GeoEnvironmental as an additional resource to assist our suppliers in responding to the questionnaire offering training and one on one consultation. Measures of Success: Our success was measured by the number of respondents and the quality of information submitted. The CDP supply chain results showed Eaton as a leading company in both number of suppliers asked and number responding. Eaton uses the supplier reported climate change qualitative and quantitative data in a variety of ways to develop an improved understanding of our footprint, as well as monitoring climate change-related risks and opportunities within our supply chain. Additionally, certain of the supplier provided emission data is used as inputs in Eaton’s calculation of relevant scope 3 emissions categories.
CC14.4b
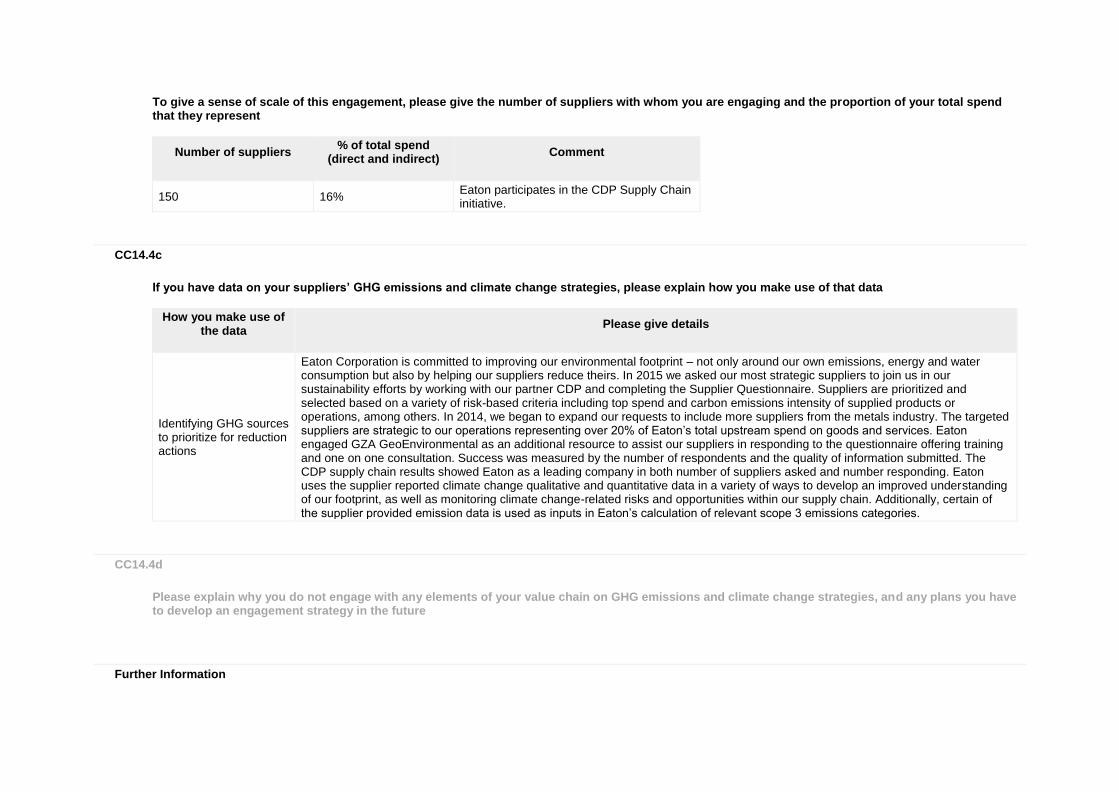
To give a sense of scale of this engagement, please give the number of suppliers with whom you are engaging and the proportion of your total spend that they represent
Number of suppliers
% of total spend (direct and indirect)
Comment
150 16% Eaton participates in the CDP Supply Chain initiative.
CC14.4c
If you have data on your suppliers’ GHG emissions and climate change strategies, please explain how you make use of that data
How you make use of the data
Please give details
Identifying GHG sources to prioritize for reduction actions
Eaton Corporation is committed to improving our environmental footprint – not only around our own emissions, energy and water consumption but also by helping our suppliers reduce theirs. In 2015 we asked our most strategic suppliers to join us in our sustainability efforts by working with our partner CDP and completing the Supplier Questionnaire. Suppliers are prioritized and selected based on a variety of risk-based criteria including top spend and carbon emissions intensity of supplied products or operations, among others. In 2014, we began to expand our requests to include more suppliers from the metals industry. The targeted suppliers are strategic to our operations representing over 20% of Eaton’s total upstream spend on goods and services. Eaton engaged GZA GeoEnvironmental as an additional resource to assist our suppliers in responding to the questionnaire offering training and one on one consultation. Success was measured by the number of respondents and the quality of information submitted. The CDP supply chain results showed Eaton as a leading company in both number of suppliers asked and number responding. Eaton uses the supplier reported climate change qualitative and quantitative data in a variety of ways to develop an improved understanding of our footprint, as well as monitoring climate change-related risks and opportunities within our supply chain. Additionally, certain of the supplier provided emission data is used as inputs in Eaton’s calculation of relevant scope 3 emissions categories.
CC14.4d
Please explain why you do not engage with any elements of your value chain on GHG emissions and climate change strategies, and any plans you have to develop an engagement strategy in the future
Further Information
Module: Sign Off
Page: CC15. Sign Off
CC15.1
Please provide the following information for the person that has signed off (approved) your CDP climate change response
Name
Job title
Corresponding job category
Craig Arnold President and Chief Executive Officer Chief Executive Officer (CEO)
Further Information
CDP 2016 Climate Change 2016 Information Request