View - Digital Library and Archives - Virginia Tech
229
The Influence of Teaching Methods on Student Achievement on Virginia’s End of Course Standards of Learning Test for Algebra I Matthew Steven Haas Dissertation submitted to the Faculty of the Virginia Polytechnic Institute and State University In partial fulfillment of the requirements for the degree of Doctor of Education In Educational Leadership and Policy Studies Travis W. Twiford, Chair Mary E. Yakimowski-Srebnick Steven M. Janosik Louis O. Tonelson Stephen Parson September 9, 2002 Virginia Beach, Virginia Key Words: Algebra, Instructional Practices, Teaching Methods, Achievement
Transcript of View - Digital Library and Archives - Virginia Tech
The Influence of Teaching Methods on
Student Achievement on Virginia’s End of Course Standards of Learning Test for Algebra I
Matthew Steven Haas
Dissertation submitted to the Faculty of the
Virginia Polytechnic Institute and State University
In partial fulfillment of the requirements for the degree of
Doctor of Education
In
Educational Leadership and Policy Studies
Travis W. Twiford, Chair
Mary E. Yakimowski-Srebnick
Steven M. Janosik
Louis O. Tonelson
Stephen Parson
September 9, 2002
Virginia Beach, Virginia
Key Words: Algebra, Instructional Practices, Teaching Methods, Achievement
The Influence of Teaching Methods on
Student Achievement on Virginia’s End of Course Standards of Learning Test for Algebra I
by
Matthew Steven Haas Travis W. Twiford, Chair
(Abstract)
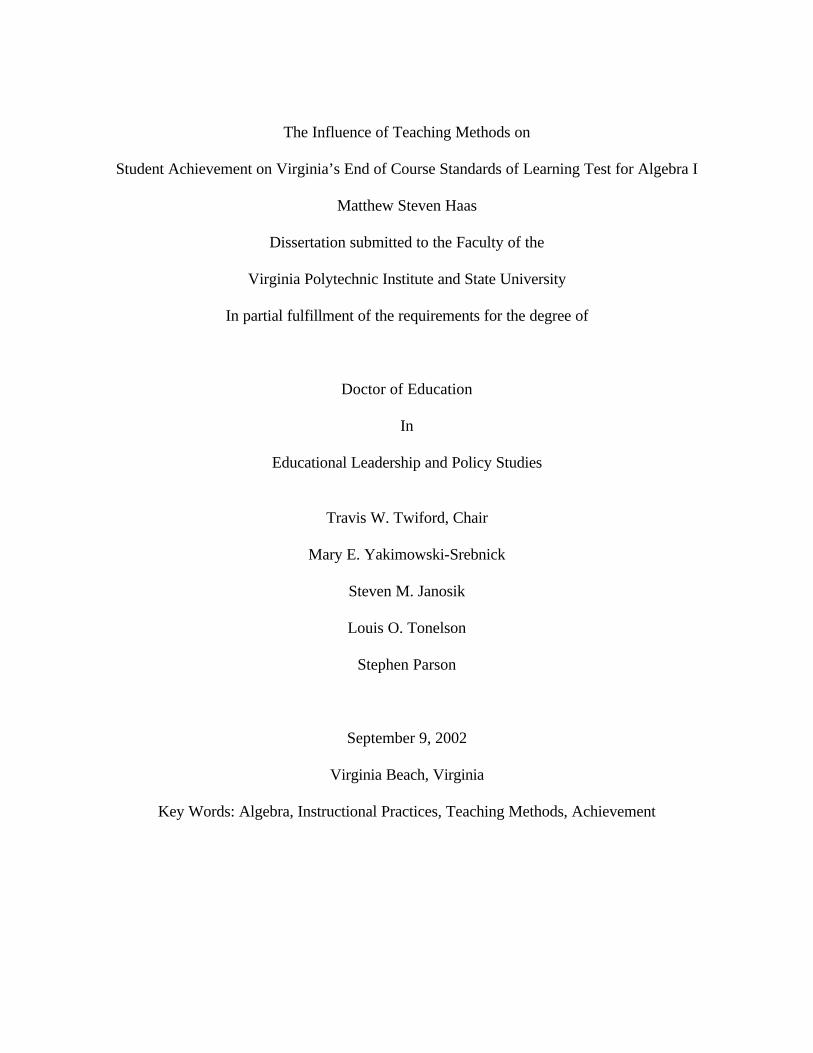
Given Virginia’s Standards of Learning (SOL)(1995) mandates, Virginia’s Algebra I
teachers and school leaders should utilize research for teaching methods; further, the relationship
between teaching methods and student achievement on Virginia’s End of Course SOL Test for
Algebra I deserves investigation, since Virginia’s students must pass this test to earn verified
credit toward high school graduation.
Replicating Marcucci’s (1980) methodology for meta-analysis, the present study focuses
on research with methods for teaching secondary level algebra from 1980 to 2001. From a
sample of 34 studies with 62 effect sizes, six categories for teaching methods and corresponding
effect sizes were derived for “good” studies: direct instruction (.67), problem-based learning
(.44), technology aided instruction (.41), cooperative learning (.26), manipulatives, models, and
multiple representations (.23), and communication and study skills (.16).
Using results from the meta-analysis and review of literature and extensive content
validation, a 51-item questionnaire with a reliability coefficient of .89 was developed. The
questionnaire was posted as a web-site to survey selected Algebra I teachers in Region VII to
ascertain how frequently they use research-based teaching methods and to determine the
influence of teaching methods on their students’ achievement on the spring, 2002, Algebra I SOL
Test.
Ninety-eight percent of teachers surveyed responded. The 53 participating Algebra I
teachers, representing 1,538 students, produced a passing mean scale score of 438.01
(SD = 32.67). Teachers indicated they used all teaching method categories more than half the
time with mean usage frequencies ranging from 2.56 to 3.75 times out of five class sessions.
Teaching method categories were then entered into a blockwise multiple regression analysis,
ranked according to the strength of their correlations to teachers’ mean scale SOL test scores.
Teaching method usage shared 9.7% of variance with participating teachers’ scores.
Meta- and regression analysis results suggest that Algebra I teachers should emphasize
direct instruction, technology aided instruction, and problem-based learning. These three
teaching method categories ranked highest in both analyses. The questionnaire developed here
could be used with a larger sample for research into the influence of teaching methods on
individual reporting categories on the Algebra I SOL test.

iv
DEDICATION
Sheri and Mark, this work is for you. I love you right up to the moon – and back.
v
ACKNOWLEDGEMENTS
Dr. Travis Twiford, thank you for being a constant source of encouragement and
friendship. You are an advisor in every best sense of the word and a blessing to me on this
arduous journey. Dr. Mary Yakimowski, thank you for teaching me what I know about research
and mentoring me. You inspired me to pursue this topic and gave me the confidence and tools I
needed to do it. Dr. Steven Janosik, thank you for your well-timed and enlightening doses of
reality. Your encouraging insights made me rethink my work for the better, and you always
found a way to phrase them positively. Dr. Louis Tonelson, thank you for being my principal. I
have always looked up to you, and you never fail to make me a better person. Dr. Stephen
Parson, thank you for your timing, candor, and sense of humor. I have learned that a comment or
question from you is always the right one at the right time; and, it is always an improvement.
I want to thank Dr. Robert Marcucci for allowing me to replicate his meta-analysis
methodology for my review of literature. By spending a few minutes with me on the phone and
giving his blessing for my study, Dr. Marcucci laid the foundation for my research. I must also
thank the following people who made the study possible. Mr. Terry Hawthorne loaned me his
talents in converting my questionnaire into an active server page. Dr. Skip Wilson and his spring,
2002, EDCI 4744 & 5744 students validated my questionnaire. Virginia Beach City Public
Schools allowed me to work with fifteen math teachers to obtain reliability data for the scale;
and, these fifteen teachers volunteered to participate. Mrs. Sheri Haas listened to countless
renditions and aspects of this study and edited it.
I cannot thank the participating superintendents, principals, and teachers of Region VII of
the Commonwealth enough for trusting me and working with me to complete this research. Your

vi
willingness to participate speaks highly of your dedication to students and your interest in
educational research.
Mr. Henry Blessing and Mrs. Susan Blessing gave me a place to stay and plenty of love
during my orientation to residency and at every step of the way through this process.
My mother and father, James and Joan Haas, made me the type of person who can finish
a job with ethics, with attention to detail, and with concern for other people, whether someone is
watching or not. Knowing, as I always have, that my parents would love me through success or
failure, made me willing to take this risk and to see it through.
My wife Sheri and my son Mark gave up their time with me and put up with me. They
have been patient beyond reason and have supported me in every way and unconditionally. Of all
the blessings I have, my wife and son are the greatest.
vii
Table of Contents
List of Tables…………………………………………………………………………….. xi
List of Figures……………………………………………………………………………. xii
Chapter I: The Problem and Its Context……….……….………………………………...
1
An International Context………….……………………………………………. 1
A National Context……………………………………………………………... 3
A State Context………..………………………………………………………... 5
Statement of the Problem………………………………………………………. 9
Research Purpose……….………………………………………………………. 10
Research Questions……………………………………………………………... 10
Limitations and Delimitations of the Study…………………………………….. 11
A Theory of Educational Productivity………………………………………….. 15
Overview of Succeeding Chapters……………………………………………... 19
Chapter II: Review of Literature ………………………………………………………... 21
Meta-Analysis of Research on Algebra Teaching Methods……………………. 26
Selection Method and Criteria………………………………………………….. 27
Study Characteristics…………….……………………………………………... 31
Calculating Effect Sizes…..…………….………………………………………. 35
The Meaning of Effect Size…………………………………………………….. 36
Variations on Effect Size Calculations…..…………….……………………….. 37
Limitations of Meta-Analysis……….…..…………….………………………... 39
Analysis of Data and Results.……….…..…………….………………………... 45
Summary of Results for Each Category.……….…..….……………………….. 49
viii
Summary and Application of Meta-Analysis Results.……….…..….…………. 65
Multiple Regression Analysis………...……….…..…………….……………… 66
Teaching Methods and Educational Productivity………………………………. 69
Chapter III: Methodology………………………………………………………………... 70
Research Question………..…………………………………………………….. 70
Setting and Participants………..……………………………………………….. 71
Data Collection…..………..……………………………………………………. 72
Data Gathering and Management Procedures…………...………….………….. 72
Instrumentation Design………………………….…………...………….……… 74
Data Analysis and Reporting Results………………………….…………...…... 79
Methodology Summary………………………….…………...………….……... 80
Chapter IV: Results of the Study………………………………………………………… 81
Description of Participants………..……………………………………………. 82
Relationships Between Variables………..……………………………………... 85
Multiple Regression Analysis Results………..………………………………… 88
Summary of Results for Each Category………..………………………………. 91
Summary of Results……..………..…………………………………………….. 98
Chapter V: Summary and Conclusions………………………………………………….. 100
Summary of Results Addressing Research Questions………………………….. 101
Limitations and Cautions.………..……………………………………………... 104
Implications……….……..………..……………………………………………. 104
Recommendations for Practitioners……….……..………..……………………. 107
Suggestions for Future Studies……….……..………..………………………… 113
ix
Web Page-Based Survey………………………………………………………. 115
Reflections……….……..………..……………………………………………... 115
Conclusion.……….……..………..…………………………………………….. 117
References………..……………………………………………………………………… 118
Appendices………………………………………………………………………………. 131
A. Letter to Dr. Marcucci
B. Coding Sheet for Study Characteristics
C. Meta-Analysis: Number of Studies of Each Teaching Method Classified by Year, Source, and Design Quality
D. Meta-Analysis: Mean Sample Size, Weeks of Treatment, and Hours of Treatment of Each Teaching Method
E. Meta-Analysis: Effect Size of Each Teaching Method for All Studies
F. Meta-Analysis: Effect Size of Each Teaching Method for “Good” Studies
G. Meta-Analysis: Effect Size of Each Teaching Method Classified by Algebra Course for All Studies
H. Meta-Analysis: Effect Size of Each Teaching Method Classified by Algebra Course for “Good” Studies
I. Meta-Analysis: Effect Size of Each Teaching Method Classified by Ability Level for All Studies
J. Meta-Analysis: Effect Size of Each Teaching Method Classified by Ability Level for “Good Studies”
K. Meta-Analysis: Effect Size by Source for All Studies
L. Meta-Analysis: Effect Size by Source for “Good Studies”
M. Meta-Analysis: Effect Size by Novelty Effect for All Studies
N. Meta-Analysis: Effect Size by Novelty Effect for “Good” Studies
O. Meta-Analysis: Effect Size by Outcome Measure for All Studies
x
P. Meta-Analysis: Effect Size by Outcome Measure for “Good” Studies Q. Meta-Analysis: Correlation Between Effect Size and Study Characteristics for All Studies
R. Meta-Analysis: Correlation Between Effect Size and Study Characteristics for “Good” Studies
S. Letter to Dr. McCracken
T. Domains and Items from the Questionnaire for an Investigation of Instructional Practices for Algebra I (Prior to first content validity study)
U. Domains and Items from the Questionnaire for an Investigation of Instructional Practices for Algebra I (Prior to second content validity study)
V. Instrument for First Content Validation Study
W. Instrument for Second Content Validation Study
X. Selected Survey Items and Survey Design
Y. Content Validation of Survey Assessing the Teacher’s Use of Instructional Practices for Algebra I: Classification of Items into Domains by Experts, Jan. and Feb. 2001
Z. Content Validation of Survey Assessing the Teacher’s Use of Instructional Practices for Algebra I: Strength of Association and Clarity by Experts, Jan. and Feb. 2001
AA. IRB Exemption Approval
BB. Virginia Beach City Public School Approval for Reliability Study
CC. Permission Letter and Form Sent to Selected Region VII Superintendents
DD. Letter to Individual Teacher Requesting Participation
EE. Contents of Pre-Contact and Reminder Postcards for Teachers and Principals
FF. Contents of Follow-Up Postcard to Teachers
GG. Follow-Up Letter to Superintendents
HH. Mean Teaching Method Questionnaire Responses by Item
xi
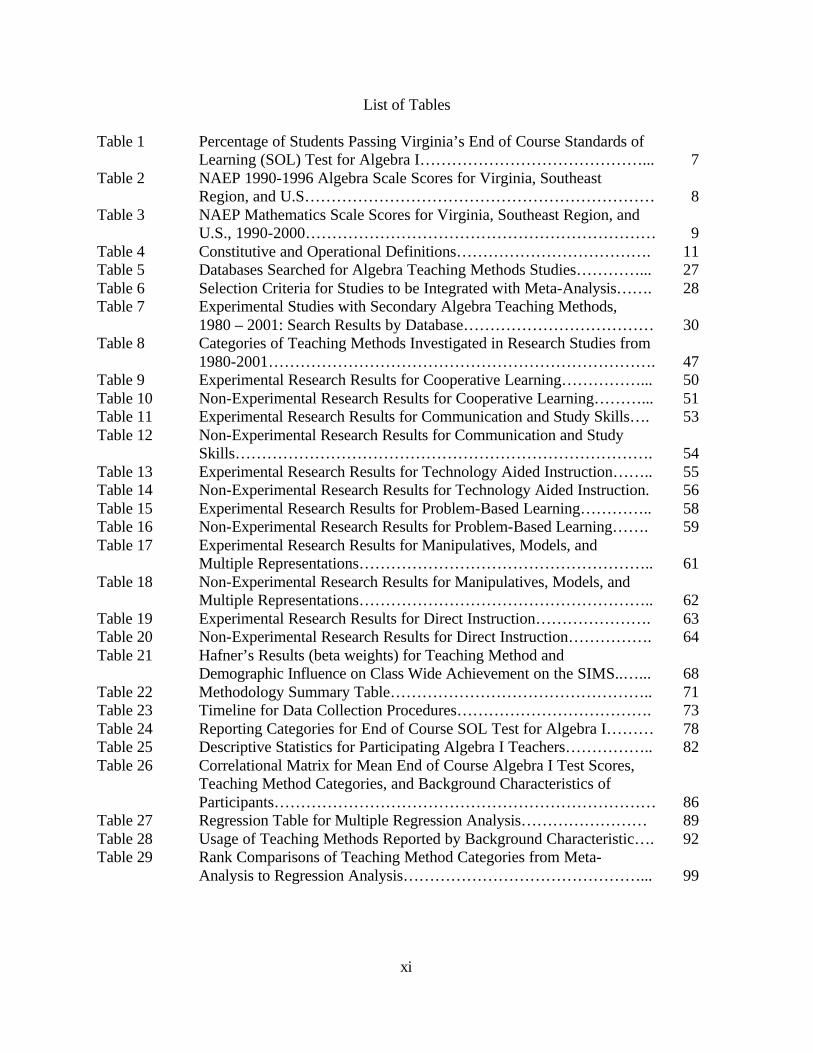
List of Tables
Table 1 Percentage of Students Passing Virginia’s End of Course Standards of Learning (SOL) Test for Algebra I……………………………………...
7
Table 2 NAEP 1990-1996 Algebra Scale Scores for Virginia, Southeast Region, and U.S…………………………………………………………
8
Table 3 NAEP Mathematics Scale Scores for Virginia, Southeast Region, and U.S., 1990-2000…………………………………………………………
9
Table 4 Constitutive and Operational Definitions………………………………. 11 Table 5 Databases Searched for Algebra Teaching Methods Studies…………... 27 Table 6 Selection Criteria for Studies to be Integrated with Meta-Analysis……. 28 Table 7 Experimental Studies with Secondary Algebra Teaching Methods,
1980 – 2001: Search Results by Database………………………………
30 Table 8 Categories of Teaching Methods Investigated in Research Studies from
1980-2001……………………………………………………………….
47 Table 9 Experimental Research Results for Cooperative Learning……………... 50 Table 10 Non-Experimental Research Results for Cooperative Learning………... 51 Table 11 Experimental Research Results for Communication and Study Skills…. 53 Table 12 Non-Experimental Research Results for Communication and Study
Skills…………………………………………………………………….
54 Table 13 Experimental Research Results for Technology Aided Instruction…….. 55 Table 14 Non-Experimental Research Results for Technology Aided Instruction. 56 Table 15 Experimental Research Results for Problem-Based Learning………….. 58 Table 16 Non-Experimental Research Results for Problem-Based Learning……. 59 Table 17 Experimental Research Results for Manipulatives, Models, and
Multiple Representations………………………………………………..
61 Table 18 Non-Experimental Research Results for Manipulatives, Models, and
Multiple Representations………………………………………………..
62 Table 19 Experimental Research Results for Direct Instruction…………………. 63 Table 20 Non-Experimental Research Results for Direct Instruction……………. 64 Table 21 Hafner’s Results (beta weights) for Teaching Method and
Demographic Influence on Class Wide Achievement on the SIMS..…...
68 Table 22 Methodology Summary Table………………………………………….. 71 Table 23 Timeline for Data Collection Procedures………………………………. 73 Table 24 Reporting Categories for End of Course SOL Test for Algebra I……… 78 Table 25 Descriptive Statistics for Participating Algebra I Teachers…………….. 82 Table 26 Correlational Matrix for Mean End of Course Algebra I Test Scores,
Teaching Method Categories, and Background Characteristics of Participants………………………………………………………………
86 Table 27 Regression Table for Multiple Regression Analysis…………………… 89 Table 28 Usage of Teaching Methods Reported by Background Characteristic…. 92 Table 29 Rank Comparisons of Teaching Method Categories from Meta-
Analysis to Regression Analysis………………………………………...
99
xii
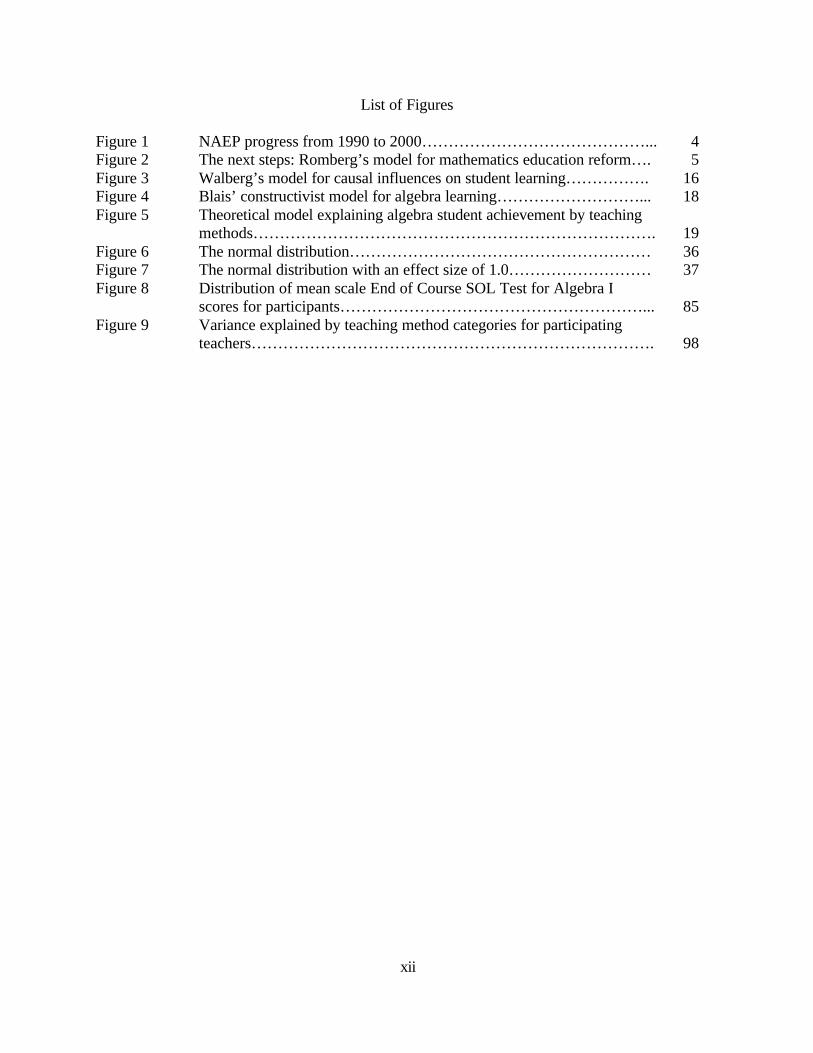
List of Figures
Figure 1 NAEP progress from 1990 to 2000……………………………………... 4 Figure 2 The next steps: Romberg’s model for mathematics education reform…. 5 Figure 3 Walberg’s model for causal influences on student learning……………. 16 Figure 4 Blais’ constructivist model for algebra learning………………………... 18 Figure 5 Theoretical model explaining algebra student achievement by teaching
methods………………………………………………………………….
19 Figure 6 The normal distribution………………………………………………… 36 Figure 7 The normal distribution with an effect size of 1.0……………………… 37 Figure 8 Distribution of mean scale End of Course SOL Test for Algebra I
scores for participants…………………………………………………...
85 Figure 9 Variance explained by teaching method categories for participating
teachers………………………………………………………………….
98

1
CHAPTER I THE PROBLEM AND ITS CONTEXT
“This intellectual Pearl Harbor, a real gutsy sock to the stomach.”
Allen Hyneck, Professor of Astronomy and Director of Dearborn Observatory, Northwestern University, April 27, 1986.
An International Context
On October 4, 1957, the Soviet Union successfully launched the Earth’s first artificial
satellite. As Americans sat transfixed by their radios, listening to the repeated pattern of beeps
emitted from Sputnik, they were caught off-guard. The public “feared that the Soviet’s ability to
launch satellites also translated into the capability to launch ballistic missiles that could carry
nuclear weapons from Europe to the U.S” (NASA, 2000, p. 2). The United States responded with
a satellite of its own on January 31, 1958, the Explorer. The first Explorer satellite aided
scientists in discovering the Van Allen radiation belts and was followed by a series of other
Explorer satellites used by the United States to investigate the solar system. In addition to the
Explorer Satellite Series, NASA was created in October 1958 by an act of Congress (NASA,
2000).
According to Alexander and Salmon (1995), another act of Congress, established in 1958
in direct response to Sputnik, forever changed the relationship of the federal government to
education. The National Defense Education Act, Public Law 85-864, approved large
expenditures to provide for instructional programs at all levels ranging from elementary school
through college in various areas including vocational training, foreign language instruction, and
improved equipment, facilities, and training in mathematics and science (U.S. Congress, 1958).
With this act the federal government infused money into the public schools with the intention of
surpassing the Soviet Union and other nations in mathematics and scientific achievement. Since
2
1958, the United States has surpassed other nations by conducting the first manned orbit of the
Earth and sending the first man to the moon.
Today, the Soviet Union no longer exists and “Space Race” is a term nostalgically
associated with the Kennedy administration. The United States leads the world economy, but
according to the National Center for Education Statistics (NCES), this leadership position is at
risk. In its 2000 findings from the Third International Mathematics and Science Study – Repeat
(TIMSS-R), NCES (2000) reported that U.S. eighth-graders continue to perform just below the
international average in mathematics when compared to the 23 nations participating in both the
1995 Third International Mathematics and Science Study (TIMSS) and the 1999 TIMSS-R
assessments, with no statistically significant changes in performance since 1995. According to
this study U.S. eighth-graders exceeded the international average in mathematics among the 38
nations participating in 1999. This positive news is coupled with the disappointing news that the
relative performance of the U.S. in mathematics was lower for eighth-graders in 1999 than it was
for the same cohort of fourth graders four years earlier in the 1995 TIMSS.
In the 1999 TIMSS-R, 14 nations had significantly higher scores in mathematics than the
U.S. average, including the Russian Federation. Further, only nine percent of U.S. students
reached the top 10% of all students assessed. This was a statistically insignificant increase from
six percent in 1995. Eight nations had significantly higher percentages of students reaching the
top 10%, including Japan. In the content area of algebra, 10 of the 38 nations assessed for the
TIMSS-R in 1999 had scores significantly higher than those of U.S. eighth-graders (NCES,
2000).
3
A National Context
In the No Child Left Behind Act of 2001, President Bush (2001) outlined the blueprint for
the U.S. educational system as the nation entered the twenty-first century. On January 8, 2002,
this Act was signed into law. Two components of the law are increased accountability for student
performance and a focus on scientifically based programs that show results. More specifically,
one goal cited in the blueprint is strengthening mathematics and science education; “K-12 math
and science education will be strengthened through math and science partnerships for states to
work with institutions of higher education to improve instruction and curriculum” (Bush, 2001,
p. 6).
The assessment used by the federal government is the National Assessment of
Educational Progress (NAEP). Since 1969, the federal government has used the NAEP for the
purposes of collecting, analyzing, and producing “valid and reliable information about the
academic performance of students in the United States in various learning areas” (Reese, Miller,
Mazzeo, & Dossey, (1997, p. 1). The 2000 NAEP assessment in mathematics constitutes the
fourth time mathematics has been assessed with the new framework developed in the 1990s,
enabling policy makers and educators to track mathematics achievement since the release of the
National Council of Teachers of Mathematics (NCTM) Curriculum and Evaluation Standards
for School Mathematics in 1989.
Major findings from the 2000 NAEP mathematics assessment show progress in the
mathematics performance by U.S. students when compared to the 1990 and 1992 assessments.
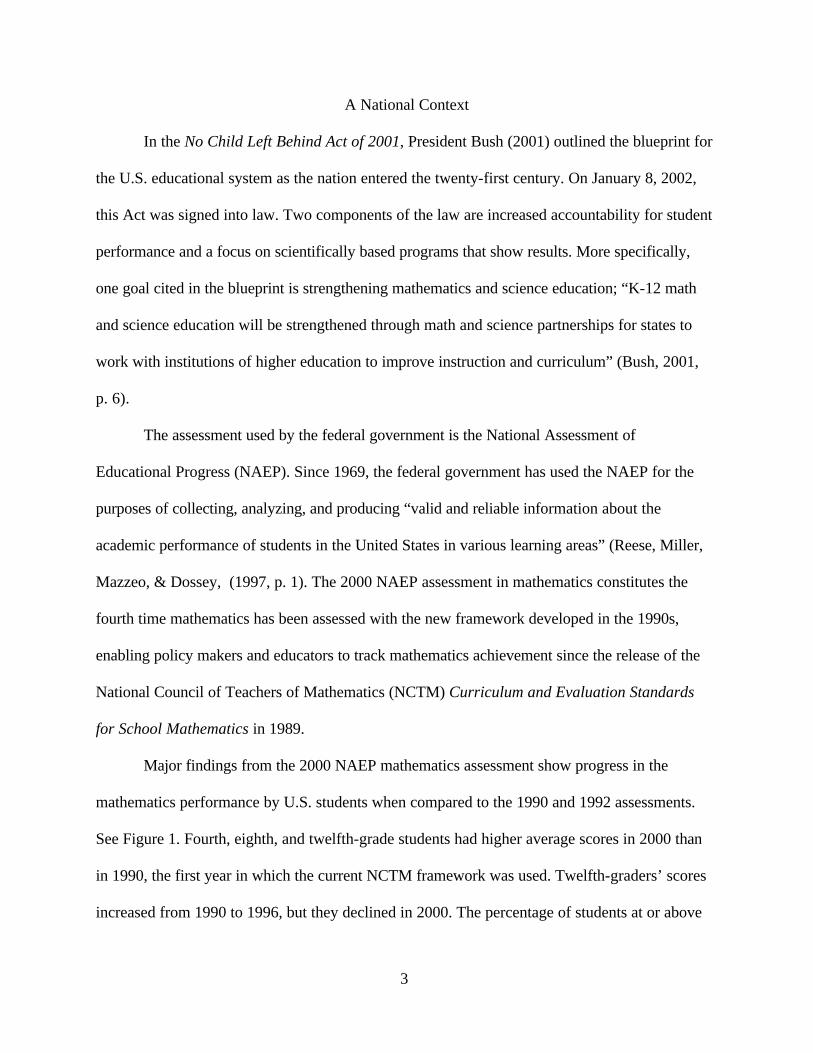
See Figure 1. Fourth, eighth, and twelfth-grade students had higher average scores in 2000 than
in 1990, the first year in which the current NCTM framework was used. Twelfth-graders’ scores
increased from 1990 to 1996, but they declined in 2000. The percentage of students at or above
4
the Proficient level increased for all three grades. Gains were made at the Advanced and Basic
levels as well, but from 1996 to 2000, the percentage of twelfth graders reaching the basic level
fell. Higher, middle and lower level students made gains since 1990 at each grade level, with the
exception of the twelfth grade, where a decline in the average score was shown in the scores of
students in the middle- and lower- performance ranges: the 50th, 25th, and 10th percentiles.
Note. From The Nation’s Report Card: Mathematics 2000, (p. 24), by J. S. Braswell, A.D. Lutkus, W.S. Grigg, S.L. Santapau, B. Tay-Lim, and M. Johnson, 2001, Washington, DC: U.S. Department of Education.
Figure 1. NAEP progress from 1990 to 2000.
*Significantly different from 2000. SOURCE: National Center for Education Statistics, National Assessment of Educational Progress (NAEP), 1990,1992,1996, and 2000 Mathematics Assessments
5
A State Context
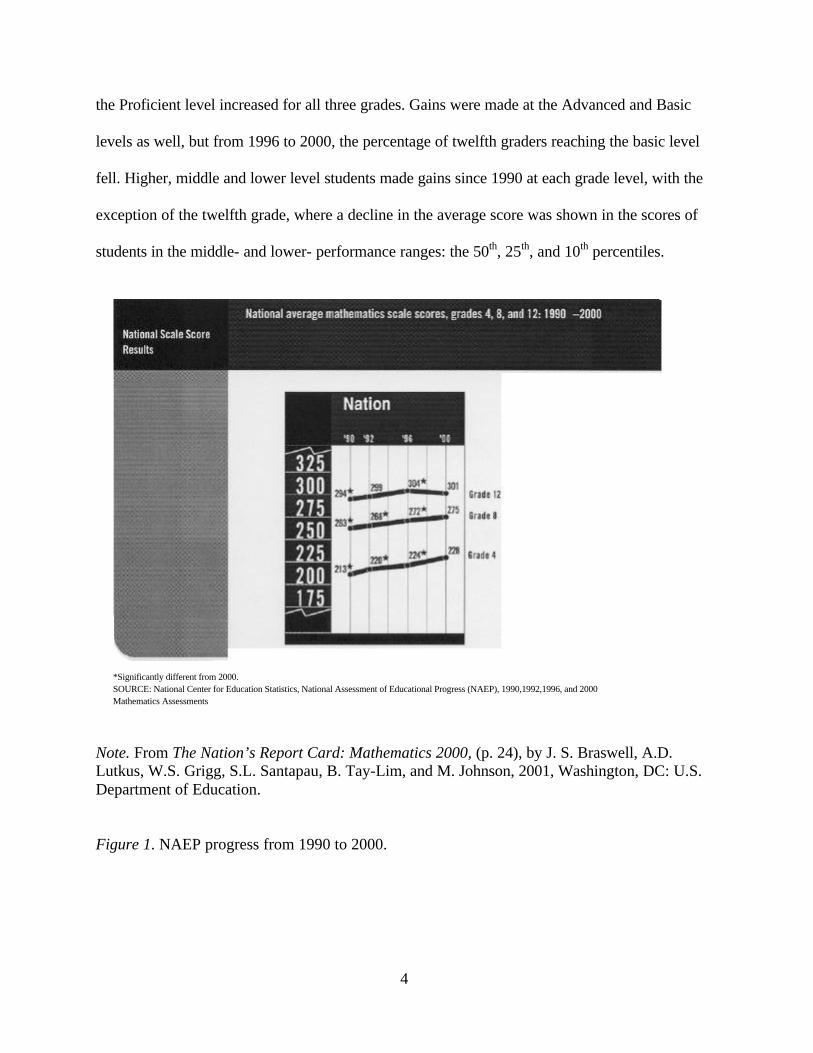
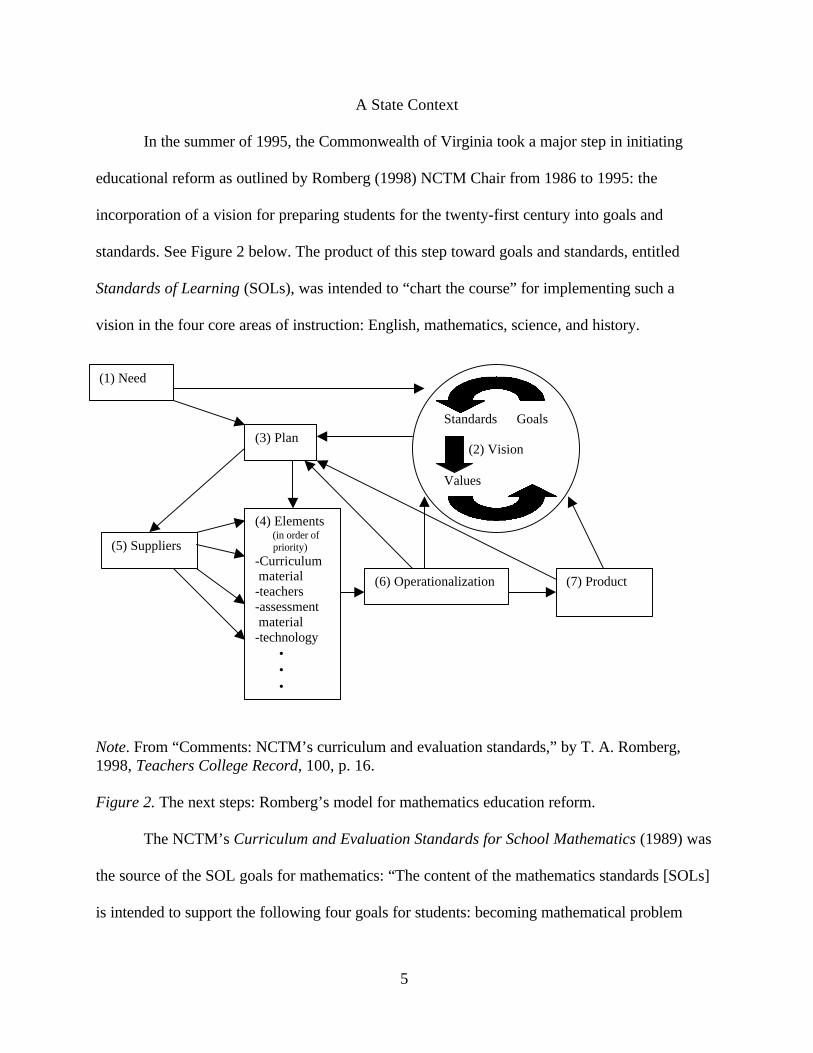
In the summer of 1995, the Commonwealth of Virginia took a major step in initiating
educational reform as outlined by Romberg (1998) NCTM Chair from 1986 to 1995: the
incorporation of a vision for preparing students for the twenty-first century into goals and
standards. See Figure 2 below. The product of this step toward goals and standards, entitled
Standards of Learning (SOLs), was intended to “chart the course” for implementing such a
vision in the four core areas of instruction: English, mathematics, science, and history.
Note. From “Comments: NCTM’s curriculum and evaluation standards,” by T. A. Romberg, 1998, Teachers College Record, 100, p. 16. Figure 2. The next steps: Romberg’s model for mathematics education reform.
The NCTM’s Curriculum and Evaluation Standards for School Mathematics (1989) was
the source of the SOL goals for mathematics: “The content of the mathematics standards [SOLs]
is intended to support the following four goals for students: becoming mathematical problem
(1) Need
Standards Goals (2) Vision Values
(3) Plan
(5) Suppliers
(4) Elements (in order of priority) -Curriculum material -teachers -assessment material -technology
• • •
(6) Operationalization (7) Product
6
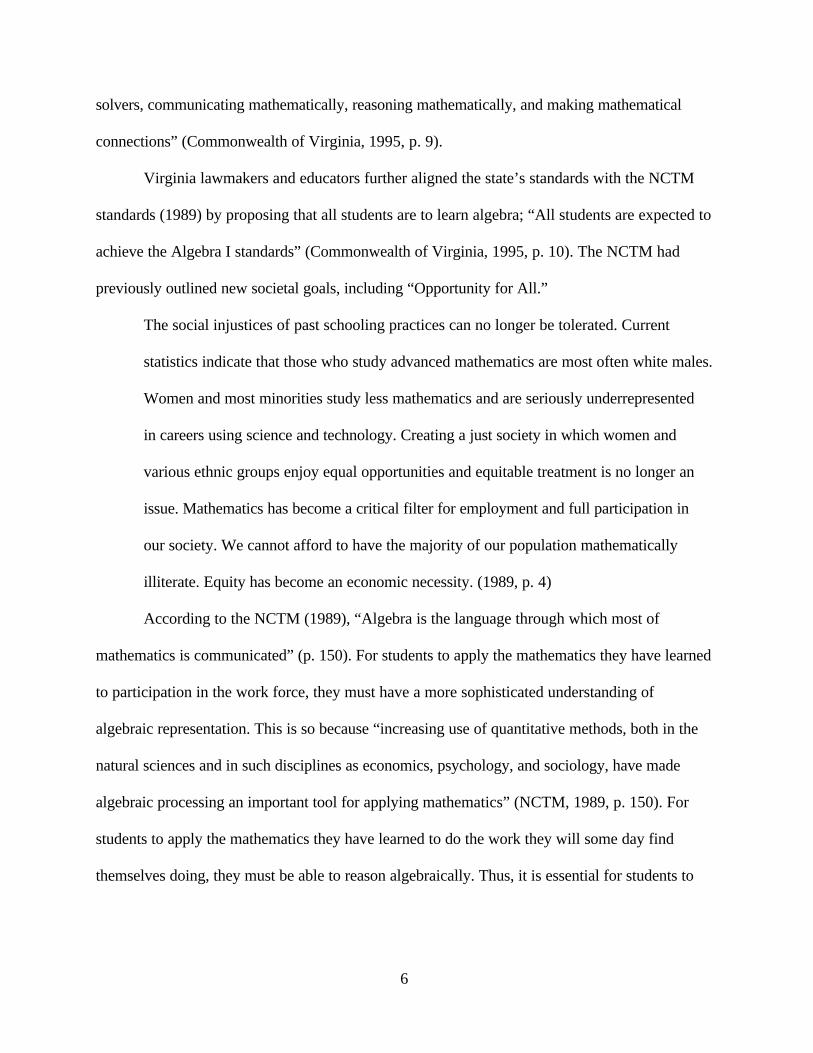
solvers, communicating mathematically, reasoning mathematically, and making mathematical
connections” (Commonwealth of Virginia, 1995, p. 9).
Virginia lawmakers and educators further aligned the state’s standards with the NCTM
standards (1989) by proposing that all students are to learn algebra; “All students are expected to
achieve the Algebra I standards” (Commonwealth of Virginia, 1995, p. 10). The NCTM had
previously outlined new societal goals, including “Opportunity for All.”
The social injustices of past schooling practices can no longer be tolerated. Current
statistics indicate that those who study advanced mathematics are most often white males.
Women and most minorities study less mathematics and are seriously underrepresented
in careers using science and technology. Creating a just society in which women and
various ethnic groups enjoy equal opportunities and equitable treatment is no longer an
issue. Mathematics has become a critical filter for employment and full participation in
our society. We cannot afford to have the majority of our population mathematically
illiterate. Equity has become an economic necessity. (1989, p. 4)
According to the NCTM (1989), “Algebra is the language through which most of
mathematics is communicated” (p. 150). For students to apply the mathematics they have learned
to participation in the work force, they must have a more sophisticated understanding of
algebraic representation. This is so because “increasing use of quantitative methods, both in the
natural sciences and in such disciplines as economics, psychology, and sociology, have made
algebraic processing an important tool for applying mathematics” (NCTM, 1989, p. 150). For
students to apply the mathematics they have learned to do the work they will some day find
themselves doing, they must be able to reason algebraically. Thus, it is essential for students to
7
master algebra. To this end, Virginia requires students to earn three credits in mathematics at or
above the level of algebra in order to receive a standard diploma (SOLs, 1995, p. 3).
According to Romberg’s (1998) model for implementing changes in a mathematics
curriculum, Virginia educators should be engaged in the ongoing process of planning and
developing the elements of curriculum change so that suppliers may provide for these elements
and so that operationalization of the plans can take place. As mathematics educators make
decisions regarding algebra curricula and teaching methods, they should examine indicators of
student achievement on standardized assessments aligned with the curriculum, such as the End of
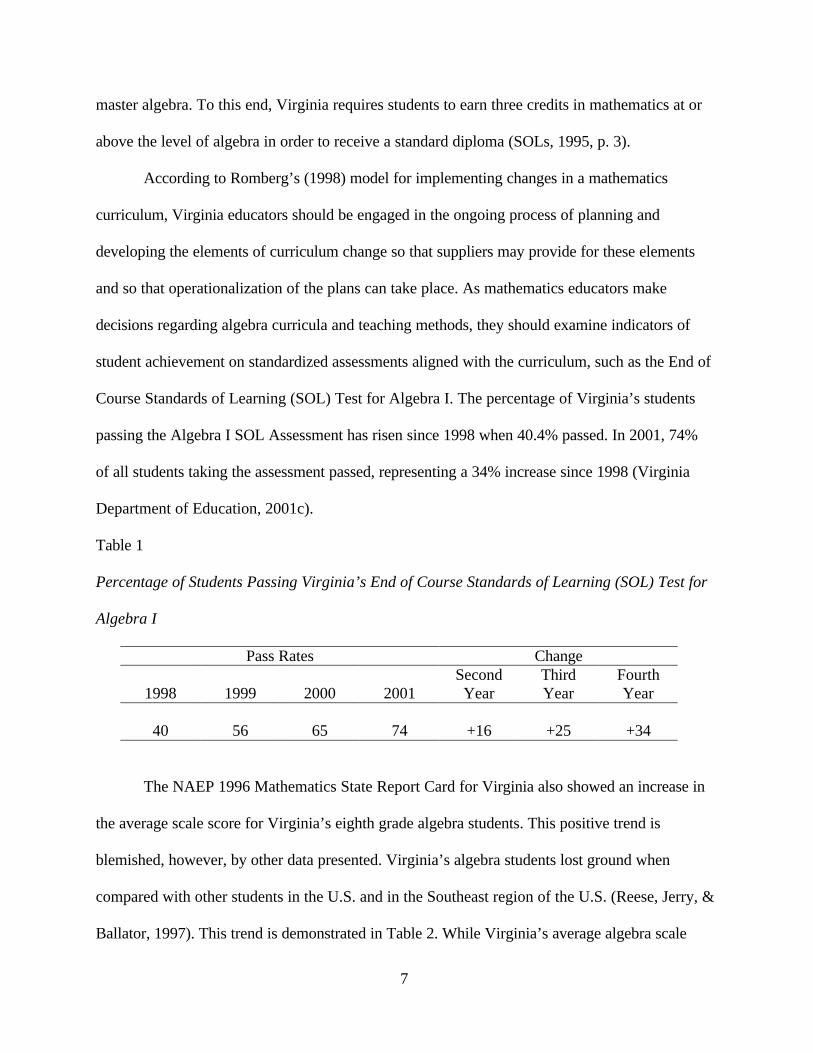
Course Standards of Learning (SOL) Test for Algebra I. The percentage of Virginia’s students
passing the Algebra I SOL Assessment has risen since 1998 when 40.4% passed. In 2001, 74%
of all students taking the assessment passed, representing a 34% increase since 1998 (Virginia
Department of Education, 2001c).
Table 1
Percentage of Students Passing Virginia’s End of Course Standards of Learning (SOL) Test for
Algebra I
Pass Rates Change
1998
1999
2000
2001 Second Year
Third Year
Fourth Year
40
56
65
74
+16
+25
+34
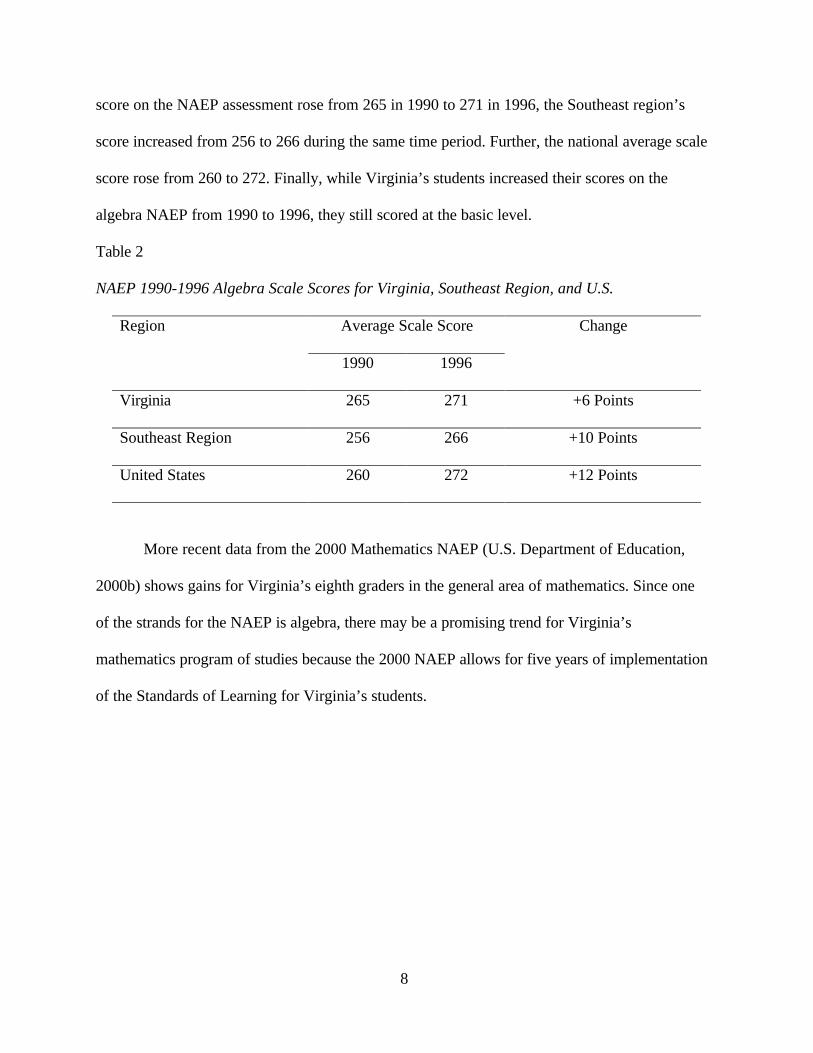
The NAEP 1996 Mathematics State Report Card for Virginia also showed an increase in
the average scale score for Virginia’s eighth grade algebra students. This positive trend is
blemished, however, by other data presented. Virginia’s algebra students lost ground when
compared with other students in the U.S. and in the Southeast region of the U.S. (Reese, Jerry, &
Ballator, 1997). This trend is demonstrated in Table 2. While Virginia’s average algebra scale
8
score on the NAEP assessment rose from 265 in 1990 to 271 in 1996, the Southeast region’s
score increased from 256 to 266 during the same time period. Further, the national average scale
score rose from 260 to 272. Finally, while Virginia’s students increased their scores on the
algebra NAEP from 1990 to 1996, they still scored at the basic level.
Table 2
NAEP 1990-1996 Algebra Scale Scores for Virginia, Southeast Region, and U.S.
Region Average Scale Score Change
1990 1996
Virginia 265 271 +6 Points
Southeast Region 256 266 +10 Points
United States 260 272 +12 Points
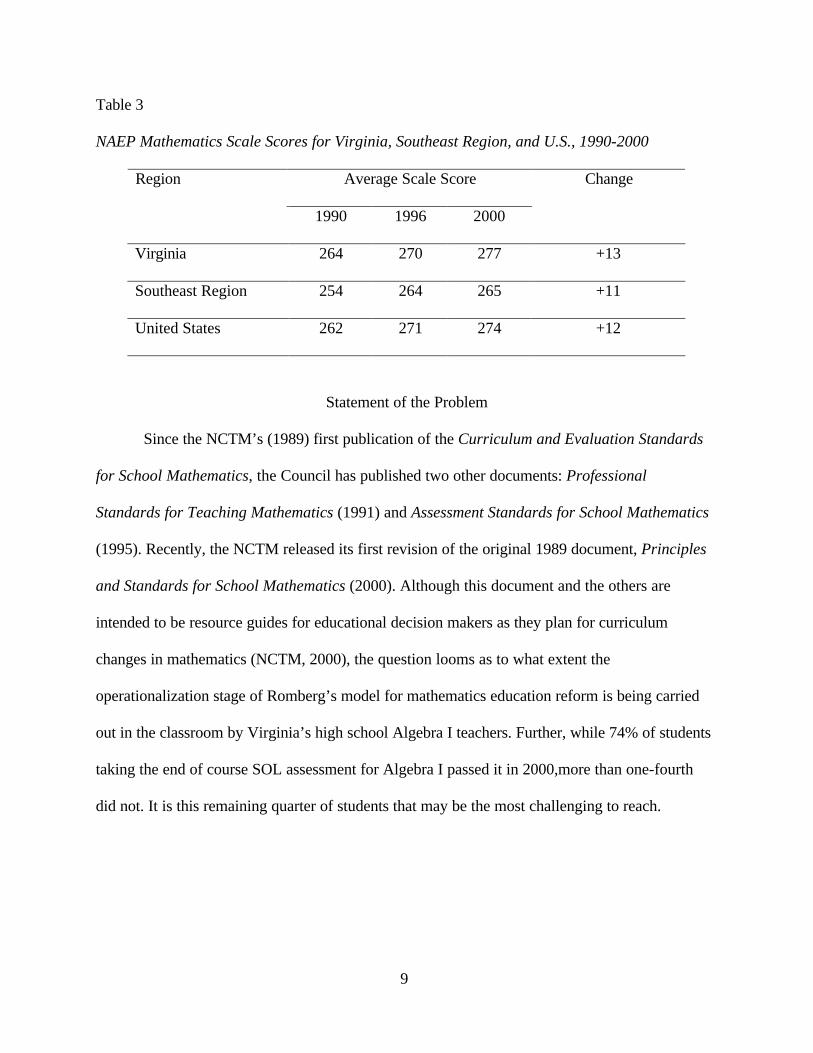
More recent data from the 2000 Mathematics NAEP (U.S. Department of Education,
2000b) shows gains for Virginia’s eighth graders in the general area of mathematics. Since one
of the strands for the NAEP is algebra, there may be a promising trend for Virginia’s
mathematics program of studies because the 2000 NAEP allows for five years of implementation
of the Standards of Learning for Virginia’s students.
9
Table 3
NAEP Mathematics Scale Scores for Virginia, Southeast Region, and U.S., 1990-2000
Region Average Scale Score Change
1990 1996 2000
Virginia 264 270 277 +13
Southeast Region 254 264 265 +11
United States 262 271 274 +12
Statement of the Problem
Since the NCTM’s (1989) first publication of the Curriculum and Evaluation Standards
for School Mathematics, the Council has published two other documents: Professional
Standards for Teaching Mathematics (1991) and Assessment Standards for School Mathematics
(1995). Recently, the NCTM released its first revision of the original 1989 document, Principles
and Standards for School Mathematics (2000). Although this document and the others are
intended to be resource guides for educational decision makers as they plan for curriculum
changes in mathematics (NCTM, 2000), the question looms as to what extent the
operationalization stage of Romberg’s model for mathematics education reform is being carried
out in the classroom by Virginia’s high school Algebra I teachers. Further, while 74% of students
taking the end of course SOL assessment for Algebra I passed it in 2000,more than one-fourth
did not. It is this remaining quarter of students that may be the most challenging to reach.
10
Research Purpose
The major purpose of the current study is to investigate the influence of teaching
methodology on student achievement on the SOL assessment for Algebra I. The
operationalization stage for mathematics education reform leads into an output stage. Currently,
the “output” measure for Virginia’s Algebra I teachers is the End of Course SOL Test for
Algebra I. Thus, it is important to determine the effectiveness of research-based teaching
methods using this output measurement. The NCTM and the Commonwealth of Virginia have
set standards for algebra instruction. To paraphrase Wagner and Kieran (1989), it is timely to
examine teaching methods within the context of these standards in order to make applicable
recommendations to classroom teachers to improve children’s learning of algebra.
Research Questions
For the review of literature, Marcucci’s (1980) meta-analysis of experimental research on
teaching methods for mathematics problem solving has been replicated with the goal of updating
his research to synthesize research findings from 1980 to 2001 on methods for teaching algebra
knowledge and skills at the secondary school level. Pertinent research studies have been
categorized according to the teaching method investigated, and the mean effect size for studies in
each category is used to compare teaching method types. Thus, the central question addressed
will be similar to that found in Marcucci’s dissertation: Based upon available research evidence,
which type of teaching methodologies appear to be the most effective in teaching algebra
knowledge and skills to students at the secondary school level? Related to this question is an
examination of the influence of study characteristics on the results of the studies included in the
meta-analysis.
11
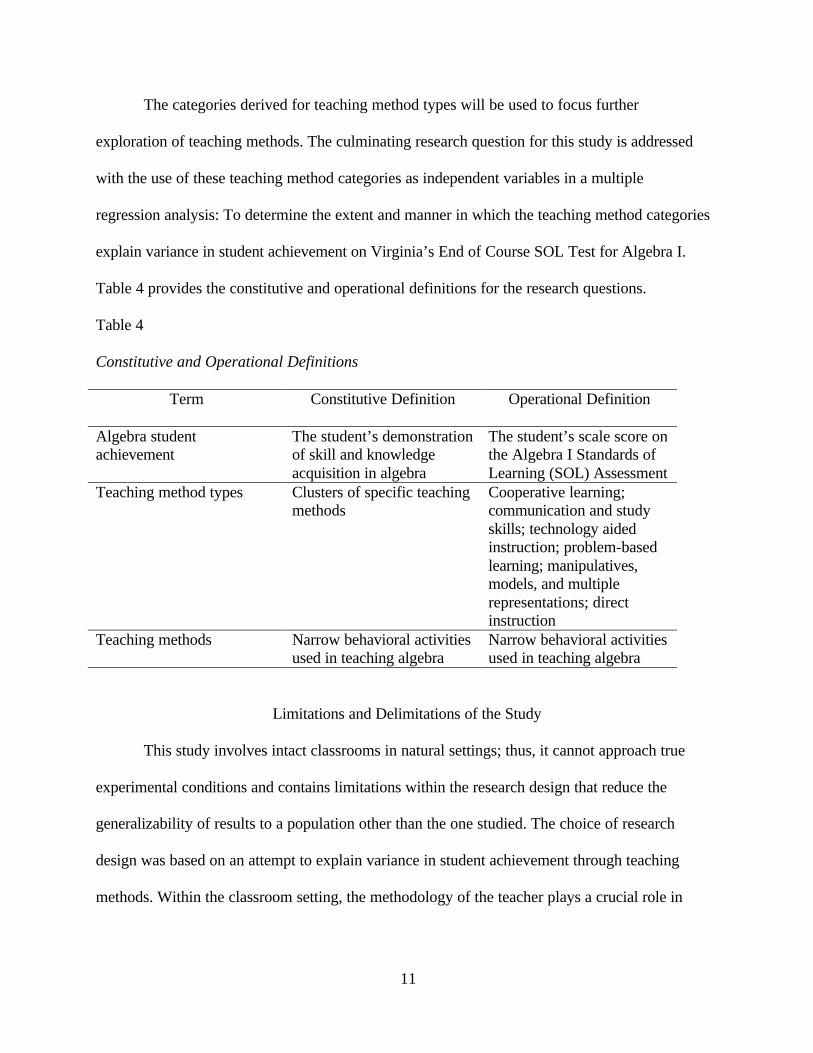
The categories derived for teaching method types will be used to focus further
exploration of teaching methods. The culminating research question for this study is addressed
with the use of these teaching method categories as independent variables in a multiple
regression analysis: To determine the extent and manner in which the teaching method categories
explain variance in student achievement on Virginia’s End of Course SOL Test for Algebra I.
Table 4 provides the constitutive and operational definitions for the research questions.
Table 4
Constitutive and Operational Definitions
Term Constitutive Definition Operational Definition
Algebra student achievement
The student’s demonstration of skill and knowledge acquisition in algebra
The student’s scale score on the Algebra I Standards of Learning (SOL) Assessment
Teaching method types Clusters of specific teaching methods
Cooperative learning; communication and study skills; technology aided instruction; problem-based learning; manipulatives, models, and multiple representations; direct instruction
Teaching methods Narrow behavioral activities used in teaching algebra
Narrow behavioral activities used in teaching algebra
Limitations and Delimitations of the Study
This study involves intact classrooms in natural settings; thus, it cannot approach true
experimental conditions and contains limitations within the research design that reduce the
generalizability of results to a population other than the one studied. The choice of research
design was based on an attempt to explain variance in student achievement through teaching
methods. Within the classroom setting, the methodology of the teacher plays a crucial role in
12
student achievement; however, as Walberg (1984) explains, there are many other factors that
affect student achievement that are beyond the control of the teacher and the researcher.
Factors such as students’ grade level and prior ability level in mathematics may be
intervening variables that affect the external validity of this study. Marcucci (1980) classified
effect sizes for teaching methods for mathematics problem solving (one component of learning
algebra) by student grade level and ability level. Each teaching method produced varied effects,
depending on the grade level and prior ability level of the students. For example, the heuristic
method, a “method stressing the teaching of general problem solving skills, such as drawing a
diagram or simplifying a problem using smaller numbers, so that the subject develops a
repertoire of problem solving strategies,” (p. 24) produced a mean effect size of 0.35 (n = 21) for
elementary students and –0.02 (n = 16) for secondary students. The same teaching method
produced a mean effect size of 0.18 (n = 7) for low ability students, a mean effect size of 0.06 (n
= 3) for middle ability students, and 0.05 (n = 5) for high ability students.
Teacher effects on students go beyond and can interact with teaching methods to
influence student learning. These effects may include the teachers’ knowledge of and experience
with teaching Algebra I in Virginia, coverage of curriculum as it is assessed on the end of course
test, rapport between the teacher and student, and classroom management practices. Any of these
teacher effects can interact with teaching methods to enhance or detract from student
achievement, and in addition, the results of this study. The NCTM (2000) states
Teachers need several different kinds of mathematical knowledge – knowledge about the
whole domain; deep, flexible knowledge about curriculum goals and about the important
ideas that are central to their grade level; knowledge about the challenges students are
likely to encounter in learning these ideas; knowledge about how ideas can be
13
represented to teach them effectively; and knowledge about how students’ understanding
can be assessed. (p. 17)
This type of knowledge may be largely dependent on the teacher’s experience with a particular
curriculum and subject area. Marzano, Pickering, and Pollack (2001) warn that focusing only on
instructional strategies leaves out other components of teaching that affect student achievement,
suggesting that “effective pedagogy involves three related areas: (1) the instructional strategies
used by the teacher, (2) the management techniques used by the teacher, and (3) the curriculum
designed by the teacher” (p. 10).
Another limitation for this study is the use of multiple school districts and schools for its
setting. Virginia developed the Standards of Learning (1995) to prompt curricular changes
throughout the state. Teachers have access to a standard scope and sequence for Algebra I
instruction provided by the Virginia Department of Education (2001b). The Department of
Education (2002) has also recently provided a curriculum framework for algebra and other
mathematics instruction. While these documents are provided to standardize instruction and
provide guidance to mathematics teachers, school districts may approach the challenge of
implementing the state curriculum with differing curricula and textbooks. These aspects of
instruction may play a large role in student achievement in conjunction with teaching methods,
as suggested above by Marzano, Pickering, and Pollock (2001); yet, they are unaccounted for in
this study.
Certain restrictions, such as choice of instrumentation, are intentionally entered into the
research design. These parameters are referred to as delimitations and also serve as threats to
external validity in the case of this study. The choice of Algebra I as the subject area falls into
this category. The decision to use Algebra I as a delimitation within this design was based on the
14
fact that Algebra I is the one secondary level mathematics course that all Virginia students must
pass to graduate (Commonwealth of Virginia, 1995). The Virginia Algebra I SOL assessment
was chosen because it is the sole measurement used to determine whether a student receives a
verified credit toward graduation for Algebra I, if the student earns a passing grade in the course.
The choice to use a researcher-developed questionnaire is another delimitation for this
study. The questionnaire was developed based on categories from a quantitative review of
literature followed by content validation by experts. The quantitative review of literature has
many limitations and delimitations as discussed in Chapter II. Choices regarding the definition
for each category and the placement of teaching methods under each category were this
researcher’s responsibility. The questionnaire is a self-report instrument with items based on the
results of the meta-analysis in Chapter II, thus it may be considered subjective in nature,
although every effort was made to make each item a forced choice. Further, the response window
for the questionnaire was immediately prior to the spring administration of the SOL tests for
2002. This time period was chosen because teachers may emphasize different teaching methods
before and after the testing window.
Finally, only one region of Virginia was selected as the population for this study, and
seven of its nineteen school districts were selected within the region. The systematic sampling
procedure is described in Chapter III. This was done in order to add credibility to the process by
having it known to participants that this researcher lives and works in the region. Teachers may
have found it imposing and perhaps intimidating to participate in this study; this researcher tried
to alleviate these feelings by working with a small sample to build positive relations with
superintendents and principals before moving forward. This choice of one region does impact the
15
study’s generalizability to other populations in the Commonwealth, as each region is unique in
terms of geography and demographics.
A Theory of Educational Productivity
Walberg (1984), following the tenets of research in agriculture, engineering, and
medicine, proposed abandoning early research practices where the relation of a single cause and
effect are studied. His premise is that we should begin to view the educational process in terms
of its power to produce outcomes. Many American industries have increased the value of their
output through experimentation and statistical studies; educational leadership should use the
same approach. While cost is inevitably a factor, it is not a factor until after the effectiveness of
an approach is tested exhaustively to see if it has an effect on the productivity of schools. Thus,
those who argue that costs should be considered first in light of dwindling financing for
education are arguing counterproductively. This type of thinking, according to Walberg, leads to
attempts at quick fixes based on fads that lead to greater costs and loss of productivity in the long
run.
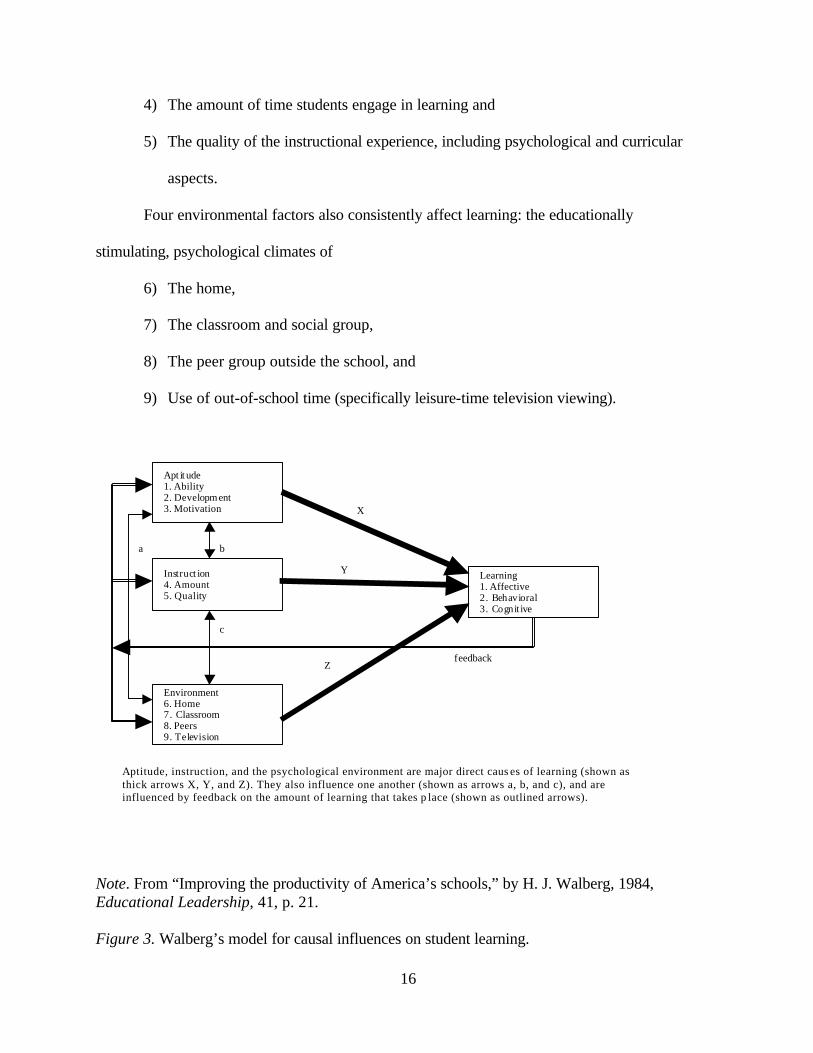
After synthesizing an expansive body of research, Walberg determined nine factors that
“require optimization to increase affective, behavioral, and cognitive learning” (1984, p. 20). See
Figure 3. Walberg states that these “potent, consistent, and widely generalizable” factors fall into
three groups: student aptitude, instruction, and environment. Student aptitude includes:
1) Ability or prior achievement, as measured by the usual standardized tests,
2) Development, as indexed by chronological age or stage of maturation, and
3) Motivation, or self-concept, as indicated by personality tests or the student’s
willingness to persevere intensively on learning tasks.
Instruction includes:
16
4) The amount of time students engage in learning and
5) The quality of the instructional experience, including psychological and curricular
aspects.
Four environmental factors also consistently affect learning: the educationally
stimulating, psychological climates of
6) The home,
7) The classroom and social group,
8) The peer group outside the school, and
9) Use of out-of-school time (specifically leisure-time television viewing).
Apt it ude 1. Ability 2. Developm ent 3. Motivation
Instruct ion 4. Amount 5. Quality
Environment 6. Home 7. Classroom 8. Peers 9. Television
Learning 1. Affective 2. Behavioral 3. Cognit ive
b
c
a
Z
X
Y
feedback
Aptitude, instruction, and the psychological environment are major direct caus es of learning (shown as thick arrows X, Y, and Z). They also influence one another (shown as arrows a, b, and c), and are influenced by feedback on the amount of learning that takes p lace (shown as outlined arrows).
Note. From “Improving the productivity of America’s schools,” by H. J. Walberg, 1984, Educational Leadership, 41, p. 21. Figure 3. Walberg’s model for causal influences on student learning.

17
Walberg states that the first five factors are well known in several educational models.
Each of these factors appears necessary for learning in school. None can be readily ignored. For
example, large amounts of unsuitable instruction will cause students to learn very little. While
these five factors are important, they are only moderately alterable by educational leadership,
since curricula and time allotments spent on various subjects and activities are partly determined
by many and diverse economic, political, and social forces.
Educational leaders must acknowledge the fact that they cannot raise student
achievement by their efforts alone. Environmental factors have a strong influence on student
achievement. Further, we must not assume that all influences on student learning outside school
are working counter to school goals. Walberg states that even television viewing time, when kept
to 10 hours, as opposed to the typical 30 hours per week, can enhance student learning in school.
It is necessary to place school factors and environmental factors in their proper perspectives. One
way to do so, as proposed by Walberg, is according to time. One hundred and eighty days of
school for thirteen years of a person’s life accounts for roughly 13% of his time between birth
and age 18. Thus, factors outside the control of school may dominate the individual’s
development.
One hundred and thirty-five hours of algebra instruction constitutes less than six percent
of a student’s waking hours during a single school year. Rather than looking at this fact and
deciding that there is little the school or teacher can do to affect student achievement in light of
the remaining 94% of the time spent away from algebra, the educational leader must concentrate
on improving the quality of instruction the student is receiving. This is the only factor within the
realm of the principal’s and teacher’s direct control. Even researchers who propose that students
“construct” their own knowledge in algebra, label education as the single process that shapes the
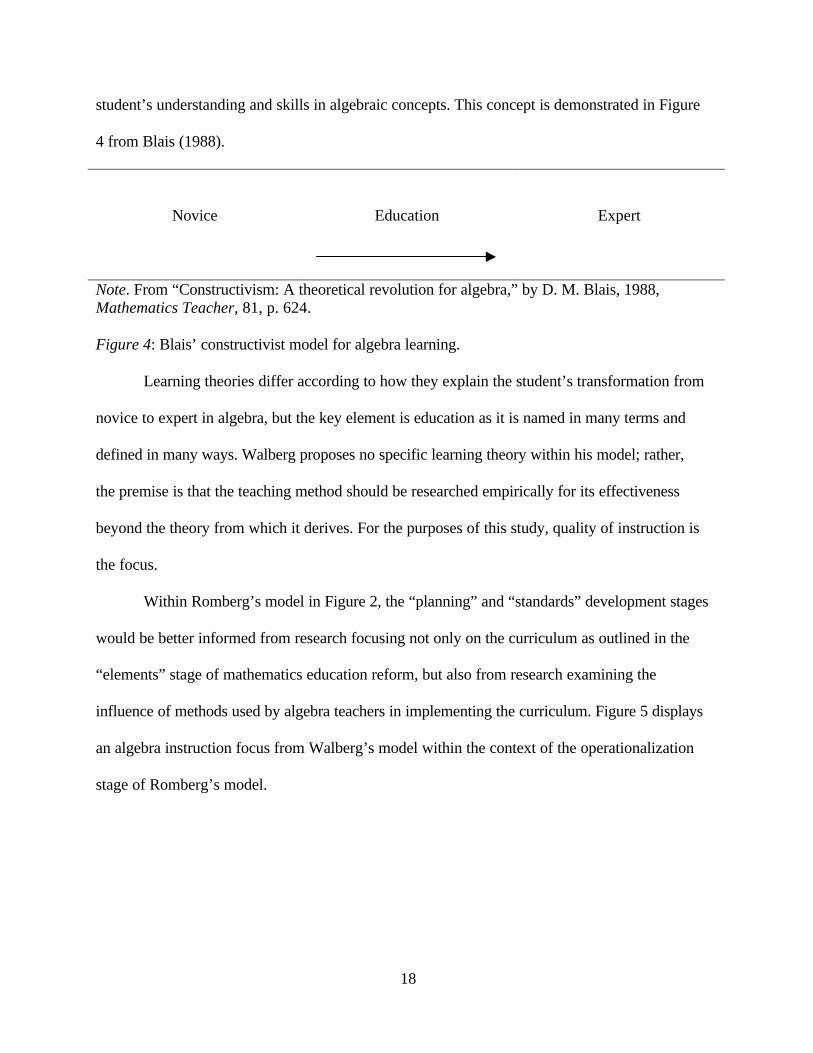
18
student’s understanding and skills in algebraic concepts. This concept is demonstrated in Figure
4 from Blais (1988).
Novice
Education
Expert
Note. From “Constructivism: A theoretical revolution for algebra,” by D. M. Blais, 1988, Mathematics Teacher, 81, p. 624. Figure 4: Blais’ constructivist model for algebra learning.
Learning theories differ according to how they explain the student’s transformation from
novice to expert in algebra, but the key element is education as it is named in many terms and
defined in many ways. Walberg proposes no specific learning theory within his model; rather,
the premise is that the teaching method should be researched empirically for its effectiveness
beyond the theory from which it derives. For the purposes of this study, quality of instruction is
the focus.
Within Romberg’s model in Figure 2, the “planning” and “standards” development stages
would be better informed from research focusing not only on the curriculum as outlined in the
“elements” stage of mathematics education reform, but also from research examining the
influence of methods used by algebra teachers in implementing the curriculum. Figure 5 displays
an algebra instruction focus from Walberg’s model within the context of the operationalization
stage of Romberg’s model.
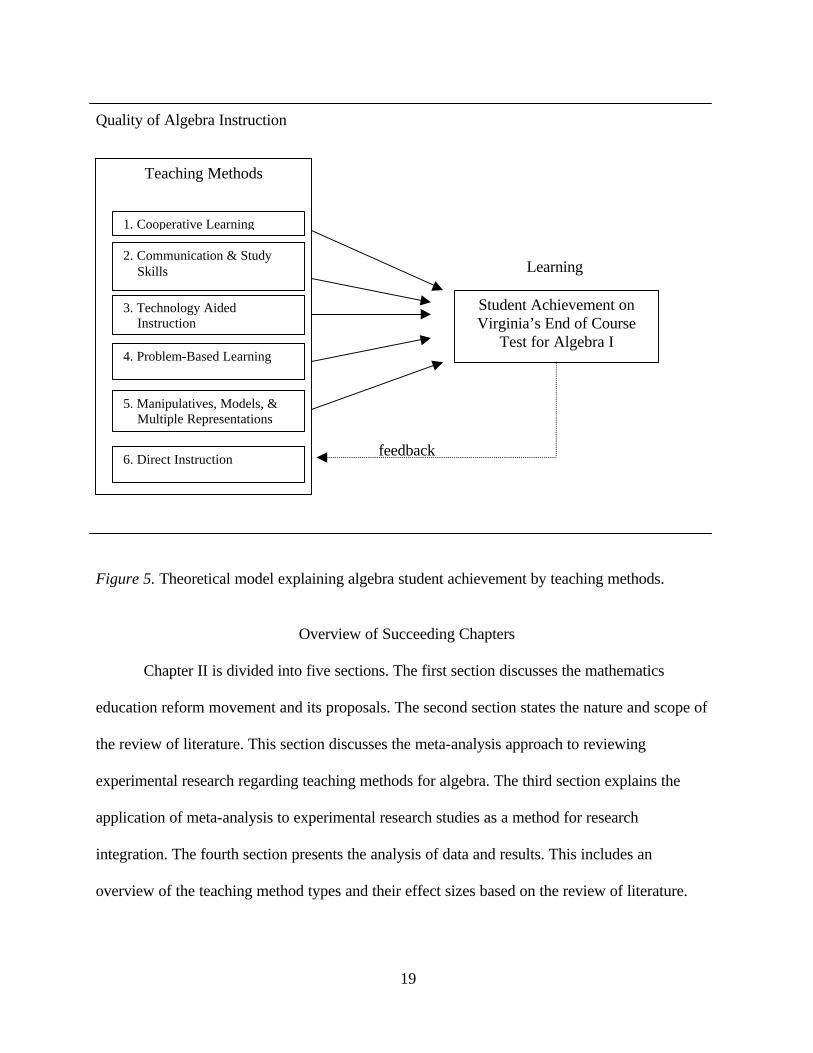
19
Quality of Algebra Instruction
Learning
feedback
Figure 5. Theoretical model explaining algebra student achievement by teaching methods.
Overview of Succeeding Chapters
Chapter II is divided into five sections. The first section discusses the mathematics
education reform movement and its proposals. The second section states the nature and scope of
the review of literature. This section discusses the meta-analysis approach to reviewing
experimental research regarding teaching methods for algebra. The third section explains the
application of meta-analysis to experimental research studies as a method for research
integration. The fourth section presents the analysis of data and results. This includes an
overview of the teaching method types and their effect sizes based on the review of literature.
Teaching Methods
1. Cooperative Learning
2. Communication & Study Skills
3. Technology Aided Instruction
4. Problem-Based Learning
5. Manipulatives, Models, & Multiple Representations
Student Achievement on Virginia’s End of Course
Test for Algebra I
6. Direct Instruction

20
Section five outlines the use of multiple regression analysis to apply results from the quantitative
review of literature to Virginia’s current assessment for Algebra I achievement.
Chapter III includes a detailed account of the methodology used in the culminating
investigation, including the setting and population, the research design, data collection,
instrumentation, and analysis techniques. Chapter IV presents the analysis of data and results in
four sections. First, there is a description of the sample of participants. Next, a correlation matrix
is provided to display relationships between variables. A table and equation describing the results
of the regression analysis present the relationship between teacher usage of each teaching
method category and the mean scale score on the End of Course SOL Test for Algebra I. This is
followed by a summary of findings for each teaching method category.
Chapter V contains a summary of the findings and a discussion. In the context of this
discussion, both the limitations and implications of the research results are communicated. This
information is followed by recommendations for practitioners, suggestions for future studies,
final reflections, and a conclusion.
21
CHAPTER II REVIEW OF LITERATURE
“Perhaps I could best describe my experience of doing mathematics in terms of entering a dark mansion. You go into the first room and it’s dark, completely dark. You stumble around, bumping into furniture. Gradually, you learn where each piece of furniture is. And finally, after six months or so, you find the light switch and turn it on. Suddenly, it’s all illuminated and you can see exactly where you were. Then you enter the next dark room…”
Professor Andrew Wiles (Aczel, 1996, p. xi)
According to Romberg (1992), reform efforts in the U.S. education system, including the
National Council of Teachers of Math (NCTM) Curriculum and Evaluation Standards for
School Mathematics (1989), are a response to criticisms of contemporary education practices.
The most potent of these criticisms is found in the National Commission on Excellence in
Education’s (NCEE) 1983 report entitled A Nation at Risk. The report presented the status of the
United States as a nation in competition with the world’s other leading nations, stating that our
educational system was failing to prepare young people to take leadership in this competition.
Further, as a nation, we would never allow a foreign invader to force an educational system like
ours on our children. “We have even squandered the gains in student achievement made in the
wake of the Sputnik challenge” (1983, p. 5).
In A Nation at Risk, the NCEE made several recommendations for improving our nation’s
educational system, among them was a recommendation to strengthen state and local high school
graduation requirements. To implement this recommendation, the following illustration was
provided:
The teaching of mathematics in high school should equip graduates to: (a) understand
geometric and algebraic concepts; (b) understand elementary probability and statistics;
(c) apply mathematics in everyday situations; and (d) estimate, approximate, measure,
and test the accuracy of their calculations. In addition to the traditional sequence of
22
studies available for college-bound students, new, equally demanding mathematics
curricula need to be developed for those who do not plan to continue their formal
education immediately. (p. 25)
Responding to A Nation at Risk and reports like it, Berliner and Biddle (1995) discussed
the “interpretive spin” that is placed on NAEP scores by critics to reinforce their claims that U.S.
schools are failing. In A Manufactured Crisis the authors stated that the NAEP program is an
excellent source of data regarding student performance in mathematics. NAEP scores for the
1970s and 1980s, however, do not support the “mythic decline of American student
achievement;” rather, the scores show very little variation over this time period. Berliner and
Biddle suggest that American students are learning as much mathematics, science, and reading as
did their parents. “[E]vidence from the NAEP also does not confirm the myth of a recent decline
in American student achievement. Instead, it indicates a general pattern of stable achievement
combined with modest growth in achievement among students from minority groups and from
‘less advantaged’ backgrounds” (1995, p. 27).
Berliner and Biddle furthered their argument by describing the NAEP test as one that
measures two extremes of student achievement: basic and advanced. A continuum of questions
ranging from easy to difficult distinguishes those students who are advanced from those who are
not. If the majority of students scores in the middle and is found to be average, it is because the
test is designed so that average students will have an average score. Finally, the authors argued
against reformers who claim that while stable achievement over 20 years on the NAEP shows
that students are achieving as well as ever in mathematics, it is not good enough to prepare them
for the twenty-first century. While reformers have claimed that the jobs of tomorrow will require
high-level skills, economists predict that the employment sectors most likely to grow in the near
23
future are those in the service industry, hospitality, and retail sales. “So if schools do not prepare
everyone to perform high-level mathematics, perhaps it is because students and their teachers are
responding sensibly to the looming job market” (p. 28).
Romberg (1992) maintained that recommendations made by the NCEE are appropriate,
because they are the result of future needs expressed by business and industry, not merely
criticisms of what has happened in the past. Our society has transformed from an industrial to an
information based society; yet, until recent reform movements, including the first publication of
the NCTM’s Curriculum and Evaluation Standards for School Mathematics (1989), state and
local school systems’ mathematical curricula reflected the needs of an industrial society.
According to Romberg, we must attempt to visualize the important features of our society as it
will be in the future, “if we are to adequately prepare today’s children for meeting its challenge”
(p. 428). Moreover, U.S. educational leaders can no longer subscribe to the notion that higher-
level mathematics is to be reserved for a small number of intellectual elite, as the majority of
society learns enough mathematics to sustain itself while functioning as production workers.
To change schools so that students graduate prepared for the twenty-first century,
Romberg argues that educators must change the epistemology of mathematics in schools, or “ the
sense on the part of the teachers and students of what the mathematical enterprise is all about”
(1992, p. 431). Romberg stated that the NCTM’s 1989 Curriculum and Evaluation Standards
were developed under the premise that “all students need to learn more, and different,
mathematics, and instruction in mathematics must be significantly revised” (NCTM, 1989, p. 1.).
He elaborates on this statement with five key notions:
24
1. Teaching mathematics to “all students” emphasizes the fact that all students need to be
mathematically literate if they are to be productive citizens in the twenty-first century. In
particular, this includes underrepresented groups, not just “talented, white males.”
2. “More mathematics” implies that all students need to learn more than how to manipulate
arithmetic routines. At present, nearly half of U.S. students never study mathematics
beyond arithmetic.
3. “Often different mathematics” refers to the fact that the mathematics all students need to
learn includes concepts from algebra, geometry, trigonometry, statistics, probability,
discrete mathematics, and even calculus.
4. “To learn” means more than to be shown or to memorize and repeat. Learning involves
investigating, formulating, representing, reasoning, and using strategies to solve
problems, and then reflecting on how mathematics is being used.
5. “Revised” instruction implies that classrooms must become discourse communities where
conjectures are made, arguments presented, strategies discussed, and so forth. (Romberg,
1998, p. 9)
Romberg (1998) explained that in most of today’s mathematics classrooms, instruction
follows a five step pattern involving homework review, explanation and examples of a new
problem type by the teacher, seat work where students work independently to practice the new
problem type, summarization of work and a question and answer period conducted by the
teacher, and teacher-assigned homework consisting of similar problems. Invariably, the next
class period begins with a review of these homework problems. This cycle, according to
Romberg, needs to be broken because to learn something involves more than repeating what one
is shown.
25
Scheffler (1975) posited that mathematics instruction has been oversimplified because
mathematics has become a subject rather than a process. As a subject, mathematics must be
presented in a mechanistic, exact, numerical, and precise manner. For every question there is an
answer. Further, the answer will be the one and only correct answer to the question, and it will be
stated in precise, numerical terms. Rather than presenting mathematics in this manner, Polya
(1957) stated that the mathematics teacher should take advantage of the great opportunity to first
arouse and then challenge the curiosity of students by offering them problems that meet them at
their ability level and challenge them to employ previous concepts in ways that are new and
different to them. The ultimate goal of this kind of instruction, that goal for which all
mathematics teachers should aim, is the development of students’ independent thought.
When the NCTM developed its standards in 1989, the organization set out to contradict
the Mathematic Sciences Education Board’s (MSEB) statement, “We have inherited a
mathematics curriculum conforming to the past, blind to the future, and bound by a tradition of
minimum expectations” (1990, p. 4). Romberg (1998) claimed, “When we [NCTM] developed
the standards, we thought instruction should take an approach involving investigating,
formulating, representing, reasoning, reading, using strategies to solve problems, providing
assertions, and reflecting on how mathematics is being used” (p. 12).
The intent of the NCTM in publishing the 1989 Curriculum and Evaluation Standards
was to begin a process of changing the way mathematics is taught. It was hoped that the 1989
Standards would be used as a document with ideas for starting points for a reform movement
involving “creative development and trials of new materials and methods of instruction”
(Romberg, 1998, p. 14). After the publication of the NCTM’s standards (1989), the Mathematics
and Sciences Education Board (MSEB) advocated a year of national dialogue. Because we live
26
in a supply-and-demand economy, a strategy for change assumed that changes in the way
mathematics is taught would produce changes in the materials and support provided to schools
and school systems based on this change.
As indicated earlier, before any plan can proceed, a need for change must be established,
such as the need for students to be prepared for participation in the knowledge-based economy of
the twenty-first century. The NCTM standards were designed to provide a vision for the new
U.S. mathematics program. The next stage in the process of change is planning, which involves
including all stakeholders so that a consensus may be reached regarding plans and timelines for
change. It is here where demands are placed on suppliers to provide the elements required to
operationalize the vision for change into a product. The product is the curriculum and the
assessment designed to determine how effective the curriculum is in enabling students to fulfill
their educational needs and the needs of their state and nation. Once curriculum is in place, the
onus for executing it falls squarely on classroom teachers. As Virginia’s mathematics teachers
seek methods for use in their classrooms, it is important for educational leaders to provide them
with choices guided by research.
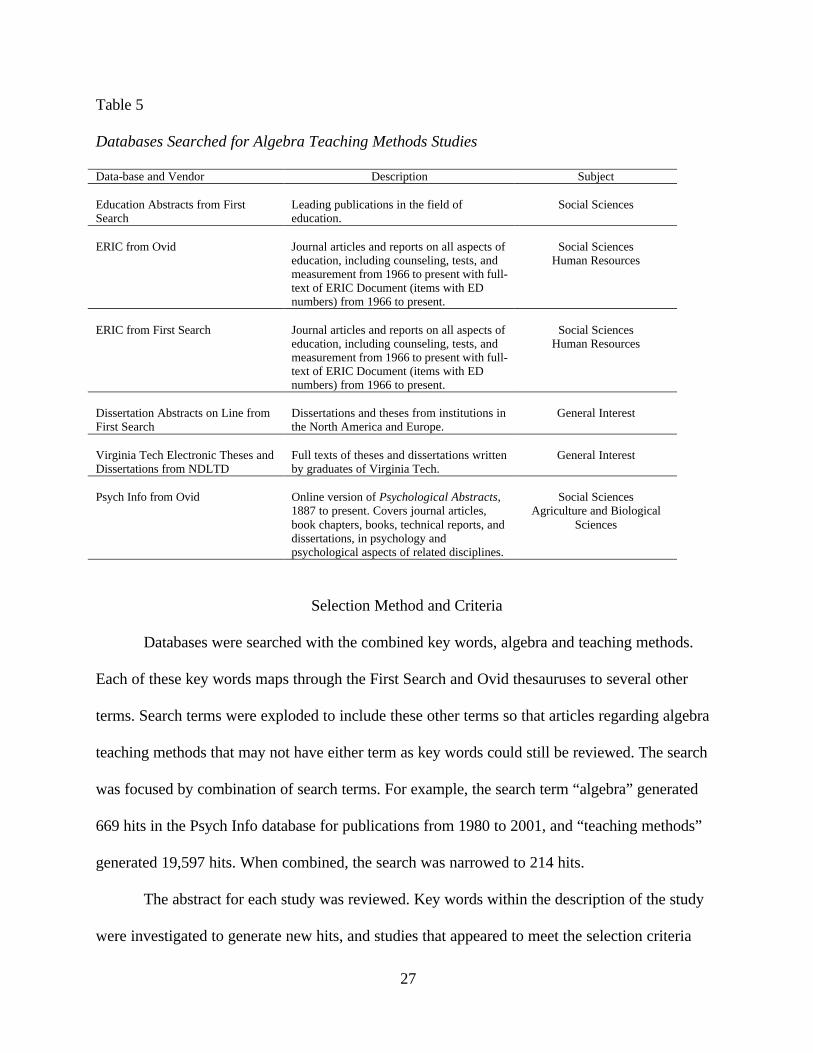
Meta-Analysis of Research on Algebra Teaching Methods
The purpose of this meta-analysis is to quantitatively synthesize the research findings
from 1980 to 2001 on methods for teaching algebra at the secondary school level. The first
requirement in reviewing literature is to locate and obtain relevant research studies. Six databases
described in Table 5 were used as starting points to find research studies pertaining to secondary
level algebra teaching methods.
27
Table 5
Databases Searched for Algebra Teaching Methods Studies
Data-base and Vendor Description Subject Education Abstracts from First Search
Leading publications in the field of education.
Social Sciences
ERIC from Ovid
Journal articles and reports on all aspects of education, including counseling, tests, and measurement from 1966 to present with full-text of ERIC Document (items with ED numbers) from 1966 to present.
Social Sciences
Human Resources
ERIC from First Search
Journal articles and reports on all aspects of education, including counseling, tests, and measurement from 1966 to present with full-text of ERIC Document (items with ED numbers) from 1966 to present.
Social Sciences
Human Resources
Dissertation Abstracts on Line from First Search
Dissertations and theses from institutions in the North America and Europe.
General Interest
Virginia Tech Electronic Theses and Dissertations from NDLTD
Full texts of theses and dissertations written by graduates of Virginia Tech.
General Interest
Psych Info from Ovid
Online version of Psychological Abstracts, 1887 to present. Covers journal articles, book chapters, books, technical reports, and dissertations, in psychology and psychological aspects of related disciplines.
Social Sciences
Agriculture and Biological Sciences
Selection Method and Criteria
Databases were searched with the combined key words, algebra and teaching methods.
Each of these key words maps through the First Search and Ovid thesauruses to several other
terms. Search terms were exploded to include these other terms so that articles regarding algebra
teaching methods that may not have either term as key words could still be reviewed. The search
was focused by combination of search terms. For example, the search term “algebra” generated
669 hits in the Psych Info database for publications from 1980 to 2001, and “teaching methods”
generated 19,597 hits. When combined, the search was narrowed to 214 hits.
The abstract for each study was reviewed. Key words within the description of the study
were investigated to generate new hits, and studies that appeared to meet the selection criteria
28
outlined in Table 6 were obtained from the Virginia Tech Library or through the interlibrary loan
service. Marcucci (1980) established selection criteria for his meta-analysis. Marcucci’s criteria
have been replicated with revisions to the types of treatment and the inclusion of studies
exploring computer technology (computers or calculators) and cooperative or small group
instruction. Marcucci did not include these areas of research because at the time of his study, the
use of these teaching methods was not prevalent. Since then, these methods have grown in
popularity and usage. While they have not been extensively researched for algebra instruction in
particular, they deserve attention as teaching methods as they are advocated within the context of
mathematics teaching reform (R. G. Marcucci, personal communication, September 10, 2001).
After a report was obtained, it was further reviewed to determine whether it met the
criteria for meta-analysis, and if not, whether it warranted inclusion as advocating a teaching
method to include under a category in the questionnaire development. The reference lists for all
studies, whether they were acceptable or not, were searched for more potential studies. Studies
found in the reference lists of reports were reviewed for applicability.
Table 6
Selection Criteria for Studies to be Integrated with Meta-Analysis
1
The study was conducted between 1980 and 2001 at the secondary school level (grades 7-12) where algebra instruction was the focus.
2
The study was an experimental investigation, comparing a treatment group to a control group, whose outcome variable was a measure of the subject’s algebra knowledge and skills achievement.
3
The method of instruction in the study dealt with algebra knowledge and skills achievement per se and not with factors related to it.
29
In general, the literature pertaining to algebra teaching methods abounds with opinion
regarding what (curriculum) should be taught so that mathematics students are prepared for the
twenty-first century. It primarily concerns proposals for methods as advocated by mathematics
reform organizations such as the NCTM. A relative few experimental investigations of teaching
methods for algebra exist from 1980 to 2001. Marcucci encountered a similar problem when
calculating effect sizes for the subject area of algebra at the secondary level. Of the 200 studies
Marcucci initially found pertaining to elementary or secondary mathematics problem solving
teaching methods from 1950 to 1980, thirty-three met his criteria for inclusion. Of those 33,
eleven examined mathematics problem solving in secondary algebra classes. At least 1,418
articles were initially reviewed for the present study. This figure was narrowed to 72 for closer
examination, and 34 were chosen for inclusion.
Referring to selection criterion one, for the purposes of this study, this researcher did not
limit the review to only reports dealing with problem solving. The constitutive definition for
algebra achievement for this study is the student’s demonstration of knowledge and skill
acquisition in algebra. This expands the number of reports that may be included and aligns the
research with the operational definition for algebra achievement for this study: the student’s
scale score on the End of Course SOL Test for Algebra I, an assessment of the student’s algebra
knowledge and skills.
For the purpose of this study, selection criterion two applies only to those studies
included in the meta-analysis. Reports that discuss teaching methods for algebra that are rooted
in research or reform are included within the review of literature in order to augment the results
from the meta-analysis and for the development of the questionnaire described in Chapter III.
Teaching methods found in these reports are categorized according to which teaching

30
methodology they typify. This is done so that each teaching method type may be fleshed out for
investigation in the regression analysis described in Chapter III.
Table 7
Experimental Studies with Secondary Algebra Teaching Methods, 1980 – 2001: Search Results
by Database
Data-base Number of Initial Hits Reviewed
Number of Studies Selected for Further
Review
Number of Studies Selected for Inclusion in Meta-Analysis
Education Abstracts from First Search
137
5
2
ERIC from Ovid
463
14
7
ERIC from First Search
543
8
4
Dissertation Abstracts on Line from First Search
96
17
11
Virginia Tech Electronic Theses and Dissertations from NDLTD
1
1
1
Psych Info from Ovid
181
24
8
Reference Lists of Reports
all
3
1
Total
At least 1,418
72
34
The End of Course SOL Test for Algebra I is not singularly a problem solving test, and
the mathematics standards in the Virginia curriculum are not solely based on problem solving.
Selection criterion number three expands Marcucci’s to include reports that addressed algebra
knowledge and skills. Table 7 displays the number of studies selected for review and final
inclusion in the meta-analysis according to the database searched. There was some redundancy in
the number of hits among databases, but there is no redundancy among studies selected for
31
further review. The final decision to include a study in the meta-analysis was based on the
criteria for selection.
Study Characteristics
According to Gay (1996), one characteristic of meta-analysis that distinguishes it from
more traditional approaches to research integration is that there is an emphasis for the researcher
to be as inclusive as possible. “Reviewers are encouraged to include results typically excluded,
such as those presented in dissertation reports and unpublished work” (p. 266). Critics have
claimed that this emphasis leads to the inclusion of “poor” studies. Glass, McGaw, and Smith
(1981) argued that there is no proof that this is the case. They further argued that articles
published in journals tend to have larger effect sizes, thus causing an over estimation of the value
of an intervention. The inclusion of unpublished reports and dissertations tempers this factor,
because dissertations demonstrate higher design quality than published journal articles and tend
to have smaller effect sizes.
Rather than excluding a study, it is important to contextualize its inclusion by coding and
analyzing it according to characteristics. Marcucci (1980) stated that there are many
characteristics that influence the measure of a treatment’s effectiveness. An important part of his
study replicated here is the identification and coding of study characteristics so that “their
relationship to the effectiveness of the methods employed to teach [algebra knowledge and
skills] could be determined” (p. 22). Thus, rather than excluding a study off hand, the researcher
may include it in light of its characteristics. Marcucci identified four groups of study
characteristics: subject variables, treatment variables, design variables, and study variables.
These groupings are replicated here; however, alterations have been made to the content of the
32
groups to facilitate the current study. Study features within each characteristic are described
below, and a copy of the coding sheet for these variables is found in Appendix B.
Subject Variables
1. Grade Level: The grade level of the subjects, 7 – 12.
2. Ability Level: The ability level of the subjects as defined by the author of the
study was recorded as unspecified, low, middle, or high.
Treatment Variables
3. Length of Treatment: This variable was measured by the number of weeks
from the beginning to the end of instruction and by the total number of hours of instruction. If
length of treatment was not specified in these terms, it was calculated based on information
given. If time amounts were not given for class sessions, the total number of hours of instruction
was determined by multiplying the number of weeks by 3.5 hours, replicating Marcucci.
4. Algebra Course: The algebra course level for the study: pre-algebra, algebra,
or advanced algebra, as defined by the researcher.
5. Type of Treatment: Based on the reviews of the literature on algebra
teaching methods and a careful reading of the studies included in this review of literature.
Studies were grouped according to the treatments under investigation and category names were
derived from these groupings. Categories were developed in an attempt to clearly differentiate
one type of teaching methodology from those within other categories. This was important to the
development of the meta-analysis and in the inclusion of studies not incorporated within it. The
categories developed here set the stage for the multiple regression analysis in Chapter III.
a. Cooperative Learning: A method of instruction characterized by students
working together to reach a common goal.
33
b. Communication and Study Skills: A method of instruction characterized by
teaching students to read and study mathematical information effectively and providing
opportunities for students to communicate mathematical ideas verbally or in writing (thinking
aloud).
c. Technology Aided Instruction: A method of instruction characterized by
using computer software applications and/or hand-held calculators to enhance instruction.
d. Problem-Based Learning: Teaching through problem solving where students
apply a general rule (deduction) or draw new conclusions or rules (induction) based on
information presented in the problem.
e. Manipulatives, Models, and Multiple Representations: A method of
instruction characterized by teaching students techniques for generating or manipulating
representations of algebraic content or processes, whether concrete, symbolic, or abstract.
f. Direct Instruction: A method of instruction characterized by teaching through
establishing a direction and rationale for learning by relating new concepts to previous learning,
leading students through a specified sequence of instructions based on predetermined steps that
introduce and reinforce a concept, and providing students with practice and feedback relative to
how well they are doing.
Marcucci (1980) used four teaching methodology types. For this study, this area is
expanded to six to include current trends in mathematics education and the introduction of
technologies that were not widely available in or prior to 1980. The six types of teaching
methods outlined here should not be considered mutually exclusive because one method may
contain another. For example, a problem-based learning approach to teaching may include the
use of technology, such as calculators for graphing, to enhance student understanding. This

34
researcher’s goal is to provide general classifications so that mean effect sizes may be inclusive
of teaching methods related to one another.
When a study seemed to use a combination of teaching methods, the decision for
classification into a category was based on the definition of the teaching method and the purpose
of the study as described by the researcher. As is the case in Marcucci’s study, in all cases the
researcher is responsible for classifying each teaching method described in a report or study into
its category. For the present study, teaching method classifications were revised and verified
through the content validation process described in chapter III.
Design Variables
1. Sample Size: “The total number of participants in the study” (Marcucci, p. 24).
2. Outcome Measure: The instrument used to measure algebra knowledge and
skills acquisition was coded as experimenter designed or standardized test.
3. Assignment to Treatment: A three-point scale was used to assess this aspect of design
quality. “One point was given to a study where subjects were randomly assigned to treatments.
Two points were given where treatments were randomly assigned to groups, and the researcher
presented convincing evidence accounting for initial differences between treatment and control
groups” (Marcucci, p. 25). Three points were given to a study when no such evidence was given.
4. Homogeneity of Variance: This variable was measured as the ratio of the
treatment group’s variance to the control group’s variance or the inverse (Marcucci, p. 25)
5. Novelty Effect: Hartley (1978) defines a novel classroom situation as a period of
instruction less than nine weeks in length (as cited in Marcucci, 1980).
6. Adjusted Means: This variable indicated whether means on the outcome measure
where adjusted for initial differences between the treatment and control groups (Marcucci, p. 25).
35
Calculating Effect Sizes
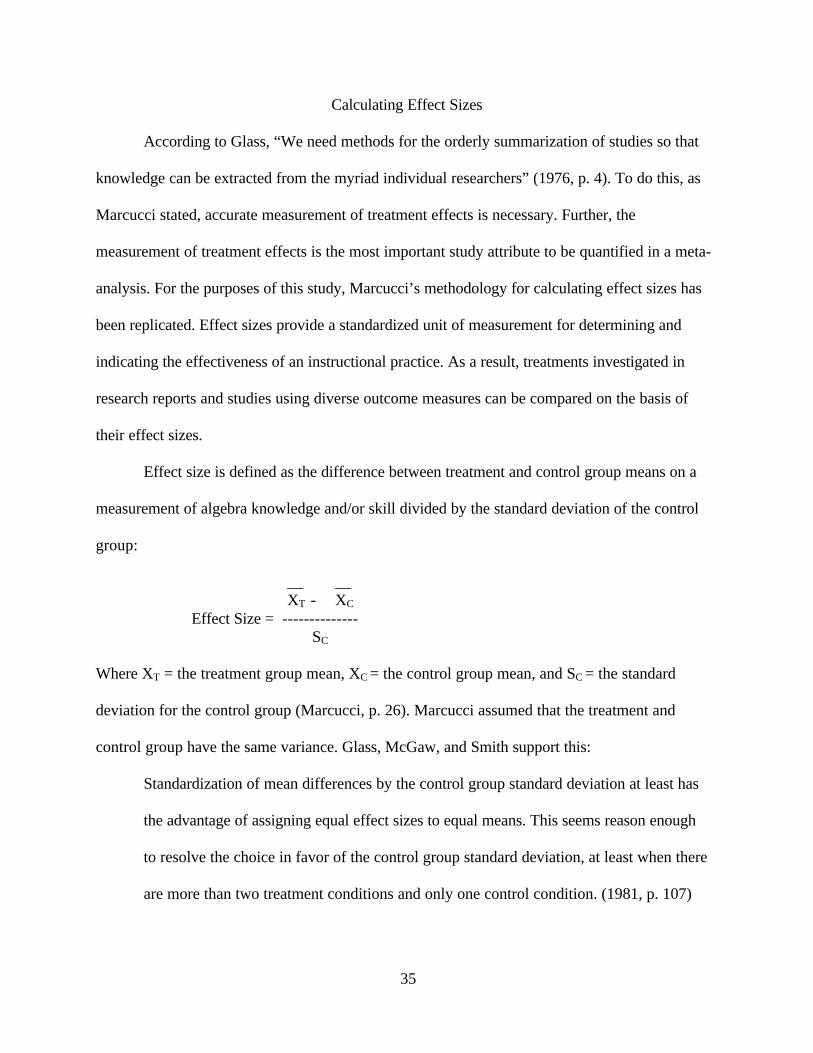
According to Glass, “We need methods for the orderly summarization of studies so that
knowledge can be extracted from the myriad individual researchers” (1976, p. 4). To do this, as
Marcucci stated, accurate measurement of treatment effects is necessary. Further, the
measurement of treatment effects is the most important study attribute to be quantified in a meta-
analysis. For the purposes of this study, Marcucci’s methodology for calculating effect sizes has
been replicated. Effect sizes provide a standardized unit of measurement for determining and
indicating the effectiveness of an instructional practice. As a result, treatments investigated in
research reports and studies using diverse outcome measures can be compared on the basis of
their effect sizes.
Effect size is defined as the difference between treatment and control group means on a
measurement of algebra knowledge and/or skill divided by the standard deviation of the control
group:
__ __ XT - XC Effect Size = -------------- SC Where XT = the treatment group mean, XC = the control group mean, and SC = the standard
deviation for the control group (Marcucci, p. 26). Marcucci assumed that the treatment and
control group have the same variance. Glass, McGaw, and Smith support this:
Standardization of mean differences by the control group standard deviation at least has
the advantage of assigning equal effect sizes to equal means. This seems reason enough
to resolve the choice in favor of the control group standard deviation, at least when there
are more than two treatment conditions and only one control condition. (1981, p. 107)
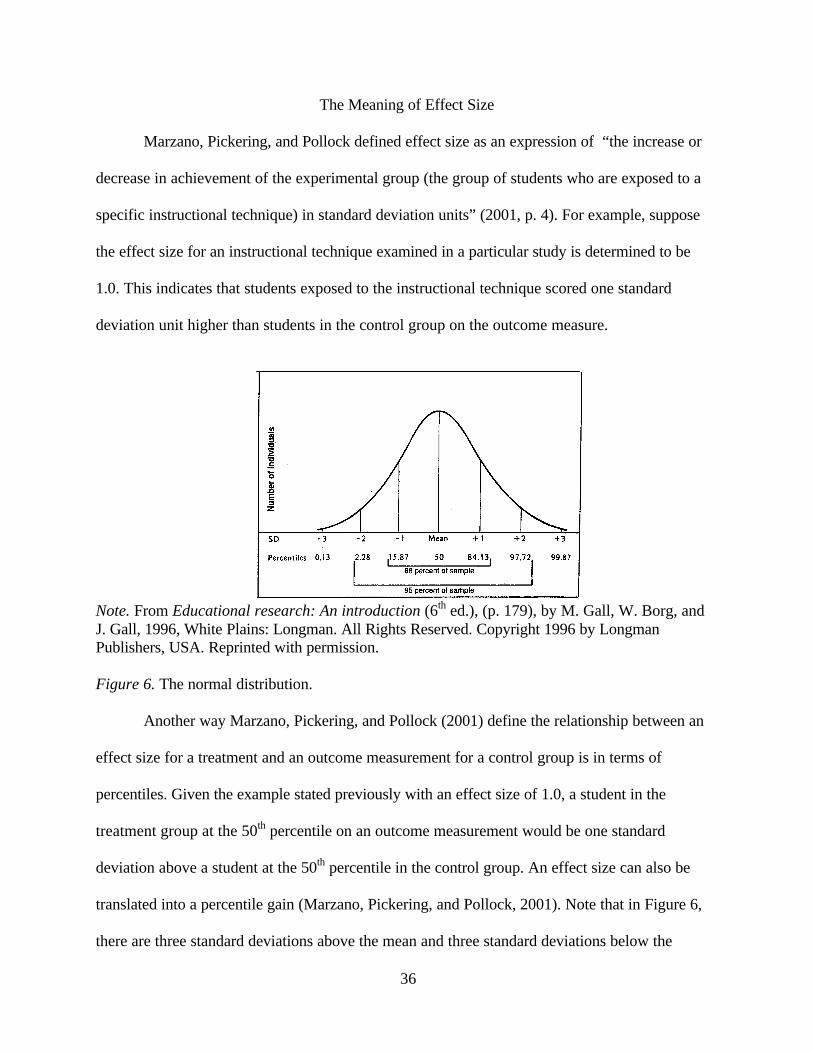
36
The Meaning of Effect Size
Marzano, Pickering, and Pollock defined effect size as an expression of “the increase or
decrease in achievement of the experimental group (the group of students who are exposed to a
specific instructional technique) in standard deviation units” (2001, p. 4). For example, suppose
the effect size for an instructional technique examined in a particular study is determined to be
1.0. This indicates that students exposed to the instructional technique scored one standard
deviation unit higher than students in the control group on the outcome measure.
Note. From Educational research: An introduction (6th ed.), (p. 179), by M. Gall, W. Borg, and J. Gall, 1996, White Plains: Longman. All Rights Reserved. Copyright 1996 by Longman Publishers, USA. Reprinted with permission. Figure 6. The normal distribution.
Another way Marzano, Pickering, and Pollock (2001) define the relationship between an
effect size for a treatment and an outcome measurement for a control group is in terms of
percentiles. Given the example stated previously with an effect size of 1.0, a student in the
treatment group at the 50th percentile on an outcome measurement would be one standard
deviation above a student at the 50th percentile in the control group. An effect size can also be
translated into a percentile gain (Marzano, Pickering, and Pollock, 2001). Note that in Figure 6,
there are three standard deviations above the mean and three standard deviations below the
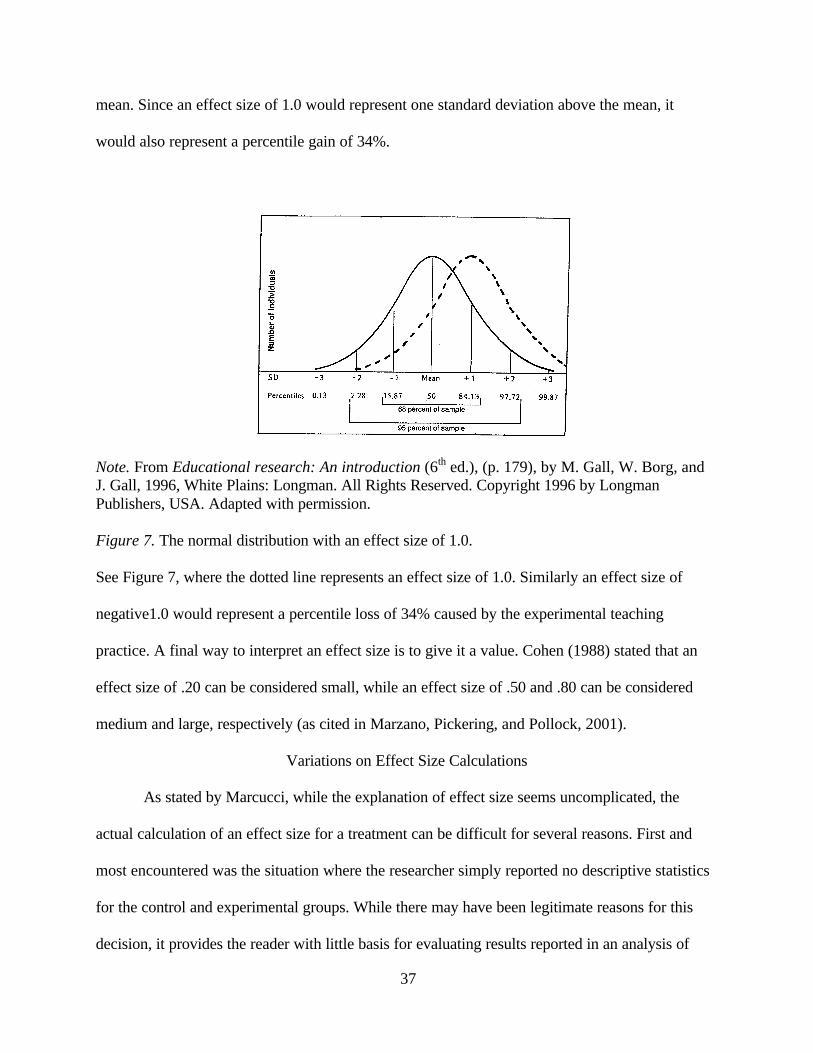
37
mean. Since an effect size of 1.0 would represent one standard deviation above the mean, it
would also represent a percentile gain of 34%.
Note. From Educational research: An introduction (6th ed.), (p. 179), by M. Gall, W. Borg, and J. Gall, 1996, White Plains: Longman. All Rights Reserved. Copyright 1996 by Longman Publishers, USA. Adapted with permission. Figure 7. The normal distribution with an effect size of 1.0.
See Figure 7, where the dotted line represents an effect size of 1.0. Similarly an effect size of
negative1.0 would represent a percentile loss of 34% caused by the experimental teaching
practice. A final way to interpret an effect size is to give it a value. Cohen (1988) stated that an
effect size of .20 can be considered small, while an effect size of .50 and .80 can be considered
medium and large, respectively (as cited in Marzano, Pickering, and Pollock, 2001).
Variations on Effect Size Calculations
As stated by Marcucci, while the explanation of effect size seems uncomplicated, the
actual calculation of an effect size for a treatment can be difficult for several reasons. First and
most encountered was the situation where the researcher simply reported no descriptive statistics
for the control and experimental groups. While there may have been legitimate reasons for this
decision, it provides the reader with little basis for evaluating results reported in an analysis of
38
variance source table. For many of the studies, the effect size could be calculated straight from
the definition, using the posttest means of the experimental and control group and the standard
deviation for the control group. When a study lacked crucial information for determining an
effect size in a straightforward manner, this researcher referred to Marcucci (1980) and Glass
and Smith (1978) for alternative ways to convert statistical information reported in a study into
an effect size. These procedures were adapted to this synthesis of research as appropriate.
Sample Sizes and t-statistic Reported
In studies where only sample sizes and t-test statistics were reported, the effect size for
the experimental treatment was determined with this formula:
XT - XC (1) Effect Size = t 1 + 1 where t = S 1 + 1 nT nC nT nC nT = the number of subjects in the treatment group, nC = the number of subjects in the control
group, and S = the pooled standard deviation of the treatment and control groups. Whether the
effect size was positive or negative was determined from the study (Marcucci, p. 27).
F-test Statistic Reported
When an F-test statistic was reported with only two groups, the square root of F was
substituted for the value of the t-test statistic in formula (1).
Analysis of Variance Design
When a study used analysis of variance (ANOVA) design and the standard deviation of
the control group was not reported, an estimate for it was found using the following procedure.
1. Adding the sum of squares for all factors except treatment.
39
2. Dividing the above result by the sum of the degrees of freedom for all factors except
treatment.
3. Taking the square root of the result in step (2).
Analysis of Covariance Design
When studies used an analysis of covariance design (ANCOVA), the numerator of the
formula for effect size was calculated from the adjusted means of the control groups. Whenever
possible, the denominator was estimated in a similar manner to the ANOVA estimate.
Multiple Effect Sizes
Some studies yield more than one effect size. In a one factor ANOVA study, for example,
comparisons of more than one instructional practice to a control group would produce an effect
size for each practice. In the case of a multi-factor ANOVA, more than one effect size could also
be obtained. For example, when grade level or ability level is a factor, effect sizes could be
calculated for each grade or ability level. When a study has both grade level and ability level as
factors, effect sizes can be calculated for each factor independently, and ability level effect sizes
can be coded as redundant data.
Limitations of Meta-Analysis
Abrami, Cohen, and d’Apollonia (1988) stated, “The great promise of meta-analysis is
that it attempts to make the process of reviewing as scientific as the conduct of the primary
research. To this end, meta-analysis should be precise, objective, and repeatable” (p. 174).
Marcucci (1980) identified limitations of meta-analysis for synthesizing research. Precision,
objectivity, and repeatability concerns affect both the validity and reliability of meta-analysis
results. Issues related to study selection, comparability of studies, and the interpretation of meta-
analysis results are treated within the context of this review of literature in an effort to address
40
these concerns. Some are addressed by using the meta-analysis as the descriptive part of this
research study while using a different methodology for making inferences regarding the
effectiveness of particular teaching methods where student achievement in algebra is concerned.
Sample of Studies
This researcher has attempted to demonstrate that the studies included in the present
meta-analysis were found from a variety of sources ranging from published journals to university
archives and reference lists of studies. Although every attempt was made to be thorough in this
review, it could not be exhaustive. Limited resources and time affected Marcucci’s review.
While this search was greatly aided by computer technology, resources and time still had an
effect. Database selection may also have had an effect. Databases searched were chosen by their
description. For example, those that included “social sciences” in their description were assumed
to include a broad spectrum of research including studies in educational issues. Some
redundancy occurred across databases. Confidence in studies selected was increased if they were
found in more than one database.
However, some studies were found in one database and not the others; even the two
databases for ERIC did not produce a great deal of redundancy using the same search terms. This
reduced confidence in the probability of exhausting all possibilities. One further phenomenon
that affected this confidence was the finding of a study in another’s reference list that probably
should have been “hit” while searching the databases. This could have been a result of the
descriptors or search terms used, although new avenues were continuously investigated by
adding to key word lists.
Although restricted by these conditions and the subjectivity involved in judging whether
a study met the selection criteria (Abrami, Cohen, & d’Apollonia, 1988, p. 156,), the sample

41
appears to contain a substantial number of the available studies meeting the three criteria for
inclusion. When compared against Marcucci’s number of studies obtained over a thirty year
period with broader selection criteria, the number obtained here is wide-ranging and supports a
methodical and thorough search.
A related problem discussed by Marcucci is whether the sample of studies is in some way
“representative” of a conceptualized population of studies. Does this sample of studies represent
the population of all studies satisfying the criteria for inclusion? This question raises the issue of
sampling error in the calculation of statistical results designed to apply primary research
methodologies to a synthesis of research studies, allowing the researcher to make inferences
about the population of studies. Whether the results of a meta-analysis should be interpreted
inferentially is a question that has been debated since Glass developed this form of research
synthesis (Abrami, Cohen, & d’Apollonia, 1988). In the case of this research study, meta-
analysis is intended as an improvement in description and explanation over the traditional
narrative review of literature. Inferential statistics were applied to assist the reader in making
judgments regarding the body of research analyzed, but this is to further enhance the descriptive
nature of the synthesis of research. See Appendices C through R.
Comparability of Studies
Marcucci (1980) addressed the issue of interpreting results and the problems of sampling
and sampling error by using procedures to be described in this section. Abrami, Cohen, and
d’Apollonia (1988) later advocated these procedures in their discussion of implementation
problems in meta-analysis. Each of the studies selected to contribute to the “results” of this
review of literature was intended to reveal the effectiveness of a particular teaching practice for
secondary level algebra. This common goal and the classification of teaching methods into
42
general categories established a basis for comparison. The studies selected, however, vary
greatly with respect to sample size, sample characteristics, outcome measures, experimental
design, and suitability of statistical analysis. Other than in a narrative format, how can the
findings of such different studies be combined and synthesized (Marcucci, 1980)?
The question posed above by Marcucci and this researcher is the key to the logic of
research integration as developed by Glass (1976). In Marcucci’s investigation, the response to
the “different studies question” included two strategies later advocated by Abrami, Cohen, and
d’Apollonia (1988). These strategies were used in the present study.
Correlation of Study Characteristics to Effect Size
Important study characteristics (e.g., sample size, type of outcome measure, weeks of
treatment) were quantified and correlated with effect size. See Appendices C through R. A low
correlation provides some evidence that the study characteristic under investigation is not
systematically related to the effect size. Consequently, assuming low correlation, it would seem
practical to compare the results of studies that differ on the given characteristic.
Comparing Teaching Methods by Subset
Different subsets of the sample, which share a common design feature, were used to
compare teaching methods. For example, the effectiveness of the six types of methods was
compared across grade levels (7 through 12) and across course (pre-algebra, algebra, advanced
algebra). Further, the design quality of each study was rated as “good” or “poor” based on the
extent of randomization in assigning subjects to treatments. The design quality ratings provide a
dimension from which to combine study findings and provide a way of assessing one of the
major criticisms of meta-analysis results. Specifically, the findings of “good” studies and “poor”
studies should not be pooled to determine treatment effectiveness (Marcucci, 1980). Slavin
43
(1984) stated that overly broad inclusion criteria result in either the introduction of systematic
bias from poorly designed studies or the senseless combination of notably different studies.
Mansfield and Busse (1977, p. 3) noted, “Poorly designed studies are likely to yield spurious
findings precisely because these studies are poorly designed” (as cited in Marcucci, 1980).
Interpretation of Results
This review of literature on teaching methods for algebra differs from the typical
narrative review found in dissertations in that it produced “results” to guide the researcher in
designing the instrumentation utilized in conducting the culminating analysis described in
Chapter III. The overall results of this meta-analysis will be expressed as comparisons of mean
effect sizes for the six general types of methods for algebra instruction and as correlations
between effect size and study characteristics. To further refine this process, mean effect sizes and
correlations are viewed in light of design quality.
Sources of Bias
Marcucci noted that there were several potential sources of bias in the results of his study.
Slavin (1984) and Abrami, Cohen, and d’Apollonia (1988) also discuss these sources of bias as
they affect the interpretation of results from meta-analysis.
1. Although the criteria for determining the types of teaching methods and design
quality ratings are stated clearly and precisely, the investigator is solely responsible
for both decisions. The influence of this type of bias may be reduced as content
validity is explored in the instrument development as described in Chapter III.
2. There is also the possibility of experimenter bias. Mansfield and Busse (1977, p. 3)
state, “If, as is often the case in educational studies, an experimental program is
44
confounded with the expertise and commitment of those implementing it, spurious
findings are likely to be obtained” (as cited in Marcucci, 1980).
3. Publication bias is a third possibility.
Large, well-designed studies are likely to be published whatever the statistical
significance of their findings. But small, poorly designed studies are likely to be
published only if significant treatment effects are obtained. Thus, summaries of
published studies can be expected to yield over-optimistic estimates of the
effectiveness of treatments. (Mansfield and Busse, 1977, p. 3)
Marcucci found that the influence of this type of publication bias was reduced for his study
because he used more than twice as many studies from unpublished sources than from journals.
In the case of the present study, the number of unpublished studies used is more than four times
the number of published studies.
The fundamental question pertaining to the interpretation of the results for this review of
literature is the same as for Marcucci’s. Should meta-analysis findings be used mainly for
descriptive purposes or to answer questions of statistical inference? Abrami, Cohen, and
d’Apollonia also posed this question. Marcucci’s response took into account the concept of
“independence” as stated by Glass (1978),
The inferential statistical problems of the meta-analysis of research are uniquely
complex. The data set to be analyzed will invariably contain complicated patterns of
statistical dependence. ‘Studies’ cannot be considered the unit of data analysis without
aggregating findings above the level at which many interesting relationships can be
studied. There is no simple answer to the question of how many independent units of
information exist in the larger data set. (p. 375)

45
Glass proceeded to discuss the risks of interpreting inferential calculations under the assumption
that each effect size is independent of the others. In light of the problems associated with
inferential procedures, the results of Marcucci’s meta-analysis and this meta-analysis are aimed
at description and summarization of the findings of the studies in the sample. It is meant to be an
enhancement and improvement over the traditional narrative approach to reviewing literature
within the context of a dissertation.
Analysis of Data and Results
The major undertaking of this review of literature was to quantitatively synthesize the
research findings from 1980 to 2001 on methods for teaching algebra at the secondary school
level. Specifically, six types of teaching methods, cooperative learning; communication and
study skills; technology aided instruction; problem-based learning; manipulatives, models, and
multiple representations; and direct instruction, were identified, and the results of experimental
studies that examined the effectiveness of each of these methods were integrated using the
concept of effect size and the techniques of meta analysis.
The analysis of data and results reported here are presented in seven sections. First, there
is an overall comparison of the effectiveness of the six types of teaching methods along with a
brief profile of the studies within the sample. Within this discussion, information pertaining to
study characteristics that had an apparent correlation to the findings is presented. This will be
followed by a summary of findings for each teaching method category. In some cases, the results
should be viewed with caution because of the relatively small number of studies contributing
effect sizes to the computation of means.
To augment his results, Marcucci took into account one significant aspect of design
quality of the studies and assigned each study a “good” or “poor” design quality rating based on
46
the experimenter’s control over the assignment of subjects to treatments. This method is
replicated here and should be noted when referring to Table 8. A study was classified as “good”
when the experimenter (a) assigned subjects to treatments randomly or (b) assigned treatments
randomly to intact groups of subjects and presented credible evidence of accounting for or
controlling some of the initial difference between groups (e.g., a reasonable application of
analysis of covariance). A study was classified as “poor” when it did not satisfy the “good”
criteria mentioned above.
Overall Effects of Teaching Methods
As stated previously, the purpose of this meta-analysis is to quantitatively synthesize the
research findings from 1980 to 2001 on methods for teaching algebra at the secondary school
level. Detailed tables replicated from Marcucci’s (1980) meta-analysis containing descriptive
results are found in Appendices C through R. The following tables and narrative are intended to
summarize the meta-analysis in a manner leading to the development of the research question to
be investigated using the methodology discussed in Chapter III. Table 8 displays the meta-
analysis results for all categories for comparison.
The sample represented in Table 8 consisted of 34 studies meeting the three criteria for
inclusion. From these 34 studies, 62 effect sizes were calculated. The majority of the studies (22)
were “good” in design quality according to Marcucci’s definition. Further, more than half of the
sample (18) consisted of doctoral dissertations, while six were obtained from journal articles.
The remaining ten studies were primarily ERIC documents, many of which were master’s theses.
Some studies initially found in the ERIC database were hit upon in a later year as published
journal articles. When this occurred, the study was recoded as a journal document and eliminated
from the unpublished document count. Most of the studies in the sample were conducted during
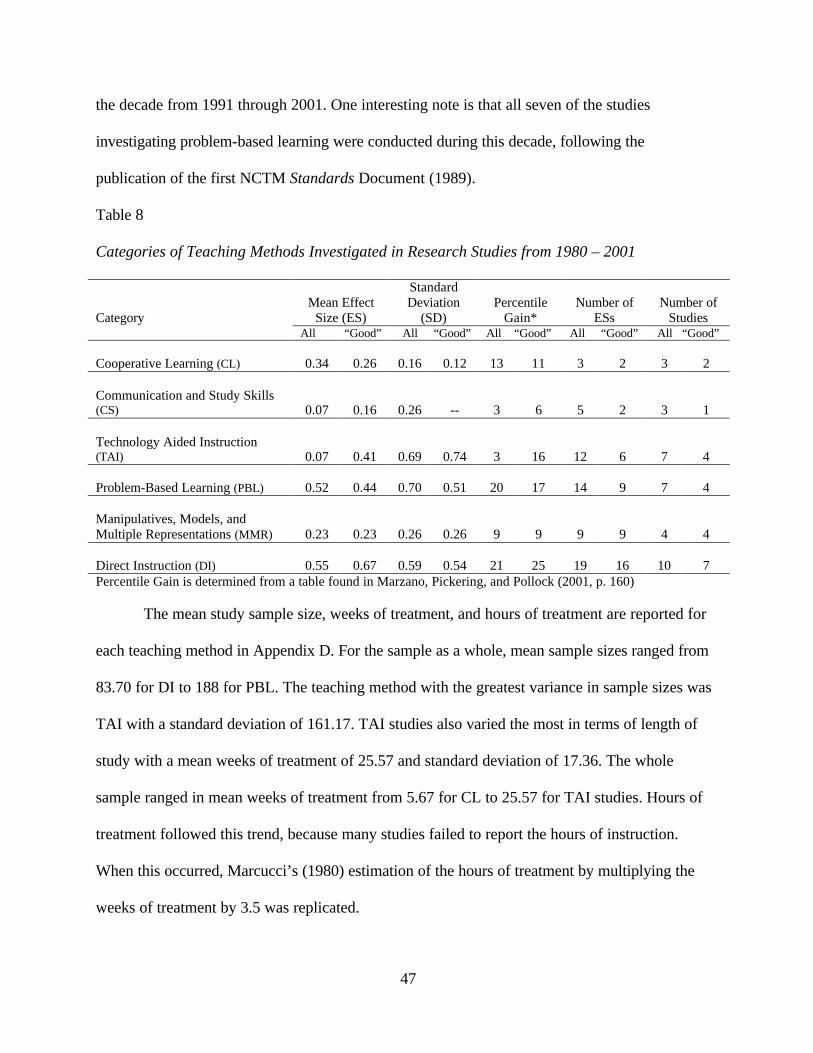
47
the decade from 1991 through 2001. One interesting note is that all seven of the studies
investigating problem-based learning were conducted during this decade, following the
publication of the first NCTM Standards Document (1989).
Table 8
Categories of Teaching Methods Investigated in Research Studies from 1980 – 2001
Mean Effect
Size (ES)
Standard Deviation
(SD)
Percentile
Gain*
Number of
ESs
Number of
Studies
Category
All “Good” All “Good” All “Good” All “Good” All “Good” Cooperative Learning (CL)
0.34
0.26
0.16
0.12
13
11
3
2
3
2
Communication and Study Skills (CS)
0.07
0.16
0.26
--
3
6
5
2
3
1
Technology Aided Instruction (TAI)
0.07
0.41
0.69
0.74
3
16
12
6
7
4
Problem-Based Learning (PBL)
0.52
0.44
0.70
0.51
20
17
14
9
7
4
Manipulatives, Models, and Multiple Representations (MMR)
0.23
0.23
0.26
0.26
9
9
9
9
4
4
Direct Instruction (DI)
0.55
0.67
0.59
0.54
21
25
19
16
10
7
Percentile Gain is determined from a table found in Marzano, Pickering, and Pollock (2001, p. 160)
The mean study sample size, weeks of treatment, and hours of treatment are reported for
each teaching method in Appendix D. For the sample as a whole, mean sample sizes ranged from
83.70 for DI to 188 for PBL. The teaching method with the greatest variance in sample sizes was
TAI with a standard deviation of 161.17. TAI studies also varied the most in terms of length of
study with a mean weeks of treatment of 25.57 and standard deviation of 17.36. The whole
sample ranged in mean weeks of treatment from 5.67 for CL to 25.57 for TAI studies. Hours of
treatment followed this trend, because many studies failed to report the hours of instruction.
When this occurred, Marcucci’s (1980) estimation of the hours of treatment by multiplying the
weeks of treatment by 3.5 was replicated.
48
Interpretation of Overall Effects
The sample of studies presented in this quantitative review produced a collection of effect
sizes represented in Table 8. For each teaching method category, the mean effect sizes for all
studies and “good” studies are presented for comparison. Each effect size is interpreted as a
percentile gain determined from a conversion table found in Marzano, Pickering, and Pollock
(2001). Considering the limitations affecting interpretation of results mentioned previously, the
ample descriptive and quantitative information derived from the aggregation of the research
studies in the sample establishes a reasonable basis for deciding which teaching method type was
most effective for teaching algebra knowledge and skills (Marcucci, 1980).
Overall, the categories for teaching methods produced effect sizes ranging from small
(0.07) to medium (0.55). This trend is mirrored when only “good” studies are considered,
although the range increases from a small 0.16 to a medium 0.67. This trend goes against the
findings of Marcucci. In his study, he found that “good” studies produced smaller effect sizes.
One explanation for this study’s larger effect sizes for “good” studies may be found by
examining other characteristics of the studies that appear to be related to effect size. Appendix Q
displays significant, moderate, negative correlations between length of treatment and effect size
(-.40 for weeks and -.43 for hours); sample size and effect size (-.34); and homogeneity of
variance and effect size (-.49). Also, a significant, positive correlation is displayed for novelty
effect and effect size (.30).
In other words, for all studies, as length of treatment, sample size, and homogeneity of
variance increased, effect size decreased. These attributes are also indicators of study quality, so
it makes sense that improvements in each of them would reduce effect size. Within the same
table however, it should be noted, that a significant, small, positive correlation (.28) exists
49
between design quality and effect size. Thus, as a researcher introduced randomization, he
increased the effect of his treatment, if, as in the case of this sample of studies, he also conducted
a lengthy study, with a large sample of two homogeneous groups. This phenomenon is more
noticeable in Appendix R, where only studies using randomization of treatment are considered.
The only significant correlation remaining is the moderate, negative relationship between
homogeneity of variance and effect size.
Other study characteristics also seem to have an impact on effect size. See Appendices K
through P. Whether all or only “good” studies are considered, published studies yielded larger
effects than unpublished studies. Studies with a novelty effect also produced larger effects than
those without it, whether all or only “good” studies are examined. Where outcome measure is the
focus, studies using a standardized assessment yielded smaller effect sizes than those using an
experimenter-designed instrument in the case of all studies. Where only “good” studies are
considered, this trend is reversed.
Apparently, the Direct Instruction (DI) category represents the most effective teaching
methods for all studies with a mean effect size of 0.55 or a movement of a typical student on a
normal distribution curve from the 50th percentile to the 71st. When only “good” studies were
examined, DI produced an effect size of 0.67. This is still in the medium range; however, it
represents the movement of a typical student from the 50th percentile to the 75th.
Summary of Results for Each Category
At this point in the review of literature, the results from the meta-analysis are discussed.
Detailed tables replicated from Marcucci’s (1980) meta-analysis containing descriptive results
are found in Appendices C through R. Each teaching method type is defined and quantified in
terms of its effect size. Individual teaching methods will then be presented, including those found
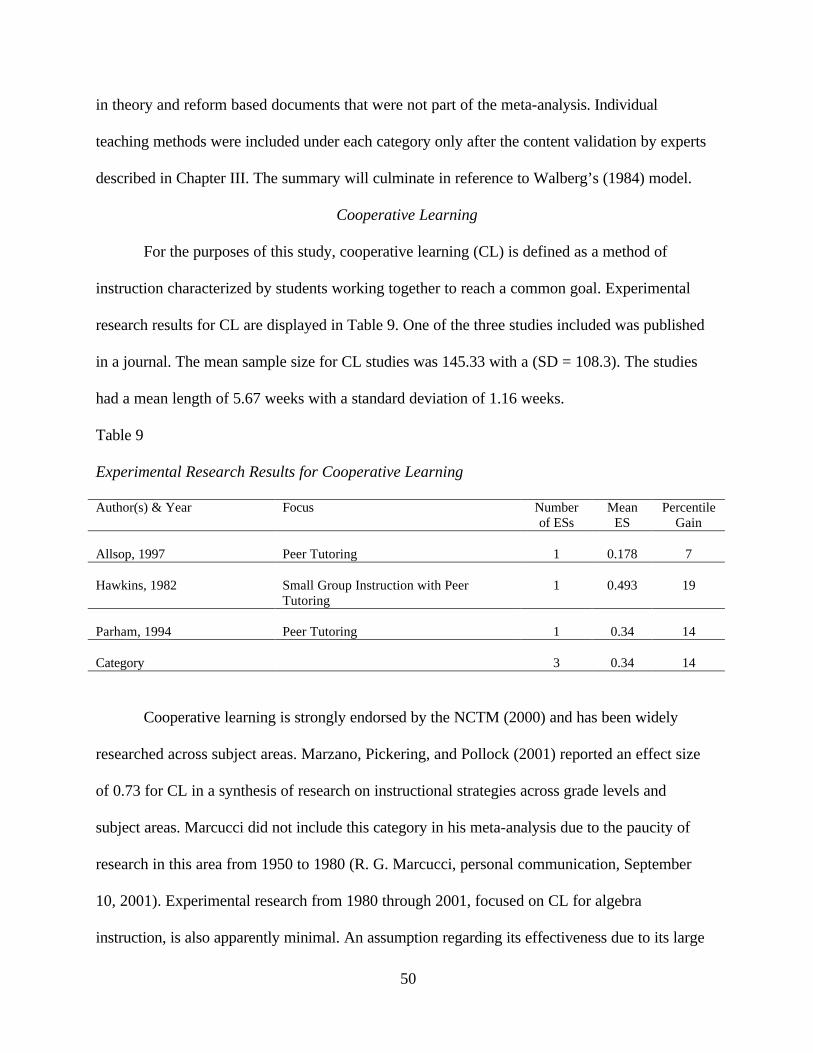
50
in theory and reform based documents that were not part of the meta-analysis. Individual
teaching methods were included under each category only after the content validation by experts
described in Chapter III. The summary will culminate in reference to Walberg’s (1984) model.
Cooperative Learning
For the purposes of this study, cooperative learning (CL) is defined as a method of
instruction characterized by students working together to reach a common goal. Experimental
research results for CL are displayed in Table 9. One of the three studies included was published
in a journal. The mean sample size for CL studies was 145.33 with a (SD = 108.3). The studies
had a mean length of 5.67 weeks with a standard deviation of 1.16 weeks.
Table 9
Experimental Research Results for Cooperative Learning
Author(s) & Year Focus Number of ESs
Mean ES
Percentile Gain
Allsop, 1997
Peer Tutoring
1
0.178
7
Hawkins, 1982
Small Group Instruction with Peer Tutoring
1
0.493
19
Parham, 1994
Peer Tutoring
1
0.34
14
Category
3
0.34
14
Cooperative learning is strongly endorsed by the NCTM (2000) and has been widely
researched across subject areas. Marzano, Pickering, and Pollock (2001) reported an effect size
of 0.73 for CL in a synthesis of research on instructional strategies across grade levels and
subject areas. Marcucci did not include this category in his meta-analysis due to the paucity of
research in this area from 1950 to 1980 (R. G. Marcucci, personal communication, September
10, 2001). Experimental research from 1980 through 2001, focused on CL for algebra
instruction, is also apparently minimal. An assumption regarding its effectiveness due to its large
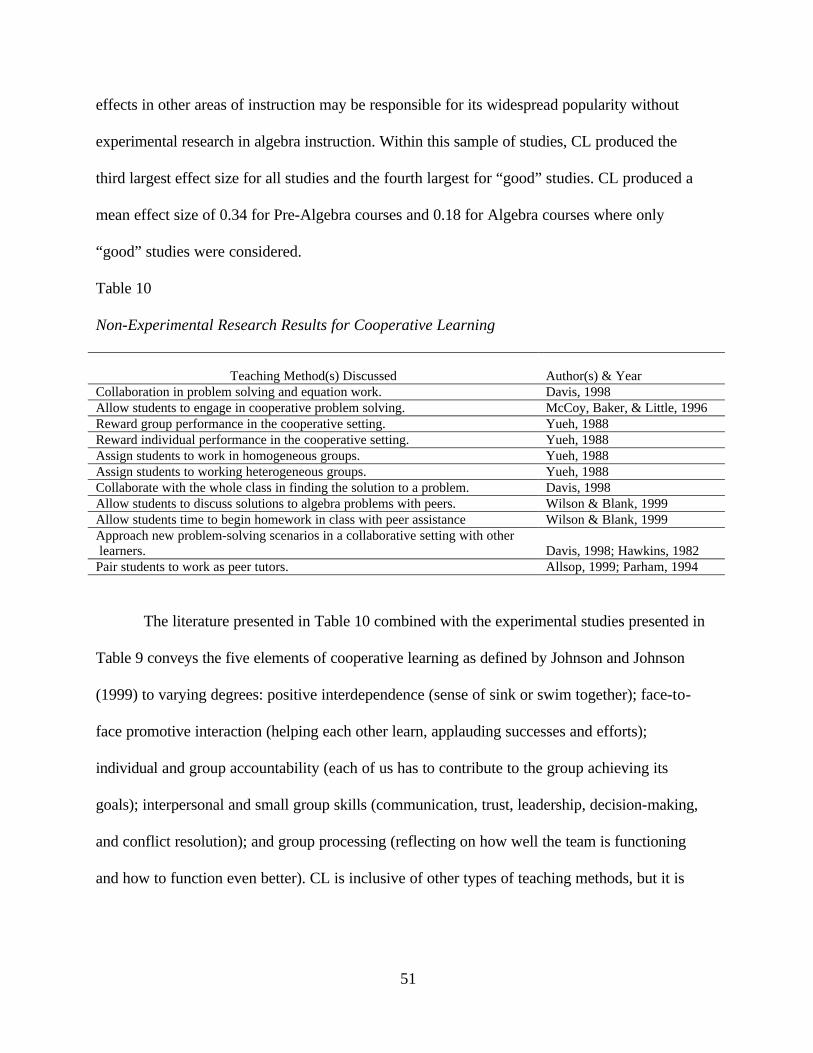
51
effects in other areas of instruction may be responsible for its widespread popularity without
experimental research in algebra instruction. Within this sample of studies, CL produced the
third largest effect size for all studies and the fourth largest for “good” studies. CL produced a
mean effect size of 0.34 for Pre-Algebra courses and 0.18 for Algebra courses where only
“good” studies were considered.
Table 10
Non-Experimental Research Results for Cooperative Learning
Teaching Method(s) Discussed
Author(s) & Year
Collaboration in problem solving and equation work. Davis, 1998 Allow students to engage in cooperative problem solving. McCoy, Baker, & Little, 1996 Reward group performance in the cooperative setting. Yueh, 1988 Reward individual performance in the cooperative setting. Yueh, 1988 Assign students to work in homogeneous groups. Yueh, 1988 Assign students to working heterogeneous groups. Yueh, 1988 Collaborate with the whole class in finding the solution to a problem. Davis, 1998 Allow students to discuss solutions to algebra problems with peers. Wilson & Blank, 1999 Allow students time to begin homework in class with peer assistance Wilson & Blank, 1999 Approach new problem-solving scenarios in a collaborative setting with other learners.
Davis, 1998; Hawkins, 1982
Pair students to work as peer tutors. Allsop, 1999; Parham, 1994
The literature presented in Table 10 combined with the experimental studies presented in
Table 9 conveys the five elements of cooperative learning as defined by Johnson and Johnson
(1999) to varying degrees: positive interdependence (sense of sink or swim together); face-to-
face promotive interaction (helping each other learn, applauding successes and efforts);
individual and group accountability (each of us has to contribute to the group achieving its
goals); interpersonal and small group skills (communication, trust, leadership, decision-making,
and conflict resolution); and group processing (reflecting on how well the team is functioning
and how to function even better). CL is inclusive of other types of teaching methods, but it is
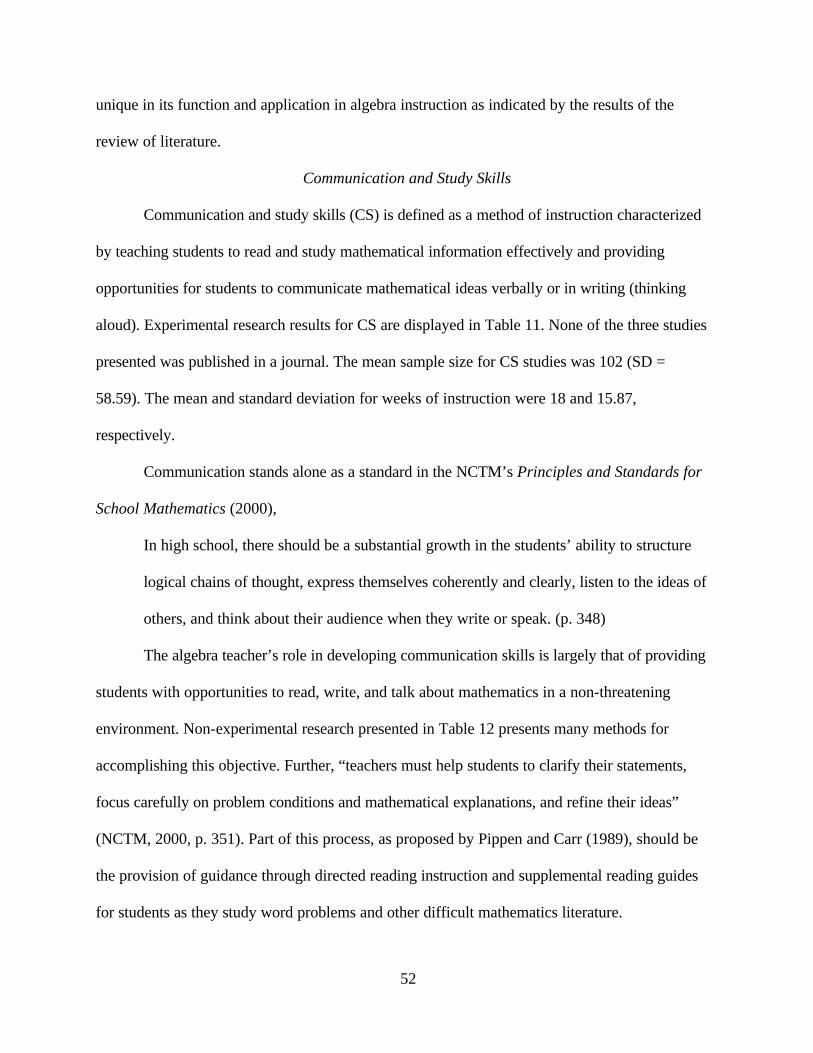
52
unique in its function and application in algebra instruction as indicated by the results of the
review of literature.
Communication and Study Skills
Communication and study skills (CS) is defined as a method of instruction characterized
by teaching students to read and study mathematical information effectively and providing
opportunities for students to communicate mathematical ideas verbally or in writing (thinking
aloud). Experimental research results for CS are displayed in Table 11. None of the three studies
presented was published in a journal. The mean sample size for CS studies was 102 (SD =
58.59). The mean and standard deviation for weeks of instruction were 18 and 15.87,
respectively.
Communication stands alone as a standard in the NCTM’s Principles and Standards for
School Mathematics (2000),
In high school, there should be a substantial growth in the students’ ability to structure
logical chains of thought, express themselves coherently and clearly, listen to the ideas of
others, and think about their audience when they write or speak. (p. 348)
The algebra teacher’s role in developing communication skills is largely that of providing
students with opportunities to read, write, and talk about mathematics in a non-threatening
environment. Non-experimental research presented in Table 12 presents many methods for
accomplishing this objective. Further, “teachers must help students to clarify their statements,
focus carefully on problem conditions and mathematical explanations, and refine their ideas”
(NCTM, 2000, p. 351). Part of this process, as proposed by Pippen and Carr (1989), should be
the provision of guidance through directed reading instruction and supplemental reading guides
for students as they study word problems and other difficult mathematics literature.
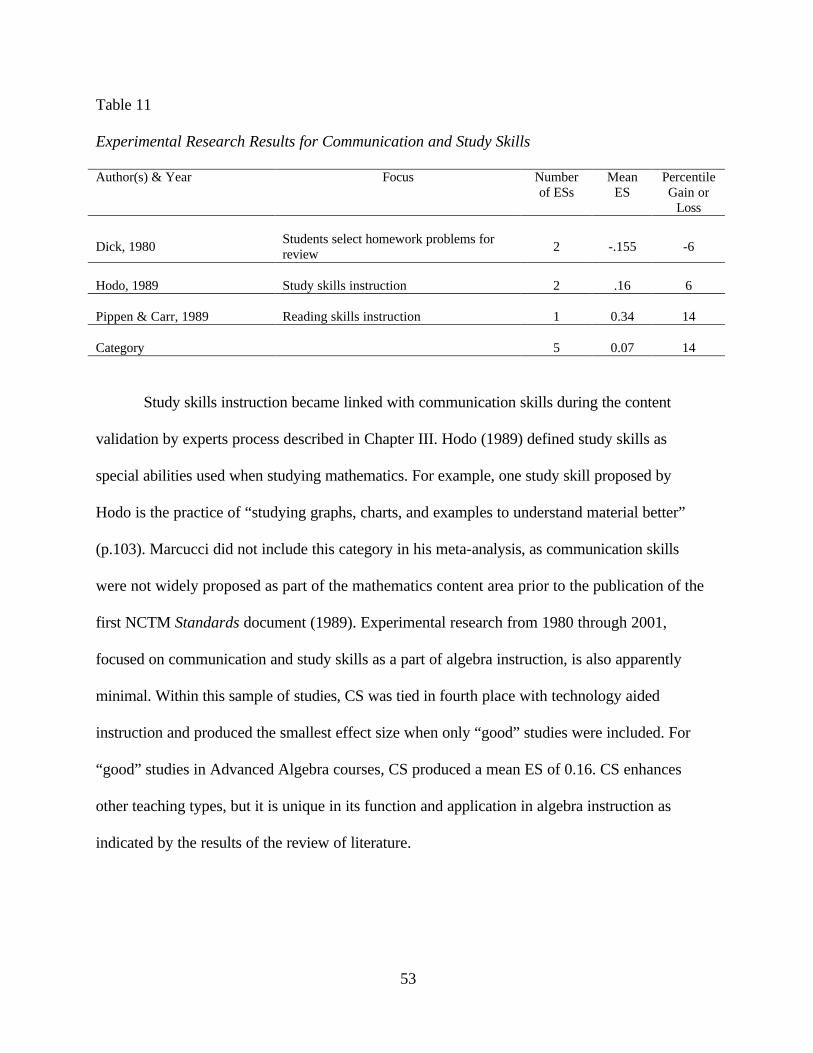
53
Table 11
Experimental Research Results for Communication and Study Skills
Author(s) & Year Focus Number of ESs
Mean ES
Percentile Gain or
Loss
Dick, 1980
Students select homework problems for review
2
-.155
-6
Hodo, 1989
Study skills instruction
2
.16
6
Pippen & Carr, 1989
Reading skills instruction
1
0.34
14
Category
5
0.07
14
Study skills instruction became linked with communication skills during the content
validation by experts process described in Chapter III. Hodo (1989) defined study skills as
special abilities used when studying mathematics. For example, one study skill proposed by
Hodo is the practice of “studying graphs, charts, and examples to understand material better”
(p.103). Marcucci did not include this category in his meta-analysis, as communication skills
were not widely proposed as part of the mathematics content area prior to the publication of the
first NCTM Standards document (1989). Experimental research from 1980 through 2001,
focused on communication and study skills as a part of algebra instruction, is also apparently
minimal. Within this sample of studies, CS was tied in fourth place with technology aided
instruction and produced the smallest effect size when only “good” studies were included. For
“good” studies in Advanced Algebra courses, CS produced a mean ES of 0.16. CS enhances
other teaching types, but it is unique in its function and application in algebra instruction as
indicated by the results of the review of literature.
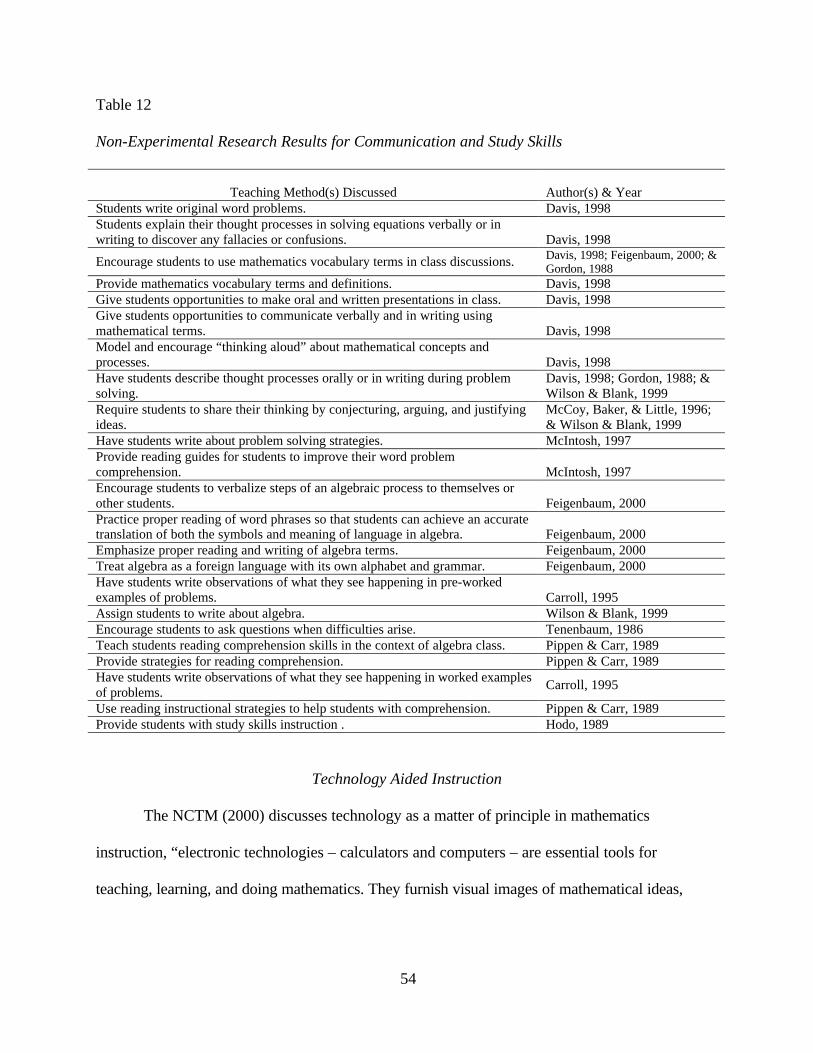
54
Table 12
Non-Experimental Research Results for Communication and Study Skills
Teaching Method(s) Discussed
Author(s) & Year
Students write original word problems. Davis, 1998 Students explain their thought processes in solving equations verbally or in writing to discover any fallacies or confusions.
Davis, 1998
Encourage students to use mathematics vocabulary terms in class discussions. Davis, 1998; Feigenbaum, 2000; & Gordon, 1988
Provide mathematics vocabulary terms and definitions. Davis, 1998 Give students opportunities to make oral and written presentations in class. Davis, 1998 Give students opportunities to communicate verbally and in writing using mathematical terms.
Davis, 1998
Model and encourage “thinking aloud” about mathematical concepts and processes.
Davis, 1998
Have students describe thought processes orally or in writing during problem solving.
Davis, 1998; Gordon, 1988; & Wilson & Blank, 1999
Require students to share their thinking by conjecturing, arguing, and justifying ideas.
McCoy, Baker, & Little, 1996; & Wilson & Blank, 1999
Have students write about problem solving strategies. McIntosh, 1997 Provide reading guides for students to improve their word problem comprehension.
McIntosh, 1997
Encourage students to verbalize steps of an algebraic process to themselves or other students.
Feigenbaum, 2000
Practice proper reading of word phrases so that students can achieve an accurate translation of both the symbols and meaning of language in algebra.
Feigenbaum, 2000
Emphasize proper reading and writing of algebra terms. Feigenbaum, 2000 Treat algebra as a foreign language with its own alphabet and grammar. Feigenbaum, 2000 Have students write observations of what they see happening in pre-worked examples of problems.
Carroll, 1995
Assign students to write about algebra. Wilson & Blank, 1999 Encourage students to ask questions when difficulties arise. Tenenbaum, 1986 Teach students reading comprehension skills in the context of algebra class. Pippen & Carr, 1989 Provide strategies for reading comprehension. Pippen & Carr, 1989 Have students write observations of what they see happening in worked examples of problems.
Carroll, 1995
Use reading instructional strategies to help students with comprehension. Pippen & Carr, 1989 Provide students with study skills instruction . Hodo, 1989
Technology Aided Instruction
The NCTM (2000) discusses technology as a matter of principle in mathematics
instruction, “electronic technologies – calculators and computers – are essential tools for
teaching, learning, and doing mathematics. They furnish visual images of mathematical ideas,
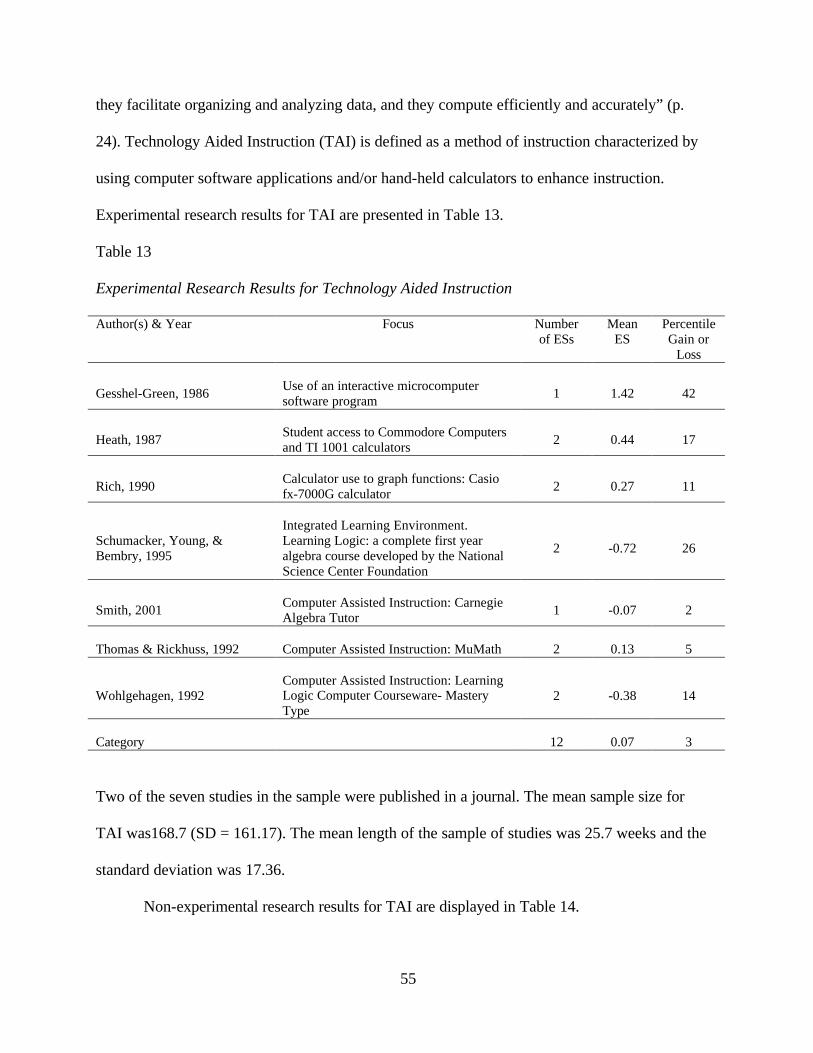
55
they facilitate organizing and analyzing data, and they compute efficiently and accurately” (p.
24). Technology Aided Instruction (TAI) is defined as a method of instruction characterized by
using computer software applications and/or hand-held calculators to enhance instruction.
Experimental research results for TAI are presented in Table 13.
Table 13
Experimental Research Results for Technology Aided Instruction
Author(s) & Year Focus Number of ESs
Mean ES
Percentile Gain or
Loss
Gesshel-Green, 1986
Use of an interactive microcomputer software program
1
1.42
42
Heath, 1987
Student access to Commodore Computers and TI 1001 calculators
2
0.44
17
Rich, 1990
Calculator use to graph functions: Casio fx-7000G calculator
2
0.27
11
Schumacker, Young, & Bembry, 1995
Integrated Learning Environment. Learning Logic: a complete first year algebra course developed by the National Science Center Foundation
2
-0.72
26
Smith, 2001
Computer Assisted Instruction: Carnegie Algebra Tutor
1
-0.07
2
Thomas & Rickhuss, 1992
Computer Assisted Instruction: MuMath
2
0.13
5
Wohlgehagen, 1992
Computer Assisted Instruction: Learning Logic Computer Courseware- Mastery Type
2
-0.38
14
Category
12
0.07
3
Two of the seven studies in the sample were published in a journal. The mean sample size for
TAI was168.7 (SD = 161.17). The mean length of the sample of studies was 25.7 weeks and the
standard deviation was 17.36.
Non-experimental research results for TAI are displayed in Table 14.
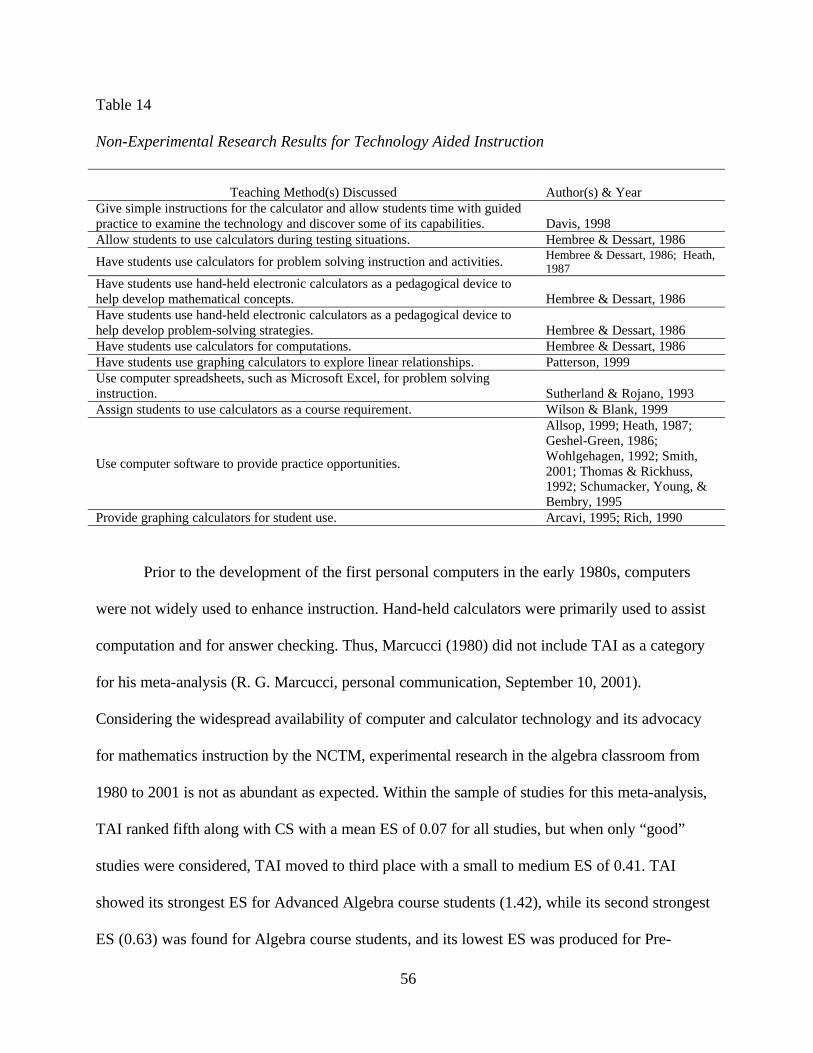
56
Table 14
Non-Experimental Research Results for Technology Aided Instruction
Teaching Method(s) Discussed
Author(s) & Year
Give simple instructions for the calculator and allow students time with guided practice to examine the technology and discover some of its capabilities.
Davis, 1998
Allow students to use calculators during testing situations. Hembree & Dessart, 1986
Have students use calculators for problem solving instruction and activities. Hembree & Dessart, 1986; Heath, 1987
Have students use hand-held electronic calculators as a pedagogical device to help develop mathematical concepts.
Hembree & Dessart, 1986
Have students use hand-held electronic calculators as a pedagogical device to help develop problem-solving strategies.
Hembree & Dessart, 1986
Have students use calculators for computations. Hembree & Dessart, 1986 Have students use graphing calculators to explore linear relationships. Patterson, 1999 Use computer spreadsheets, such as Microsoft Excel, for problem solving instruction.
Sutherland & Rojano, 1993
Assign students to use calculators as a course requirement. Wilson & Blank, 1999
Use computer software to provide practice opportunities.
Allsop, 1999; Heath, 1987; Geshel-Green, 1986; Wohlgehagen, 1992; Smith, 2001; Thomas & Rickhuss, 1992; Schumacker, Young, & Bembry, 1995
Provide graphing calculators for student use. Arcavi, 1995; Rich, 1990
Prior to the development of the first personal computers in the early 1980s, computers
were not widely used to enhance instruction. Hand-held calculators were primarily used to assist
computation and for answer checking. Thus, Marcucci (1980) did not include TAI as a category
for his meta-analysis (R. G. Marcucci, personal communication, September 10, 2001).
Considering the widespread availability of computer and calculator technology and its advocacy
for mathematics instruction by the NCTM, experimental research in the algebra classroom from
1980 to 2001 is not as abundant as expected. Within the sample of studies for this meta-analysis,
TAI ranked fifth along with CS with a mean ES of 0.07 for all studies, but when only “good”
studies were considered, TAI moved to third place with a small to medium ES of 0.41. TAI
showed its strongest ES for Advanced Algebra course students (1.42), while its second strongest
ES (0.63) was found for Algebra course students, and its lowest ES was produced for Pre-
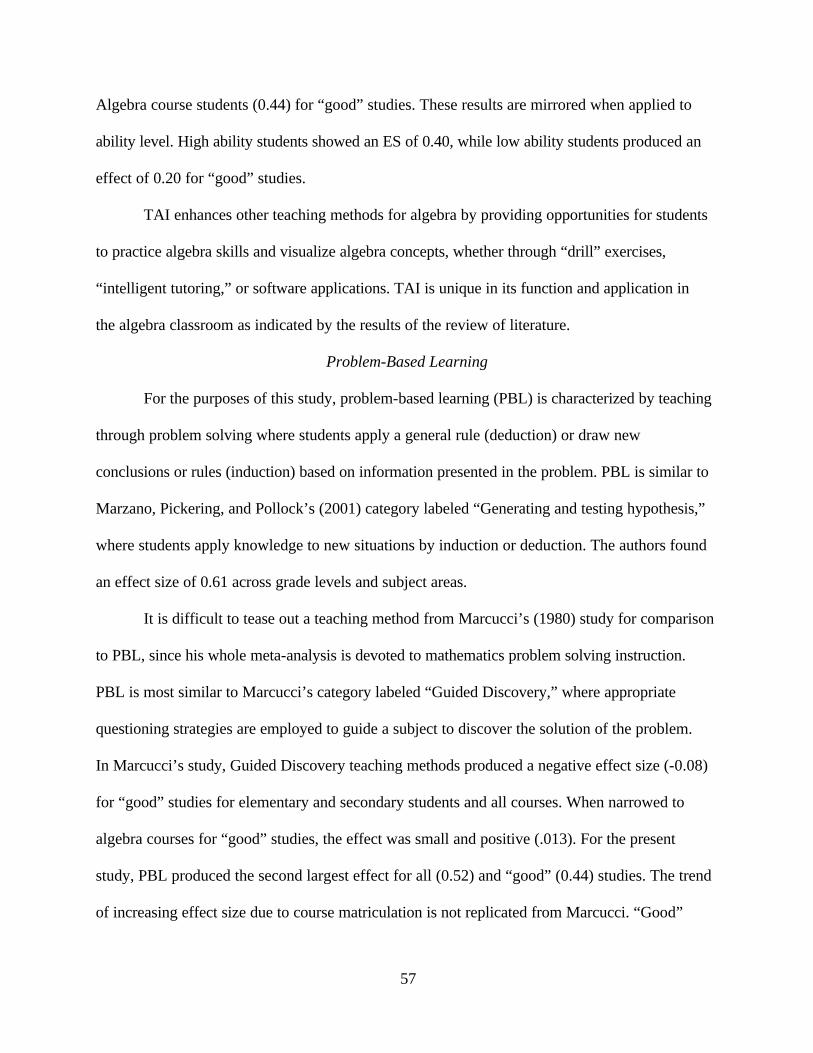
57
Algebra course students (0.44) for “good” studies. These results are mirrored when applied to
ability level. High ability students showed an ES of 0.40, while low ability students produced an
effect of 0.20 for “good” studies.
TAI enhances other teaching methods for algebra by providing opportunities for students
to practice algebra skills and visualize algebra concepts, whether through “drill” exercises,
“intelligent tutoring,” or software applications. TAI is unique in its function and application in
the algebra classroom as indicated by the results of the review of literature.
Problem-Based Learning
For the purposes of this study, problem-based learning (PBL) is characterized by teaching
through problem solving where students apply a general rule (deduction) or draw new
conclusions or rules (induction) based on information presented in the problem. PBL is similar to
Marzano, Pickering, and Pollock’s (2001) category labeled “Generating and testing hypothesis,”
where students apply knowledge to new situations by induction or deduction. The authors found
an effect size of 0.61 across grade levels and subject areas.
It is difficult to tease out a teaching method from Marcucci’s (1980) study for comparison
to PBL, since his whole meta-analysis is devoted to mathematics problem solving instruction.
PBL is most similar to Marcucci’s category labeled “Guided Discovery,” where appropriate
questioning strategies are employed to guide a subject to discover the solution of the problem.
In Marcucci’s study, Guided Discovery teaching methods produced a negative effect size (-0.08)
for “good” studies for elementary and secondary students and all courses. When narrowed to
algebra courses for “good” studies, the effect was small and positive (.013). For the present
study, PBL produced the second largest effect for all (0.52) and “good” (0.44) studies. The trend
of increasing effect size due to course matriculation is not replicated from Marcucci. “Good”
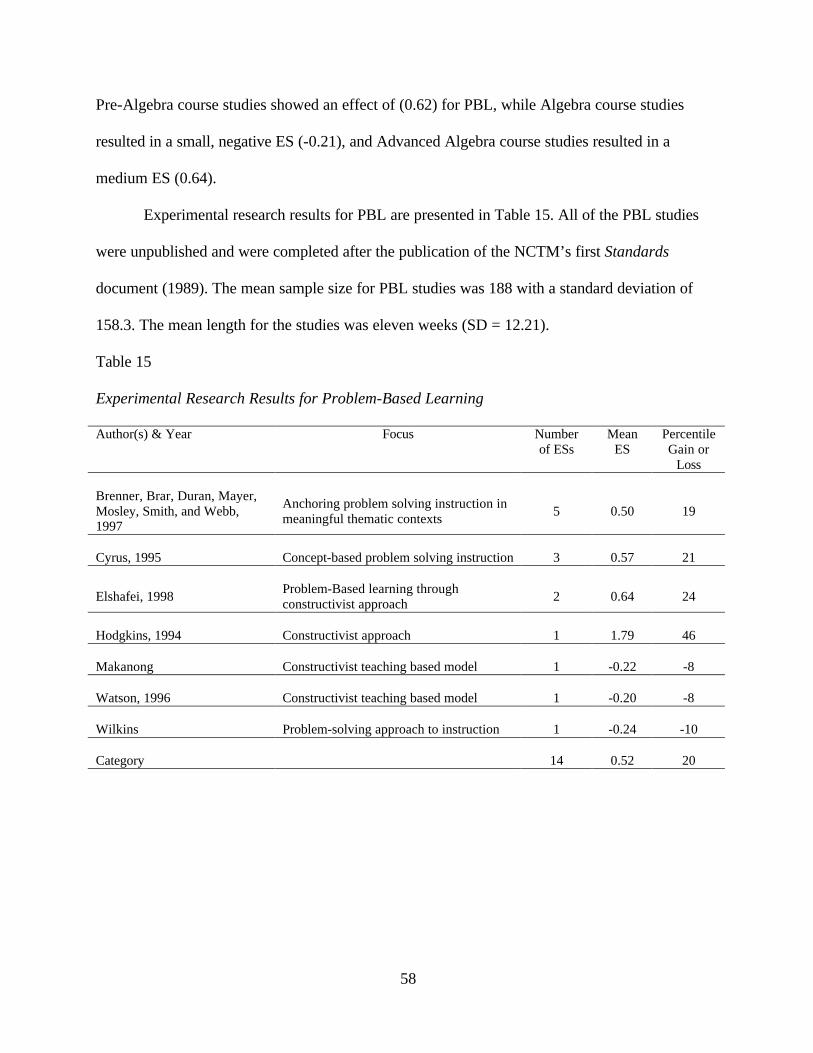
58
Pre-Algebra course studies showed an effect of (0.62) for PBL, while Algebra course studies
resulted in a small, negative ES (-0.21), and Advanced Algebra course studies resulted in a
medium ES (0.64).
Experimental research results for PBL are presented in Table 15. All of the PBL studies
were unpublished and were completed after the publication of the NCTM’s first Standards
document (1989). The mean sample size for PBL studies was 188 with a standard deviation of
158.3. The mean length for the studies was eleven weeks (SD = 12.21).
Table 15
Experimental Research Results for Problem-Based Learning
Author(s) & Year Focus Number of ESs
Mean ES
Percentile Gain or
Loss Brenner, Brar, Duran, Mayer, Mosley, Smith, and Webb, 1997
Anchoring problem solving instruction in meaningful thematic contexts
5
0.50
19
Cyrus, 1995
Concept-based problem solving instruction
3
0.57
21
Elshafei, 1998
Problem-Based learning through constructivist approach
2
0.64
24
Hodgkins, 1994
Constructivist approach
1
1.79
46
Makanong
Constructivist teaching based model
1
-0.22
-8
Watson, 1996
Constructivist teaching based model
1
-0.20
-8
Wilkins
Problem-solving approach to instruction
1
-0.24
-10
Category
14
0.52
20
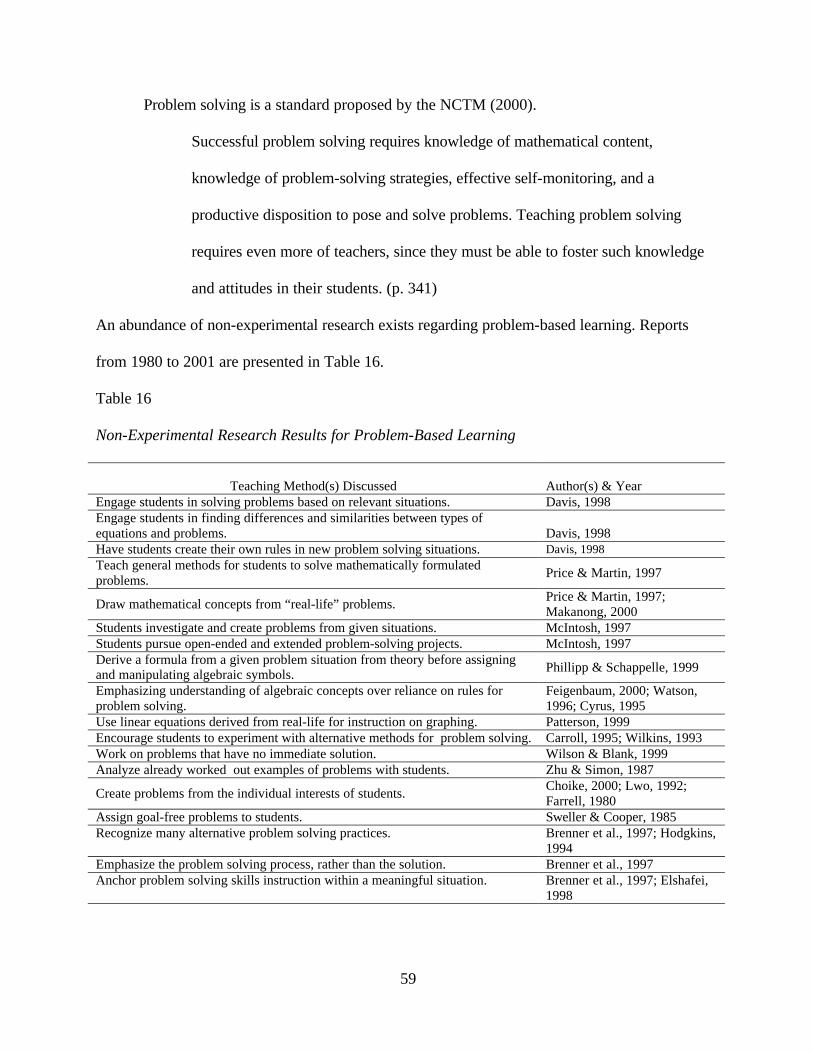
59
Problem solving is a standard proposed by the NCTM (2000).
Successful problem solving requires knowledge of mathematical content,
knowledge of problem-solving strategies, effective self-monitoring, and a
productive disposition to pose and solve problems. Teaching problem solving
requires even more of teachers, since they must be able to foster such knowledge
and attitudes in their students. (p. 341)
An abundance of non-experimental research exists regarding problem-based learning. Reports
from 1980 to 2001 are presented in Table 16.
Table 16
Non-Experimental Research Results for Problem-Based Learning
Teaching Method(s) Discussed
Author(s) & Year
Engage students in solving problems based on relevant situations. Davis, 1998 Engage students in finding differences and similarities between types of equations and problems.
Davis, 1998
Have students create their own rules in new problem solving situations. Davis, 1998 Teach general methods for students to solve mathematically formulated problems.
Price & Martin, 1997
Draw mathematical concepts from “real-life” problems. Price & Martin, 1997; Makanong, 2000
Students investigate and create problems from given situations. McIntosh, 1997 Students pursue open-ended and extended problem-solving projects. McIntosh, 1997 Derive a formula from a given problem situation from theory before assigning and manipulating algebraic symbols. Phillipp & Schappelle, 1999
Emphasizing understanding of algebraic concepts over reliance on rules for problem solving.
Feigenbaum, 2000; Watson, 1996; Cyrus, 1995
Use linear equations derived from real-life for instruction on graphing. Patterson, 1999 Encourage students to experiment with alternative methods for problem solving. Carroll, 1995; Wilkins, 1993 Work on problems that have no immediate solution. Wilson & Blank, 1999 Analyze already worked out examples of problems with students. Zhu & Simon, 1987
Create problems from the individual interests of students. Choike, 2000; Lwo, 1992; Farrell, 1980
Assign goal-free problems to students. Sweller & Cooper, 1985 Recognize many alternative problem solving practices.
Brenner et al., 1997; Hodgkins, 1994
Emphasize the problem solving process, rather than the solution. Brenner et al., 1997 Anchor problem solving skills instruction within a meaningful situation.
Brenner et al., 1997; Elshafei, 1998
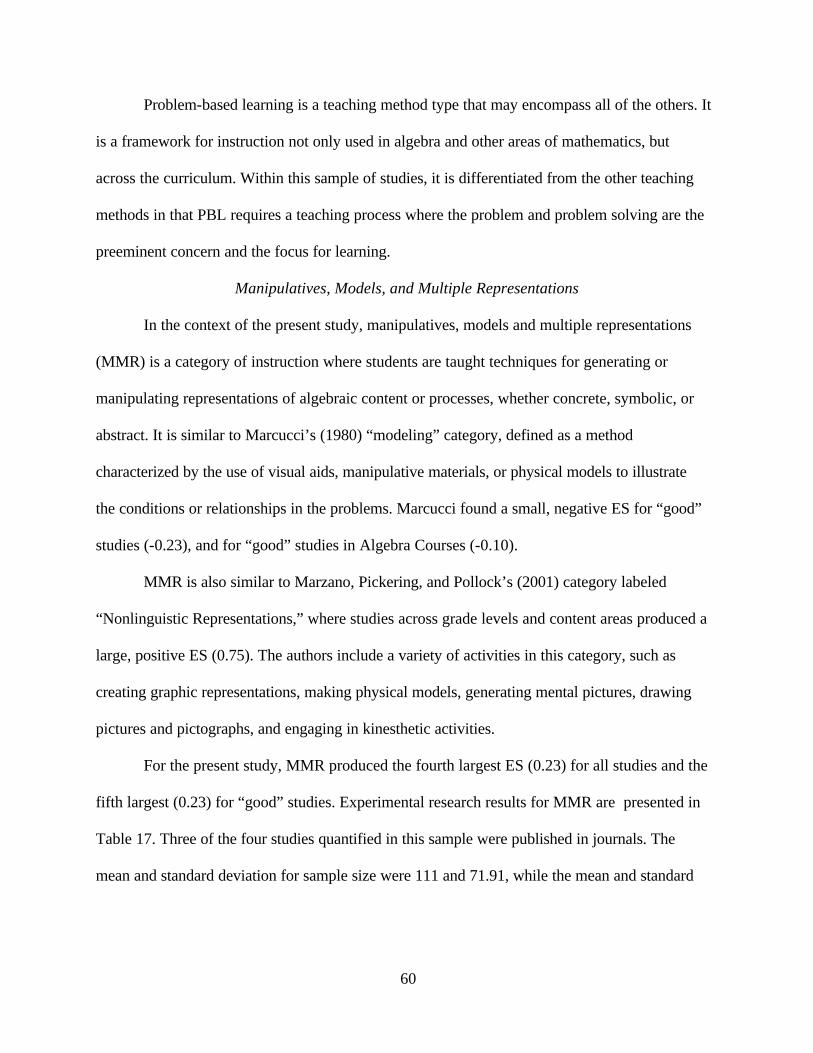
60
Problem-based learning is a teaching method type that may encompass all of the others. It
is a framework for instruction not only used in algebra and other areas of mathematics, but
across the curriculum. Within this sample of studies, it is differentiated from the other teaching
methods in that PBL requires a teaching process where the problem and problem solving are the
preeminent concern and the focus for learning.
Manipulatives, Models, and Multiple Representations
In the context of the present study, manipulatives, models and multiple representations
(MMR) is a category of instruction where students are taught techniques for generating or
manipulating representations of algebraic content or processes, whether concrete, symbolic, or
abstract. It is similar to Marcucci’s (1980) “modeling” category, defined as a method
characterized by the use of visual aids, manipulative materials, or physical models to illustrate
the conditions or relationships in the problems. Marcucci found a small, negative ES for “good”
studies (-0.23), and for “good” studies in Algebra Courses (-0.10).
MMR is also similar to Marzano, Pickering, and Pollock’s (2001) category labeled
“Nonlinguistic Representations,” where studies across grade levels and content areas produced a
large, positive ES (0.75). The authors include a variety of activities in this category, such as
creating graphic representations, making physical models, generating mental pictures, drawing
pictures and pictographs, and engaging in kinesthetic activities.
For the present study, MMR produced the fourth largest ES (0.23) for all studies and the
fifth largest (0.23) for “good” studies. Experimental research results for MMR are presented in
Table 17. Three of the four studies quantified in this sample were published in journals. The
mean and standard deviation for sample size were 111 and 71.91, while the mean and standard
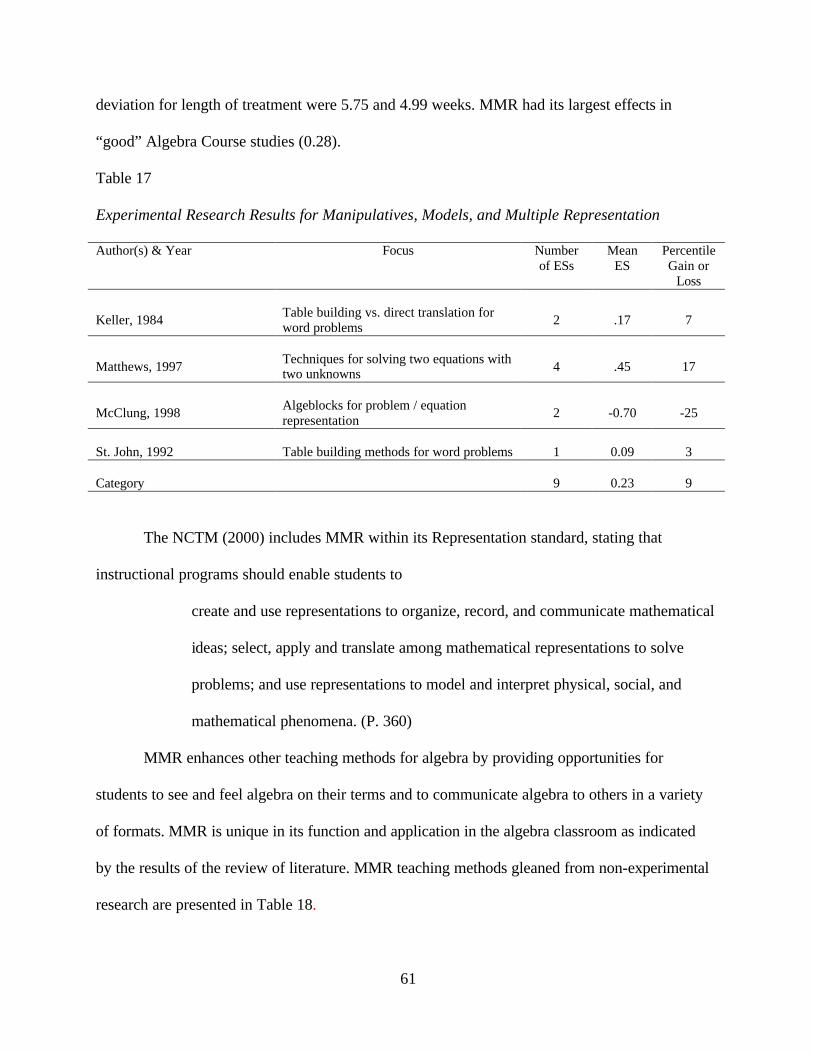
61
deviation for length of treatment were 5.75 and 4.99 weeks. MMR had its largest effects in
“good” Algebra Course studies (0.28).
Table 17
Experimental Research Results for Manipulatives, Models, and Multiple Representation
Author(s) & Year Focus Number of ESs
Mean ES
Percentile Gain or
Loss
Keller, 1984
Table building vs. direct translation for word problems
2
.17
7
Matthews, 1997
Techniques for solving two equations with two unknowns
4
.45
17
McClung, 1998
Algeblocks for problem / equation representation
2
-0.70
-25
St. John, 1992
Table building methods for word problems
1
0.09
3
Category
9
0.23
9
The NCTM (2000) includes MMR within its Representation standard, stating that
instructional programs should enable students to
create and use representations to organize, record, and communicate mathematical
ideas; select, apply and translate among mathematical representations to solve
problems; and use representations to model and interpret physical, social, and
mathematical phenomena. (P. 360)
MMR enhances other teaching methods for algebra by providing opportunities for
students to see and feel algebra on their terms and to communicate algebra to others in a variety
of formats. MMR is unique in its function and application in the algebra classroom as indicated
by the results of the review of literature. MMR teaching methods gleaned from non-experimental
research are presented in Table 18.
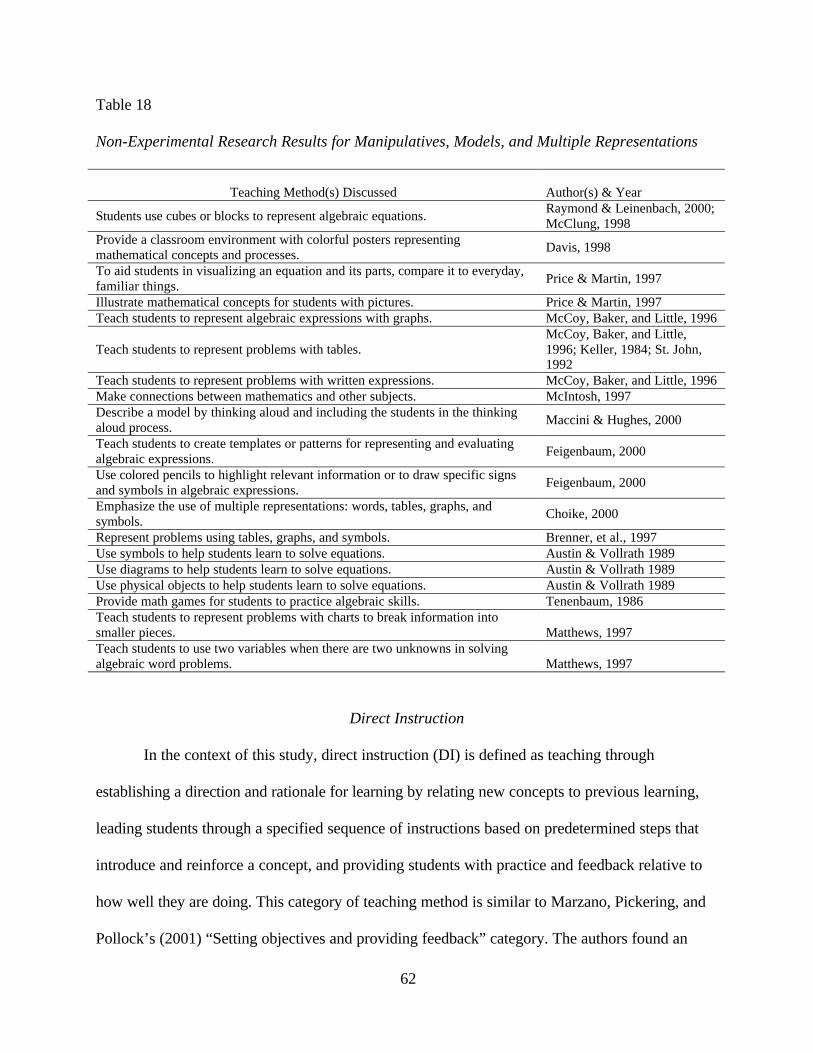
62
Table 18
Non-Experimental Research Results for Manipulatives, Models, and Multiple Representations
Teaching Method(s) Discussed
Author(s) & Year
Students use cubes or blocks to represent algebraic equations. Raymond & Leinenbach, 2000; McClung, 1998
Provide a classroom environment with colorful posters representing mathematical concepts and processes.
Davis, 1998
To aid students in visualizing an equation and its parts, compare it to everyday, familiar things.
Price & Martin, 1997
Illustrate mathematical concepts for students with pictures. Price & Martin, 1997 Teach students to represent algebraic expressions with graphs. McCoy, Baker, and Little, 1996
Teach students to represent problems with tables. McCoy, Baker, and Little, 1996; Keller, 1984; St. John, 1992
Teach students to represent problems with written expressions. McCoy, Baker, and Little, 1996 Make connections between mathematics and other subjects. McIntosh, 1997 Describe a model by thinking aloud and including the students in the thinking aloud process.
Maccini & Hughes, 2000
Teach students to create templates or patterns for representing and evaluating algebraic expressions.
Feigenbaum, 2000
Use colored pencils to highlight relevant information or to draw specific signs and symbols in algebraic expressions.
Feigenbaum, 2000
Emphasize the use of multiple representations: words, tables, graphs, and symbols.
Choike, 2000
Represent problems using tables, graphs, and symbols. Brenner, et al., 1997 Use symbols to help students learn to solve equations. Austin & Vollrath 1989 Use diagrams to help students learn to solve equations. Austin & Vollrath 1989 Use physical objects to help students learn to solve equations. Austin & Vollrath 1989 Provide math games for students to practice algebraic skills. Tenenbaum, 1986 Teach students to represent problems with charts to break information into smaller pieces.
Matthews, 1997
Teach students to use two variables when there are two unknowns in solving algebraic word problems.
Matthews, 1997
Direct Instruction
In the context of this study, direct instruction (DI) is defined as teaching through
establishing a direction and rationale for learning by relating new concepts to previous learning,
leading students through a specified sequence of instructions based on predetermined steps that
introduce and reinforce a concept, and providing students with practice and feedback relative to
how well they are doing. This category of teaching method is similar to Marzano, Pickering, and
Pollock’s (2001) “Setting objectives and providing feedback” category. The authors found an
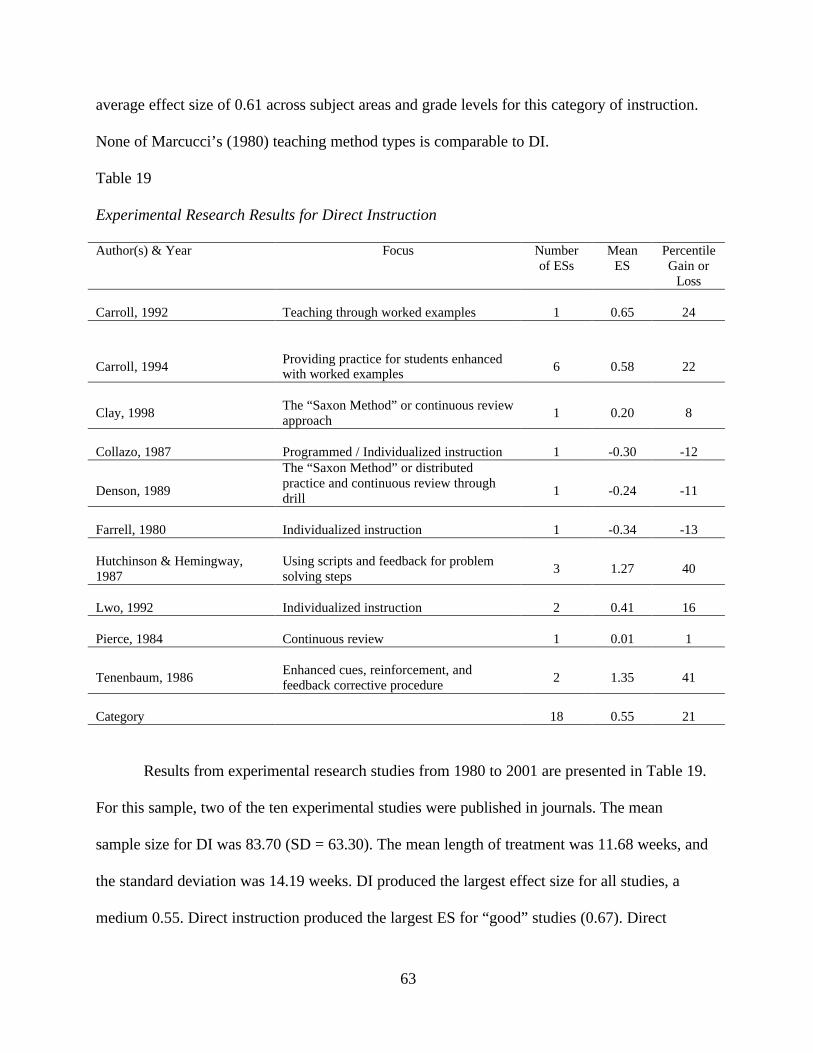
63
average effect size of 0.61 across subject areas and grade levels for this category of instruction.
None of Marcucci’s (1980) teaching method types is comparable to DI.
Table 19
Experimental Research Results for Direct Instruction
Author(s) & Year Focus Number of ESs
Mean ES
Percentile Gain or
Loss Carroll, 1992
Teaching through worked examples
1
0.65
24
Carroll, 1994
Providing practice for students enhanced with worked examples
6
0.58
22
Clay, 1998
The “Saxon Method” or continuous review approach
1
0.20
8
Collazo, 1987
Programmed / Individualized instruction
1
-0.30
-12
Denson, 1989
The “Saxon Method” or distributed practice and continuous review through drill
1
-0.24
-11
Farrell, 1980
Individualized instruction
1
-0.34
-13
Hutchinson & Hemingway, 1987
Using scripts and feedback for problem solving steps
3
1.27
40
Lwo, 1992
Individualized instruction
2
0.41
16
Pierce, 1984
Continuous review
1
0.01
1
Tenenbaum, 1986
Enhanced cues, reinforcement, and feedback corrective procedure
2
1.35
41
Category
18
0.55
21
Results from experimental research studies from 1980 to 2001 are presented in Table 19.
For this sample, two of the ten experimental studies were published in journals. The mean
sample size for DI was 83.70 (SD = 63.30). The mean length of treatment was 11.68 weeks, and
the standard deviation was 14.19 weeks. DI produced the largest effect size for all studies, a
medium 0.55. Direct instruction produced the largest ES for “good” studies (0.67). Direct
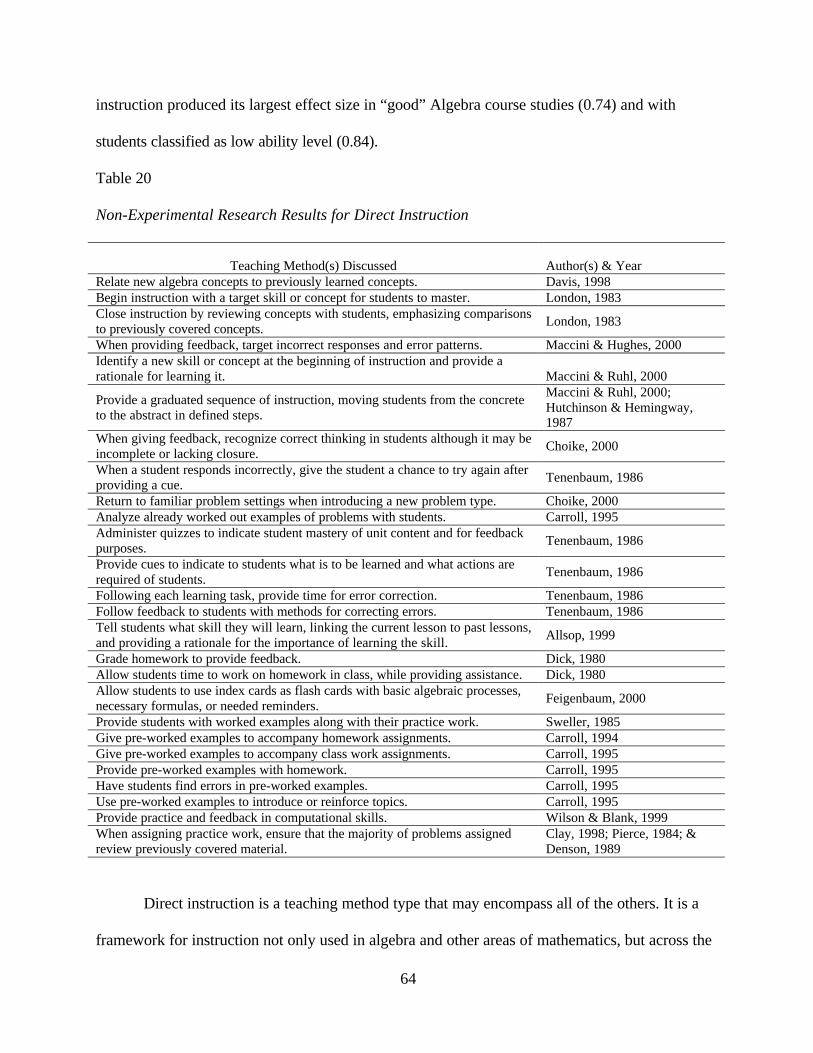
64
instruction produced its largest effect size in “good” Algebra course studies (0.74) and with
students classified as low ability level (0.84).
Table 20
Non-Experimental Research Results for Direct Instruction
Teaching Method(s) Discussed
Author(s) & Year
Relate new algebra concepts to previously learned concepts. Davis, 1998 Begin instruction with a target skill or concept for students to master. London, 1983 Close instruction by reviewing concepts with students, emphasizing comparisons to previously covered concepts.
London, 1983
When providing feedback, target incorrect responses and error patterns. Maccini & Hughes, 2000 Identify a new skill or concept at the beginning of instruction and provide a rationale for learning it.
Maccini & Ruhl, 2000
Provide a graduated sequence of instruction, moving students from the concrete to the abstract in defined steps.
Maccini & Ruhl, 2000; Hutchinson & Hemingway, 1987
When giving feedback, recognize correct thinking in students although it may be incomplete or lacking closure.
Choike, 2000
When a student responds incorrectly, give the student a chance to try again after providing a cue.
Tenenbaum, 1986
Return to familiar problem settings when introducing a new problem type. Choike, 2000 Analyze already worked out examples of problems with students. Carroll, 1995 Administer quizzes to indicate student mastery of unit content and for feedback purposes.
Tenenbaum, 1986
Provide cues to indicate to students what is to be learned and what actions are required of students.
Tenenbaum, 1986
Following each learning task, provide time for error correction. Tenenbaum, 1986 Follow feedback to students with methods for correcting errors. Tenenbaum, 1986 Tell students what skill they will learn, linking the current lesson to past lessons, and providing a rationale for the importance of learning the skill.
Allsop, 1999
Grade homework to provide feedback. Dick, 1980 Allow students time to work on homework in class, while providing assistance. Dick, 1980 Allow students to use index cards as flash cards with basic algebraic processes, necessary formulas, or needed reminders.
Feigenbaum, 2000
Provide students with worked examples along with their practice work. Sweller, 1985 Give pre-worked examples to accompany homework assignments. Carroll, 1994 Give pre-worked examples to accompany class work assignments. Carroll, 1995 Provide pre-worked examples with homework. Carroll, 1995 Have students find errors in pre-worked examples. Carroll, 1995 Use pre-worked examples to introduce or reinforce topics. Carroll, 1995 Provide practice and feedback in computational skills. Wilson & Blank, 1999 When assigning practice work, ensure that the majority of problems assigned review previously covered material.
Clay, 1998; Pierce, 1984; & Denson, 1989
Direct instruction is a teaching method type that may encompass all of the others. It is a
framework for instruction not only used in algebra and other areas of mathematics, but across the
65
curriculum. Within this sample of studies, it is differentiated from the other teaching methods in
that DI requires a focused skill or concept mastery as the preeminent concern and the focus for
learning.
Summary and Application of Meta-Analysis Results
According to Walberg (1984), the educational leader must concentrate on improving the
quality of instruction the student is receiving. This is the only factor within the realm of the
principal’s and teacher’s direct control. The opening sections of Chapter II presented a proposal
for mathematics instruction reform that has long been advanced by the NCTM and other
educational organizations. This meta-analysis of experimental research studies on teaching
methods for algebra from 1980 to 2001 covers the span of time from three years before the
publication of A Nation at Risk (1983) through the publication of all of the NCTM Standards
documents.
From this quantitative review of literature, six categories of instruction were derived:
cooperative learning; communication and study skills; technology aided instruction; problem-
based learning; manipulatives, models, and multiple representations; and direct instruction. Each
has yielded a positive effect size for algebra instruction, with direct instruction presenting the
largest effect. To augment the quantitative review of literature, teaching methods from non-
experimental research reports are presented. Experts placed teaching methods in each category,
as outlined in Chapter III. These method descriptions serve to provide flesh to the skeleton laid
out as teaching method categories. In culminating this study, the results of the meta-analysis are
applied to determine the influence of teaching methodology on student achievement on the SOL
assessment for Algebra I, the most current standardized assessment offered to students in the
Commonwealth of Virginia.
66
Multiple Regression Analysis
According to Gay (1996) and Gall, Borg, and Gall (1996), meta-analysis has three
important attributes that make it a powerful tool for integrating research: focus on the magnitude
of the effect observed in each study, provision of an effect size, and determination of study
features that affect the results of the review.
There are also three drawbacks to relying on a meta-analysis of previous research to
provide results for current practitioners. First, studies integrated, in this case in particular, use
various assessments (experimenter and standardized) not necessarily related to the assessment
used currently for high stakes testing. In this case, Virginia’s Algebra I teachers may be
primarily interested in the relationship between teaching methods and student achievement on
the SOL assessment, rather than various other assessments. The second disadvantage to meta-
analysis as discussed by Marcucci (1980) is that it does not explore the relationship between
experimental treatments. In this case, teaching method types can be compared based on their
effect sizes; however, the relationship between each teaching method type and student
achievement is not explored in light of the other teaching method types. A third and final
disadvantage to relying solely on results from the meta-analysis is that background or
demographic characteristics of the students, schools, and teachers are not correlated to effect
sizes.
Hierarchical multiple regression with teaching method categories derived from the meta-
analysis will provide a clearer explanation of each category’s influence on a single dependent
variable, while controlling for other categories of teaching methods. Hafner (1993) examined the
influence of mathematics specific teaching practices on class-level mathematics achievement,
using data from the 1995 Second International Mathematics Study (SIMS). Hafner’s study used a
67
sample of 227 classes and their teachers who participated in the SIMS, analyzing teacher
responses to four teaching scale questionnaires that accompanied the achievement tests given to
the students.
Hafner performed stepwise multiple regression analysis to examine the influence of
mathematics-specific teaching practices on class-level mathematics achievement. More
specifically, Hafner sought to determine the extent and manner in which seven achievement
dependent variables could be predicted or explained by student performance on pretests, socio-
economic status (SES), class type, opportunity to learn (OTL) the subject, and five teaching
practice types: show and tell, comparison, inductive, eclectic, and abstract/memorization. Results
for the algebra achievement dependent variable are displayed in Table 21. All of the variables
together contributed roughly 86% of the variance in the student’s scores on the algebra
achievement variable. Individual unstandardized regression weights are provided for the
variables.
Noteworthy is the b value for abstract teaching practice types, .90. This was significant at
p<.05. The abstract/memorization scale measured an approach to teaching that focuses on
“memorization of rules and formulae, justifying steps, and teaching abstract meanings” (p. 79).
An example of an item from this scale is “It is important to justify steps in solving problems”
(p.91). Hafner’s results would indicate that teachers who use practices in the
abstract/memorization category contribute positively to their student’s scores in algebra
achievement.
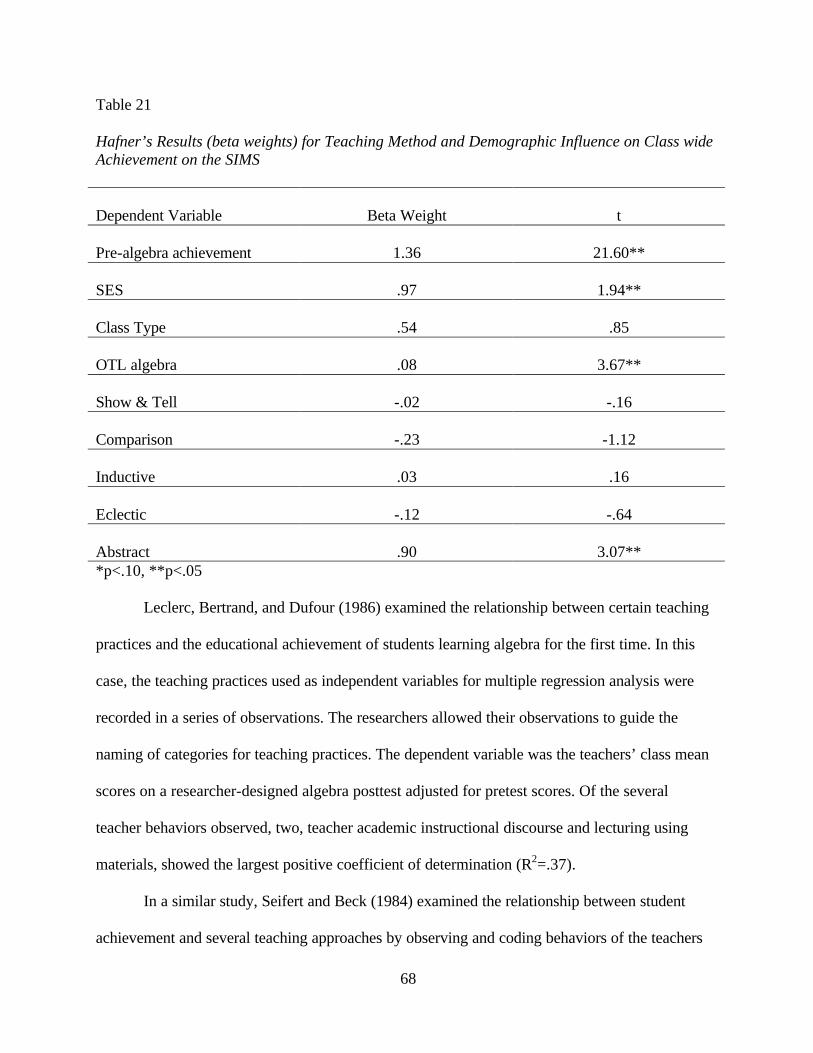
68
Table 21
Hafner’s Results (beta weights) for Teaching Method and Demographic Influence on Class wide Achievement on the SIMS
Dependent Variable
Beta Weight
t
Pre-algebra achievement
1.36
21.60**
SES
.97
1.94**
Class Type
.54
.85
OTL algebra
.08
3.67**
Show & Tell
-.02
-.16
Comparison
-.23
-1.12
Inductive
.03
.16
Eclectic
-.12
-.64
Abstract
.90
3.07**
*p<.10, **p<.05
Leclerc, Bertrand, and Dufour (1986) examined the relationship between certain teaching
practices and the educational achievement of students learning algebra for the first time. In this
case, the teaching practices used as independent variables for multiple regression analysis were
recorded in a series of observations. The researchers allowed their observations to guide the
naming of categories for teaching practices. The dependent variable was the teachers’ class mean
scores on a researcher-designed algebra posttest adjusted for pretest scores. Of the several
teacher behaviors observed, two, teacher academic instructional discourse and lecturing using
materials, showed the largest positive coefficient of determination (R2=.37).
In a similar study, Seifert and Beck (1984) examined the relationship between student
achievement and several teaching approaches by observing and coding behaviors of the teachers
69
and students. One major focus for this study was to determine the effect of the amount of
engaged learning time on student achievement on a mathematics posttest. Teacher behaviors
were assessed in light of how well they promoted time-on task. “The lecture/discussion method
of instruction yielded the highest correlation (r=0.46) when compared with achievement gain” (p.
9). The researchers also found that seatwork appears to be negatively correlated with
achievement gain.
Teaching Methods and Educational Productivity
Each of these three studies examined quality of instruction in terms of how the teacher
presents concepts and skills. Leclerc, Bertrand, and Dufour (1986) and Seifert and Beck (1984)
largely examined how the teacher teaches and the amount of time the teacher spends in each
category of teaching methods. Hafner used factor analysis to group teacher statements regarding
philosophical approaches to what they taught into broader categories. Walberg (1984) linked
amount and quality of instruction as inputs in his productivity model.
For the purposes of this study, teaching practices are grouped according to broader
categories and validated with domain association by experts. The individual method defines
itself in terms of the extent to which it is a “how to” or “what to” teach. The broader definition
for the category in which each method falls encompasses and ties together methods that may
differ somewhat in these aspects. The “amount” of time the teacher spends within each category
of teaching method is quantified by the teacher’s self-report of how often class time is devoted to
the category over a typical five class periods. To provide descriptive information pertaining to
this time element, teachers were asked to tell what type of schedule their schools use as a part of
background information as well as how many credits the Algebra I course is worth. A two-credit
course for Algebra I is twice the duration of a one-credit course.
70
CHAPTER III METHODOLOGY
“To study a construct or variable scientifically we must be able to identify the sources of its variation.”
(Pedhazer, 1997, p. 2)
This chapter discusses the methodological tools to be used in the culminating analysis for
this study. The methodology to be utilized here is quantitative as it leads to the development of a
regression equation for predictive and explanatory purposes. Teaching methods reviewed in
Chapter II are considered variables known to be correlates of the criterion for this study: student
achievement on the End of Course SOL Test for Algebra I. The remainder of this chapter
includes a discussion of the research question, research design, setting and sample, data
collection, instrumentation, and the data analysis techniques to be employed.
Research Question
In Chapter II, experimental research studies from 1980 to 2001 were quantitatively
integrated so that teaching method types could be examined in terms of their effects on student
achievement. These teaching method types include specific methods explored in the
experimental studies as well as those supported by other research. Since the major purpose of the
current study is to determine the influence of teaching methodology on student achievement on
the End of Course SOL Test for Algebra I, the research question displayed in Table 22 will guide
the research design.
This investigation began with an extensive review of literature ranging from 1980 to
2001, with studies chosen based on criteria established to include those that pertain to algebra
teaching methods where an effect size could be calculated. Teaching methods were then grouped
into categories, further focusing the review of literature so that its results could be channeled into
a regression study. In order to enhance the categories for the purposes of designing a
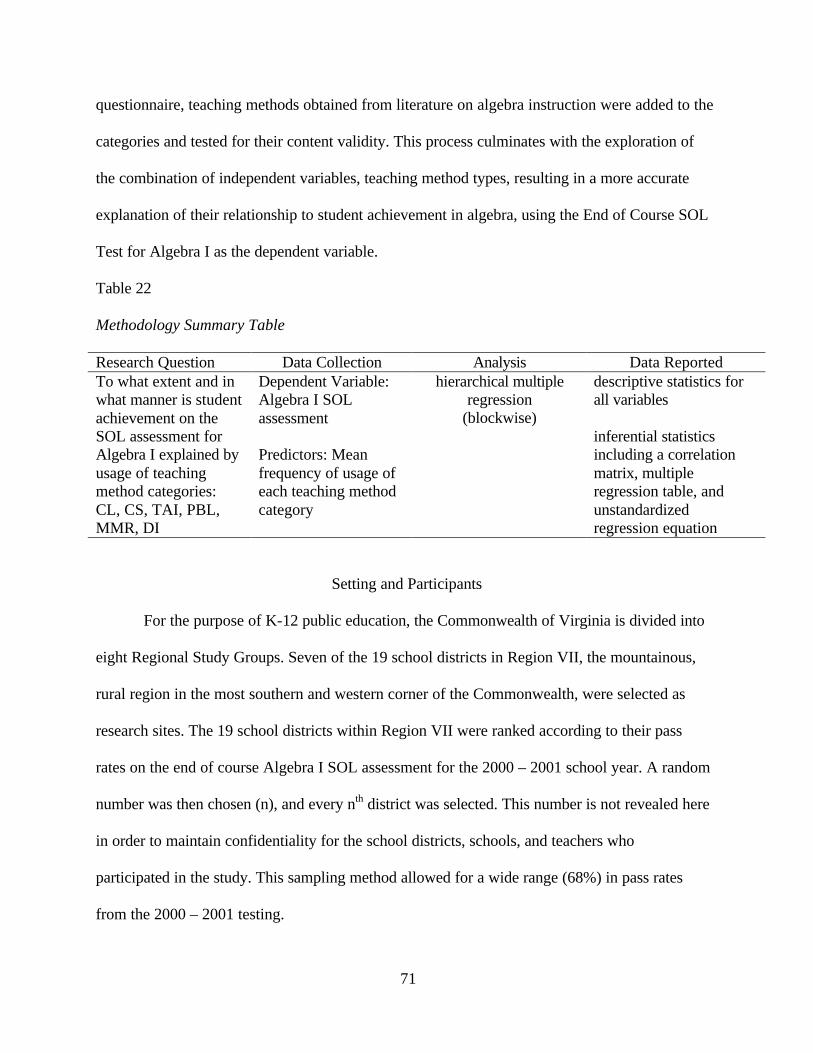
71
questionnaire, teaching methods obtained from literature on algebra instruction were added to the
categories and tested for their content validity. This process culminates with the exploration of
the combination of independent variables, teaching method types, resulting in a more accurate
explanation of their relationship to student achievement in algebra, using the End of Course SOL
Test for Algebra I as the dependent variable.
Table 22
Methodology Summary Table
Research Question Data Collection Analysis Data Reported To what extent and in what manner is student achievement on the SOL assessment for Algebra I explained by usage of teaching method categories: CL, CS, TAI, PBL, MMR, DI
Dependent Variable: Algebra I SOL assessment Predictors: Mean frequency of usage of each teaching method category
hierarchical multiple regression
(blockwise)
descriptive statistics for all variables inferential statistics including a correlation matrix, multiple regression table, and unstandardized regression equation
Setting and Participants
For the purpose of K-12 public education, the Commonwealth of Virginia is divided into
eight Regional Study Groups. Seven of the 19 school districts in Region VII, the mountainous,
rural region in the most southern and western corner of the Commonwealth, were selected as
research sites. The 19 school districts within Region VII were ranked according to their pass
rates on the end of course Algebra I SOL assessment for the 2000 – 2001 school year. A random
number was then chosen (n), and every nth district was selected. This number is not revealed here
in order to maintain confidentiality for the school districts, schools, and teachers who
participated in the study. This sampling method allowed for a wide range (68%) in pass rates
from the 2000 – 2001 testing.
72
Before moving forward with the study, exemption from the Virginia Tech Institutional
Review Board was obtained (Appendix AA). Each district superintendent was asked permission
to conduct the study and asked to provide an approximate number of Algebra I teachers in the
district. See Appendix CC. The first approximation of participants was 66. After contacting each
high school and middle school principal by telephone in the seven selected school districts to
provide information regarding the study and to ask permission to work with the teaching staff,
the approximate number of participants was reduced to an estimate of 59 teachers currently
teaching Algebra I. During the surveying process the number of participants was further reduced
to 53. One declined. Another indicated that she was not teaching Algebra I during the spring of
2002, and did not complete the questionnaire. Four more teachers who completed the
questionnaire were not teaching Algebra I during the spring of 2002. This reduced the sample of
participants to 53 teachers. Research suggests that the number of participants be equal to six to
10 times the number of predictors (Pedhazer, 1997). Based on this guideline, a minimum of 36
teachers was needed to use multiple regression analysis.
Data Collection
Two sources of data were used in this study. Data used to quantify independent variables
was collected through the use of a researcher-designed questionnaire. The dependent variable for
this study was each teacher’s mean scale score for his or her students on the End of Course SOL
Test for Algebra I for 2002. This information was requested from each school district
participating in the study.
Data Gathering and Management Procedures
The researcher-designed questionnaire was posted as a web site developed in
collaboration with Mr. Terry Hawthorne, the Smyth County Schools’ technology director:
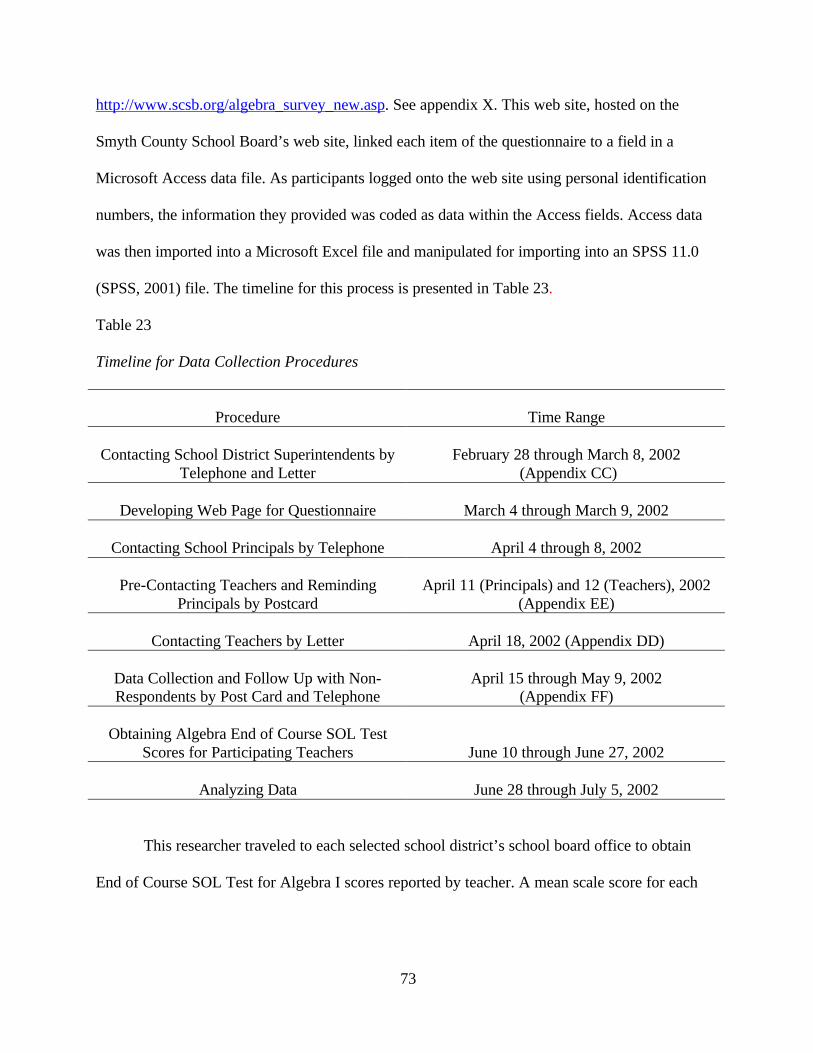
73
http://www.scsb.org/algebra_survey_new.asp. See appendix X. This web site, hosted on the
Smyth County School Board’s web site, linked each item of the questionnaire to a field in a
Microsoft Access data file. As participants logged onto the web site using personal identification
numbers, the information they provided was coded as data within the Access fields. Access data
was then imported into a Microsoft Excel file and manipulated for importing into an SPSS 11.0
(SPSS, 2001) file. The timeline for this process is presented in Table 23.
Table 23 Timeline for Data Collection Procedures
Procedure
Time Range
Contacting School District Superintendents by
Telephone and Letter
February 28 through March 8, 2002
(Appendix CC)
Developing Web Page for Questionnaire
March 4 through March 9, 2002
Contacting School Principals by Telephone
April 4 through 8, 2002
Pre-Contacting Teachers and Reminding Principals by Postcard
April 11 (Principals) and 12 (Teachers), 2002
(Appendix EE)
Contacting Teachers by Letter
April 18, 2002 (Appendix DD)
Data Collection and Follow Up with Non-Respondents by Post Card and Telephone
April 15 through May 9, 2002
(Appendix FF)
Obtaining Algebra End of Course SOL Test Scores for Participating Teachers
June 10 through June 27, 2002
Analyzing Data
June 28 through July 5, 2002
This researcher traveled to each selected school district’s school board office to obtain
End of Course SOL Test for Algebra I scores reported by teacher. A mean scale score for each
74
teacher was recorded and entered into the SPSS 11.0 database with the questionnaire data for
conducting the multiple regression analysis.
Instrumentation Design
The following two sections describe the designs for the researcher developed
questionnaire and the End of Course SOL Test for Algebra I.
Researcher Developed Questionnaire
The questionnaire was developed using Dillman’s (1978) Total Design Method for
surveys from the categories of teaching methods derived from the meta-analysis of research
studies in Chapter II. After initially assembling the studies and effect sizes, seven categories and
114 items were derived, as displayed in Appendix T. After the first round of content validation,
the “homework and practice” category was dropped because it appeared ambiguous to the
content validation experts. Forty-nine items and one complete category from the first round were
found acceptable using the criteria described in the instrument validation process. Thus, the
remaining 65 items were included in the second round of content validation with five categories,
as displayed in Appendix U.
Under each of the six category headings, eight specific statements were included
pertaining to teaching methods that define the category. These items were those with the
strongest association and clarity ratings from the content validation process. See Appendix X.
Hafner’s (1993) survey consisted of five categories with item totals ranging from four to eight.
Items were designed as close-ended statements with ordered answer choices. The teacher was
asked to consider five typical class periods and decide how many times he or she used a teaching
method during these five periods. The choice range was from zero to five. As described by
Dillman (1978), this type of item is designed to offer a choice, which will represent “the
75
graduation of a single dimension of some concept. This structure is ideally suited for determining
such things as … frequency of participation” (p. 89). This determined the extent to which each
teacher differed from the others in terms of usage of a particular teaching method. Dillman stated
that responses to this type of item are well suited for regression analysis.
In order to provide background information for the sample, the questionnaire contains
items that ask for information pertaining to quantity of instruction and the teaching-learning
environment, including the number of years of teaching experience the teacher has with Algebra
I in Virginia, on what type of schedule is his or her class (4 x 4 block, alternating days block,
seven period day), and whether the Algebra I course is being taught for one unit of credit or two.
Whether the teacher worked at a middle or high school was noted and included as a variable in
the SPSS 11.0 file later.
Questionnaire Validation Process
Categories and items of the questionnaire were validated in cooperation with Dr. Skip
Wilson and his 14 secondary mathematics teaching methods students at Virginia Polytechnic
Institute and State University in Blacksburg, Virginia. This course, EDCI 4744 & 5744,
Teaching Mathematics in the Secondary School II, is the final preparation for teacher candidates
before they begin student teaching. Students learn about, practice, and discuss teaching methods
for secondary mathematics. For example, when this researcher visited the class, the students
explored the possibilities of an electric data collection device for representing data depicting
linear relationships graphically.
The first round of the validation process was completed on January 24, 2002. This
researcher visited the class and administered the content validation instrument displayed in
Appendix V. Students took from 30 to 45 minutes to complete the instrument. Data from the
76
completed instruments were entered into SPSS 11.0 file and descriptive statistics were calculated
for each item. In order for an item to be retained, 80% of the participants had to place it in a
category, preferably the expected category. Further, the item had to produce a mean association
score for that category of three or higher on a scale of one to four. Finally, the item had to have a
clarity rating of 2.5 or higher on a scale of one to three.
After the first round of content validation, one category was dropped, “Homework and
Practice,” because it appeared to be inclusive of the other categories, distracting one or two
experts away from the expected category for several items. In order to drop this category, the
researcher returned to Chapter II and distributed the studies from it into other appropriate
categories. The meta-analysis was then recalculated before the questionnaire content validation
process could be resumed with six categories. Another category, “Technology Aided
Instruction,” was completely validated by the students, so it was removed from the validation
process for the second round. Forty-nine items met the criteria for inclusion from the first round,
so they were removed for the second round.
The second round of the validation process was completed on February 18, 2002. To
avoid taking up more of Dr. Wilson’s class time, the instrument displayed in Appendix W was
distributed via e-mail to the students, and they were asked to complete and return it by February
18, 2002. All 14 students returned their instruments. Data from the completed instruments were
entered into SPSS 11.0 and descriptive statistics were calculated for each item. In order for an
item to be retained, 80% of the participants had to place it in a category, preferably the expected
category. Further, the item had to produce a mean association score for that category of three or
higher on a scale of one to four. Finally, the item had to have a clarity rating of 2.5 or higher on a
77
scale of one to three. Appendices Y and Z present tables summarizing the content validation by
experts process.
Of the 101 items that met the criteria for inclusion in the six questionnaire categories, 48
were retained. The eight items with the strongest association and clarity ratings and the least
redundancy were retained under each category. When the questionnaire was posted, items were
organized under each category and converted to “I” statements (Dillman, 1978). See Appendix X
for the current draft of the questionnaire categories and items or use this hot link:
http://www.scsb.org/algebra_survey_new.asp.
Questionnaire Reliability
Reliability data for the questionnaire was obtained in cooperation with a sample of 15
high school mathematics teachers employed by Virginia Beach City Public Schools. See
Appendix BB. Participants completed the questionnaire during the week of April 1 to April 5,
2002. Data from the respondents was analyzed using the split-half technique, a measure of
internal consistency. This resulted in a reliability coefficient of r = .89, after applying the
Spearman-Brown prophecy formula.
End of Course SOL Test for Algebra I
The End of Course SOL Test for Algebra I is designed to allow each student to
demonstrate skills and knowledge acquisition in Algebra I. The Virginia Department of
Education (2001b; 2002) has provided a scope and sequence and curriculum framework for
Algebra I instruction. This test is untimed and conducted with a multiple-choice format. The
Blueprint for the Algebra I test (1997) states that the test includes a total of 60 items. Table 25
displays the reporting categories and the number of items associated with each. Fifty of the items
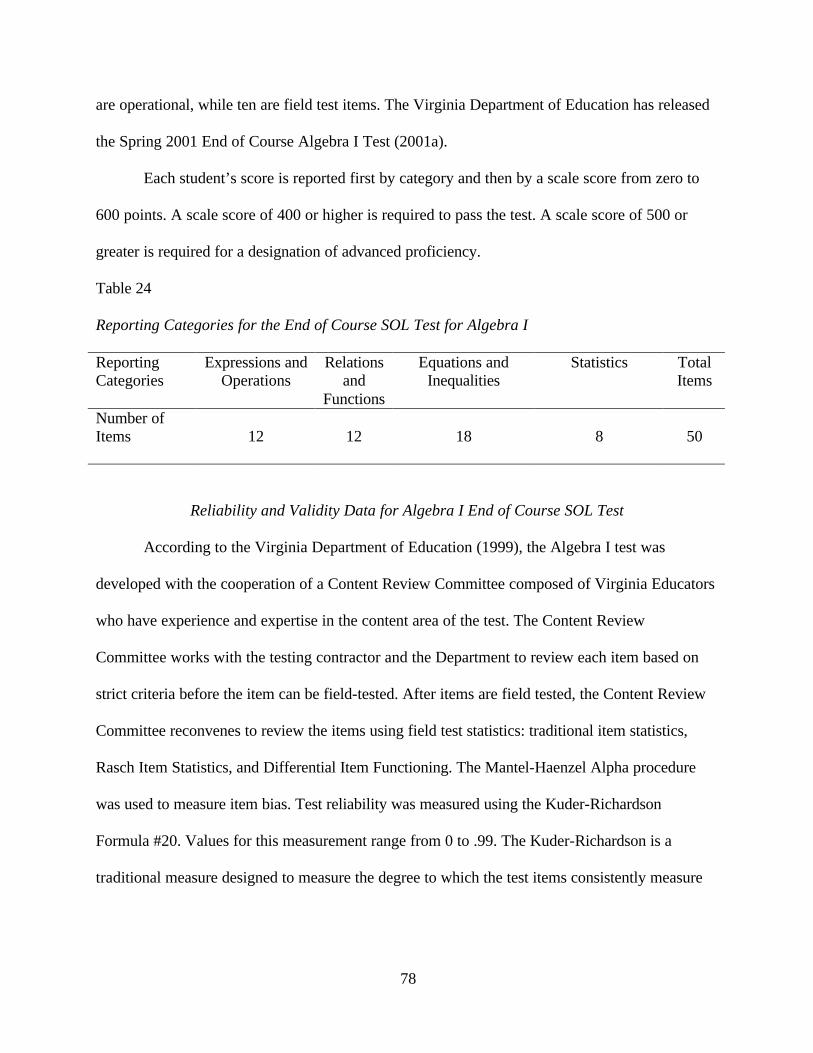
78
are operational, while ten are field test items. The Virginia Department of Education has released
the Spring 2001 End of Course Algebra I Test (2001a).
Each student’s score is reported first by category and then by a scale score from zero to
600 points. A scale score of 400 or higher is required to pass the test. A scale score of 500 or
greater is required for a designation of advanced proficiency.
Table 24
Reporting Categories for the End of Course SOL Test for Algebra I
Reporting Categories
Expressions and Operations
Relations and
Functions
Equations and Inequalities
Statistics Total Items
Number of Items
12
12
18
8
50
Reliability and Validity Data for Algebra I End of Course SOL Test
According to the Virginia Department of Education (1999), the Algebra I test was
developed with the cooperation of a Content Review Committee composed of Virginia Educators
who have experience and expertise in the content area of the test. The Content Review
Committee works with the testing contractor and the Department to review each item based on
strict criteria before the item can be field-tested. After items are field tested, the Content Review
Committee reconvenes to review the items using field test statistics: traditional item statistics,
Rasch Item Statistics, and Differential Item Functioning. The Mantel-Haenzel Alpha procedure
was used to measure item bias. Test reliability was measured using the Kuder-Richardson
Formula #20. Values for this measurement range from 0 to .99. The Kuder-Richardson is a
traditional measure designed to measure the degree to which the test items consistently measure
79
the same body of content and skills. The Kuder-Richardson #20 reliability coefficient for
Algebra I was .88 (Virginia Department of Education, 1999).
Data Analysis and Reporting Results
Data collected from the questionnaire was imported into an SPSS 11.0 data file for
analysis. Mean End of Course Algebra I SOL scale scores for each teacher’s students were added
to the file along with responses to the questionnaire. Once this process was completed, data was
not associated with a teacher by name, and data and results were not associated with schools or
school districts. Descriptive statistics were calculated for the teachers participating in the study.
Descriptive statistics for questionnaire responses include the mean and standard deviation for
individual teaching method frequencies, as well as a mean and standard deviation of frequency
of usage for each teaching method category. Descriptive statistics were also calculated for the
participants’ students’ mean scale scores for the End of Course SOL Test for Algebra I.
Hierarchical multiple regression analysis was used to determine the extent and manner in
which the use of each teaching method category can explain the teacher’s students’ mean scores
on the SOL test. Results reported from the hierarchical multiple regression include a
correlational matrix displaying correlations for teaching method categories, teacher mean scale
scores on the SOL test, and background characteristics. A regression table is displayed to explain
the variance contributed by each teaching method category along with an unstandardized
regression equation to demonstrate the manner in which each teaching method type relates to
student performance on the End of Course SOL Test for Algebra I.
Pedhazer (1997) and Huck (2000) discuss the use of multiple regression analysis for
correlational studies where the researcher seeks to determine the “amount of ingredient” equated
to the size of the bivariate correlation between the given independent variable and the dependent
80
variable. Multiple regression analysis takes into account that the independent variables may be
intercorrelated or that they may interact in their effects on the dependent variable. “Multiple
regression analysis is eminently suited for analyzing collective and separate effects of two or
more independent variables on a dependent variable” (Pedhazer, 1997, p. 3). In hierarchical
multiple regression, the researcher will “determine the order in which the independent variables
become a part of the regression equation” (Huck, 2000, p. 584).
Interpretation of the regression table and correlational matrix determines the extent and
manner the variation in the criterion variable (dependent variable) can be explained and/or
predicted by the predictors (independent variables). The extent of the correlation or shared
variation is represented by Mult R or R2; while the manner in which the shared variation is
explained or predicted is represented by the relative size or magnitude of the B value (Beta
Weight) for each step. Beta weight is defined as the standardized regression coefficient; it is the
change in “y” dependent variable) for each unit change in “x”(independent variable).
Methodology Summary
Teaching method categories derived in Chapter II were used as variables known to be
correlates of the criterion for this study, student achievement on the End of Course SOL Test for
Algebra I, in order to conduct hierarchical multiple regression analysis. The culmination of this
process is the exploration of the combination of independent variables, teaching method
categories, in Algebra I classes currently in session for the 2001-2002 school year, resulting in a
more accurate prediction or explanation of their effects on student achievement in algebra, using
the End of Course SOL Test for Algebra I as the dependent variable.
81
CHAPTER IV RESULTS OF THE STUDY
“We educators stand at a special point in time. This is not because a new decade, century, and
millennium have begun. Rather, it is because the ‘art’ of teaching is rapidly becoming the ‘science’ of teaching, and this is a relatively new phenomenon. ”
(Marzano, Pickering, & Pollock, 2001, p. 1)
The purpose for this quantitative study was to investigate the influence of teaching
methodology on student achievement on the End of Course SOL Test for Algebra I. Specifically,
six categories of teaching methods, cooperative learning; communication and study skills;
technology aided instruction; problem-based learning; manipulatives, models, and multiple
representations; and direct instruction, were derived from the meta-analysis in Chapter II. The
categories were used to develop a questionnaire to measure the frequency with which Algebra I
teachers use these teaching methods. Algebra I teachers in seven school districts in Region VII of
Virginia were surveyed, and their responses to the questionnaire were aggregated to comprise the
independent variables for the present regression analysis. The dependent variable for this
analysis, as previously outlined, was the mean scale score on the End of Course SOL Test for
Algebra I for each participating teacher’s students. The results of this analysis are offered here.
The analysis of data and results are presented in four sections. First, there is a description
of the sample of participants, including background characteristics, mean frequency of use for
each teaching method category, and a mean End of Course SOL Test scale score. Next, a
correlation matrix is provided to display relationships between variables. A table describing the
results of the regression analysis presents the relationship between teacher usage of each
teaching method category and the mean scale score on the End of Course SOL Test for Algebra
I. This is followed by a summary of findings for each teaching method category, including mean
frequencies for teaching method categories in light of background characteristics.
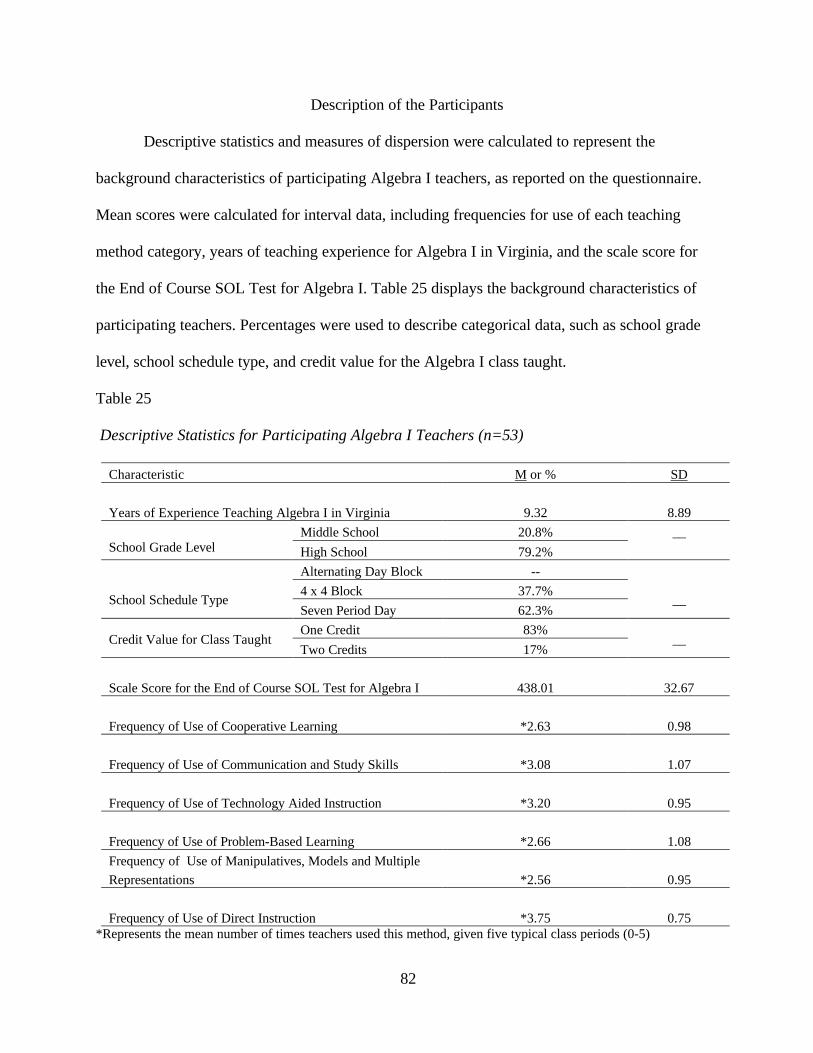
82
Description of the Participants
Descriptive statistics and measures of dispersion were calculated to represent the
background characteristics of participating Algebra I teachers, as reported on the questionnaire.
Mean scores were calculated for interval data, including frequencies for use of each teaching
method category, years of teaching experience for Algebra I in Virginia, and the scale score for
the End of Course SOL Test for Algebra I. Table 25 displays the background characteristics of
participating teachers. Percentages were used to describe categorical data, such as school grade
level, school schedule type, and credit value for the Algebra I class taught.
Table 25
Descriptive Statistics for Participating Algebra I Teachers (n=53)
Characteristic M or % SD
Years of Experience Teaching Algebra I in Virginia
9.32
8.89
Middle School 20.8% School Grade Level
High School 79.2%
__
Alternating Day Block --
4 x 4 Block 37.7%
School Schedule Type Seven Period Day 62.3%
__
One Credit 83% Credit Value for Class Taught
Two Credits 17% __
Scale Score for the End of Course SOL Test for Algebra I
438.01
32.67
Frequency of Use of Cooperative Learning
*2.63
0.98
Frequency of Use of Communication and Study Skills
*3.08
1.07
Frequency of Use of Technology Aided Instruction
*3.20
0.95
Frequency of Use of Problem-Based Learning
*2.66
1.08
Frequency of Use of Manipulatives, Models and Multiple
Representations
*2.56
0.95
Frequency of Use of Direct Instruction
*3.75
0.75 *Represents the mean number of times teachers used this method, given five typical class periods (0-5)

83
Participant Background Characteristics
Initially, 59 teachers were asked to participate in the study by completing the
questionnaire based on their principals’ indication that they were teaching Algebra I during the
spring of 2002. A minimum of 36 teachers was needed to meet the requirement of six to ten
participants per independent variable in the multiple regression analysis. One of the initial 59
declined. Another indicated that she was not teaching Algebra I during the spring of 2002 and
did not complete the questionnaire. Four more teachers who completed the questionnaire were
not teaching Algebra I during the spring of 2002, so their responses were deleted from the
database. This reduced the sample of participants to 53 teachers representing 1,538 students. The
teachers ranged in experience teaching Algebra I in Virginia from one year to 32 years, with a
mean of 9.8 years. More than half the teachers have been teaching Algebra I in Virginia for less
than five years.
The majority (79.2%) of the participating teachers work at the high school level. Three
schedule types were offered on the questionnaire to describe the participants’ schools: alternating
day block, 4 x 4 block, and seven period day. On the alternating day, or A – B day block
schedule, four 90-minute class periods are scheduled each day. On one day, the student takes one
set of classes, and on the next day, he takes another set of classes. No participating teachers
worked at alternating day block scheduled schools. The majority (62.3%) of the teachers work at
schools with the traditional seven period day. On this schedule, seven class periods are offered
each day, all year. The remaining teachers (37.7%) worked at schools with a 4 x 4 block
schedule. Students attend four 90-minute class periods each day. Students take one set of four
classes for one half of the school year and a second set of four classes during the next half.

84
Credit value for the class taught indicates the duration for the Algebra I class. A one-
credit Algebra I class is either offered for one semester on the 4 x 4 block schedule or one full
year on the seven period day schedule. The two credit Algebra I class is broken into two parts.
Each part is taken as a full year course on the seven period day schedule, and each part is taken
for one half the school year on the 4 x 4 block schedule. Thus, students taking Algebra I for two
credits have twice the time to learn the knowledge and skills required in the SOLs. Eighty-three
percent of the participating teachers teach Algebra I for one credit, while relatively few (17%)
teach the course for two credits.
Algebra I SOL Test Score Distribution for Participants
The mean scale End of Course SOL test for Algebra I score for the sample of participants
was 438.11 with a standard deviation of 32.67. Mean scores for individual teachers’ students
ranged from 350.57 to 511.56. A scale score of 400 or higher is required to pass the test. A scale
score of 500 or greater is required for a designation of advanced proficiency. A histogram
displaying the distribution of mean test scores in comparison to a normal curve is presented in
Figure 8. Scores are represented with 10 intervals to give an identifiable shape to the bar
distribution.
The distribution of scores is slightly positively skewed, as the mean (438.01) is greater
than the median (437.06). In other words, the mean is skewed or pulled in the direction of the
extreme scores, while the median is not. The lowest scores fall well outside two standard
deviations to the left of the mean (372.66). All teachers with student mean scores within one
standard deviation to the left or right of the mean (405 – 470.67) had passing student mean
scores. Just less than71% of the teachers’ students achieved mean scores of at least 400, and
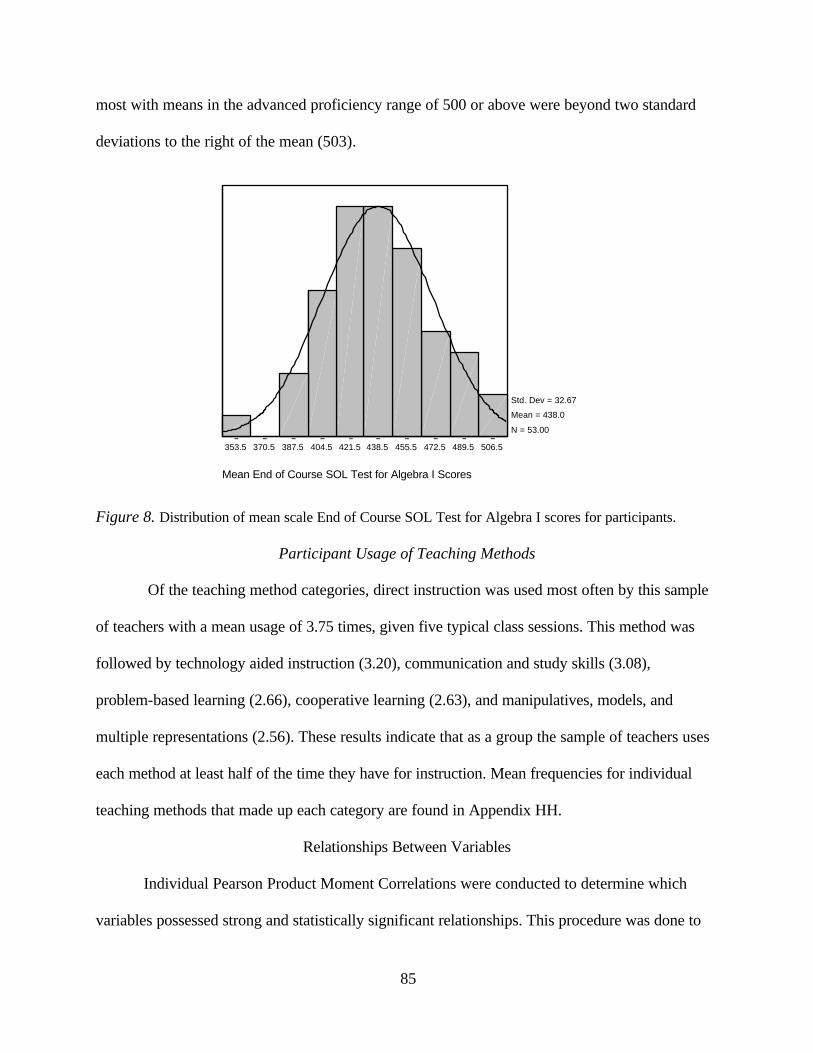
85
most with means in the advanced proficiency range of 500 or above were beyond two standard
deviations to the right of the mean (503).
Mean End of Course SOL Test for Algebra I Scores
506.5489.5472.5455.5438.5421.5404.5387.5370.5353.5
Std. Dev = 32.67
Mean = 438.0
N = 53.00
Figure 8. Distribution of mean scale End of Course SOL Test for Algebra I scores for participants.
Participant Usage of Teaching Methods
Of the teaching method categories, direct instruction was used most often by this sample
of teachers with a mean usage of 3.75 times, given five typical class sessions. This method was
followed by technology aided instruction (3.20), communication and study skills (3.08),
problem-based learning (2.66), cooperative learning (2.63), and manipulatives, models, and
multiple representations (2.56). These results indicate that as a group the sample of teachers uses
each method at least half of the time they have for instruction. Mean frequencies for individual
teaching methods that made up each category are found in Appendix HH.
Relationships Between Variables
Individual Pearson Product Moment Correlations were conducted to determine which
variables possessed strong and statistically significant relationships. This procedure was done to
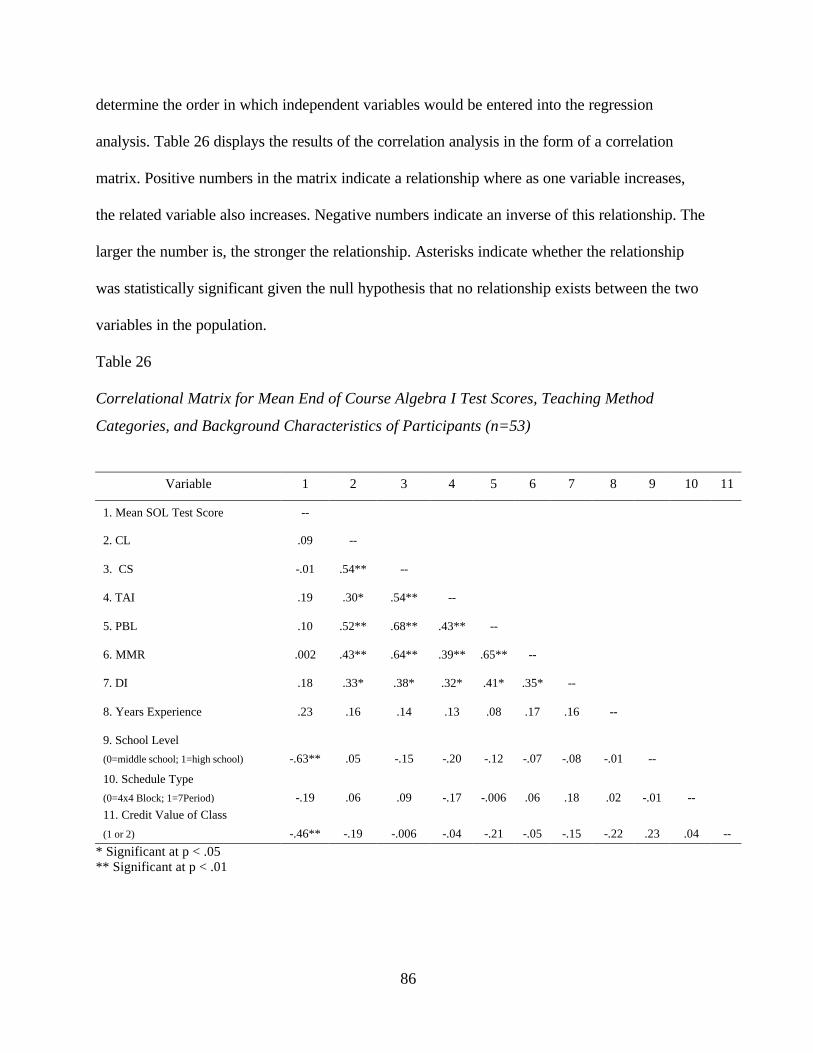
86
determine the order in which independent variables would be entered into the regression
analysis. Table 26 displays the results of the correlation analysis in the form of a correlation
matrix. Positive numbers in the matrix indicate a relationship where as one variable increases,
the related variable also increases. Negative numbers indicate an inverse of this relationship. The
larger the number is, the stronger the relationship. Asterisks indicate whether the relationship
was statistically significant given the null hypothesis that no relationship exists between the two
variables in the population.
Table 26
Correlational Matrix for Mean End of Course Algebra I Test Scores, Teaching Method
Categories, and Background Characteristics of Participants (n=53)
Variable 1 2 3 4 5 6 7 8 9 10 11
1. Mean SOL Test Score --
2. CL .09 --
3. CS -.01 .54** --
4. TAI .19 .30* .54** --
5. PBL .10 .52** .68** .43** --
6. MMR .002 .43** .64** .39** .65** --
7. DI .18 .33* .38* .32* .41* .35* --
8. Years Experience .23 .16 .14 .13 .08 .17 .16 --
9. School Level
(0=middle school; 1=high school)
-.63**
.05
-.15
-.20
-.12
-.07
-.08
-.01
--
10. Schedule Type
(0=4x4 Block; 1=7Period)
-.19
.06
.09
-.17
-.006
.06
.18
.02
-.01
--
11. Credit Value of Class
(1 or 2)
-.46**
-.19
-.006
-.04
-.21
-.05
-.15
-.22
.23
.04
--
* Significant at p < .05 ** Significant at p < .01
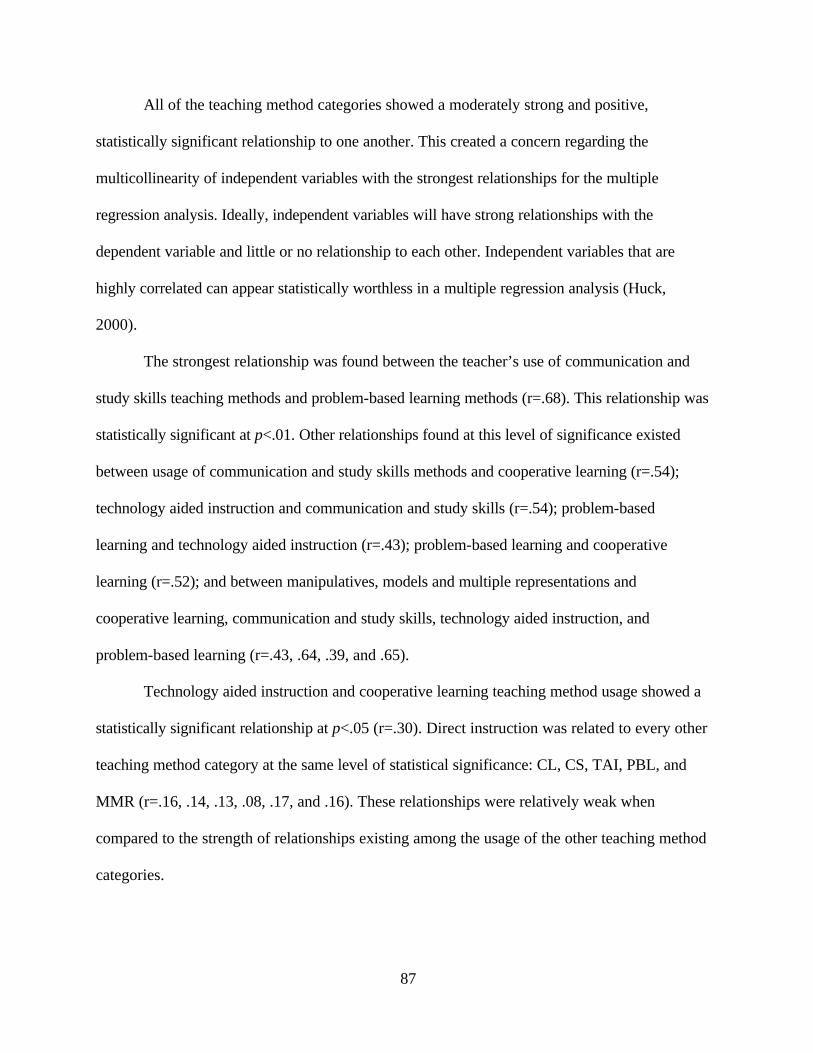
87
All of the teaching method categories showed a moderately strong and positive,
statistically significant relationship to one another. This created a concern regarding the
multicollinearity of independent variables with the strongest relationships for the multiple
regression analysis. Ideally, independent variables will have strong relationships with the
dependent variable and little or no relationship to each other. Independent variables that are
highly correlated can appear statistically worthless in a multiple regression analysis (Huck,
2000).
The strongest relationship was found between the teacher’s use of communication and
study skills teaching methods and problem-based learning methods (r=.68). This relationship was
statistically significant at p<.01. Other relationships found at this level of significance existed
between usage of communication and study skills methods and cooperative learning (r=.54);
technology aided instruction and communication and study skills (r=.54); problem-based
learning and technology aided instruction (r=.43); problem-based learning and cooperative
learning (r=.52); and between manipulatives, models and multiple representations and
cooperative learning, communication and study skills, technology aided instruction, and
problem-based learning (r=.43, .64, .39, and .65).
Technology aided instruction and cooperative learning teaching method usage showed a
statistically significant relationship at p<.05 (r=.30). Direct instruction was related to every other
teaching method category at the same level of statistical significance: CL, CS, TAI, PBL, and
MMR (r=.16, .14, .13, .08, .17, and .16). These relationships were relatively weak when
compared to the strength of relationships existing among the usage of the other teaching method
categories.
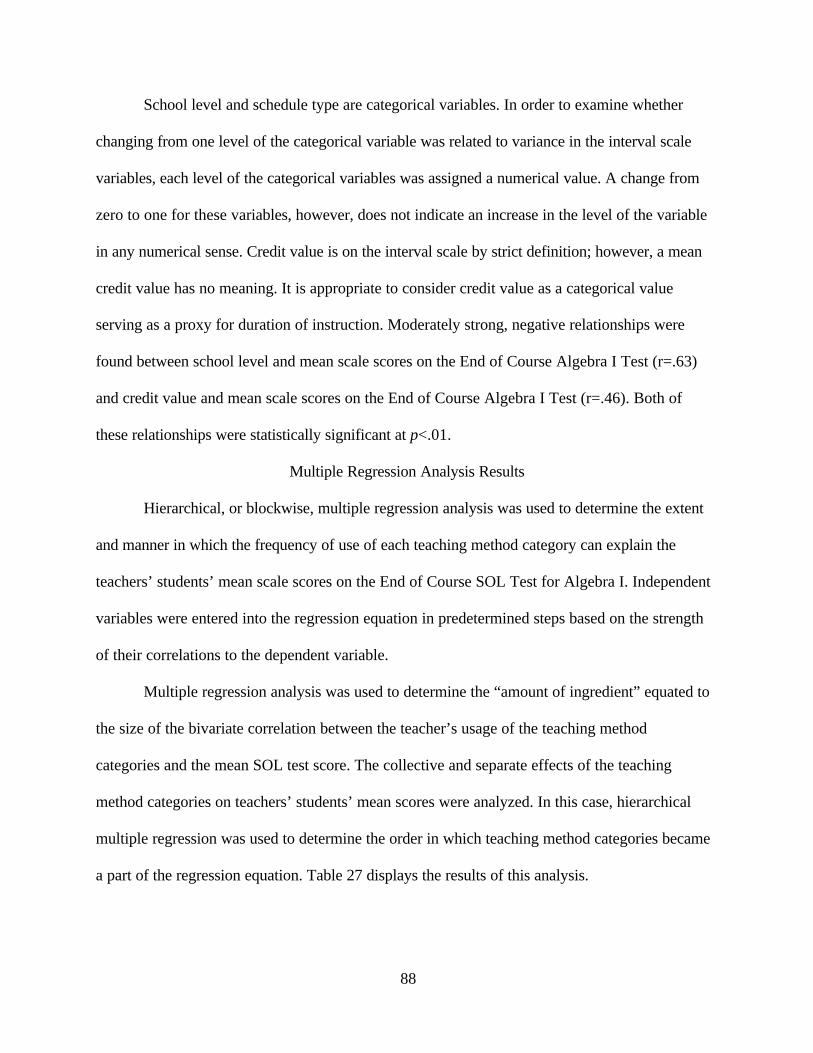
88
School level and schedule type are categorical variables. In order to examine whether
changing from one level of the categorical variable was related to variance in the interval scale
variables, each level of the categorical variables was assigned a numerical value. A change from
zero to one for these variables, however, does not indicate an increase in the level of the variable
in any numerical sense. Credit value is on the interval scale by strict definition; however, a mean
credit value has no meaning. It is appropriate to consider credit value as a categorical value
serving as a proxy for duration of instruction. Moderately strong, negative relationships were
found between school level and mean scale scores on the End of Course Algebra I Test (r=.63)
and credit value and mean scale scores on the End of Course Algebra I Test (r=.46). Both of
these relationships were statistically significant at p<.01.
Multiple Regression Analysis Results
Hierarchical, or blockwise, multiple regression analysis was used to determine the extent
and manner in which the frequency of use of each teaching method category can explain the
teachers’ students’ mean scale scores on the End of Course SOL Test for Algebra I. Independent
variables were entered into the regression equation in predetermined steps based on the strength
of their correlations to the dependent variable.
Multiple regression analysis was used to determine the “amount of ingredient” equated to
the size of the bivariate correlation between the teacher’s usage of the teaching method
categories and the mean SOL test score. The collective and separate effects of the teaching
method categories on teachers’ students’ mean scores were analyzed. In this case, hierarchical
multiple regression was used to determine the order in which teaching method categories became
a part of the regression equation. Table 27 displays the results of this analysis.
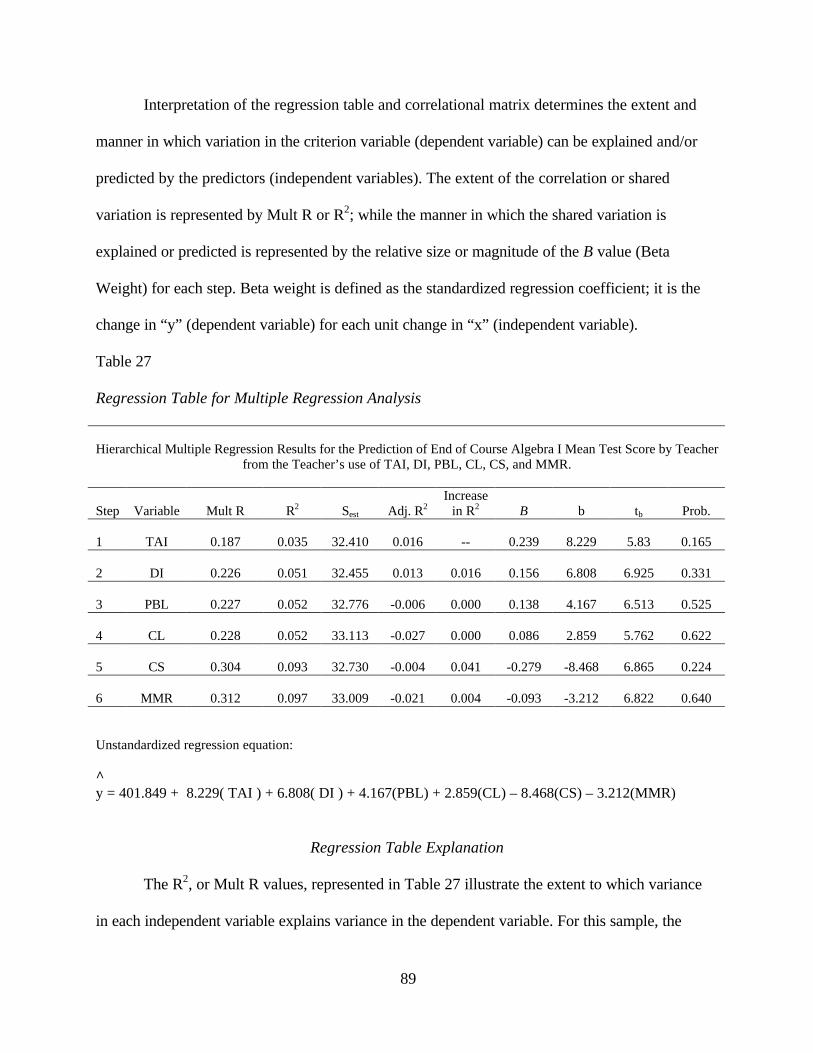
89
Interpretation of the regression table and correlational matrix determines the extent and
manner in which variation in the criterion variable (dependent variable) can be explained and/or
predicted by the predictors (independent variables). The extent of the correlation or shared
variation is represented by Mult R or R2; while the manner in which the shared variation is
explained or predicted is represented by the relative size or magnitude of the B value (Beta
Weight) for each step. Beta weight is defined as the standardized regression coefficient; it is the
change in “y” (dependent variable) for each unit change in “x” (independent variable).
Table 27
Regression Table for Multiple Regression Analysis
Hierarchical Multiple Regression Results for the Prediction of End of Course Algebra I Mean Test Score by Teacher
from the Teacher’s use of TAI, DI, PBL, CL, CS, and MMR.
Step
Variable
Mult R
R2
Sest
Adj. R2
Increase in R2
B
b
tb
Prob.
1
TAI
0.187
0.035
32.410
0.016
--
0.239
8.229
5.83
0.165
2
DI
0.226
0.051
32.455
0.013
0.016
0.156
6.808
6.925
0.331
3
PBL
0.227
0.052
32.776
-0.006
0.000
0.138
4.167
6.513
0.525
4
CL
0.228
0.052
33.113
-0.027
0.000
0.086
2.859
5.762
0.622
5
CS
0.304
0.093
32.730
-0.004
0.041
-0.279
-8.468
6.865
0.224
6
MMR
0.312
0.097
33.009
-0.021
0.004
-0.093
-3.212
6.822
0.640
Unstandardized regression equation: ^ y = 401.849 + 8.229( TAI ) + 6.808( DI ) + 4.167(PBL) + 2.859(CL) – 8.468(CS) – 3.212(MMR)
Regression Table Explanation
The R2, or Mult R values, represented in Table 27 illustrate the extent to which variance
in each independent variable explains variance in the dependent variable. For this sample, the
90
group of independent variables shared nearly 10% of variance with the dependent variable as
indicated by the final R2 of 0.097. Note, however, that this result has no statistical significance
when referred to the population. None of the probability values indicated that variance shared
between any given independent variable and the dependent variable was statistically significant
at p<.05. In other words, the assumption that none of the variance in the dependent variable is
explained by the collection of independent variables for the population was not overcome in this
case.
The R2 values for independent variables increased according to the order in which the
variables were entered into the regression analysis. A relatively large increase in R2 occurred
between steps four and five; however, this was tempered by examining the negative values for
adjusted R2 used to anticipate the amount of reduction that would occur in the value of R2 had a
much larger sample of participants been used. None of the changes in R2 were statistically
significant at p<.05.
Unstandardized Regression Equation
The unstandardized regression equation accompanying Table 27 conveys the manner in
which the set of independent variables explains variance in the dependent variable. It is the
equation for a line, where the “y” value indicates a teacher’s mean scale SOL score, given the
values calculated in the regression equation. The constant value of 401.849 specifies the point at
which the line would intercept the “y” axis if the teacher indicated a zero usage for all teaching
methods.
The number preceding each independent variable in the equation is referred to as the
unstandardized regression coefficient. This value is taken from the “b” column in Table 27. It
indicates the amount of slope that each independent variable will contribute to the regression
^
91
line. Of course, the slope of the line will vary, given the values of the independent variables.
Each independent variable represents an “x” value and contributes to the slope of the line, just as
a point on the “x” axis contributes to the slope of a given line. The “b” value indicates the rise,
while the independent variable’s “x” value indicates the run of the line.
Summary of Results for Each Category
This final section of Chapter IV presents a summary of findings for each teaching method
category. These results are reported in light of the background characteristics of the participants
in Table 28. The participants’ usage of teaching methods is described in terms of their
background characteristics and instructional setting to provide a context. A mean frequency from
zero to five is presented for each item along with the standard deviation. This score represents
the mean number of times participants used this teaching method, given typical five class
periods. Participants’ years of experience teaching Algebra I in Virginia ranged from one to
thirty-two years. Rather than attempting to give a mean usage for each level of this variable, a
correlation between years experience and method usage is presented. Information pertaining to
individual questionnaire items is found in Appendix HH.
Cooperative Learning
For the purposes of this study, cooperative learning is defined as a method of instruction
characterized by students working together to reach a common goal. Cooperative learning
produced the third largest mean effect size (0.34) and a percentile gain of 13% for all studies and
the fourth largest mean effect size (0.26) and a percentile gain of 11% for “good” studies in the
meta-analysis presented in Chapter II. This indicated a small effect (Cohen, 1988) for this
teaching method on student achievement in algebra.
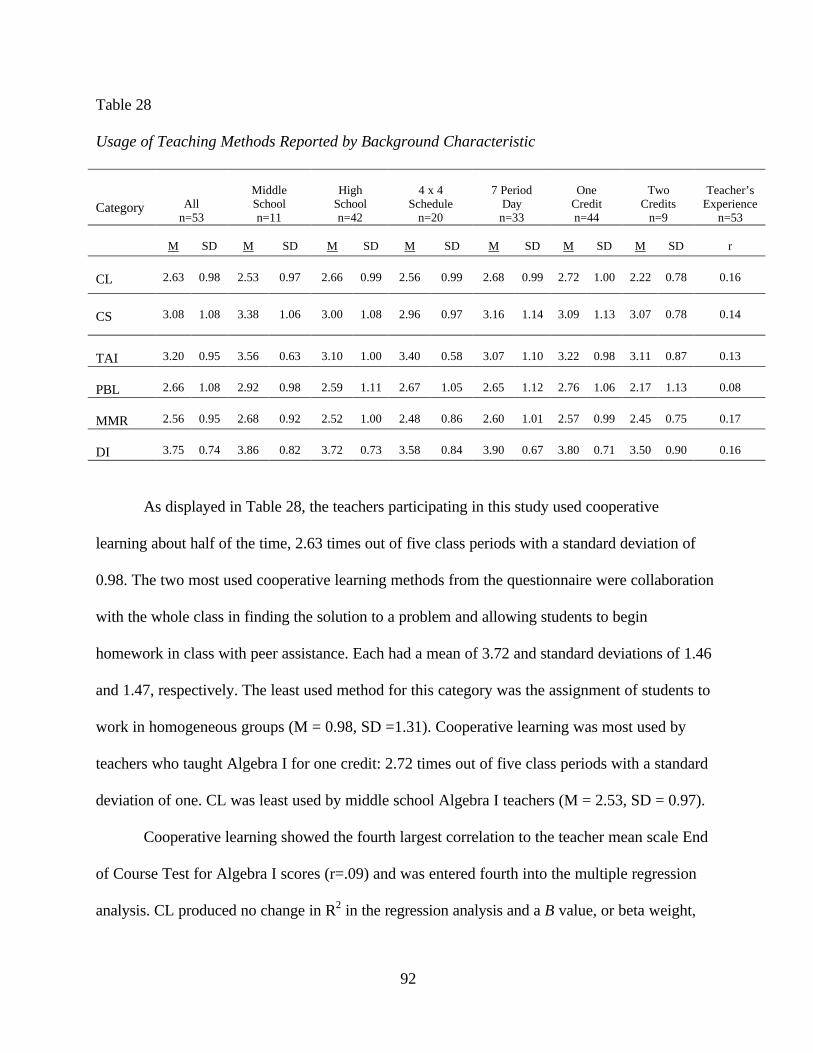
92
Table 28
Usage of Teaching Methods Reported by Background Characteristic
Category
All n=53
Middle School n=11
High
School n=42
4 x 4
Schedule n=20
7 Period
Day n=33
One
Credit n=44
Two
Credits n=9
Teacher’s
Experience n=53
M
SD
M
SD
M
SD
M
SD
M
SD
M
SD
M
SD
r
CL
2.63
0.98
2.53
0.97
2.66
0.99
2.56
0.99
2.68
0.99
2.72
1.00
2.22
0.78
0.16
CS
3.08
1.08
3.38
1.06
3.00
1.08
2.96
0.97
3.16
1.14
3.09
1.13
3.07
0.78
0.14
TAI
3.20
0.95
3.56
0.63
3.10
1.00
3.40
0.58
3.07
1.10
3.22
0.98
3.11
0.87
0.13
PBL
2.66
1.08
2.92
0.98
2.59
1.11
2.67
1.05
2.65
1.12
2.76
1.06
2.17
1.13
0.08
MMR
2.56
0.95
2.68
0.92
2.52
1.00
2.48
0.86
2.60
1.01
2.57
0.99
2.45
0.75
0.17
DI
3.75
0.74
3.86
0.82
3.72
0.73
3.58
0.84
3.90
0.67
3.80
0.71
3.50
0.90
0.16
As displayed in Table 28, the teachers participating in this study used cooperative
learning about half of the time, 2.63 times out of five class periods with a standard deviation of
0.98. The two most used cooperative learning methods from the questionnaire were collaboration
with the whole class in finding the solution to a problem and allowing students to begin
homework in class with peer assistance. Each had a mean of 3.72 and standard deviations of 1.46
and 1.47, respectively. The least used method for this category was the assignment of students to
work in homogeneous groups (M = 0.98, SD =1.31). Cooperative learning was most used by
teachers who taught Algebra I for one credit: 2.72 times out of five class periods with a standard
deviation of one. CL was least used by middle school Algebra I teachers (M = 2.53, SD = 0.97).
Cooperative learning showed the fourth largest correlation to the teacher mean scale End
of Course Test for Algebra I scores (r=.09) and was entered fourth into the multiple regression
analysis. CL produced no change in R2 in the regression analysis and a B value, or beta weight,
93
of 0.086. The location of CL in the unstandardized regression equation is similar to its rank in
the meta-analysis results.
Communication and Study Skills
For the purposes of this study, communication and study skills is defined as a method of
instruction characterized by teaching students to read and study mathematical information
effectively and providing opportunities for students to communicate mathematical ideas verbally
or in writing. Communication and study skills produced the fifth smallest mean effect size (0.07)
and a percentile gain of three percent for all studies and the smallest mean effect size (0.16) and
a percentile gain of six percent for “good” studies in the meta-analysis presented in Chapter II.
This indicated a small effect (Cohen, 1988) for this teaching method on student achievement in
algebra.
Communication and study skills teaching methods were used more than half of the time,
3.08 times out of five class periods with a standard deviation of 1.08, by the teachers
participating in this study. The most used CS strategy was encouraging students to ask questions
when difficulties or misunderstandings arise (M = 4.62, SD = 1.10). This item had the highest
mean score of all questionnaire items. The least used CS strategy was having students write
about their problem solving strategies (M = 1.28, SD = 1.47). CS was most used by middle
school Algebra I teachers: 3.38 times out of five class periods with a standard deviation of 1.06.
CS was least used by teachers on the 4x4 block schedule with a mean score of 2.96 and standard
deviation of 0.97.
Communication and study skills showed the second smallest correlation to the teacher
mean scale End of Course Test for Algebra I scores with a negative r = 0.01. CS was entered
fifth into the multiple regression analysis. This teaching method produced a change of 0.041 in
94
R2 in the regression analysis and a B value, or beta weight, of negative 0.28. The location of CS
in the unstandardized regression equation is similar to its rank in the meta-analysis results.
Technology Aided Instruction
For the purposes of this study, technology aided instruction is defined as a method of
instruction characterized by the use of computer software applications and/or hand-held
calculators to enhance instruction. Technology aided instruction produced the fifth smallest
mean effect size (0.07) and a percentile gain of three percent for all studies and the third largest
mean effect size (0.41) and a percentile gain of 16% for “good” studies in the meta-analysis
presented in Chapter II. This indicated a small to near medium effect (Cohen, 1988) for this
teaching method on student achievement in algebra.
Technology aided instruction was used well more than half of the time, 3.20 times out of
five class periods with a standard deviation of 0.95, by the teachers participating in this study. It
was second only to direct instruction in terms of usage. Allowing students to use calculators
during tests or quizzes was the most used TAI method (M = 4.60, SD = 1.10). The least used
TAI method with the lowest score on the total questionnaire was having the students use
computer spreadsheets for problem solving instruction (M = 0.26, SD = 0.76). TAI was most
used by middle school Algebra I teachers: 3.56 times out of five class periods with a standard
deviation of 0.63. TAI was least used by teachers on the seven period day schedule with a mean
score of 3.07 and standard deviation of 1.10.
Technology aided instruction showed the largest correlation to the teacher mean scale
End of Course Test scores for Algebra I (0.19). TAI was entered first into the multiple regression
analysis. This teaching method produced an R2 value of 0.035, representing 3.5% shared
variance with the dependent variable. TAI produced a B value, or beta weight, of 0.24. The
95
location of TAI in the unstandardized regression equation does not reflect its place in the meta-
analysis results. This teaching method moved from either tied for last for all studies or third for
“good” studies in the meta-analysis to first in the multiple regression analysis.
Problem-Based Learning
For the purposes of this study, problem-based learning is defined as a method of
instruction characterized by teaching through problem solving where students apply a general
rule (deduction) or draw new conclusions or rules (induction) based on information presented in
the problem. Problem-based learning produced the second largest mean effect size (0.52) and a
percentile gain of 20% for all studies and the second largest mean effect size (0.44) and a
percentile gain of 17% for “good” studies in the meta-analysis presented in Chapter II. This
indicated a medium effect (Cohen, 1988) for this teaching method on student achievement in
algebra.
The teachers participating in this study used problem-based learning teaching methods
about half of the time, 2.66 times out of five class periods with a standard deviation of 1.08. This
category was ranked fourth in terms of usage. Emphasizing the problem solving process over the
solution was the most used PBL method (M = 3.51, SD = 1.53). The least used PBL method was
“I have students pursue open-ended and extended problem solving projects” (M = 1.58, SD =
1.51). PBL was most used by middle school Algebra I teachers: 2.92 times out of five class
periods with a standard deviation of 0.98. PBL was least used in two-credit Algebra I classes (M
= 2.17, SD = 1.13).
Problem-based learning showed the third largest correlation to the teacher mean scale
End of Course Test scores for Algebra I (0.10) and the smallest correlation to the teacher’s years
of experience teaching Algebra I in Virginia (0.08). PBL was entered third into the multiple
96
regression analysis. This teaching method produced no change in R2 beyond the first two
variables. PBL produced a B value, or beta weight, of 0.138. The location of PBL in the
unstandardized regression equation does not reflect its place in the meta-analysis results. This
teaching method moved from second place for all studies and “good” studies in the meta-analysis
to third in the multiple regression analysis.
Manipulatives, Models, and Multiple Representations
For the purposes of this study, manipulatives, models, and multiple representations is a
category of instruction where students are taught techniques for generating or manipulating
representations of algebraic content or processes, whether concrete, symbolic, or abstract. The
manipulatives, models, and multiple representations category produced the fourth largest mean
effect size (0.23) and a percentile gain of nine percent for all studies and the fifth largest mean
effect size (0.23) and a percentile gain of nine percent for “good” studies in the meta-analysis
presented in Chapter II. This indicated a small effect (Cohen, 1988) for this teaching method on
student achievement in algebra.
The MMR teaching method category was used the least frequently among participants,
about half of the time, or 2.56 times out of five class periods with a standard deviation of 0.95.
The most used MMR method from the questionnaire was teaching students to represent algebraic
equations with graphs (M = 3.34, SD = 1.58). Using cubes or blocks to represent algebraic
equations was least used (M = 1.15, SD =1.32). MMR was most used by middle school teachers:
2.68 times out of five class periods with a standard deviation of 0.92. This category was least
used by those teaching Algebra I for two credits (M = 2.45, SD = 0.75).
The manipulatives, models, and multiple representations category had the largest
correlation to the teacher’s years of experience with teaching Algebra I in Virginia (0.17). MMR
97
had the smallest correlation to the teacher mean scale End of Course Test for Algebra I scores
(r=.002) and was entered last into the multiple regression analysis. MMR produced an increase
of 0.004 in R2 in the regression analysis and a B value, or beta weight, of -0.093. The MMR
category moved from fourth or fifth place in the meta-analysis to last place in the unstandardized
regression equation.
Direct Instruction
For the purposes of this study, direct instruction is defined as teaching through
establishing a direction and rationale for learning by relating new concepts to previous learning,
leading students through a specified sequence of instructions based on predetermined steps that
introduce and reinforce a concept, and providing students with practice and feedback relative to
how well they are doing. The direct instruction category produced the largest mean effect size
(0.51) and a percentile gain of 21% for all studies and the largest mean effect size (0.67) and a
percentile gain of 25% for “good” studies in the meta-analysis presented in Chapter II. This
indicated a medium effect (Cohen, 1988) for this teaching method on student achievement in
algebra.
Direct instruction teaching methods were used the most by the participants: 3.75 times
out of five class periods with a standard deviation of 0.74. Requiring students to indicate a one-
step-at-a-time process in working equations was the most used DI method (M = 4.19, SD =
1.19). The least used DI method was “I grade homework to provide feedback” (M = 3.23, SD =
1.79). DI was most used by Algebra I teachers at schools with seven period day schedules: 3.90
times out of five class periods with a standard deviation of 0.67. DI was least used in two-credit
Algebra I classes (M = 3.50, SD = 0.90).
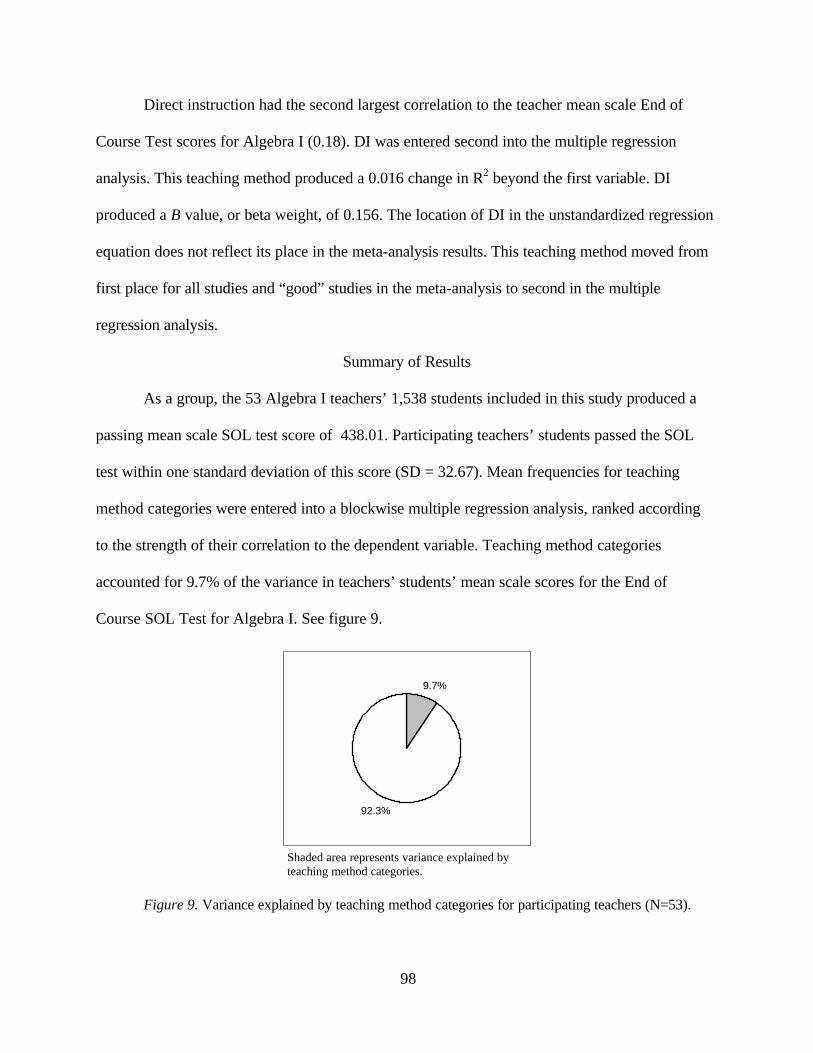
98
Direct instruction had the second largest correlation to the teacher mean scale End of
Course Test scores for Algebra I (0.18). DI was entered second into the multiple regression
analysis. This teaching method produced a 0.016 change in R2 beyond the first variable. DI
produced a B value, or beta weight, of 0.156. The location of DI in the unstandardized regression
equation does not reflect its place in the meta-analysis results. This teaching method moved from
first place for all studies and “good” studies in the meta-analysis to second in the multiple
regression analysis.
Summary of Results
As a group, the 53 Algebra I teachers’ 1,538 students included in this study produced a
passing mean scale SOL test score of 438.01. Participating teachers’ students passed the SOL
test within one standard deviation of this score (SD = 32.67). Mean frequencies for teaching
method categories were entered into a blockwise multiple regression analysis, ranked according
to the strength of their correlation to the dependent variable. Teaching method categories
accounted for 9.7% of the variance in teachers’ students’ mean scale scores for the End of
Course SOL Test for Algebra I. See figure 9.
9.7%
92.3%
Shaded area represents variance explained by
teaching method categories.
Figure 9. Variance explained by teaching method categories for participating teachers (N=53).
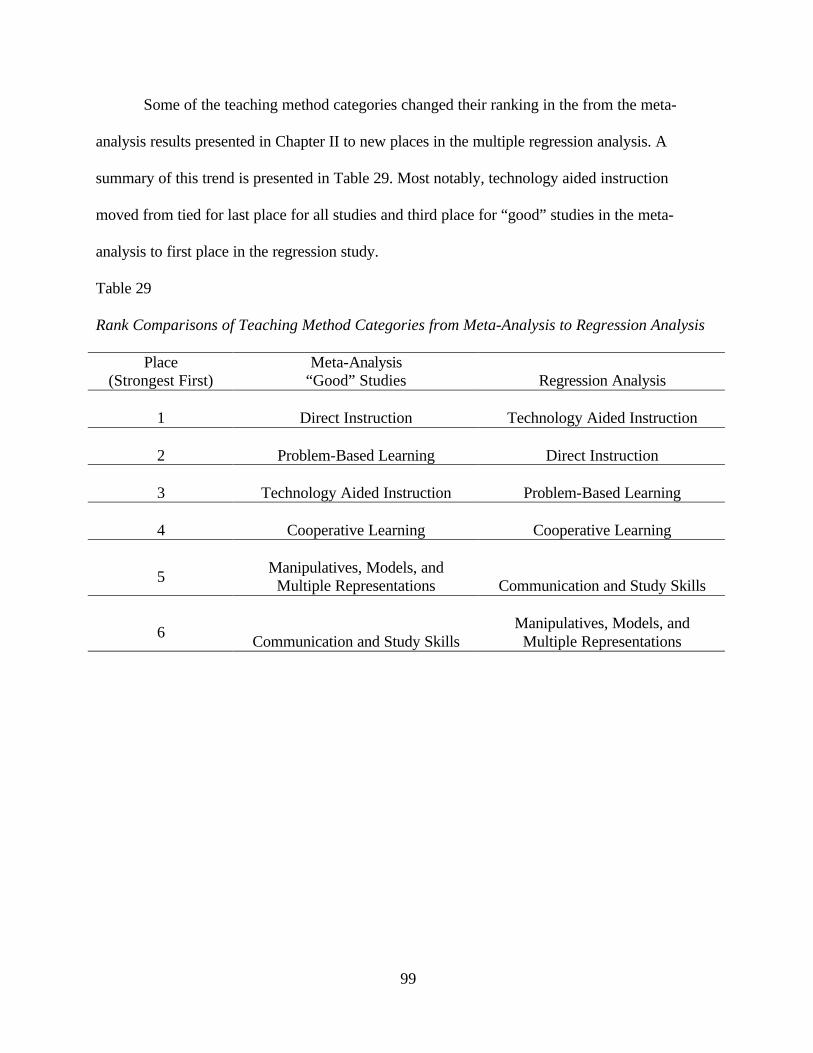
99
Some of the teaching method categories changed their ranking in the from the meta-
analysis results presented in Chapter II to new places in the multiple regression analysis. A
summary of this trend is presented in Table 29. Most notably, technology aided instruction
moved from tied for last place for all studies and third place for “good” studies in the meta-
analysis to first place in the regression study.
Table 29
Rank Comparisons of Teaching Method Categories from Meta-Analysis to Regression Analysis
Place (Strongest First)
Meta-Analysis “Good” Studies
Regression Analysis
1
Direct Instruction
Technology Aided Instruction
2
Problem-Based Learning
Direct Instruction
3
Technology Aided Instruction
Problem-Based Learning
4
Cooperative Learning
Cooperative Learning
5
Manipulatives, Models, and
Multiple Representations
Communication and Study Skills
6
Communication and Study Skills
Manipulatives, Models, and
Multiple Representations
100
CHAPTER V SUMMARY AND CONCLUSIONS
“Teaching mathematics well is a complex endeavor, and there are no easy recipes. ”
(NCTM, 2000)
I conducted this study in an effort to provide a resource for school leaders and
mathematics teachers as they face the challenge of helping all students to learn algebra
knowledge and skills as set forth in Virginia’s Standards of Learning (1995). I sought to derive
teaching methods for algebra from a research base and to determine the influence of these
teaching methods on algebra student achievement. Replicating Marcucci’s (1980) methodology
for meta-analysis, I reviewed experimental research on teaching methods for secondary level
algebra from 1980 to 2001, and I categorized these methods to create generalized domains of
instructional practices. Each category was expanded to include teaching methods found in non-
experimental reports. Results from the meta-analysis were reported in Chapter II and used to
develop a questionnaire designed to determine the frequency with which teachers use the
teaching methods under investigation.
After conducting validity and reliability studies, I administered the questionnaire to a
sample of Algebra I teachers in Region VII of the Commonwealth of Virginia. Data gathered
from the questionnaire was aggregated to provide a mean frequency score for each teaching
method category, along with background characteristics of participants. These teaching method
categories became independent variables in a multiple regression analysis, where the dependent
variable was the participating teacher’s students’ mean scale score on the spring, 2002,
administration of the End of Course SOL Test for Algebra I. Results from this analysis were
reported in Chapter IV.
101
Presented here is a summary of the findings and a discussion. In the context of this
discussion, I will put forward both the limitations and implications of the research results. This
information is followed by recommendations for practitioners, suggestions for future studies,
final reflections, and a conclusion to this dissertation.
Summary of Results Addressing Research Questions
In Chapter I, the following research questions were posed for the meta-analysis review of
literature, the extent of teacher usage of reform- and research-based teaching methods under
study, and the multiple regression analysis.
For the review of literature, the central question addressed is similar to that found in
Marcucci’s (1980) dissertation: Based upon available research evidence, which type of teaching
methodologies appear to be the most effective in teaching algebra knowledge and skills to
students at the secondary school level?
Regarding usage of reform- and research-based teaching methods, the question addressed
is to what extent mathematics education reform is being carried out in the classroom by
Virginia’s Algebra I teachers. In other words, are Algebra I teachers in Virginia using teaching
methods endorsed by the NCTM as well as methods explored in research?
The culminating research question for this study is addressed with the use of teaching
method categories developed in the meta-analysis as independent variables in a multiple
regression analysis: To determine the extent and manner in which the teaching method categories
explain variance in student achievement on Virginia’s End of Course SOL Test for Algebra I. A
summary of the results for each research question is presented here.
102
Review of Literature
Based upon a thorough review of research reports including anecdotal reports, technical
reports for refereed journals, master’s theses, and doctoral dissertations, the teaching methods I
studied in the meta-analysis appear to be the most effective in teaching algebra knowledge and
skills to students at the secondary school level. Considering the limitations affecting the
interpretation of these results, including correlations between effect sizes and study
characteristics discussed in Chapter II, the meta-analysis I conducted establishes a reasonable
basis for defining - and ranking as to their effect sizes - the following teaching method
categories: direct instruction (.55), problem-based learning (.52), cooperative learning (.34),
manipulatives, models, and multiple representations (.23), technology aided instruction (.07), and
communication and study skills (.07).
These methods produced effect sizes for “good” studies ranging from a small 0.16 for
communication and study skills to a near-large 0.67 effect size for direct instruction. The latter
effect translates into a 25-point percentile gain in a normal distribution of scores. Further, I
conducted extensive content validation by experts to ensure that individual teaching methods
discovered in the 34 studies used for meta-analysis, along with non-experimental reports, were
appropriately placed under general teaching method categories.
Usage of Research and Reform Based Teaching Methods
At the turn of the century, the NCTM released Principles and Standards for School
Mathematics. Although this document and others like it are intended to be resource guides for
educational decision makers as they plan for curriculum changes in mathematics (NCTM, 2000),
the question looms as to what extent mathematics education reform is being carried out in the
classroom by Virginia’s Algebra I teachers. Based on the results of this study, it is apparent that
103
Algebra I teachers are embracing teaching methods endorsed by the NCTM as well as methods
explored in research.
With a passing mean scale score of 438.01 (SD = 32.67) and just less than71% of the
teachers’ students achieving a mean score of at least 400 for spring, 2002, this group of teachers
is apparently experiencing increasing success with the standards of learning. Their respective
school districts had a mean pass rate of 64% for the full year of 2000-2001. Participating
teachers indicated that they used all of the teaching method categories more than half of the time
with mean frequencies ranging from 2.56 to 3.75 times out of five class sessions for use of
manipulatives, models, and multiple representation and direct instruction, respectively. Direct
instruction had the largest effect size in the meta-analysis, and it is the teaching method category
most used by the participants in this study.
Regression Analysis of Teaching Methods and Student Achievement
Teaching method categories under investigation were used as independent variables in a
multiple regression analysis, where the dependent variable was the participating teacher’s
students’ mean scale score on the spring, 2002 administration of the End of Course SOL Test for
Algebra I. The categories were entered into a blockwise multiple regression analysis, ranked
according to the strength of their correlations to the dependent variable. For this sample of
teachers, the teaching method categories accounted for 9.7% of the variance in teachers’
students’ mean scale scores for the End of Course SOL Test for Algebra I. These results convey
the extent and manner in which teaching method categories explain variance in mean scale SOL
scores for this sample. Several of the teaching method categories changed their ranking from the
meta-analysis results to new places in the regression analysis. Particularly, technology aided
104
instruction moved from tied for last place for all studies and third place for “good” studies in the
meta-analysis to first place in the regression study.
Limitations and Cautions
Results obtained from the regression analysis convey the extent and manner in which
teaching method categories explain variance in mean scale SOL scores for this sample, not the
general population. The assumption that shared variance between independent variables and the
dependent variable in the population is zero was not overcome, since no R2 values were
statistically significant at p<.05. Further, a causal link between the independent variables and the
dependent variable should not be inferred. In other words, teaching methods did not “cause”
9.7% of the variance in teachers’ students’ mean SOL test scores for this sample of 53 teachers.
There is an association or relationship between the two.
Implications
According to Pedhazer (1997), in explanatory research, the purpose of data analysis is to
“shed light on theory” (p. 8). The choice of research design is based on a theoretical framework
that explains the relationship(s) between variables. That is the case in this study. I selected a
theory of educational productivity as proposed by Walberg (1984) and further selected one small
piece of the theory to explore. This study was not an effort to find a “magic bullet” that causes
students to achieve. It was a methodical attempt to “shed light” on a small part of a theory by
making it more specific and focused; thus, allowing educators to make practical decisions about
teaching methods.
Theory of Educational Productivity
Walberg determined nine factors that “require optimization to increase affective,
behavioral, and cognitive learning” (1984, p. 20). Walberg states that these factors fall into three
105
groups: student aptitude, instruction, and environment. Instruction includes the amount of time
students engage in learning and the quality of the instructional experience, including
psychological and curricular aspects. Referring back to figure 9, the pie chart would be cut into
nine slices in accordance with Walberg’s model. These slices would vary in size, of course, as
the factors they represent would vary in their impact on student learning.
Now consider a particular sample of 53 teachers with one measure of student learning,
the End of Course SOL Test for Algebra I. Suppose that one of the factors, quality of instruction,
could account for nine to ten percent of the impact of the entire model, given that there are eight
other factors accounting for the remaining 90 to 91%. Within the factor labeled “quality of
instruction,” the usage of six teaching methods that vary in their influence on student learning is
quantified in terms of their frequency of usage by the sample of teachers. These methods are
generalized categories that contain several specific practices found in comparative research and
theory based reports.
In light of Walberg’s theory of educational productivity and the limitations discussed
previously, there is one clear implication of the results of this study. Teaching methods can
influence student learning as it is measured by a single outcome, such as the Standards of
Learning test. The effect sizes for the teaching methods displayed in Table 29 give an order of
impact from near large to small for an aggregate of diverse studies with single outcome
measures: direct instruction, problem-based learning, technology-aided instruction, cooperative
learning, manipulatives, models, and multiple representations, and communication and study
skills. The multiple regression analysis gives a different order based on variance shared between
the teaching methods and one outcome measure: TAI, DI, PBL, CL, CS, and MMR.
106
Given that within Walberg’s model, the principal and Algebra I teacher can only control
instructional factors, it would be enlightening for these practitioners to consider the research
findings presented here in order to make instructional decisions that optimize their integrated
usage of research-based teaching methods.
Mathematics Education Reform
One of the premises of the NCTM’s 1989 Curriculum and Evaluation Standards is that
“instruction in mathematics must be significantly revised” (NCTM, 1989, p. 1). According to
Romberg (1998), “Revised instruction implies that classrooms must become discourse
communities where conjectures are made, arguments presented, strategies discussed, and so
forth. In 1998, Romberg painted a bleak description of the typical mathematics classroom.
Instruction follows a five step pattern involving reviewing homework, explanation and examples
of a new problem type by the teacher, seat work where students work independently to practice
the new problem type, summarization of work and a question and answer period conducted by
the teacher, and teacher-assigned homework consisting of similar problems. Invariably, the next
class period begins with a review of these homework problems.
Now consider the following scenario. The teacher identifies a new skill or concept at the
beginning of instruction and provides a rationale for learning it (DI). The teacher then moves on
to present the class with instruction and related problem-solving activities derived from “real-
life” situations that are meant to be interesting to the students (PBL). In the context of these
activities, students use calculators to develop problem-solving strategies or to represent linear
relationships in equations with graphs (TAI and MMR). During the course of the lesson, the
teacher encourages students to use mathematics vocabulary, to share their thinking by
conjecturing, arguing, and justifying ideas orally or in written form, and to ask questions when
107
difficulties or misunderstandings arise (CS). The class concludes with the teacher providing
feedback and reviewing concepts with students, emphasizing comparisons to previously covered
concepts. Students do practice work at home that reviews previously covered material as well as
the day’s target objective (DI).
This scenario is much more optimistic, and it is another implication from the present
study, where the participants indicated that they use all of the teaching method categories more
than half the time. Regardless of whether this change from Romberg’s 1989 description to the
one implied by the results of this study is based on reform or research and theory, the promising
aspect of it in terms of Walberg’s model is that it appears to be a productive change.
Recommendations for Practitioners
Sergiovanni and Starratt (1993) discussed teaching effectiveness in terms of teaching as
decision-making. If we view teaching effectiveness in terms of the teacher’s ability to bring
about desired student learning or educational outcomes, then we must consider two dimensions
of teaching.
1) The teacher’s ability to teach in a way in which learning is viewed by students
as meaningful and significant
2) The teacher’s ability to adjust teaching strategies as warranted by changes in
the teaching and learning situation (p. 107)
According to the authors, “teaching approaches…seem less an issue of which is the best
way than of which is the best way for what purpose” (p.109). The key recommendation to be
considered by practitioners in the case of the present study is to consider first the teaching and
learning situation. Currently, Algebra I teachers in Virginia are faced with a great challenge:
108
teaching all students algebra so that they may successfully complete Algebra I and earn a
verified credit toward graduation for this course by passing the SOL test associated with it.
Which teaching methods will produce the strongest influence on algebra student
learning? To prioritize teaching methods based on the results of this study would suggest a recipe
for teaching; however, the results do suggest that three teaching methods should be prioritized:
direct instruction, problem-based learning, and technology aided instruction.
Direct Instruction
Direct instruction landed in the top two places in both analyses and had the largest effect
size in the meta-analysis. Direct instruction is defined as teaching through establishing a
direction and rationale for learning by relating new concepts to previous learning, leading
students through a specified sequence of instructions based on predetermined steps that introduce
and reinforce a concept, and providing students with practice and feedback relative to how well
they are doing. The direct instruction category produced the largest mean effect size (0.51) and a
percentile gain of 21% for all studies and the largest mean effect size (0.67) and a percentile gain
of 25% for “good” studies in the meta-analysis presented in Chapter II. This indicated a medium
effect (Cohen, 1988) for this teaching method on student achievement in algebra.
Direct instruction teaching methods were used the most by the participants: 3.75 times
out of five class periods with a standard deviation of 0.74. Requiring students to indicate a one-
step-at-a-time process in working equations was the most used DI method (M = 4.19, SD =
1.19). Direct instruction had the second largest correlation to the teacher mean scale End of
Course Test scores for Algebra I (0.18). DI was entered second into the multiple regression
analysis. This teaching method produced a 0.016 change in R2 beyond the first variable.

109
The approach associated with this method lends itself to teaching Virginia’s SOLs:
starting with an objective (an SOL) and focusing instruction on it while making assessments of
student progress and providing feedback. Direct instruction forms a solid foundation for using
other strategies.
Problem-Based Learning
Problem-based learning ranked in the top three in both analyses. It was second in the
meta-analysis and third in the regression analysis. Problem-based learning is defined as teaching
through problem solving where students apply a general rule (deduction) or draw new
conclusions or rules (induction) based on information presented in the problem. Problem-based
learning produced the second largest mean effect size (0.52) and a percentile gain of 20% for all
studies and the second largest mean effect size (0.44) and a percentile gain of 17% for “good”
studies in the meta-analysis presented in Chapter II. This indicated a medium effect (Cohen,
1988) for this teaching method on student achievement in algebra.
The teachers participating in this study used problem-based learning teaching methods
about half of the time, 2.66 times out of five class periods with a standard deviation of 1.08. This
category was ranked fourth in terms of usage. Emphasizing the problem solving process over the
solution was the most used PBL method (M = 3.51, SD = 1.53).
Problem-based learning activities provide a context for learning and create a situation
where students actively construct their knowledge of algebra. When a teacher engages students
with contextual problems and encourages multiple approaches and solutions, he is fostering
learning with understanding. Algebra knowledge and skills are intended for problem solving, and
the End of Course Test for Algebra I is intended to be primarily a problem-solving test; thus, it is
sensible to use this mode of teaching in an Algebra I class.
110
Technology Aided Instruction
Technology aided instruction ranked in the top three methods in the meta-analysis of
“good” studies and in the regression analysis. Technology aided instruction is defined as a
method of instruction characterized by the use of computer software applications and/or hand-
held calculators to enhance instruction. Technology aided instruction produced third largest
mean effect size (0.41) and a percentile gain of 16% for “good” studies in the meta-analysis
presented in Chapter II. This indicated a near medium effect (Cohen, 1988) for this teaching
method on student achievement in algebra.
Technology aided instruction was used well more than half of the time, 3.20 times out of
five class periods with a standard deviation of 0.95, by the teachers participating in this study. It
was second only to direct instruction in terms of usage. Allowing students to use calculators
during tests or quizzes was the most used TAI method (M = 4.60, SD = 1.10).
Technology aided instruction showed the largest correlation to the teacher mean scale
End of Course Test scores for Algebra I (0.19). TAI was entered first into the multiple regression
analysis. This teaching method produced an R2 value of 0.035, representing 3.5% shared
variance with the dependent variable.
TAI can facilitate problem solving skills development by allowing students to
concentrate on the problem instead of calculations, or in the case of studying linear relationships,
plotting points. Students may be able to define and understand problems and solutions more
readily if they are not bogged down with mechanics that they have already mastered. The NCTM
(2000) discusses technology as a matter of principle in mathematics instruction, “electronic
technologies – calculators and computers – are essential tools for teaching, learning, and doing
mathematics. They furnish visual images of mathematical ideas, they facilitate organizing and
111
analyzing data, and they compute efficiently and accurately” (p. 24).It is instructive to note that
the most frequently used individual teaching method within the TAI category was allowing
students to use calculators during testing situations. Practice with the calculator during testing
situations may aid the student in using this tool during the SOL testing.
Integration of Teaching Methods
This research study supports an emphasis on direct instruction, problem-based learning,
and technology aided instruction as a foundation for instruction. Teachers may use a variety of
teaching methods within the framework of the top three teaching methods. Participants’ students
achieved a passing mean scale score of 438.01 (SD = 32.67), and just less than71% of the
students achieved a score of at least 400 for spring, 2002. Their respective school districts had a
mean pass rate of 64% for the full year of 2000-2001. In light of these results, this group of
teachers is apparently experiencing increasing success with the standards of learning. Thus, their
teaching methodologies can enlighten us.
The 53 teachers participating in this study indicated that they used each of the teaching
method categories more than half of the instructional time, given five class periods. Further,
frequencies of usage for all of the teaching method categories showed positive correlations to
each other in the correlation matrix. This indicates that as the teachers’ usage of one teaching
method category increased, so did their usage in others. For example, The strongest relationship
was found between the teacher’s use of problem-based learning and communication and study
skills teaching methods (r=.68). This relationship was statistically significant at p<.01. This
indicates an integration of methodology.
As participating teachers tended to teach through problem solving, where students apply
a general rule or draw new conclusions based on information presented in a problem, the

112
teachers also emphasized teaching students to read and study mathematical information
effectively and provided opportunities for students to communicate mathematical ideas verbally
or in writing. To solve a problem, a student must be able to analyze it and pull out pertinent
information. Next, the student must understand what the problem is asking and develop a plan
for solving the problem. The student must act, verify the results, and communicate these results
to others. Further, the student must be able to articulate any difficulties in solving the problem to
get the right help. As a teacher emphasizes problem solving, he must facilitate it with
communication and study skills.
Cooperative learning; manipulatives, models, and multiple representations; and
communication and study skills teaching methods all ranked in the lower half of the six teaching
method categories studied in both analyses. These teaching methods apparently make less of a
difference in terms of effect sizes where comparative studies were concerned. They probably
best serve as ways to enhance the other teaching method categories through integration.
According to the results of this study, their usage should not form the foundation for instruction,
nor should they be used outside the context of direct instruction.
Final Recommendation
Emphasize direct instruction. Focus on the desired learning outcome and make decisions
about pacing and curriculum emphasis so that students may have every opportunity to learn what
they are expected to learn. Use teaching methods that suit both the concept and the students who
must learn it within the framework of direct instruction, such as problem-based learning and
technology aided instruction. Assess whether students are learning the instructional objectives
with methods that are similar to the End of Course SOL Test for Algebra I. Make decisions to
113
adjust teaching methods based on assessment results. This statement presented in Chapter I from
the NCTM (2000) regarding effective teaching bears repeating here:
Teachers need several different kinds of mathematical knowledge – knowledge about the
whole domain; deep, flexible knowledge about curriculum goals and about the important
ideas that are central to their grade level; knowledge about the challenges students are
likely to encounter in learning these ideas; knowledge about how ideas can be
represented to teach them effectively; and knowledge about how students’ understanding
can be assessed. (p. 17)
Suggestions for Future Studies
This study focused on one small piece of a much larger puzzle involving student
achievement in mathematics in general and algebra specifically. Other avenues of research that
address some of the limitations discussed in the context of my research deserve attention.
The questionnaire developed for this study has extensive research behind it. Content
validation by experts and a high reliability coefficient add to its strength as a research instrument.
Further, I feel that this study may build trust and confidence that mathematics teachers can place
in similar research where they indicate their instructional choices, and their students’ SOL test
scores are analyzed. Another researcher could use the questionnaire to study Algebra I teachers
in Virginia on a much larger scale. Rather than using the teaching method categories as
predictors in a regression analysis with a looming threat of multicollinearity, a researcher could
use the factor analytic method to develop composite teacher types to be used as predictors. This
would be a close replication of Hafner (1993) and would reveal combinations of teaching method
types that influence student achievement.
114
Another possibility is to study the influence of teaching method categories on individual
reporting categories for the SOL test: expressions and operations, relations and functions,
equations and inequalities, and statistics. Discovering which teaching methods influence
achievement for specific reporting categories would assist teachers in developing individualized
instruction for remediation and recovery programs, as test results are reported by category.
Another use for the questionnaire developed here would be to adapt it to an observational
scale. A researcher could use the methods applied by Leclerc, Bertrand, and Dufour (1986) and
Seifert and Beck (1984) to conduct observations in the instructional setting, coding teacher
behaviors according to the questionnaire items and categories. Continuing in this qualitative
vein, the observations would make a sound basis for either interviews or focus group discussions
with the purpose of examining the factors that affect algebra teachers’ instructional decision-
making.
Two fairly large, negative correlations appeared in the correlational matrix for two
background variables in this study. School level (middle or high school) and credit value of the
course (one or two) presented correlations of r = -0.63 and –0.46 with the teacher’s students’
mean scale SOL scores, significant at p<.01. The cause for these correlations may seem obvious:
“brighter” students take Algebra I in middle school and “brighter” students take Algebra I for
one credit at the middle or high school level. The researcher must ask, though, if this is a case of
“brightness” or readiness. Are these students simply more ready to handle the type of abstract
thinking and problem solving necessary for algebra study? Are there students who may not be
ready to learn algebra during their K-12 educations? What factors affect a student’s readiness to
learn algebra? These questions deserve further attention.

115
Web-Page Based Survey
I highly recommend using active server page technology to post a questionnaire on the
internet for surveying participants. The use of this technology makes survey data collection faster
and more accurate, as all responses are automatically entered from a web-based “front end” into
a spread sheet program, such as Microsoft Access. It is also easier to track responses because
there is no mail delay. The researcher can know immediately each day how many respondents
completed the questionnaire. Survey completion and response time is greatly reduced for
participants because their participation only requires logging onto a web-site, entering data, and
submitting it.
I recommend using a personal approach in entreating participants to complete the web-
based questionnaire. It is important to pre-contact the sample with hand-signed post cards and
letters. It is also recommended that the researcher use telephone contacts to pre-contact the
sample and to follow up with non-respondents. The use of the telephone and color post cards
and letters will add to the cost and time associated with the surveying process; however, these
techniques indicate to the participant that the researcher has invested effort and resources. The
web-based questionnaire is a great time-saving measure for the researcher and respondent, but it
still requires a personalized approach.
Reflections
As I worked on this study and became increasingly aware of the complexities involved in
teaching and learning algebra, I also became increasingly concerned with our current emphasis
on testing as a means for accountability. In 1957, the launching of Sputnik apparently catalyzed
our national interest in improving the quality of its educational agenda. The federal government
infused school systems with funding for all sorts of programs in mathematics and science so that

116
we could –for want of a better term – beat the Soviet Union to the moon and retain our status as
the world’s preeminent superpower. While there is no doubt that testing was a part of this reform
movement in education, test results are not the first aspect on which we focus when we highlight
its success. Our greatest outcomes from this era include NASA and other “space-age”
technological programs, the superior U.S. military, the survival of our democratic form of
government and the demise of the Soviet Union, and our world-leading economy.
The current reform movement apparently resulted from a publication, A Nation at Risk
(1983), and other criticisms like it. This document states, among other ideas, that we would
never allow a foreign invader to force an educational system like ours on our children. I must
also submit that we would not allow a foreign invader to seize our children, with all of their
diverse strengths, needs, and backgrounds, and place them in a situation where they must answer
to a single battery of tests, measuring a very specific set of educational outcomes.
Can we continue to focus on teaching and learning when we are becoming increasingly
concerned with testing and test scores? It largely depends on how the tests are used. Tests make
much better diagnostic tools than means for sanctions. Metaphorically speaking, to measure it is
probably better to use a ruler than a hammer. Over time, a heavy-handed use of testing will
undoubtedly produce fantastic results as test scores may be interpreted in many ways. Are test
results, however, a true measure of a nation’s strengths? As Berliner and Biddle (1995) have
suggested, test scores and pass rates can be manipulated to demonstrate growth or to demonstrate
failure, depending on the national agenda. In any case, one resulting impact on our teachers and
students is likely: cynicism. Will we some day look around to see that other nations have
surpassed us economically and technologically, only to wonder how they did it while our test
scores were so high?
117
Conclusion
Teaching mathematics effectively has never been easy, and it has become more
challenging for Virginia’s Algebra I teachers in recent years. It is much like leading young
people into the dark mansion described by Professor Andrew Wiles, the mathematician who
astounded the mathematics community in1993 by proving Fermat’s Last Theorem (Aczel, 1996).
To paraphrase Wiles,
We take algebra students into the first room and it’s dark, completely dark. We stumble
around, bumping into furniture. Gradually, they learn where each piece of furniture is.
And finally, after months have passed, each student finds the light switch and turns it on.
Suddenly, it’s all illuminated and all can see exactly where they were. Then we all enter
the next dark room…
Virginia’s Standards of Learning initiative has provided a focus for teaching and learning
algebra, and it has prompted reform in mathematics education in the Commonwealth.
Simultaneously, the End of Course SOL Test for Algebra I has created a situation where all
students must find their way quickly around the complexities of algebra, regardless of the many
factors that can affect their learning of the knowledge and skills implicit within it. One factor in
this process that the classroom teacher can control is the quality of instruction. As educators, we
owe it to our students to make the most of this factor.
118
Reference List
References marked with an asterisk indicate studies included in the meta-analysis.
Abrami, P.C., Cohen, P. A., & d’Apollonia, S. (1988). Implementation problems in meta-
analysis. Review of Educational Research, 58 (2), 151-179.
Aczel, A. D. (1996). Fermat’s last theorem. New York: Bantam Doubleday Dell Publishing
Group, Inc.
Alexander, K., & Salmon, R. (1995). Public school finance. Boston: Allyn & Bacon.
*Allsop, D. H. (1997). Using class wide peer tutoring to teach beginning algebra problem-
solving skills in heterogeneous classrooms. Remedial and Special Education, 18 (6), 367-
379.
Allsop, D. H. (1999). Using modeling, manipulatives, and mnemonics with eighth-grade math
students. Teaching Exceptional Children, 32 (2), 74-81.
Arcavi, A. (1995). Teaching and learning algebra: Past, present, and future. Journal of
Mathematical Behavior, 14, 145-162.
Austin, J.D., & Vollrath, H.J. (1989). Representing, solving, and using algebraic equations.
Mathematics Teacher, 82, 608-612.
Berliner, D., & Biddle, B. (1995). The manufactured crisis. Reading: Addison-Wesley
Publishing Company.
Blais, D. M. (1988). Constructivism: A theoretical revolution for algebra. Mathematics Teacher,
81, 624-631.
*Brenner, M.E., Brar, T., Duran, R., Mayer, R.E., & Moseley, B., Smith, B., & Webb, D. (1997).
Learning by understanding: The role of multiple representations in learning algebra.
American Education Research Journal, 34, 663-689.

119
Bush, G. (2001, January). No child left behind. [Online]. Available:
http://www.ed.gov/inits/nclb/index.html. [2001, January 31].
*Carroll, W.M. (1992). The use of worked examples in teaching algebra. (Research Report).
(ERIC Document Reproduction Service No. ED 353 130).
*Carroll, W.M. (1994). Using worked examples as an instructional support in the algebra
classroom. Journal of Educational Psychology, 86 (3), 360-367.
Carroll, W.M. (1995). Increasing mathematics confidence by using worked examples.
Mathematics Teacher, 88, 276-279.
Choike, J.R. (2000). Teaching strategies for “algebra for all.” Mathematics Teacher, 93 (7), 556-
560.
*Clay, D.W. (1998). A study to determine the effects of a non-traditional approach to algebra
instruction on student achievement. (Research Report). (ERIC Document Reproduction
Service No. ED 428 963).
Cohen, J. (1988). Statistical power analysis for the behavioral sciences. [2nd Edition]. Hillsdale,
NJ: Erlbaum.
*Collazo, R. U. (1987). The effectiveness of two methods employed in teaching algebra I
(California) (Master’s thesis, California State University, Long Beach, 1987). Masters
Abstracts International, 26, 01.
Commonwealth of Virginia. (1995). Standards of learning for Virginia public schools:
Secondary courses. Richmond, VA: Virginia Board of Education.
120
*Cyrus, R. E. (1995). An investigation of two instructional methods for teaching selected pre-
algebra concepts to minority at-risk seventh grade mathematics students (Doctoral
dissertation, University of Missouri-Saint Louis, 1995). Dissertation Abstracts
International, 56, 8A.
Davis, B.M. (1998). Middle school algebra: Variables for success. (ERIC Document
Reproduction Service No. ED 436 363).
*Denson, P. S. (1989). A comparison of the effectiveness of the Saxon and Dolciani texts and
theories about the teaching of high school algebra (Doctoral dissertation, Claremont
Graduate School, 1989). Dissertation Abstracts International, 50, 10A.
*Dick, D. (1980). An experimental study of the effects of required homework review vs. review
on request upon achievement. (Research Report). (ERIC Document Reproduction Service
No. ED 194 320).
Dillman, D.A. (1978). Mail and telephone surveys: The total design method. New York: John
Wiley & Sons.
*Elshafei, D. L. (1998). A comparison of problem-based and traditional learning in algebra II
(Doctoral dissertation, Indiana University, 1998). Dissertation Abstracts International,
60, 1A.
*Farrell, J. R. (1980). The effects of individualized instruction on the achievement of cognitive
and affective objectives by selected first-year algebra students (Doctoral dissertation,
Iowa State University, 1980). Dissertation Abstracts International, 40, 12A.
Feigenbaum, R. (2000). Algebra for students with learning disabilities. Mathematics Teacher, 93
(4), 270-274.

121
Gall, M., Borg, W., & Gall, J. (1996). Educational research: An introduction (6th ed.).
White Plains, NY: Longman.
Gay, L. R. (1996). Educational research: Competencies for analysis and application. Columbus:
Prentice Hall.
*Gesshel-Green, H. A. (1986). The effect of interactive microcomputer graphics on student
achievement and retention in second year algebra in an academic high school (Doctoral
dissertation, Temple University, 1986). Dissertation Abstracts International, 48, 02A.
Glass, G. V. (1976). Primary, secondary, and meta-analysis of research. Educational Researcher,
5, 3-8.
Glass, G.V. (1978). Integrating findings: The meta-analysis of research. In L.S. Shulman (ed.),
Review of Research in Education. Itasca, IL.: F.E. Peacock.
Glass, G. V., McGaw, B., & Smith, M. L. (1981). Meta-analysis in social research. Beverly
Hills: Sage.
Glass, G.V., & Smith, M.L. (1978). Meta-analysis research on the relationship of class size and
achievement. San Francisco: Far West Laboratory for Educational Research and
Development.
Gordon, J.T. (1988). Writing: A teaching strategy for elementary algebraic fractions. Focus on
Learning Problems in Mathematics, 10 (1), 29-36.
Hafner, A.L. (1993). Teaching-method scales and mathematics-class achievement: What works
with different outcomes? American Educational Research Journal, 30 (1), 71-94.
Hartley, S.S. (1978). A meta-analysis of the effects of individually paced mathematics
instruction (Doctoral dissertation, University of Colorado, 1978). Dissertation Abstracts
International, 30, 4003A.

122
*Hawkins, V. J. (1982). A comparison of two methods of instruction, a saturated learning
environment and traditional learning environment: Its effects on achievement and
retention among female adolescents in first-year algebra (Doctoral dissertation,
University of Connecticut, 1982). Dissertation Abstracts International, 43, 02A.
*Heath, R. D. (1987). The effects of calculators and computers on problem-solving ability,
computational ability and attitude toward mathematics (Doctoral dissertation, Northern
Arizona University, 1987). Dissertation Abstracts International, 48, 05A.
Hembree, R., & Dessart, D.J. (1986). Effects of hand-held calculators in precollege mathematics
education: a meta-analysis. Journal for Research in Mathematics Education, 17, 83-89.
*Hodgkins, M. A. (1994). Students’ understanding of the concept of variable: comparison of two
teaching methods (Master’s thesis, Christopher Newport University, 1994). Masters
Abstracts International, 33, 06.
*Hodo, L. B. (1989). The effects of study skills instruction on achievement and usage of selected
study strategies in algebra II classes (Doctoral dissertation, University of Alabama,
1989). Dissertation Abstracts International, 50, 04A.
Huck, S. W. (2000). Reading statistics and research. New York: Longman.
*Hutchinson, N., & Hemingway, P. (1987). Teaching representation and solution of algebra
word problems to learning disabled students. (Research Report). (ERIC Document
Reproduction Service No. ED 293 272).
Johnson, D.W., & Johnson, R.T. (1999). Learning together and alone: Cooperative, competitive,
and individualistic learning. Boston: Allyn & Bacon.
123
*Keller, J. E. (1984). The effects of table-building problem solving procedures on students’
understanding of variables in pre-algebra (Doctoral dissertation, Ohio State University,
1984). Dissertation Abstracts International, 45, 06A.
Leclerc, M., Bertrand, R., & Dufour, N. (1986). Correlations between teaching practices and
class achievement in introductory algebra. Teaching and Teacher Education, 2 (4), 355-
65.
London, R. (1983). An inductive approach to algebra. The Mathematics Teacher, 76, 582-584.
*Lwo, L.S. (1992). Effects of individualized examples and personalized contexts in computer-
based adaptive teaching of algebra word problems (Doctoral dissertation, Oregon State
University, 1992). Dissertation Abstracts International, 53, 06A.
Maccini, P., & Hughes, C.A. (2000). Effects of a problem-solving strategy on introductory
algebra performance of secondary students with learning disabilities. Learning
Disabilities Research and Practice, 15 (1), 10-21.
Maccini, P., & Ruhl, K.L. (2000). Effects of graduated instructional sequence on the algebra
subtraction of integers by secondary students with learning disabilities. Education and the
Treatment of Children, 23 (4), 465-489.
*Makanong, A. (2000). The effects of constructivist approaches on ninth grade algebra
achievement in Thailand secondary school students (Doctoral dissertation, University of
Minnesota, 2000). Dissertation Abstracts International, 61, 03A.
Mansfield, R.S., & Busse, T.V. (1977). Meta-analysis research: A rejoinder to Glass.
Educational Researcher, 6, 3.
124
Marcucci, R.G. (1980). A meta-analysis of research of teaching mathematical problem solving
(Doctoral dissertation, University of Iowa, 1980). Dissertation Abstracts International,
41, 06A.
Marzano, R.J., Pickering, D.J., & Pollock, J.E. (2001). Classroom instruction that works:
Research-based strategies for increasing student achievement. Alexandria: Association
for Supervision and Curriculum Development.
Mathematical Sciences Education Board. (1990). Reshaping school mathematics. Washington,
DC: National Academy Press.
*Matthews, S.M. (1997). The effects of using two variables when there are two unknowns in
solving algebraic word problems. Mathematics Education Research Journal, 9 (2), 122-
135.
*McClung, L.W. (1998). A study on the use of manipulatives and their effect on student
achievement in high school algebra class. (Research Report). (ERIC Document
Reproduction Service No. ED 425 077).
McCoy, L.P., Baker, T.H., & Little, L.S. (1996). Using multiple representations to communicate:
An algebra challenge. National Council of Teachers of Math Yearbook, 40-44.
McIntosh, M.E. (1997). Guide students to better comprehension of word problems. The Clearing
House, 71, 26-32.
NASA. (2000, October 16). Sputnik and the dawn of the space age. [Online]. Available:
http://www.nasa.gov. [2001, February 11].
125
National Center for Education Statistics. (2000, December). Pursuing excellence: A study of U.S.
eighth-grade mathematics and science teaching from a U.S. perspective, 1995 and 1999.
[Online]. Available: http://www.nces.ed.gov/timss. [2001, Jan. 5].
National Commission on Excellence in Education. (1983). A nation at risk: The imperative for
educational reform. Washington, DC: U.S. Government Printing Office.
National Council of Teachers of Mathematics. (1989). Curriculum and evaluation standards for
school mathematics. Reston, VA: Author.
National Council of Teachers of Mathematics. (1991) Professional Standards for Teaching
Mathematics. Reston, VA: Author.
National Council of Teachers of Mathematics. (1995). Assessment Standards for School
Mathematics. Reston, VA: Author.
National Council of Teachers of Mathematics. (2000). Principles and standards for school
mathematics. Reston, VA: Author.
*Parham, J. W. (1994). An analysis of the effects of tutoring on seventh grade students engaged
in the mastery of pre-algebra concepts (Doctoral dissertation, University of Maryland,
1994). Dissertation Abstracts International, 54, 11A.
Patterson, A. (1999). Grasping graphing. Mathematics Teacher, 92 (9), 758-762.
Pedhazer, E. (1997). Multiple regression in behavioral research: Explanation and prediction.
New York: Holt, Rinehart, and Winston.
Phillipp, R., & Schappelle, B. (1999). Algebra as a generalized arithmetic: Starting with the
known for a change. Mathematics Teacher, 92 (4), 310-316.
126
*Pierce, R. D. (1984). A quasi-experimental study of Saxon’s incremental development model
and its effects on student achievement in first-year algebra (Doctoral dissertation,
University of Tulsa, 1984). Dissertation Abstracts International, 45, 2A.
*Pippen, J. F., and Carr, D.B. (1989). The effects of two reading methods in a content area upon
ninth-grade, first-year algebra students’ problem-solving performance of algebra word
problems and reading achievement. (Research Report). (ERIC Document Reproduction
Service No. ED 315 306).
Polya, G. (1957). How to solve it. New York: Doubleday.
Price, S., & Martin, L. (1997). The equation, the whole equation and nothing but the equation!
One approach to the teaching of linear equations. Educational Studies in Mathematics,
34, 159-181.
Raymond, A.E., & Leinenbach, M. (2000). Collaborative action research on the learning and
teaching of algebra: A story of one mathematics teacher’s development. Educational
Studies in Mathematics, 41, 283-307.
Reese, C., Jerry, L. & Ballator, N. (1997). NAEP 1996 mathematics state report for Virginia.
United States Department of Education, National Center for Education Statistics (NCES).
Reese, C., Miller, K., Mazzeo, J., & Dossey, J. (1997). NAEP 1996 mathematics report card for
the nation and states. United States Department of Education, National Center for
Education Statistics (NCES).
*Rich, B. S. (1990). The effect of the use of graphing calculators on the learning of function
concepts in precalculus mathematics (Doctoral dissertation, University of Iowa, 1990).
Dissertation Abstracts International, 52, 03A.
127
Romberg, T. (1992). The scholarly basis of the school mathematics reform movement in the
United States. International Journal of Educational Research, 17 (5), 419-437.
Romberg, T. (1998). Comments: NCTM’s curriculum and evaluation standards. Teachers
College Record, 100 (1), 8-21.
Scheffler, I. (1975). Basic mathematical skills: Some philosophical and practical remarks. In The
NIE Conference on basic mathematical skills and learning. Vol. 1. Contributed position
papers (pp. 182-189). Euclid, OH, and Los Alamitos, CA: SWRL Educational Research
and Developments.
*Schumacker, R.E., Young, J.I., & Bembry, K.L. (1995). Math attitudes and achievement of
algebra I students: A comparative study of computer assisted and traditional lecture
methods of instruction. Computers in the Schools, 11 (4), 27-33.
Seifert, E. H., & Beck, J. J. (1984). The relationship between task time and learning gains in
secondary schools. The Journal of Educational Research, 78 (1), 5-10.
Sergiovanni, T. S., & Starratt, R. J. (1993). Supervision: A redefinition. New York: McGraw-
Hill.
Slavin, R.E. (1984). Meta-analysis in education: How has it been used? Educational Researcher,
13(8), 6-27.
*Smith, J. E. (2001). The effect of the Carnegie Algebra Tutor on student achievement and
attitude in introductory high school algebra. Retrieved electronically, September 18,
2001, from Virginia Polytechnic Institute and State University Electronic Thesis and
Dissertation Web Site: http://scholar.lib.vt.edu/theses/available/etd-04232001-161143/
128
*St. John, D. J. (1992). A comparison of two methods of teaching eighth grade pre-algebra
students how to construct tables for use in solving selected mathematics problems
(Doctoral dissertation, University of Iowa, 1992). Dissertation Abstracts International,
54, 02A.
Sutherland, R., & Rojano, T. (1993). A spreadsheet approach to solving algebra problems.
Journal of Mathematical Behavior, 12, 353-383.
SSPS Inc. (2001). Statistical package for Social Studies. Upper Saddle River, NJ: Prentice Hall.
Sweller, J. (1989). Cognitive technology: Some procedures for facilitating learning and problem
solving in mathematics and science. Journal of Educational Psychology, 81 (4), 457-466.
Sweller, J., & Cooper, G. (1985). The use of worked examples as a substitute for problem
solving in learning algebra. Cognition and Instruction, 2 (1), 59-89.
*Tenenbaum, G. (1986). The effect of quality of instruction on higher and lower mental
processes and on the prediction of summative achievement. Journal of Experimental
Education, 80 (2), 105-114.
*Thomas, P.G., & Rickhuss, M.G. (1992). An experiment in the use of computer algebra in the
classroom. Education and Computing, 8, 255-263.
United States Congress. (1958). National Defense Education Act. Washington, D.C.: U.S.
Government Printing Office.
U.S. Department of Education. Office of Educational Research and Improvement. National
Center for Education Statistics. The nation’s report card: Mathematics 2000, NCES 2001
– 517, by J.S. Braswell, A.D. Lutkus, W.S. Grigg, S.I. Santapau, B. Tay-Lim, and M.
Johnson. Washington, DC: 2001a.
129
U.S. Department of Education. Office of Educational Research and Improvement. National
Center for Education Statistics. The nation’s report card: State mathematics 2000, report
for Virginia, NCES 2001 – 519VA, by C. Solomon, L. Jerry, and A. Lutkus. Washington,
DC: 2001b.
Virginia Department of Education. (1997). Standards of learning assessment: Program blueprint
for the algebra I test. [Online]. Available: http://www.pen.k12.va.us [2001, September 9].
Virginia Department of Education. (1999). Standards of learning validity and reliability
information: Spring 1998 administration. [Online]. Available: www.pen.k12.va.us
[2001, October 15].
Virginia Department of Education (2001a). Virginia standards of learning assessments, spring
2001 released test: End of course Algebra I. [Online]. Available:
http://www.pen.k12.va.us/VDOE/Instruction/2001sol/algebra_eoc.pdf [2002, February
27].
Virginia Department of Education. (2001b). Mathematics standards of learning sample scope and
sequence for Algebra I. [Online]. Available:
www.pen.k12.va.us/VDOE/Instruction/solscope/ [2002, February 27].
Virginia Department of Education. (2001c). Pass rates 2001. [Online]. Available:
www.pen.k12.va.us [2001, September 22].
Virginia Department of Education. (2002). Mathematics standards of learning curriculum
Framework: Algebra I. [Online]. Available:
http://www.pen.k12.va.us/VDOE/Instruction/Math/math_framework.html [2002, April
15].
130
Wagner, S., & Kieran, C. (1989). The research agenda in algebra: A mathematics education
perspective. In L. Booth (Ed.), Research issues in the learning and teaching of algebra
(pp. 238-246). Hillsdale, NJ: National Council of Teachers of Mathematics.
Walberg, H. J. (1984). Improving the productivity of America’s schools. Educational
Leadership, 41(8), 19-27.
*Watson, M. L. (1996). The impact of a new program for teaching algebra to increase
achievement and persistence in mathematics (Doctoral dissertation, Claremont Graduate
School, 1996). Dissertation Abstracts International, 57, 9A.
*Wilkins, C. W. (1993). The effects of using a problem solving approach to algebra I
instruction. (Research Report). (ERIC Document Reproduction Service No. ED 372 934).
Wilson, L., & Blank, R. (1999). Improving mathematics education using results from NAEP and
TIMSS. Washington, D.C.: State Education Assessment Center. (ERIC Documentation
Reproduction Service No. ED 346 082)
*Wohlgehagen, K. S. (1992). A comparison of the attitude and achievement in mathematics of
algebra I students using computer-based and traditional instructional methods (Doctoral
dissertation, University of North Texas, 1992). Dissertation Abstracts International, 53,
12A.
Yueh, J., & Alessi, S.M. (1988). The effect of reward structure and group ability composition on
cooperative computer-assisted instruction. Journal of Computer-Based Instruction, 15
(1), 18-22.
Zhu, X., & Simon, H. (1987). Learning mathematics from examples and by doing. Cognition and
Instruction, 4 (3), 137-166.
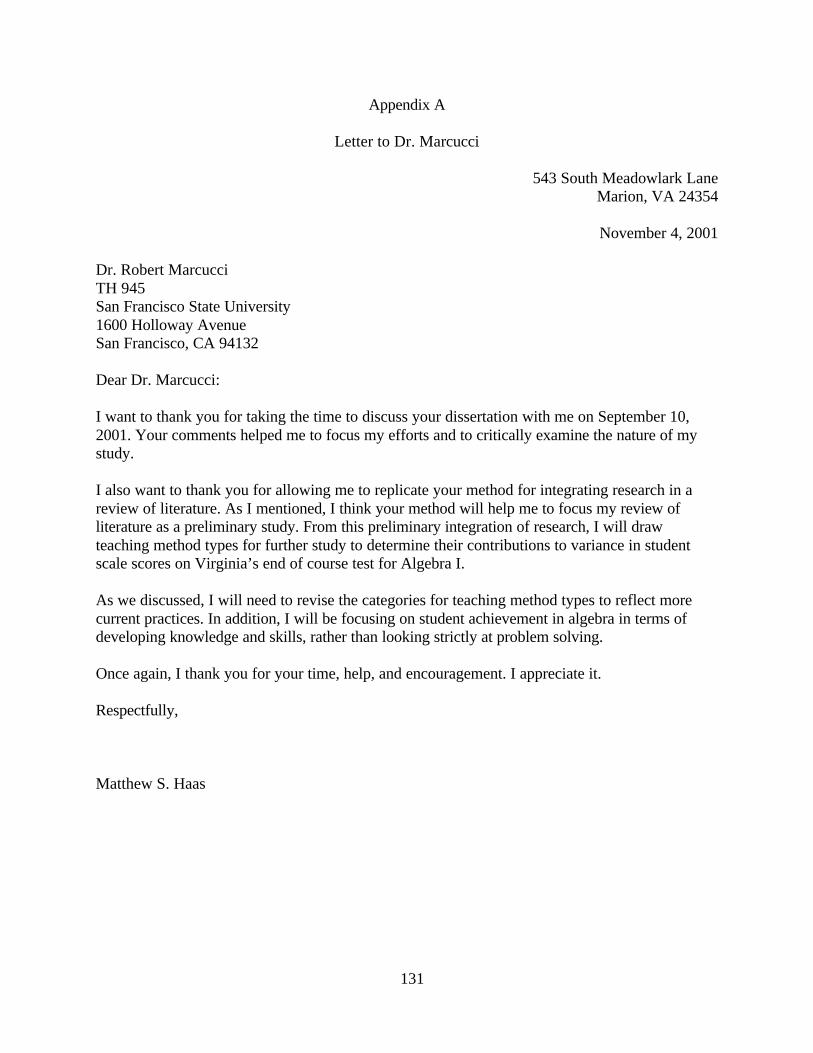
131
Appendix A
Letter to Dr. Marcucci
543 South Meadowlark Lane Marion, VA 24354
November 4, 2001
Dr. Robert Marcucci TH 945 San Francisco State University 1600 Holloway Avenue San Francisco, CA 94132 Dear Dr. Marcucci: I want to thank you for taking the time to discuss your dissertation with me on September 10, 2001. Your comments helped me to focus my efforts and to critically examine the nature of my study. I also want to thank you for allowing me to replicate your method for integrating research in a review of literature. As I mentioned, I think your method will help me to focus my review of literature as a preliminary study. From this preliminary integration of research, I will draw teaching method types for further study to determine their contributions to variance in student scale scores on Virginia’s end of course test for Algebra I. As we discussed, I will need to revise the categories for teaching method types to reflect more current practices. In addition, I will be focusing on student achievement in algebra in terms of developing knowledge and skills, rather than looking strictly at problem solving. Once again, I thank you for your time, help, and encouragement. I appreciate it. Respectfully, Matthew S. Haas
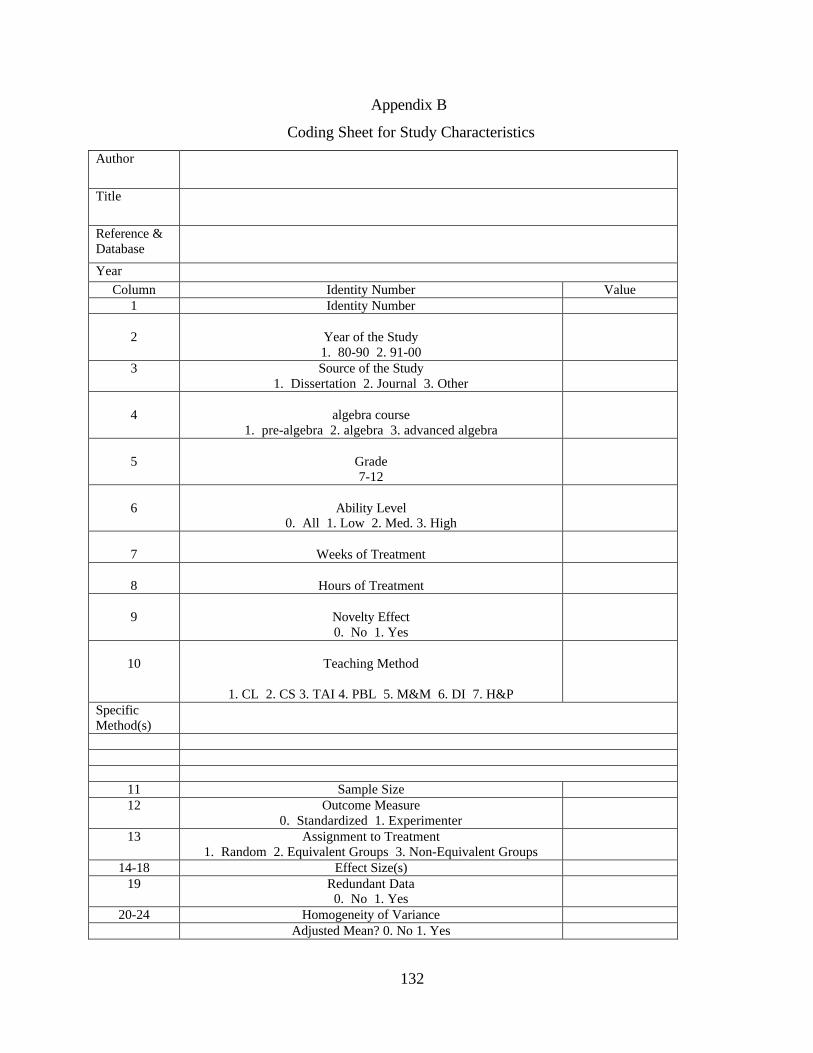
132
Appendix B
Coding Sheet for Study Characteristics
Author
Title
Reference & Database
Year Column Identity Number Value
1 Identity Number
2
Year of the Study 1. 80-90 2. 91-00
3 Source of the Study 1. Dissertation 2. Journal 3. Other
4
algebra course
1. pre-algebra 2. algebra 3. advanced algebra
5
Grade 7-12
6
Ability Level
0. All 1. Low 2. Med. 3. High
7
Weeks of Treatment
8
Hours of Treatment
9
Novelty Effect 0. No 1. Yes
10
Teaching Method
1. CL 2. CS 3. TAI 4. PBL 5. M&M 6. DI 7. H&P
Specific Method(s)
11 Sample Size 12 Outcome Measure
0. Standardized 1. Experimenter
13 Assignment to Treatment 1. Random 2. Equivalent Groups 3. Non-Equivalent Groups
14-18 Effect Size(s) 19 Redundant Data
0. No 1. Yes
20-24 Homogeneity of Variance Adjusted Mean? 0. No 1. Yes
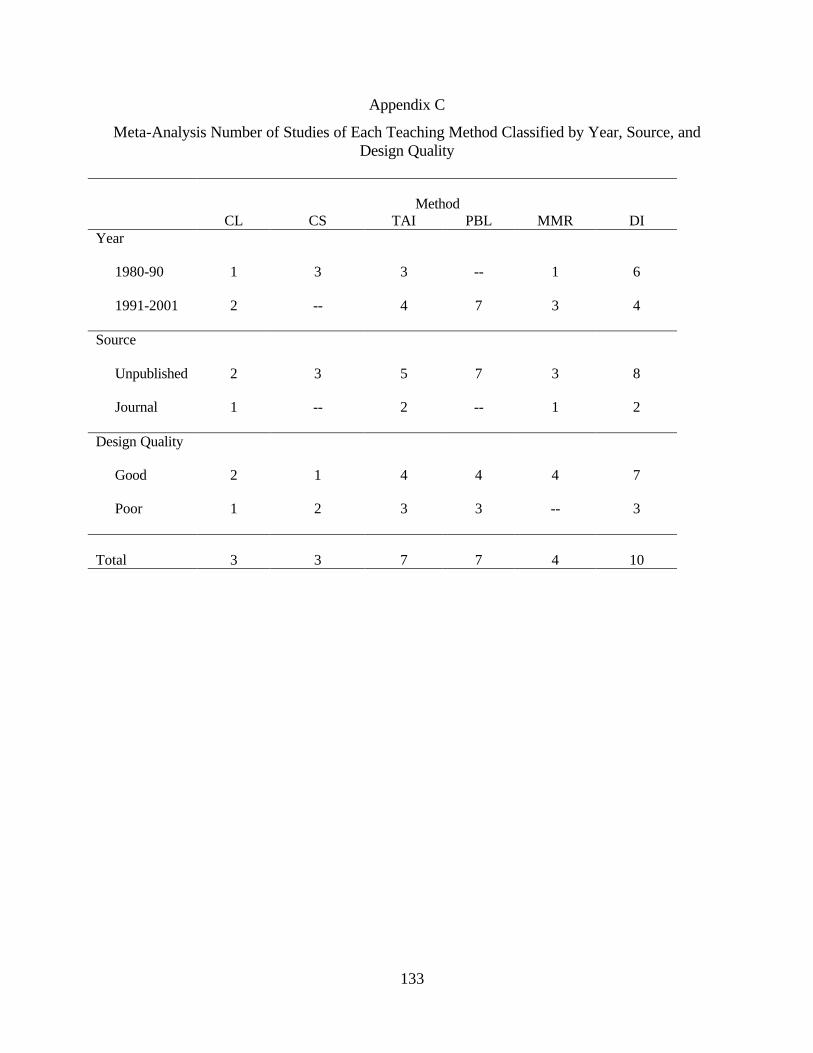
133
Appendix C
Meta-Analysis Number of Studies of Each Teaching Method Classified by Year, Source, and Design Quality
Method CL CS TAI PBL MMR DI Year
1980-90
1 3 3 -- 1 6
1991-2001
2 -- 4 7 3 4
Source
Unpublished
2 3 5 7 3 8
Journal
1 -- 2 -- 1 2
Design Quality
Good
2 1 4 4 4 7
Poor
1 2 3 3 -- 3
Total
3
3
7
7
4
10
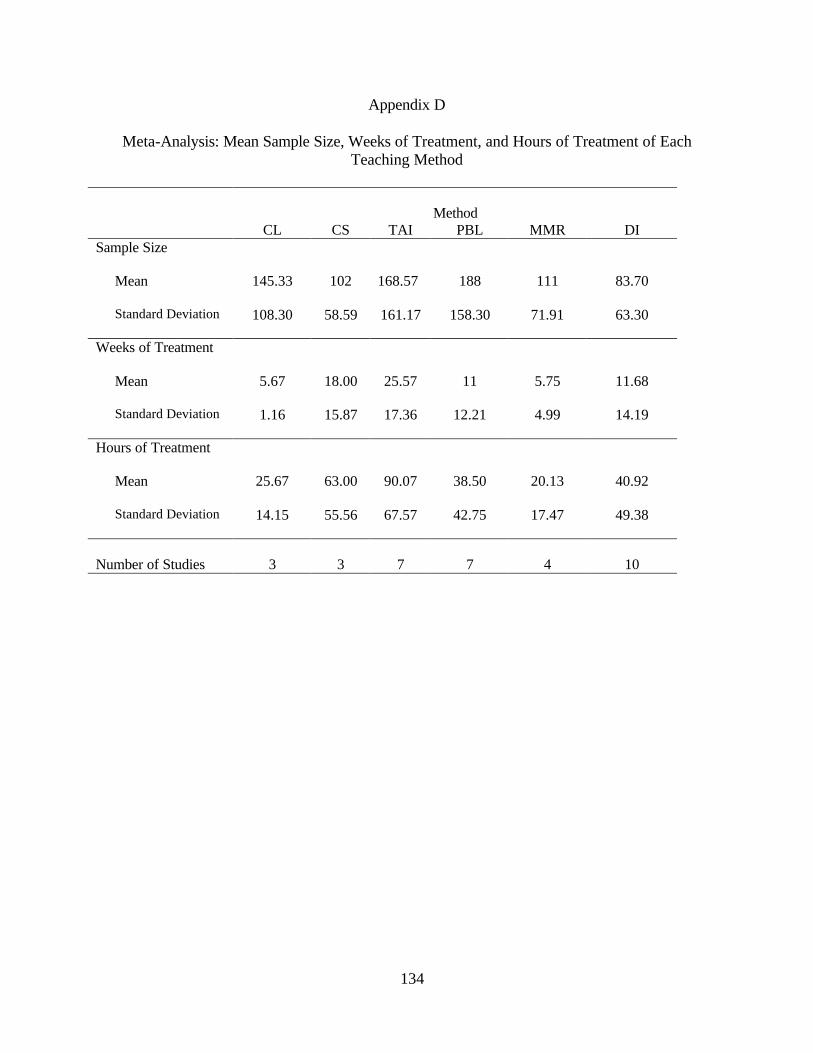
134
Appendix D
Meta-Analysis: Mean Sample Size, Weeks of Treatment, and Hours of Treatment of Each Teaching Method
Method CL CS TAI PBL MMR DI Sample Size
Mean
145.33 102 168.57 188 111 83.70
Standard Deviation
108.30 58.59 161.17 158.30 71.91 63.30
Weeks of Treatment
Mean
5.67 18.00 25.57 11 5.75 11.68
Standard Deviation
1.16 15.87 17.36 12.21 4.99 14.19
Hours of Treatment
Mean
25.67 63.00 90.07 38.50 20.13 40.92
Standard Deviation
14.15 55.56 67.57 42.75 17.47 49.38
Number of Studies
3
3
7
7
4
10

135
Appendix E
Meta-Analysis: Effect Size of Each Teaching Method for All Studies
Method
CL CS TAI PBL MMR DI Mean
0.34
0.07
0.07
0.52
0.23
0.55
Standard Deviation
0.16 0.26 0.69 0.70 0.26 0.59
Number of Effect Sizes
3 5 12 14 9 19
Number of Studies
3
3
7
7
4
10
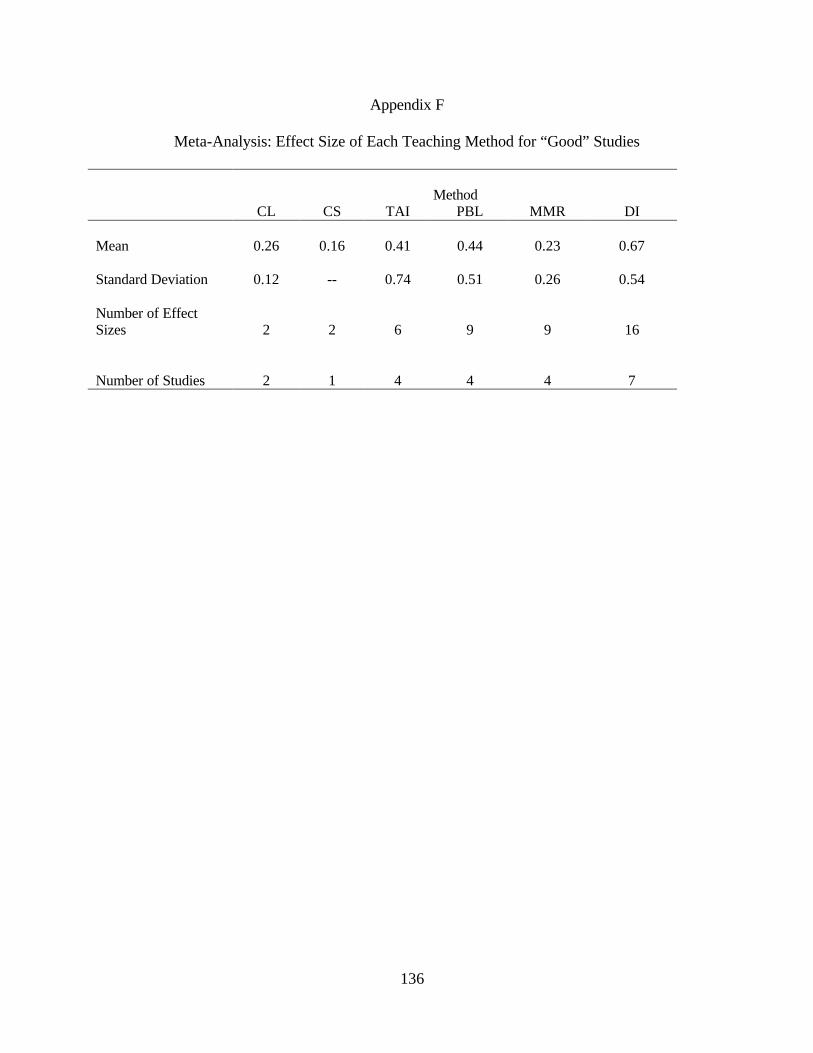
136
Appendix F
Meta-Analysis: Effect Size of Each Teaching Method for “Good” Studies
Method
CL CS TAI PBL MMR DI Mean
0.26
0.16
0.41
0.44
0.23
0.67
Standard Deviation
0.12 -- 0.74 0.51 0.26 0.54
Number of Effect Sizes
2
2
6
9
9
16
Number of Studies
2
1
4
4
4
7
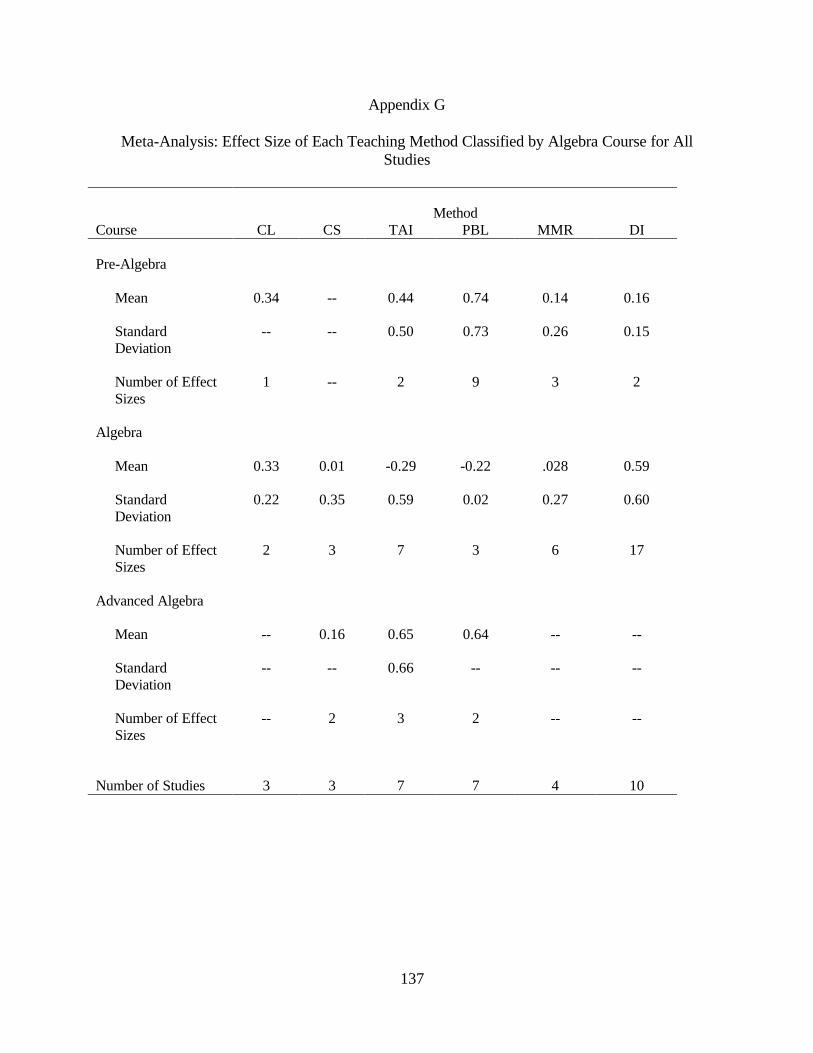
137
Appendix G
Meta-Analysis: Effect Size of Each Teaching Method Classified by Algebra Course for All Studies
Method Course CL CS TAI PBL MMR DI Pre-Algebra
Mean
0.34 -- 0.44 0.74 0.14 0.16
Standard Deviation
-- -- 0.50 0.73 0.26 0.15
Number of Effect Sizes
1 -- 2 9 3 2
Algebra
Mean
0.33 0.01 -0.29 -0.22 .028 0.59
Standard Deviation
0.22 0.35 0.59 0.02 0.27 0.60
Number of Effect Sizes
2 3 7 3 6 17
Advanced Algebra
Mean
-- 0.16 0.65 0.64 -- --
Standard Deviation
-- -- 0.66 -- -- --
Number of Effect Sizes
-- 2 3 2 -- --
Number of Studies
3
3
7
7
4
10
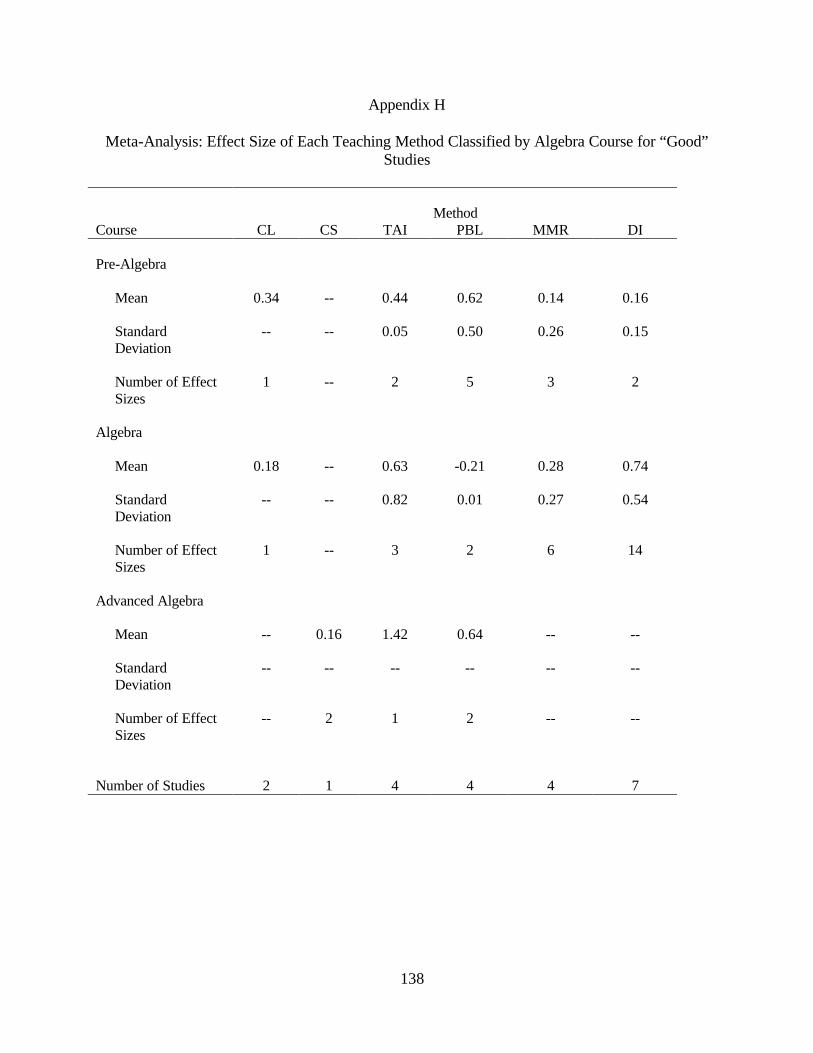
138
Appendix H
Meta-Analysis: Effect Size of Each Teaching Method Classified by Algebra Course for “Good” Studies
Method Course CL CS TAI PBL MMR DI Pre-Algebra
Mean
0.34 -- 0.44 0.62 0.14 0.16
Standard Deviation
-- -- 0.05 0.50
0.26 0.15
Number of Effect Sizes
1 -- 2 5 3 2
Algebra
Mean
0.18 -- 0.63 -0.21 0.28 0.74
Standard Deviation
-- -- 0.82 0.01 0.27 0.54
Number of Effect Sizes
1 -- 3 2 6 14
Advanced Algebra
Mean
-- 0.16 1.42 0.64 -- --
Standard Deviation
-- -- -- -- -- --
Number of Effect Sizes
-- 2 1 2 -- --
Number of Studies
2
1
4
4
4
7
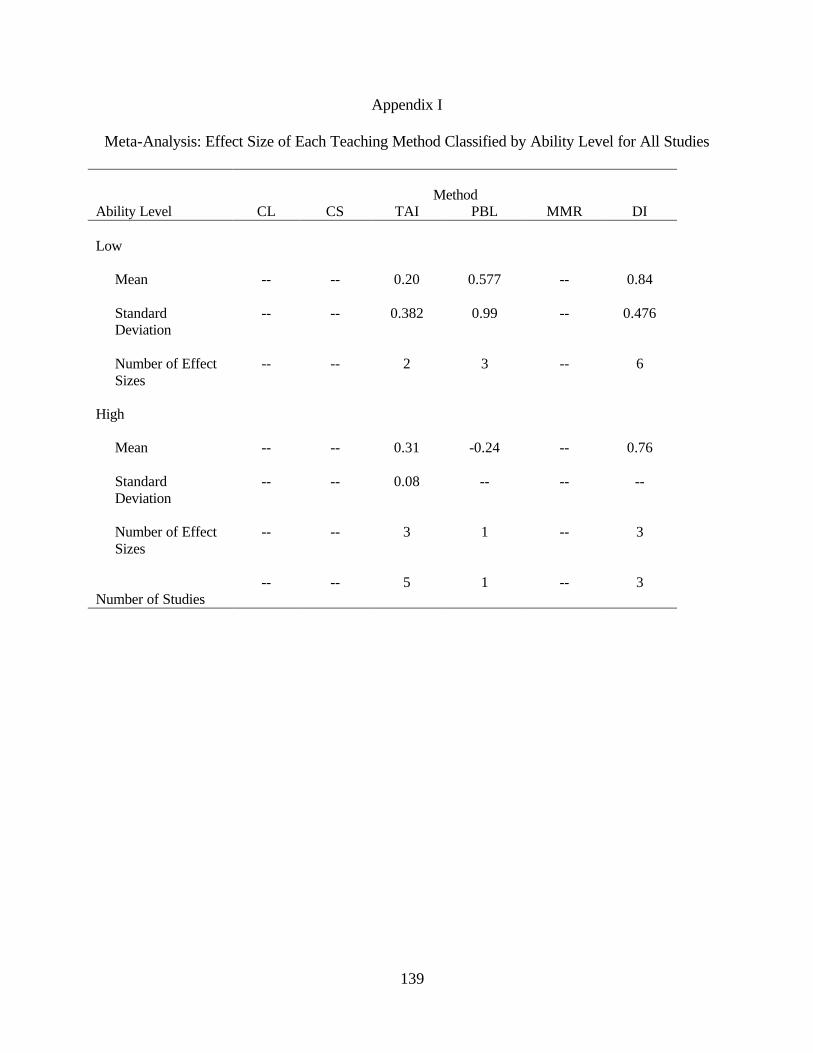
139
Appendix I
Meta-Analysis: Effect Size of Each Teaching Method Classified by Ability Level for All Studies
Method
Ability Level CL CS TAI PBL MMR DI Low
Mean
-- -- 0.20 0.577 -- 0.84
Standard Deviation
-- -- 0.382 0.99 -- 0.476
Number of Effect Sizes
-- -- 2 3 -- 6
High
Mean
-- -- 0.31 -0.24 -- 0.76
Standard Deviation
-- -- 0.08 -- -- --
Number of Effect Sizes
-- -- 3 1 -- 3
Number of Studies
-- -- 5 1 -- 3
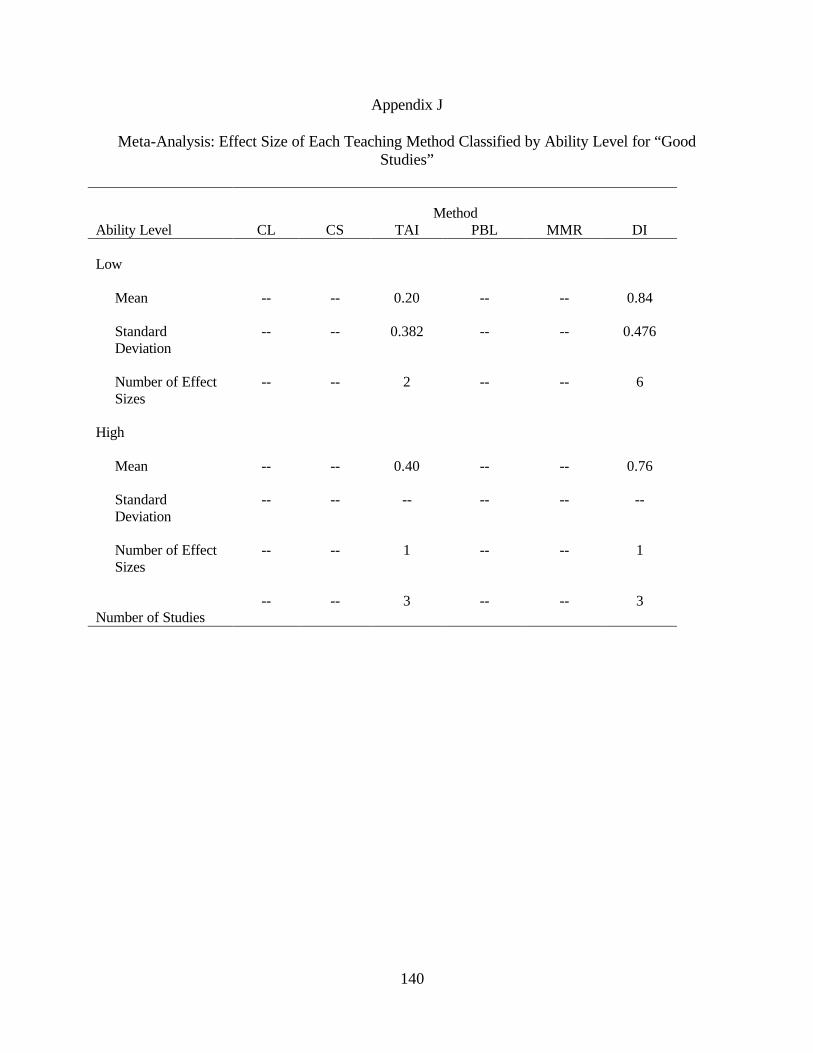
140
Appendix J
Meta-Analysis: Effect Size of Each Teaching Method Classified by Ability Level for “Good Studies”
Method Ability Level CL CS TAI PBL MMR DI Low
Mean
-- -- 0.20 -- -- 0.84
Standard Deviation
-- -- 0.382 -- -- 0.476
Number of Effect Sizes
-- -- 2 -- -- 6
High
Mean
-- -- 0.40 -- -- 0.76
Standard Deviation
-- -- -- -- -- --
Number of Effect Sizes
-- -- 1 -- -- 1
Number of Studies
-- -- 3 -- -- 3
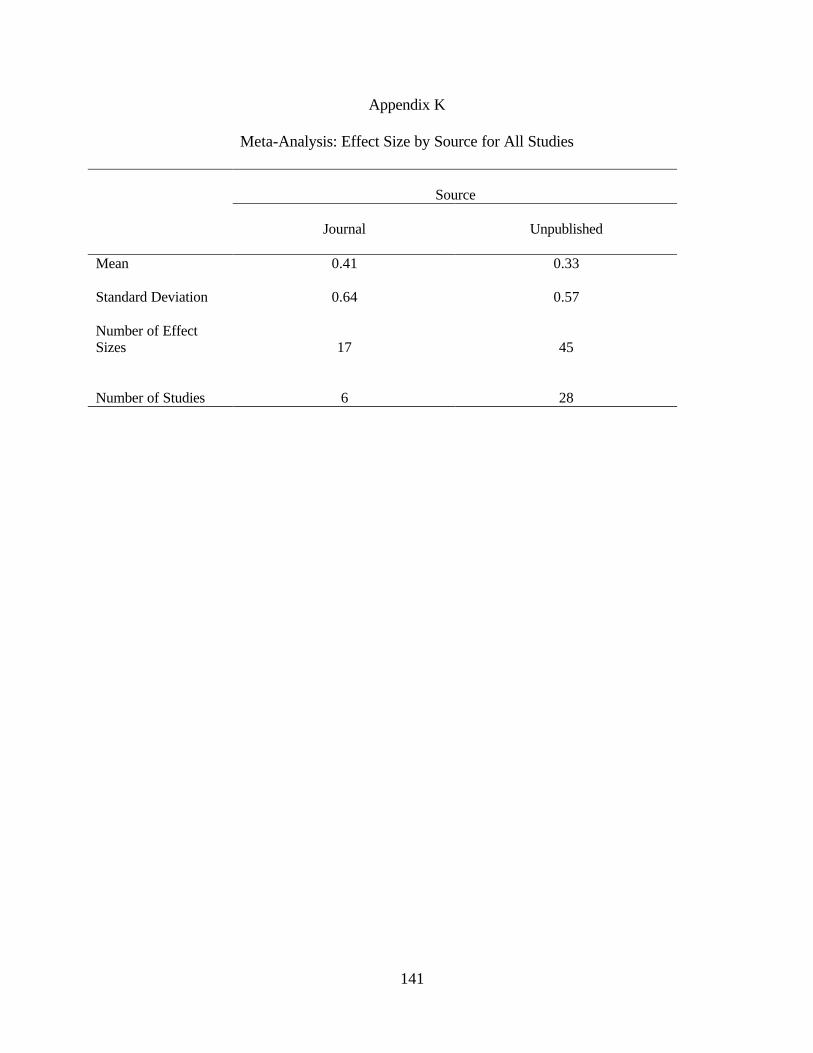
141
Appendix K
Meta-Analysis: Effect Size by Source for All Studies
Source
Journal
Unpublished
Mean
0.41 0.33
Standard Deviation
0.64 0.57
Number of Effect Sizes
17
45
Number of Studies
6
28
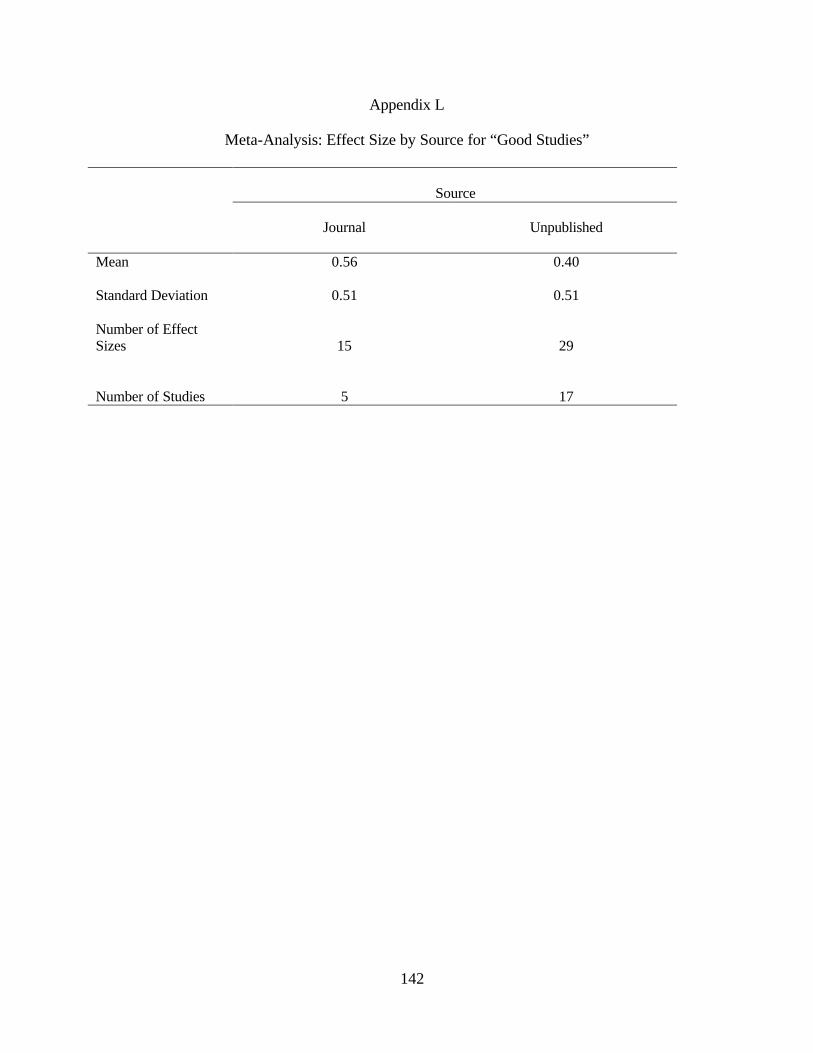
142
Appendix L
Meta-Analysis: Effect Size by Source for “Good Studies”
Source
Journal
Unpublished
Mean
0.56 0.40
Standard Deviation
0.51 0.51
Number of Effect Sizes
15
29
Number of Studies
5
17
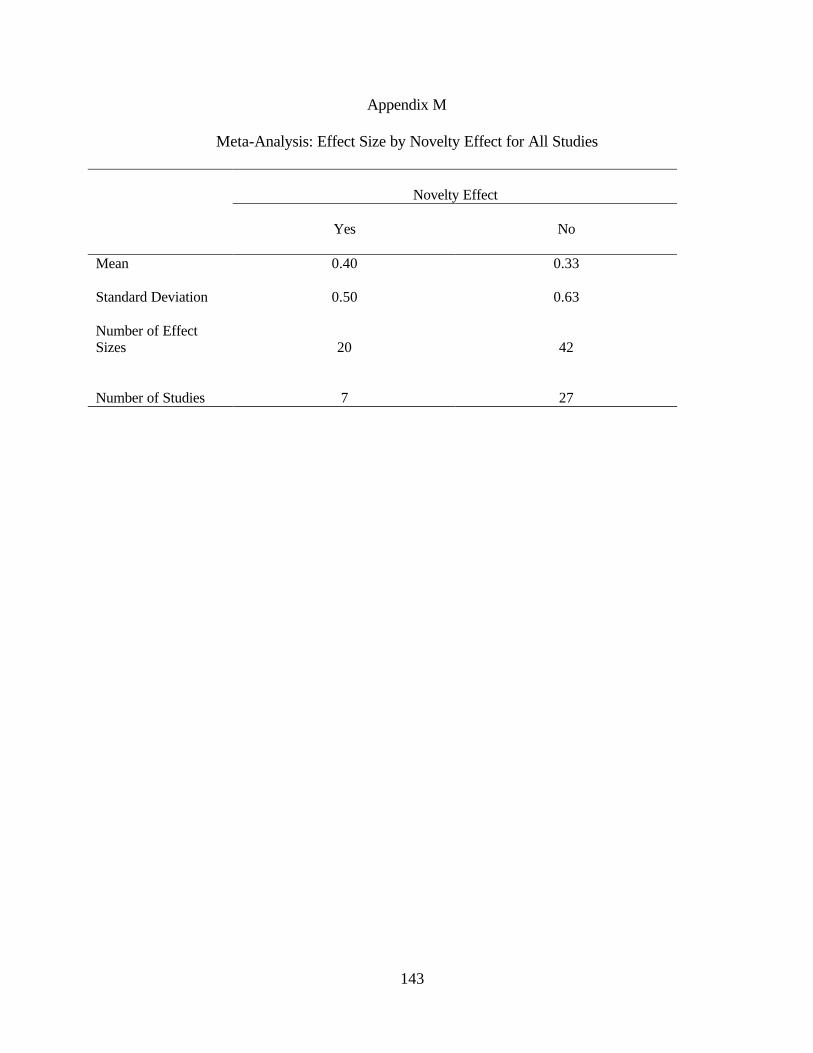
143
Appendix M
Meta-Analysis: Effect Size by Novelty Effect for All Studies
Novelty Effect
Yes
No
Mean
0.40 0.33
Standard Deviation
0.50 0.63
Number of Effect Sizes
20
42
Number of Studies
7
27
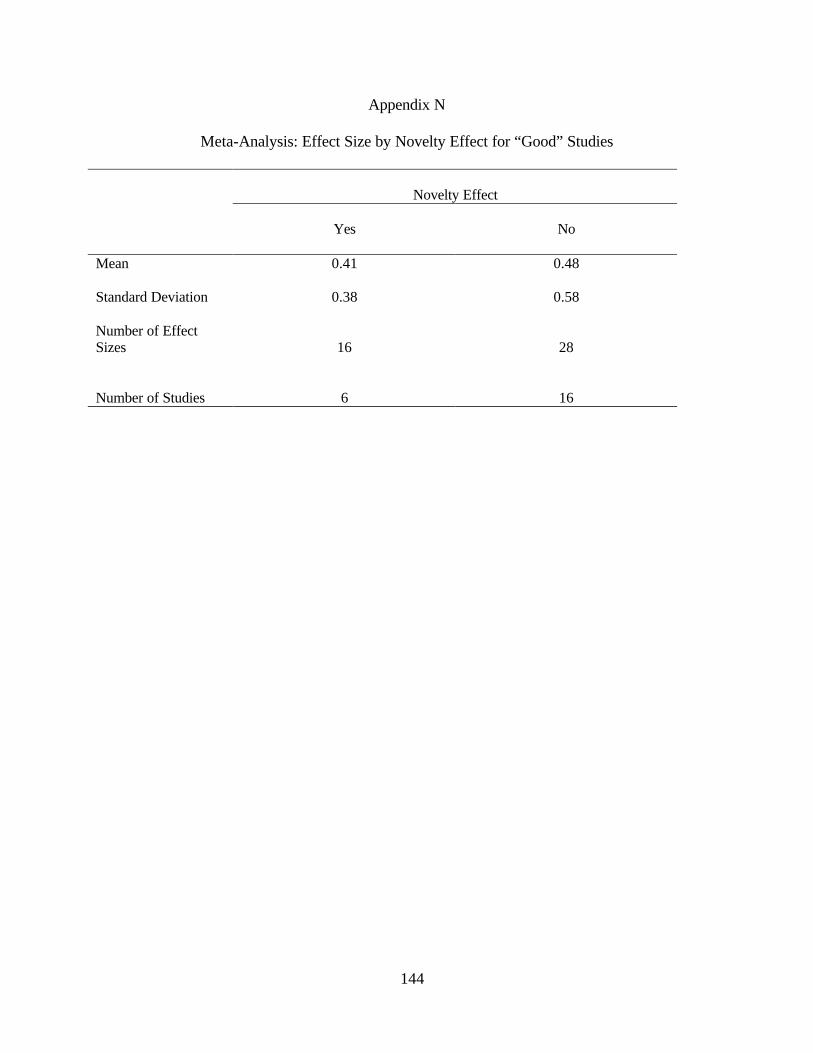
144
Appendix N
Meta-Analysis: Effect Size by Novelty Effect for “Good” Studies
Novelty Effect
Yes
No
Mean
0.41 0.48
Standard Deviation
0.38 0.58
Number of Effect Sizes
16
28
Number of Studies
6
16

145
Appendix O
Meta-Analysis: Effect Size by Outcome Measure for All Studies
Outcome Measure
Standardized
Experimenter
Mean
0.17 0.42
Standard Deviation
0.67 0.55
Number of Effect Sizes
16
46
Number of Studies
11
23
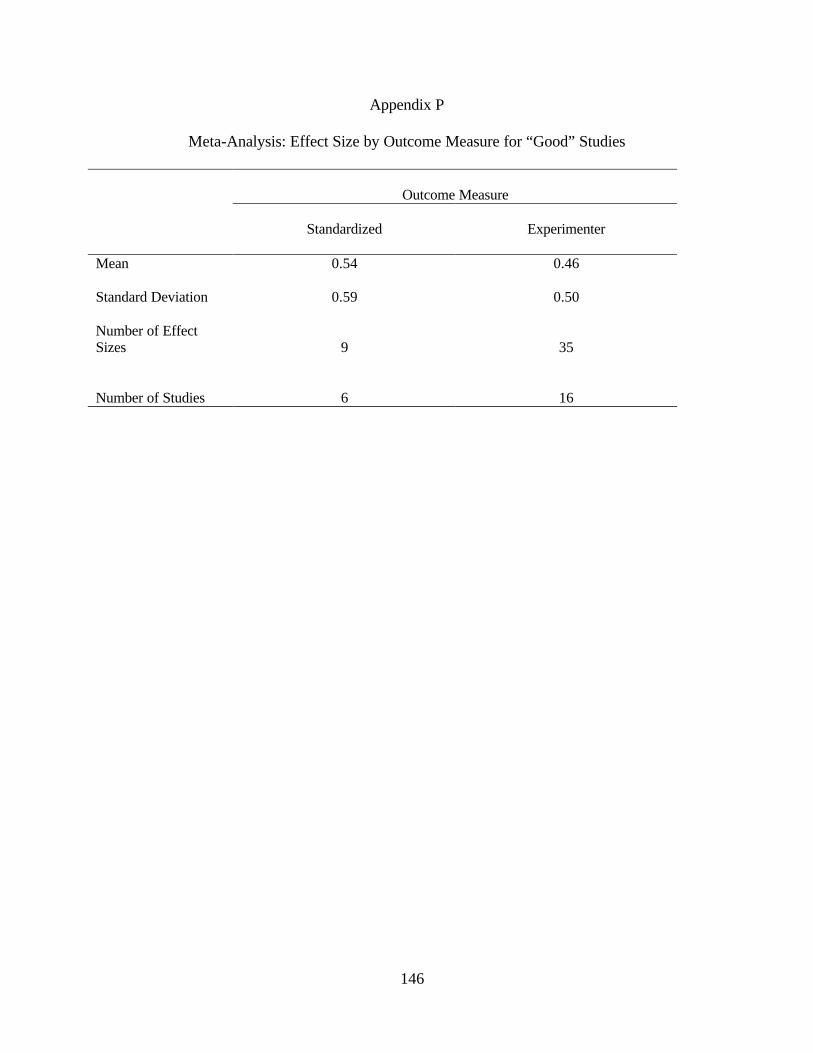
146
Appendix P
Meta-Analysis: Effect Size by Outcome Measure for “Good” Studies
Outcome Measure
Standardized
Experimenter
Mean
0.54 0.46
Standard Deviation
0.59 0.50
Number of Effect Sizes
9
35
Number of Studies
6
16
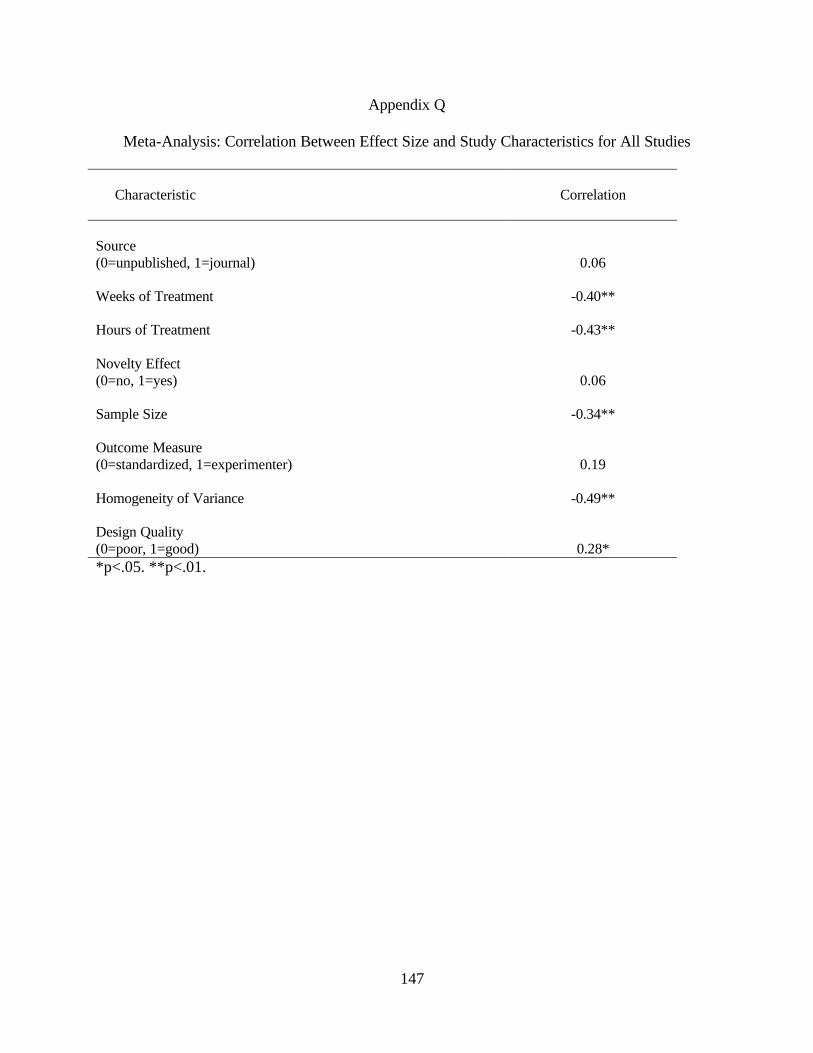
147
Appendix Q
Meta-Analysis: Correlation Between Effect Size and Study Characteristics for All Studies
Characteristic
Correlation
Source (0=unpublished, 1=journal)
0.06 Weeks of Treatment
-0.40**
Hours of Treatment
-0.43**
Novelty Effect (0=no, 1=yes)
0.06 Sample Size
-0.34**
Outcome Measure (0=standardized, 1=experimenter)
0.19 Homogeneity of Variance
-0.49**
Design Quality (0=poor, 1=good)
0.28* *p<.05. **p<.01.
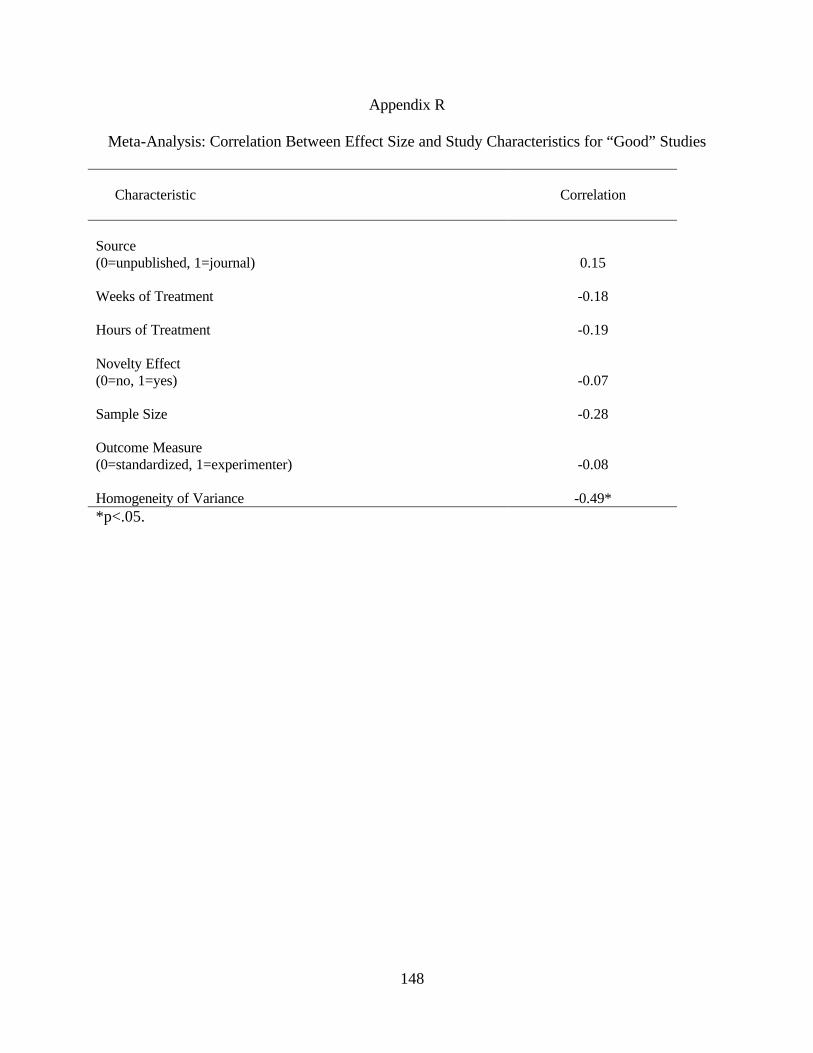
148
Appendix R
Meta-Analysis: Correlation Between Effect Size and Study Characteristics for “Good” Studies
Characteristic
Correlation
Source (0=unpublished, 1=journal)
0.15 Weeks of Treatment
-0.18
Hours of Treatment
-0.19
Novelty Effect (0=no, 1=yes)
-0.07 Sample Size
-0.28
Outcome Measure (0=standardized, 1=experimenter)
-0.08 Homogeneity of Variance
-0.49*
*p<.05.
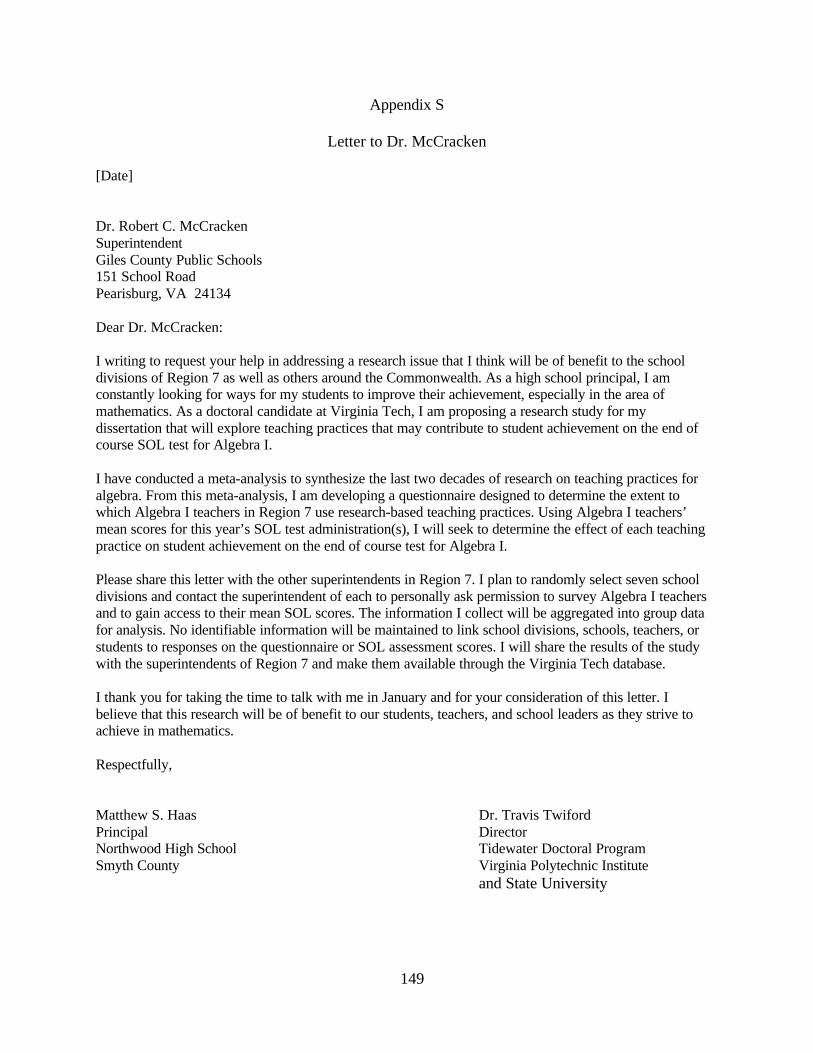
149
Appendix S
Letter to Dr. McCracken [Date] Dr. Robert C. McCracken Superintendent Giles County Public Schools 151 School Road Pearisburg, VA 24134 Dear Dr. McCracken: I writing to request your help in addressing a research issue that I think will be of benefit to the school divisions of Region 7 as well as others around the Commonwealth. As a high school principal, I am constantly looking for ways for my students to improve their achievement, especially in the area of mathematics. As a doctoral candidate at Virginia Tech, I am proposing a research study for my dissertation that will explore teaching practices that may contribute to student achievement on the end of course SOL test for Algebra I. I have conducted a meta-analysis to synthesize the last two decades of research on teaching practices for algebra. From this meta-analysis, I am developing a questionnaire designed to determine the extent to which Algebra I teachers in Region 7 use research-based teaching practices. Using Algebra I teachers’ mean scores for this year’s SOL test administration(s), I will seek to determine the effect of each teaching practice on student achievement on the end of course test for Algebra I. Please share this letter with the other superintendents in Region 7. I plan to randomly select seven school divisions and contact the superintendent of each to personally ask permission to survey Algebra I teachers and to gain access to their mean SOL scores. The information I collect will be aggregated into group data for analysis. No identifiable information will be maintained to link school divisions, schools, teachers, or students to responses on the questionnaire or SOL assessment scores. I will share the results of the study with the superintendents of Region 7 and make them available through the Virginia Tech database. I thank you for taking the time to talk with me in January and for your consideration of this letter. I believe that this research will be of benefit to our students, teachers, and school leaders as they strive to achieve in mathematics. Respectfully, Matthew S. Haas Dr. Travis Twiford Principal Director Northwood High School Tidewater Doctoral Program Smyth County Virginia Polytechnic Institute and State University
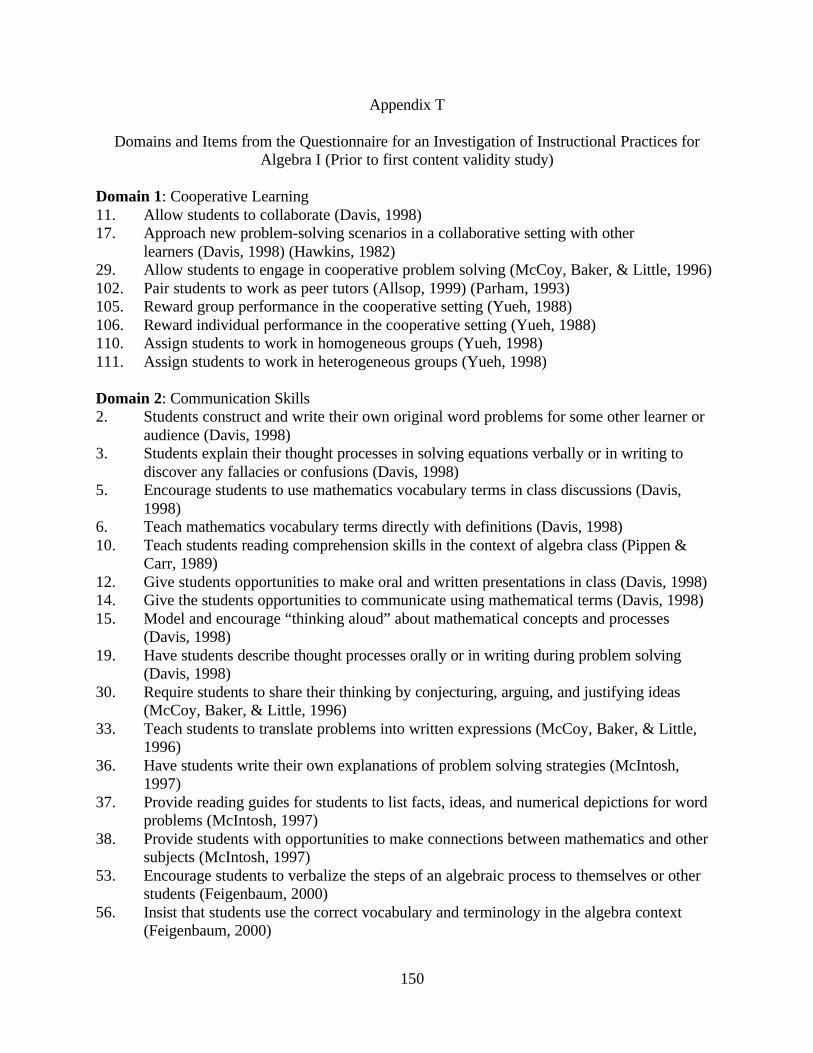
150
Appendix T
Domains and Items from the Questionnaire for an Investigation of Instructional Practices for Algebra I (Prior to first content validity study)
Domain 1: Cooperative Learning 11. Allow students to collaborate (Davis, 1998) 17. Approach new problem-solving scenarios in a collaborative setting with other learners (Davis, 1998) (Hawkins, 1982) 29. Allow students to engage in cooperative problem solving (McCoy, Baker, & Little, 1996) 102. Pair students to work as peer tutors (Allsop, 1999) (Parham, 1993) 105. Reward group performance in the cooperative setting (Yueh, 1988) 106. Reward individual performance in the cooperative setting (Yueh, 1988) 110. Assign students to work in homogeneous groups (Yueh, 1998) 111. Assign students to work in heterogeneous groups (Yueh, 1998) Domain 2: Communication Skills 2. Students construct and write their own original word problems for some other learner or
audience (Davis, 1998) 3. Students explain their thought processes in solving equations verbally or in writing to
discover any fallacies or confusions (Davis, 1998) 5. Encourage students to use mathematics vocabulary terms in class discussions (Davis,
1998) 6. Teach mathematics vocabulary terms directly with definitions (Davis, 1998) 10. Teach students reading comprehension skills in the context of algebra class (Pippen &
Carr, 1989) 12. Give students opportunities to make oral and written presentations in class (Davis, 1998) 14. Give the students opportunities to communicate using mathematical terms (Davis, 1998) 15. Model and encourage “thinking aloud” about mathematical concepts and processes
(Davis, 1998) 19. Have students describe thought processes orally or in writing during problem solving
(Davis, 1998) 30. Require students to share their thinking by conjecturing, arguing, and justifying ideas
(McCoy, Baker, & Little, 1996) 33. Teach students to translate problems into written expressions (McCoy, Baker, & Little,
1996) 36. Have students write their own explanations of problem solving strategies (McIntosh,
1997) 37. Provide reading guides for students to list facts, ideas, and numerical depictions for word
problems (McIntosh, 1997) 38. Provide students with opportunities to make connections between mathematics and other
subjects (McIntosh, 1997) 53. Encourage students to verbalize the steps of an algebraic process to themselves or other
students (Feigenbaum, 2000) 56. Insist that students use the correct vocabulary and terminology in the algebra context
(Feigenbaum, 2000)
151
57. Require that all written mathematics indicate a one-step-at-a-time process (Feigenbaum, 2000)
58. Practice proper reading of word phrases so that students can achieve an accurate translation of both the symbols and meaning of language in algebra (Feigenbaum, 2000)
59. Emphasize proper reading and writing of algebraic terms (Fiegenbaum, 2000) 60. Treat algebra as a foreign language with its own alphabet and grammar (Feigenbaum,
2000) 63. Have students write about their work in problem solving or about their thought processes
in algebra (Gordon, 1988) 64. Promote discussion and verbalization of thought processes and mathematical
relationships (Gordon, 1988) 81. Have students write observations of what they see happening in worked examples of
problems (Carroll, 1995) 95. Assign students to write about algebra (Wilson & Blank, 1999) 97. Encourage students to communicate explanations of responses and procedures in both
verbal and written formats (Wilson & Blank, 1999) 100. Encourage students to explain the reasoning behind their ideas (Wilson & Blank, 1999) 109. Use reading-to-learn in the content area strategies (Pippen & Carr, 1989) Domain 3: Technology Aided Instruction 9. Give simple instructions for calculators and allow students time with guided practice to
examine the technology and discover some of its capabilities (Davis, 1998) 20. Students use calculators during testing situations (Hembree & Dessart, 1986) 21. Students use calculators for problem solving instruction and activities (Hembree &
Dessart, 1986) (Heath, 1987) 22. Students use hand-held electronic calculators as a pedagogical device to help develop
mathematical concepts (Hembree & Dessart, 1986) 23. Students use hand-held electronic calculators as a pedagogical device to help develop
problem-solving strategies (Hembree & Dessart, 1986) 24. Students use calculators for computations (Hembree & Dessart, 1986) 61. Students use the graphing calculator to explore linear relationships (Patterson, 1999) 65. Use computer spreadsheets, such as Microsoft excel, for problem solving instruction
(Sutherland & Rojano, 1993) 94. Assign students to use calculators (Wilson & Blank, 1999) 103. Use computer software to provide practice opportunities (Allsop, 1999) (Heath, 1987)
(Geshel-Green, 1986) (Wohlgehagen, 1992) (Smith, 2001) (Johnson & Rickhuss, 1992) (Schumacker, Young, & Bembry, 1995)
107. Provide graphing calculators for student use (Arcavi, 1995) (Rich, 1990) Domain 4: Problem-Based Learning 8. Involve the whole class in finding a the solution to a problem (Davis, 1998) 13. Engage the students in solving “real world” problems (Davis, 1998) 16. Ask students for similarities and differences between types of equations and problems
(Davis, 1998) 18. Have students recall and use individually constructed schema (rules) in new problem-
solving situations (Davis, 1998)
152
26. Teach generalizable methods for solution (algorithms) by which students can solve mathematically formulated problems (Price & Martin, 1997)
28. Start with a real life situation and draw a mathematical concept out of it with students (Price & Martin, 1997) (Makanong, 2000)
39. Students investigate and formulate problems from given situations (McIntosh, 1997) 40. Students pursue open-ended and extended problem-solving projects (McIntosh, 1997) 50. Teach students to derive a formula for a given problem using arithmetic theory before
assigning and manipulating algebraic symbols (Philipp & Schappelle, 1999) 54. Emphasize understanding of algebraic concepts over reliance on rules (Feigenbaum,
2000) (Watson, 1996) (Cyrus, 1995) 62. Use equations derived from “real life” for instruction on graphing linear equations
(Patterson, 1999) 68. Return to familiar problem settings by modifying them to enrich students’ understanding
of algebra (Choike, 2000) 72. Allow students to discuss their own problem solving processes and recognize many
alternatives (Brenner et al., 1997) (Hodgkins, 1994) 73. Emphasize the problem solving process, rather than the solution (Brenner et al., 1997) 74. Anchor problem solving skills instruction within a meaningful thematic situation
(Brenner et al., 1997) (Elshafei, 1998) 78. Encourage students to experiment with alternative methods for solving problems (Carroll,
1995) (Wilkins, 1993) 83. Analyze already worked out examples of problems with students (Carroll, 1995) 96. Discuss solutions to algebra problems as a class (Wilson & Blank, 1999) 99. Assign students to work on problems that have no immediate solution (Wilson & Blank,
1999) 108. Students observe worked examples of algebraic equations to derive rules for solving
future equations (Zhu & Simon, 1987) Domain 5: Manipulatives, Models, and Multiple Representations 1. Students use cubes or blocks to represent algebraic equations (Raymond & Leinenbach,
2000) (McClung, 1998) 4. Provide a classroom environment with colorful posters demonstrating mathematical
concepts and processes (Davis, 1998) 25. Use realistic metaphors to aid students in visualizing an equation and its parts (Price &
Martin, 1997) 27. Illustrate mathematical concepts for students with pictures (Price & Martin, 1997) 31. Teach students to translate algebraic expressions into graphs (McCoy, Baker, & Little,
1996) 32. Teach students to translate problems into tables (McCoy, Baker, & Little, 1996) (Keller,
1984) (St. John, 1992) 44. Show students how to make charts for solving problems to break information into smaller
pieces (Matthews, 1997) 45. Teach students to use two variables when there are two unknowns in solving algebraic
word problems (Matthews, 1997) 47. Describe a model by thinking aloud and including students in the thinking aloud process
(Maccini & Hughes, 2000)
153
52. Teach students to create templates or patterns for evaluating algebraic expressions (Feigenbaum, 2000)
55. Teach students to use colored pencils to highlight relevant information or to draw specific sign and symbols in algebraic expressions (Feigenbaum, 2000)
69. Emphasize use of multiple representations: words, tables, graphs, and symbols (Choike, 2000)
75. Emphasize problem representation skills using tables, graphs, and symbols (Brenner et al., 1997)
91. Use symbols to help students learn to solve equations (Austin, 1989) 92. Use diagrams to help students learn to solve equations (Austin, 1989) 93. Use physical objects to help students learn to solve equations (Austin, 1989) Domain 6: Direct Instruction: Setting objectives and providing feedback 7. Engage students in discussions of how new concepts relate to previously learned concepts
(Davis, 1998) 41. Begin instruction with a target problem type to simplify (London, 1983) 42. Give students one increasingly difficult problem at a time to simplify during instruction
(London, 1983) 43. Close instruction by discussing problem solutions with students, emphasizing
comparisons to preceding problems (London, 1983) 46. When providing feedback, target incorrect responses and error patterns (Maccini &
Hughes, 2000) 48. Identify a new skill or concept at the beginning of instruction and provide a rationale for
learning it (Maccini & Ruhl, 2000) 49. Provide a graduated sequence of instruction, moving students from the concrete to the
abstract in defined steps (Maccini & Ruhl, 2000) (Hutchinson & Hemingway, 1987) 66. Mold lessons around the interests of individual students (Choike, 2000) (Lwo, 1992)
(Farrell, 1980) 67. When giving feedback, recognize correct thinking in students even when it may be
incomplete or lacking closure Choike, 2000) 84. When a student responds incorrectly, provide a new cue or explanation, giving the
student a chance to try again (Tenenbaum, 1986) 86. Encourage students to ask questions when difficulties or misunderstandings arise
(Tenenbaum, 1986) 87. Administer quizzes to indicate student mastery of unit content and for feedback purposes
(Tenenbaum, 1986) 88. Provide cues to indicate to students what is to be learned and what actions are required of
students (Tenenbaum, 1986) 89. Following each learning task, provide time for error correction (Tenenbaum, 1986) 90. Follow feedback to students with methods for correcting errors (Tenenbaum, 1986) 104. Tell students what skill they will learn, linking the current lesson to past lessons, and
providing a rationale for the importance of learning the skill (Allsop, 1999) (Collazo, 1987)
154
Domain 7: Homework and Practice 34. Grade homework (Dick, 1980) 35. Allow students time to work on homework in class (Dick, 1980) 51. Allow students to use index cards as flash cards with basic algebraic processes, necessary
formulas, or needed reminders (Feigenbaum, 2000) 70. Assign goal-free problems to students for practice (Sweller & Cooper, 1985) 71. Provide students with worked examples along with their practice work (Sweller, 1985) 76. Use worked examples to accompany homework assignments (Carroll, 1994) 77. Use worked examples to accompany class work assignments (Carroll, 1995) 79. Provide worked examples with homework (Carroll, 1995) 80. Have students find errors in worked examples (Carroll, 1995) 82. Use worked examples to introduce or reinforce topics (Carroll, 1995) 85. Provide math games for students to practice algebraic skills (Tenenbaum, 1986) 98. Provide practice in computational skills (Wilson & Blank, 1999) 101. Allow students time to begin homework in class (Wilson & Blank, 1999) 112. Provide students with study skills instruction (Hodo, 1989) 113. Review only homework problems requested by the students (Dick, 1980) 114. When assigning practice work, ensure that the majority of problems assigned review
previously covered material (Clay, 1998) (Pierce, 1984) (Denson, 1989)

155
Appendix U
Domains and Items from the Questionnaire for an Investigation of Instructional Practices for Algebra I (Prior to the second content validation study)
Domain 1: Cooperative Learning 8. Collaborate with the whole class in finding the solution to a problem (Davis, 1998) 11. Allow students to collaborate (Davis, 1998) 17. Approach new problem-solving scenarios in a collaborative setting with other learners (Davis, 1998) (Hawkins, 1982) 29. Allow students to engage in cooperative problem solving (McCoy, Baker, & Little, 1996) 96. Allow students to discuss solutions to algebra problems with peers (Wilson & Blank,
1999) 101. Allow students time to begin homework in class with peer assistance (Wilson & Blank,
1999) 102. Pair students to work as peer tutors (Allsop, 1999) (Parham, 1993) 105. Reward group performance in the cooperative setting (Yueh, 1988) 106. Reward individual performance in the cooperative setting (Yueh, 1988) 110. Assign students to work in homogeneous groups (Yueh, 1998) 111. Assign students to work in heterogeneous groups (Yueh, 1998) Domain 2: Communication and Study Skills 2. Students write original word problems. (Davis, 1998) 3. Students explain their thought processes in solving equations verbally or in writing to
discover any fallacies or confusions (Davis, 1998) 5. Encourage students to use mathematics vocabulary terms in class discussions (Davis,
1998) 6. Provide mathematics vocabulary terms and definitions (Davis, 1998) 10. Provide strategies for reading comprehension. (Pippen & Carr, 1989) 12. Give students opportunities to make oral and written presentations in class (Davis, 1998) 14. Give the students opportunities to communicate verbally and in writing using
mathematical terms (Davis, 1998) 15. Model and encourage “thinking aloud” about mathematical concepts and processes
(Davis, 1998) 19. Have students describe thought processes orally or in writing during problem solving
(Davis, 1998) 30. Require students to share their thinking by conjecturing, arguing, and justifying ideas
(McCoy, Baker, & Little, 1996) 36. Have students write about problem solving strategies (McIntosh, 1997) 37. Provide reading guides for students to improve their word problem comprehension
(McIntosh, 1997) 53. Encourage students to verbalize the steps of an algebraic process to themselves or other
students (Feigenbaum, 2000) 56. Insist that students use the correct vocabulary and terminology in the algebra context
(Feigenbaum, 2000) 58. Practice proper reading of word phrases so that students can achieve an accurate
translation of both the symbols and meaning of language in algebra (Feigenbaum, 2000)
156
59. Emphasize proper reading and writing of algebraic terms (Fiegenbaum, 2000) 60. Treat algebra as a foreign language with its own alphabet and grammar (Feigenbaum,
2000) 63. Have students write about their work in problem solving or about their thought processes
in algebra (Gordon, 1988) 64. Promote discussion and verbalization of thought processes and mathematical
relationships (Gordon, 1988) 81. Have students write observations of what they see happening in worked examples of
problems (Carroll, 1995) 86. Encourage students to ask questions when difficulties or misunderstandings arise
(Tenenbaum, 1986) 95. Assign students to write about algebra (Wilson & Blank, 1999) 97. Encourage students to communicate explanations of responses and procedures in both
verbal and written formats (Wilson & Blank, 1999) 100. Encourage students to explain the reasoning behind their ideas (Wilson & Blank, 1999) 109. Use reading instructional strategies to help students with comprehension (Pippen & Carr,
1989) 112. Provide students with study skills instruction (Hodo, 1989) 113. Review only homework problems requested by the students (Dick, 1980) Domain 3: Technology Aided Instruction 9. Give simple instructions for the calculator and allow students time with guided practice
to examine the technology and discover some of its capabilities (Davis, 1998) 20. Students use calculators during testing situations (Hembree & Dessart, 1986) 21. Students use calculators for problem solving instruction and activities (Hembree &
Dessart, 1986) (Heath, 1987) 22. Students use hand-held electronic calculators as a pedagogical device to help develop
mathematical concepts (Hembree & Dessart, 1986) 23. Students use hand-held electronic calculators as a pedagogical device to help develop
problem-solving strategies (Hembree & Dessart, 1986) 24. Students use calculators for computations (Hembree & Dessart, 1986) 61. Students use the graphing calculator to explore linear relationships (Patterson, 1999) 65. Use computer spreadsheets, such as Microsoft excel, for problem solving instruction
(Sutherland & Rojano, 1993) 94. Assign students to use calculators as a course requirement (Wilson & Blank, 1999) 103. Use computer software to provide practice opportunities (Allsop, 1999) (Heath, 1987)
(Geshel-Green, 1986) (Wohlgehagen, 1992) (Smith, 2001) (Johnson & Rickhuss, 1992) (Schumacker, Young, & Bembry, 1995)
107. Provide graphing calculators for student use (Arcavi, 1995) (Rich, 1990) Domain 4: Problem-Based Learning 13. Engage the students in solving problems based on relevant situations (Davis, 1998) 16. Engage students in finding similarities and differences between types of equations and
problems (Davis, 1998) 18. Have students create their own rules in new problem-solving situations (Davis, 1998)
157
26. Teach general methods for students to solve mathematically formulated problems (Price & Martin, 1997)
28. Draw mathematical concepts from “real-life” problems (Price & Martin, 1997) (Makanong, 2000)
39. Students investigate and create problems from given situations (McIntosh, 1997) 40. Students pursue open-ended and extended problem-solving projects (McIntosh, 1997) 50. Derive a formula for a given problem from theory before assigning and manipulating
algebraic symbols (Philipp & Schappelle, 1999) 54. Emphasize understanding of algebraic concepts over reliance on rules for problem
solving (Feigenbaum, 2000) (Watson, 1996) (Cyrus, 1995) 62. Use linear equations derived from “real life” relationships for instruction on graphing
(Patterson, 1999) 66. Create problems from the interests of individual students (Choike, 2000) (Lwo, 1992)
(Farrell, 1980) 70. Assign goal-free problems to students (Sweller & Cooper, 1985) 72. Recognize many alternative problem-solving practices (Brenner et al., 1997) (Hodgkins,
1994) 73. Emphasize the problem solving process, rather than the solution (Brenner et al., 1997) 74. Anchor problem solving skills instruction within a meaningful situation (Brenner et al.,
1997) (Elshafei, 1998) 78. Encourage students to experiment with alternative methods for solving problems (Carroll,
1995) (Wilkins, 1993) 99. Work on problems that have no immediate solution (Wilson & Blank, 1999) 108. Students examine pre-worked examples of algebraic equations to derive rules for solving
future equations (Zhu & Simon, 1987) Domain 5: Manipulatives, Models, and Multiple Representations 1. Students use cubes or blocks to represent algebraic equations (Raymond & Leinenbach,
2000) (McClung, 1998) 4. Provide a classroom environment with colorful posters representing mathematical
concepts and processes (Davis, 1998) 25. To aid students in visualizing an equation and its parts, compare it to everyday, familiar
things. (Price & Martin, 1997) 27. Illustrate mathematical concepts for students with pictures (Price & Martin, 1997) 31. Teach students to represent algebraic expressions with graphs (McCoy, Baker, & Little,
1996) 32. Teach students to represent problems with tables (McCoy, Baker, & Little, 1996)
(Keller, 1984) (St. John, 1992) 33. Teach students to represent problems with written expressions (McCoy, Baker, & Little,
1996) 38. Make connections between mathematics and other subjects (McIntosh, 1997) 44. Teach students to represent problems with charts to break information into smaller pieces
(Matthews, 1997) 45. Teach students to use two variables when there are two unknowns in solving algebraic
word problems (Matthews, 1997)
158
47. Describe a model by thinking aloud and including students in the thinking aloud process (Maccini & Hughes, 2000)
52. Teach students to create templates or patterns for representing and evaluating algebraic expressions (Feigenbaum, 2000)
55. Use colored pencils to highlight relevant information or to draw specific signs and symbols in algebraic expressions (Feigenbaum, 2000)
69. Emphasize the use of multiple representations: words, tables, graphs, and symbols (Choike, 2000)
75. Represent problems using tables, graphs, and symbols (Brenner et al., 1997) 85. Provide math games for students to practice algebraic skills (Tenenbaum, 1986) 91. Use symbols to help students learn to solve equations (Austin & Vollrath 1989) 92. Use diagrams to help students learn to solve equations (Austin & Vollrath, 1989) 93. Use physical objects to help students learn to solve equations (Austin & Vollrath, 1989) Domain 6: Direct Instruction: Setting objectives and providing feedback 7. Relate new algebra concepts to previously learned concepts (Davis, 1998) 34. Grade homework to provide feedback (Dick, 1980) 35. Allow students time to work on homework in class, while providing assistance (Dick,
1980) 41. Begin instruction with a target skill or concept for students to master (London, 1983) 42. Work one increasingly difficult problem at a time to simplify during instruction (London,
1983) 43. Close instruction by reviewing concepts with students, emphasizing comparisons to
previously covered concepts (London, 1983) 46. When providing feedback, target incorrect responses and error patterns (Maccini &
Hughes, 2000) 48. Identify a new skill or concept at the beginning of instruction and provide a rationale for
learning it (Maccini & Ruhl, 2000) 49. Provide a graduated sequence of instruction, moving students from the concrete to the
abstract in defined steps (Maccini & Ruhl, 2000) (Hutchinson & Hemingway, 1987) 51. Allow students to use index cards as flash cards with basic algebraic processes, necessary
formulas, or needed reminders (Feigenbaum, 2000) 57. Require students to indicate a one-step-at-a-time process in working equations
(Feigenbaum, 2000) 67. When giving feedback, recognize correct thinking in students although it may be
incomplete or lacking closure (Choike, 2000) 68. Return to familiar problem settings when introducing a new problem type (Choike, 2000) 71. Provide students with worked examples along with their practice work (Sweller, 1985) 76. Give pre-worked examples to accompany homework assignments (Carroll, 1994) 77. Give pre-worked examples to accompany class work assignments (Carroll, 1995) 79. Provide pre-worked examples with homework (Carroll, 1995) 80. Have students find errors in worked examples (Carroll, 1995) 82. Use worked examples to introduce or reinforce topics (Carroll, 1995) 83. Analyze already worked out examples of problems with students (Carroll, 1995)
159
84. When a student responds incorrectly, give the student a chance to try again after providing a cue (Tenenbaum, 1986)
87. Administer quizzes to indicate student mastery of unit content and for feedback purposes (Tenenbaum, 1986)
88. Provide cues to indicate to students what is to be learned and what actions are required of students (Tenenbaum, 1986)
89. Following each learning task, provide time for error correction (Tenenbaum, 1986) 90. Follow feedback to students with methods for correcting errors (Tenenbaum, 1986) 98. Provide practice and feedback in computational skills (Wilson & Blank, 1999) 104. Tell students what skill they will learn, linking the current lesson to past lessons, and
providing a rationale for the importance of learning the skill (Allsop, 1999) (Collazo, 1987)
114. When assigning practice work, ensure that the majority of problems assigned review previously covered material (Clay, 1998) (Pierce, 1984) (Denson, 1989)
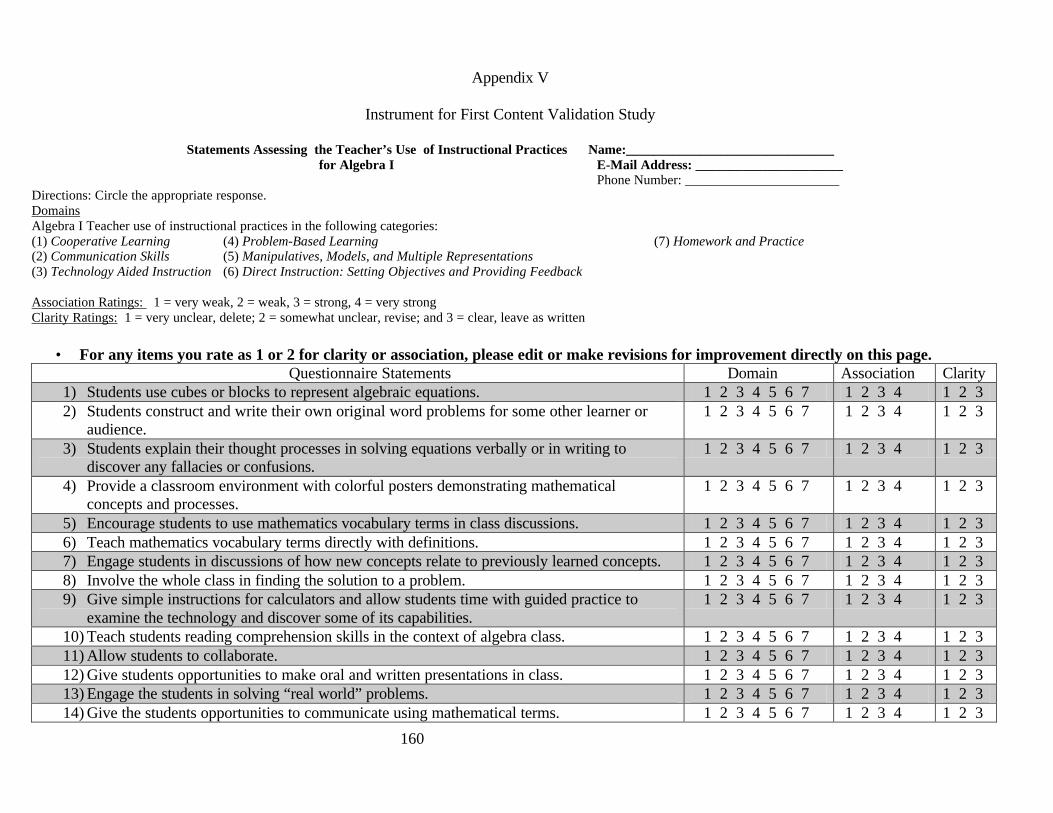
160
Appendix V
Instrument for First Content Validation Study
Statements Assessing the Teacher’s Use of Instructional Practices Name:_______________________________ for Algebra I E-Mail Address: ______________________
Phone Number: _______________________ Directions: Circle the appropriate response. Domains Algebra I Teacher use of instructional practices in the following categories: (1) Cooperative Learning (4) Problem-Based Learning (7) Homework and Practice (2) Communication Skills (5) Manipulatives, Models, and Multiple Representations (3) Technology Aided Instruction (6) Direct Instruction: Setting Objectives and Providing Feedback Association Ratings: 1 = very weak, 2 = weak, 3 = strong, 4 = very strong Clarity Ratings: 1 = very unclear, delete; 2 = somewhat unclear, revise; and 3 = clear, leave as written
• For any items you rate as 1 or 2 for clarity or association, please edit or make revisions for improvement directly on this page. Questionnaire Statements Domain Association Clarity
1) Students use cubes or blocks to represent algebraic equations. 1 2 3 4 5 6 7 1 2 3 4 1 2 3 2) Students construct and write their own original word problems for some other learner or
audience. 1 2 3 4 5 6 7 1 2 3 4 1 2 3
3) Students explain their thought processes in solving equations verbally or in writing to discover any fallacies or confusions.
1 2 3 4 5 6 7 1 2 3 4 1 2 3
4) Provide a classroom environment with colorful posters demonstrating mathematical concepts and processes.
1 2 3 4 5 6 7 1 2 3 4 1 2 3
5) Encourage students to use mathematics vocabulary terms in class discussions. 1 2 3 4 5 6 7 1 2 3 4 1 2 3 6) Teach mathematics vocabulary terms directly with definitions. 1 2 3 4 5 6 7 1 2 3 4 1 2 3 7) Engage students in discussions of how new concepts relate to previously learned concepts. 1 2 3 4 5 6 7 1 2 3 4 1 2 3 8) Involve the whole class in finding the solution to a problem. 1 2 3 4 5 6 7 1 2 3 4 1 2 3 9) Give simple instructions for calculators and allow students time with guided practice to
examine the technology and discover some of its capabilities. 1 2 3 4 5 6 7 1 2 3 4 1 2 3
10) Teach students reading comprehension skills in the context of algebra class. 1 2 3 4 5 6 7 1 2 3 4 1 2 3 11) Allow students to collaborate. 1 2 3 4 5 6 7 1 2 3 4 1 2 3 12) Give students opportunities to make oral and written presentations in class. 1 2 3 4 5 6 7 1 2 3 4 1 2 3 13) Engage the students in solving “real world” problems. 1 2 3 4 5 6 7 1 2 3 4 1 2 3 14) Give the students opportunities to communicate using mathematical terms. 1 2 3 4 5 6 7 1 2 3 4 1 2 3
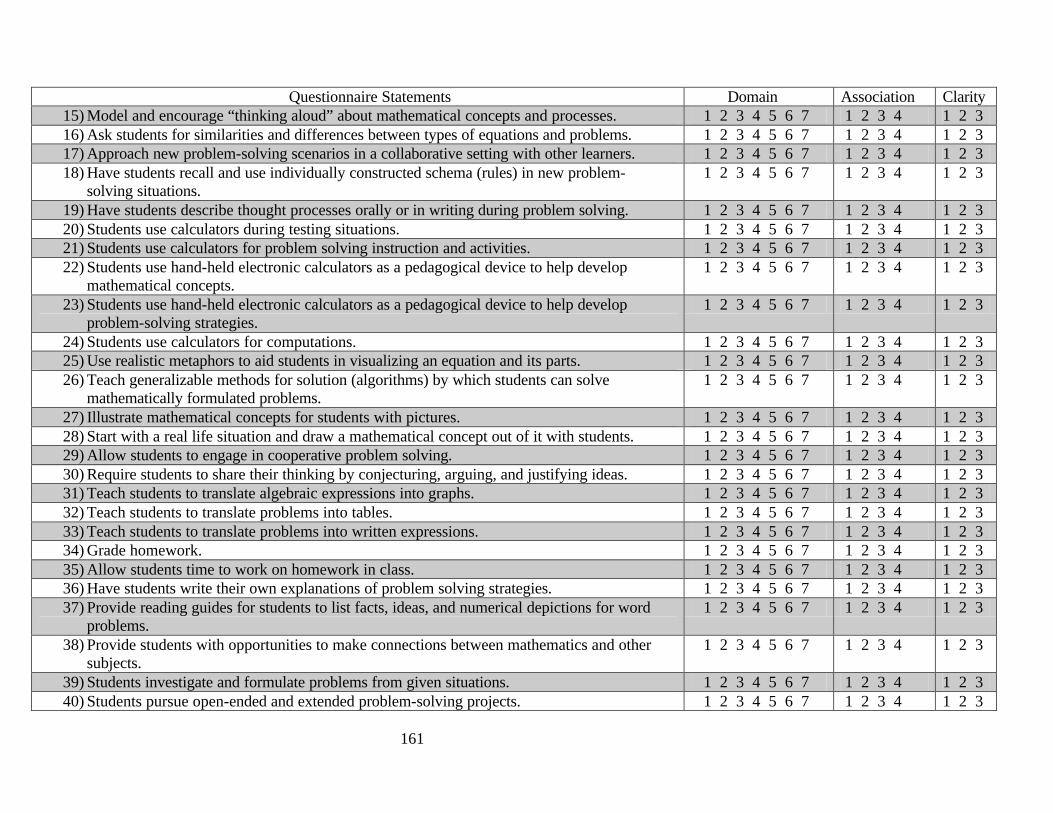
161
Questionnaire Statements Domain Association Clarity
15) Model and encourage “thinking aloud” about mathematical concepts and processes. 1 2 3 4 5 6 7 1 2 3 4 1 2 3 16) Ask students for similarities and differences between types of equations and problems. 1 2 3 4 5 6 7 1 2 3 4 1 2 3 17) Approach new problem-solving scenarios in a collaborative setting with other learners. 1 2 3 4 5 6 7 1 2 3 4 1 2 3 18) Have students recall and use individually constructed schema (rules) in new problem-
solving situations. 1 2 3 4 5 6 7 1 2 3 4 1 2 3
19) Have students describe thought processes orally or in writing during problem solving. 1 2 3 4 5 6 7 1 2 3 4 1 2 3 20) Students use calculators during testing situations. 1 2 3 4 5 6 7 1 2 3 4 1 2 3 21) Students use calculators for problem solving instruction and activities. 1 2 3 4 5 6 7 1 2 3 4 1 2 3 22) Students use hand-held electronic calculators as a pedagogical device to help develop
mathematical concepts. 1 2 3 4 5 6 7 1 2 3 4 1 2 3
23) Students use hand-held electronic calculators as a pedagogical device to help develop problem-solving strategies.
1 2 3 4 5 6 7 1 2 3 4 1 2 3
24) Students use calculators for computations. 1 2 3 4 5 6 7 1 2 3 4 1 2 3 25) Use realistic metaphors to aid students in visualizing an equation and its parts. 1 2 3 4 5 6 7 1 2 3 4 1 2 3 26) Teach generalizable methods for solution (algorithms) by which students can solve
mathematically formulated problems. 1 2 3 4 5 6 7 1 2 3 4 1 2 3
27) Illustrate mathematical concepts for students with pictures. 1 2 3 4 5 6 7 1 2 3 4 1 2 3 28) Start with a real life situation and draw a mathematical concept out of it with students. 1 2 3 4 5 6 7 1 2 3 4 1 2 3 29) Allow students to engage in cooperative problem solving. 1 2 3 4 5 6 7 1 2 3 4 1 2 3 30) Require students to share their thinking by conjecturing, arguing, and justifying ideas. 1 2 3 4 5 6 7 1 2 3 4 1 2 3 31) Teach students to translate algebraic expressions into graphs. 1 2 3 4 5 6 7 1 2 3 4 1 2 3 32) Teach students to translate problems into tables. 1 2 3 4 5 6 7 1 2 3 4 1 2 3 33) Teach students to translate problems into written expressions. 1 2 3 4 5 6 7 1 2 3 4 1 2 3 34) Grade homework. 1 2 3 4 5 6 7 1 2 3 4 1 2 3 35) Allow students time to work on homework in class. 1 2 3 4 5 6 7 1 2 3 4 1 2 3 36) Have students write their own explanations of problem solving strategies. 1 2 3 4 5 6 7 1 2 3 4 1 2 3 37) Provide reading guides for students to list facts, ideas, and numerical depictions for word
problems. 1 2 3 4 5 6 7 1 2 3 4 1 2 3
38) Provide students with opportunities to make connections between mathematics and other subjects.
1 2 3 4 5 6 7 1 2 3 4 1 2 3
39) Students investigate and formulate problems from given situations. 1 2 3 4 5 6 7 1 2 3 4 1 2 3 40) Students pursue open-ended and extended problem-solving projects. 1 2 3 4 5 6 7 1 2 3 4 1 2 3
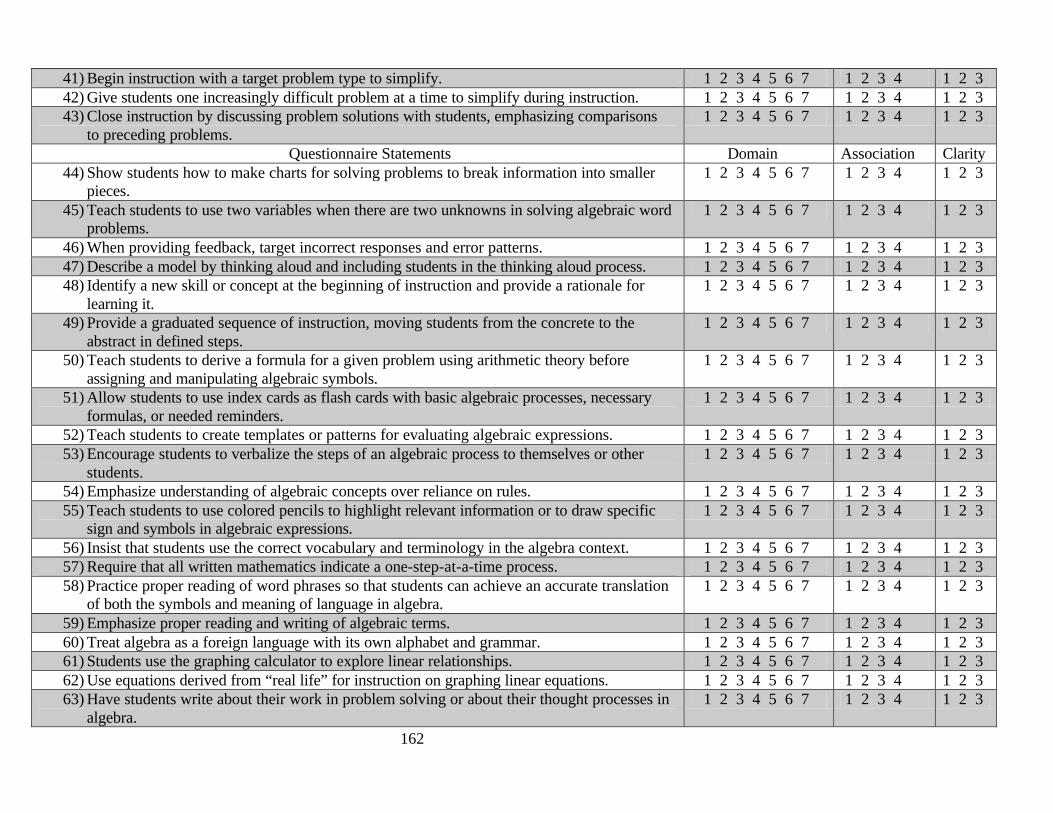
162
41) Begin instruction with a target problem type to simplify. 1 2 3 4 5 6 7 1 2 3 4 1 2 3 42) Give students one increasingly difficult problem at a time to simplify during instruction. 1 2 3 4 5 6 7 1 2 3 4 1 2 3 43) Close instruction by discussing problem solutions with students, emphasizing comparisons
to preceding problems. 1 2 3 4 5 6 7 1 2 3 4 1 2 3
Questionnaire Statements Domain Association Clarity 44) Show students how to make charts for solving problems to break information into smaller
pieces. 1 2 3 4 5 6 7 1 2 3 4 1 2 3
45) Teach students to use two variables when there are two unknowns in solving algebraic word problems.
1 2 3 4 5 6 7 1 2 3 4 1 2 3
46) When providing feedback, target incorrect responses and error patterns. 1 2 3 4 5 6 7 1 2 3 4 1 2 3 47) Describe a model by thinking aloud and including students in the thinking aloud process. 1 2 3 4 5 6 7 1 2 3 4 1 2 3 48) Identify a new skill or concept at the beginning of instruction and provide a rationale for
learning it. 1 2 3 4 5 6 7 1 2 3 4 1 2 3
49) Provide a graduated sequence of instruction, moving students from the concrete to the abstract in defined steps.
1 2 3 4 5 6 7 1 2 3 4 1 2 3
50) Teach students to derive a formula for a given problem using arithmetic theory before assigning and manipulating algebraic symbols.
1 2 3 4 5 6 7 1 2 3 4 1 2 3
51) Allow students to use index cards as flash cards with basic algebraic processes, necessary formulas, or needed reminders.
1 2 3 4 5 6 7 1 2 3 4 1 2 3
52) Teach students to create templates or patterns for evaluating algebraic expressions. 1 2 3 4 5 6 7 1 2 3 4 1 2 3 53) Encourage students to verbalize the steps of an algebraic process to themselves or other
students. 1 2 3 4 5 6 7 1 2 3 4 1 2 3
54) Emphasize understanding of algebraic concepts over reliance on rules. 1 2 3 4 5 6 7 1 2 3 4 1 2 3 55) Teach students to use colored pencils to highlight relevant information or to draw specific
sign and symbols in algebraic expressions. 1 2 3 4 5 6 7 1 2 3 4 1 2 3
56) Insist that students use the correct vocabulary and terminology in the algebra context. 1 2 3 4 5 6 7 1 2 3 4 1 2 3 57) Require that all written mathematics indicate a one-step-at-a-time process. 1 2 3 4 5 6 7 1 2 3 4 1 2 3 58) Practice proper reading of word phrases so that students can achieve an accurate translation
of both the symbols and meaning of language in algebra. 1 2 3 4 5 6 7 1 2 3 4 1 2 3
59) Emphasize proper reading and writing of algebraic terms. 1 2 3 4 5 6 7 1 2 3 4 1 2 3 60) Treat algebra as a foreign language with its own alphabet and grammar. 1 2 3 4 5 6 7 1 2 3 4 1 2 3 61) Students use the graphing calculator to explore linear relationships. 1 2 3 4 5 6 7 1 2 3 4 1 2 3 62) Use equations derived from “real life” for instruction on graphing linear equations. 1 2 3 4 5 6 7 1 2 3 4 1 2 3 63) Have students write about their work in problem solving or about their thought processes in
algebra. 1 2 3 4 5 6 7 1 2 3 4 1 2 3
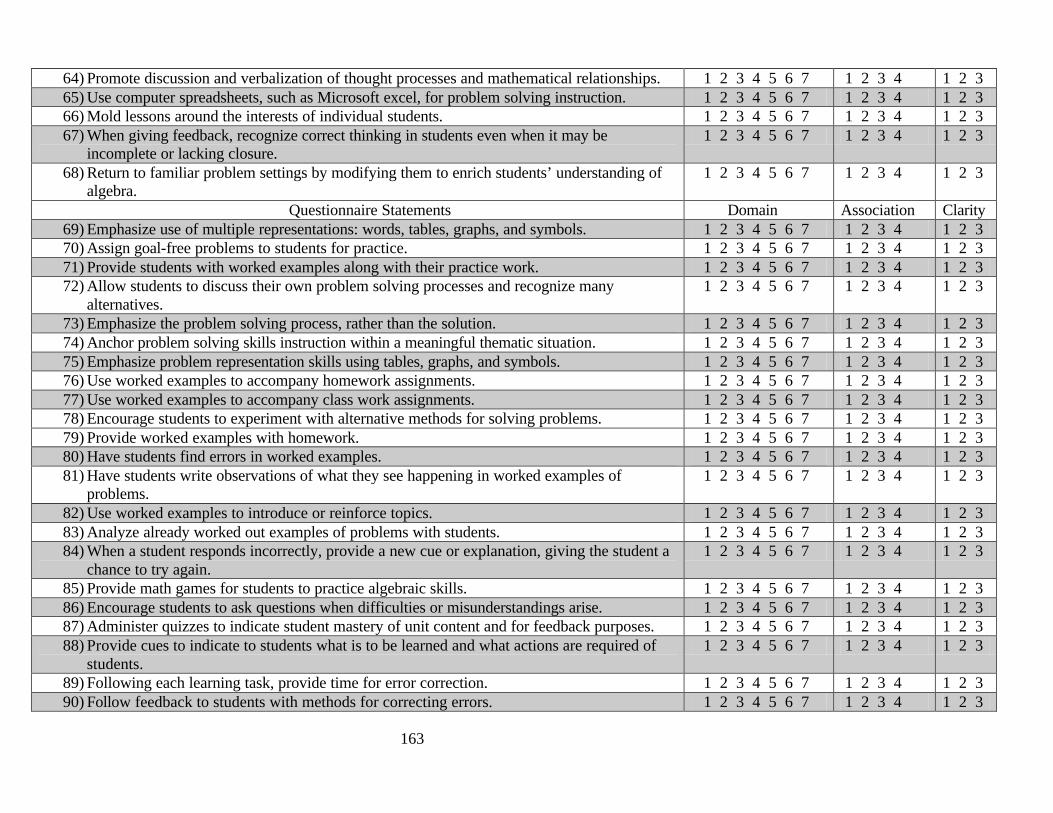
163
64) Promote discussion and verbalization of thought processes and mathematical relationships. 1 2 3 4 5 6 7 1 2 3 4 1 2 3 65) Use computer spreadsheets, such as Microsoft excel, for problem solving instruction. 1 2 3 4 5 6 7 1 2 3 4 1 2 3 66) Mold lessons around the interests of individual students. 1 2 3 4 5 6 7 1 2 3 4 1 2 3 67) When giving feedback, recognize correct thinking in students even when it may be
incomplete or lacking closure. 1 2 3 4 5 6 7 1 2 3 4 1 2 3
68) Return to familiar problem settings by modifying them to enrich students’ understanding of algebra.
1 2 3 4 5 6 7 1 2 3 4 1 2 3
Questionnaire Statements Domain Association Clarity 69) Emphasize use of multiple representations: words, tables, graphs, and symbols. 1 2 3 4 5 6 7 1 2 3 4 1 2 3 70) Assign goal-free problems to students for practice. 1 2 3 4 5 6 7 1 2 3 4 1 2 3 71) Provide students with worked examples along with their practice work. 1 2 3 4 5 6 7 1 2 3 4 1 2 3 72) Allow students to discuss their own problem solving processes and recognize many
alternatives. 1 2 3 4 5 6 7 1 2 3 4 1 2 3
73) Emphasize the problem solving process, rather than the solution. 1 2 3 4 5 6 7 1 2 3 4 1 2 3 74) Anchor problem solving skills instruction within a meaningful thematic situation. 1 2 3 4 5 6 7 1 2 3 4 1 2 3 75) Emphasize problem representation skills using tables, graphs, and symbols. 1 2 3 4 5 6 7 1 2 3 4 1 2 3 76) Use worked examples to accompany homework assignments. 1 2 3 4 5 6 7 1 2 3 4 1 2 3 77) Use worked examples to accompany class work assignments. 1 2 3 4 5 6 7 1 2 3 4 1 2 3 78) Encourage students to experiment with alternative methods for solving problems. 1 2 3 4 5 6 7 1 2 3 4 1 2 3 79) Provide worked examples with homework. 1 2 3 4 5 6 7 1 2 3 4 1 2 3 80) Have students find errors in worked examples. 1 2 3 4 5 6 7 1 2 3 4 1 2 3 81) Have students write observations of what they see happening in worked examples of
problems. 1 2 3 4 5 6 7 1 2 3 4 1 2 3
82) Use worked examples to introduce or reinforce topics. 1 2 3 4 5 6 7 1 2 3 4 1 2 3 83) Analyze already worked out examples of problems with students. 1 2 3 4 5 6 7 1 2 3 4 1 2 3 84) When a student responds incorrectly, provide a new cue or explanation, giving the student a
chance to try again. 1 2 3 4 5 6 7 1 2 3 4 1 2 3
85) Provide math games for students to practice algebraic skills. 1 2 3 4 5 6 7 1 2 3 4 1 2 3 86) Encourage students to ask questions when difficulties or misunderstandings arise. 1 2 3 4 5 6 7 1 2 3 4 1 2 3 87) Administer quizzes to indicate student mastery of unit content and for feedback purposes. 1 2 3 4 5 6 7 1 2 3 4 1 2 3 88) Provide cues to indicate to students what is to be learned and what actions are required of
students. 1 2 3 4 5 6 7 1 2 3 4 1 2 3
89) Following each learning task, provide time for error correction. 1 2 3 4 5 6 7 1 2 3 4 1 2 3 90) Follow feedback to students with methods for correcting errors. 1 2 3 4 5 6 7 1 2 3 4 1 2 3
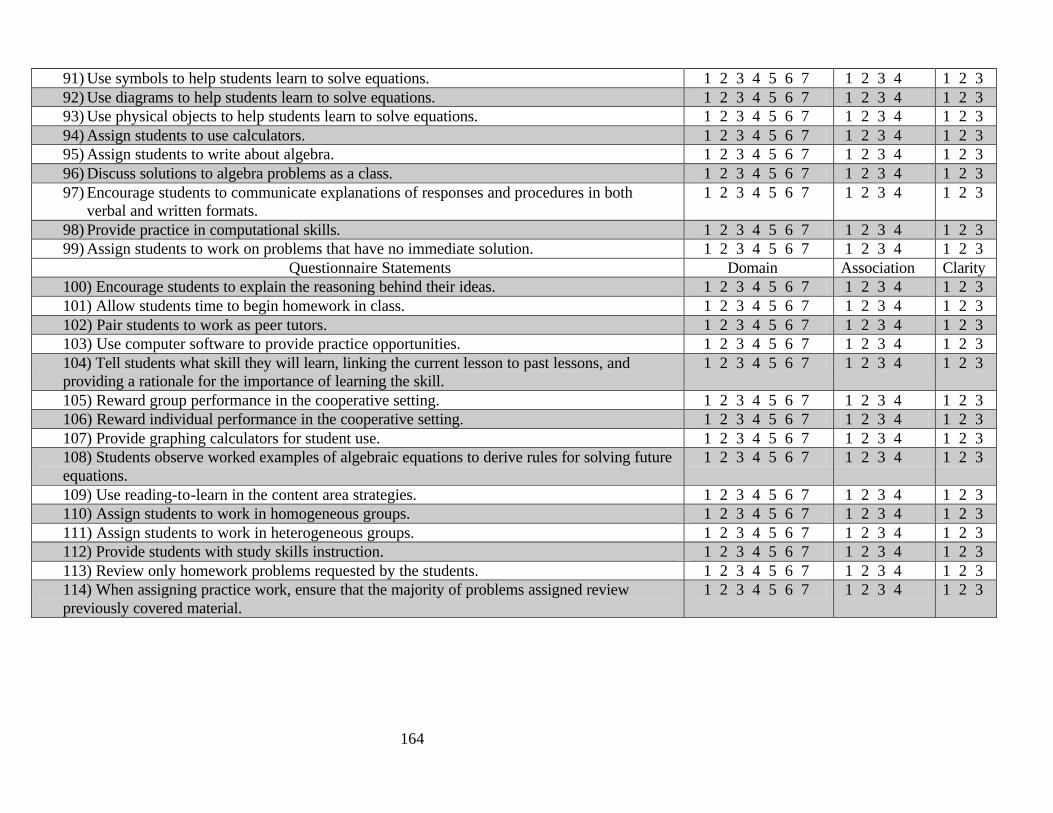
164
91) Use symbols to help students learn to solve equations. 1 2 3 4 5 6 7 1 2 3 4 1 2 3 92) Use diagrams to help students learn to solve equations. 1 2 3 4 5 6 7 1 2 3 4 1 2 3 93) Use physical objects to help students learn to solve equations. 1 2 3 4 5 6 7 1 2 3 4 1 2 3 94) Assign students to use calculators. 1 2 3 4 5 6 7 1 2 3 4 1 2 3 95) Assign students to write about algebra. 1 2 3 4 5 6 7 1 2 3 4 1 2 3 96) Discuss solutions to algebra problems as a class. 1 2 3 4 5 6 7 1 2 3 4 1 2 3 97) Encourage students to communicate explanations of responses and procedures in both
verbal and written formats. 1 2 3 4 5 6 7 1 2 3 4 1 2 3
98) Provide practice in computational skills. 1 2 3 4 5 6 7 1 2 3 4 1 2 3 99) Assign students to work on problems that have no immediate solution. 1 2 3 4 5 6 7 1 2 3 4 1 2 3
Questionnaire Statements Domain Association Clarity 100) Encourage students to explain the reasoning behind their ideas. 1 2 3 4 5 6 7 1 2 3 4 1 2 3 101) Allow students time to begin homework in class. 1 2 3 4 5 6 7 1 2 3 4 1 2 3 102) Pair students to work as peer tutors. 1 2 3 4 5 6 7 1 2 3 4 1 2 3 103) Use computer software to provide practice opportunities. 1 2 3 4 5 6 7 1 2 3 4 1 2 3 104) Tell students what skill they will learn, linking the current lesson to past lessons, and providing a rationale for the importance of learning the skill.
1 2 3 4 5 6 7 1 2 3 4 1 2 3
105) Reward group performance in the cooperative setting. 1 2 3 4 5 6 7 1 2 3 4 1 2 3 106) Reward individual performance in the cooperative setting. 1 2 3 4 5 6 7 1 2 3 4 1 2 3 107) Provide graphing calculators for student use. 1 2 3 4 5 6 7 1 2 3 4 1 2 3 108) Students observe worked examples of algebraic equations to derive rules for solving future equations.
1 2 3 4 5 6 7 1 2 3 4 1 2 3
109) Use reading-to-learn in the content area strategies. 1 2 3 4 5 6 7 1 2 3 4 1 2 3 110) Assign students to work in homogeneous groups. 1 2 3 4 5 6 7 1 2 3 4 1 2 3 111) Assign students to work in heterogeneous groups. 1 2 3 4 5 6 7 1 2 3 4 1 2 3 112) Provide students with study skills instruction. 1 2 3 4 5 6 7 1 2 3 4 1 2 3 113) Review only homework problems requested by the students. 1 2 3 4 5 6 7 1 2 3 4 1 2 3 114) When assigning practice work, ensure that the majority of problems assigned review previously covered material.
1 2 3 4 5 6 7 1 2 3 4 1 2 3
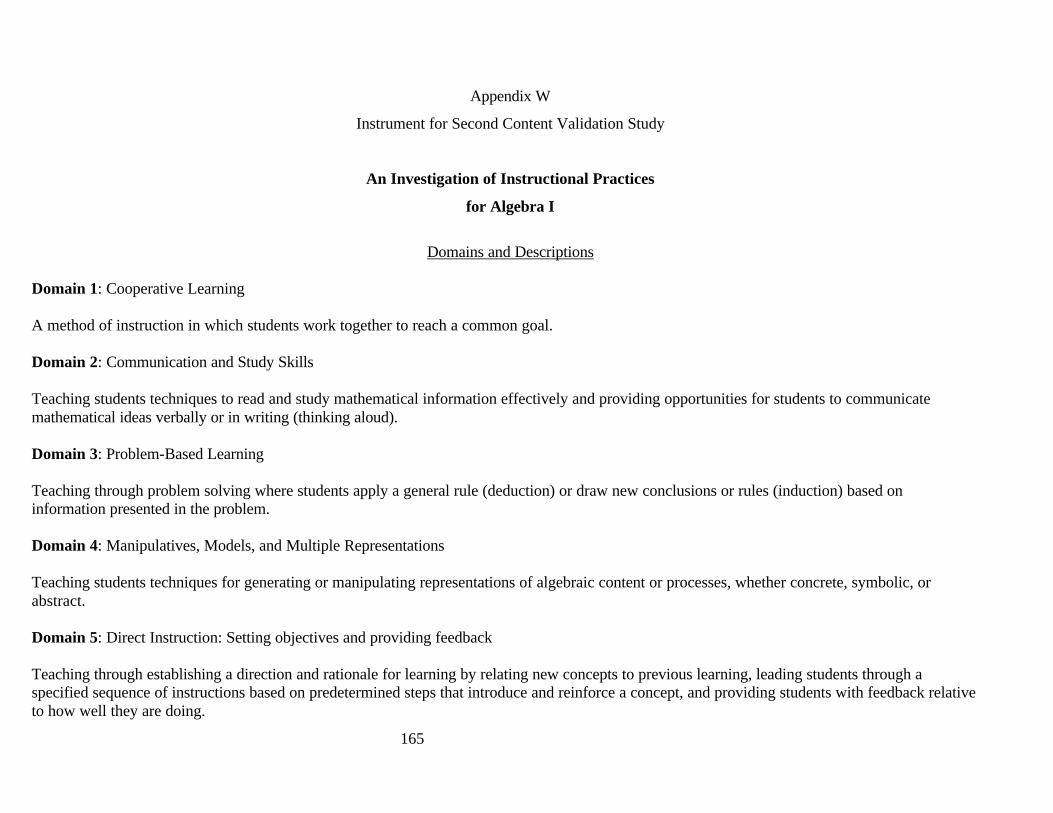
165
Appendix W
Instrument for Second Content Validation Study
An Investigation of Instructional Practices
for Algebra I
Domains and Descriptions
Domain 1: Cooperative Learning A method of instruction in which students work together to reach a common goal. Domain 2: Communication and Study Skills Teaching students techniques to read and study mathematical information effectively and providing opportunities for students to communicate mathematical ideas verbally or in writing (thinking aloud). Domain 3: Problem-Based Learning Teaching through problem solving where students apply a general rule (deduction) or draw new conclusions or rules (induction) based on information presented in the problem. Domain 4: Manipulatives, Models, and Multiple Representations Teaching students techniques for generating or manipulating representations of algebraic content or processes, whether concrete, symbolic, or abstract. Domain 5: Direct Instruction: Setting objectives and providing feedback Teaching through establishing a direction and rationale for learning by relating new concepts to previous learning, leading students through a specified sequence of instructions based on predetermined steps that introduce and reinforce a concept, and providing students with feedback relative to how well they are doing.
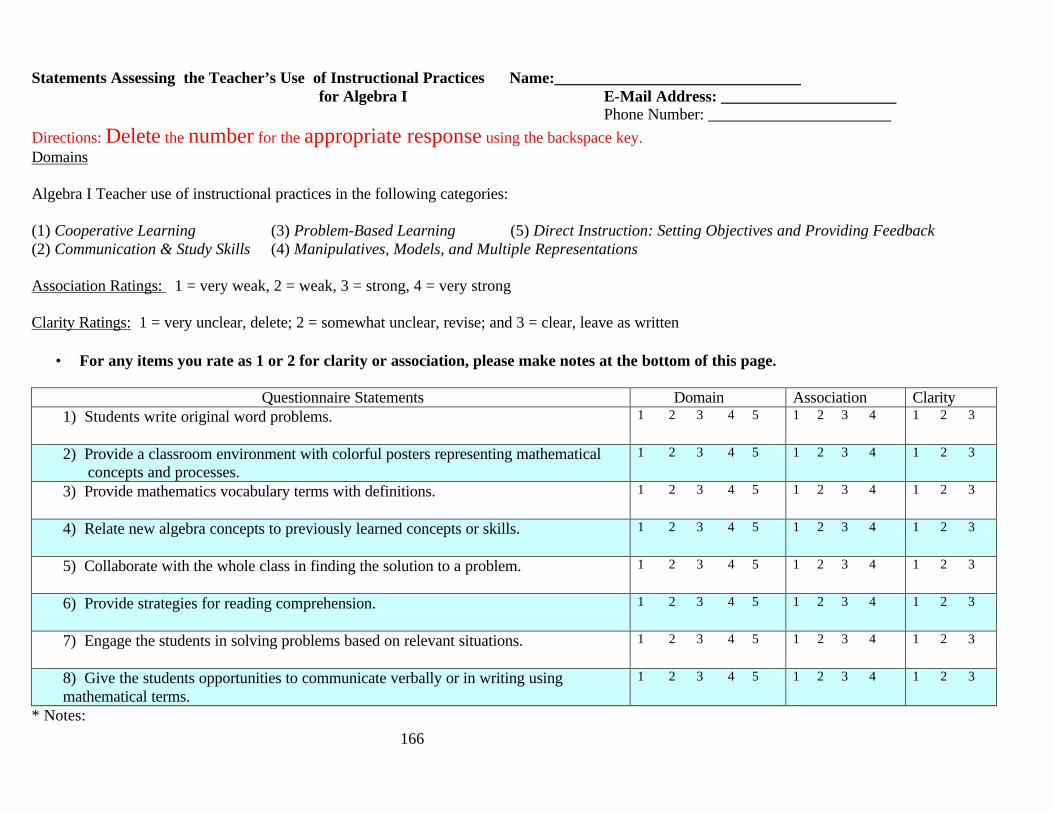
166
Statements Assessing the Teacher’s Use of Instructional Practices Name:_______________________________ for Algebra I E-Mail Address: ______________________
Phone Number: _______________________
Directions: Delete the number for the appropriate response using the backspace key. Domains Algebra I Teacher use of instructional practices in the following categories: (1) Cooperative Learning (3) Problem-Based Learning (5) Direct Instruction: Setting Objectives and Providing Feedback (2) Communication & Study Skills (4) Manipulatives, Models, and Multiple Representations Association Ratings: 1 = very weak, 2 = weak, 3 = strong, 4 = very strong Clarity Ratings: 1 = very unclear, delete; 2 = somewhat unclear, revise; and 3 = clear, leave as written
• For any items you rate as 1 or 2 for clarity or association, please make notes at the bottom of this page.
Questionnaire Statements Domain Association Clarity 1) Students write original word problems.
1 2 3 4 5 1 2 3 4 1 2 3
2) Provide a classroom environment with colorful posters representing mathematical concepts and processes.
1 2 3 4 5 1 2 3 4 1 2 3
3) Provide mathematics vocabulary terms with definitions.
1 2 3 4 5 1 2 3 4 1 2 3
4) Relate new algebra concepts to previously learned concepts or skills.
1 2 3 4 5 1 2 3 4 1 2 3
5) Collaborate with the whole class in finding the solution to a problem.
1 2 3 4 5 1 2 3 4 1 2 3
6) Provide strategies for reading comprehension.
1 2 3 4 5 1 2 3 4 1 2 3
7) Engage the students in solving problems based on relevant situations.
1 2 3 4 5 1 2 3 4 1 2 3
8) Give the students opportunities to communicate verbally or in writing using mathematical terms.
1 2 3 4 5 1 2 3 4 1 2 3
* Notes:
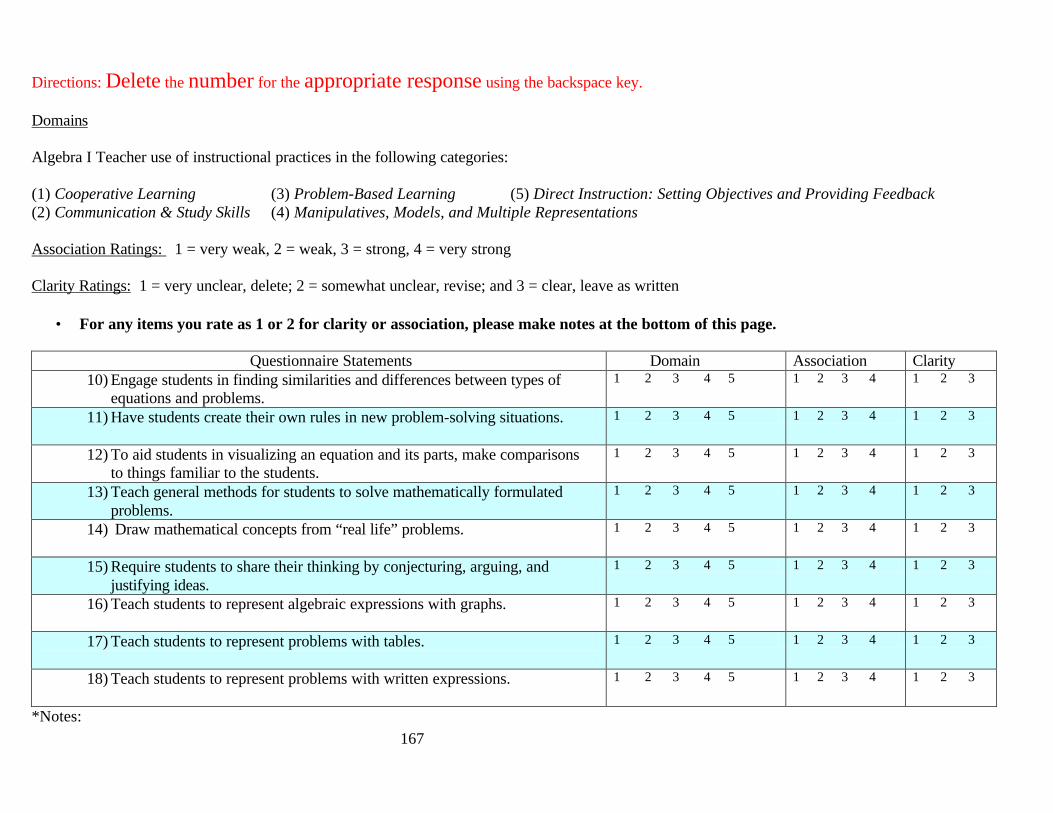
167
Directions: Delete the number for the appropriate response using the backspace key. Domains Algebra I Teacher use of instructional practices in the following categories: (1) Cooperative Learning (3) Problem-Based Learning (5) Direct Instruction: Setting Objectives and Providing Feedback (2) Communication & Study Skills (4) Manipulatives, Models, and Multiple Representations Association Ratings: 1 = very weak, 2 = weak, 3 = strong, 4 = very strong Clarity Ratings: 1 = very unclear, delete; 2 = somewhat unclear, revise; and 3 = clear, leave as written
• For any items you rate as 1 or 2 for clarity or association, please make notes at the bottom of this page.
Questionnaire Statements Domain Association Clarity 10) Engage students in finding similarities and differences between types of
equations and problems. 1 2 3 4 5 1 2 3 4 1 2 3
11) Have students create their own rules in new problem-solving situations.
1 2 3 4 5 1 2 3 4 1 2 3
12) To aid students in visualizing an equation and its parts, make comparisons to things familiar to the students.
1 2 3 4 5 1 2 3 4 1 2 3
13) Teach general methods for students to solve mathematically formulated problems.
1 2 3 4 5 1 2 3 4 1 2 3
14) Draw mathematical concepts from “real life” problems.
1 2 3 4 5 1 2 3 4 1 2 3
15) Require students to share their thinking by conjecturing, arguing, and justifying ideas.
1 2 3 4 5 1 2 3 4 1 2 3
16) Teach students to represent algebraic expressions with graphs.
1 2 3 4 5 1 2 3 4 1 2 3
17) Teach students to represent problems with tables.
1 2 3 4 5 1 2 3 4 1 2 3
18) Teach students to represent problems with written expressions.
1 2 3 4 5 1 2 3 4 1 2 3
*Notes:
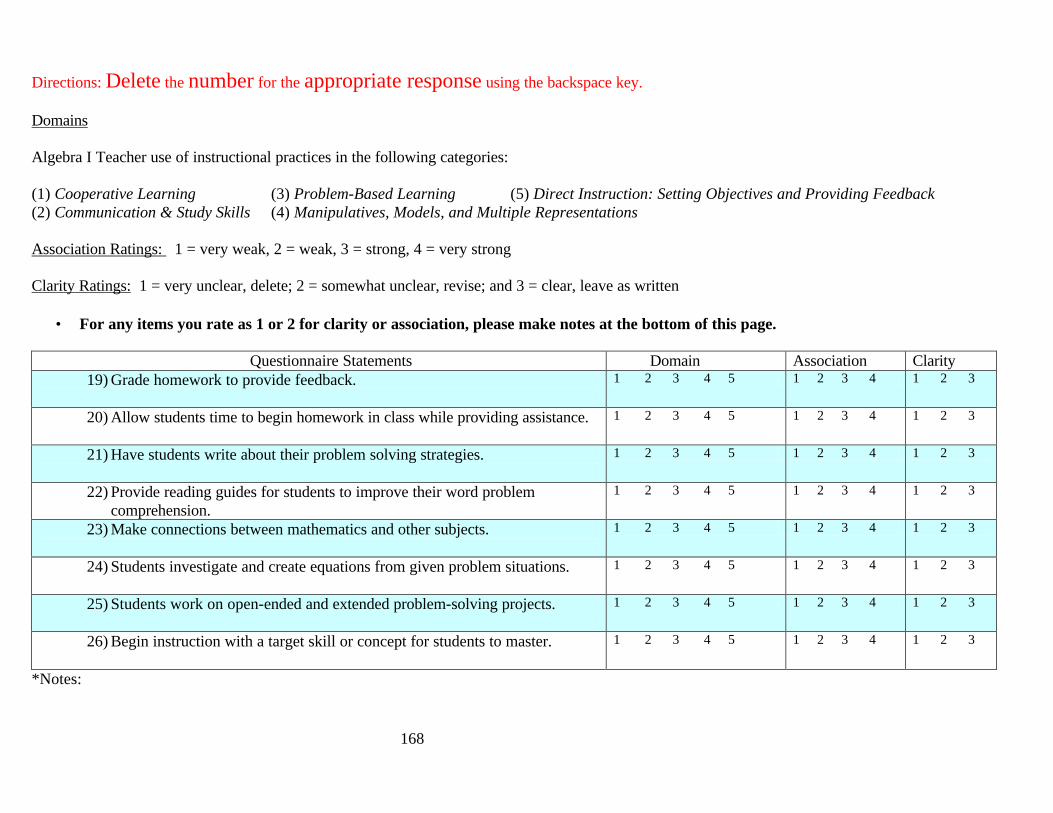
168
Directions: Delete the number for the appropriate response using the backspace key. Domains Algebra I Teacher use of instructional practices in the following categories: (1) Cooperative Learning (3) Problem-Based Learning (5) Direct Instruction: Setting Objectives and Providing Feedback (2) Communication & Study Skills (4) Manipulatives, Models, and Multiple Representations Association Ratings: 1 = very weak, 2 = weak, 3 = strong, 4 = very strong Clarity Ratings: 1 = very unclear, delete; 2 = somewhat unclear, revise; and 3 = clear, leave as written
• For any items you rate as 1 or 2 for clarity or association, please make notes at the bottom of this page.
Questionnaire Statements Domain Association Clarity 19) Grade homework to provide feedback.
1 2 3 4 5 1 2 3 4 1 2 3
20) Allow students time to begin homework in class while providing assistance.
1 2 3 4 5 1 2 3 4 1 2 3
21) Have students write about their problem solving strategies.
1 2 3 4 5 1 2 3 4 1 2 3
22) Provide reading guides for students to improve their word problem comprehension.
1 2 3 4 5 1 2 3 4 1 2 3
23) Make connections between mathematics and other subjects.
1 2 3 4 5 1 2 3 4 1 2 3
24) Students investigate and create equations from given problem situations.
1 2 3 4 5 1 2 3 4 1 2 3
25) Students work on open-ended and extended problem-solving projects.
1 2 3 4 5 1 2 3 4 1 2 3
26) Begin instruction with a target skill or concept for students to master.
1 2 3 4 5 1 2 3 4 1 2 3
*Notes:
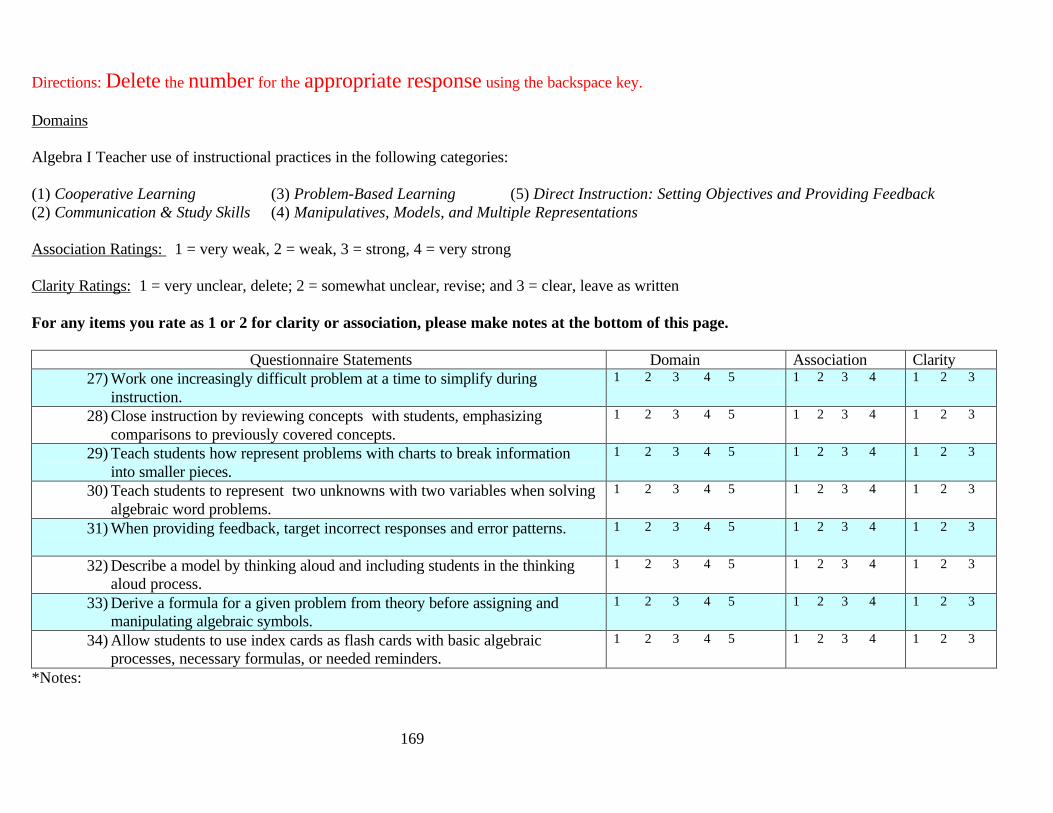
169
Directions: Delete the number for the appropriate response using the backspace key. Domains Algebra I Teacher use of instructional practices in the following categories: (1) Cooperative Learning (3) Problem-Based Learning (5) Direct Instruction: Setting Objectives and Providing Feedback (2) Communication & Study Skills (4) Manipulatives, Models, and Multiple Representations Association Ratings: 1 = very weak, 2 = weak, 3 = strong, 4 = very strong Clarity Ratings: 1 = very unclear, delete; 2 = somewhat unclear, revise; and 3 = clear, leave as written For any items you rate as 1 or 2 for clarity or association, please make notes at the bottom of this page.
Questionnaire Statements Domain Association Clarity 27) Work one increasingly difficult problem at a time to simplify during
instruction. 1 2 3 4 5 1 2 3 4 1 2 3
28) Close instruction by reviewing concepts with students, emphasizing comparisons to previously covered concepts.
1 2 3 4 5 1 2 3 4 1 2 3
29) Teach students how represent problems with charts to break information into smaller pieces.
1 2 3 4 5 1 2 3 4 1 2 3
30) Teach students to represent two unknowns with two variables when solving algebraic word problems.
1 2 3 4 5 1 2 3 4 1 2 3
31) When providing feedback, target incorrect responses and error patterns.
1 2 3 4 5 1 2 3 4 1 2 3
32) Describe a model by thinking aloud and including students in the thinking aloud process.
1 2 3 4 5 1 2 3 4 1 2 3
33) Derive a formula for a given problem from theory before assigning and manipulating algebraic symbols.
1 2 3 4 5 1 2 3 4 1 2 3
34) Allow students to use index cards as flash cards with basic algebraic processes, necessary formulas, or needed reminders.
1 2 3 4 5 1 2 3 4 1 2 3
*Notes:
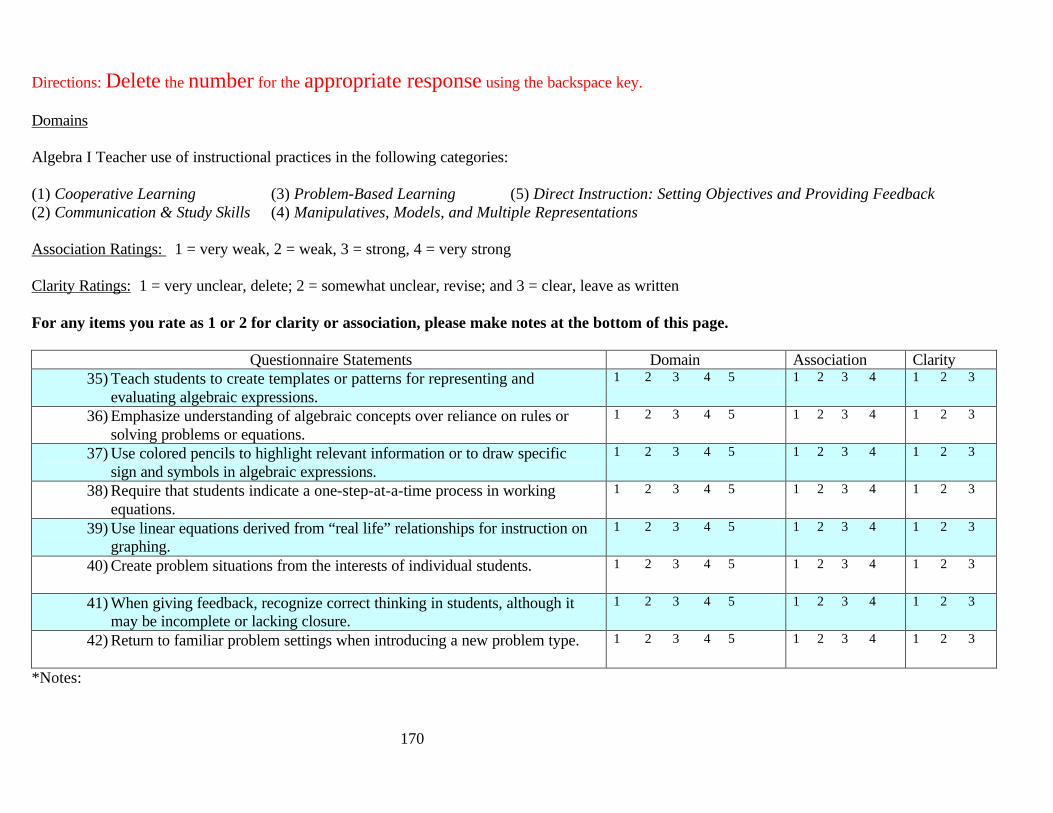
170
Directions: Delete the number for the appropriate response using the backspace key. Domains Algebra I Teacher use of instructional practices in the following categories: (1) Cooperative Learning (3) Problem-Based Learning (5) Direct Instruction: Setting Objectives and Providing Feedback (2) Communication & Study Skills (4) Manipulatives, Models, and Multiple Representations Association Ratings: 1 = very weak, 2 = weak, 3 = strong, 4 = very strong Clarity Ratings: 1 = very unclear, delete; 2 = somewhat unclear, revise; and 3 = clear, leave as written For any items you rate as 1 or 2 for clarity or association, please make notes at the bottom of this page.
Questionnaire Statements Domain Association Clarity 35) Teach students to create templates or patterns for representing and
evaluating algebraic expressions. 1 2 3 4 5 1 2 3 4 1 2 3
36) Emphasize understanding of algebraic concepts over reliance on rules or solving problems or equations.
1 2 3 4 5 1 2 3 4 1 2 3
37) Use colored pencils to highlight relevant information or to draw specific sign and symbols in algebraic expressions.
1 2 3 4 5 1 2 3 4 1 2 3
38) Require that students indicate a one-step-at-a-time process in working equations.
1 2 3 4 5 1 2 3 4 1 2 3
39) Use linear equations derived from “real life” relationships for instruction on graphing.
1 2 3 4 5 1 2 3 4 1 2 3
40) Create problem situations from the interests of individual students.
1 2 3 4 5 1 2 3 4 1 2 3
41) When giving feedback, recognize correct thinking in students, although it may be incomplete or lacking closure.
1 2 3 4 5 1 2 3 4 1 2 3
42) Return to familiar problem settings when introducing a new problem type.
1 2 3 4 5 1 2 3 4 1 2 3
*Notes:
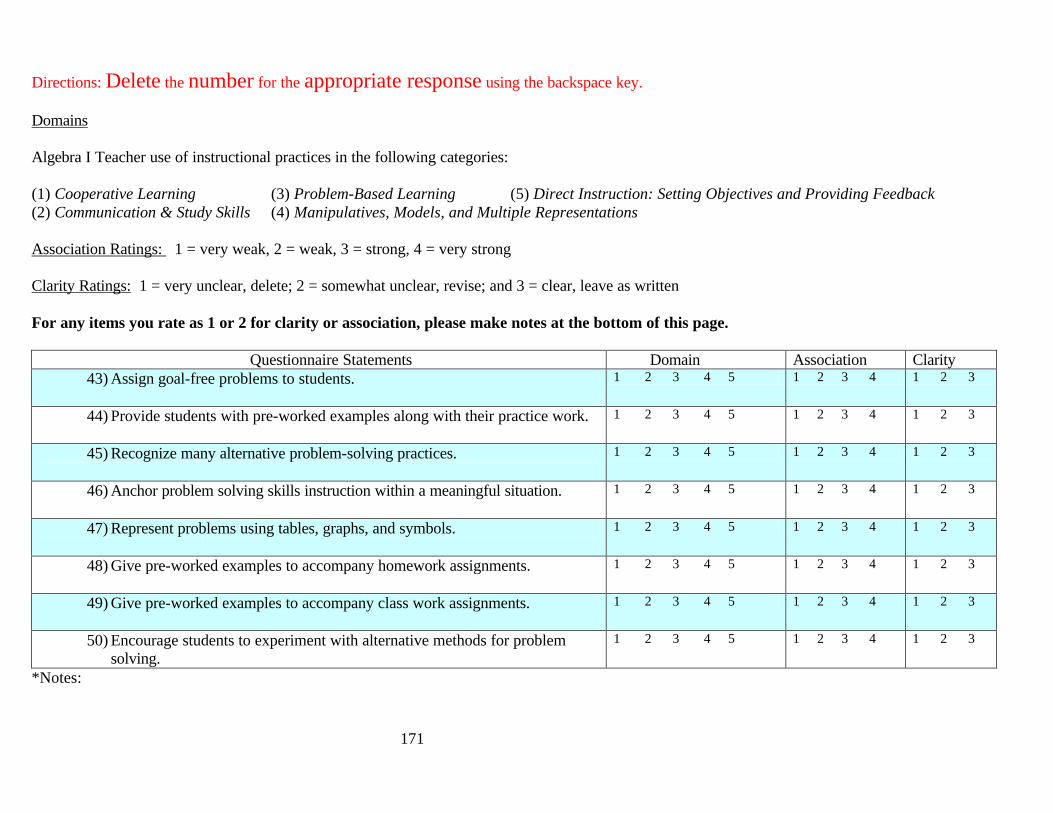
171
Directions: Delete the number for the appropriate response using the backspace key. Domains Algebra I Teacher use of instructional practices in the following categories: (1) Cooperative Learning (3) Problem-Based Learning (5) Direct Instruction: Setting Objectives and Providing Feedback (2) Communication & Study Skills (4) Manipulatives, Models, and Multiple Representations Association Ratings: 1 = very weak, 2 = weak, 3 = strong, 4 = very strong Clarity Ratings: 1 = very unclear, delete; 2 = somewhat unclear, revise; and 3 = clear, leave as written For any items you rate as 1 or 2 for clarity or association, please make notes at the bottom of this page.
Questionnaire Statements Domain Association Clarity 43) Assign goal-free problems to students.
1 2 3 4 5 1 2 3 4 1 2 3
44) Provide students with pre-worked examples along with their practice work.
1 2 3 4 5 1 2 3 4 1 2 3
45) Recognize many alternative problem-solving practices.
1 2 3 4 5 1 2 3 4 1 2 3
46) Anchor problem solving skills instruction within a meaningful situation.
1 2 3 4 5 1 2 3 4 1 2 3
47) Represent problems using tables, graphs, and symbols.
1 2 3 4 5 1 2 3 4 1 2 3
48) Give pre-worked examples to accompany homework assignments.
1 2 3 4 5 1 2 3 4 1 2 3
49) Give pre-worked examples to accompany class work assignments.
1 2 3 4 5 1 2 3 4 1 2 3
50) Encourage students to experiment with alternative methods for problem solving.
1 2 3 4 5 1 2 3 4 1 2 3
*Notes:
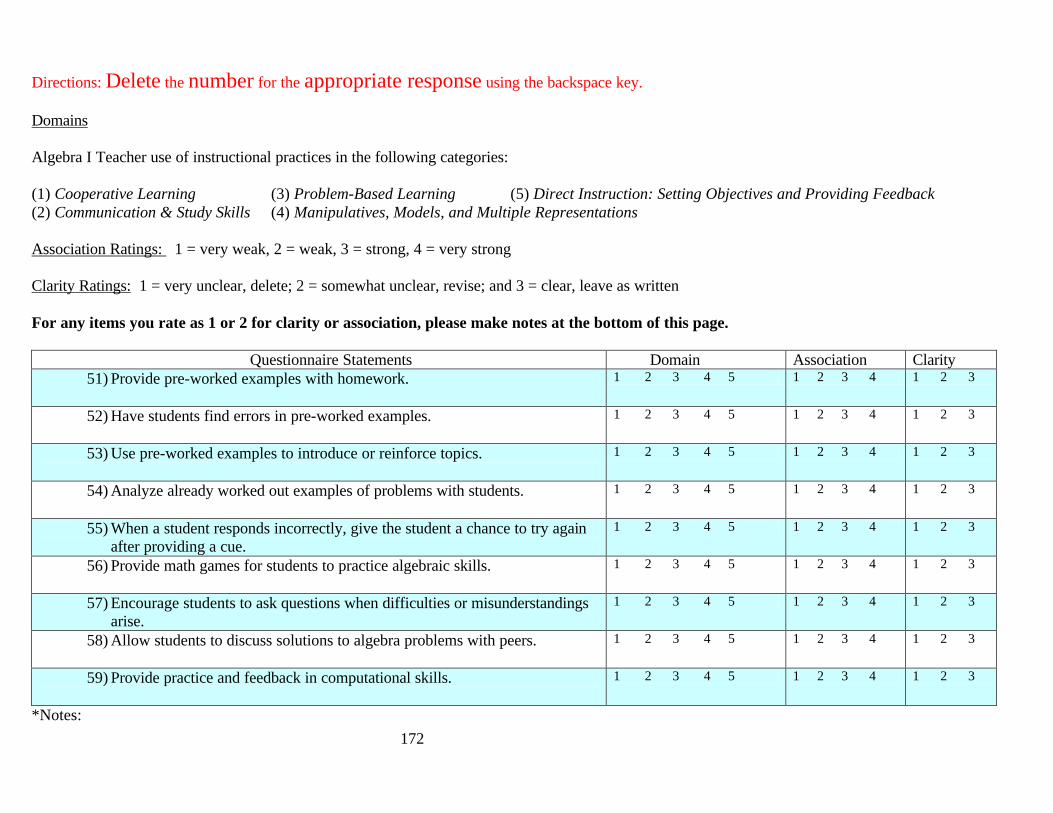
172
Directions: Delete the number for the appropriate response using the backspace key. Domains Algebra I Teacher use of instructional practices in the following categories: (1) Cooperative Learning (3) Problem-Based Learning (5) Direct Instruction: Setting Objectives and Providing Feedback (2) Communication & Study Skills (4) Manipulatives, Models, and Multiple Representations Association Ratings: 1 = very weak, 2 = weak, 3 = strong, 4 = very strong Clarity Ratings: 1 = very unclear, delete; 2 = somewhat unclear, revise; and 3 = clear, leave as written For any items you rate as 1 or 2 for clarity or association, please make notes at the bottom of this page.
Questionnaire Statements Domain Association Clarity 51) Provide pre-worked examples with homework.
1 2 3 4 5 1 2 3 4 1 2 3
52) Have students find errors in pre-worked examples.
1 2 3 4 5 1 2 3 4 1 2 3
53) Use pre-worked examples to introduce or reinforce topics.
1 2 3 4 5 1 2 3 4 1 2 3
54) Analyze already worked out examples of problems with students.
1 2 3 4 5 1 2 3 4 1 2 3
55) When a student responds incorrectly, give the student a chance to try again after providing a cue.
1 2 3 4 5 1 2 3 4 1 2 3
56) Provide math games for students to practice algebraic skills.
1 2 3 4 5 1 2 3 4 1 2 3
57) Encourage students to ask questions when difficulties or misunderstandings arise.
1 2 3 4 5 1 2 3 4 1 2 3
58) Allow students to discuss solutions to algebra problems with peers.
1 2 3 4 5 1 2 3 4 1 2 3
59) Provide practice and feedback in computational skills.
1 2 3 4 5 1 2 3 4 1 2 3
*Notes:
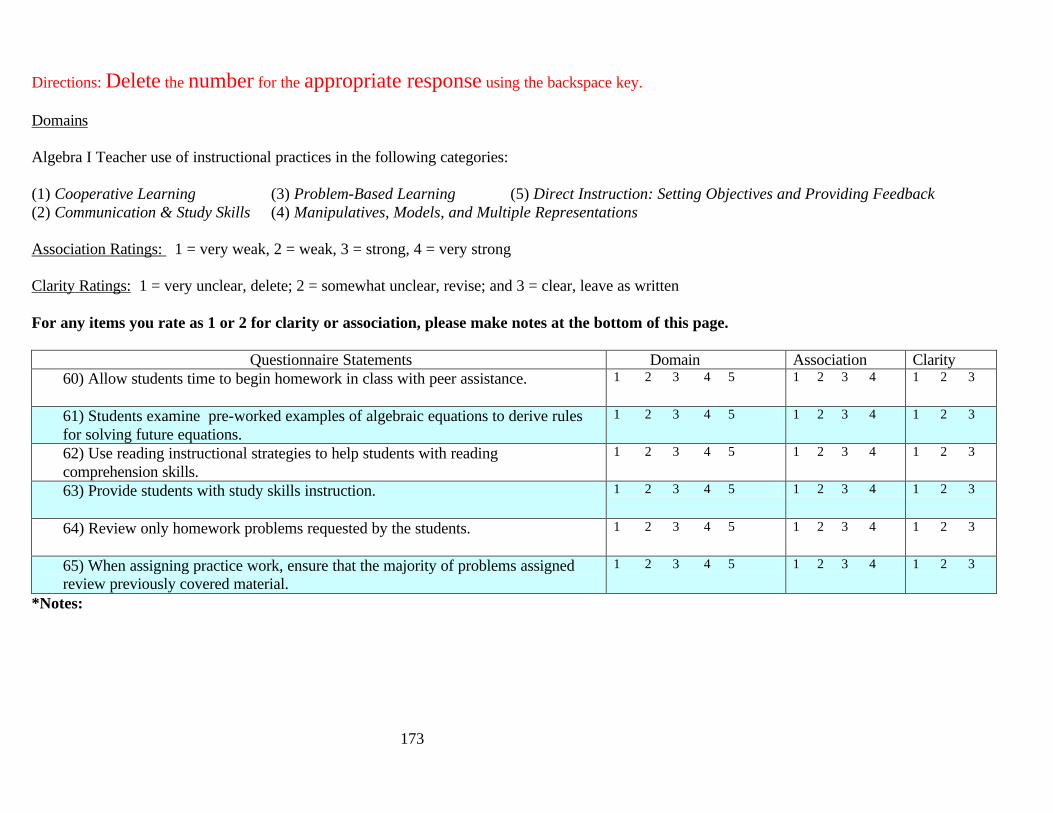
173
Directions: Delete the number for the appropriate response using the backspace key. Domains Algebra I Teacher use of instructional practices in the following categories: (1) Cooperative Learning (3) Problem-Based Learning (5) Direct Instruction: Setting Objectives and Providing Feedback (2) Communication & Study Skills (4) Manipulatives, Models, and Multiple Representations Association Ratings: 1 = very weak, 2 = weak, 3 = strong, 4 = very strong Clarity Ratings: 1 = very unclear, delete; 2 = somewhat unclear, revise; and 3 = clear, leave as written For any items you rate as 1 or 2 for clarity or association, please make notes at the bottom of this page.
Questionnaire Statements Domain Association Clarity 60) Allow students time to begin homework in class with peer assistance.
1 2 3 4 5 1 2 3 4 1 2 3
61) Students examine pre-worked examples of algebraic equations to derive rules for solving future equations.
1 2 3 4 5 1 2 3 4 1 2 3
62) Use reading instructional strategies to help students with reading comprehension skills.
1 2 3 4 5 1 2 3 4 1 2 3
63) Provide students with study skills instruction.
1 2 3 4 5 1 2 3 4 1 2 3
64) Review only homework problems requested by the students.
1 2 3 4 5 1 2 3 4 1 2 3
65) When assigning practice work, ensure that the majority of problems assigned review previously covered material.
1 2 3 4 5 1 2 3 4 1 2 3
*Notes:
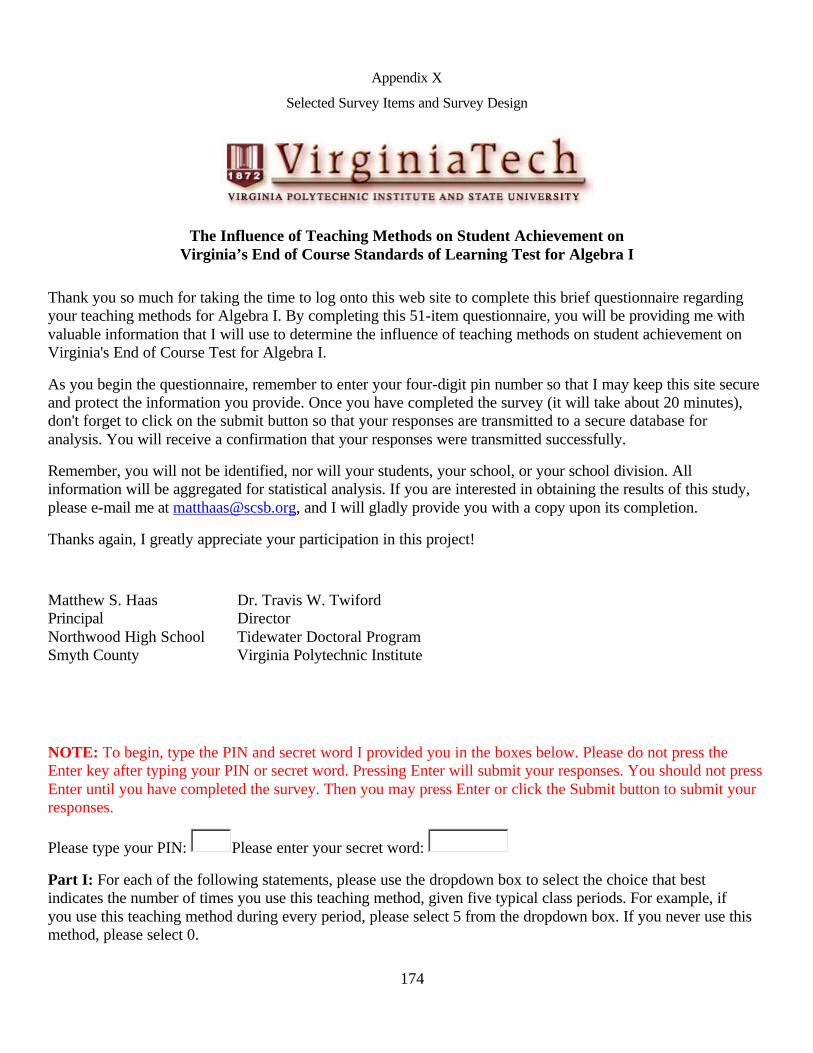
174
Appendix X
Selected Survey Items and Survey Design
The Influence of Teaching Methods on Student Achievement on Virginia’s End of Course Standards of Learning Test for Algebra I
Thank you so much for taking the time to log onto this web site to complete this brief questionnaire regarding your teaching methods for Algebra I. By completing this 51-item questionnaire, you will be providing me with valuable information that I will use to determine the influence of teaching methods on student achievement on Virginia's End of Course Test for Algebra I.
As you begin the questionnaire, remember to enter your four-digit pin number so that I may keep this site secure and protect the information you provide. Once you have completed the survey (it will take about 20 minutes), don't forget to click on the submit button so that your responses are transmitted to a secure database for analysis. You will receive a confirmation that your responses were transmitted successfully.
Remember, you will not be identified, nor will your students, your school, or your school division. All information will be aggregated for statistical analysis. If you are interested in obtaining the results of this study, please e-mail me at [email protected], and I will gladly provide you with a copy upon its completion.
Thanks again, I greatly appreciate your participation in this project!
Matthew S. Haas Principal Northwood High School Smyth County
Dr. Travis W. Twiford Director Tidewater Doctoral Program Virginia Polytechnic Institute
NOTE: To begin, type the PIN and secret word I provided you in the boxes below. Please do not press the Enter key after typing your PIN or secret word. Pressing Enter will submit your responses. You should not press Enter until you have completed the survey. Then you may press Enter or click the Submit button to submit your responses.
Please type your PIN: Please enter your secret word:
Part I: For each of the following statements, please use the dropdown box to select the choice that best indicates the number of times you use this teaching method, given five typical class periods. For example, if you use this teaching method during every period, please select 5 from the dropdown box. If you never use this method, please select 0.
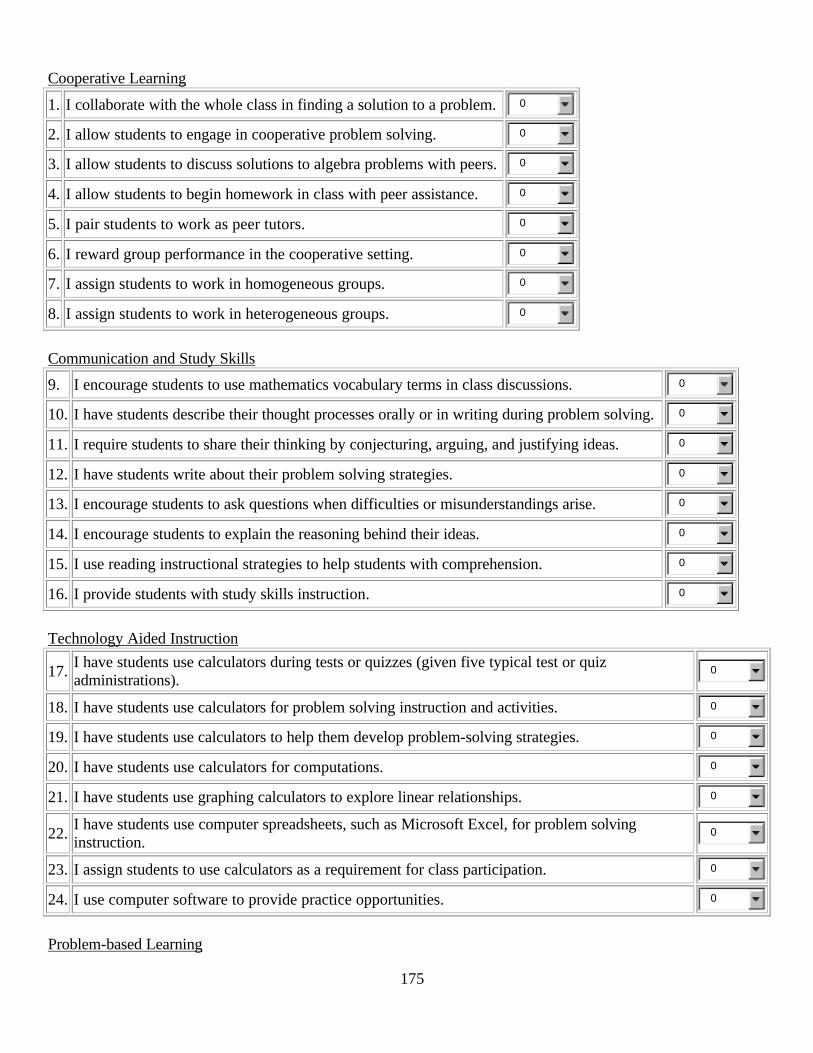
175
Cooperative Learning
1. I collaborate with the whole class in finding a solution to a problem. 0
2. I allow students to engage in cooperative problem solving. 0
3. I allow students to discuss solutions to algebra problems with peers. 0
4. I allow students to begin homework in class with peer assistance. 0
5. I pair students to work as peer tutors. 0
6. I reward group performance in the cooperative setting. 0
7. I assign students to work in homogeneous groups. 0
8. I assign students to work in heterogeneous groups. 0
Communication and Study Skills
9. I encourage students to use mathematics vocabulary terms in class discussions. 0
10. I have students describe their thought processes orally or in writing during problem solving. 0
11. I require students to share their thinking by conjecturing, arguing, and justifying ideas. 0
12. I have students write about their problem solving strategies. 0
13. I encourage students to ask questions when difficulties or misunderstandings arise. 0
14. I encourage students to explain the reasoning behind their ideas. 0
15. I use reading instructional strategies to help students with comprehension. 0
16. I provide students with study skills instruction. 0
Technology Aided Instruction
17. I have students use calculators during tests or quizzes (given five typical test or quiz administrations).
0
18. I have students use calculators for problem solving instruction and activities. 0
19. I have students use calculators to help them develop problem-solving strategies. 0
20. I have students use calculators for computations. 0
21. I have students use graphing calculators to explore linear relationships. 0
22. I have students use computer spreadsheets, such as Microsoft Excel, for problem solving instruction.
0
23. I assign students to use calculators as a requirement for class participation. 0
24. I use computer software to provide practice opportunities. 0
Problem-based Learning
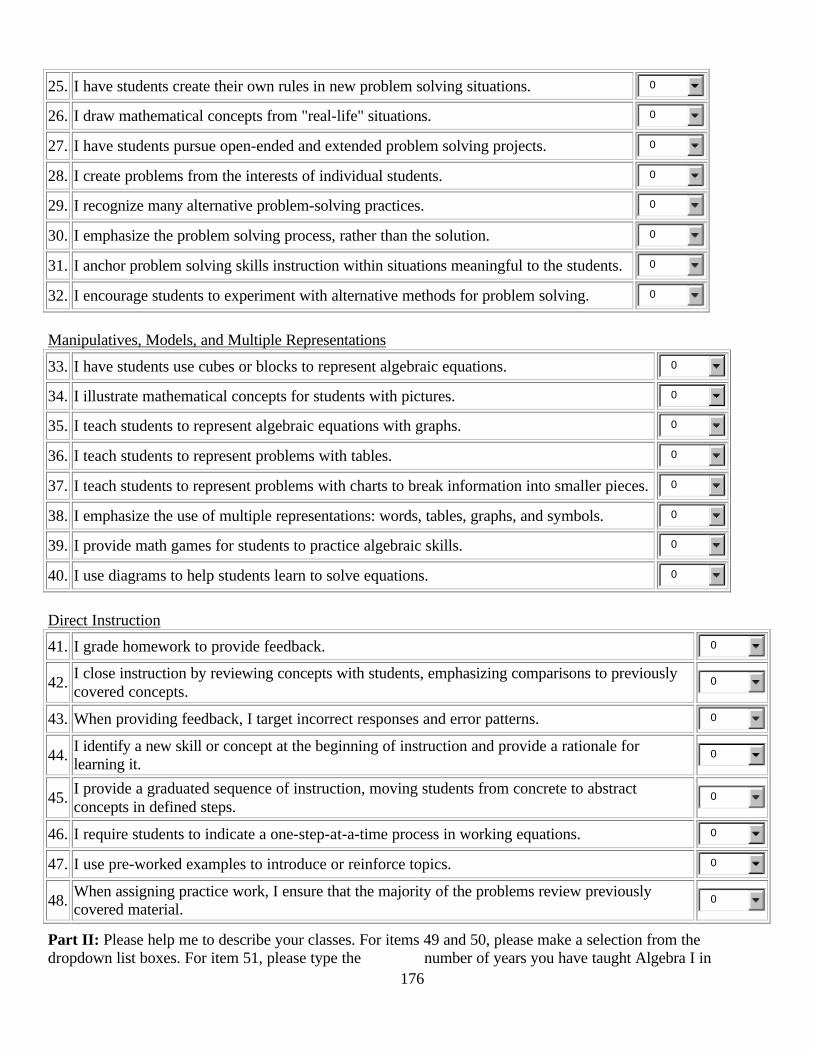
176
25. I have students create their own rules in new problem solving situations. 0
26. I draw mathematical concepts from "real-life" situations. 0
27. I have students pursue open-ended and extended problem solving projects. 0
28. I create problems from the interests of individual students. 0
29. I recognize many alternative problem-solving practices. 0
30. I emphasize the problem solving process, rather than the solution. 0
31. I anchor problem solving skills instruction within situations meaningful to the students. 0
32. I encourage students to experiment with alternative methods for problem solving. 0
Manipulatives, Models, and Multiple Representations
33. I have students use cubes or blocks to represent algebraic equations. 0
34. I illustrate mathematical concepts for students with pictures. 0
35. I teach students to represent algebraic equations with graphs. 0
36. I teach students to represent problems with tables. 0
37. I teach students to represent problems with charts to break information into smaller pieces. 0
38. I emphasize the use of multiple representations: words, tables, graphs, and symbols. 0
39. I provide math games for students to practice algebraic skills. 0
40. I use diagrams to help students learn to solve equations. 0
Direct Instruction
41. I grade homework to provide feedback. 0
42. I close instruction by reviewing concepts with students, emphasizing comparisons to previously covered concepts.
0
43. When providing feedback, I target incorrect responses and error patterns. 0
44. I identify a new skill or concept at the beginning of instruction and provide a rationale for learning it.
0
45. I provide a graduated sequence of instruction, moving students from concrete to abstract concepts in defined steps.
0
46. I require students to indicate a one-step-at-a-time process in working equations. 0
47. I use pre-worked examples to introduce or reinforce topics. 0
48. When assigning practice work, I ensure that the majority of the problems review previously covered material.
0
Part II: Please help me to describe your classes. For items 49 and 50, please make a selection from the dropdown list boxes. For item 51, please type the number of years you have taught Algebra I in

177
Virginia.
49. Indicate the type of schedule your school uses: Please select your schedule.
50. Indicate the credit value of your Algebra I class: Please select number of credits.
51. Please type the number of years you have taught Algebra I in Virginia:
Please click the Submit button below ONCE to submit your survey responses. (If you double-click the button, your responses will be sent twice.)
Submit
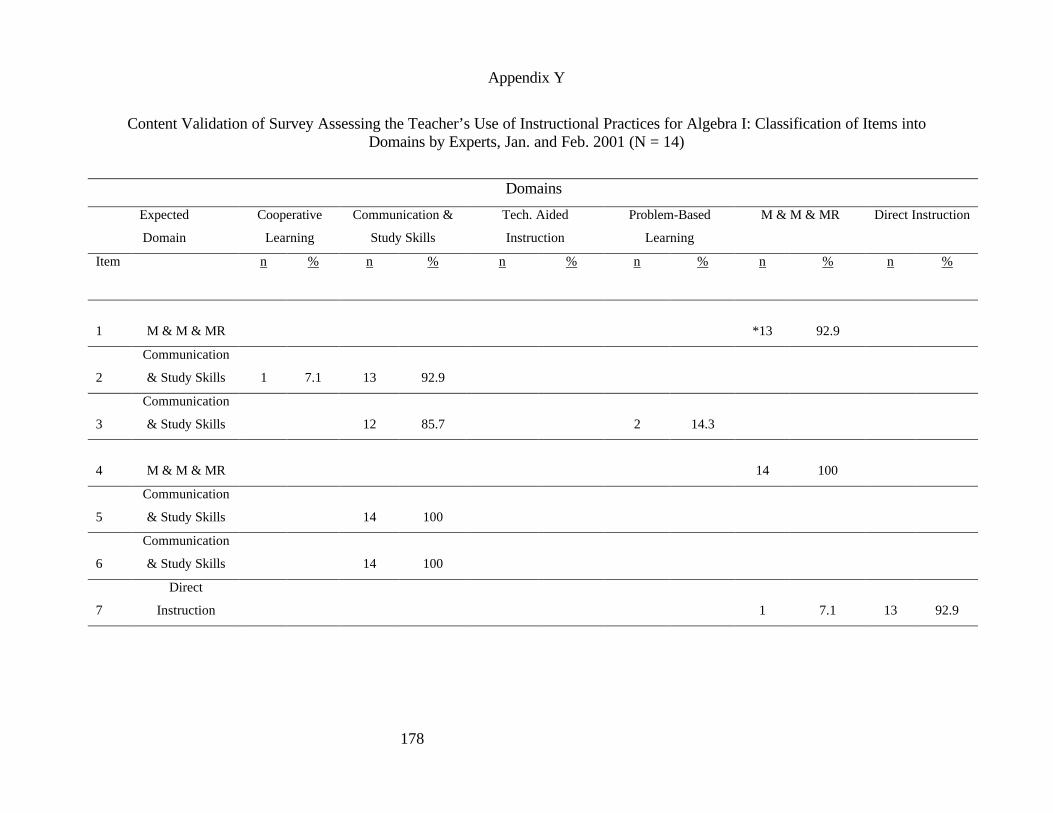
178
Appendix Y
Content Validation of Survey Assessing the Teacher’s Use of Instructional Practices for Algebra I: Classification of Items into Domains by Experts, Jan. and Feb. 2001 (N = 14)
Domains
Expected
Domain
Cooperative
Learning
Communication &
Study Skills
Tech. Aided
Instruction
Problem-Based
Learning
M & M & MR Direct Instruction
Item
n % n % n % n % n % n %
1
M & M & MR
*13
92.9
2
Communication
& Study Skills
1
7.1
13
92.9
3
Communication
& Study Skills
12
85.7
2
14.3
4
M & M & MR
14
100
5
Communication
& Study Skills
14
100
6
Communication
& Study Skills
14
100
7
Direct
Instruction
1
7.1
13
92.9
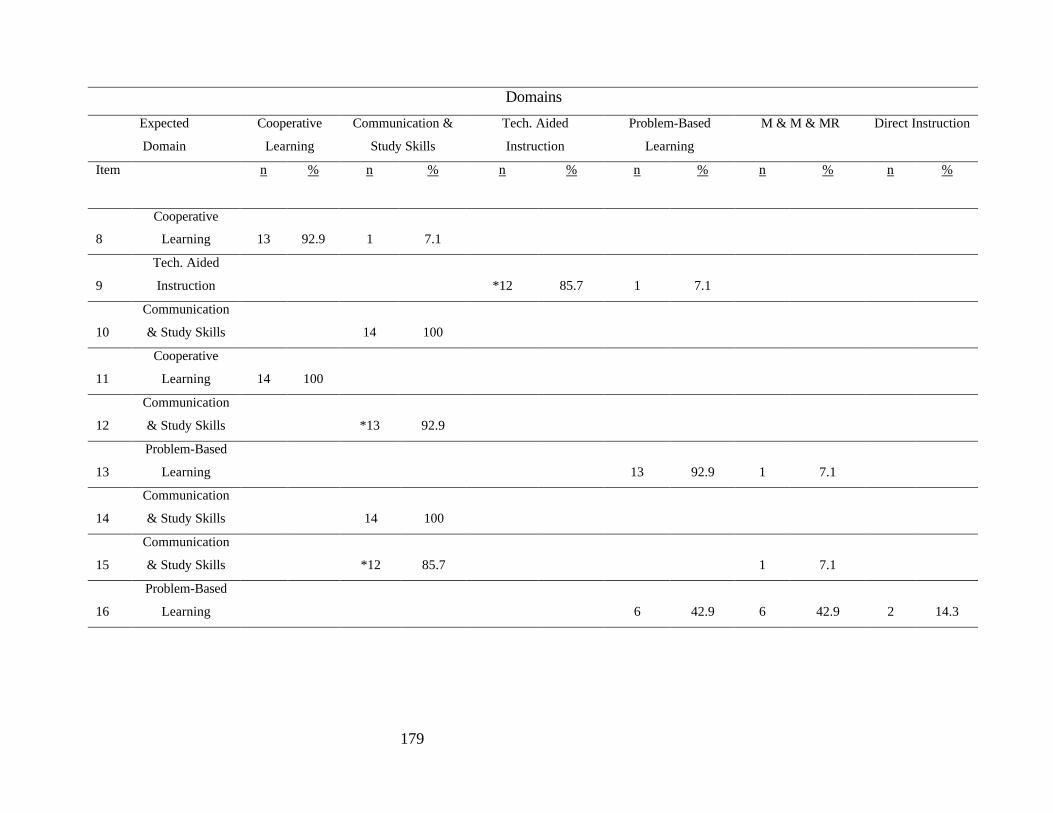
179
Domains
Expected
Domain
Cooperative
Learning
Communication &
Study Skills
Tech. Aided
Instruction
Problem-Based
Learning
M & M & MR Direct Instruction
Item
n % n % n % n % n % n %
8
Cooperative
Learning
13
92.9
1
7.1
9
Tech. Aided
Instruction
*12
85.7
1
7.1
10
Communication
& Study Skills
14
100
11
Cooperative
Learning
14
100
12
Communication
& Study Skills
*13
92.9
13
Problem-Based
Learning
13
92.9
1
7.1
14
Communication
& Study Skills
14
100
15
Communication
& Study Skills
*12
85.7
1
7.1
16
Problem-Based
Learning
6
42.9
6
42.9
2
14.3
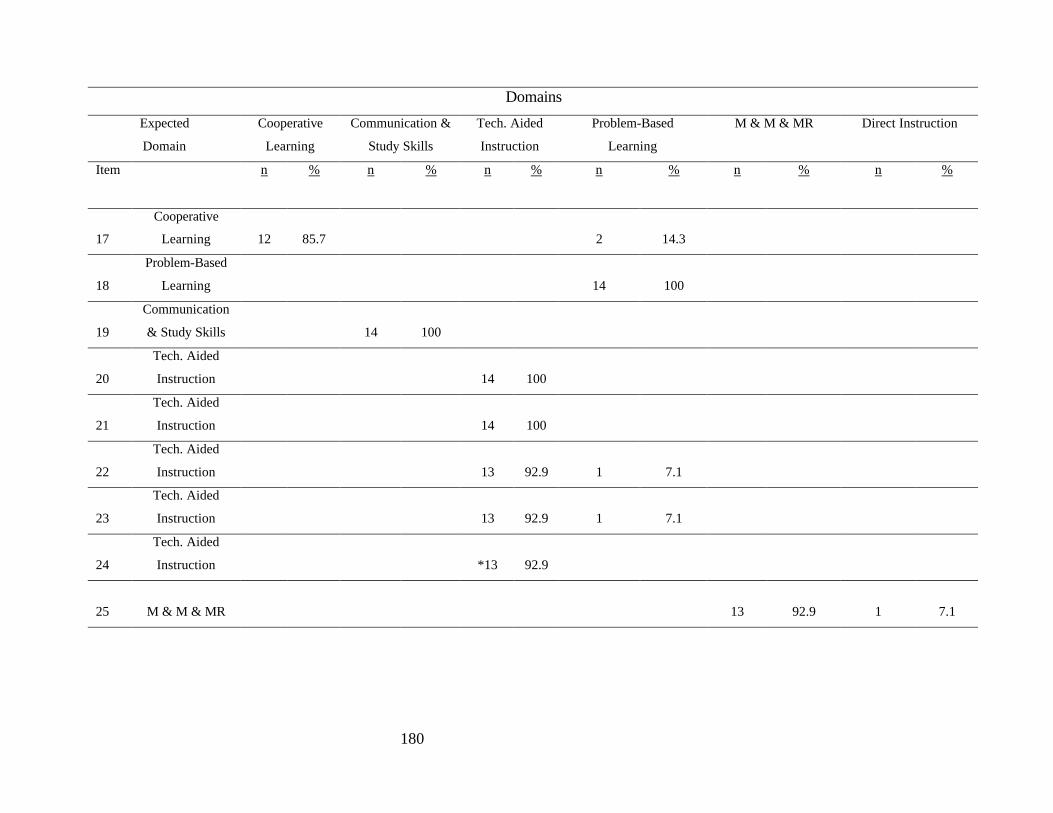
180
Domains
Expected
Domain
Cooperative
Learning
Communication &
Study Skills
Tech. Aided
Instruction
Problem-Based
Learning
M & M & MR Direct Instruction
Item
n % n % n % n % n % n %
17
Cooperative
Learning
12
85.7
2
14.3
18
Problem-Based
Learning
14
100
19
Communication
& Study Skills
14
100
20
Tech. Aided
Instruction
14
100
21
Tech. Aided
Instruction
14
100
22
Tech. Aided
Instruction
13
92.9
1
7.1
23
Tech. Aided
Instruction
13
92.9
1
7.1
24
Tech. Aided
Instruction
*13
92.9
25
M & M & MR
13
92.9
1
7.1
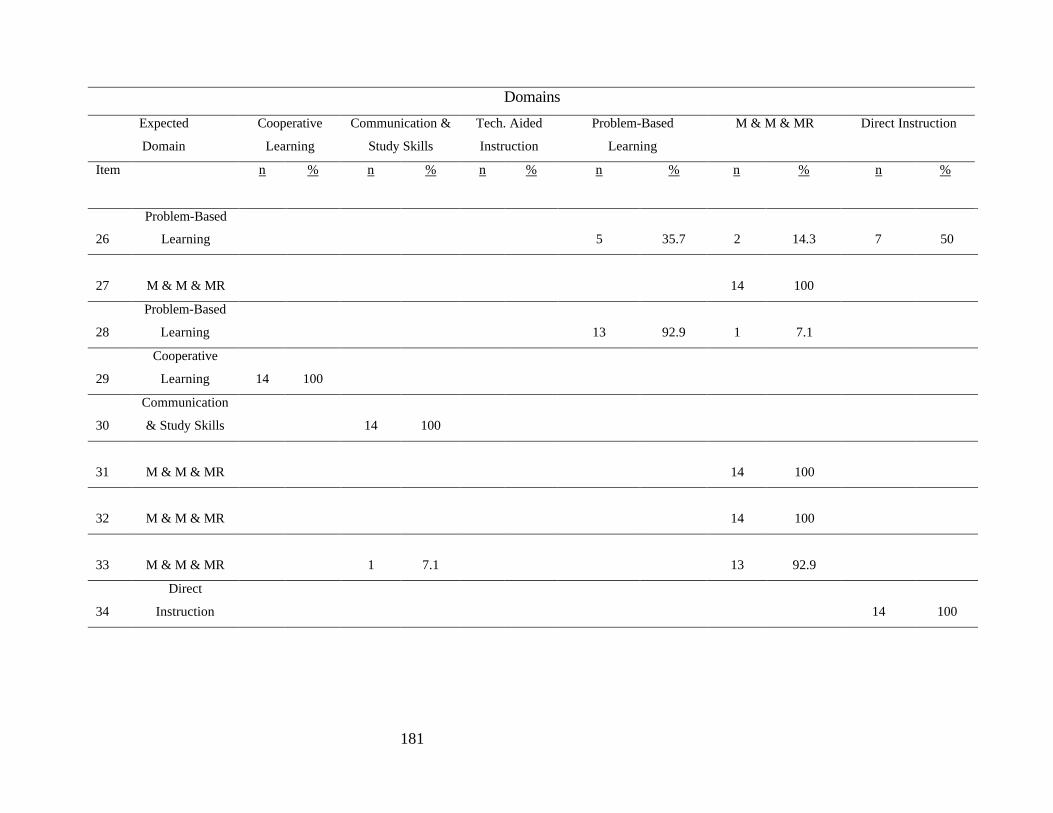
181
Domains
Expected
Domain
Cooperative
Learning
Communication &
Study Skills
Tech. Aided
Instruction
Problem-Based
Learning
M & M & MR Direct Instruction
Item
n % n % n % n % n % n %
26
Problem-Based
Learning
5
35.7
2
14.3
7
50
27
M & M & MR
14
100
28
Problem-Based
Learning
13
92.9
1
7.1
29
Cooperative
Learning
14
100
30
Communication
& Study Skills
14
100
31
M & M & MR
14
100
32
M & M & MR
14
100
33
M & M & MR
1
7.1
13
92.9
34
Direct
Instruction
14
100
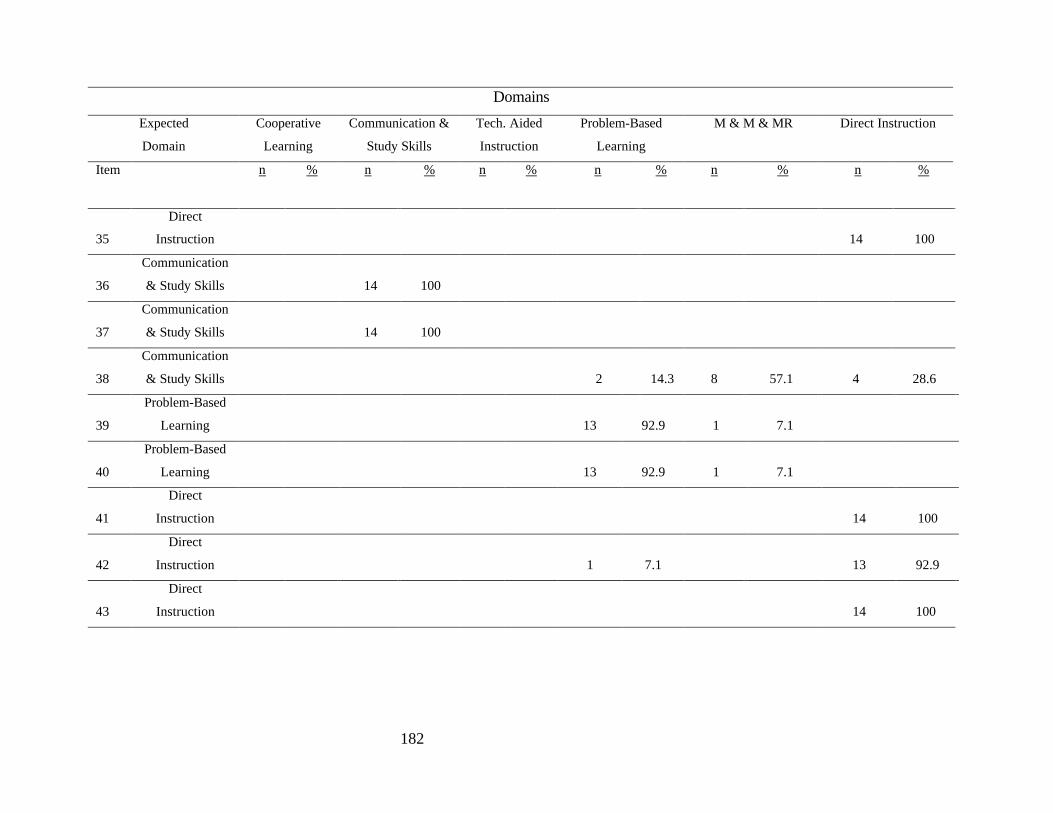
182
Domains
Expected
Domain
Cooperative
Learning
Communication &
Study Skills
Tech. Aided
Instruction
Problem-Based
Learning
M & M & MR Direct Instruction
Item
n % n % n % n % n % n %
35
Direct
Instruction
14
100
36
Communication
& Study Skills
14
100
37
Communication
& Study Skills
14
100
38
Communication
& Study Skills
2
14.3
8
57.1
4
28.6
39
Problem-Based
Learning
13
92.9
1
7.1
40
Problem-Based
Learning
13
92.9
1
7.1
41
Direct
Instruction
14
100
42
Direct
Instruction
1
7.1
13
92.9
43
Direct
Instruction
14
100
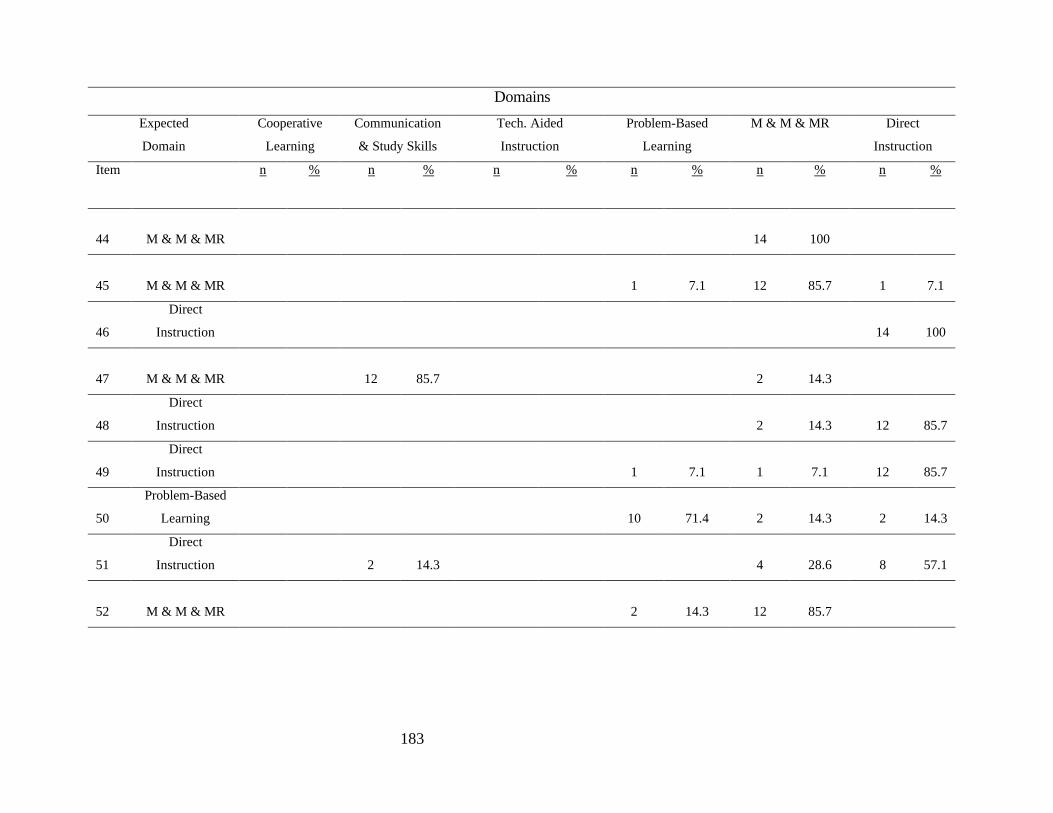
183
Domains
Expected
Domain
Cooperative
Learning
Communication
& Study Skills
Tech. Aided
Instruction
Problem-Based
Learning
M & M & MR Direct
Instruction
Item
n % n % n % n % n % n %
44
M & M & MR
14
100
45
M & M & MR
1
7.1
12
85.7
1
7.1
46
Direct
Instruction
14
100
47
M & M & MR
12
85.7
2
14.3
48
Direct
Instruction
2
14.3
12
85.7
49
Direct
Instruction
1
7.1
1
7.1
12
85.7
50
Problem-Based
Learning
10
71.4
2
14.3
2
14.3
51
Direct
Instruction
2
14.3
4
28.6
8
57.1
52
M & M & MR
2
14.3
12
85.7

184
Domains
Expected
Domain
Cooperative
Learning
Communication &
Study Skills
Tech. Aided
Instruction
Problem-Based
Learning
M & M & MR Direct Instruction
Item
n % n % n % n % n % n %
53
Communication
Skills
13
92.9
1
7.1
54
Problem-Based
Learning
13
92.9
1
7.1
55
M & M & MR
2
14.3
12
85.7
56
Communication
& Study Skills
13
92.9
1
7.1
57
Direct
Instruction
14
100
58
Communication
& Study Skills
*13
92.9
59
Communication
& Study Skills
13
92.9
1
7.1
60
Communication
& Study Skills
13
92.9
1
7.1
61
Tech. Aided
Instruction
14
100
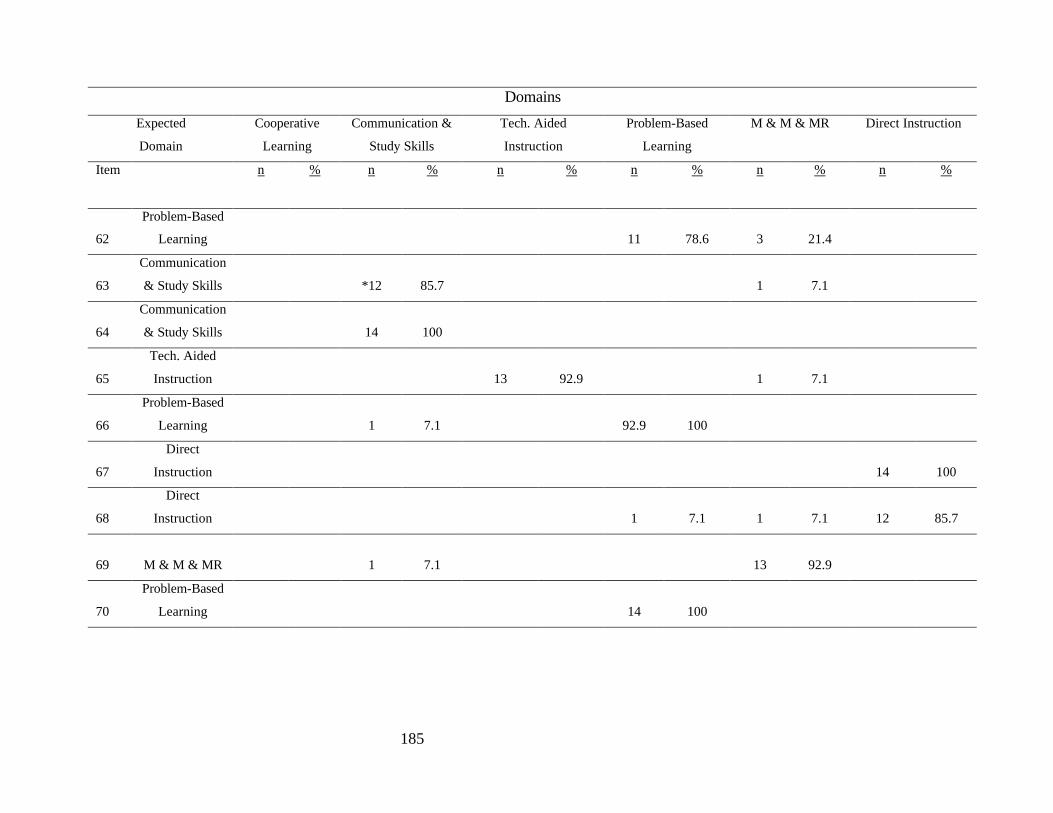
185
Domains
Expected
Domain
Cooperative
Learning
Communication &
Study Skills
Tech. Aided
Instruction
Problem-Based
Learning
M & M & MR Direct Instruction
Item
n % n % n % n % n % n %
62
Problem-Based
Learning
11
78.6
3
21.4
63
Communication
& Study Skills
*12
85.7
1
7.1
64
Communication
& Study Skills
14
100
65
Tech. Aided
Instruction
13
92.9
1
7.1
66
Problem-Based
Learning
1
7.1
92.9
100
67
Direct
Instruction
14
100
68
Direct
Instruction
1
7.1
1
7.1
12
85.7
69
M & M & MR
1
7.1
13
92.9
70
Problem-Based
Learning
14
100
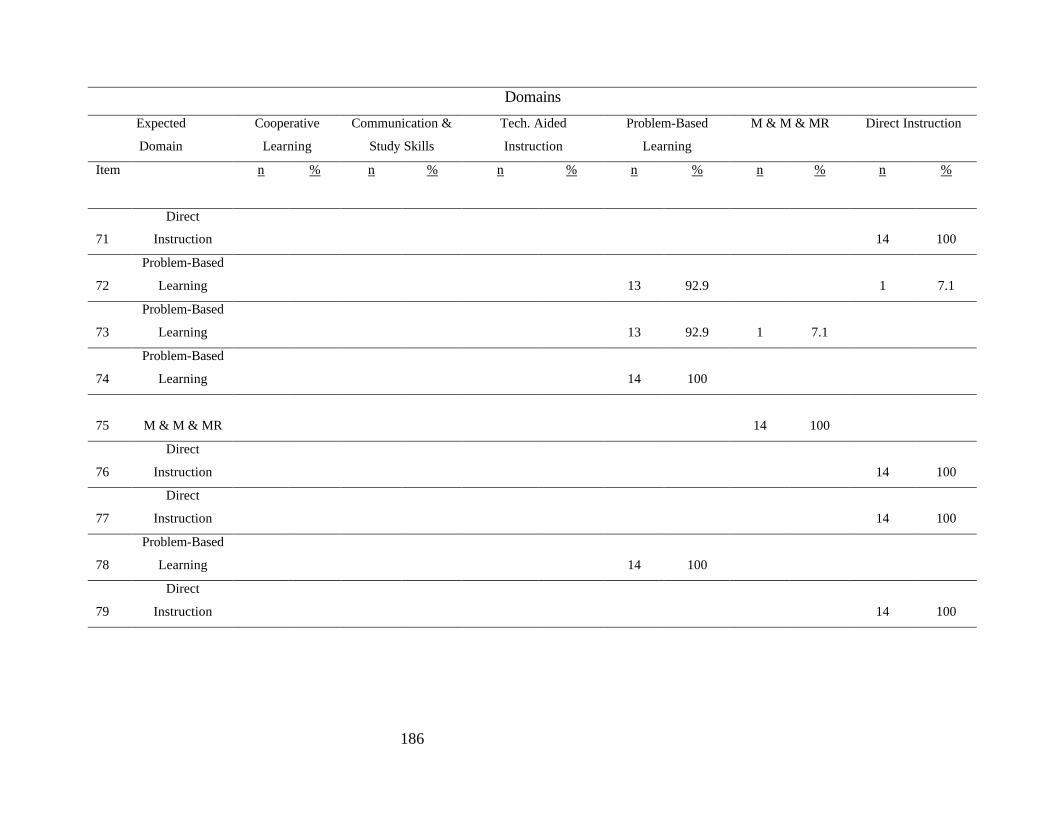
186
Domains
Expected
Domain
Cooperative
Learning
Communication &
Study Skills
Tech. Aided
Instruction
Problem-Based
Learning
M & M & MR Direct Instruction
Item
n % n % n % n % n % n %
71
Direct
Instruction
14
100
72
Problem-Based
Learning
13
92.9
1
7.1
73
Problem-Based
Learning
13
92.9
1
7.1
74
Problem-Based
Learning
14
100
75
M & M & MR
14
100
76
Direct
Instruction
14
100
77
Direct
Instruction
14
100
78
Problem-Based
Learning
14
100
79
Direct
Instruction
14
100
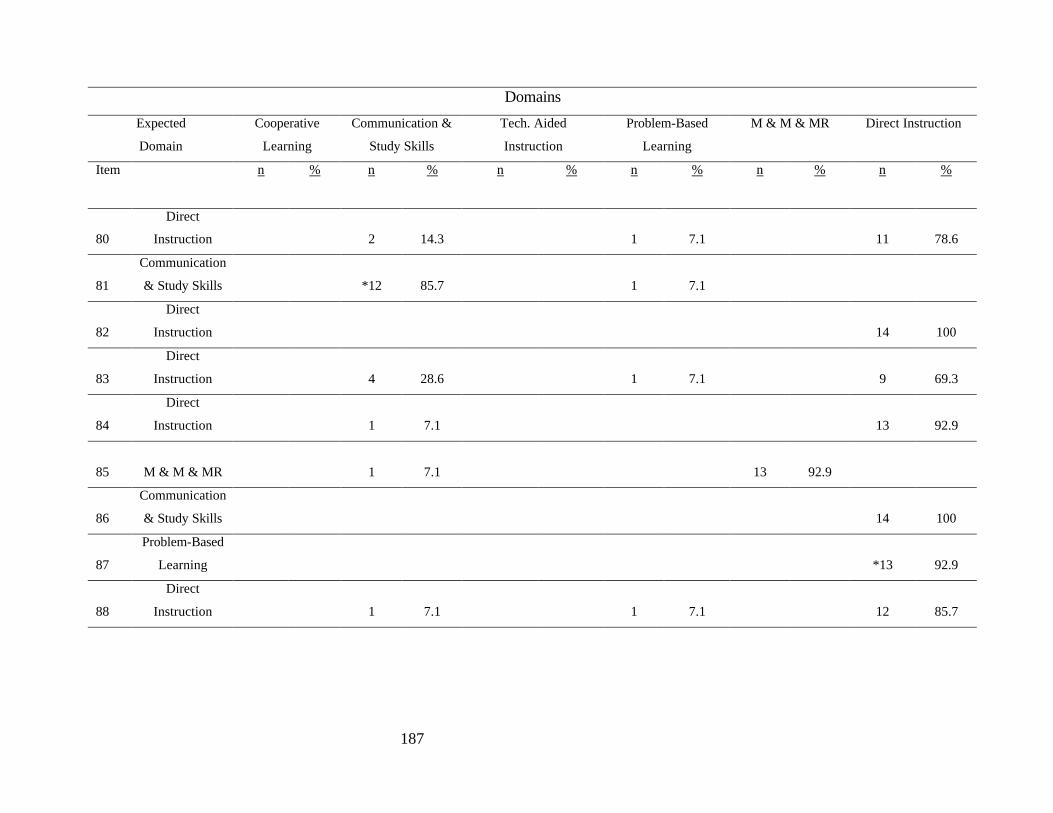
187
Domains
Expected
Domain
Cooperative
Learning
Communication &
Study Skills
Tech. Aided
Instruction
Problem-Based
Learning
M & M & MR Direct Instruction
Item
n % n % n % n % n % n %
80
Direct
Instruction
2
14.3
1
7.1
11
78.6
81
Communication
& Study Skills
*12
85.7
1
7.1
82
Direct
Instruction
14
100
83
Direct
Instruction
4
28.6
1
7.1
9
69.3
84
Direct
Instruction
1
7.1
13
92.9
85
M & M & MR
1
7.1
13
92.9
86
Communication
& Study Skills
14
100
87
Problem-Based
Learning
*13
92.9
88
Direct
Instruction
1
7.1
1
7.1
12
85.7
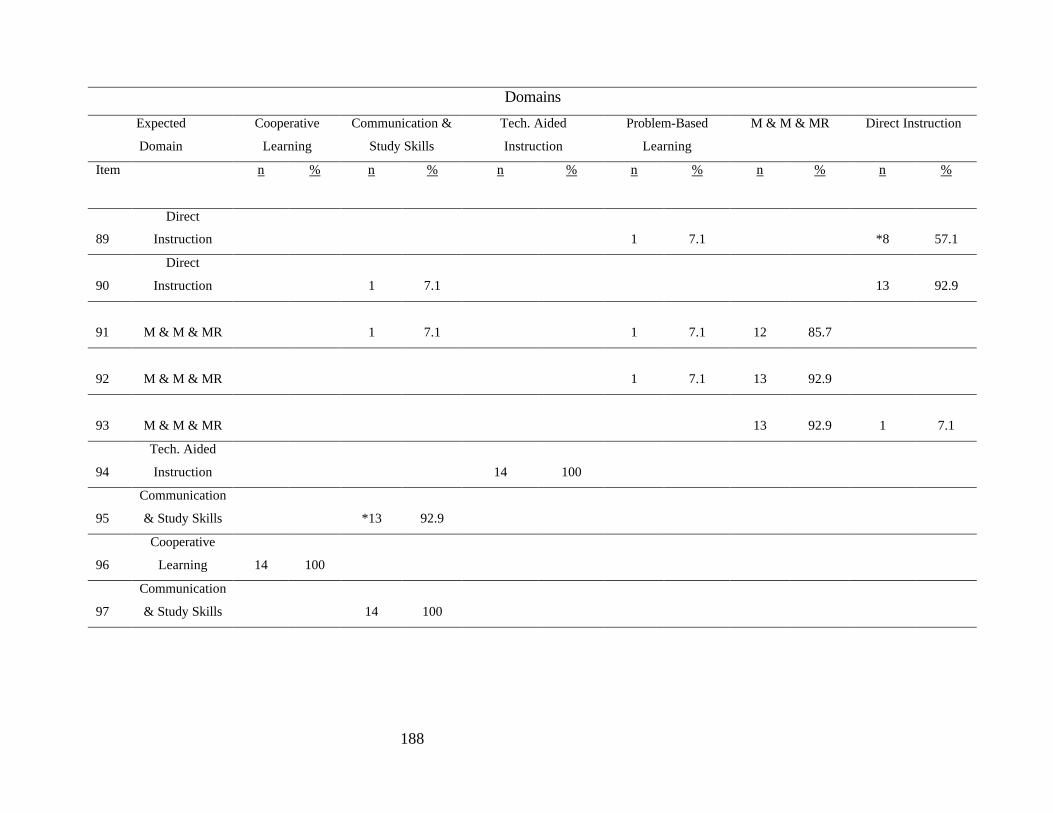
188
Domains
Expected
Domain
Cooperative
Learning
Communication &
Study Skills
Tech. Aided
Instruction
Problem-Based
Learning
M & M & MR Direct Instruction
Item
n % n % n % n % n % n %
89
Direct
Instruction
1
7.1
*8
57.1
90
Direct
Instruction
1
7.1
13
92.9
91
M & M & MR
1
7.1
1
7.1
12
85.7
92
M & M & MR
1
7.1
13
92.9
93
M & M & MR
13
92.9
1
7.1
94
Tech. Aided
Instruction
14
100
95
Communication
& Study Skills
*13
92.9
96
Cooperative
Learning
14
100
97
Communication
& Study Skills
14
100
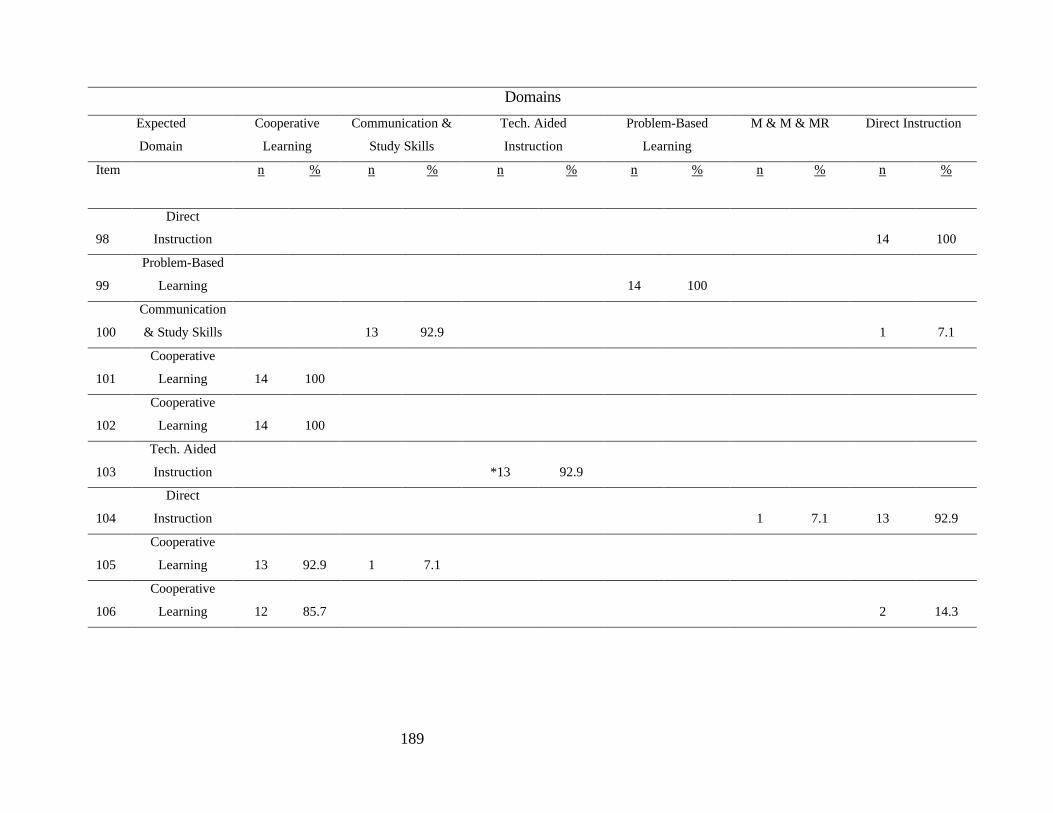
189
Domains
Expected
Domain
Cooperative
Learning
Communication &
Study Skills
Tech. Aided
Instruction
Problem-Based
Learning
M & M & MR Direct Instruction
Item
n % n % n % n % n % n %
98
Direct
Instruction
14
100
99
Problem-Based
Learning
14
100
100
Communication
& Study Skills
13
92.9
1
7.1
101
Cooperative
Learning
14
100
102
Cooperative
Learning
14
100
103
Tech. Aided
Instruction
*13
92.9
104
Direct
Instruction
1
7.1
13
92.9
105
Cooperative
Learning
13
92.9
1
7.1
106
Cooperative
Learning
12
85.7
2
14.3
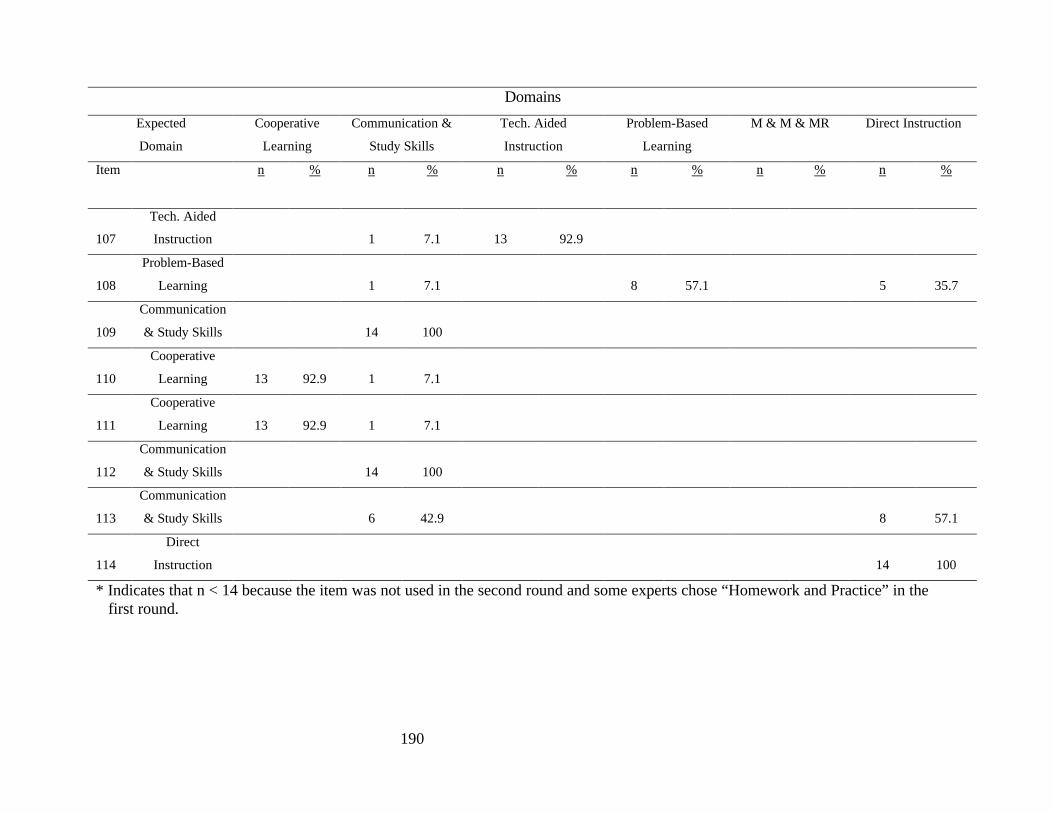
190
Domains
Expected
Domain
Cooperative
Learning
Communication &
Study Skills
Tech. Aided
Instruction
Problem-Based
Learning
M & M & MR Direct Instruction
Item
n % n % n % n % n % n %
107
Tech. Aided
Instruction
1
7.1
13
92.9
108
Problem-Based
Learning
1
7.1
8
57.1
5
35.7
109
Communication
& Study Skills
14
100
110
Cooperative
Learning
13
92.9
1
7.1
111
Cooperative
Learning
13
92.9
1
7.1
112
Communication
& Study Skills
14
100
113
Communication
& Study Skills
6
42.9
8
57.1
114
Direct
Instruction
14
100
* Indicates that n < 14 because the item was not used in the second round and some experts chose “Homework and Practice” in the first round.
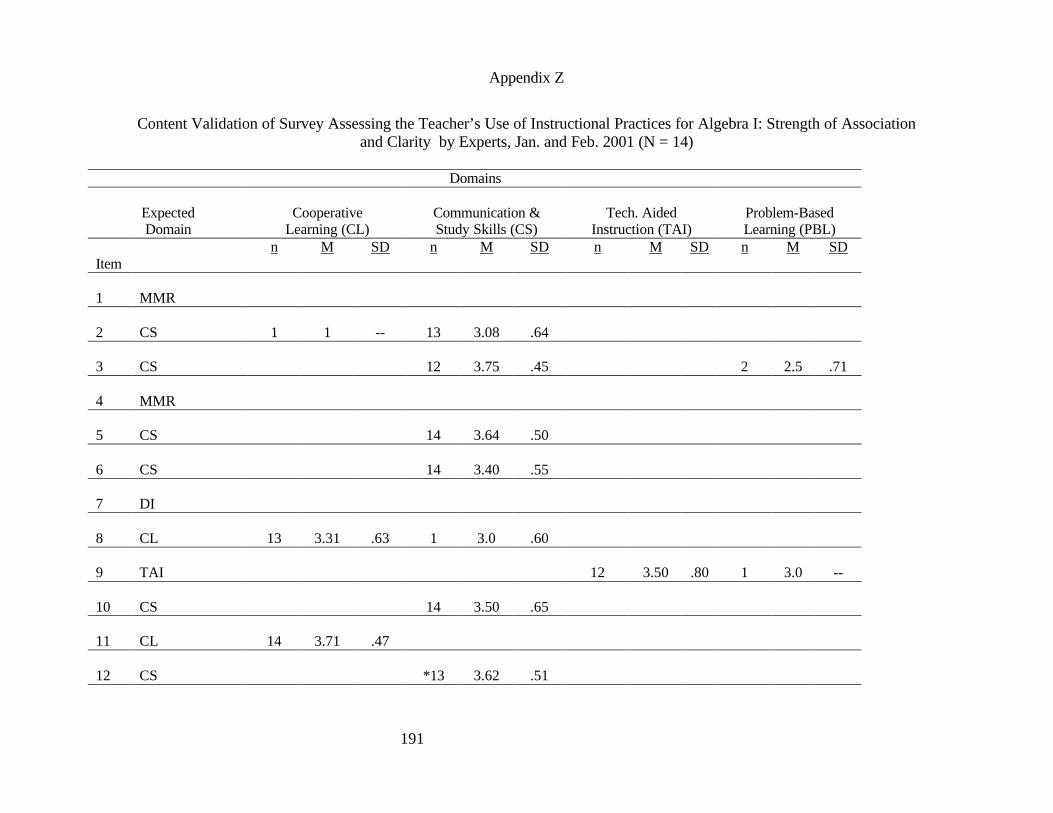
191
Appendix Z
Content Validation of Survey Assessing the Teacher’s Use of Instructional Practices for Algebra I: Strength of Association and Clarity by Experts, Jan. and Feb. 2001 (N = 14)
Domains
Expected Domain
Cooperative
Learning (CL)
Communication & Study Skills (CS)
Tech. Aided
Instruction (TAI)
Problem-Based Learning (PBL)
Item
n
M SD n
M SD n
M SD n
M SD
1
MMR
2
CS
1
1
--
13
3.08
.64
3
CS
12
3.75
.45
2
2.5
.71
4
MMR
5
CS
14
3.64
.50
6
CS
14
3.40
.55
7
DI
8
CL
13
3.31
.63
1
3.0
.60
9
TAI
12
3.50
.80
1
3.0
--
10
CS
14
3.50
.65
11
CL
14
3.71
.47
12
CS
*13
3.62
.51
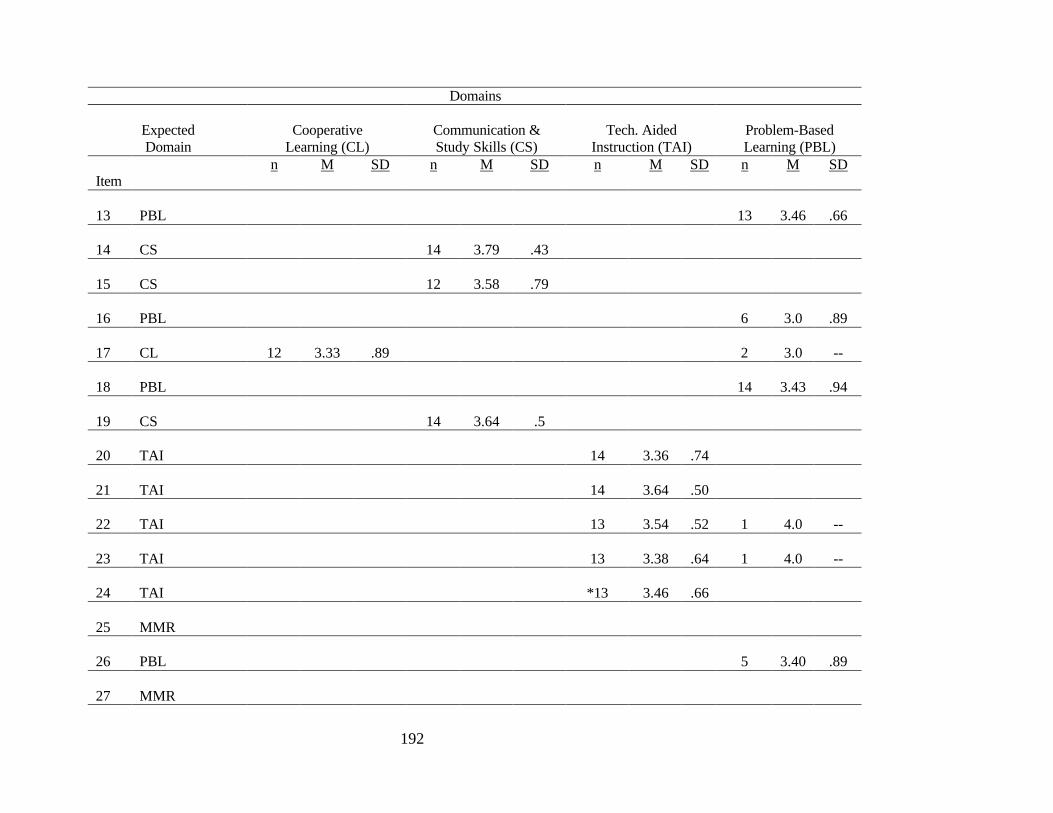
192
Domains
Expected Domain
Cooperative
Learning (CL)
Communication & Study Skills (CS)
Tech. Aided
Instruction (TAI)
Problem-Based Learning (PBL)
Item
n
M SD n
M SD n
M SD n
M SD
13
PBL
13
3.46
.66
14
CS
14
3.79
.43
15
CS
12
3.58
.79
16
PBL
6
3.0
.89
17
CL
12
3.33
.89
2
3.0
--
18
PBL
14
3.43
.94
19
CS
14
3.64
.5
20
TAI
14
3.36
.74
21
TAI
14
3.64
.50
22
TAI
13
3.54
.52
1
4.0
--
23
TAI
13
3.38
.64
1
4.0
--
24
TAI
*13
3.46
.66
25
MMR
26
PBL
5
3.40
.89
27
MMR
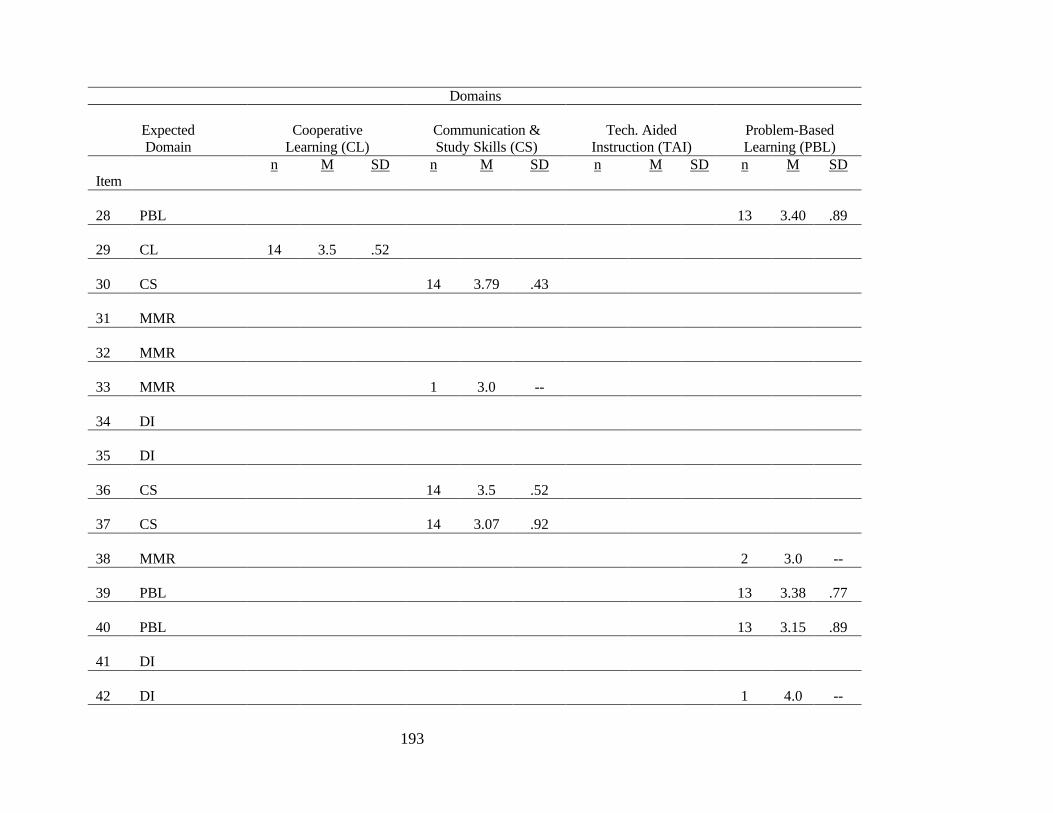
193
Domains
Expected Domain
Cooperative
Learning (CL)
Communication & Study Skills (CS)
Tech. Aided
Instruction (TAI)
Problem-Based Learning (PBL)
Item
n
M SD n
M SD n
M SD n
M SD
28
PBL
13
3.40
.89
29
CL
14
3.5
.52
30
CS
14
3.79
.43
31
MMR
32
MMR
33
MMR
1
3.0
--
34
DI
35
DI
36
CS
14
3.5
.52
37
CS
14
3.07
.92
38
MMR
2
3.0
--
39
PBL
13
3.38
.77
40
PBL
13
3.15
.89
41
DI
42
DI
1
4.0
--
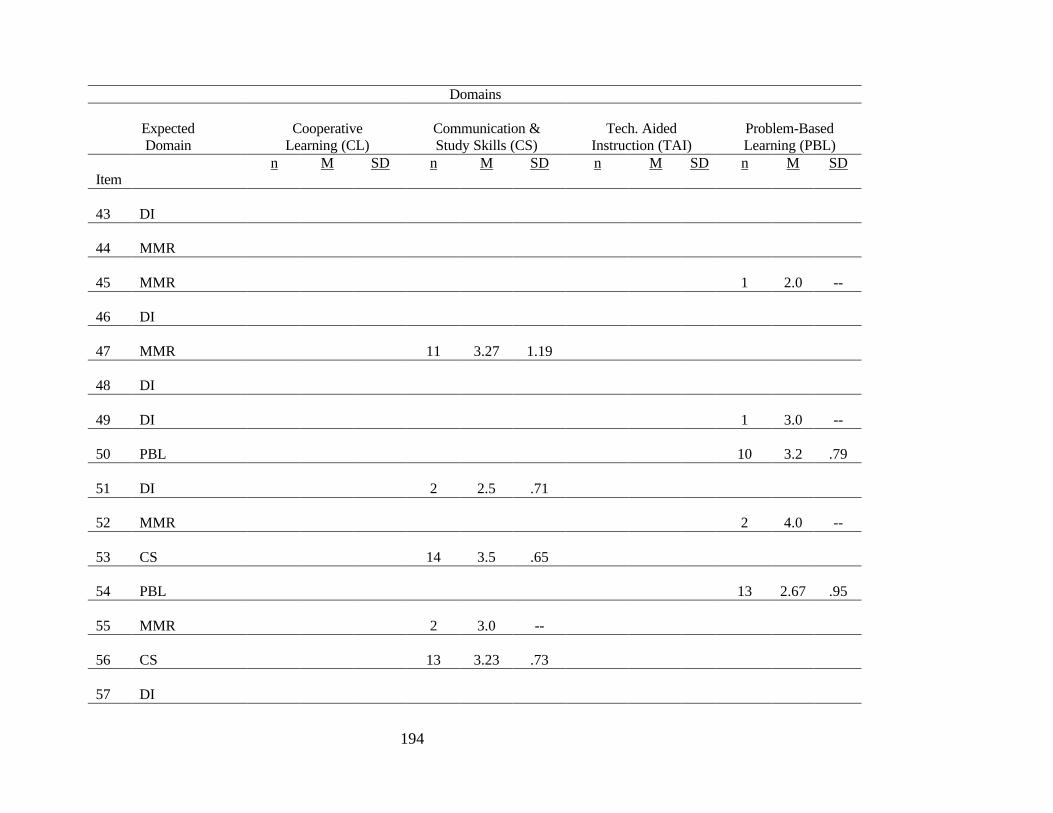
194
Domains
Expected Domain
Cooperative
Learning (CL)
Communication & Study Skills (CS)
Tech. Aided
Instruction (TAI)
Problem-Based Learning (PBL)
Item
n
M SD n
M SD n
M SD n
M SD
43
DI
44
MMR
45
MMR
1
2.0
--
46
DI
47
MMR
11
3.27
1.19
48
DI
49
DI
1
3.0
--
50
PBL
10
3.2
.79
51
DI
2
2.5
.71
52
MMR
2
4.0
--
53
CS
14
3.5
.65
54
PBL
13
2.67
.95
55
MMR
2
3.0
--
56
CS
13
3.23
.73
57
DI
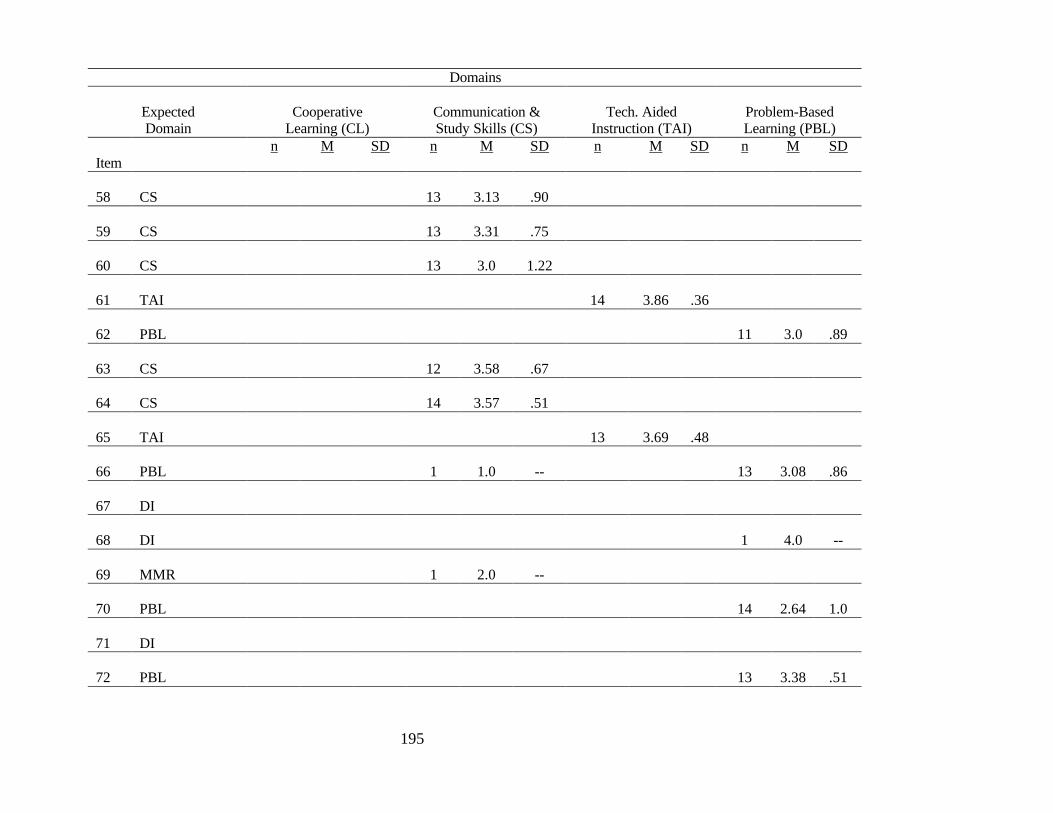
195
Domains
Expected Domain
Cooperative
Learning (CL)
Communication & Study Skills (CS)
Tech. Aided
Instruction (TAI)
Problem-Based Learning (PBL)
Item
n
M SD n
M SD n
M SD n
M SD
58
CS
13
3.13
.90
59
CS
13
3.31
.75
60
CS
13
3.0
1.22
61
TAI
14
3.86
.36
62
PBL
11
3.0
.89
63
CS
12
3.58
.67
64
CS
14
3.57
.51
65
TAI
13
3.69
.48
66
PBL
1
1.0
--
13
3.08
.86
67
DI
68
DI
1
4.0
--
69
MMR
1
2.0
--
70
PBL
14
2.64
1.0
71
DI
72
PBL
13
3.38
.51
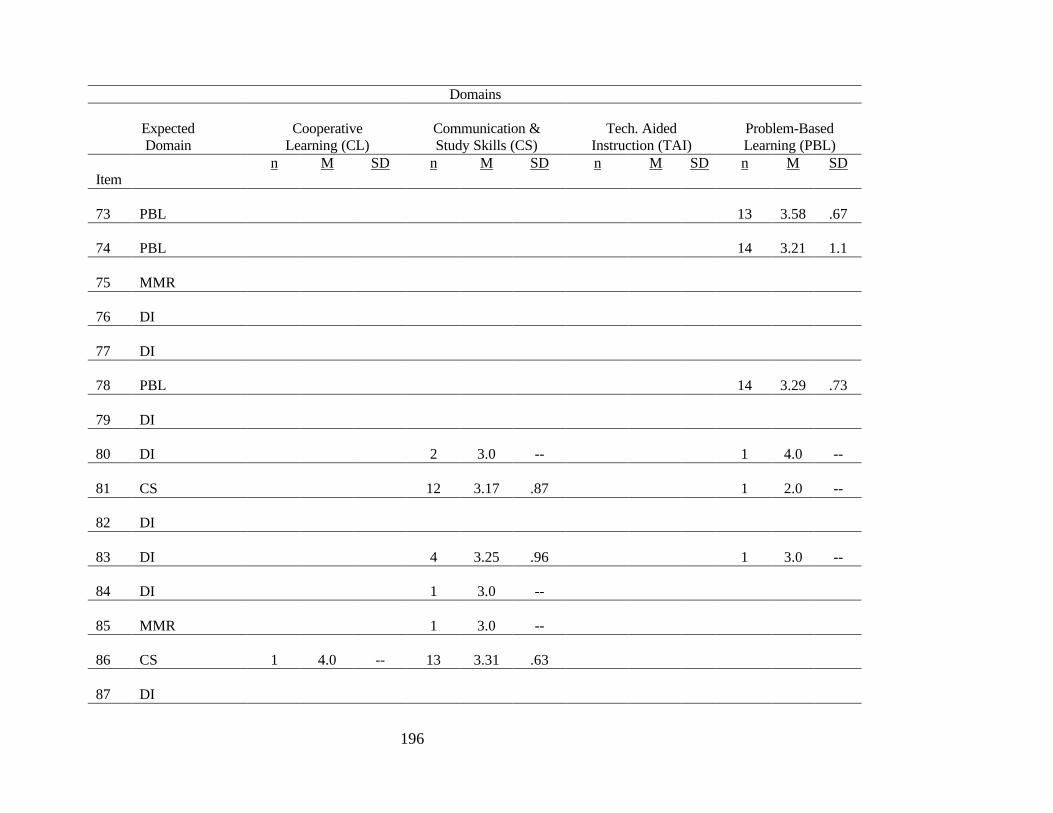
196
Domains
Expected Domain
Cooperative
Learning (CL)
Communication & Study Skills (CS)
Tech. Aided
Instruction (TAI)
Problem-Based Learning (PBL)
Item
n
M SD n
M SD n
M SD n
M SD
73
PBL
13
3.58
.67
74
PBL
14
3.21
1.1
75
MMR
76
DI
77
DI
78
PBL
14
3.29
.73
79
DI
80
DI
2
3.0
--
1
4.0
--
81
CS
12
3.17
.87
1
2.0
--
82
DI
83
DI
4
3.25
.96
1
3.0
--
84
DI
1
3.0
--
85
MMR
1
3.0
--
86
CS
1
4.0
--
13
3.31
.63
87
DI
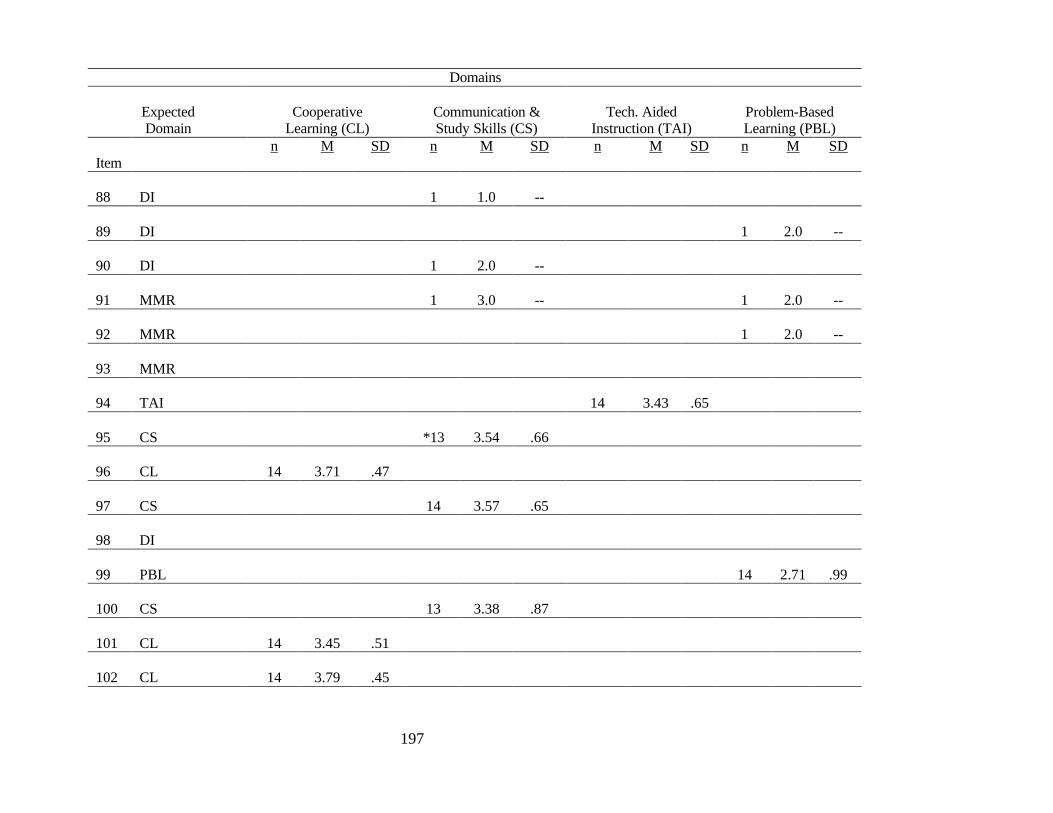
197
Domains
Expected Domain
Cooperative
Learning (CL)
Communication & Study Skills (CS)
Tech. Aided
Instruction (TAI)
Problem-Based Learning (PBL)
Item
n
M SD n
M SD n
M SD n
M SD
88
DI
1
1.0
--
89
DI
1
2.0
--
90
DI
1
2.0
--
91
MMR
1
3.0
--
1
2.0
--
92
MMR
1
2.0
--
93
MMR
94
TAI
14
3.43
.65
95
CS
*13
3.54
.66
96
CL
14
3.71
.47
97
CS
14
3.57
.65
98
DI
99
PBL
14
2.71
.99
100
CS
13
3.38
.87
101
CL
14
3.45
.51
102
CL
14
3.79
.45
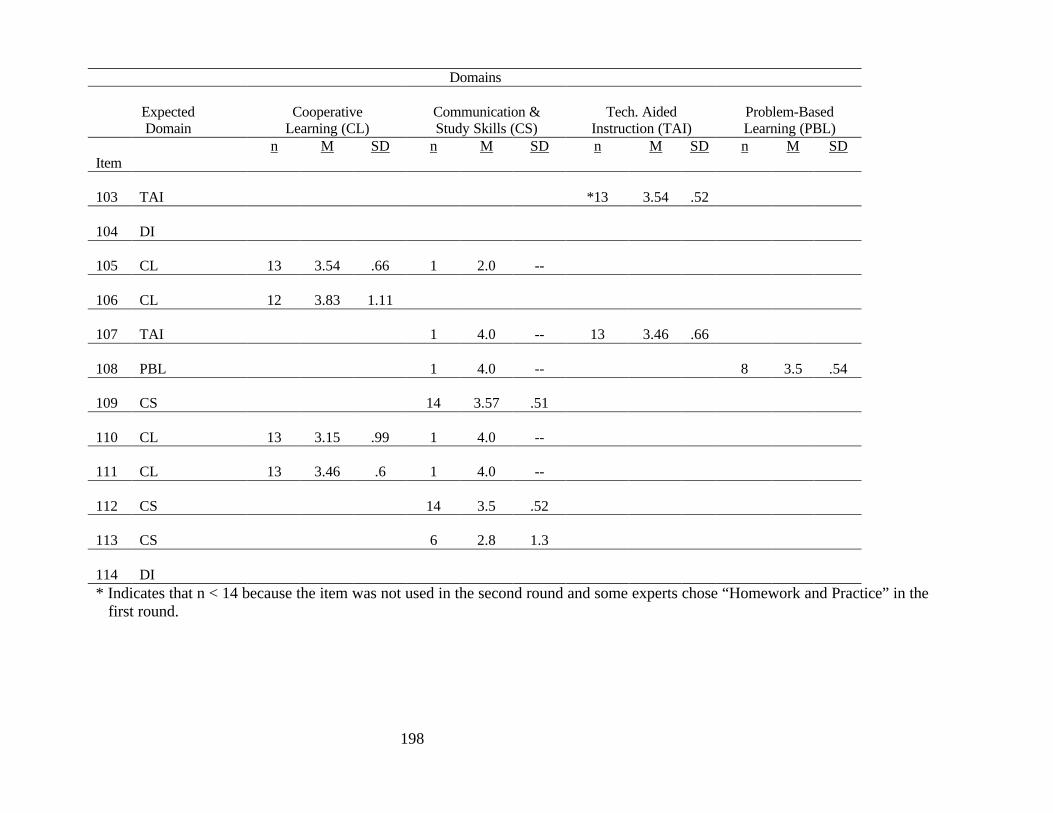
198
Domains
Expected Domain
Cooperative
Learning (CL)
Communication & Study Skills (CS)
Tech. Aided
Instruction (TAI)
Problem-Based Learning (PBL)
Item
n
M SD n
M SD n
M SD n
M SD
103
TAI
*13
3.54
.52
104
DI
105
CL
13
3.54
.66
1
2.0
--
106
CL
12
3.83
1.11
107
TAI
1
4.0
--
13
3.46
.66
108
PBL
1
4.0
--
8
3.5
.54
109
CS
14
3.57
.51
110
CL
13
3.15
.99
1
4.0
--
111
CL
13
3.46
.6
1
4.0
--
112
CS
14
3.5
.52
113
CS
6
2.8
1.3
114
DI
* Indicates that n < 14 because the item was not used in the second round and some experts chose “Homework and Practice” in the first round.
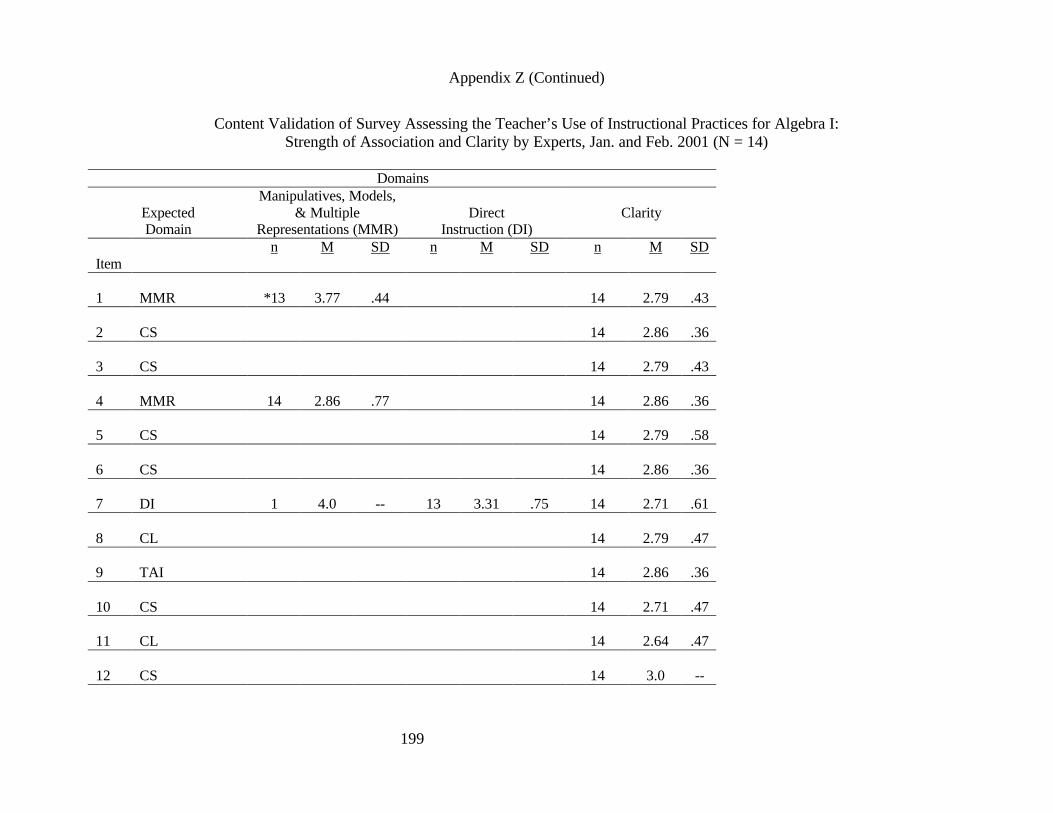
199
Appendix Z (Continued)
Content Validation of Survey Assessing the Teacher’s Use of Instructional Practices for Algebra I: Strength of Association and Clarity by Experts, Jan. and Feb. 2001 (N = 14)
Domains
Expected Domain
Manipulatives, Models, & Multiple
Representations (MMR)
Direct
Instruction (DI)
Clarity
Item
n
M SD n
M SD n
M SD
1
MMR
*13
3.77
.44
14
2.79
.43
2
CS
14
2.86
.36
3
CS
14
2.79
.43
4
MMR
14
2.86
.77
14
2.86
.36
5
CS
14
2.79
.58
6
CS
14
2.86
.36
7
DI
1
4.0
--
13
3.31
.75
14
2.71
.61
8
CL
14
2.79
.47
9
TAI
14
2.86
.36
10
CS
14
2.71
.47
11
CL
14
2.64
.47
12
CS
14
3.0
--
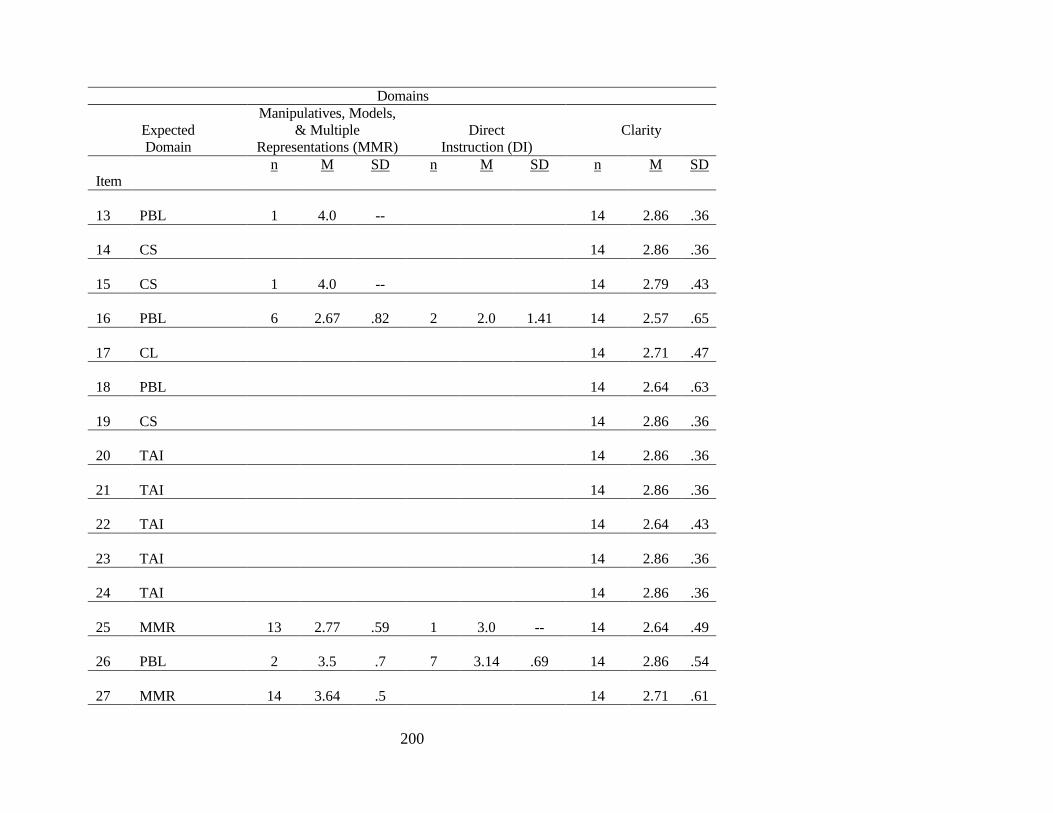
200
Domains
Expected Domain
Manipulatives, Models, & Multiple
Representations (MMR)
Direct
Instruction (DI)
Clarity
Item
n
M SD n
M SD n
M SD
13
PBL
1
4.0
--
14
2.86
.36
14
CS
14
2.86
.36
15
CS
1
4.0
--
14
2.79
.43
16
PBL
6
2.67
.82
2
2.0
1.41
14
2.57
.65
17
CL
14
2.71
.47
18
PBL
14
2.64
.63
19
CS
14
2.86
.36
20
TAI
14
2.86
.36
21
TAI
14
2.86
.36
22
TAI
14
2.64
.43
23
TAI
14
2.86
.36
24
TAI
14
2.86
.36
25
MMR
13
2.77
.59
1
3.0
--
14
2.64
.49
26
PBL
2
3.5
.7
7
3.14
.69
14
2.86
.54
27
MMR
14
3.64
.5
14
2.71
.61

201
Domains
Expected Domain
Manipulatives, Models, & Multiple
Representations (MMR)
Direct
Instruction (DI)
Clarity
Item
n
M SD n
M SD n
M SD
28
PBL
1
2.0
--
14
2.86
.36
29
CL
14
2.79
.53
30
CS
14
2.93
.27
31
MMR
14
3.71
.47
14
2.93
.27
32
MMR
14
3.79
.43
14
2.86
.54
33
MMR
13
3.62
.51
14
2.71
.61
34
DI
14
3.71
.61
14
2.93
.27
35
DI
14
3.0
1.03
14
2.86
.36
36
CS
14
2.79
.55
37
CS
14
2.71
.47
38
MMR
8
2.88
.64
4
3.25
.96
14
2.64
.63
39
PBL
1
4.0
--
14
2.71
.47
40
PBL
1
4.0
--
14
2.64
.63
41
DI
14
3.36
.75
14
2.79
.43
42
DI
13
3.23
.83
14
2.57
.76
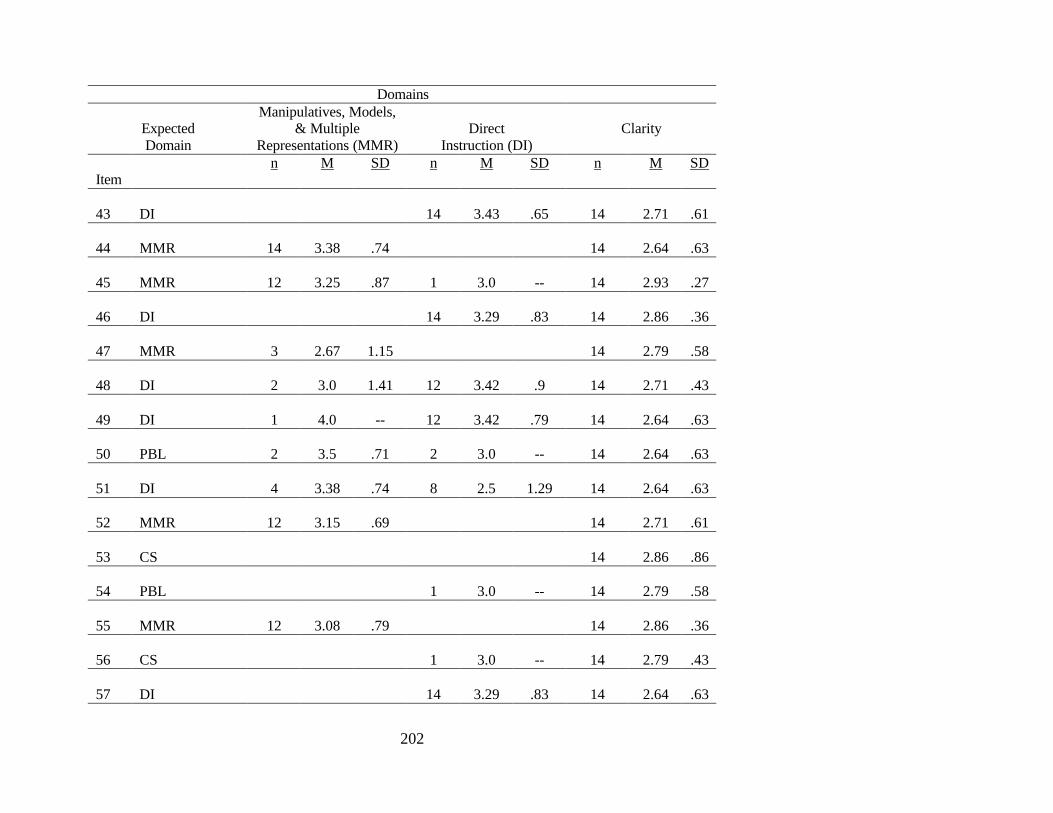
202
Domains
Expected Domain
Manipulatives, Models, & Multiple
Representations (MMR)
Direct
Instruction (DI)
Clarity
Item
n
M SD n
M SD n
M SD
43
DI
14
3.43
.65
14
2.71
.61
44
MMR
14
3.38
.74
14
2.64
.63
45
MMR
12
3.25
.87
1
3.0
--
14
2.93
.27
46
DI
14
3.29
.83
14
2.86
.36
47
MMR
3
2.67
1.15
14
2.79
.58
48
DI
2
3.0
1.41
12
3.42
.9
14
2.71
.43
49
DI
1
4.0
--
12
3.42
.79
14
2.64
.63
50
PBL
2
3.5
.71
2
3.0
--
14
2.64
.63
51
DI
4
3.38
.74
8
2.5
1.29
14
2.64
.63
52
MMR
12
3.15
.69
14
2.71
.61
53
CS
14
2.86
.86
54
PBL
1
3.0
--
14
2.79
.58
55
MMR
12
3.08
.79
14
2.86
.36
56
CS
1
3.0
--
14
2.79
.43
57
DI
14
3.29
.83
14
2.64
.63

203
Domains
Expected Domain
Manipulatives, Models, & Multiple
Representations (MMR)
Direct
Instruction (DI)
Clarity
Item
n
M SD n
M SD n
M SD
58
CS
14
2.64
.5
59
CS
1
3.0
--
14
3.0
--
60
CS
1
4.0
--
14
2.64
.63
61
TAI
14
3.0
--
62
PBL
3
2.67
.58
14
2.71
.61
63
CS
14
2.79
.43
64
CS
14
2.93
.97
65
TAI
1
3.0
--
14
2.93
.27
66
PBL
14
2.79
.58
67
DI
14
3.14
.95
14
2.71
.47
68
DI
1
1.0
--
12
3.58
.67
14
2.64
.63
69
MMR
13
3.85
.38
14
2.93
.27
70
PBL
14
2.21
.8
71
DI
14
3.43
.51
14
2.93
.27
72
PBL
1
1.0
--
14
2.86
.54
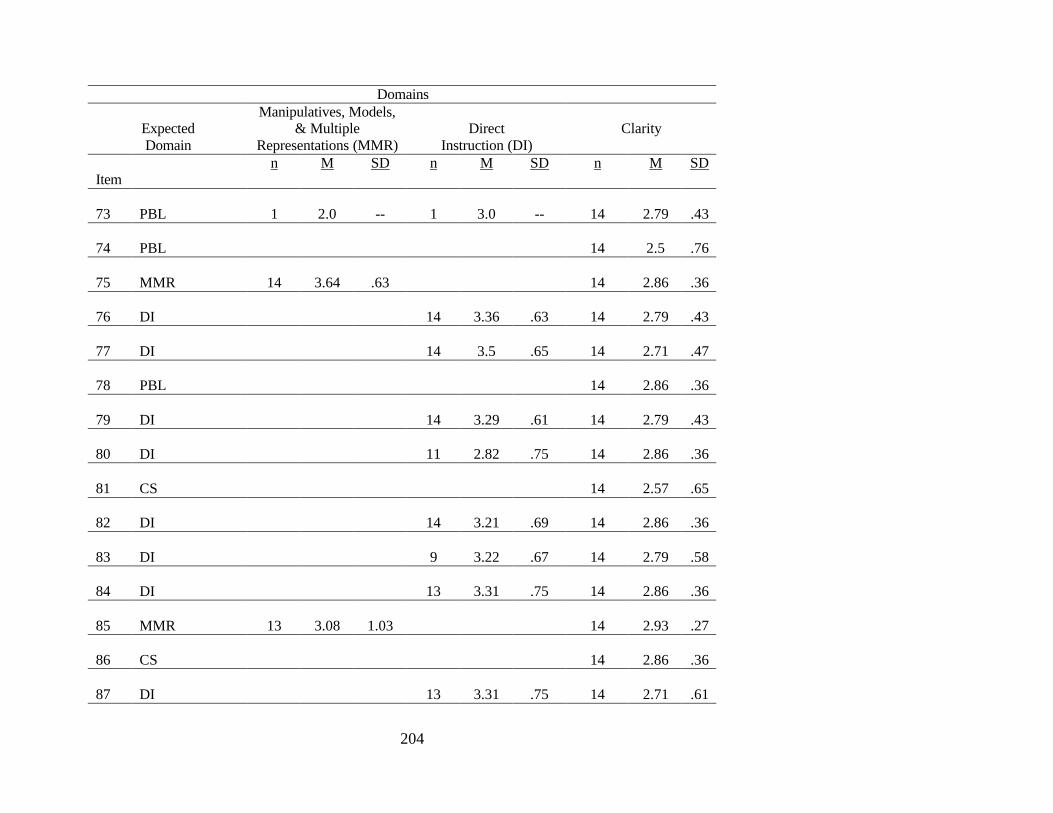
204
Domains
Expected Domain
Manipulatives, Models, & Multiple
Representations (MMR)
Direct
Instruction (DI)
Clarity
Item
n
M SD n
M SD n
M SD
73
PBL
1
2.0
--
1
3.0
--
14
2.79
.43
74
PBL
14
2.5
.76
75
MMR
14
3.64
.63
14
2.86
.36
76
DI
14
3.36
.63
14
2.79
.43
77
DI
14
3.5
.65
14
2.71
.47
78
PBL
14
2.86
.36
79
DI
14
3.29
.61
14
2.79
.43
80
DI
11
2.82
.75
14
2.86
.36
81
CS
14
2.57
.65
82
DI
14
3.21
.69
14
2.86
.36
83
DI
9
3.22
.67
14
2.79
.58
84
DI
13
3.31
.75
14
2.86
.36
85
MMR
13
3.08
1.03
14
2.93
.27
86
CS
14
2.86
.36
87
DI
13
3.31
.75
14
2.71
.61
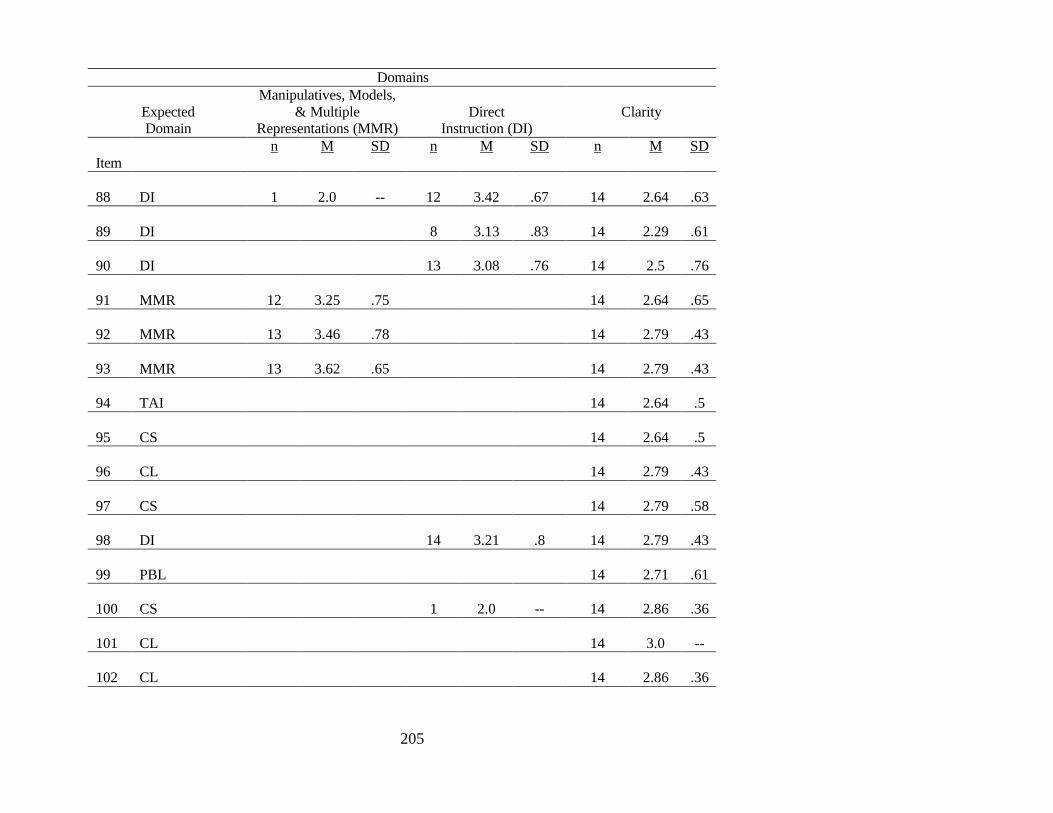
205
Domains
Expected Domain
Manipulatives, Models, & Multiple
Representations (MMR)
Direct
Instruction (DI)
Clarity
Item
n
M SD n
M SD n
M SD
88
DI
1
2.0
--
12
3.42
.67
14
2.64
.63
89
DI
8
3.13
.83
14
2.29
.61
90
DI
13
3.08
.76
14
2.5
.76
91
MMR
12
3.25
.75
14
2.64
.65
92
MMR
13
3.46
.78
14
2.79
.43
93
MMR
13
3.62
.65
14
2.79
.43
94
TAI
14
2.64
.5
95
CS
14
2.64
.5
96
CL
14
2.79
.43
97
CS
14
2.79
.58
98
DI
14
3.21
.8
14
2.79
.43
99
PBL
14
2.71
.61
100
CS
1
2.0
--
14
2.86
.36
101
CL
14
3.0
--
102
CL
14
2.86
.36
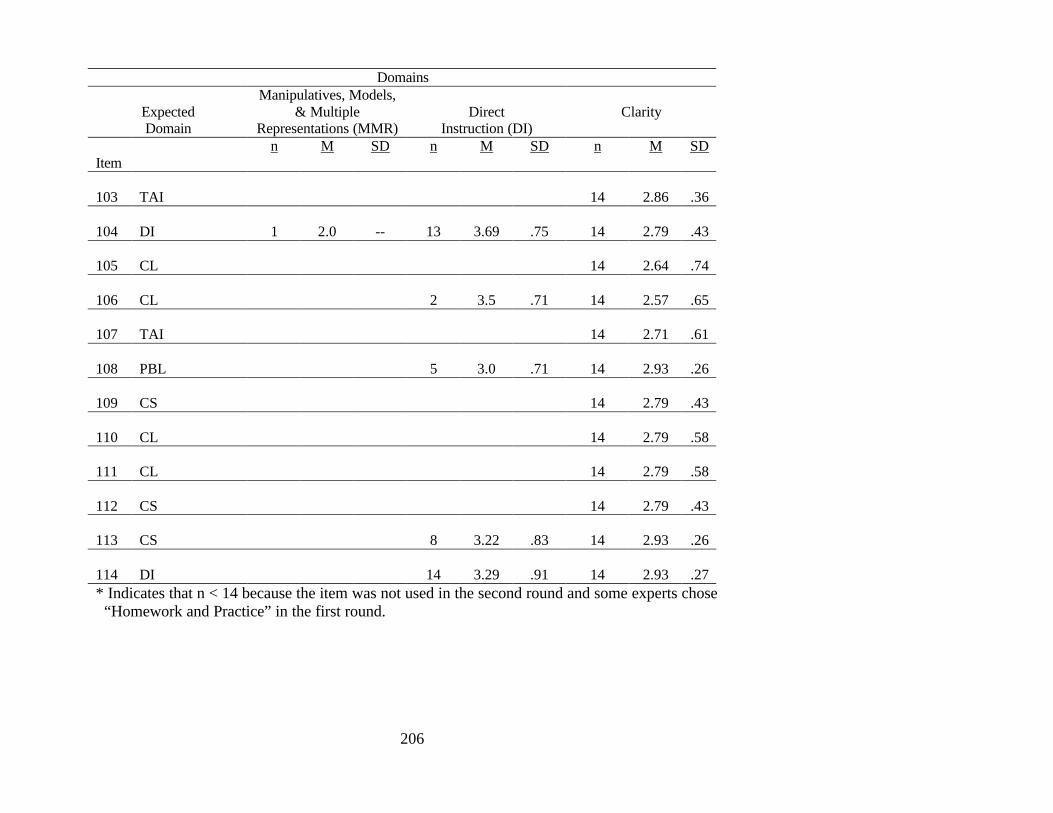
206
Domains
Expected Domain
Manipulatives, Models, & Multiple
Representations (MMR)
Direct
Instruction (DI)
Clarity
Item
n
M SD n
M SD n
M SD
103
TAI
14
2.86
.36
104
DI
1
2.0
--
13
3.69
.75
14
2.79
.43
105
CL
14
2.64
.74
106
CL
2
3.5
.71
14
2.57
.65
107
TAI
14
2.71
.61
108
PBL
5
3.0
.71
14
2.93
.26
109
CS
14
2.79
.43
110
CL
14
2.79
.58
111
CL
14
2.79
.58
112
CS
14
2.79
.43
113
CS
8
3.22
.83
14
2.93
.26
114
DI
14
3.29
.91
14
2.93
.27
* Indicates that n < 14 because the item was not used in the second round and some experts chose “Homework and Practice” in the first round.
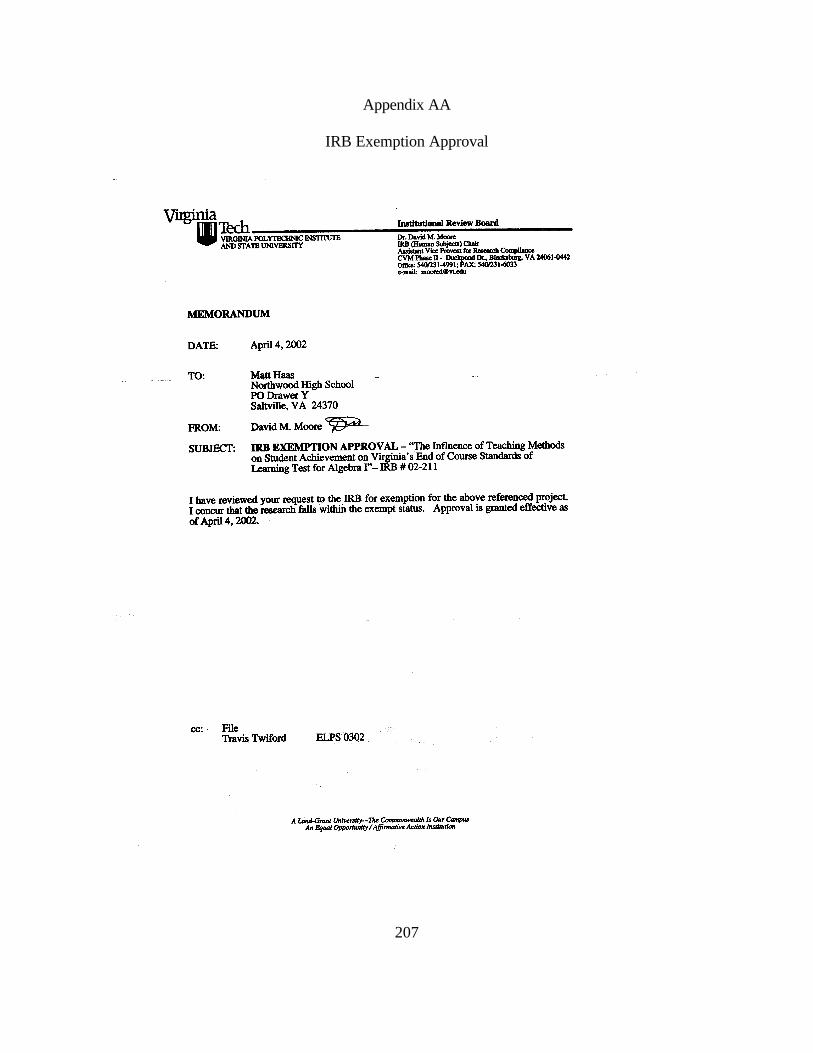
Appendix AA
IRB Exemption Approval
207

208
Appendix BB
Virginia Beach City Public School Approval for Reliability Study
209
Appendix CC
Permission Letter and Form Sent to Selected Region VII Superintendents
[date] Superintendent School Division Street Address City, State Zip Code Dear [Superintendent]: I am writing to request your help in addressing a research issue that I think will be of benefit to the school divisions of Region 7 as well as others around the Commonwealth. As a high school principal, I am constantly looking for ways for my students to improve their achievement, especially in the area of mathematics. As a doctoral candidate at Virginia Tech, I am proposing a research study for my dissertation that will explore teaching practices that may contribute to student achievement on the end of course SOL test for Algebra I. I have conducted a meta-analysis to synthesize the last two decades of research on teaching practices for algebra. From this meta-analysis, I am developing a questionnaire designed to determine the extent to which Algebra I teachers in Region 7 use research-based teaching practices. Using Algebra I teachers’ mean scores for this year’s SOL test administration(s), I will seek to determine the effect of each teaching practice on student achievement on the end of course test for Algebra I. I am contacting you to ask permission to survey Algebra I teachers in [school division] in April and to gain access to their mean SOL scores after the spring administration. Of course, if you grant this permission, I will also contact each school principal before moving forward. The information I collect will be aggregated into group data for analysis. No identifiable information will be maintained to link school divisions, schools, teachers, or students to responses on the questionnaire or SOL assessment scores. I will share the results of the study with the superintendents of Region 7 and make them available through the Virginia Tech database. As we discussed in our telephone conversation, if you decide to grant your permission, please take a moment to complete the attached form and fax it to me at (276) 496 – 3216. If you have any questions, or concerns, please call me at (276) 496 – 7751. I believe that this research will be of benefit to our students, teachers, and school leaders as they strive to achieve in mathematics. Respectfully, Matthew S. Haas Dr. Travis W. Twiford Principal Director Northwood High School Tidewater Doctoral Program Smyth County Virginia Polytechnic Institute and State University

210
Please complete this form and fax it to Matt Haas at (276) 496 – 3216 by Thursday,
March 13, 2002. By signing this form, I am granting Matt Haas permission to conduct his research project, “An Investigation of Teaching Methods for Algebra I,” with the participation of [school division] Algebra I teachers. Matt Haas agrees to follow his research proposal as outlined in the attached letter. 1) Contact each school principal before moving forward. 2) The information I collect will be aggregated into group data for analysis. 3) No identifiable information will be maintained to link school divisions, schools, teachers, or students to responses on the questionnaire or SOL assessment scores. 4) The results of the study will be shared with the superintendents of Region 7 and made available through the Virginia Tech database. superintendent Date Please indicate the number of Algebra I teachers in your school division: _____________ Please complete this form and fax it to Matt Haas at (276) 496 – 3216 by Thursday,
March 13, 2002.
211
Appendix DD
Letter to Individual Teacher Requesting Participation
[date] «Prefix» «Last_Name» Algebra I Teacher «School» «Address» «City», «State» «Postal_Code» Dear «Prefix» «Last_Name»: Given Virginia’s mandate that all high school students must pass Algebra I to graduate, there is a pressing need to provide assistance to Algebra I teachers across the commonwealth as they strive for success with their students. In order to make a useful contribution to this process, I am studying the influence of teaching methods on student achievement on Virginia’s End of Course SOL Test for Algebra I. I need your help to do so. I am asking you to complete a brief, research-based survey. You are one of 59 Algebra I teachers in Region VII asked to participate. As an Algebra I teacher, the information you can provide regarding your teaching methods is essential to the completion of this study. By analyzing responses to this survey along with results from the spring administration of the End of Course SOL Test for Algebra I, I am seeking to determine which teaching methods have the strongest influence on student achievement on this test. Please log onto the following secure web site. Please remember to type the underline spaces between “algebra” and “survey” and between “survey” and “new.” You will need your PIN and secret word to log on.
http://www.scsb.org/algebra_survey_new.asp Your PIN is «PIN» The secret word is newton. You can be assured of complete confidentiality. Your name will not appear in my database. Your PIN and the secret word are provided so that I may protect your responses. The information I collect will be aggregated into group data for analysis. No identifiable information will be maintained to link school divisions, schools, teachers, or students to responses on the survey or SOL assessment scores. «Division» superintendent, «Superintendent», has approved this project.
The results of this research will be made available through the Virginia Tech database. If you are interested in obtaining the results of this study, or if you have any questions or need assistance, please e-mail me at [email protected], or call me at (276) 496-7751. I would be most happy to answer any questions you might have.
Thanks again. I greatly appreciate your participation in this project!
Respectfully, Matthew S. Haas Dr. Travis W. Twiford Principal Director Northwood High School Tidewater Doctoral Program Smyth County Virginia Polytechnic Institute and State University
212
Appendix EE
Contents of Pre-Contact and Reminder Postcards for Teachers and Principals
Dear «Prefix» «Last Name»:
Given Virginia’s mandate that all high school students must pass Algebra I to graduate, there is a pressing need to assist Algebra I teachers as they strive for success with their students.
In about a week, I’ll be asking you to complete a brief, completely confidential, research-based survey designed to determine which teach-ing methods have the strongest influence on student achievement on the Algebra I SOL Test. The information you can provide about your teaching methods is essential to the completion of this study. Thank you for your consideration.
Sincerely,
Matthew S. Haas Dr. Travis W. Twiford
Northwood High School Virginia Tech.
Which Teaching Methods Influence Student Achievement on Virginia’s End of Course
SOL Test for Algebra I?
Dear «Prefix» «LastName»:
Given Virginia’s mandate that all high school students must pass Algebra I to graduate, there is a pressing need to assist Algebra I teachers as they strive for success with their students.
In about a week, I’ll be asking your Algebra I staff to complete a brief, completely confidential, research-based survey designed to determine which teaching methods have the strongest influence on student achievement on the Algebra I SOL Test. The information your staff can provide about teaching methods is essential to the completion of this study. Thank you for any assistance you can provide.
Sincerely,
Matthew S. Haas Dr. Travis W. Twiford
Northwood High School Virginia Tech.
Which Teaching Methods Influence Student Achievement on Virginia’s End of Course
SOL Test for Algebra I?

213
Appendix FF
Contents of Follow-Up Postcard to Teachers
Dear «Prefix» «Last Name»:
Last week, I mailed you a letter asking you to complete a brief, completely confidential survey designed to determine which teaching methods have the strongest influence on student achievement on the Algebra I SOL Test.
If you have already completed the survey, please accept my sincere thanks. If not, please do so today. Because only a small, representative sample of Alge-bra I teachers was asked to participate, it is extremely important that you re-spond so that the results of the study are accurate and complete.
If by some chance you did not receive my letter, or you have had technical difficulties with the web address for the survey, please call me now, collect (276-496-7751), or e-mail me ([email protected]), and I will assist you in completing the survey in a matter of minutes.
Sincerely,
Matthew S. Haas Dr. Travis W. Twiford
Northwood High School Virginia Tech.
Your Response is Critical!
214
Appendix GG
Follow-Up Letter to Superintendents
[date] «Name» Superintendent «School_Division» «Street_Address» «City», «State» «Zip_Code» Dear «Name»: I cannot thank you enough for allowing me to ask your Algebra I teachers to participate in my study concerning the influence of teaching methods on student achievement on the SOL test for Algebra I. Thanks to your endorsement and support and that of your secondary school principals, I was able to achieve a 98% response rate to my on-line questionnaire across the seven school divisions I asked to participate. All of the principals were accommodating and encouraging and expressed a real interest in instruction. Further, the fact that Algebra I teachers working for «School_Division» were so willing to participate conveys an impressive interest in research-based teaching methods. During the second or third week in June, I will contact you by telephone to make an appointment to visit your school board office at your convenience. The purpose of my visit will be to obtain a mean scale SOL test score for this spring for each participating Algebra I teacher. I will accept the data I need in whatever format that is convenient for you. I have a Microsoft Access file that was developed by Smyth County’s Technology Coordinator that converts text files sent by the testing company into fields for sorting. I would be happy to bring this software on my visit, and I have permission to share it. This will be the final phase of my data collection process. I want to repeat that the information I collect will be aggregated into group data for analysis. No identifiable information will be maintained to link school divisions, schools, teachers, or students to responses on the questionnaire or SOL assessment scores. I will share the results of the study with you and make them available through the Virginia Tech database. Thanks again for your support and encouragement in this research that I believe will be of benefit to our students, teachers, and school leaders as they strive to achieve in mathematics. I look forward to talking with you again and maybe meeting you in person in June. Respectfully, Matthew S. Haas Dr. Travis W. Twiford Principal Director Northwood High School Tidewater Doctoral Program Smyth County Virginia Polytechnic Institute and State University
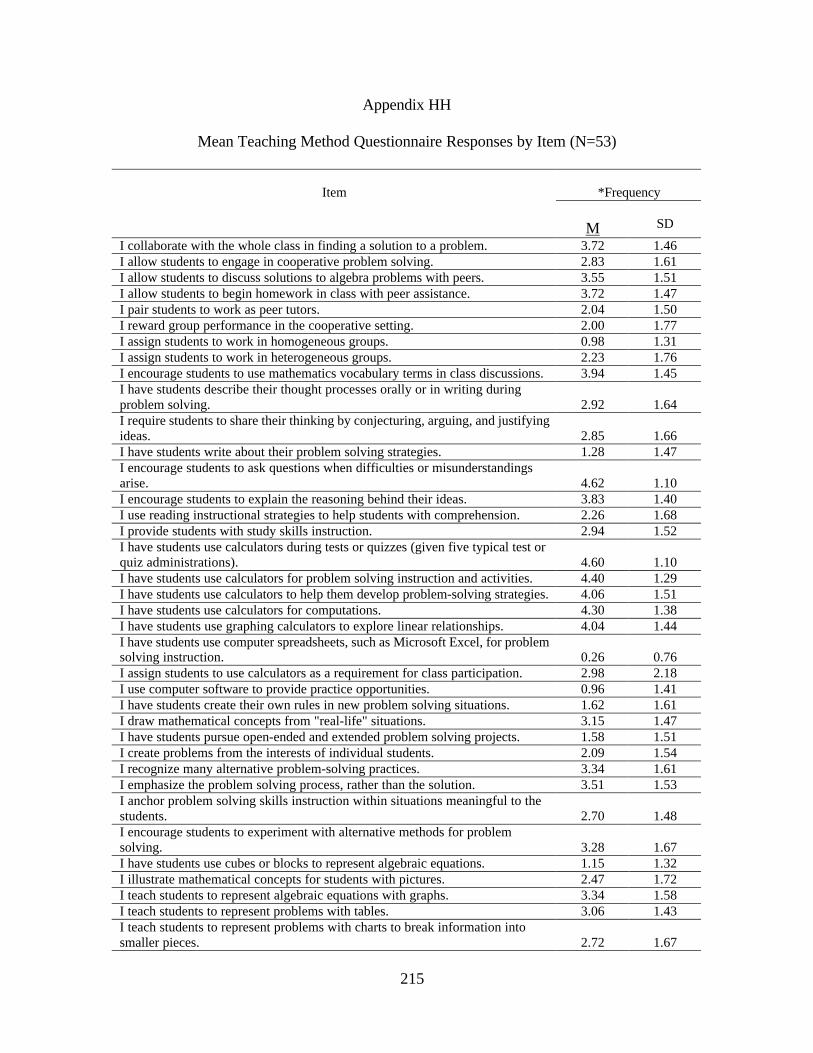
215
Appendix HH
Mean Teaching Method Questionnaire Responses by Item (N=53)
Item
*Frequency
M
SD
I collaborate with the whole class in finding a solution to a problem. 3.72 1.46 I allow students to engage in cooperative problem solving. 2.83 1.61 I allow students to discuss solutions to algebra problems with peers. 3.55 1.51 I allow students to begin homework in class with peer assistance. 3.72 1.47 I pair students to work as peer tutors. 2.04 1.50 I reward group performance in the cooperative setting. 2.00 1.77 I assign students to work in homogeneous groups. 0.98 1.31 I assign students to work in heterogeneous groups. 2.23 1.76 I encourage students to use mathematics vocabulary terms in class discussions. 3.94 1.45 I have students describe their thought processes orally or in writing during problem solving.
2.92
1.64
I require students to share their thinking by conjecturing, arguing, and justifying ideas.
2.85
1.66
I have students write about their problem solving strategies. 1.28 1.47 I encourage students to ask questions when difficulties or misunderstandings arise.
4.62
1.10
I encourage students to explain the reasoning behind their ideas. 3.83 1.40 I use reading instructional strategies to help students with comprehension. 2.26 1.68 I provide students with study skills instruction. 2.94 1.52 I have students use calculators during tests or quizzes (given five typical test or quiz administrations).
4.60
1.10
I have students use calculators for problem solving instruction and activities. 4.40 1.29 I have students use calculators to help them develop problem-solving strategies. 4.06 1.51 I have students use calculators for computations. 4.30 1.38 I have students use graphing calculators to explore linear relationships. 4.04 1.44 I have students use computer spreadsheets, such as Microsoft Excel, for problem solving instruction.
0.26
0.76
I assign students to use calculators as a requirement for class participation. 2.98 2.18 I use computer software to provide practice opportunities. 0.96 1.41 I have students create their own rules in new problem solving situations. 1.62 1.61 I draw mathematical concepts from "real-life" situations. 3.15 1.47 I have students pursue open-ended and extended problem solving projects. 1.58 1.51 I create problems from the interests of individual students. 2.09 1.54 I recognize many alternative problem-solving practices. 3.34 1.61 I emphasize the problem solving process, rather than the solution. 3.51 1.53 I anchor problem solving skills instruction within situations meaningful to the students.
2.70
1.48
I encourage students to experiment with alternative methods for problem solving.
3.28
1.67
I have students use cubes or blocks to represent algebraic equations. 1.15 1.32 I illustrate mathematical concepts for students with pictures. 2.47 1.72 I teach students to represent algebraic equations with graphs. 3.34 1.58 I teach students to represent problems with tables. 3.06 1.43 I teach students to represent problems with charts to break information into smaller pieces.
2.72
1.67
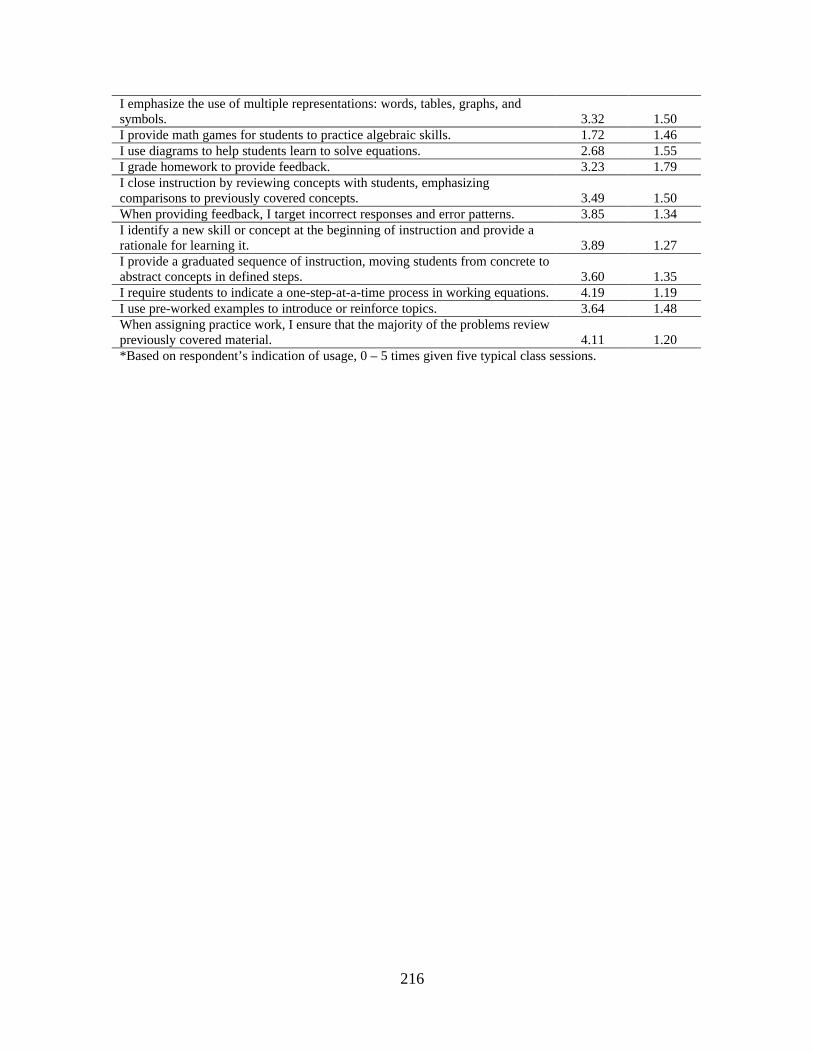
216
I emphasize the use of multiple representations: words, tables, graphs, and symbols.
3.32
1.50
I provide math games for students to practice algebraic skills. 1.72 1.46 I use diagrams to help students learn to solve equations. 2.68 1.55 I grade homework to provide feedback. 3.23 1.79 I close instruction by reviewing concepts with students, emphasizing comparisons to previously covered concepts.
3.49
1.50
When providing feedback, I target incorrect responses and error patterns. 3.85 1.34 I identify a new skill or concept at the beginning of instruction and provide a rationale for learning it.
3.89
1.27
I provide a graduated sequence of instruction, moving students from concrete to abstract concepts in defined steps.
3.60
1.35
I require students to indicate a one-step-at-a-time process in working equations. 4.19 1.19 I use pre-worked examples to introduce or reinforce topics. 3.64 1.48 When assigning practice work, I ensure that the majority of the problems review previously covered material.
4.11
1.20
*Based on respondent’s indication of usage, 0 – 5 times given five typical class sessions.
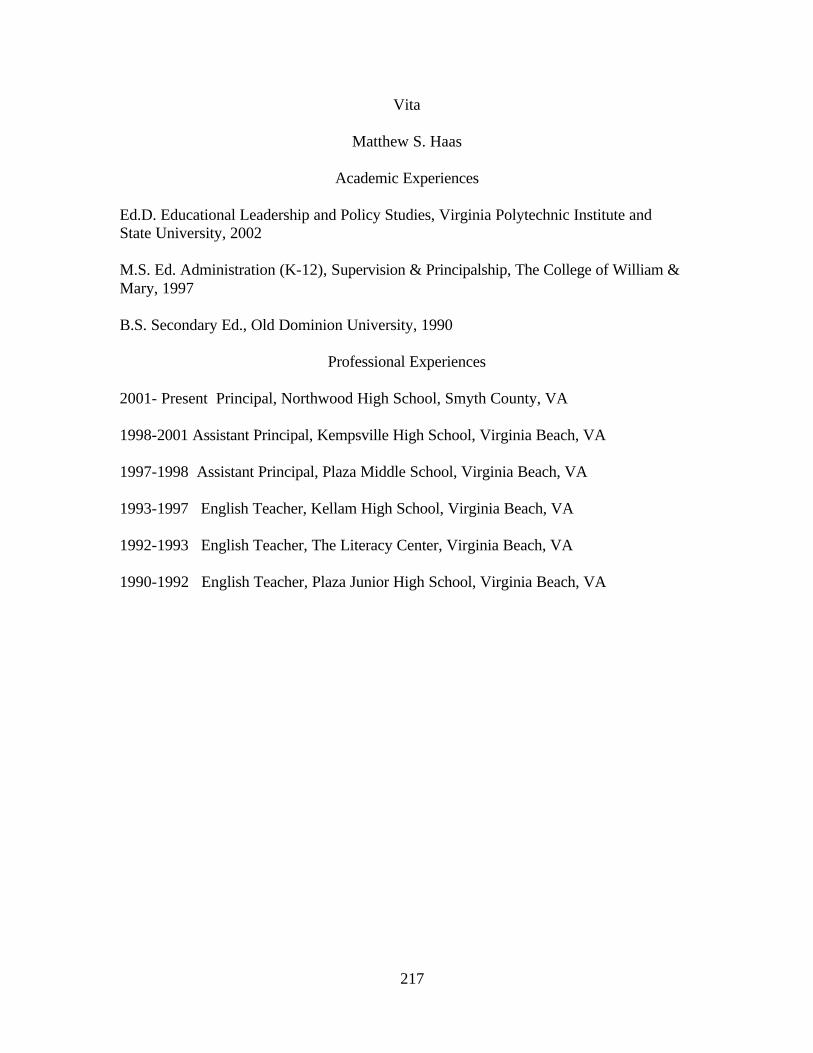
217
Vita
Matthew S. Haas
Academic Experiences
Ed.D. Educational Leadership and Policy Studies, Virginia Polytechnic Institute and State University, 2002
M.S. Ed. Administration (K-12), Supervision & Principalship, The College of William & Mary, 1997 B.S. Secondary Ed., Old Dominion University, 1990
Professional Experiences 2001- Present Principal, Northwood High School, Smyth County, VA 1998-2001 Assistant Principal, Kempsville High School, Virginia Beach, VA
1997-1998 Assistant Principal, Plaza Middle School, Virginia Beach, VA
1993-1997 English Teacher, Kellam High School, Virginia Beach, VA 1992-1993 English Teacher, The Literacy Center, Virginia Beach, VA 1990-1992 English Teacher, Plaza Junior High School, Virginia Beach, VA