View Article Online / Journal Homepage / Table of Contents...
8
Trends in isothermal microcalorimetry 1 : : ,l,e ‘d) ._ . - - _ _ - - -. _ _ A Ingemar Wadso Thermochemistry, Chemical Center, Lund University,PO Box 124, S-22 I00 Lund, Sweden Isothermal microcalorimeters are of increasing importance in thermodynamics and as general ‘process monitors’. Recent developments in instrumentation and in experi- mental methods have been significant and several easy-to- use instruments are now commercially available. Important application areas include investigations of solute-solvent interactions and ligand binding processes, sorption pro- cesses, living cellular systems and the assessment of stabil- ities of technical products. The combination of isothermal calorimetry with different specific analytical techniques seems to be particularly promising. 1 Introduction All calorimeters are thermodynamic instruments but some are also used in kinetics or as analytical tools. Differential (temperature) scanning calorimetry (DSC) has for a long time been one of the most important techniques in thermal analysis and more recently ‘isothermal microcalorimeters’ are gaining an increasing importance as analytical instruments, in particular in some applied areas. The term ‘isothermal microcalorimeter’ is not well defined, but is now commonly used for calorimeters designed for work in the microwatt range conducted under (essentially) isothermal conditions. ‘Nanocalorimeters’, the name of which usually indicates a detection limit approaching one nanowatt, are here included in the group of ‘microcalorimeters’. Recent develop- ments in isothermal microcalorimetry have been substantial and several easy-to-use instruments are now commercially availa- ble. Some of them have the character of modular systems, which allow several general and specialised measurement functions. When complex processes are characterised by calorimetric measurements, for example in technical products or in living materials, it may not be possible to express the results in terms of thermodynamic or kinetic quantities referring to well-defined reaction steps. In such cases, isothermal microcalorimeters have found important but so far limited use as general ‘process monitors’. Ingemar Wadso is Professor Emeritus in Thermochemistry at the Chemical Center, Lund University, where he has spent most of his career. His thermochemical research has centred around in- strumental developments, and investigations of solute-water interactions and of living cel- lular systems. He has been ac- tive in IUPAC. He received the Arrhenius plaquette, I970 (Swedish Society for Chemists), The HufSman Memorial Award, I979 (Calorimetry Conference), The Award for Applied Chem- ical Thermodynamics, 1984 (Swiss Society for Thermal Anal- ysis) and the Lavoisier Medal, I990 (International Society for Biological Calorimetry).He was awarded the MD honoris causa by Lund University in 1992. This review will discuss some properties and current uses of isothermal microcalorimeters. A special focus will be on microcalorimeters used as process monitors in applied areas and on developments of instrument assemblies where specific analytical measurements are conducted in parallel with the calorimetric experiments. 2 Some measurement principles and design characteristics From the point of view of heat measurement principles it is common to divide calorimeters into three main groups: adiabatic, heat conduction and power compensation cal- orimeters. 2.1 Adiabatic calorimeters In an ideal adiabatic calorimeter there is no heat exchange between the calorimetric vessel and its surroundings. Adiabatic conditions are usually obtained by placing an ‘adiabatic shield’ between the vessel and the surroundings. During a measurement the temperature difference between the vessel and the shield is kept at zero. The heat quantity which is evolved or absorbed during an experiment with an ideal adiabatic calorimeter is equal to the product between the temperature change and the heat capacity of the calorimetric vessel, including its content. Semi-adiabatic calorimeters, often called isoperibol calorime- ters, are more commonly used than the (close to) ideal adiabatic instruments. When semi-adiabatic instruments are used in accurate measurements it is necessary to apply corrections for the heat exchange between the vessel and the surroundings. 2.2 Heat conduction calorimeters In a heat conduction calorimeter heat released (or absorbed) in the reaction vessel is allowed to flow to (or from) a surrounding heat sink, usually an aluminum block. Normally, a thermopile positioned between the sample container and the heat sink is used as a sensor for the heat flow. Its driving force, i.e. the temperature difference between the vessel and the heat sink, will give rise to an electrical potential, U, over the thermo- pile. Provided that the temperature is uniform in the vessel and in the heat sink, the thermal power (the rate of heat production) released in the vessel, is given by the Tian equation [eqn. (I)]: P = E (U + .tdU/dt) (1) where P = dq/dt is the thermal power, E is the calibration constant, IC the time constant of the instrument and dU/dt the time derivative of the thermopile potential. For a steady-state process eqn. (1) is reduced to eqn. (2). P=Eu (2) For any process the heat quantity released in the vessel is given by the potential time integral eqn. (3). q = EjUdt (3) (The initial and final thermopile potentials are assumed to be the same). Heat conduction microcalorimeters are usually equipped with semi-conducting thermopiles, often called ‘thermocouple Chemical Society Reviews, 1997 79 Downloaded on 30 December 2012 Published on 01 January 1997 on http://pubs.rsc.org | doi:10.1039/CS9972600079 View Article Online / Journal Homepage / Table of Contents for this issue
-
Upload
nguyentuong -
Category
Documents
-
view
217 -
download
0
Transcript of View Article Online / Journal Homepage / Table of Contents...
Trends in isothermal microcalorimetry
1:: ,l,e, ‘ d ) ._ . - - _ _ - - -. _ _ A
Ingemar Wadso Thermochemistry, Chemical Center, Lund University, PO Box 124, S-22 I00 Lund, Sweden
Isothermal microcalorimeters are of increasing importance in thermodynamics and as general ‘process monitors’. Recent developments in instrumentation and in experi- mental methods have been significant and several easy-to- use instruments are now commercially available. Important application areas include investigations of solute-solvent interactions and ligand binding processes, sorption pro- cesses, living cellular systems and the assessment of stabil- ities of technical products. The combination of isothermal calorimetry with different specific analytical techniques seems to be particularly promising.
1 Introduction All calorimeters are thermodynamic instruments but some are also used in kinetics or as analytical tools. Differential (temperature) scanning calorimetry (DSC) has for a long time been one of the most important techniques in thermal analysis and more recently ‘isothermal microcalorimeters’ are gaining an increasing importance as analytical instruments, in particular in some applied areas.
The term ‘isothermal microcalorimeter’ is not well defined, but is now commonly used for calorimeters designed for work in the microwatt range conducted under (essentially) isothermal conditions. ‘Nanocalorimeters’, the name of which usually indicates a detection limit approaching one nanowatt, are here included in the group of ‘microcalorimeters’. Recent develop- ments in isothermal microcalorimetry have been substantial and several easy-to-use instruments are now commercially availa- ble. Some of them have the character of modular systems, which allow several general and specialised measurement functions. When complex processes are characterised by calorimetric measurements, for example in technical products or in living materials, it may not be possible to express the results in terms of thermodynamic or kinetic quantities referring to well-defined reaction steps. In such cases, isothermal microcalorimeters have found important but so far limited use as general ‘process monitors’.
Ingemar Wadso is Professor Emeritus in Thermochemistry at the Chemical Center, Lund University, where he has spent most of his career. His thermochemical research has centred around in- strumental developments, and investigations of solute-water
interactions and of living cel- lular systems. He has been ac- tive in IUPAC. He received the Arrhenius plaquette, I970 (Swedish Society for Chemists), The HufSman Memorial Award, I979 (Calorimetry Conference), The Award for Applied Chem- ical Thermodynamics, 1984 (Swiss Society for Thermal Anal- ysis) and the Lavoisier Medal, I990 (International Society for Biological Calorimetry). He was awarded the M D honoris causa by Lund University in 1992.
This review will discuss some properties and current uses of isothermal microcalorimeters. A special focus will be on microcalorimeters used as process monitors in applied areas and on developments of instrument assemblies where specific analytical measurements are conducted in parallel with the calorimetric experiments.
2 Some measurement principles and design characteristics From the point of view of heat measurement principles it is common to divide calorimeters into three main groups: adiabatic, heat conduction and power compensation cal- orimeters.
2.1 Adiabatic calorimeters In an ideal adiabatic calorimeter there is no heat exchange between the calorimetric vessel and its surroundings. Adiabatic conditions are usually obtained by placing an ‘adiabatic shield’ between the vessel and the surroundings. During a measurement the temperature difference between the vessel and the shield is kept at zero. The heat quantity which is evolved or absorbed during an experiment with an ideal adiabatic calorimeter is equal to the product between the temperature change and the heat capacity of the calorimetric vessel, including its content. Semi-adiabatic calorimeters, often called isoperibol calorime- ters, are more commonly used than the (close to) ideal adiabatic instruments. When semi-adiabatic instruments are used in accurate measurements it is necessary to apply corrections for the heat exchange between the vessel and the surroundings.
2.2 Heat conduction calorimeters In a heat conduction calorimeter heat released (or absorbed) in the reaction vessel is allowed to flow to (or from) a surrounding heat sink, usually an aluminum block. Normally, a thermopile positioned between the sample container and the heat sink is used as a sensor for the heat flow. Its driving force, i .e. the temperature difference between the vessel and the heat sink, will give rise to an electrical potential, U , over the thermo- pile.
Provided that the temperature is uniform in the vessel and in the heat sink, the thermal power (the rate of heat production) released in the vessel, is given by the Tian equation [eqn. (I)]:
P = E (U + .tdU/dt) (1) where P = dq/dt is the thermal power, E is the calibration constant, IC the time constant of the instrument and dU/dt the time derivative of the thermopile potential. For a steady-state process eqn. (1) is reduced to eqn. (2).
P = E u (2) For any process the heat quantity released in the vessel is given by the potential time integral eqn. (3).
q = EjUdt (3) (The initial and final thermopile potentials are assumed to be the same).
Heat conduction microcalorimeters are usually equipped with semi-conducting thermopiles, often called ‘thermocouple
Chemical Society Reviews, 1997 79
Dow
nloa
ded
on 3
0 D
ecem
ber
2012
Publ
ishe
d on
01
Janu
ary
1997
on
http
://pu
bs.r
sc.o
rg |
doi:1
0.10
39/C
S997
2600
079
View Article Online / Journal Homepage / Table of Contents for this issue
plates' or 'Peltier effect plates' as sensors for the heat flow. They have a relatively large thermal conductance and the temperature difference between the microcalorimetric vessel and the heat sink is small, typically in the order of one mK.1 Such instruments can therefore normally be considered as isothermal calorimeters.
For processes which are slow on a timescale given by the time constant (typically, the order of a few minutes) the simple eqn. (2) may describe the rate of heat evolution, and thus the kinetics of the process, with an adequate precision. However, in order to obtain accurate rate values for fast processes it is necessary to apply Tian's eqn. (l), or one of its more advanced forms.' With modern commercial microcalorimeters such 'dynamic correc- tions' can be made automatically. However, reported in literature it is common to find thermal power-time curves derived using the simple eqn. (2), in cases where the time constant term in eqn. (1) is clearly significant. For more detailed discussions of properties of heat conduction microcalorimeters, see ref. 1 and 3.
Most isothermal microcalorimeters in current use are of the heat conduction type, for example the microcalorimetric systems marketed by CSC (earlier Hart Scientific) (USA), Setaram (France) and Thermometric (Sweden). In contrast, Microcal's (USA) titration microcalorimeter uses the same principle as an adiabatic shield DSC. The temperature is allowed to increase, very slowly, during an experiment and the heat evolution from a reaction is balanced by a corresponding change in the heating rate (power compensation, see below).
2.3 Power compensation calorimeters In a power compensation calorimeter the thermal power from an exothermic process is balanced by a cooling power, in microcalorimetry normally by use of Peltier effect cooling. For endothermic processes, compensation can be achieved by reversing the Peltier effect current or by use of an electrical heater.
2.4 Some design features Isothermal inicrocalorimeters form a heterogenous group of instruments and many different designs have been described. Regardless of the calorimetric principle used, most microcal- orimeters are designed as twin or differential instruments. The 'reaction vessel', which is used for the investigated process, and the 'reference vessel', which is charged with an inert material, should preferably be nearly identical, in particular with respect to heat capacity and thermal conductance. In some cases microcalorimetric reaction vessels are taken out from the calorimeter at cleaning and charging operations ('insertion vessels'), alternatively vessels are permanently mounted in the heat sensitive zone of the calorimeter.
Measurements can be conducted as batch experiments, with or without agitation (stirring) of the content, or as continuous or stopped flow experiments. Ongoing processes, for example in living materials, and slow degradation and relaxation processes in materials and products of technical importance are often measured using simple sealed ampoules as reaction vessels. Injection techniques are usually employed when liquid or gaseous reactants are used to initiate a batch process. Such methods are particularly well suited to automation, for example in titration experiments. Several microcalorimetric designs have been reported where processes are initiated by bringing reagents together in a flow mixing vessel or in a stirred perfusion vessel. The mixing of a reagent with a heterogenous system ( e . g . a suspension of solid particles, which tend to sediment) can be difficult to achieve without causing large heat effects. In such cases rotating or rocking calorimeters using bi-compartment vessels can be the best choice. Electrodes and other analytical sensors can be positioned in the reaction vessels and light can be introduced by use of light guides. Designs and properties of different kinds of isothermal microcalorimeters have been reviewed.24
2.5 Direct and indirect determination of enthalpy changes Recent developments in isothermal microcalorimetry have opened several areas for direct calorimetric measurements where earlier indirect methods had to be used. Enthalpy values for well defined chemical processes can be derived from values for equlibrium constants determined as function of temperature ['van't Hoff enthalpies', Table 1, eqn. (4)]. However, such
Table 1 Some basic thermodynamic relationships
d In K AHo
dT RT2 - (van't Hoff equation) (4) - --
AG" = -RT 1nK (5)
(6 )
AC," = dAH"/dT (7)
(8)
AsolvH = AsolH - AvapHo (9)
(10)
AG" = AH" - TAS"
AtransHm = AsolHm(2) - A s o ~ H ~ ( l )
Cp,2m = AsolCpm + Cp*
Symbols: R = the gas constant (8.314 J K-1 mol-1). K = equilibrium constant. T = temperature (in kelvin). AGO, AH", AS" and AC," = standard changes in Gibbs energy, enthalpy, entropy and heat capacity, respectively. Cp,2m = partial molar heat capacity at infinite dilution. C,* = heat capacity for a pure compound. Subscripts: p, trans, sol, solv, vap = constant pressure, transfer, (dis)solu- tion solvation and vaporization, respectively.
values usually have a low accuracy and changes in heat capacity, AC,", derived from van't Hoff enthalpies are in most cases only marginally useful.5 Table 2 gives a summary of expected statistical uncertainties for AH " and AC," values derived from equilibrium constants of different precision determined over different temperature ranges. It is seen that in order to obtain precise values for AH", and in particular for AC," very high precision is required in determination of equilibrium constants. Further, many determinations over a wide temperature range must be made-conditions which are rarely met for van? Hoff values reported in literature.
Table 2 Propagation of errors in log K in calculation of van? Hoff AHo and AC," values at 25 "C for a 1 : 1 binding reaction (5SD). From King6
f SD in f SD in 5 SD in Experimental AHo/ AC,"I log K temperaturesPC kJ mol-1 J K-1 mol-1
0.02 20, 22, 24, 26, 4 2800
0.001 5, 10, 15, 20, 0.04 6 28,30
25, 30, 35, 40, 45,50
Energy-material balances of living systems are often esti- mated by 'indirect calorimetry',7 meaning that values for heat production are derived from analytical values for substances consumed and produced during metabolism (usually only the respiratory gases). Microcalorimetric techniques are now available by which thermal power values can be determined accurately for small samples of living cells and tissues,*J under well defined physiological conditions.
2.6 Process monitoring The very broad application range for non-specific methods like calorimetry can be attractive both in thermodynamic measure- ments and in analytical work. As practically all processes are
80 Chemical Society Reviews, 1997
Dow
nloa
ded
on 3
0 D
ecem
ber
2012
Publ
ishe
d on
01
Janu
ary
1997
on
http
://pu
bs.r
sc.o
rg |
doi:1
0.10
39/C
S997
2600
079
View Article Online
accompanied by heat effects, calorimetry is particularly well suited to the discovery of unexpected or unknown processes in samples of any aggregation state. Further, in contrast to spectroscopic methods, calorimetry does not require optically clear objects. In particular when heat conduction calorimeters are used, the experiments can be conducted over long periods of time-weeks or longer. These properties can make isothermal microcalorimeters ideal as monitors for slow and complex processes, not the least for solids where chemical and physical processes can be difficult to record continously without interfering with the processes. However, the lack of specificity in heat measurements will also lead to serious limitations for such methods, cf Section 5.
It is important to keep in mind that a calorimetric experiment will lead to thermodynamic data, even if the instrument is employed only for analytical purposes. Derived thermodynamic values can sometimes be compared with values estimated from results of chemical analyses combined with thermodynamic data from compilations. It is therefore often important also to be concerned about the accuracy of the calorimetric results, when the instrument is used as a 'process monitor'
3 Important applications Isothermal microcalorimetry is used in a wide range of applications and a comprehensive review cannot be given here. In this section some comments are made on current activities in a few important areas.
3.1 Ligand binding and aggregation processes in solution One of the main applications for isothermal microcalorimetry is the investigation of non-covalent binding processes by means of titration techniques, sometimes referred to as ITC (isothermal titration calorimetry). In such experiments the titrant solution is normally injected stepwise into a stirred reaction vessel, volume typically ca. 1 ml.
The interpretation of calorimetric titration experiments is based on the assumption that the heat quantities accompanying the injections, corrected for dilution effects, are proportional to the amount of titrant reacted. If the concentration equilibrium constant, K,, is very high (for example, K , > 1 X lo8 for a 1 : 1 binding reaction) there will be nearly zero concentration of free titrant following each injection step, until the equivalence point has been reached. Such experiments will lead to information about the stoichiometry of the process and will lead to a value for the molar enthalpy change, but K , values cannot be derived. For processes with moderately high K , values a significant fraction of the titrant will not be consumed and this fraction will increase as the injections continue. The fractions of nonreacted titrant depend on the equilibrium constant for the process and a certain binding model must be predicted in order to derive values for AH" and K,. Results of the calorimetric measure- ments are fit to the assumed binding model using K, and AH" as fitting parameters5 Commercial titration microcalorimeters are now delivered with computer programs for such fitting procedures.
For a correct binding model small and random least-squares residuals are obtained as a result of the minimization calcula- tion. Such results will support, but will not prove the correctness of a certain model or combination of models. In particular for processes which appear to be more complex than a 1 : 1 binding reaction it is desirable that the stoichiometry is also supported by results of specific chemical analyses. Values for the standard Gibbs energy, AG ", and corresponding entropy change, AS O, are calculated from eqns. (5) and (6), respectively. From experiments conducted at different temperatures a value for the heat capacity change, AC,", can be derived, eqn. (7).
When a 1 : 1 complex is too strong to allow the determination of K, it is sometimes possible to employ a 'displacement' titration technique in which the binding reaction is divided into
two steps, where each has a K , value which is sufficiently small to be e~aluated.~
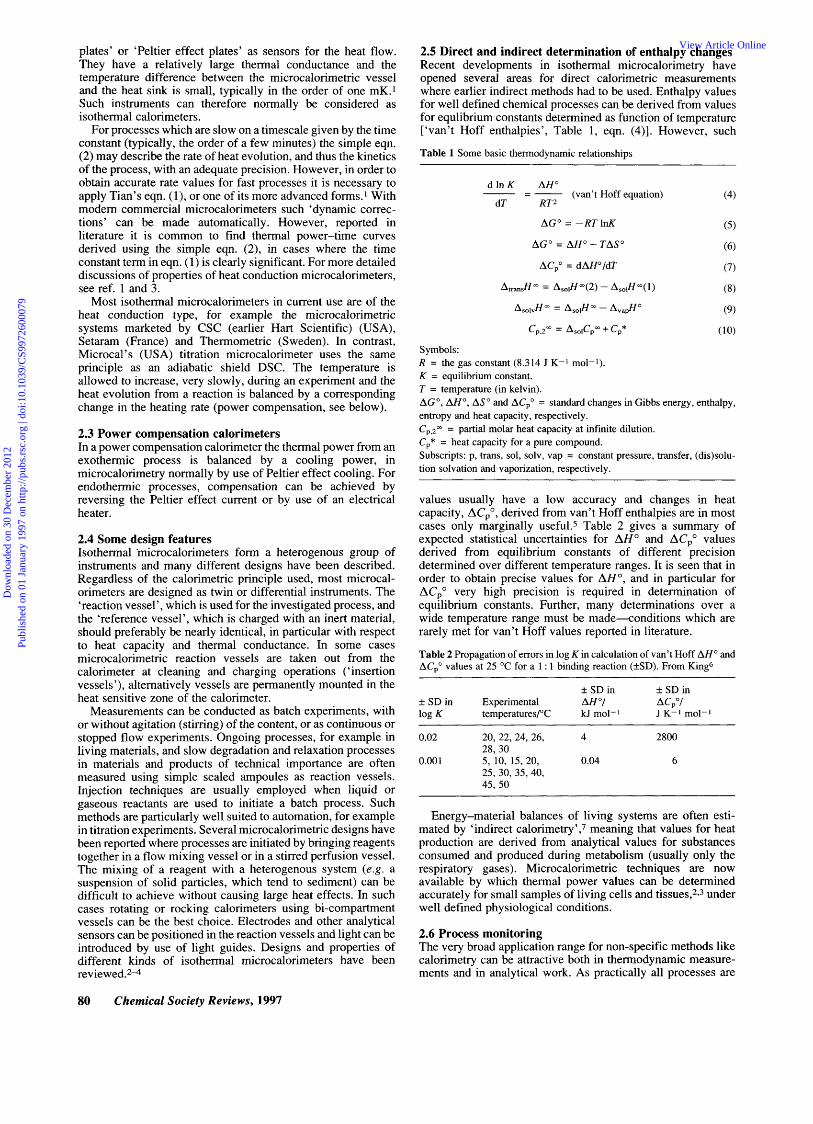
The time constant for a heat conduction calorimeter is larger than for comparable adiabatic and power compensation calo- rimeters, often 2-3 min when 1 ml vessels are used.' It will then take ca. 25 min until the heat released in a fast reaction has been conducted to the heat sink and the measurement time for a binding experiment with 15 titration steps will thus be > 6 h. However, 'dynamic correction' techniques1 can decrease the time required for a titration experiment to the same level as found with adiabatic and power compensation instruments, without any loss of accuracy. As an example, Fig. 1 shows a record from a protein ligand binding experiment conducted with a heat conduction microcalorimeter used with a dynamic correction technique.
15 30 45 t / min
Fig. 1 Stepwise titration of ribonuclease A (ca. 60 pmol) by 2'-cytidine mo- nophosphate using a heat conduction titration microcalorimeter (stainless steel reaction vessel, volume 2 ml, T = 210 s). A 'dynamic correction' technique was employed and the time between injections was reduced to 4 min. Two curves are shown: the one with low and rounded peaks is the experimental curve, the curve with sharp peaks is the corrected curve. (Courtesy of Thermometric AB).
Specific binding reactions between biopolymers and low molecular mass compounds are now investigated in many laboratories by use of titration microcalorimetry. Other equilib- rium reactions studied include aggregation between bio- polymers and interactions between proteins and membrane receptors. In the pharmaceutical industry the binding of drugs and related compounds to biopolymers is currently developing as an important part of techniques used in 'rational drug design'.* Specific binding processes involving macrocyclic compounds, in particular cyclodextrins,5 have been much studied. Investigations of micelle formation by detergents, phospholipids and other amphiphilic molecules is another field where titration microcalorimetry is frequently used. These latter experiments are normally conducted by stepwise injection of amphiphile solutions, at concentrations higher than their critical micelle concentration (cmc), to the reaction vessel which is initially charged with pure solvent.9 The heat quantities measured will thus refer to the deaggregation process until the solute in the reaction vessel has reached a concentration above its cmc. Values for cmc and (after correction for dilution effects) the enthalpy of micelle formation can thus be obtained. Similarly, the thermodynamic properties at pairwise inter- actions can also be derived.I0
3.2 Dissolution and mixing processes Results from calorimetric measurements of enthalpy of dissolu- tion of pure substances (gases, liquids and solids) are essential for our understanding of the thermodynamics of processes in solution.3.11 For aqueous solution systems, in particular, values for their temperature derivatives, i.e. corresponding heat capacity values, are of major importance.
Detailed studies of solute-solvent interactions can be made by determination of enthalpies of dissolution, AsolH, preferably
Chemical Society Reviews, 1997 81
Dow
nloa
ded
on 3
0 D
ecem
ber
2012
Publ
ishe
d on
01
Janu
ary
1997
on
http
://pu
bs.r
sc.o
rg |
doi:1
0.10
39/C
S997
2600
079
View Article Online
at different temperatures leading to corresponding heat capacity values. In microcalorimetric dissolution experiments the con- centration of the solutes are often low enough to regard the solutions as infinitely dilute. The difference between dissolu- tion enthalpies for a compound in different solvents will give the enthalpy of transfer for the compound between the solvents, eqn. (8). Similarly, the difference between AsolHm and the enthalpy of vapourization A,,&O (the ideal gas phase value), will give the enthalpy change for the transfer of the compound between gas phase and the solution, often called the enthalpy of solvation, AsolvH m , eqn. (9).
The functions A,,,,H and AsolvH and corresponding ACPm values reflect changes in solute-solvent interactions, which are free from contributions from interactions between the solute molecules in solution or in their pure form. The same applies to the partial molar heat capacity of solutes at infinite dilution, Cp,2=, which can be derived from eqn. (10).
Development work in dissolution microcalorimetry3~~ * has resulted in several instruments for dissolution of slightly and easily soluble compounds (gases, liquids and solids) into water and other solvents. Results have been reported for many slightly soluble compounds in water, for example, the rare gases, low molecular mass gaseous and liquid hydrocarbons, several other liquid hydrophobic molecules and a few slightly soluble solid compounds. The development of microcalorimetric dissolution techniques has been important, in particular for investigations of biochemical model systems and the hydrophobic effect. However, at present there is little fundamental work conducted in the field of dissolution microcalorimetry, presumably due to the lack of commercial instruments.
In addition to its use in studies of solute-solvent interactions, it is likely that dissolution microcalorimetry will become important for the characterization of the state of solids and liquids. For example, dissolution microcalorimetry has been used to characterize solid materials with respect to different polymorphic forms,12 an area very important to the phar- maceutical industry.
Enthalpies of mixing of organic liquids, of theoretical and practical importance, are often determined by use of flow microcalorimeters~~4 thus avoiding a gas phase in the calorime- tric vessel, which may cause evaporation or condensation effects. In addition, flow calorimetric measurements can easily be automated.
3.3 Sorption processes Enthalpy measurements of sorption (adsorption or absorption) of solutes on small solid particles and on fibres can often be conducted using titration microcalorimeters. The solid material is then (more or less) suspended in the liquid and can be titrated by the solution. For larger pieces of solid material it may be appropriate to use, for example, a rotating sample holder to bring the material into intimate contact with the solution. One area of current practical importance in this field is the thermodynamic characterization of the binding of amphiphile molecules (detergents) to mineral particles, in connection with oil recovery techniquies.
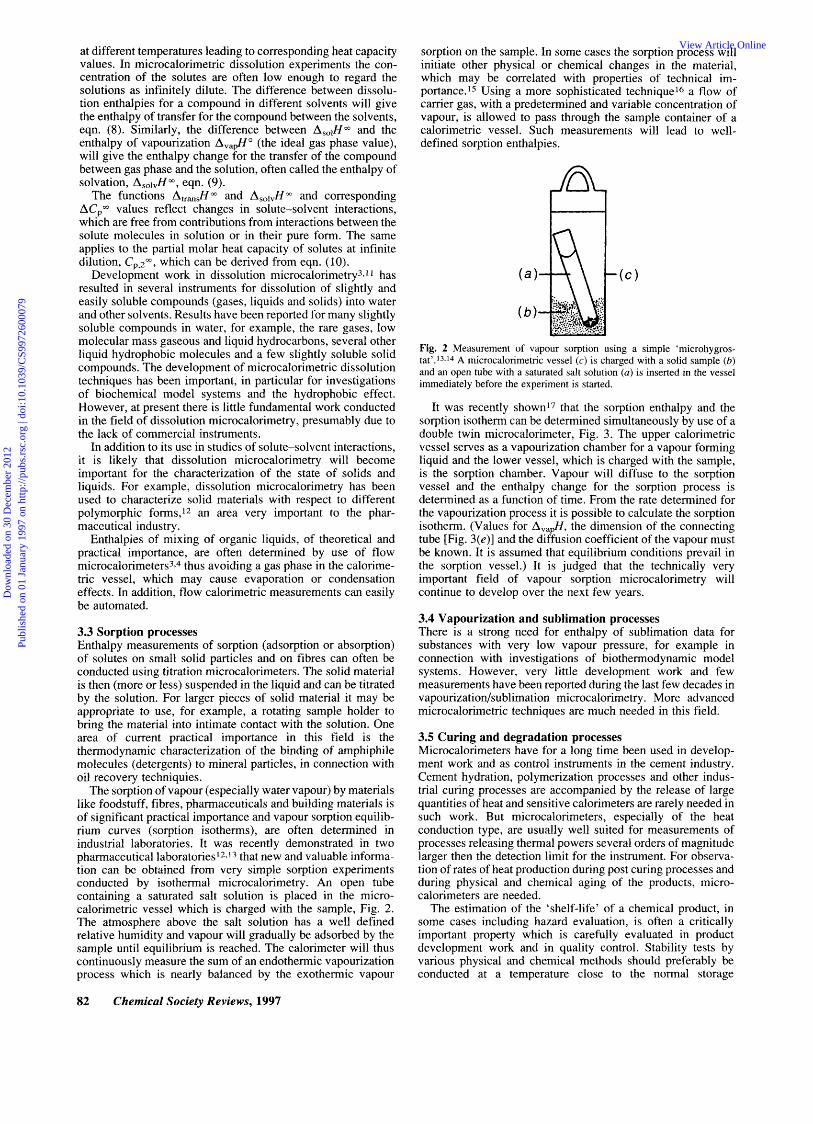
The sorption of vapour (especially water vapour) by materials like foodstuff, fibres, pharmaceuticals and building materials is of significant practical importance and vapour sorption equilib- rium curves (sorption isotherms), are often determined in industrial laboratories. It was recently demonstrated in two pharmaceutical laboratories1*,13 that new and valuable informa- tion can be obtained from very simple sorption experiments conducted by isothermal microcalorimetry. An open tube containing a saturated salt solution is placed in the micro- calorimetric vessel which is charged with the sample, Fig. 2. The atmosphere above the salt solution has a well defined relative humidity and vapour will gradually be adsorbed by the sample until equilibrium is reached. The calorimeter will thus continuously measure the sum of an endothermic vapourization process which is nearly balanced by the exothermic vapour
sorption on the sample. In some cases the sorption process will initiate other physical or chemical changes in the material, which may be correlated with properties of technical im- portance.15 Using a more sophisticated technique16 a flow of carrier gas, with a predetermined and variable concentration of vapour, is allowed to pass through the sample container of a calorimetric vessel. Such measurements will lead to well- defined sorption enthalpies.
Fig. 2 Measurement of vapour sorption using a simple ‘microhygros- tat’.’3J4 A microcalorimetric vessel (c ) is charged with a solid sample (b) and an open tube with a saturated salt solution (a) is inserted in the vessel immediately before the experiment is started.
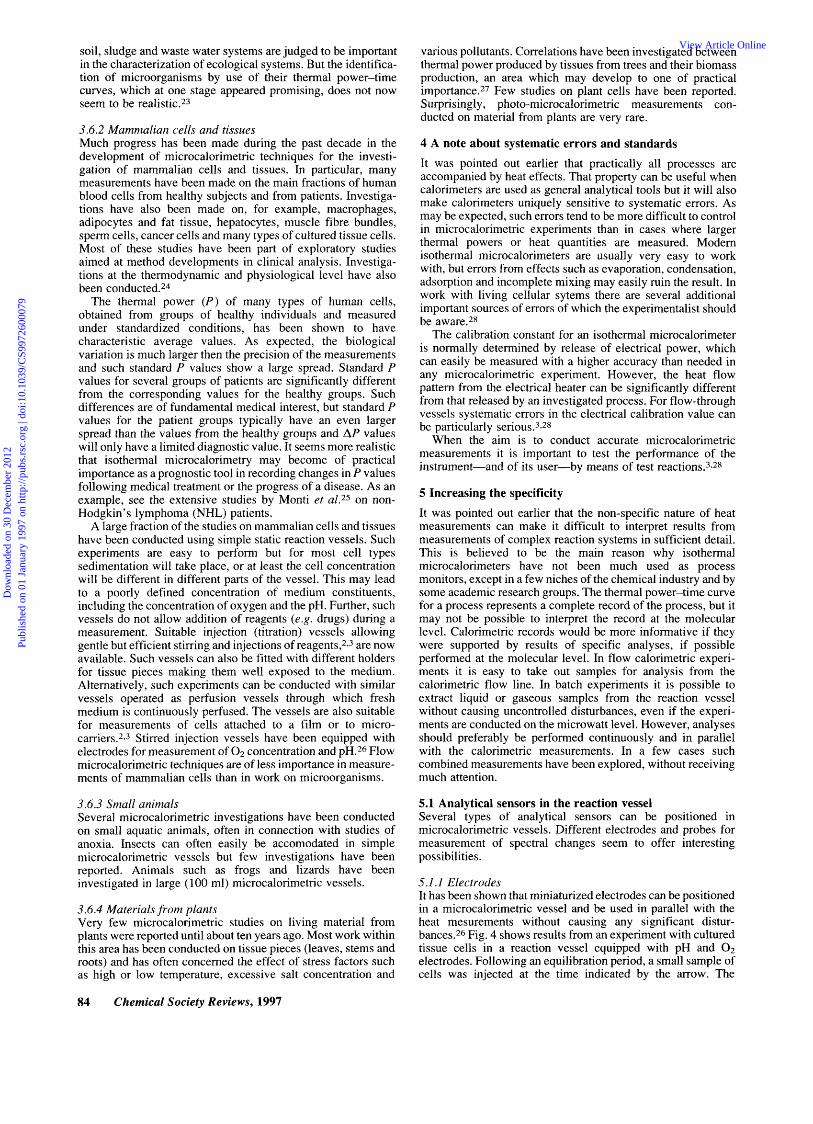
It was recently shownl7 that the sorption enthalpy and the sorption isotherm can be determined simultaneously by use of a double twin microcalorimeter, Fig. 3. The upper calorimetric vessel serves as a vapourization chamber for a vapour forming liquid and the lower vessel, which is charged with the sample, is the sorption chamber. Vapour will diffuse to the sorption vessel and the enthalpy change for the sorption process is determined as a function of time. From the rate determined for the vapourization process it is possible to calculate the sorption isothenn. (Values for A,,&, the dimension of the connecting tube [Fig. 3(e)] and the diffusion coefficient of the vapour must be known. It is assumed that equilibrium conditions prevail in the sorption vessel.) It is judged that the technically very important field of vapour sorption microcalorimetry will continue to develop over the next few years.
3.4 Vapourization and sublimation processes There is a strong need for enthalpy of sublimation data for substances with very low vapour pressure, for example in connection with investigations of biothermodynamic model systems. However, very little development work and few measurements have been reported during the last few decades in vapourization/sublimation microcalorimetry. More advanced microcalorimetric techniques are much needed in this field.
3.5 Curing and degradation processes Microcalorimeters have for a long time been used in develop- ment work and as control instruments in the cement industry. Cement hydration, polymerization processes and other indus- trial curing processes are accompanied by the release of large quantities of heat and sensitive calorimeters are rarely needed in such work. But microcalorimeters, especially of the heat conduction type, are usually well suited for measurements of processes releasing thermal powers several orders of magnitude larger then the detection limit for the instrument. For observa- tion of rates of heat production during post curing processes and during physical and chemical aging of the products, micro- calorimeters are needed.
The estimation of the ‘shelf-life’ of a chemical product, in some cases including hazard evaluation, is often a critically important property which is carefully evaluated in product development work and in quality control. Stability tests by various physical and chemical methods should preferably be conducted at a temperature close to the normal storage
82 Chemical Society Reviews, 1997
Dow
nloa
ded
on 3
0 D
ecem
ber
2012
Publ
ishe
d on
01
Janu
ary
1997
on
http
://pu
bs.r
sc.o
rg |
doi:1
0.10
39/C
S997
2600
079
View Article Online

Fig. 3 Simplified picture of a vapourization-sorption microcalorimeter for simultaneous determination of sorption isotherms and enthalpy of sorp- tion.17 (a) Vapour forming liquid, (b) solid sample, (c) vapourization chamber, (d) thermopile, ( e ) connection tube, (f> sorption chamber.
temperature, but such assessments will usually require very long observation periods-months or years. It is therefore common to perform accelerated tests by performing the measurements at different elevated temperatures, for example at 150-200 OC, and estimate a value for the rate of degradation at the storage temperature by use of Arrhenius' relationship. Such accelerated tests are useful but may lead to erroneous conclu- sions as the nature of a complex degradation process can change significantly over a large temperature range.
With respect to thermally induced run-away reactions, calorimetry is obviously the most fundamental measurement method. However, in some branches of the chemical industry isothermal microcalorimetry is also used more generally in the study and control of slow degradation processes, including those caused by incompatibility between different materials. Measurements are then conducted directly at the storage temperature of the products or at slightly increased tem- peratures, for example at 40-70 OC, from which reasonably safe extrapolations can be made to ambient temperatures.
Several microcalorimeters primarily designed for kinetic investigations of relatively fast processes (halflife < 1 s) have been reported, but they have not reached any wider use. Calorimeters are inherently more suitable for accurate kinetic investigations of slow processes, for example many curing and degradation processes. Willson et a1.18 have developed a method which permits a direct analysis of calorimetric results in terms of reaction order, rate constant and enthalpy of reaction, with no prior assumptions concerning reaction mechanism etc. In case the reaction mechanism changes during the course of the experiment, parameters for each contributing process can be evaluated.
The amount of heat evolved from a chemical process depends on the (specific or molar) enthalpy change, which will lead to very different detection limits for different processes. For example, oxidation of organic material might be accompanied by a heat evolution of 600 kJ mol-l of 0 2 whereas enthalpy changes for an ester hydrolysis are often close to zero. Table 3 shows the limits of detectability estimated for an isothermal microcalorimeter of the heat conduction type used in measure- ments of some hypothetical degradation processes. The detec- tion limit for the instrument is taken as 0.1 pW, which may not seem as an impressive value by today's standards. However, the
useful detection limit in this type of experiment normally depends on the value of the irreproducibility of the instrument baseline (zero thermal power), which is determined in separate experiments where the reaction vessel is chargedhecharged with an inert material. The variability in that value is typically significantly larger than, for example, the detection limit for deviations of the thermopile signal during a baseline experi- ment. It is values of this latter kind which are normally reported in papers describing properties of microcalorimeters and in printed materials from manufacturers.
Table 3 Limits of detectability in the study of some hypothetical decomposition processes using a heat conduction microcalorimeter. The instrument detection limit is assumed to be 0.1 pW and the amount of sample 3 g
Detection limit, expressed as %
Molecular mass AH/ decomposition of substance kJ mol-' per year
100
10 000
~~
10 1 50 0.2
500 0.02 10 100 50 20
500 2
Many isothermal microcalorimeters presently employed in industrial laboratories are used for stability measurements, mainly in the explosives industry, at military arsenals and in the pharmaceutical industry. Compatibility experiments are im- portant and are easy to perform. Two components of a product are brought into contact and the thermal power-time curve for the mixed material is measured. The result is compared with the theoretical curve (perfect compatibility) constructed from results of separate measurements of the two components.
3.6 Living materials A large part of the method work conducted in isothermal microcalorimetry has been concerned with instruments and working procedures for measurements of living cellular sys- tems. Much of that work has been directed towards use in applied areas: clinical analysis, pharmacology, ecology, bio- technology and agriculture. Results of many 'demonstration experiments' and of some fundamental investigations in cell physiology have been reported but, so far, no application area of real practical importance has been established. 19 Isothermal microcalorimetry is currently used in the study of micro- organisms, human and animal cellular systems, small animals and on material from plants; representative examples of reviews and reports from work in these areas have been published in Special Issues of Thermochim. Acta.2s22
3.6.1 Microorganisms In calorimetric experiments conducted on microbial systems it is common that comparatively large thermal powers are released and the detectability limit of the instruments is rarely a problem. A more important problem is often that cultures may turn anoxic due to limitations in the supply of oxygen.',* Flow calorimetric techniques are often used. The suspension of microorganisms can then be pumped from a conventional fermenter where the properties of the culture are accurately controlled. Yeast cells are heavy which will often cause problems as they may sediment in calorimetric vessels and in flow lines.
Microcalorimetric investigations on microbial systems have been conducted at the fundamental level and in several applied areas. For example, the effect of drugs has been studied extensively, in order to explore the possible practical use of the technique in areas such as clinical analysis and pharmacology. The results of method investigations on microbial systems in
Chemical Society Reviews, 1997 83
Dow
nloa
ded
on 3
0 D
ecem
ber
2012
Publ
ishe
d on
01
Janu
ary
1997
on
http
://pu
bs.r
sc.o
rg |
doi:1
0.10
39/C
S997
2600
079
View Article Online
soil, sludge and waste water systems are judged to be important in the characterization of ecological systems. But the identifica- tion of microorganisms by use of their thermal power-time curves, which at one stage appeared promising, does not now seem to be reali~tic.~3
3.6.2 Mammalian cells and tissues Much progress has been made during the past decade in the development of microcalorimetric techniques for the investi- gation of mammalian cells and tissues. In particular, many measurements have been made on the main fractions of human blood cells from healthy subjects and from patients. Investiga- tions have also been made on, for example, macrophages, adipocytes and fat tissue, hepatocytes, muscle fibre bundles, sperm cells, cancer cells and many types of cultured tissue cells. Most of these studies have been part of exploratory studies aimed at method developments in clinical analysis. Investiga- tions at the thermodynamic and physiological level have also been conducted.24
The thermal power ( P ) of many types of human cells, obtained from groups of healthy individuals and measured under standardized conditions, has been shown to have characteristic average values. As expected, the biological variation is much larger then the precision of the measurements and such standard P values show a large spread. Standard P values for several groups of patients are significantly different from the corresponding values for the healthy groups. Such differences are of fundamental medical interest, but standard P values for the patient groups typically have an even larger spread than the values from the healthy groups and AP values will only have a limited diagnostic value. It seems more realistic that isothermal microcalorimetry may become of practical importance as a prognostic tool in recording changes in P values following medical treatment or the progress of a disease. As an example, see the extensive studies by Monti et al.25 on non- Hodgkin’s lymphoma (NHL) patients.
A large fraction of the studies on mammalian cells and tissues have been conducted using simple static reaction vessels. Such experiments are easy to perform but for most cell types sedimentation will take place, or at least the cell concentration will be different in different parts of the vessel. This may lead to a poorly defined concentration of medium constituents, including the concentration of oxygen and the pH. Further, such vessels do not allow addition of reagents (e.g. drugs) during a measurement. Suitable injection (titration) vessels allowing gentle but efficient stirring and injections of reagents,2J are now available. Such vessels can also be fitted with different holders for tissue pieces making them well exposed to the medium. Alternatively, such experiments can be conducted with similar vessels operated as perfusion vessels through which fresh medium is continuously perfused. The vessels are also suitable for measurements of cells attached to a film or to micro- carriers.2.3 Stirred injection vessels have been equipped with electrodes for measurement of 0 2 concentration and pH.26 Flow microcalorimetric techniques are of less importance in measure- ments of mammalian cells than in work on microorganisms.
3.6.3 Small animals Several microcalorimetric investigations have been conducted on small aquatic animals, often in connection with studies of anoxia. Insects can often easily be accomodated in simple microcalorimetric vessels but few investigations have been reported. Animals such as frogs and lizards have been investigated in large (100 ml) microcalorimetric vessels.
3.6.4 Materials from plants Very few microcalorimetric studies on living material from plants were reported until about ten years ago. Most work within this area has been conducted on tissue pieces (leaves, stems and roots) and has often concerned the effect of stress factors such as high or low temperature, excessive salt concentration and
various pollutants. Correlations have been investigated between thermal power produced by tissues from trees and their biomass production, an area which may develop to one of practical importance? Few studies on plant cells have been reported. Surprisingly, photo-microcalorimetric measurements con- ducted on material from plants are very rare.
4 A note about systematic errors and standards It was pointed out earlier that practically all processes are accompanied by heat effects. That property can be useful when calorimeters are used as general analytical tools but it will also make calorimeters uniquely sensitive to systematic errors. As may be expected, such errors tend to be more difficult to control in microcalorimetric experiments than in cases where larger thermal powers or heat quantities are measured. Modern isothermal microcalorimeters are usually very easy to work with, but errors from effects such as evaporation, condensation, adsorption and incomplete mixing may easily ruin the result. In work with living cellular sytems there are several additional important sources of errors of which the experimentalist should be aware.28
The calibration constant for an isothermal microcalorimeter is normally determined by release of electrical power, which can easily be measured with a higher accuracy than needed in any microcalorimetric experiment. However, the heat flow pattern from the electrical heater can be significantly different from that released by an investigated process. For flow-through vessels systematic errors in the electrical calibration value can be particularly serious.3.28
When the aim is to conduct accurate microcalorimetric measurements it is important to test the performance of the instrument-and of its user-by means of test reactions.3.28
5 Increasing the specificity It was pointed out earlier that the non-specific nature of heat measurements can make it difficult to interpret results from measurements of complex reaction systems in sufficient detail. This is believed to be the main reason why isothermal microcalorimeters have not been much used as process monitors, except in a few niches of the chemical industry and by some academic research groups. The thermal power-time curve for a process represents a complete record of the process, but it may not be possible to interpret the record at the molecular level. Calorimetric records would be more informative if they were supported by results of specific analyses, if possible performed at the molecular level. In flow calorimetric experi- ments it is easy to take out samples for analysis from the calorimetric flow line. In batch experiments it is possible to extract liquid or gaseous samples from the reaction vessel without causing uncontrolled disturbances, even if the experi- ments are conducted on the microwatt level. However, analyses should preferably be performed continuously and in parallel with the calorimetric measurements. In a few cases such combined measurements have been explored, without receiving much attention.
5.1 Analytical sensors in the reaction vessel Several types of analytical sensors can be positioned in microcalorimetric vessels. Different electrodes and probes for measurement of spectral changes seem to offer interesting possibilities.
5.1 .I Electrodes It has been shown that miniaturized electrodes can be positioned in a microcalorimetric vessel and be used in parallel with the heat mesurements without causing any significant distur- bances.26 Fig. 4 shows results from an experiment with cultured tissue cells in a reaction vessel equipped with pH and 0 2 electrodes. Following an equilibration period, a small sample of cells was injected at the time indicated by the arrow. The
84 Chemical Society Reviews, 1997
Dow
nloa
ded
on 3
0 D
ecem
ber
2012
Publ
ishe
d on
01
Janu
ary
1997
on
http
://pu
bs.r
sc.o
rg |
doi:1
0.10
39/C
S997
2600
079
View Article Online

I I I I
0 10 20 30 I I I
t l h
0 10 20 30 t l h
Fig. 4 Results from measurement of metabolic heat from T-lymphoma cells using a heat conduction microcalorimeter fitted with a stirred perfusion vesseL26 Miniaturised electrodes for determination of pH and oxygen concentration were positioned in the vessel which was without gas phase. (A) Results from parallel measurements of thermal power, P , (-), pH (--.--a) and oxygen concentration (---) are shown. The perfusion of the medium was stopped at time zero and cells were injected at the time indicated by the arrow. ( B ) The total heat production divided into an aerobic part (shaded) and an anaerobic part (hatched), cf. the text.
calorimetric curve increased momentarily after which a gradual increase in the thermal power due to aerobic growth is observed. The signal from the oxygen electrode showed a fast decrease, reaching zero after ca. 5 h. The pH also decreased. The changes in the metabolic pattern during the anaerobic phase are reflected by the changes in the thermal power and the pH. Clearly, the thermal power curve is better understood through the support from the two electrode curves. Further, the rate of oxygen consumption, together with corresponding release of thermal power, is essential for interpretation of the energetics of the metabolic process.
5.1.2 Measurements of spectral changes Light can easily be introduced into a microcalorimetric vessel, for example by use of a rod or a fibre bundle made from quartz, glass or plastic. Such light guides have been used in several macro- and micro-calorimeters for the study of photochemical processes.3 By means of light guides it is also possible to use a microcalorimetric vessel simultaneously for heat measurements and as a light absorption cell, Fig. 5. Several years ago Schaarschmidt and Lamprecht29 employed quartz rods as light guides in a microcalorimetric vessel used for the simultaneous measurement of thermal power and optical density of a cell suspension. Using a slightly different arrangement this group monitored oscillating reactions (for example the Belusov- Zhabotinskii reaction), calorimetrically in parallel with the changes of the absorption spectrum.30
5.2 Continues analysis conducted outside the reaction vessel With flow or perfusion calorimeters it is easy to connect analytical instruments on-line with the reaction vessel; tech- niques which have been used in several cases. Similarly, gases
(d 1 Fig. 5 Principle arrangement of a microcalorimetric titrationbight absorp- tion vessel. An electrode is also positioned in the vessel. (a) Lamp and other optical equipment, (b) light guide, (c), titration syringe, (d) micro- calorimetric vessel, ( e ) electrode, (f) light path in the medium, (g) spectrometer.
may diffuse from a calorimetric reaction vessel to analytical instruments outside the calorimeter. A few examples will be given.
Gnaiger and coworkers have made extensive use of perfusion microcalorimeters in studies of small aquatic animals, under different conditions of oxygen supply. Using oxygen electrodes positioned in the flow line before and after the calorimetric vessel, the oxygen consumption and its average concentration in the vessel could be measured continuously during calorimetric experiments.31
Criddle et al.32 have used an assembly consisting of two microcalorimetric vessels and a pressure sensor to analyse the energetics of plant tissue in the dark. The three instruments form a closed system connected by gas tight tubes, Fig. 6. One of the microcalorimetric vessels, A, is the reaction vessel for the plant tissue. Calorimetric vessel B contains a solution of NaOH, and serves as a trap for the CO2 formed. From the thermal power measured in vessel B the rate of release of CO2 can be determined. From these results, combined with values from the pressure measurements and the gas volume of the closed instrument system, changes in the oxygen concentration can be derived.
Fig. 6 Schematic picture of a microcalorimetric assembly used for the simultaneous determination of thermal power and production/consumption of C 0 2 and 02, in experiments with plant tissue and in the dark. (Adapted from Criddle et a1.32). The metabolic heat is measured by one calorimeter, (a), only the reaction vessel is indicated, CO2 from respiration of the tissue will diffuse to the second microcalorimeter (b), where it is absorbed by NaOH solution. The two calorimetric vessels and a pressure meter (P) are connected by gas tight tubes to form a closed system.
Chemical Society Reviews, 1997 85
Dow
nloa
ded
on 3
0 D
ecem
ber
2012
Publ
ishe
d on
01
Janu
ary
1997
on
http
://pu
bs.r
sc.o
rg |
doi:1
0.10
39/C
S997
2600
079
View Article Online

Fig 7 shows a simplified picture of a wet gas perfusion assembly for studies of living tissues, in particular plant tissues 33 The reaction vessels of two twin heat conduction microcalorimeters (A, B) are connected by gas-tight tubing and are positioned in the same thermostatted bath (Only the reaction vessels are indicated) Vessel A contains the biological tissue and vessel B is charged with NaOH solution Perfusing gas is prehumified in a separate vessel (a) and the final water vapour concentration is adjusted by passing the gas through humidifiers (c, parts of the reaction vessel of calorimeter A) The gas leaving the reaction vessel passes vessel B which serves as an on-line CO2 analyser, cf Criddle et a1 32 Gaseous reagents from a syringe (b) can be supplied to the incoming gas-flow and samples can be taken out for continues or stepwise analyses through a septum (f> Dynamic corrections are carried out to compensate for the inertia of the calonmeters and for the slow flow rate of the gas (ca 50 ml h-1) Electrodes and light guides have now been added to the reaction vessel of calorimeter A (which is designed as a modular system) 34
f
A Y t
A B A B
’-
Fig. 7 Schematic picture of a wet gas microcalonmetric perfusion system for simultaneous determination of metabolic heat and C 0 2 production by living tissues 33 (a) Prehumidifier, (b) inlet for gaseous reagents, (c) humidifiers, (4 reaction vessel, (e ) calorimetnc vessel used as trap for CO2, (#) gas sampling septum
6 Conclusions Some commercially available isothermal microcalonmeters can now be used at a level of sensitivity which approaches the nanowatt level and it has become realistic to work with compounds that are much more expensive, less soluble, have a higher molecular mass etc , compared to the situation of a few years ago Further, it is judged there will soon be increased possibilities for such work conducted at higher temperatures and pressures However, careful method studies should be conducted before such goals will be realized, remembenng how vulnerable microcalonmetric measurements are to systematic errors Further developments of chemical test processes and an increased use of such processes are needed
Much development in isothermal microcalorimetry has been initiated by needs in biochemistry and cell biology In some cases, in particular regarding the thermodynamic character- ization of ligand binding reactions involving biopolymers, and of model systems, the development work has been very fruitful Instrument and method development work directed towards applications in cell biology have had a significant impact on the progress of modern isothermal microcalorimetry, but has not yet been of much importance for the intended target areas
In the late 1960s, following the pionering work of C a l ~ e t ~ ~ in France and Benzinge1-3~ in the USA, the development of modem isothermal microcalonmeters began to accelerate At that time
and dunng the following decade there were great expectations concerning the practical use of such instruments as general analytical tools From our relatively short perspective those expectations were not realistic However, based on the concept of combining isothermal microcalorimetry with specific analyt- ical instruments and by a wealth of information from 30 years of method work, a new optimism can now be sensed
7 References 1 P Backman, M Bastos, D Hallen, P Lonnbro and I Wadso J Bzochem
Biophys Methods, 1994, 28, 85 2 I Wadso, in Thermal and Energetic Studies of Cellular Systems, ed A
M James, 1987, Wnght, Bnstol, p 34 3 I Wadso, in Solution Calorimetry, ed K N Marsh and P A G O’Hare,
1994, Blackwell, Oxford, p 267 4 J B Ott and C J Wormald, in Solution Calorimetry, ed K N Marsh
and P A G O’Hare, 1994, Blackwell, Oxford, p 161 5 M Stodeman and I Wadso, Pure Appl Chem , 1995,67, 1059 6 E J King, Aczd-Base Equlibrza, 1965, Pergamon Press, Oxford,
7 E H Battley, Thermochem Acta, 1995,250, 337 8 P R Connelly, R A Aldape, F J Bruzzese, S P Fitzgibbon,
J Matthew, M A Fleming, S Itoh, D J Livingston and M A Vaviva, Proc Natl Acad Sci , (USA), 1994,91, 1964
9 I Johansson and G Olofsson, J Chem Soc Faraday Trans 1, 1988, 84,551
10 L G Soldi, Y Marcus, M J Blandamer and P M Curtis, J S o h Chem , 1995,24,201
11 S J Gill, J Chem Thermodynamics, 1988,20, 1361 12 G Salvetti, E Tognoni, E Tomban and G P Johan, Thermochim Acta,
13 M Angberg, C Nystrom and S Castensson, Znt J Pharm , 1991, 81,
14 L -E Bnggner, G Buckton, K Bystrom and P D’Arcy, Int J Pharm ,
15 G Buckton, Thermochzm Acta, 1995,248, 117 16 A Bakn, Application Note 22021, Thermornetnc AB, Jarfalla, Sweden,
17 I Wadso and L Wadso, Thermochim Acta, 1996,271, 179 18 R J Willson, A E Beezer, J C Mitchell and W Loh, J Phys Chem ,
19 I Wadso, Thermochim Acta, 1995,2691270, 337 20 Special Issue of Thermochzm Acta, ed R B Kemp, 1990, 172 21 Special Issue of Thermochzm Acta, ed I Lamprecht, W Hemminger
22 Special Issue of Thermochim Acta, ed R B Kemp and B Schaarsch-
23 R D Newell, in Biological Microcalorimetry, ed A E Beezer, 1980,
24 R B Kemp, Thermochim Acta, 1993,219, 17 25 M Monti, L Brandt, J Lkomi-Kumm and H Olsson, Eur J Haematol ,
26 P Backman and I Wadso, J Biochem Biophys Meth, 1991, 23,
27 L D Hansen,M S Hopkin,D K Taylor,T S Anekonda,D R Rank,
28 I Wadso, Thermochim Acta, 1993,219, 1 29 B Schaarschmidt and I Lamprecht, Expenenta, 1973, 29, 505 30 B Schaarschmidt, I Lamprecht, T Plessner and S C Muller, Thermo
31 J E Doeller, D W Kraus, E Gnaiger and J M Shick, in ref 20,
32 R S Cnddle, A J Fontana, D R Rank, D Page, L D Hansen and
33 P Backman, R W Breidenbach, P Johansson and I Wadso
34 P Johansson and I Wadso, unpublished 35 E Calvet and H Prat, Recent Progress in Microcalorimetry, Pergamon,
London 1963 36 T H Benzinger and C Kitzinger, in Temperature-Jts Measurement
and Control in Science and Industry, ed , J D Hardy, Reinhold, New York, 1963, vol 3
p 184
1996,285,243
153
1994, 105, 125
1993
1995, 99, 7108
and G W H Hohne, 1991,193
midt, 1995,250
Academic, London, p 163
1990,40,250
283
R W Breidenbach and R S Cnddle, in ref 22, p 215
chim Acta, 1986, 105, 205
p 171
R W Breidenbach, Anal Biochem, 1991,194,413
Thermochim Acta, 1995,251, 323
Received, 18th November 1996 Accepted, 6th December 1996
86 Chemical Society Reviews, 1997
Dow
nloa
ded
on 3
0 D
ecem
ber
2012
Publ
ishe
d on
01
Janu
ary
1997
on
http
://pu
bs.r
sc.o
rg |
doi:1
0.10
39/C
S997
2600
079
View Article Online