
Vietnam Rural Electrification ProgramRURAL ELECTRIFICATION OVERVIEW Electricity access in 2009 -...
37
Vietnam Rural Electrification Program Văn Tiến Hùng Senior Energy Specialist World Bank in Vietnam
Transcript of Vietnam Rural Electrification ProgramRURAL ELECTRIFICATION OVERVIEW Electricity access in 2009 -...

Vietnam Rural Electrification Program
Văn Tiến Hùng
Senior Energy Specialist
World Bank in Vietnam

RURAL ELECTRIFICATION OVERVIEW Electricity access in 2009 - Regional aggregates
Population
without
electricity
Electrificatio
n rate
Urban
electrificatio
n rate
Rural
electrificatio
n rate
million % % %
Africa 587 41.8 68.8 25
North Africa 2 99 99.6 98.4
Sub-Saharan Africa 585 30.5 59.9 14.2
Developing Asia 675 81 94 73.2
China & East Asia 182 90.8 96.4 86.4
South Asia 493 68.5 89.5 59.9
Latin America 31 93.2 98.8 73.6
Middle East 21 89 98.5 71.8
Developing countries 1,314 74.7 90.6 63.2
World* 1,317 80.5 93.7 68
Myanmar 13% (WB data of 2009)
* World total includes OECD and Eastern Europe / Eurasia
Source: WEO-2011

0%
10%
20%
30%
40%
50%
60%
70%
80%
90%
100%
1976 1986 1996 2006
Vietnam Rural Electrification -Evolving Process
2.5% CEG/DEG
63%,
Power Sector
19%
LDU 56%
Power
Sector
(34%)
Power
Sector73%
LDU 20%
Self manage, Agr Coop,
Private, CEG
Post War Recovery
Taking off
Preparation
Management
Improvement
Consolidation
for the last mile
Quantity to
Quality
RE
RE2+AF
RD
1986 1993 1997 2004 2009
EVN piloting 8 communes Decree 22
Electricity Law

0
200
400
600
800
1000
1200
-
10.0
20.0
30.0
40.0
50.0
60.0
70.0
80.0
90.0
100.0
Per C
ap
ita G
DP
($)
Po
pu
latio
n (m
illio
n)
Population of Viet nam (million) Rural Po pulation (million)
Access to Electr icity in ru ral (million) GDP per capita (current US$)
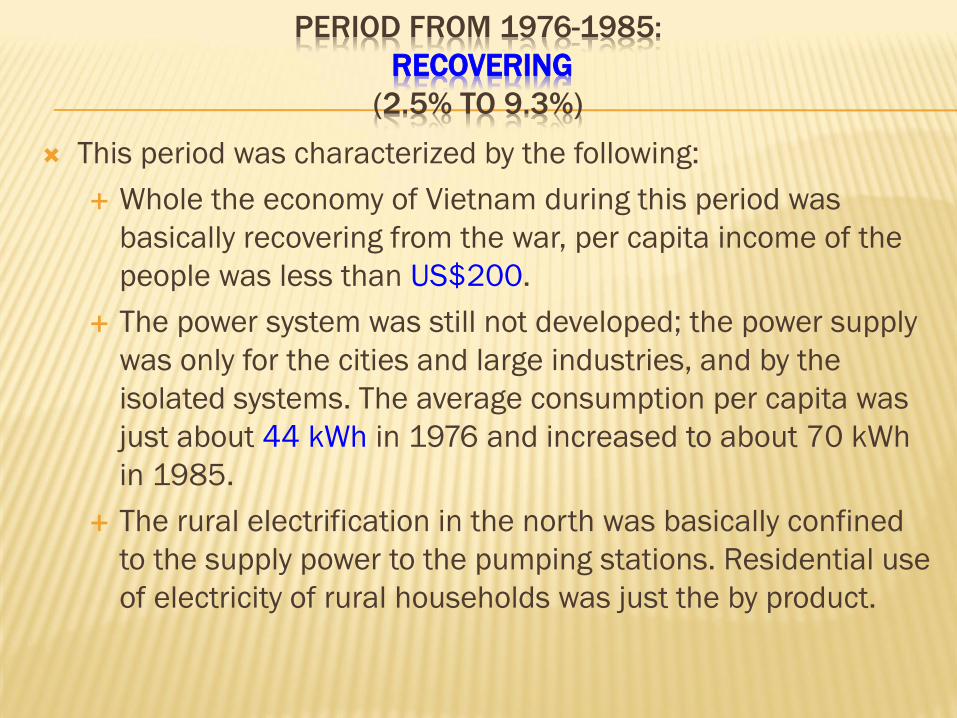
PERIOD FROM 1976-1985:
RECOVERING
(2.5% TO 9.3%)
This period was characterized by the following:
Whole the economy of Vietnam during this period was
basically recovering from the war, per capita income of the
people was less than US$200.
The power system was still not developed; the power supply
was only for the cities and large industries, and by the
isolated systems. The average consumption per capita was
just about 44 kWh in 1976 and increased to about 70 kWh
in 1985.
The rural electrification in the north was basically confined
to the supply power to the pumping stations. Residential use
of electricity of rural households was just the by product.

PERIOD 1986 TO 1993:
PREPARATION
(10% TO 14%)
The most important policy that had the large impact not only
for the rural electrification in Vietnam, but for the whole
economy of Vietnam, this was the “Doi Moi” or Renovation
Policy in 1996. Two year after the “ Doi Moi”, from 1988
Vietnam changed from rice importer to the rice exporter.
In 1990 the GoV had exempted the agriculture taxes for the
farmers; many agriculture cooperatives had decided to used
these exempted taxes for the construction of the rural
electricity networks.
Power sources started to increase with large Hydropower
sources like Tri an, Hoa binh
500 kV North to South Transmission line was started

PERIOD FROM 1994 TO 1997:
TAKING OFF
(14% TO 61%)
This period could be characterized by :
i. booming up the household connection for the
residential uses,
ii. demand driven, bottom –up process,
iii. lacking of the institutional set up, and
iv. lacking of the technical specification for the
rural networks.
This period created a strong push for the RE
program, but also left many issues for the next
period.

MAIN FACTORS AND FINANCING
OF THE TAKING OFF PERIOD
Demand for the acess in the rural araes became urgent
Power sources, the necessary conditions was granted : particularly 1920 MW
of Hoa Binh Hydropower station was fully put into operation
Transmission networks, the other basic condition was also granted,
particularly the 500 kV north to south was put into operation.
The main finacing sources were from customers and the local budgets
0%
20%
40%
60%
80%
100%
120%
MV LV MV+LV
25% 15%
21%
40%
19%
31%
35%
66% 48%
GoV budget &Power Sector Provincial and surcharge
Contribution from customers

INVESTMENT SHARE OF THE MAIN ACTORS
0%
10%
20%
30%
40%
50%
60%
70%
80%
Power Sector Local
Authority
customers other
to 1998 1996-2000 2001-2005

PERIOD FROM 1998 TO 2004:
MANAGEMENT IMPROVEMENT
: ( 61% TO 87%):
This period was characterized by the following:
The average annual access rate dropped to 3.7%
Percentage of financing from power sector was
increasing
Institutional and legal frameworks started with
the Decree 22, 25 and the Electricity Law
Technical specifications for rural system was
established.
International donors, particularly WB, started to
assist the GoV program.

PERIOD FROM 2005 TO 2009:
FROM QUANTITY TO QUALITY
(92% TO 95%)
This period could be characterized by:
Strengthened the management requirements.
Moving from expansion to rehabilitation
Direct funding from the central government
budget for the remote areas for the minority
people ( Central Highland Project with 85%
from GoV budget, 15% from EVN)

0
50000
100000
150000
200000
250000
Access rate for poorest provinces in 1997
HH not connected in 1997 HH connected in 1997
11%
13% 19%
20%
20% 25% 27%
0
50000
100000
150000
200000
250000
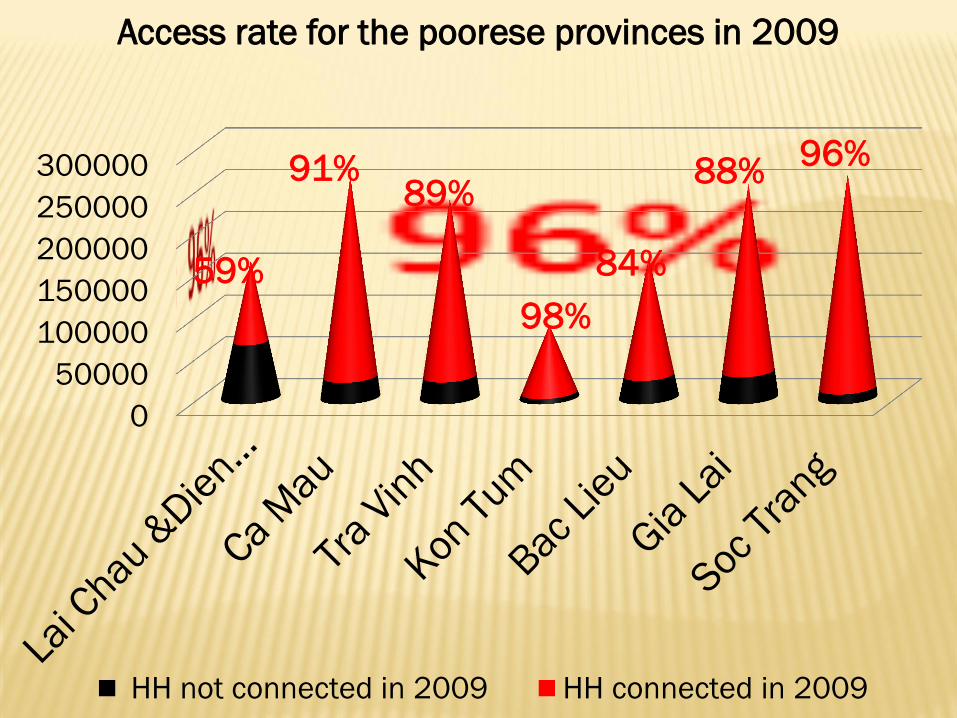
300000
Access rate for the poorese provinces in 2009
HH not connected in 2009 HH connected in 2009
59%
91% 89%
98%
84%
88% 96%

PERIOD FROM 2009:
CONSOLIDATION FOR THE LAST MILE
The important benchmark of this period was
the Decision 21 of the Prime Minister in
March 2009.
Uniform power tariff for all the customers,
both rural and urban
Most of the LDU with low financial capacity
are merging to the power companies.

Outstanding
issues
The commune
systems developed
during the early 90’s
need to be
rehabilitated to reduce
losses and increase
quality and quantity of
power supply

Outstanding Issues
There are
about one
million
households
mainly in
mountainous
areas and
islands still
looking for
electricity

TASKS AND CHALLENGES FOR THE
PERIOD TO COME
Tasks
Rehabilitate about 3,000 commune
Expansion to about 5% of the HH
Challenges
Funding
3,000 com x 400,000 $/com= US$ 1,2 billion
1,000,000 HH x 2,000 S/HH= US$ 2 billion
Total about US$ 3 billion required.
Management capacity of the power companies

Number of rural people that have access to
electricity (1993 to 2008)
by the end of 1993 million 7.8
by the end of 2008 million 59.4
in 15 years million 51.6
in 1 year million 3.4
in 1 day person 9,424
in 1 day Households 1,885

Many Pico Hydro sets are using

WHY VIETNAM RE PROGRAM IS
SUCCESSFUL
Among basic types of infrastructure (Electricity- Roads- Schools-
Clinics), most people opt for Electricity-
Strong desire of people to have the access
Strong commitment of the Government
Correct policy: “State and People- Central and Local” doing
together.”
Multiple funding sources:
(i) customer contribution,
(ii) commune, district, province and central government budgets,
(iii) special surcharges from urban customers,
(iv) private investors,
(v) borrowings,
(vi) retained depreciation from EVN
(vii) international donors

Overview
of the
Power Sector
And
Management System in Rural Areas
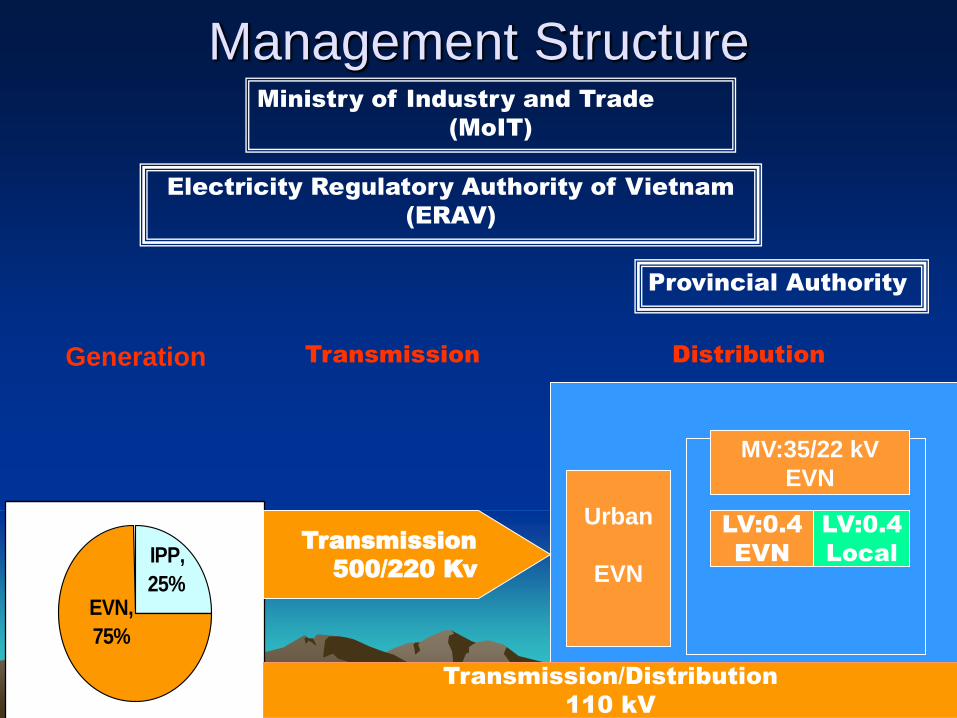
Management Structure
IPP,
25%EVN,
75%
Urban
EVN
Rural
MV:35/22 kV
EVN
Generation
LV:0.4
Local
LV:0.4
EVN
Ministry of Industry and Trade
(MoIT)
Electricity Regulatory Authority of Vietnam
(ERAV)
Transmission
500/220 Kv
Transmission/Distribution
110 kV
Transmission Distribution
Provincial Authority

Demarcation
Electricity of Vietnam (EVN)
Local Distribution Utility
(LDU) (EVN and non-EVN)
35/22 kV 0.4 kV
Service
Agents

Local Distribution Utility
(LDU) • LDU is a utility such as a cooperative
(working under cooperative law) or a
company (working under company law).
• LDUs buy power from EVN at bulk tariff and
sell to final customers. LDUs in charge of
development and operating the LV system in
one or more rural communes.
• Typical LDU serves 1000 households.

Service Agent
• Agent is used by EVN in a commune, where
EVN directly manages and operates the LV
system.
• Agent is a local person in a commune, hired
by EVN to collect the bill, lines checking,
maintaining ROW, other works, and liaison
person. (See model contract on AEI
prototype web)
• Agent model considerably reduced the
operating cost of EVN

Tariff and Tariff Setting • Before 1 March 2009, Bulk tariff to the LDU at 390
d/kwh, 420 d/kwh with VAT
• Retail price from LDU was 700 d/kwh as the
ceiling, set by GoV
• Province can allow tariff >700 d/kWh based on the
business plan of each LDU
• From 1 March 2009 Retail Tariff is a national
uniform tariff for rural and urban customers.

New tariff structure
effective from December 22, 2012 Block retailed tariff Bulk tariff to LDU
kwh d/kwh d/kwh
0-50 993 807
0-100 1,350 1067
101-150 1,545 1190
151-200 1,947 1499
201-300 2,105 1631
301-400 2,249 1743
>400 2,307 1799
1 US$= VND20,850

Rapid development of RE in 90s
but lacking:
(i) proper management set up,
(ii) technical specification for
rural networks, and
(iii) adequate funding
Most of the systems
developed in this period have
high losses and are unreliable
Average losses in these
systems are about 30%, in some
cases up to 50%

After converting to
LDU, no case of
the stealing
reported.
Collection rate is
almost 100%.
With proper design
and use of the
new technical
standards, the
losses are about
7%-10%

Costs and cost sharing
• Difficult to estimate, due to asset created by various
parties from various sources, no reliable records
• The trend in cost sharing is:
– Before 1995: all RE capital costs were paid by
consumers and local authorities (both for MV and
LV)
– From 1999: MV system transferred to EVN, and
EVN paid for the assets, EVN started taking over
LV systems. EVN share of capital costs is
increasing with time.
• See the following table
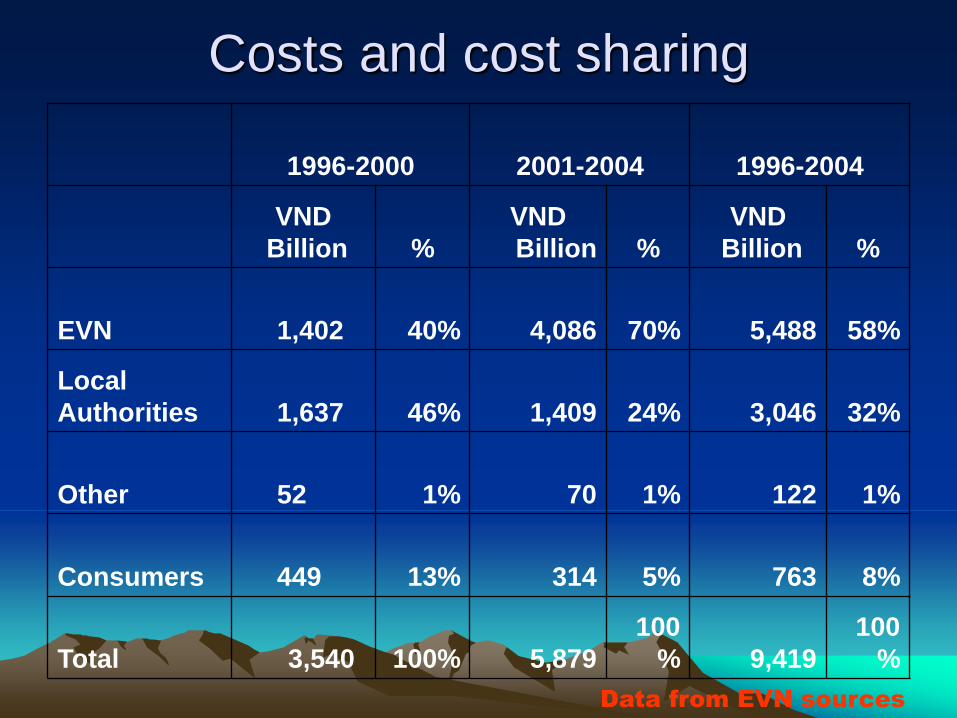
Costs and cost sharing
1996-2000 2001-2004 1996-2004
VND
Billion %
VND
Billion %
VND
Billion %
EVN
1,402 40% 4,086 70%
5,488 58%
Local
Authorities
1,637 46% 1,409 24%
3,046 32%
Other
52 1% 70 1% 122 1%
Consumers
449 13% 314 5% 763 8%
Total
3,540 100% 5,879
100
% 9,419
100
%
Data from EVN sources

Costs and cost sharing (IRC for RE financed by WB 2000-2006)
Data from WB
Financing Sources Impl. Agencies Costs (US$) Sources (%)
PC1 73.6
IDA PC2 35.02
PC3 40.41
Sub total 150.92 74%
PC1 10.9
Counterpart funds PC2 11.3
PC3 10.5
Sub total 32.7 16%
PC1 1.4
Local Government PC2 1.9
(for resettlement works) PC3 2.6
Sub total 5.9 3%
PC1 5.5
Customers PC2 6.5
(for connection to HH) PC3 1.7
Sub total 13.7 7%
Total 203

Costs and cost sharing (IRC for RE financed by WB)
Data from WB
Communes
electrified
Households
connected
Costs US$ per
commune
Cost per
HH
$ mil 1000$ US$
PC1: for
northern region
529 232,955 91.4 173 392
PC2: for
southern region
187 184,472 54.72 293 297
PC3: for central
region
260 137,900 55.21 212 400
Total 976 555,327 201.3
3
206 363

Development Process Adapting Policies to Realities
From: no planning, no regulation,
no technical standard;
losses up to 50%
To: Electricity Law,
with the technical standard for RE
losses down to 7-10%

Development process Rolling Out and Expanding
From: more economic active areas,
center of communes,
more contributions from customers,
To: less developed areas, isolated
villages
more assistances from GoV, donors

IS THERE …
Enough power sources?
Desire of people to have the power?
Strong commitment of the government authorities
of every level?
Clear road maps for expanding access? By what
way? Grid, off grid, household connection?
Sustainable Management Model for rural areas?
Low cost technical standards for the rural
networks?
Local consultancy industry
Local supply of basic material and equipment?


