VIETNAM OIl AND GAS INDUSTRY REPORT 2017 · • Oil prices remained fluctuant during 2017 but...
178
VIETNAM OIl AND GAS INDUSTRY REPORT 2017
Transcript of VIETNAM OIl AND GAS INDUSTRY REPORT 2017 · • Oil prices remained fluctuant during 2017 but...

VIETNAM OIl AND GAS INDUSTRY REPORT 2017

Content
2
Executive summary 4 3.4 The current situation 66
1. Business environment 6 4. Risks 108
1.1 Macroeconomic context 6 4.1 Risks 108
1.2 Legal barriers 12 4.2 SWOT analysis 112
1.3 Trade agreement impact 22 5. Prospect, planning and prediction 114
2. The petroleum industry in the world 26 5.1 Planning 120
2.1 Crude oil 26 5.2 Prediction 143
2.2 Fuel gas 33 6. Enterprise analysis 147
2.3 Situation of key nations in the industry 47 6.1 Enterprise introduction 147
2.4 Major companies in the industry 51 6.2 Financial analysis 161
3. The petroleum industry in Vietnam 56 Financial Statements Appendix 171
3.1 Definition and classification 56
3.2 History of development 60
3.3 Industry value chain 62

Abbreviation
BTU British Thermal Unit
IEA International Energy Agency
IGU International Gas Union
MOIT Ministry of Industry and Trade
LNG Liquefied natural gas
LPG Liquefied Petroleum Gas
3
OPEC Organization of the Petroleum Exporting Countries
PVN Vietnam Oil and Gas Group
GDVC General Department of Vietnam Customs
GSO General Statistics Office of Vietnam
VIRAC Vietnam Industry Research And Consultancy
4
• As estimated, the oil supply surged to 96.5 million barrels/day in 2017,
increasing by 0.7 million barrels/day.
• Oil prices remained fluctuant during 2017 but showed positive signals
for last months of the year.
• In 2016, the global natural gas production reached 3.552 million cubic
feet, up 0.6% compared to 2015- and was the lowest level since 2009.
• Vietnam’s oil and gas industry is at its newly-fledged stage and just
paid attention by the government recently.
• Currently, mining for export is still placed above all other activities,
making the local industry mostly depend on the world’s oil prices.
• As usual, the oil industry is divided into three groups, including
upstream, midstream and downstream.
Executive summary

Executive summary
5
• In 2017, Vietnam exploited around 13,567.3 thousand tons of oil,
down 10.8% compared to the same period.
• According to preliminary figures compiled by the General
Department of Customs, in 2017, 6.8 million tons of crude oil was
exported, up 0.6% equivalent to 2.87 billion USD - an increase of
21.8% compared to the same period in 2016.
• Vietnam’s crude oil import was estimated to reach 1,180.0 thousand,
worth $476.5 million, an increase of 171.2% in volume and 199.3% in
value compared with the same period in 2016.
• Vietnam's import turnover was expected to revenue 805.1 million
USD.
• In 2016, the oil and gas enterprises recorded negative growth rates
in terms of net sales compared to the year 2015.
• The gloomy situation is forecast to re-bounce soon.

1. Business environment
1.1 Macroeconomic context
1.2 Legal barriers
Content
6

7
• Vietnam's GDP growth is based primarily on natural resource exploitations
with its mining industry focusing on 3 principal areas: coal, oil and gas.
Source: VIRAC, GSO
Source: VIRAC, GSO
1. Business environment
1.1 Macroeconomic context
Current - price GDP and per capita GDP, 2013-2017
Thousand billion
VND
GDP growth, 2011-2017
1. Business environment
1.1 Macroeconomic context
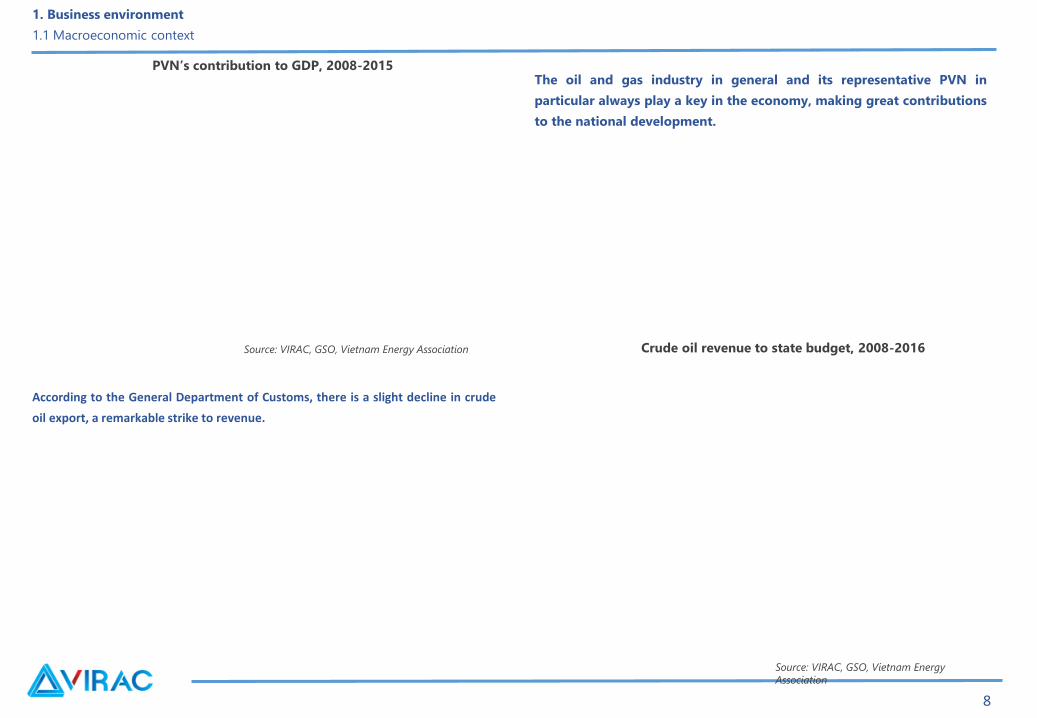
PVN’s contribution to GDP, 2008-2015
Source: VIRAC, GSO, Vietnam Energy Association
The oil and gas industry in general and its representative PVN in
particular always play a key in the economy, making great contributions
to the national development.
Crude oil revenue to state budget, 2008-2016
Source: VIRAC, GSO, Vietnam Energy
Association
According to the General Department of Customs, there is a slight decline in crude
oil export, a remarkable strike to revenue.
8

9
• The petroleum industry brings about not only major foreign investment sources for the country but also an pivotal impetus for economic
development.
• The sector has made significant contributions to the State budget. Although the total export earnings have fallen recently, the oil and gas industry
still maintains its significance to the country’s GDP.
• According to BP’s statistics, Vietnam is ranked 20th out of 52 countries in the world having oil and gas resources.
1. Business environment
1.1 Macroeconomic context

10
Source: VIRAC, GDVC
1. Business environment
1.1 Macroeconomic context
• In 2017, Vietnam's export turnover was estimated at 214 billion
dollars, up 21.2 percent compared with the same period last year.
• In the same year, Vietnam's imports increased sharply compared
with the same period in 2016 as a result of a bounce back from
China.
• Vietnam's import-export during this period was very much reliable
on FDI.
Crude oil im-export against Vietnam’s total im-export turnover, 2010-
2017
FDI contribution to import - export, 2017e

11
Source: VIRAC, GDVC Source: VIRAC, GDVC
Source: VIRAC, GDVC
2. Vietnam's economy
2.1 Economic growth 2.1.5 Export - Import
Billion
USD
Most - imported goods, 2017
Vietnam’s main export markets, 2017
Export commodity structure, 2017

1. Business environment
1.1 Macroeconomic context
1.2 Legal barriers
Content
12

1. Business environment
1.2 Legal barriers
13

14
1. Business environment
1.2 Legal barriers

Group of regulations and standards for oil & gas mining and production:
• Circular No. 36/2016 / TT-BTC of the Ministry of Finance guiding the implementation of tax regulations applicable to organizations and individuals
dealing with oil and gas prospection, exploration and exploitation according to the provisions of the oil & gas law.
15
No. Mining output
Tax rate (%)
1
2
3
4
5
6
7
8
9
1. Business environment
1.2 Legal barriers

16
1. Business environment
1.2 Legal barriers

17
Group regulations, standards for petroleum consumption and export:
1. Business environment
1.2 Legal barriers

18
Types of productTax rate
1. Business environment
1.2 Legal barriers

19
Code Description Tax rate (%)
PREFERENTIAL IMPORT TARIFF APPLICABLE TO CHAPTER 97 ACCORDING TO VIETNAM’S LIST OF IMPORTED GOODS
1. Business environment
1.2 Legal barriers

20
Code Description Tax rate (%)
PREFERENTIAL IMPORT TARIFF APPLICABLE TO CHAPTER 97 ACCORDING TO VIETNAM’S LIST OF IMPORTED GOODS
1. Business environment
1.2 Legal barriers

21
Code Description Corresponding codes in section I -
annex II
Tax rate (%)
REGULATIONS ON PRODUCT CODES AND PREFERENTIAL IMPORT TARIFFS FOR CERTAIN PRODUCT GROUPS AND ITEMS
Code Description Tax rate (%)
PREFERENTIAL IMPORT TARIFF APPLICABLE TO CHAPTER 97 ACCORDING TO VIETNAM’S LIST OF IMPORTED GOODS
1. Business environment
1.2 Legal barriers

2. The petroleum industry in the world
2.1 Crude oil
2.2 Fuel gas
2.3 Key nations in the industry
Content
22

23
2. The petroleum industry in the world
2.1 Crude-oil - 2.1.1 Global reserves
• According to BP, the global oil reserves were estimated to at 1,706.7 billion
barrels in 2016.
• According to the Oil Gas Journal (OGJ)’s latest figures, the world’s crude oil
reserves reached 1.651 trillion barrels in 2017.
Verified oil reserves, 2016
Source: VIRAC
Billion
barrels
Top 10 countries with the largest oil reserves, 2016
Billion
barrels
Source: VIRAC

24
2. The petroleum industry in the world
2.1 Crude oil - 2.1.2 Classification
Physical state Product Carbon atom quantityBoiling
temperatureUse case
Classification, characteristics and use cases
Source: VIRAC, the World energy council

Global oil rig structure by region, 2017
25
Global drilling rig quantity, 2014-2017Regarding positive price signals, the global number of drilling rigs rose
sharply to 2.110 units in 2017, up 26.35% compared to 2016.
Source: VIRAC, OPEC
Source: VIRAC, OPEC
2. The petroleum industry in the world
2.1 Crude Oil - 2.1.3 Drilling rig
Oil rig
The US’s drilling rig quantity, 2015-2017
Source: VIRAC, OPEC
Oil rig

26
World oil supply, 2016-2017e
2. The petroleum industry in the world
2.1 crude oil - 2.1.4 Oil supply
Million barrels/day
Source: VIRAC, OPEC
Oil supply by region 2017e
Source: VIRAC, OPEC
In the period of 2013-2016, the world oil supply remained stable, with a growing output from non-OPEC countries.

27
2. The petroleum industry in the world
2.1 Crude oil - 2.1.4 Oil supply

28
OPEC countries’ crude oil output, 2013-2017
Million barrels/day
OPEC countries’ crude oil production structure, 2017-2017
Source: VIRAC, OPEC
Source: VIRAC, OPEC
2. The petroleum industry in the world
2.1 Crude oil - 2.1.4 Oil supply

29
Million barrels/day2016 recorded a highest oil consumption of 96.56 million barrels a day, an
increase of 1.56 million barrels a day compared with the same period last
year.
Source: VIRAC
2. The petroleum industry in the world
2.1 Crude oil - 2.1.6 Oil consumption
World oil consumption, 2013-2016
Per capita oil consumption, 2016
Source: VIRAC
Oil consumption by region, 2016
Source: VIRAC
Ton

30
In 2016, 10 largest oil consumers alone accounted for 53.9% of the global
consumption.
Source: VIRAC, OPEC
2. The petroleum industry in the world
2.1 Crude oil - 2.1.6 Oil consumption
Top 10 oil consumers, 2016
Oil consumption by certain products 2006-2016
Source: VIRAC, OPEC
Million barrels/day

31
Million barrels/day
Source: VIRAC
2. The petroleum industry in the world
2.1 Crude oil - 7 2.1 Oil trading
Oil trade, 2006-2016World oil trade, 2016Million tons
Source: VIRAC

32
Million barrels/day
Source: VIRAC, OPEC
Source: VIRAC, OPEC
2. The petroleum industry in the world
2.1 Crude oil - 7 2.1 Oil trading
Imported crude oil output, 2012-2016
Imported crude oil output structure, 2016

33
Million barrels/day
Global crude oil production structure by output, 2016
• Crude oil has a huge export value, accounting for about 4.3 % of
the global merchandise export.
Source: VIRAC, OPEC
Source: VIRAC, OPEC
Exported crude oil output, 2012-2016
2. The petroleum industry in the world
2.1 Crude oil - 7 2.1 Oil trading

34
2. The petroleum industry in the world
2.1 Crude oil - 2.1.8 Price
World crude oil prices from 1861-2017f
Source: VIRAC

35
• Crude oil prices plunged into a steep downward trend from 114 USD per barrel in mid-2014 to below 50 USD per barrel in early 2015, and continued to
touch the lowest level for almost 13 years in early 2016.
• It was only after OPEC negotiations with member states on November 30th, 2016 to cut down 1.2 million barrels per day in the first half of 2017 that
the prices exceeded 50 USD/ barrel.
2. The petroleum industry in the world
2.1 Crude oil - 2.1.8 Price

36
2. The petroleum industry in the world
2.1 Crude oil - 2.1.8 Price

37
2. The petroleum industry in the world
2.1 Crude oil - 2.1.8 Price

2. The petroleum industry in the world
2.1 Crude oil
2.2 Fuel gas
2.3 Key nations in the industry
Content
38

Gas classification
• Natural gas:
• Liquefied natural gas (LNG):
• Liquefied petroleum gas (LPG):
• Condensate gas
39
2. The petroleum industry in the world
2.2 Fuel gas - 2.2.1 Gas classification

40
Top 10 countries with the largest natural gas reserves, 2016
Source: VIRAC, the World energy
council
Source: VIRAC, Rystad Energy
Thousand billion VND
The gas Industry value chain
2. The petroleum industry in the world
2.2 Fuel gas - 2.2.2 Gas reserves

41
Natural gas output 1970-2016
Thousand billion
VND
Source: VIRAC
2. The petroleum industry in the world
2.2 Fuel gas - 2.2.3 Production

42
Natural gas production by area, 2016
Source: VIRAC
European and Eurosia are taking the lead in natural gas output, accounting for
28% of the world total, equivalent to 1,000 thousand cubic feet.
2. The petroleum industry in the world
2.2 Fuel gas - 2.2.3 Production

43
Leading natural gas producers, 2016
Source: VIRAC
2. The petroleum industry in the world
2.2 Fuel gas - 2.2.3 Production

44
Thousand billion
VND
Natural gas consumption, 2006-2016
Source: VIRAC
Natural gas production by area, 2016
Source: VIRAC
2. The petroleum industry in the world
2.2 Fuel gas - 2.2.4 Consumption

45
Top 10 largest natural gas consumers, 2016
Source: VIRAC
Per capita natural gas consumption, 2016
Source: VIRAC
Equivalent tonnes
2. The petroleum industry in the world
2.2 Fuel gas - 2.2.4 Consumption

46
Natural applications by sector, 2016
Source: VIRAC
2. The petroleum industry in the world
2.2 Fuel gas - 2.2.4 Consumption

47
Natural gas is often exported via (1) pipeline system for dry gas: low cost and fast but with inadequate and limited infrastructure (2) specialized means
of transportation.
Natural gas exports, 2015-2016Billion
cubic
feet
Source: VIRAC
Gas pipelines by region, 2017
Source: VIRAC
Km
2. The petroleum industry in the world
2.2 Fuel gas - 2.2.5 Trading
48
Source: VIRAC
Top 10 oil & gas exporter via pipeline, 2016
Billion
cubic
feet
Source: VIRAC
The global gas trade, 2016
2. The petroleum industry in the world
2.2 Fuel gas - 2.2.4 Consumption

49
Source: VIRAC
, Top 10 LNG exporters, 2016Billion cubic feet
2. The petroleum industry in the world
2.2 Fuel gas - 2.2.4 Consumption

50
Source: VIRAC
Top 10 LNG importers, 2016Billion
cubic
feet
Top 10 oil & gas importers via pipeline, 2016
Billion cubic feet
2. The petroleum industry in the world
2.2 Fuel gas - 2.2.4 Consumption

51
Global natural gas movements, 2012-2017
USD/million BTU
Source: VIRAC, Indexmundi
2. The petroleum industry in the world
2.2 Fuel gas

2. The petroleum industry in the world
2.1 Crude oil
2.2 Fuel gas
2.3 2.4 Key nations in the industry
2.4 Major companies in the industry
Content
52

53
2. The petroleum industry in the world
2.4 Key nations in the industry
54
Source: VIRAC, EIA
Million barrels/day
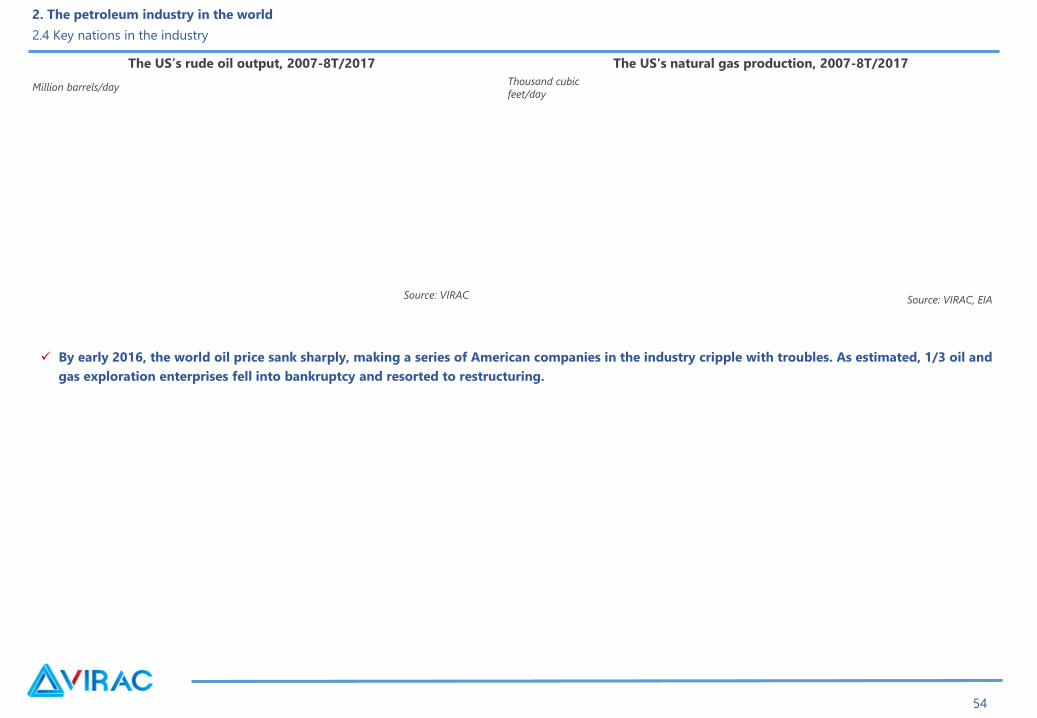
The US’s rude oil output, 2007-8T/2017
Source: VIRAC
The US's natural gas production, 2007-8T/2017
Thousand cubic
feet/day
✓ By early 2016, the world oil price sank sharply, making a series of American companies in the industry cripple with troubles. As estimated, 1/3 oil and
gas exploration enterprises fell into bankruptcy and resorted to restructuring.
2. The petroleum industry in the world
2.4 Key nations in the industry

55
Million cubic
feet.
Source: VIRAC, EIA
The US’s natural gas trade balance, 2016-8T/2017Petroleum-based product export, 2016-8T/2017
Source: VIRAC, EIA
Million barrels/day
2. The petroleum industry in the world
2.4 Key nations in the industry

56
China’s crude oil and crude oil product net import,
6/2016 – 8/2017Million barrels/day
Source: VIRAC, OPEC
2. The petroleum industry in the world
2.4 Key nations in the industry

3. The petroleum industry in Vietnam
3.1 Definition and classification
3.2 History of development
3.3 Industry value chain
3.4 The current situation
Content
57
3. The petroleum industry in Vietnam
3.1 Definition and classification
58
• Crude oil:
➢ Definition: Crude oil or mineral oil is a liquid, condensed, brown-colored or pale green substance, a mixture of organic chemicals, mainly
hydrocarbons.

3. The petroleum industry in Vietnam
3.1 Definition and classification
59

3. The petroleum industry in Vietnam
3.1 Definition and classification
60

3 The petroleum industry in Vietnam
3.1 Definition and classification
3.2 History of development
3.3 Industry value chain
3.4 The current situation
Content
62

3. The petroleum industry in Vietnam
3.2 History of development
62

3 The petroleum industry in Vietnam
3.1 Definition and classification
3.2 History of development
3.3 Industry value chain
3.4 The current situation
Content
64

3. The petroleum industry in Vietnam
3.3 Industry value chain
64
The crude oil value chain
Exploitation Production Transportation Oil refinery
Marketing (retail
outlets,
commercial
activities)
Oilfield services
) )

3. The petroleum industry in Vietnam
3.3 Industry value chain
65
The natural gas value
chain
Exploitation Production ProcessingTransportation
and storageLast users
Oilfield services
3. The petroleum industry in Vietnam
3.3 Industry value chain
66
Such terms as upstream, midstream, downstream refer to main activities in the oil and gas industry.

3 The petroleum industry in Vietnam
3.1 History of development
3.2 Definition and classification
3.3 Industry value chain
3.4 The current situation
Content
66

3. The petroleum industry in Vietnam
3.4 Current situation - 3.4.1 Upstream - seeking and exploration activities
68
Phases of oil seeking and exploration
Preparatory phase
Seeking phase
Exploration phase
Extended
exploration phase

3. The petroleum industry in Vietnam
3.4 Current situation - 3.4.1 Upstream - seeking and exploration activities
69
Oil seeking and exploration approaches
Approach Characteristics
3. The petroleum industry in Vietnam
3.4 Current situation - 3.4.1 Upstream - seeking and exploration activities
70
Approach Characteristics

3. The petroleum industry in Vietnam
3.4 Current situation - 3.4.1 Upstream - seeking and exploration activities
71
Approach Characteristics

3. The petroleum industry in Vietnam
3.4 Current situation - 3.4.1 Upstream - seeking and exploration activities
72
Billion
barrelsThousand
billion cubic
feet
Source: VIRAC, PVN
Mine quantity are exploited every each 5-year cycle,
1981 - 2015
Source: VIRAC, CIA
Vietnam oil and gas reserves, 2010 - 2016

3. The petroleum industry in Vietnam
3.4 Current situation - 3.4.1 Upstream - seeking and exploration activities
73
• Vietnam petroleum industry has been dominated by the Vietnam
national oil and gas group (PVN), under the supervision of the
Ministry of industry and trade executively and operationally.
Source: VIRAC, PVN
Vietnam’s oil field location by contract

Truong Sa
basin group
Nam Con Son
basin
Hoang Sa basin
• The country’s oil potential is mainly contributed by 7 hotspots. Cuu
Long, con son, the Red River, Malay Chu, Phu Khanh tank, Paracel
Islands and Spratley Islands.
3. The petroleum industry in Vietnam
3.4 Current situation - 3.4.1 Upstream - seeking and exploration activities
74
Oil and gas areas in Vietnam
Source: VIRAC, PVN

3. The petroleum industry in Vietnam
3.4 Current situation - 3.4.1 Upstream - seeking and exploration activities
75
Vietnamese oil and gas exploitation enterprises, 2010-
2016
Source: VIRAC, GSO
Source: VIRAC, GSO
Labor
Oil and gas laborer quantity, 2010-2016

3. The petroleum industry in Vietnam
3.4 Current situation - 3.4.1 Upstream - seeking and exploration activities
76
In 2017, the overall mining reach approximately 13,567.3 thousand tons,
down 10.8% compared to the same period last year.
Vietnam’s crude oil exploitation output, 2010-2017
Million
tons
Source: VIRAC, BP Global, PVN, GSO

3. The petroleum industry in Vietnam
3.4 Current situation - 3.4.1 Upstream - seeking and exploration activities
77
Source: VIRAC, BP Global, PVN, GSO
Billion m ³
Vietnam’s natural gas exploitation output, 2010-2017
Natural gas production by mine, 2007-8T/2017
Source: VIRAC, VPI/EMC
3. The petroleum industry in Vietnam
3.4 Current situation - 3.4.1 Upstream - seeking and exploration activities
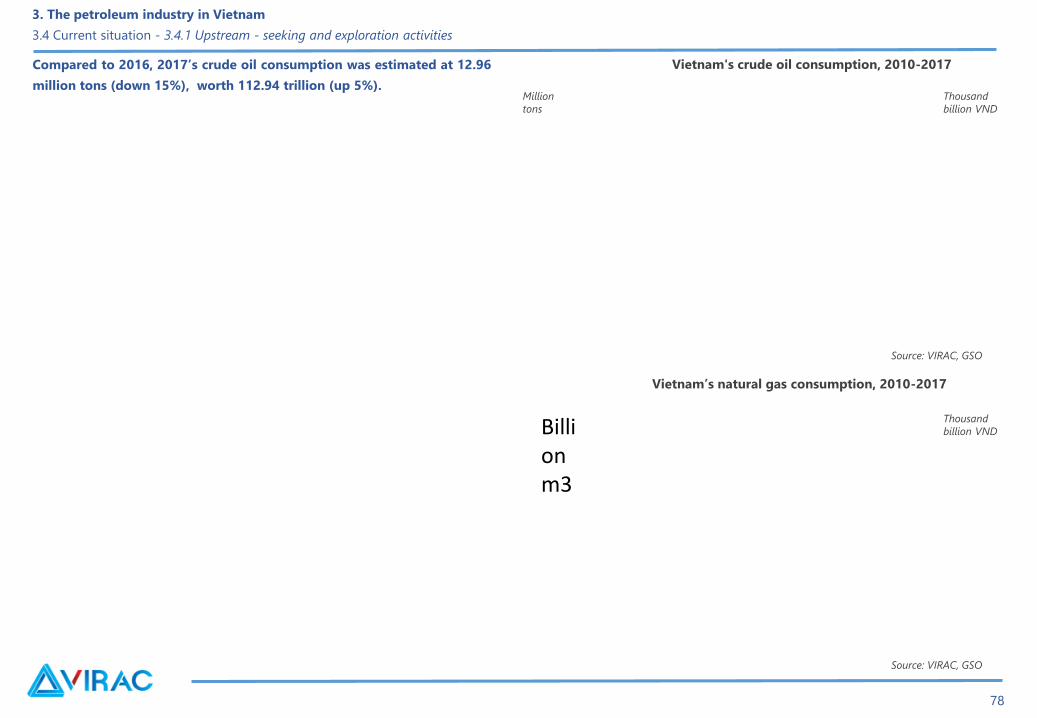
78
Compared to 2016, 2017’s crude oil consumption was estimated at 12.96
million tons (down 15%), worth 112.94 trillion (up 5%).
Vietnam's crude oil consumption, 2010-2017
Source: VIRAC, GSO
Million
tons
Source: VIRAC, GSO
Billion m3
Vietnam’s natural gas consumption, 2010-2017
Thousand
billion VND
Thousand
billion VND

3. The petroleum industry in Vietnam
3.4 Current situation - 3.4.1 Upstream - seeking and exploration activities
79
Vietnam's crude oil export, 2010-2017
Million
tons
Source: VIRAC, GDVC
Billion
USD

3. The petroleum industry in Vietnam
3.4 Current situation - 3.4.1 Upstream - seeking and exploration activities
80
Source: VIRAC, GDVC
Global crude oil export structure by output, 2017
Source: VIRAC, GDVC
Average crude oil export prices by market, 2017
USD/ton
Vietnam mainly exports to the Chinese market at a fairly low price, undermining profitability and national energy security concerning the country’s
limited oil reserves.

3. The petroleum industry in Vietnam
3.4 Current situation - 3.4.1 Upstream - seeking and exploration activities
81
Vietnam’s crude oil import, 2010 - 2017
Source: VIRAC, GDVC
Thousand
ton
Source: VIRAC, GDVC
Global crude oil import structure by output, 2017
Million
USD

3. The petroleum industry in Vietnam
3.4 Current situation - 3.4.1 Upstream - seeking and exploration activities
82
• According to preliminary figures taken from the General Department of
customs, Vietnam’s natural gas export reached 178.2 million, an increase of
43% compared with the previous year.
Vietnam’s natural gas export, 2013-2017
Million USD
Source: VIRAC, GDVC
Top 10 largest natural gas exporters, 2017e
Source: VIRAC, GDVC
Top 10 Vietnam’s largest natural gas importers, 2017e
Source: VIRAC, GDVC
D

3. The petroleum industry in Vietnam
3.4 Current situation - 3.4.1 Upstream - seeking and exploration activities
83
Vietnam’s natural gas import, 2010-2017
Source: VIRAC, GDVC
Source: VIRAC, GDVC
Million
USD
Source: VIRAC, GDVC
Top 10 largest natural gas exporters, 2017e Natural gas importer structure, 2017e
D

84
Oil and gas circulation
3. The petroleum industry in Vietnam
3.4 Current situation -3.4.2 Midstream
Source: VIRAC, PVN

85
Means of crude oil transportation
3. The petroleum industry in Vietnam
3.4 Current situation -3.4.2 Midstream
Source: VIRAC, PVN
Means of transportation Advantages Disadvantages

86
3. The petroleum industry in Vietnam
3.4 Current situation -3.4.2 Midstream

87
3. The petroleum industry in Vietnam
3.4 Current situation -3.4.2 Midstream
Region No. Facility Years of
operationInvestor
Operating
unitLength (km)
Design
capacity
(m3/year)
Gas resource
Gas pipelines
Source: VIRAC, EMC-VPI
88
3. The petroleum industry in Vietnam
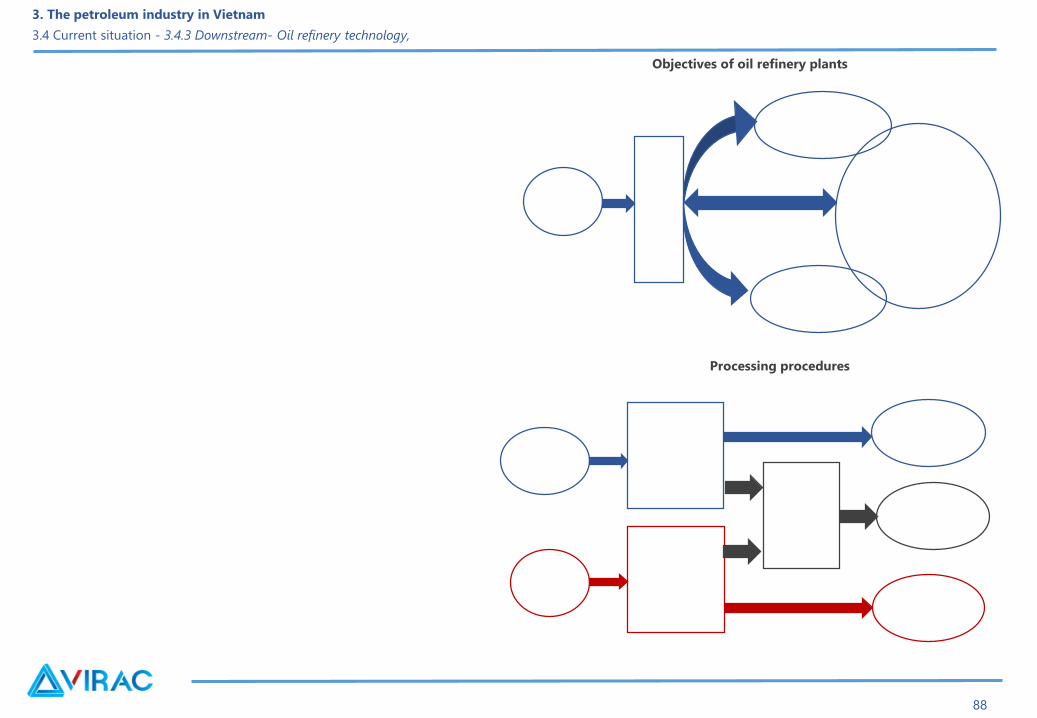
3.4 Current situation - 3.4.3 Downstream- Oil refinery technology,
Processing procedures
Objectives of oil refinery plants

89
Processing procedures
3. The petroleum industry in Vietnam
3.4 Current situation - 3.4.3 Downstream- Oil refinery technology,

90
• Increased distilat products capacity has made oil processing
enterprises deal with residual issues in distillation and a dramatic
downward trend in crude oil markets.
Oil refinery project distribution in Vietnam
Source: VIRAC, MOIT, PVN
3. The petroleum industry in Vietnam
3.4 Current situation - 3.4.3 Downstream- Oil refinery technology,

91
3. The petroleum industry in Vietnam
3.4 Current situation - 3.4.3 Downstream- Oil refinery technology,

92
Downstream segment is mainly state- controlled (except for liquefied gas retail sector).
3. The petroleum industry in Vietnam
3.4 Current situation - 3.4.3 Downstream- Petroleum types
Source: VIRAC, Globalpetroprices
Petroleum management structure

93
• Vietnam's gasoline market, as well as other markets such as fuel oil, kerosene, diesel oil and jetA1, is placed under the state’s supervision for
distribution through a chain of importing/wholesale outlets.
3. The petroleum industry in Vietnam
3.4 Current situation - 3.4.3 Downstream- Petroleum types

94
3. The petroleum industry in Vietnam
3.4 Current situation - 3.4.3 Downstream- Petroleum types
Source: VIRAC, MOIT, PVN
Thousand
ton
Petroleum production by type, 2009-2017

95
3. The petroleum industry in Vietnam
3.4 Current situation - 3.4.3 Downstream- Petroleum types
Source: VIRAC, MOIT, PVN
Gasoline consumption, 2010-6T/2017e
Million tons

96
3. The petroleum industry in Vietnam
3.4 Current situation - 3.4.3 Downstream- Petroleum types
Source: VIRAC, Globalpetroprices
Per capita gasoline consumption in the region as of
8/2016Litre/person/year
Source: VIRAC, EMC-VPI
Fuel demand structure, 2016

97
• Vietnam's gasoline was fluctuant in recent years, with a sharp plunge in
the period 2011-2014 due to the 2012 global economic crisis and a
bounce back in 2015-2016.
3. The petroleum industry in Vietnam
3.4 Current situation - 3.4.3 Downstream- Petroleum types
Source: VIRAC, GDVC
Petroleum production by type, 2010-2017
Million
tons
Million
USD
Gasoline export market structure, 2017
Source: VIRAC, GDVC

98
3. The petroleum industry in Vietnam
3.4 Current situation - 3.4.3 Downstream- Petroleum types
Source: VIRAC, GDVC
Petroleum import by type, 2010-2017
Million
tons
Million
USD
Source: VIRAC, GDVC
Import market structure by value, 2017

99
3. The petroleum industry in Vietnam
3.4 Current situation - 3.4.3 Downstream- Petroleum types
Domestic supply Domestic demand
No. Classification Capacity (ton) Gasoline (ton) Oil (ton) Gasoline (ton) Oil (ton)
Source: Synthesized by
VIRAC
Balance of supply and demand of gasoline market the average Vietnam from 2018 to 2022

100
3. The petroleum industry in Vietnam
3.4 Current situation - 3.4.3 Downstream- Petroleum types
Source: VIRAC, Department of
price management
Domestic petrol price movement, 2015-2017
Source: VIRAC, Department of
price management
Gasoline price adjustments, 2017
Dong/liter
101
3. The petroleum industry in Vietnam
3.4 Current situation - 3.4.3 Downstream- Petroleum types
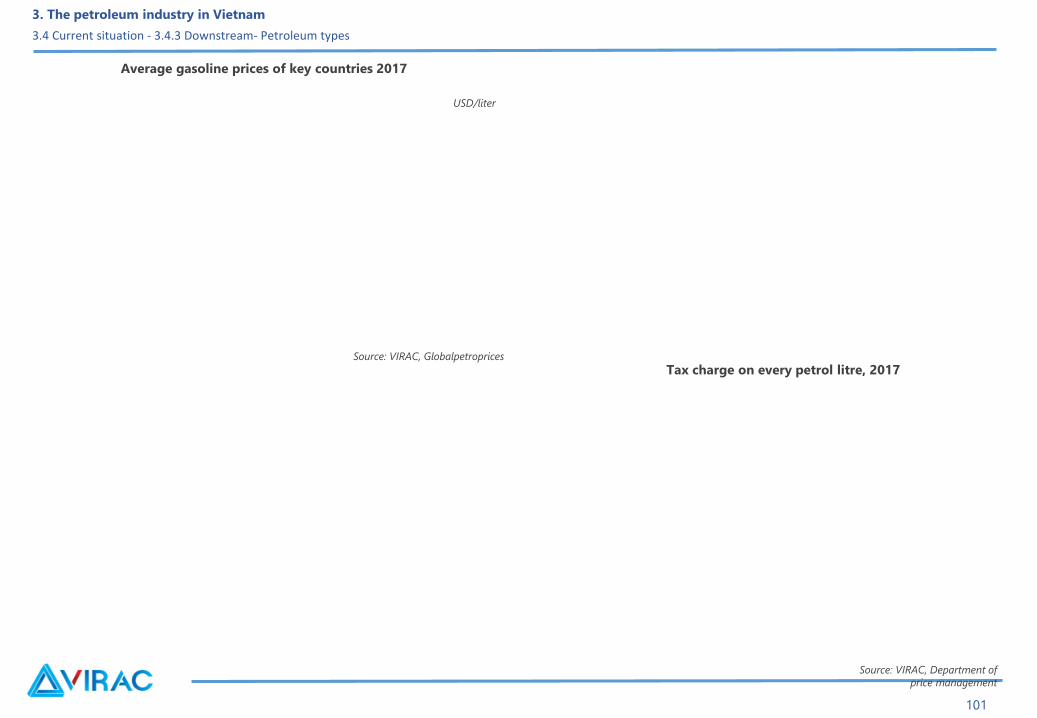
Source: VIRAC, Globalpetroprices
Average gasoline prices of key countries 2017
USD/liter
Source: VIRAC, Department of
price management
Tax charge on every petrol litre, 2017

102
3. The petroleum industry in Vietnam
3.4 Current situation - 3.4.3 Downstream- Petroleum types
Scale of 5 leading petroleum trading units, 2017
Source: VIRAC, Petrolimex Saigon, Petrol, Thalexim, Mipec
Petrolime
xPV oil Thalexim Saigon Petrol Mipec
Market share
Capacity (m3)
Petrol
outlet
Authorized
by
Agency
Business location
Petroleum market structure
2017e

103
3. The petroleum industry in Vietnam
3.4 Current situation - 3.4.3 Downstream- Petroleum types

104
3. The petroleum industry in Vietnam
3.4 Current situation - 3.4.3 Downstream- Petroleum types
Outlet-level Total capacity (m3)

105
3. The petroleum industry in Vietnam
3.4 Current situation - 3.4.3 Downstream- Petroleum types
Petrolimex distribution
Source: Petrolimex
Petrolimex's revenue by distribution channel, 2016

106
3. The petroleum industry in Vietnam
3.4 Current situation - 3.4.3 Downstream- Petroleum types
Source: Petrolimex
Vietnam’s petroleum distribution system

107
3. The petroleum industry in Vietnam
3.4 Current situations - 3.4.3 Downstream - Liquefied petroleum gas (LPG)
Source: VIRAC, GSO
LPG production, 2009-2017
Thousand ton

108
3. The petroleum industry in Vietnam
3.4 Current situations - 3.4.3 Downstream - Liquefied petroleum gas (LPG)
Source: VIRAC, PV Gas
Gas production, refinement and distribution
Domestic LPG suppliers
Source: VIRAC, PV Gas

109
3. The petroleum industry in Vietnam
3.4 Current situations - 3.4.3 Downstream - Liquefied petroleum gas (LPG)
Source: Synthesized by VIRAC
LPG consumption, 2009 – 2016
Thousand ton
Source: VIRAC, PVN
LPG consumption structure, 2016

110
3. The petroleum industry in Vietnam
3.4 Current situations - 3.4.3 Downstream - Liquefied petroleum gas (LPG)
Source: VIRAC, GDVC
Import LPG, 2009-2017
Thousand ton
Source: VIRAC, GDVC
LPG import market structure by value, 2017
Million USD

111
3. The petroleum industry in Vietnam
3.4 Current situations - 3.4.3 Downstream - Liquefied petroleum gas (LPG)
LPG storage house
Source: VIRAC, PV Gas
LPG container capacity by region

112
3. The petroleum industry in Vietnam
3.4 Current situations - 3.4.3 Downstream - Liquefied petroleum gas (LPG)
Distribution LPG
Source: VIRAC
LPG distribution channelS

3. The petroleum industry in Vietnam
3.4 Current situations - 3.4.3 Downstream - Liquefied petroleum gas (LPG)
• PV Gas is currently the largest LPG distributor in Vietnam thanks to two branches: Liquefied petroleum gas facilities in the South (PGS) and in the
North (PVG).
LPG retail market, 2015
Source: VIRAC, PV Gas
113

3. The petroleum industry in Vietnam
3.4 Current situation - 3.4.3 Downstream- Oil refinery technology,
Liquefied oil products are chemicals made from natural gas or from intermediary materials of oil refinery plants.
114

Source: VIRAC, GSO
Types of product Input material Main product Customer
3. The petroleum industry in Vietnam
3.4 Current situation - 3.4.3 Downstream- Oil refinery technology,
115

Source: VIRAC, GSO
• Nito compound and fertilizers occupy the largest proportion of the chemical
industry structure.
• Source materials for petrochemical products serving the domestic market
are mainly imported, especially PE and PP.
Thousand ton
Source: VIRAC, MOIT, PVN
Polypropylene supply and demand in Vietnam, 2010-2016e/6T
Product group structure by revenue, 2015
3. The petroleum industry in Vietnam
3.4 Current situation - 3.4.3 Downstream- Oil refinery technology,
116

4. Risks
4.1 Risks
4.2 SWOT analysis
117

4. Risks
4.1 Risks
The oil and gas industry plays an important role in Vietnam's economy. Featured with natural resource extraction activities, the sector is strongly
influenced by political factors and natural conditions.
118
Geological risk
119
4. Risks
4.1 Risks

Legal risks
Economic risks
120
4. Risks
4.1 Risks
Pricing risks
Supply-demand risks
Cost risks

121
4. Risks
4.1 Risks
Risk of petroleum items

4. Risks
4.1 Risks
4.2 SWOT analysis
122

S WO T
123
4. Risks
4.1 SWOT analysis

5. Prospect, planning and prediction
5.1 Planning
5.2 Prediction
124

5. Prospect, planning and prediction
5.1 Planning
125

5. Prospect, planning and prediction
5.1 Planning
126

127
5. Prospect, planning and prediction
5.1 Planning

128
4. The sector’s directory of major investment projects.
▪ The period 2016 – 2025:
No. Pipe name Launching timeExpected capacity
(billion m3/year)Length (km) Diameter (inch)
5. Prospect, planning and prediction
5.1 Planning

129
▪ The period 2026 – 2035:
No. Pipe name Launching timeExpected capacity
(billion m3/year)Length (km) Diameter (inch)
5. Prospect, planning and prediction
5.1 Planning

130
❖ The central region.
▪ The period 2016 – 2025:
No.Facility
Launching timeExpected capacity
(billion m3/year)Length (km) Diameter (inch)
5. Prospect, planning and prediction
5.1 Planning

131
▪ The period 2026 – 2035:
No. Facility Launching timeExpected capacity
(billion m3/year)Length (km) Diameter (inch)
5. Prospect, planning and prediction
5.1 Planning

132
❖ Southeast
▪ The period 2016 – 2025:
No. Pipe name Launching timeExpected capacity
(billion m3/year)Length (km) Diameter (inch)
5. Prospect, planning and prediction
5.1 Planning
133
❖ The southeast area
❖ The period 2016 – 2025:
No. Pipe name Launching timeExpected capacity
(billion m3/year)Length (km) Diameter (inch)
5. Prospect, planning and prediction
5.1 Planning
134
• The period 2026 – 2035:
No. Pipe name Launching timeExpected capacity
(billion m3/year)Length (km) Diameter (inch)
5. Prospect, planning and prediction
5.1 Planning

135
❖ The southwest area.
No. Facility Launching timeExpected capacity
(billion m3/year)Length (km) Diameter (inch)
5. Prospect, planning and prediction
5.1 Planning

136
b) LNG import projects
• The period 2016 – 2025:
No. Facility Launching timeCapacity ( million
tons/year)Length (km) Diameter (inch)
5. Prospect, planning and prediction
5.1 Planning

137
• The period 2026 – 2035:
No. Facility Launching timeCapacity ( million
tons/year)Length (km) Diameter (inch)
5. Prospect, planning and prediction
5.1 Planning

138
c) LPG storage system.
• The period 2016 – 2020:
Region Province/city Location Capacity (ton) Forms of investment
5. Prospect, planning and prediction
5.1 Planning

139
• The period 2021- 2025:
Region Province/city Location Capacity (ton) Form
5. Prospect, planning and prediction
5.1 Planning

140
• The period 2026- 2035:
Region Province/city Location Capacity (ton)Forms (newly-
built/expanded)
5. Prospect, planning and prediction
5.1 Planning

Source: VIRAC, MOIT, PVNSource: VIRAC, MOIT,
PVN
5. Prospect, planning and prediction
5.1 Planning
Capital investment needs by region, 2016-2025 Capital investment needs by region, 2026-2035
141
5. Capital investment needs.

142
6. Solution:
a) Organizational management (policy mechanisms, model)
b) Investment solutions.
c) Financial and capital arrangement.
d) Market solutions.
5. Prospect, planning and prediction
5.1 Planning

143
e) Scientific and technological solutions.
f) Human resource development.
g) Safety, environmental and sustainable development.
h) National defense and security.
5. Prospect, planning and prediction
5.1 Planning

144
1. Development vision.
a2. LPG production and distribution system planning
a) LPG production system planning
The period 2014-2020:
5. Prospect, planning and prediction
5.1 Planning

145
❖ The period 2021-2030:
❖ The period 2021-2030:
5. Prospect, planning and prediction
5.1 Planning

146
❖ The period 2014-2020P:
❖ The period 2021-2030:
❖ The period 2014-2020:
❖ The period 2021-2030:
5. Prospect, planning and prediction
5.1 Planning

5. Prospect, planning and prediction
5.1 Planning
5.2 Prediction
147

148
Oil industry prospects
❖ Supply-demand
5. Prospect, planning and prediction
5.2 Prospect
Source: VIRAC, OPEC
Supply and demand balance, 2017-2018fMillion barrels/day
149
Tri
llio
n s
qu
are
feet
Increasing natural gas production by country,
2016-2040fTrillion square feet
Source: VIRAC, EIA
Global natural gas consumption, 2016-2040f
Source: VIRAC, EIA
5. Prospect, planning and prediction
5.2 Prediction

150
❖ Oil prices
❖ Domestic activities
5. Prospect, planning and prediction
5.2 Prospect
Target 2017 Prediction towards 2018
PVN mining plan 2018
Source: VIRAC, PVN
Tonne of oil equivalent

151
Currently, the oil and gas industry in Vietnam is comprised of
mainly young enterprises that cannot meet domestic demand.
Vietnam’s oil supply-demand forecast, 2014-2025
Vietnam’s gas supply-demand forecast, 2014-
2020
Source: VIRAC, IOP
Source: VIRAC, IOP
Million
barrels/day
Thousand ton
5. Prospect, planning and prediction
5.2 Prediction

152
5. Prospect, planning and prediction
5.2 Prediction
Gas industry prospects
❖ Domestic activities:
Currently, Vietnam’s natural gas exploitation is facing many difficulties because reserves are on the verge of exhaustion.
6. Enterprise analysis
6.1 Enterprise introduction
6.2 Financial analysis
153

154
6. Enterprise analysis
6.1 Enterprise introduction
Vietnam’s petroleum industry structure
Source: VIRAC

155
6. Enterprise analysis
6.1 Enterprise introduction
Vietnam petroleum industry is governed by the Vietnam national oil and gas group (PVN),
Key companies
Vietnam Oil and Gas Group

156
6. Enterprise analysis
6.1 Enterprise introduction
Source: VIRAC, PVN
Thousand billion
VND
PVN’s revenue, 2010-2016

157
6. Enterprise analysis
6.1 Enterprise introduction
Vietnam petroleum group.

158
6. Enterprise analysis
6.1 Enterprise introduction
Regarding petroleum aspect, Petrolimex continues its dominant role on the domestic market with approximately 50% of market share.
Source: Petrolimex
Petrolimex’s revenue, 2011-2016Thousand billion
VND

159
6. Enterprise analysis
6.1 Enterprise introduction
Other companies
PetroVietnam Drilling and Well Service Corporation
160
6. Enterprise analysis
6.1 Enterprise introduction
PetroVietnam Exploration Production Corporation Ltd.

161
6. Enterprise analysis
6.1 Enterprise introduction
PetroVietnam Gas Joint Stock Corporation

162162162
6. Enterprise analysis
6.1 Enterprise introduction
A glimpse of Binh Son Refining and Petrochemical Company Limited

163
6. Enterprise analysis
6.1 Enterprise introduction
Petrovietnam Oil Corporation

164
6. Enterprise analysis
6.1 Enterprise introduction
Ho Chi Minh City One-Member Limited Liability Oil & Gas Company
165
6. Enterprise analysis
6.1 Enterprise introduction
Vietnam Air Petrol Company Ltd

166
6. Enterprise analysis
6.1 Enterprise introduction
Dong Thap Petroleum Trading Import Export Company Limited

160
6. Enterprise analysis
6.1 Enterprise introduction
6.2 Financial analysis
168
6. Enterprise analysis
6.1 Enterprise introduction - Profitability
Source: VIRAC
Revenue growth, 2015-2016
Thousand billion
VND

169
6. Enterprise analysis
6.1 Enterprise introduction - Profitability

170
6. Enterprise analysis
6.1 Enterprise introduction - Profitability
Source: VIRAC
Gross profit growth, 2015-2016Thousand billion
VND
171
6. Enterprise analysis
6.1 Enterprise introduction - Profitability
Gross profit margin 2016
Source: VIRAC
Thousand billion
VND

172
6. Enterprise analysis
6.1 Enterprise introduction - Profitability
Solvency capacity, 2016
Source: VIRAC
173
6. Enterprise analysis
6.1 Enterprise introduction - Profitability
Turnover ratio of receivables, 2016
Source: VIRAC

174
Solvency capacity, 2016
Times
Source: VIRAC
6. Enterprise analysis
6.1 Enterprise introduction - Solvency

175
Total asset turnover ratio, 2016
Times
Source: VIRAC
Fixed asset turnover coefficient, 2016
Source: VIRAC
Times
6. Enterprise analysis
6.1 Enterprise introduction - Operating efficiency

176
Gross profit margin 2015
Source: VIRAC
6. Enterprise analysis
6.1 Enterprise introduction - Profitability rate
Recommendation
Recommended use
This report is made Vietnam Industry Research and Consultancy (VIRAC), providing only the industry overview and business analysis. All information, statements
and projections are based on reliable sources with ultimate prudence as of the time of writing. However, due to subjective and objective reasons in terms of
published formation sources, VIRAC does not guarantee or bear any responsibility for information accuracy and no liability for damages on using this report
partly or wholly. All viewpoints and statements in this report are subjected to changes without notice. This publication is protected by copyright owned by
Vietnam Industry Research and Consultancy (VIRAC). Copying, modifying and printing without permission are strictly prohibited.
Please contact us for more details:
VIETNAM INDUSTRY RESEARCH AND CONSULTANCY
Floor 6, Anh Minh Building, 36 Hoang Cau Street, O Cho Dua Ward, Dong Da District, Hanoi
Email: [email protected] | Phone: +84 463289520
181

Thank you !