Vietnam Enterprise Investments Initiation of coverage · Vietnam Enterprise Investments is a ......
14
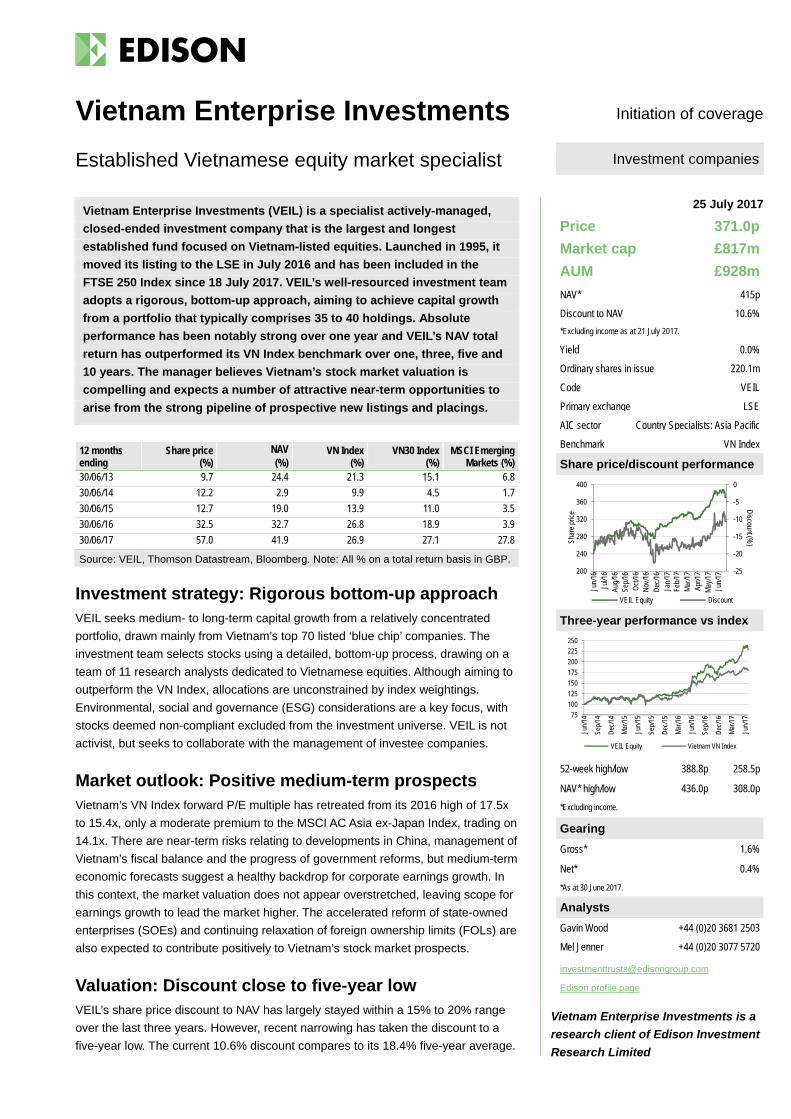
25 July 2017 Initiation of coverage Vietnam Enterprise Investments (VEIL) is a specialist actively-managed, closed-ended investment company that is the largest and longest established fund focused on Vietnam-listed equities. Launched in 1995, it moved its listing to the LSE in July 2016 and has been included in the FTSE 250 Index since 18 July 2017. VEIL’s well-resourced investment team adopts a rigorous, bottom-up approach, aiming to achieve capital growth from a portfolio that typically comprises 35 to 40 holdings. Absolute performance has been notably strong over one year and VEIL’s NAV total return has outperformed its VN Index benchmark over one, three, five and 10 years. The manager believes Vietnam’s stock market valuation is compelling and expects a number of attractive near-term opportunities to arise from the strong pipeline of prospective new listings and placings. 12 months ending Share price (%) NAV (%) VN Index (%) VN30 Index (%) MSCI Emerging Markets (%) 30/06/13 9.7 24.4 21.3 15.1 6.8 30/06/14 12.2 2.9 9.9 4.5 1.7 30/06/15 12.7 19.0 13.9 11.0 3.5 30/06/16 32.5 32.7 26.8 18.9 3.9 30/06/17 57.0 41.9 26.9 27.1 27.8 Source: VEIL, Thomson Datastream, Bloomberg. Note: All % on a total return basis in GBP. Investment strategy: Rigorous bottom-up approach VEIL seeks medium- to long-term capital growth from a relatively concentrated portfolio, drawn mainly from Vietnam’s top 70 listed ‘blue chip’ companies. The investment team selects stocks using a detailed, bottom-up process, drawing on a team of 11 research analysts dedicated to Vietnamese equities. Although aiming to outperform the VN Index, allocations are unconstrained by index weightings. Environmental, social and governance (ESG) considerations are a key focus, with stocks deemed non-compliant excluded from the investment universe. VEIL is not activist, but seeks to collaborate with the management of investee companies. Market outlook: Positive medium-term prospects Vietnam’s VN Index forward P/E multiple has retreated from its 2016 high of 17.5x to 15.4x, only a moderate premium to the MSCI AC Asia ex-Japan Index, trading on 14.1x. There are near-term risks relating to developments in China, management of Vietnam’s fiscal balance and the progress of government reforms, but medium-term economic forecasts suggest a healthy backdrop for corporate earnings growth. In this context, the market valuation does not appear overstretched, leaving scope for earnings growth to lead the market higher. The accelerated reform of state-owned enterprises (SOEs) and continuing relaxation of foreign ownership limits (FOLs) are also expected to contribute positively to Vietnam’s stock market prospects. Valuation: Discount close to five-year low VEIL’s share price discount to NAV has largely stayed within a 15% to 20% range over the last three years. However, recent narrowing has taken the discount to a five-year low. The current 10.6% discount compares to its 18.4% five-year average. Vietnam Enterprise Investments Established Vietnamese equity market specialist Price 371.0p Market cap £817m AUM £928m NAV* 415p Discount to NAV 10.6% *Excluding income as at 21 July 2017. Yield 0.0% Ordinary shares in issue 220.1m Code VEIL Primary exchange LSE AIC sector Country Specialists: Asia Pacific Benchmark VN Index Share price/discount performance Three-year performance vs index 52-week high/low 388.8p 258.5p NAV* high/low 436.0p 308.0p *Excluding income. Gearing Gross* 1.6% Net* 0.4% *As at 30 June 2017. Analysts Gavin Wood +44 (0)20 3681 2503 Mel Jenner +44 (0)20 3077 5720 [email protected] Edison profile page Investment companies -25 -20 -15 -10 -5 0 200 240 280 320 360 400 Jun/16 Jul/16 Aug/16 Sep/16 Oct/16 Nov/16 Dec/16 Jan/17 Feb/17 Mar/17 Apr/17 May/17 Jun/17 Discount (%) Share price VEIL Equity Discount 75 100 125 150 175 200 225 250 Jun/14 Sep/14 Dec/14 Mar/15 Jun/15 Sep/15 Dec/15 Mar/16 Jun/16 Sep/16 Dec/16 Mar/17 Jun/17 VEIL Equity Vietnam VN Index Vietnam Enterprise Investments is a research client of Edison Investment Research Limited
Transcript of Vietnam Enterprise Investments Initiation of coverage · Vietnam Enterprise Investments is a ......
25 July 2017
Initiation of coverage
Vietnam Enterprise Investments (VEIL) is a specialist actively-managed,
closed-ended investment company that is the largest and longest
established fund focused on Vietnam-listed equities. Launched in 1995, it
moved its listing to the LSE in July 2016 and has been included in the
FTSE 250 Index since 18 July 2017. VEIL’s well-resourced investment team
adopts a rigorous, bottom-up approach, aiming to achieve capital growth
from a portfolio that typically comprises 35 to 40 holdings. Absolute
performance has been notably strong over one year and VEIL’s NAV total
return has outperformed its VN Index benchmark over one, three, five and
10 years. The manager believes Vietnam’s stock market valuation is
compelling and expects a number of attractive near-term opportunities to
arise from the strong pipeline of prospective new listings and placings.
12 months ending
Share price (%)
NAV (%)
VN Index (%)
VN30 Index (%)
MSCI Emerging Markets (%)
30/06/13 9.7 24.4 21.3 15.1 6.8
30/06/14 12.2 2.9 9.9 4.5 1.7
30/06/15 12.7 19.0 13.9 11.0 3.5
30/06/16 32.5 32.7 26.8 18.9 3.9
30/06/17 57.0 41.9 26.9 27.1 27.8
Source: VEIL, Thomson Datastream, Bloomberg. Note: All % on a total return basis in GBP.
Investment strategy: Rigorous bottom-up approach VEIL seeks medium- to long-term capital growth from a relatively concentrated
portfolio, drawn mainly from Vietnam’s top 70 listed ‘blue chip’ companies. The
investment team selects stocks using a detailed, bottom-up process, drawing on a
team of 11 research analysts dedicated to Vietnamese equities. Although aiming to
outperform the VN Index, allocations are unconstrained by index weightings.
Environmental, social and governance (ESG) considerations are a key focus, with
stocks deemed non-compliant excluded from the investment universe. VEIL is not
activist, but seeks to collaborate with the management of investee companies.
Market outlook: Positive medium-term prospects Vietnam’s VN Index forward P/E multiple has retreated from its 2016 high of 17.5x
to 15.4x, only a moderate premium to the MSCI AC Asia ex-Japan Index, trading on
14.1x. There are near-term risks relating to developments in China, management of
Vietnam’s fiscal balance and the progress of government reforms, but medium-term
economic forecasts suggest a healthy backdrop for corporate earnings growth. In
this context, the market valuation does not appear overstretched, leaving scope for
earnings growth to lead the market higher. The accelerated reform of state-owned
enterprises (SOEs) and continuing relaxation of foreign ownership limits (FOLs) are
also expected to contribute positively to Vietnam’s stock market prospects.
Valuation: Discount close to five-year low VEIL’s share price discount to NAV has largely stayed within a 15% to 20% range
over the last three years. However, recent narrowing has taken the discount to a
five-year low. The current 10.6% discount compares to its 18.4% five-year average.
Vietnam Enterprise Investments
Established Vietnamese equity market specialist
Price 371.0p
Market cap £817m
AUM £928m
NAV* 415p
Discount to NAV 10.6%
*Excluding income as at 21 July 2017.
Yield 0.0%
Ordinary shares in issue 220.1m
Code VEIL
Primary exchange LSE
AIC sector Country Specialists: Asia Pacific
Benchmark VN Index
Share price/discount performance
Three-year performance vs index
52-week high/low 388.8p 258.5p
NAV* high/low 436.0p 308.0p
*Excluding income.
Gearing
Gross* 1.6%
Net* 0.4%
*As at 30 June 2017.
Analysts
Gavin Wood +44 (0)20 3681 2503
Mel Jenner +44 (0)20 3077 5720
Edison profile page
Investment companies
-25
-20
-15
-10
-5
0
200
240
280
320
360
400
Jun/
16Ju
l/16
Aug/
16Se
p/16
Oct
/16
Nov
/16
Dec
/16
Jan/
17Fe
b/17
Mar
/17
Apr/1
7M
ay/1
7Ju
n/17
Discount (%
)Shar
e pr
ice
VEIL Equity Discount
75
100
125
150
175
200
225
250
Jun/
14
Sep/
14
Dec
/14
Mar
/15
Jun/
15
Sep/
15
Dec
/15
Mar
/16
Jun/
16
Sep/
16
Dec
/16
Mar
/17
Jun/
17VEIL Equity Vietnam VN Index
Vietnam Enterprise Investments is a
research client of Edison Investment
Research Limited

Vietnam Enterprise Investments | 25 July 2017 2
Exhibit 1: Company at a glance
Investment objective and fund background Recent developments VEIL’s investment objective is to achieve medium- to long-term capital growth by investing in the equity securities of companies primarily operating in, or with significant exposure to, Vietnam. VEIL adopts a bottom-up approach to investment selection and does not set portfolio allocations with reference to index weightings. The VN Index is used as a performance benchmark, which VEIL seeks to outperform on a rolling three-year basis.
18 July 2017: VEIL’s ordinary shares included in the FTSE 250 Index. 14 July 2017: New tiered annual management fee from 1 August 2017 – 2.00% on
net assets up to US$1.25bn; 1.75% up to US$1.50bn; 1.50% above US$1.50bn. 20 April 2017: Annual results to 31 December 2016 – NAV total return +46.5% in
sterling terms versus +39.7% for the VN Index. 17 February 2017: New share buyback programme commenced as part of VEIL’s
active discount management policy.
Forthcoming Capital structure Fund details AGM June 2018 Total expense ratio 2.16% (see page 11) Group Dragon Capital Interim results September 2017 Net gearing 0.4% Manager Vu Huu Dien Year end 31 December Annual mgmt fee Tiered: 2.00%;1.75%;1.50% of
net assets Address PO Box 309, Ugland House,
Grand Cayman, KY1‐1104 Cayman Islands Dividend paid N/A Performance fee None
Launch date 11 August 1995 Company life Indefinite Phone +84 8 3823 9355 Continuation vote None Loan facilities US$40m credit facility Website www.veil-dragoncapital.com
Dividend policy and history (financial years) Share buyback policy and history (financial years) VEIL’s investment objective is to achieve capital growth and there is currently no intention to pay a regular dividend.
VEIL has annually renewed authority to repurchase up to 14.99% of its issued capital. A new share buyback programme was initiated in February 2017.
Shareholder base (as at 24 July 2017) Portfolio exposure by sector (as at 30 June 2017)
Top 10 holdings (as at 30 June 2017)
Portfolio weight % VN Index weight %
Company Sector First invested 30 June 2017 30 June 2016* 30 June 2017**
Vinamilk Food & beverages October 2003 12.5 18.8 12.2 Mobile World Retail October 2014 7.6 2.4 1.7 Military Bank Banks March 2010 6.9 6.2 2.0 Asia Commercial Bank Banks December 1996 5.9 5.5 N/A FPT Corp Technology March 2008 5.8 6.0 1.2 Hoa Phat Group Materials & resources June 2009 4.4 6.7 2.2 Vietjet Air Transport December 2016 4.3 N/A 2.2 PV Gas Energy November 2010 4.1 5.6 5.9 Khang Dien House Real estate November 2013 3.7 3.6 0.4 ACV Transport December 2015 3.4 2.8 N/A Top 10 at each date 58.6 63.1 55.8
Source: VEIL, Edison Investment Research, Bloomberg, Thomson Reuters. Note: *N/A where not in June 2016 portfolio. **N/A where not a constituent of the VN Index.
0.0
0.2
0.4
0.6
0.8
1.0
2016
2015
2014
2013
2012
2011
DPS
(p)
Full year dividend payment Special dividends
0
5
10
15
20
25
2011
2012
2013
2014
2015
2016
2017
Cos
ts/p
roce
eds
(£m
)
Repurchases Allotments
Gates Foundation Trust (11.4%)
Skagen (4.1%)
BlackRock (2.1%)
Dragon Capital (1.7%)
Schroders (1.6%)
Baillie Gifford (1.4%)
Union Investment (1.4%)
Charlemagne Capital (1.0%)
Other (75.3%)
Real estate (16.7%)
Banks (16.5%)
Food & beverage (15.3%)
Materials & resources (10.8%)
Transportation (8.0%)
Retail (7.6%)
Energy (6.0%)
Software & services (5.8%)
Diversified financials (4.5%)
Other sectors (8.8%)
Vietnam Enterprise Investments | 25 July 2017 3
Market outlook: Robust medium-term growth expected
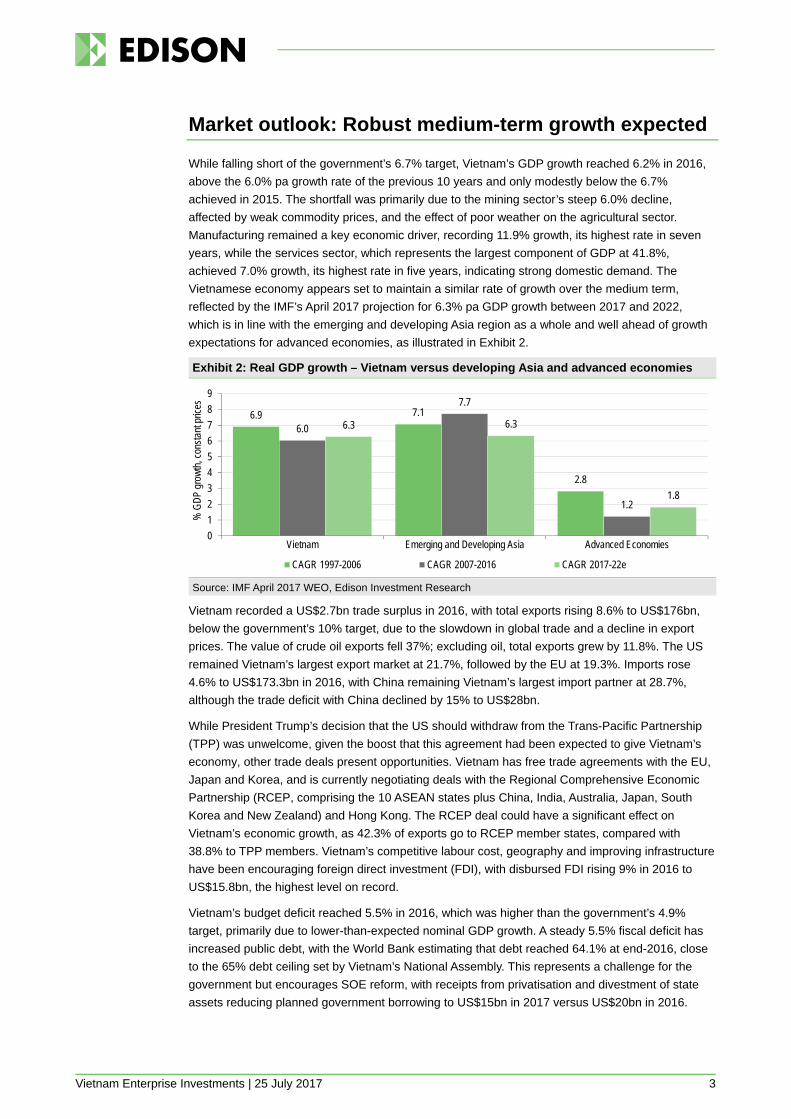
While falling short of the government’s 6.7% target, Vietnam’s GDP growth reached 6.2% in 2016,
above the 6.0% pa growth rate of the previous 10 years and only modestly below the 6.7%
achieved in 2015. The shortfall was primarily due to the mining sector’s steep 6.0% decline,
affected by weak commodity prices, and the effect of poor weather on the agricultural sector.
Manufacturing remained a key economic driver, recording 11.9% growth, its highest rate in seven
years, while the services sector, which represents the largest component of GDP at 41.8%,
achieved 7.0% growth, its highest rate in five years, indicating strong domestic demand. The
Vietnamese economy appears set to maintain a similar rate of growth over the medium term,
reflected by the IMF’s April 2017 projection for 6.3% pa GDP growth between 2017 and 2022,
which is in line with the emerging and developing Asia region as a whole and well ahead of growth
expectations for advanced economies, as illustrated in Exhibit 2.
Exhibit 2: Real GDP growth – Vietnam versus developing Asia and advanced economies
Source: IMF April 2017 WEO, Edison Investment Research
Vietnam recorded a US$2.7bn trade surplus in 2016, with total exports rising 8.6% to US$176bn,
below the government’s 10% target, due to the slowdown in global trade and a decline in export
prices. The value of crude oil exports fell 37%; excluding oil, total exports grew by 11.8%. The US
remained Vietnam’s largest export market at 21.7%, followed by the EU at 19.3%. Imports rose
4.6% to US$173.3bn in 2016, with China remaining Vietnam’s largest import partner at 28.7%,
although the trade deficit with China declined by 15% to US$28bn.
While President Trump’s decision that the US should withdraw from the Trans-Pacific Partnership
(TPP) was unwelcome, given the boost that this agreement had been expected to give Vietnam’s
economy, other trade deals present opportunities. Vietnam has free trade agreements with the EU,
Japan and Korea, and is currently negotiating deals with the Regional Comprehensive Economic
Partnership (RCEP, comprising the 10 ASEAN states plus China, India, Australia, Japan, South
Korea and New Zealand) and Hong Kong. The RCEP deal could have a significant effect on
Vietnam’s economic growth, as 42.3% of exports go to RCEP member states, compared with
38.8% to TPP members. Vietnam’s competitive labour cost, geography and improving infrastructure
have been encouraging foreign direct investment (FDI), with disbursed FDI rising 9% in 2016 to
US$15.8bn, the highest level on record.
Vietnam’s budget deficit reached 5.5% in 2016, which was higher than the government’s 4.9%
target, primarily due to lower-than-expected nominal GDP growth. A steady 5.5% fiscal deficit has
increased public debt, with the World Bank estimating that debt reached 64.1% at end-2016, close
to the 65% debt ceiling set by Vietnam’s National Assembly. This represents a challenge for the
government but encourages SOE reform, with receipts from privatisation and divestment of state
assets reducing planned government borrowing to US$15bn in 2017 versus US$20bn in 2016.
6.9 7.1
2.8
6.0
7.7
1.2
6.3 6.3
1.8
0
1
2
3
4
5
6
7
8
9
Vietnam Emerging and Developing Asia Advanced Economies
% G
DP
grow
th, c
onst
ant p
rices
CAGR 1997-2006 CAGR 2007-2016 CAGR 2017-22e
Vietnam Enterprise Investments | 25 July 2017 4
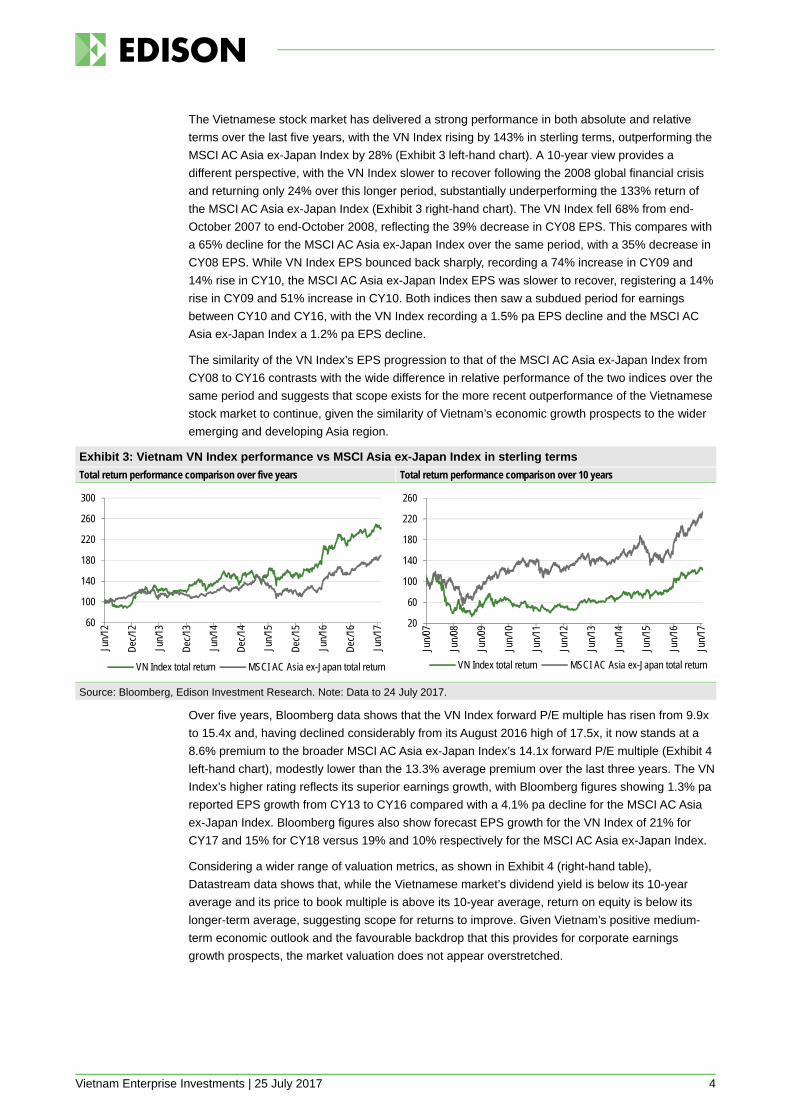
The Vietnamese stock market has delivered a strong performance in both absolute and relative
terms over the last five years, with the VN Index rising by 143% in sterling terms, outperforming the
MSCI AC Asia ex-Japan Index by 28% (Exhibit 3 left-hand chart). A 10-year view provides a
different perspective, with the VN Index slower to recover following the 2008 global financial crisis
and returning only 24% over this longer period, substantially underperforming the 133% return of
the MSCI AC Asia ex-Japan Index (Exhibit 3 right-hand chart). The VN Index fell 68% from end-
October 2007 to end-October 2008, reflecting the 39% decrease in CY08 EPS. This compares with
a 65% decline for the MSCI AC Asia ex-Japan Index over the same period, with a 35% decrease in
CY08 EPS. While VN Index EPS bounced back sharply, recording a 74% increase in CY09 and
14% rise in CY10, the MSCI AC Asia ex-Japan Index EPS was slower to recover, registering a 14%
rise in CY09 and 51% increase in CY10. Both indices then saw a subdued period for earnings
between CY10 and CY16, with the VN Index recording a 1.5% pa EPS decline and the MSCI AC
Asia ex-Japan Index a 1.2% pa EPS decline.
The similarity of the VN Index’s EPS progression to that of the MSCI AC Asia ex-Japan Index from
CY08 to CY16 contrasts with the wide difference in relative performance of the two indices over the
same period and suggests that scope exists for the more recent outperformance of the Vietnamese
stock market to continue, given the similarity of Vietnam’s economic growth prospects to the wider
emerging and developing Asia region.
Exhibit 3: Vietnam VN Index performance vs MSCI Asia ex-Japan Index in sterling terms
Total return performance comparison over five years Total return performance comparison over 10 years
Source: Bloomberg, Edison Investment Research. Note: Data to 24 July 2017.
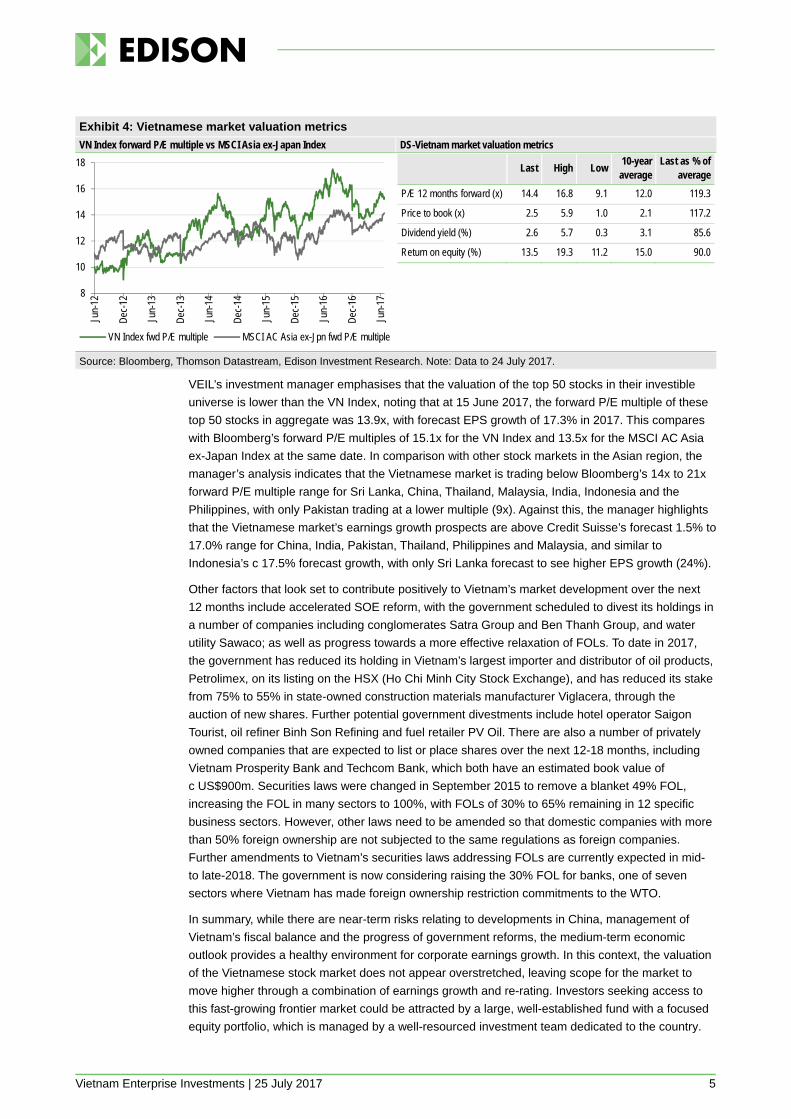
Over five years, Bloomberg data shows that the VN Index forward P/E multiple has risen from 9.9x
to 15.4x and, having declined considerably from its August 2016 high of 17.5x, it now stands at a
8.6% premium to the broader MSCI AC Asia ex-Japan Index’s 14.1x forward P/E multiple (Exhibit 4
left-hand chart), modestly lower than the 13.3% average premium over the last three years. The VN
Index’s higher rating reflects its superior earnings growth, with Bloomberg figures showing 1.3% pa
reported EPS growth from CY13 to CY16 compared with a 4.1% pa decline for the MSCI AC Asia
ex-Japan Index. Bloomberg figures also show forecast EPS growth for the VN Index of 21% for
CY17 and 15% for CY18 versus 19% and 10% respectively for the MSCI AC Asia ex-Japan Index.
Considering a wider range of valuation metrics, as shown in Exhibit 4 (right-hand table),
Datastream data shows that, while the Vietnamese market’s dividend yield is below its 10-year
average and its price to book multiple is above its 10-year average, return on equity is below its
longer-term average, suggesting scope for returns to improve. Given Vietnam’s positive medium-
term economic outlook and the favourable backdrop that this provides for corporate earnings
growth prospects, the market valuation does not appear overstretched.
60
100
140
180
220
260
300
Jun/
12
Dec
/12
Jun/
13
Dec
/13
Jun/
14
Dec
/14
Jun/
15
Dec
/15
Jun/
16
Dec
/16
Jun/
17
VN Index total return MSCI AC Asia ex-Japan total return
20
60
100
140
180
220
260
Jun/
07
Jun/
08
Jun/
09
Jun/
10
Jun/
11
Jun/
12
Jun/
13
Jun/
14
Jun/
15
Jun/
16
Jun/
17
VN Index total return MSCI AC Asia ex-Japan total return
Vietnam Enterprise Investments | 25 July 2017 5
Exhibit 4: Vietnamese market valuation metrics
VN Index forward P/E multiple vs MSCI Asia ex-Japan Index DS-Vietnam market valuation metrics
Last High Low 10-year average
Last as % of average
P/E 12 months forward (x) 14.4 16.8 9.1 12.0 119.3
Price to book (x) 2.5 5.9 1.0 2.1 117.2
Dividend yield (%) 2.6 5.7 0.3 3.1 85.6
Return on equity (%) 13.5 19.3 11.2 15.0 90.0
Source: Bloomberg, Thomson Datastream, Edison Investment Research. Note: Data to 24 July 2017.
VEIL’s investment manager emphasises that the valuation of the top 50 stocks in their investible
universe is lower than the VN Index, noting that at 15 June 2017, the forward P/E multiple of these
top 50 stocks in aggregate was 13.9x, with forecast EPS growth of 17.3% in 2017. This compares
with Bloomberg’s forward P/E multiples of 15.1x for the VN Index and 13.5x for the MSCI AC Asia
ex-Japan Index at the same date. In comparison with other stock markets in the Asian region, the
manager’s analysis indicates that the Vietnamese market is trading below Bloomberg’s 14x to 21x
forward P/E multiple range for Sri Lanka, China, Thailand, Malaysia, India, Indonesia and the
Philippines, with only Pakistan trading at a lower multiple (9x). Against this, the manager highlights
that the Vietnamese market’s earnings growth prospects are above Credit Suisse’s forecast 1.5% to
17.0% range for China, India, Pakistan, Thailand, Philippines and Malaysia, and similar to
Indonesia’s c 17.5% forecast growth, with only Sri Lanka forecast to see higher EPS growth (24%).
Other factors that look set to contribute positively to Vietnam’s market development over the next
12 months include accelerated SOE reform, with the government scheduled to divest its holdings in
a number of companies including conglomerates Satra Group and Ben Thanh Group, and water
utility Sawaco; as well as progress towards a more effective relaxation of FOLs. To date in 2017,
the government has reduced its holding in Vietnam’s largest importer and distributor of oil products,
Petrolimex, on its listing on the HSX (Ho Chi Minh City Stock Exchange), and has reduced its stake
from 75% to 55% in state-owned construction materials manufacturer Viglacera, through the
auction of new shares. Further potential government divestments include hotel operator Saigon
Tourist, oil refiner Binh Son Refining and fuel retailer PV Oil. There are also a number of privately
owned companies that are expected to list or place shares over the next 12-18 months, including
Vietnam Prosperity Bank and Techcom Bank, which both have an estimated book value of
c US$900m. Securities laws were changed in September 2015 to remove a blanket 49% FOL,
increasing the FOL in many sectors to 100%, with FOLs of 30% to 65% remaining in 12 specific
business sectors. However, other laws need to be amended so that domestic companies with more
than 50% foreign ownership are not subjected to the same regulations as foreign companies.
Further amendments to Vietnam’s securities laws addressing FOLs are currently expected in mid-
to late-2018. The government is now considering raising the 30% FOL for banks, one of seven
sectors where Vietnam has made foreign ownership restriction commitments to the WTO.
In summary, while there are near-term risks relating to developments in China, management of
Vietnam’s fiscal balance and the progress of government reforms, the medium-term economic
outlook provides a healthy environment for corporate earnings growth. In this context, the valuation
of the Vietnamese stock market does not appear overstretched, leaving scope for the market to
move higher through a combination of earnings growth and re-rating. Investors seeking access to
this fast-growing frontier market could be attracted by a large, well-established fund with a focused
equity portfolio, which is managed by a well-resourced investment team dedicated to the country.
8
10
12
14
16
18
Jun-
12
Dec
-12
Jun-
13
Dec
-13
Jun-
14
Dec
-14
Jun-
15
Dec
-15
Jun-
16
Dec
-16
Jun-
17
VN Index fwd P/E multiple MSCI AC Asia ex-Jpn fwd P/E multiple

Vietnam Enterprise Investments | 25 July 2017 6
Fund profile: Focused Vietnamese equity portfolio
VEIL is an LSE-listed, closed-ended investment company, incorporated in the Cayman Islands,
which stands as one of the largest and longest established funds focused on Vietnam. In July 2016,
VEIL's shares were admitted to trading on the Main Market of the London Stock Exchange and de-
listed from the Irish Stock Exchange, where they had traded since its launch in August 1995. VEIL’s
shares were included in the FTSE 250 Index as of 18 July 2017.VEIL adopts a value-orientated
investment style, using a research-driven, bottom-up approach to select stocks, and its portfolio is
principally invested in Vietnamese listed companies, which operate businesses that are expected to
benefit from Vietnam’s underlying economic growth drivers. The investment process generally
results in the selection of industry/sector leaders with good corporate governance that the manager
considers are trading at compelling discounts to intrinsic value.
VEIL seeks to outperform the VN Index (a capitalisation-weighted index of all companies listed on
the HSX) on a rolling three-year basis. However, portfolio construction is not constrained by index
weightings and allocations are driven by the bottom-up investment process. While relatively
concentrated, typically comprising 35 to 40 investments, the portfolio is diversified across more than
10 industries. Although primarily invested in HSX-listed companies, VEIL also has significant
exposure (20% of NAV at end-2016) to non-benchmark stocks including pre-IPO and OTC-traded
companies, as well as companies traded on the Hanoi Stock Exchange (HNX) and the Unlisted
Public Companies Market (UPCoM).
VEIL's investment manager is Enterprise Investment Management, a wholly owned subsidiary of
Dragon Capital, which ranks as Vietnam’s leading foreign institutional fund manager, with US$1.7bn
assets under management. Founded in 1994, Dragon Capital is based in Vietnam, with offices in
Thailand, Hong Kong and the UK, and has US$1.6bn invested in listed equities, making it the
largest investor in the Vietnamese stock market after the government. Dragon Capital has acted as
VEIL’s investment manager since its launch in 1995; the current investment management
agreement can be terminated by VEIL giving 24 months’ notice, not to expire earlier than July 2019.
VEIL’s investment team comprises a portfolio manager and two deputy managers, overseen by an
investment advisory committee, which comprises Bill Stoops, CIO, Le Minh Anh, CEO, Dr Le Anh
Tuan, head of research, Gavin Patterson, chief risk officer, and Alex Pasikowski, deputy CEO.
Dominic Scriven, Dragon Capital’s chairman, sits on VEIL’s investment committee as an observer.
Vu Huu Dien has acted as VEIL’s portfolio manager since 2010, having joined Dragon Capital as a
senior analyst in 2000. Ngo Thanh Thao was appointed as a deputy portfolio manager in 2010,
after three years as an analyst at Dragon Capital. In 2017, Bui Minh Tuan, an analyst at Dragon
Capital since 2014, took over as a second deputy portfolio manager from Hoang Thi Hoa, who
assumed other responsibilities after three years in the role. The investment team draws on Dragon
Capital’s wider resources, with all potential investments rigorously screened by Dragon Capital’s in-
house research team, which includes 11 analysts dedicated to Vietnamese equities.
The fund manager: Vu Huu Dien
The manager’s view: Positive economic and market outlook The manager sees the Vietnamese economy getting back on track in 2017 following a weak start,
with 5.1% first quarter GDP growth, citing leading indicators in April pointing to continued economic
strength. In particular, industrial production accelerated to 7.4% from 5.5% in March; foreign direct
and indirect investment remained strong; government investment accelerated; exports grew
strongly; the PMI remained robust above 50; and credit growth recorded the highest increase since
2013. The agricultural sector is recovering and manufacturing and domestic consumption remain
Vietnam Enterprise Investments | 25 July 2017 7
key growth drivers. Since staging a recovery in H116, commodity prices have been relatively
subdued, so an inflationary threat is considered unlikely and foreign exchange rates are expected
to remain broadly stable. Global uncertainties are seen as the biggest risk to Vietnam’s economic
growth prospects but the manager believes Vietnam is in a strong position to face these headwinds,
with the government committed to reform and macroeconomic indicators appearing favourable.
A positive outlook is also seen for the Vietnamese stock market over the remainder of 2017, after
strong momentum in the early part of the year, with the combined market cap of the HSX, HNX and
UPCoM exchanges moving above US$100bn at the end of March, after rising 42% from US$60.6bn
to US$86.0bn in 2016. This growth is being driven by larger-cap company listings, such as
Petrolimex (US$1.2bn), Vietjet Air (US$1.1bn), Vietnam Engine and Agricultural Machinery
(US$845m), PV Oil (US$480m), PV Power (US$1.4bn) and Binh Son Refining (US$1.6bn), as well
as landmark deals such as the state divestment of Sabeco in December 2016, and the likely
forthcoming privatisations of Satra Group (US$3.5bn), Ben Thanh Group, Sawaco and Saigon
Tourist. The manager observes that the high number of completed and prospective larger-cap
company listings in 2017 will markedly change the composition of the VN Index and the top 50
stocks in VEIL’s investible universe. This does not create any particular concerns, as VEIL’s
portfolio allocations are not linked to index weightings, and the manager anticipates that new
listings will include a number of highly attractive investment prospects, potentially representing
once-in-a-decade opportunities.
The manager cites ACV and Vietjet Air as examples of undervalued IPO stocks where VEIL was
able to invest due to its market knowledge and expertise, and continues to pursue this strategy,
hoping to achieve similar results from upcoming IPO listings. In US dollar terms, airport operator
ACV’s shares rose 86.4% from when it started trading on UPCoM in November 2016 to end-2016,
bringing VEIL’s gain to 264% since purchasing the stock in December 2015. In December 2016,
VEIL participated in the pre-IPO and IPO of Vietjet Air, the leading low-cost carrier and the second-
largest airline in Vietnam. The IPO was oversubscribed, attracting strong institutional and retail
investor interest. Both companies have subsequently announced strong 2016 operating results.
The biggest detractor to VEIL’s performance in 2016 was the banks sector, with the manager
attributing the weak performance to very high provisions being made for non-performing loans
(NPLs), driven by sector restructuring, as well as a restrained outlook for credit growth, with banks
facing pressure to raise capital to meet Basel II standards. In addition, market expectations for bank
FOLs to be lifted went unfulfilled, and they remained at 30%. Nonetheless, the portfolio’s banking
exposure outperformed the market in 2016 due to its holdings representing the better performing
stocks, including Vietcombank, ACB and Military Bank. In contrast to 2016, the banks sector surged
in early 2017, with Vietnam’s prime minister giving a clear indication of the government’s intention
to lift bank FOLs and signalling government plans to restructure Vietnam’s five weakest banks.
Sector sentiment was also helped by the lowering of the capital adequacy ratio from 9% to 8% and
a delay in the official implementation of Basel II capital requirements until 2020. ACB outperformed
after its chairman indicated it would resolve its troubled legacy asset issues during 2017, while
Military Bank announced a change in key management, leading to expectations that a focus on
improving productivity will drive strong earnings growth, which was already seen in Q117 results.
Commenting on the outlook for the balance of 2017, the manager highlights that, in aggregate, the
top 50 stocks in VEIL’s investible universe are forecast to deliver 16.3% EPS growth over the year,
while trading at an average forward earnings multiple of 13.0x which, in his view, gives Vietnamese
stocks one of the most compelling growth/valuation metrics in the region. He notes that VEIL’s top
10 holdings in aggregate are trading on a forward P/E multiple of 13.6x and are forecast to deliver
20.6% EPS growth, representing a more attractive PEG (P/E multiple:growth) ratio. Additionally, the
manager points to the superior 2.8% prospective yield of VEIL’s top 10 holdings, compared with the
2.6% prospective yield of the top 50 stock universe.

Vietnam Enterprise Investments | 25 July 2017 8
Asset allocation
Investment strategy: Focused on Vietnamese listed equities VEIL’s investment objective is to achieve medium- to long-term capital appreciation of its assets by
investing in a relatively concentrated portfolio, typically comprising 35 to 40 investments in
companies primarily operating in, or with significant exposure to Vietnam. The majority of VEIL’s
portfolio is invested in Vietnam’s top 70 listed ‘blue chip’ companies, with market caps generally
down to a cut-off of US$200m, but the investment team is expanding its coverage of mid-cap stocks
in the US$50-200m range. Although liquidity remains a concern, the team’s in-depth research aims
to identify those mid-cap stocks where significant upside prospects are considered to outweigh the
disadvantage of lower liquidity. While not an activist investor, VEIL seeks to collaborate with the
management of investee companies, advising them on actions to enhance company value, in areas
such as business strategy, capital structure, corporate governance and investor relations. In 2017,
a key element of VEIL’s approach is to capture new investment opportunities through participating
in IPOs, private placements, pre-listings and state divestments.
The majority of VEIL’s portfolio investments are equities trading on the Stock Trading Center of
Vietnam in Ho Chi Minh City (HSX) and the Hanoi Stock Exchange (HNX). VEIL also invests in the
unlisted securities of both private companies and state-owned enterprises (SOEs) ahead of a
planned IPO, as well as equities listed on the Unlisted Public Company Market (UPCoM), where
public companies list their shares following IPO, prior to listing on either of the two main stock
exchanges. The manager aims to limit total exposure to unlisted securities and shares listed on
UPCoM (which often have low liquidity) to 15% of VEIL’s NAV. At end-June 2017, VEIL’s unlisted
investments comprised three OTC-listed equities: Vietnam Engine and Agricultural Machinery, Tin
Nghia and VietCap Securities, which together represented 3.5% of NAV. Among VEIL’s listed
investments, only ACV and Vinatex were UPCoM-listed at end-June 2017, together representing
4.4% of NAV.
While there are no restrictions by market capitalisation or industry sector, the following gross assets
exposure limits are observed at the time of investment, with a view to risk management: 20% to a
single counterparty, 20% to any one issuer, 40% to any one industrial sector. In practice, no more
than 8% of NAV is allocated to any new investment. VEIL is permitted to invest up to 20% of its net
asset value in companies operating in, or with significant exposure to Cambodia and Laos, but the
manager has refrained from investing due to concerns over the small size and low liquidity of each
country’s stock market. VEIL may also invest in listed or unlisted debt securities or loan instruments
but currently has no exposure.
VEIL may use derivatives for investment purposes as well as efficient portfolio management and is
permitted to invest up to 10% of NAV in other investment companies that focus on securities falling
within VEIL's investment policy. VEIL aims to be substantially fully invested under normal market
conditions. However, when considered prudent (such as when there is a lack of suitable investment
opportunities or during periods of falling markets or elevated market volatility), VEIL may also hold a
significant proportion of NAV in cash or other short-term investments such as commercial paper or
certificates of deposit.
Investment process: Research-driven, bottom-up analysis The investment process is driven by individual company research, which incorporates an in-house
view of the broader economic outlook. The analyst team covers the top 60-70 listed stocks by
market cap, focusing on the top 50 stocks in VEIL’s investible universe, which excludes companies
that are deemed non-compliant from an ESG perspective. Guided by head of research Dr Le Anh
Tuan, each of the 11 analysts is a sector specialist, responsible for maintaining detailed coverage of
Vietnam Enterprise Investments | 25 July 2017 9
the leading stocks in their sector, which includes regularly meeting with company management and
providing input to the ESG assessment.
The research team generates investment ideas based on each analyst’s detailed analysis and their
specialist sector knowledge. These ideas are reviewed by the portfolio managers, who take a wider
perspective, making portfolio allocation decisions with the aim of constructing a portfolio that should
outperform the VN Index benchmark. All new investment decisions are reviewed by the investment
advisory committee, based on written reports prepared by the portfolio managers. The committee
meets monthly to discuss matters raised by the portfolio managers as well as conducting its own
portfolio review. When appropriate, it has authority to intervene in portfolio matters and direct the
portfolio managers to undertake any actions deemed necessary to keep returns on track.
In addition to maintaining coverage of listed companies, the research team conducts detailed
analysis of pre-IPO companies. Once a company is identified as a potential IPO candidate, the
relevant sector analyst will arrange to meet the company’s management and prepare a detailed
analysis ahead of the IPO being launched. This places VEIL in a strong position to participate in the
IPO auction process, which usually occurs at 30 days’ notice without a prospectus being published,
meaning that only limited information is typically available to potential investors.
Current portfolio positioning VEIL has a relatively concentrated portfolio, comprising 40 holdings at end-June 2017, with the top
10 representing 58.6% of NAV, modestly lower than at end-June 2016 when the top 10 represented
63.1% of NAV (see Exhibit 1). A major element of the decline in the top 10 weighting is accounted
for by Vinamilk, with VEIL reducing its exposure from 18.8% to 12.5% of NAV over the year. While
remaining the largest portfolio holding, VEIL’s exposure to Vinamilk is now only slightly higher than
the stock’s 12.2% weighting in the VN Index at end-June 2017. Seven of the top 10 holdings remain
from a year earlier, but this reflects performance differentials as well as portfolio additions and
sales, with Vietjet Air the only new investment among these stocks. Within the top 10 holdings, Asia
Commercial Bank has been in the portfolio for more than 20 years, while Vinamilk has been held for
over 10 years, and the manager reports that typical annual portfolio turnover is around 35%.
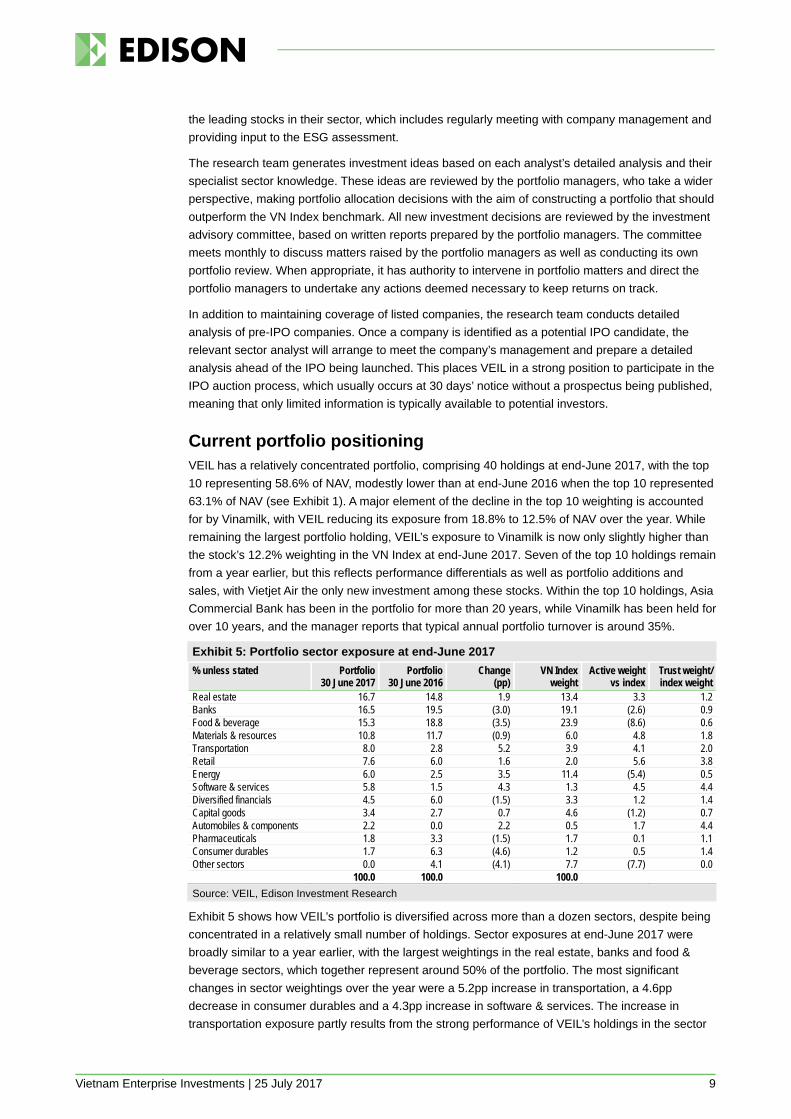
Exhibit 5: Portfolio sector exposure at end-June 2017
% unless stated Portfolio 30 June 2017
Portfolio 30 June 2016
Change (pp)
VN Index weight
Active weight vs index
Trust weight/ index weight
Real estate 16.7 14.8 1.9 13.4 3.3 1.2 Banks 16.5 19.5 (3.0) 19.1 (2.6) 0.9 Food & beverage 15.3 18.8 (3.5) 23.9 (8.6) 0.6 Materials & resources 10.8 11.7 (0.9) 6.0 4.8 1.8 Transportation 8.0 2.8 5.2 3.9 4.1 2.0 Retail 7.6 6.0 1.6 2.0 5.6 3.8 Energy 6.0 2.5 3.5 11.4 (5.4) 0.5 Software & services 5.8 1.5 4.3 1.3 4.5 4.4 Diversified financials 4.5 6.0 (1.5) 3.3 1.2 1.4 Capital goods 3.4 2.7 0.7 4.6 (1.2) 0.7 Automobiles & components 2.2 0.0 2.2 0.5 1.7 4.4 Pharmaceuticals 1.8 3.3 (1.5) 1.7 0.1 1.1 Consumer durables 1.7 6.3 (4.6) 1.2 0.5 1.4 Other sectors 0.0 4.1 (4.1) 7.7 (7.7) 0.0 100.0 100.0 100.0
Source: VEIL, Edison Investment Research
Exhibit 5 shows how VEIL’s portfolio is diversified across more than a dozen sectors, despite being
concentrated in a relatively small number of holdings. Sector exposures at end-June 2017 were
broadly similar to a year earlier, with the largest weightings in the real estate, banks and food &
beverage sectors, which together represent around 50% of the portfolio. The most significant
changes in sector weightings over the year were a 5.2pp increase in transportation, a 4.6pp
decrease in consumer durables and a 4.3pp increase in software & services. The increase in
transportation exposure partly results from the strong performance of VEIL’s holdings in the sector

Vietnam Enterprise Investments | 25 July 2017 10
during the year, as well as top 10 holding Vietjet Air being added to the portfolio in December 2016.
Food & beverage exposure declined by only 3.5pp despite a 6.3pp reduction in Vinamilk, due to
Sabeco, Vietnam’s leading beer producer, being added to the portfolio when the state divested its
stake in December 2016.
Performance: Notably strong over one year
Exhibit 6 illustrates VEIL’s exceptionally strong NAV performance over one year to end-June 2017
in absolute terms, with its 41.9% NAV total return in sterling terms comparing to the 26.9% return of
the VN Index. Sterling weakness accounts for a relatively small part of this performance, with
sterling having declined only 2.8% against the US dollar over the period. The relatively weak
performance of both VEIL and the VN Index over 10 years is largely due to the very pronounced
pre-financial crisis stock market peak in 2007, which is captured at the start of this time period. We
note that VEIL’s 12-year NAV total return is 15.7% pa, which provides a better reflection of its
longer-term performance.
Exhibit 6: Investment company performance to 30 June 2017 in sterling terms
Price, NAV and index total return performance, one-year rebased Price, NAV and index total return performance (%)
Source: Thomson Datastream, Edison Investment Research. Note: Three, five and 10-year performance figures annualised.
As illustrated in Exhibit 7, VEIL’s price and NAV total returns have both outperformed the Vietnam
VN Index over one, three, five and 10 years, helped by notably strong absolute and relative NAV
performance over the year to end-June 2017.
Exhibit 7: Share price and NAV total return performance, relative to indices (%)
One month Three months Six months One year Three years Five years 10 years Price relative to Vietnam VN Index 4.8 10.5 14.6 23.7 27.8 18.0 16.2 NAV relative to Vietnam VN Index 0.9 1.9 7.0 11.8 22.3 17.3 28.4 Price relative to Vietnam VN30 Index 3.0 7.8 9.6 23.5 39.7 43.0 N/A NAV relative to Vietnam VN30 Index (0.9) (0.6) 2.4 11.6 33.7 42.3 N/A Price relative to MSCI Emerging Markets 9.0 12.7 14.3 22.8 70.6 93.3 (29.8) NAV relative to MSCI Emerging Markets 4.9 3.9 6.8 11.1 63.2 92.3 (22.4)
Source: Thomson Datastream, Edison Investment Research. Note: Data to end-June 2017. Geometric calculation.
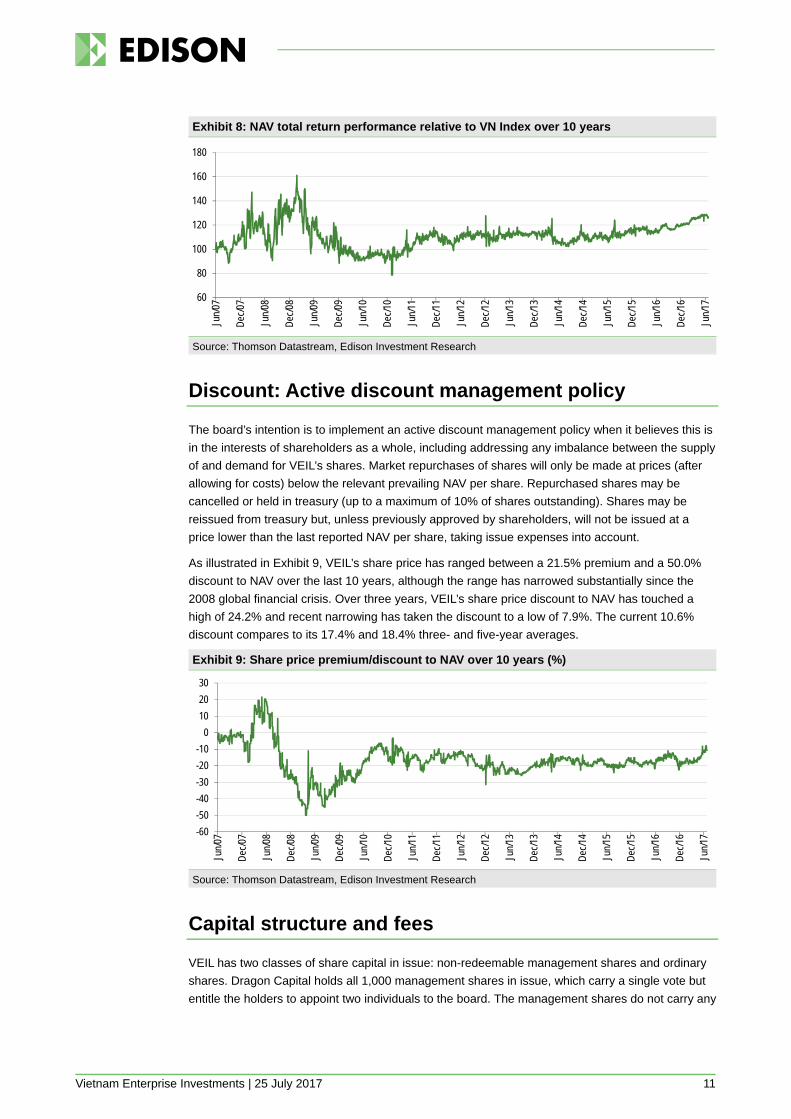
While VEIL’s performance relative to the VN Index fluctuated immediately before and after the 2008
global financial crisis, Exhibit 8 illustrates that since March 2010, VEIL’s NAV return has not been
particularly differentiated from the VN Index but has achieved a fairly steady outperformance, which
is slightly more pronounced since September 2014.
90
100
110
120
130
140
150
160
Jun/
16
Jul/1
6
Aug/
16
Sep/
16
Oct
/16
Nov
/16
Dec
/16
Jan/
17
Feb/
17
Mar
/17
Apr/1
7
May
/17
Jun/
17
VEIL Equity VEIL NAV Vietnam VN Index
0
10
20
30
40
50
60
1 m 3 m 6 m 1 y 3 y 5 y 10 y
Perfo
rman
ce
VEIL Equity VEIL NAV Vietnam VN Index
Vietnam Enterprise Investments | 25 July 2017 11
Exhibit 8: NAV total return performance relative to VN Index over 10 years
Source: Thomson Datastream, Edison Investment Research
Discount: Active discount management policy
The board’s intention is to implement an active discount management policy when it believes this is
in the interests of shareholders as a whole, including addressing any imbalance between the supply
of and demand for VEIL’s shares. Market repurchases of shares will only be made at prices (after
allowing for costs) below the relevant prevailing NAV per share. Repurchased shares may be
cancelled or held in treasury (up to a maximum of 10% of shares outstanding). Shares may be
reissued from treasury but, unless previously approved by shareholders, will not be issued at a
price lower than the last reported NAV per share, taking issue expenses into account.
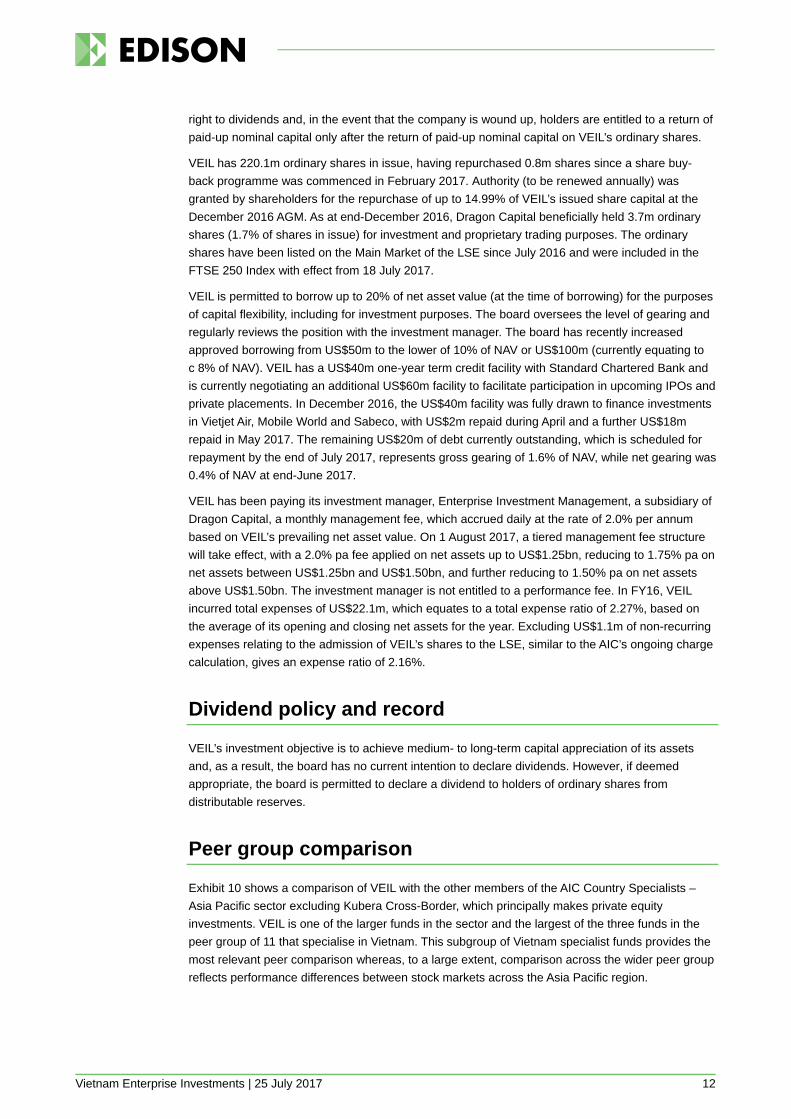
As illustrated in Exhibit 9, VEIL’s share price has ranged between a 21.5% premium and a 50.0%
discount to NAV over the last 10 years, although the range has narrowed substantially since the
2008 global financial crisis. Over three years, VEIL’s share price discount to NAV has touched a
high of 24.2% and recent narrowing has taken the discount to a low of 7.9%. The current 10.6%
discount compares to its 17.4% and 18.4% three- and five-year averages.
Exhibit 9: Share price premium/discount to NAV over 10 years (%)
Source: Thomson Datastream, Edison Investment Research
Capital structure and fees
VEIL has two classes of share capital in issue: non-redeemable management shares and ordinary
shares. Dragon Capital holds all 1,000 management shares in issue, which carry a single vote but
entitle the holders to appoint two individuals to the board. The management shares do not carry any
60
80
100
120
140
160
180
Jun/
07
Dec
/07
Jun/
08
Dec
/08
Jun/
09
Dec
/09
Jun/
10
Dec
/10
Jun/
11
Dec
/11
Jun/
12
Dec
/12
Jun/
13
Dec
/13
Jun/
14
Dec
/14
Jun/
15
Dec
/15
Jun/
16
Dec
/16
Jun/
17
-60
-50
-40
-30
-20
-10
0
10
20
30
Jun/
07
Dec
/07
Jun/
08
Dec
/08
Jun/
09
Dec
/09
Jun/
10
Dec
/10
Jun/
11
Dec
/11
Jun/
12
Dec
/12
Jun/
13
Dec
/13
Jun/
14
Dec
/14
Jun/
15
Dec
/15
Jun/
16
Dec
/16
Jun/
17
Vietnam Enterprise Investments | 25 July 2017 12
right to dividends and, in the event that the company is wound up, holders are entitled to a return of
paid-up nominal capital only after the return of paid-up nominal capital on VEIL’s ordinary shares.
VEIL has 220.1m ordinary shares in issue, having repurchased 0.8m shares since a share buy-
back programme was commenced in February 2017. Authority (to be renewed annually) was
granted by shareholders for the repurchase of up to 14.99% of VEIL’s issued share capital at the
December 2016 AGM. As at end-December 2016, Dragon Capital beneficially held 3.7m ordinary
shares (1.7% of shares in issue) for investment and proprietary trading purposes. The ordinary
shares have been listed on the Main Market of the LSE since July 2016 and were included in the
FTSE 250 Index with effect from 18 July 2017.
VEIL is permitted to borrow up to 20% of net asset value (at the time of borrowing) for the purposes
of capital flexibility, including for investment purposes. The board oversees the level of gearing and
regularly reviews the position with the investment manager. The board has recently increased
approved borrowing from US$50m to the lower of 10% of NAV or US$100m (currently equating to
c 8% of NAV). VEIL has a US$40m one-year term credit facility with Standard Chartered Bank and
is currently negotiating an additional US$60m facility to facilitate participation in upcoming IPOs and
private placements. In December 2016, the US$40m facility was fully drawn to finance investments
in Vietjet Air, Mobile World and Sabeco, with US$2m repaid during April and a further US$18m
repaid in May 2017. The remaining US$20m of debt currently outstanding, which is scheduled for
repayment by the end of July 2017, represents gross gearing of 1.6% of NAV, while net gearing was
0.4% of NAV at end-June 2017.
VEIL has been paying its investment manager, Enterprise Investment Management, a subsidiary of
Dragon Capital, a monthly management fee, which accrued daily at the rate of 2.0% per annum
based on VEIL’s prevailing net asset value. On 1 August 2017, a tiered management fee structure
will take effect, with a 2.0% pa fee applied on net assets up to US$1.25bn, reducing to 1.75% pa on
net assets between US$1.25bn and US$1.50bn, and further reducing to 1.50% pa on net assets
above US$1.50bn. The investment manager is not entitled to a performance fee. In FY16, VEIL
incurred total expenses of US$22.1m, which equates to a total expense ratio of 2.27%, based on
the average of its opening and closing net assets for the year. Excluding US$1.1m of non-recurring
expenses relating to the admission of VEIL’s shares to the LSE, similar to the AIC’s ongoing charge
calculation, gives an expense ratio of 2.16%.
Dividend policy and record
VEIL’s investment objective is to achieve medium- to long-term capital appreciation of its assets
and, as a result, the board has no current intention to declare dividends. However, if deemed
appropriate, the board is permitted to declare a dividend to holders of ordinary shares from
distributable reserves.
Peer group comparison
Exhibit 10 shows a comparison of VEIL with the other members of the AIC Country Specialists –
Asia Pacific sector excluding Kubera Cross-Border, which principally makes private equity
investments. VEIL is one of the larger funds in the sector and the largest of the three funds in the
peer group of 11 that specialise in Vietnam. This subgroup of Vietnam specialist funds provides the
most relevant peer comparison whereas, to a large extent, comparison across the wider peer group
reflects performance differences between stock markets across the Asia Pacific region.
Vietnam Enterprise Investments | 25 July 2017 13
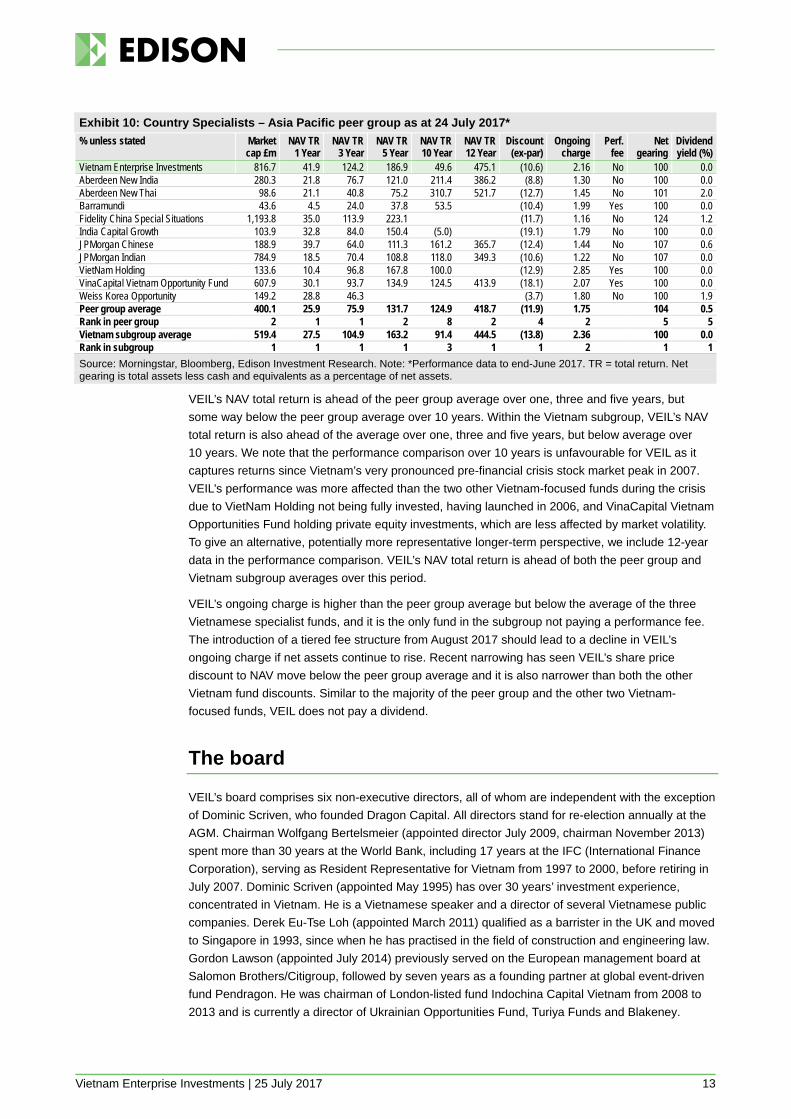
Exhibit 10: Country Specialists – Asia Pacific peer group as at 24 July 2017*
% unless stated Market cap £m
NAV TR 1 Year
NAV TR 3 Year
NAV TR 5 Year
NAV TR 10 Year
NAV TR 12 Year
Discount (ex-par)
Ongoing charge
Perf. fee
Net gearing
Dividend yield (%)
Vietnam Enterprise Investments 816.7 41.9 124.2 186.9 49.6 475.1 (10.6) 2.16 No 100 0.0 Aberdeen New India 280.3 21.8 76.7 121.0 211.4 386.2 (8.8) 1.30 No 100 0.0 Aberdeen New Thai 98.6 21.1 40.8 75.2 310.7 521.7 (12.7) 1.45 No 101 2.0 Barramundi 43.6 4.5 24.0 37.8 53.5 (10.4) 1.99 Yes 100 0.0 Fidelity China Special Situations 1,193.8 35.0 113.9 223.1 (11.7) 1.16 No 124 1.2 India Capital Growth 103.9 32.8 84.0 150.4 (5.0) (19.1) 1.79 No 100 0.0 JPMorgan Chinese 188.9 39.7 64.0 111.3 161.2 365.7 (12.4) 1.44 No 107 0.6 JPMorgan Indian 784.9 18.5 70.4 108.8 118.0 349.3 (10.6) 1.22 No 107 0.0 VietNam Holding 133.6 10.4 96.8 167.8 100.0 (12.9) 2.85 Yes 100 0.0 VinaCapital Vietnam Opportunity Fund 607.9 30.1 93.7 134.9 124.5 413.9 (18.1) 2.07 Yes 100 0.0 Weiss Korea Opportunity 149.2 28.8 46.3 (3.7) 1.80 No 100 1.9 Peer group average 400.1 25.9 75.9 131.7 124.9 418.7 (11.9) 1.75 104 0.5 Rank in peer group 2 1 1 2 8 2 4 2 5 5 Vietnam subgroup average 519.4 27.5 104.9 163.2 91.4 444.5 (13.8) 2.36 100 0.0 Rank in subgroup 1 1 1 1 3 1 1 2 1 1
Source: Morningstar, Bloomberg, Edison Investment Research. Note: *Performance data to end-June 2017. TR = total return. Net gearing is total assets less cash and equivalents as a percentage of net assets.
VEIL’s NAV total return is ahead of the peer group average over one, three and five years, but
some way below the peer group average over 10 years. Within the Vietnam subgroup, VEIL’s NAV
total return is also ahead of the average over one, three and five years, but below average over
10 years. We note that the performance comparison over 10 years is unfavourable for VEIL as it
captures returns since Vietnam’s very pronounced pre-financial crisis stock market peak in 2007.
VEIL’s performance was more affected than the two other Vietnam-focused funds during the crisis
due to VietNam Holding not being fully invested, having launched in 2006, and VinaCapital Vietnam
Opportunities Fund holding private equity investments, which are less affected by market volatility.
To give an alternative, potentially more representative longer-term perspective, we include 12-year
data in the performance comparison. VEIL’s NAV total return is ahead of both the peer group and
Vietnam subgroup averages over this period.
VEIL’s ongoing charge is higher than the peer group average but below the average of the three
Vietnamese specialist funds, and it is the only fund in the subgroup not paying a performance fee.
The introduction of a tiered fee structure from August 2017 should lead to a decline in VEIL’s
ongoing charge if net assets continue to rise. Recent narrowing has seen VEIL’s share price
discount to NAV move below the peer group average and it is also narrower than both the other
Vietnam fund discounts. Similar to the majority of the peer group and the other two Vietnam-
focused funds, VEIL does not pay a dividend.
The board
VEIL’s board comprises six non-executive directors, all of whom are independent with the exception
of Dominic Scriven, who founded Dragon Capital. All directors stand for re-election annually at the
AGM. Chairman Wolfgang Bertelsmeier (appointed director July 2009, chairman November 2013)
spent more than 30 years at the World Bank, including 17 years at the IFC (International Finance
Corporation), serving as Resident Representative for Vietnam from 1997 to 2000, before retiring in
July 2007. Dominic Scriven (appointed May 1995) has over 30 years’ investment experience,
concentrated in Vietnam. He is a Vietnamese speaker and a director of several Vietnamese public
companies. Derek Eu-Tse Loh (appointed March 2011) qualified as a barrister in the UK and moved
to Singapore in 1993, since when he has practised in the field of construction and engineering law.
Gordon Lawson (appointed July 2014) previously served on the European management board at
Salomon Brothers/Citigroup, followed by seven years as a founding partner at global event-driven
fund Pendragon. He was chairman of London-listed fund Indochina Capital Vietnam from 2008 to
2013 and is currently a director of Ukrainian Opportunities Fund, Turiya Funds and Blakeney.
Vietnam Enterprise Investments | 25 July 2017 14
Dr Marc Faber and Stanley Chou were both appointed as directors in January 2016, replacing non-
independent director Farida Khambata (appointed April 2012) and Susie Rippingall (appointed July
2014). Faber is an independent investment advisor based in Thailand, having served as managing
director of Drexel Burnham Lambert in Hong Kong from 1978 to 1990. Based in Hong Kong, Chou
has over 20 years’ experience in finance and has been investing in Vietnam since 2005. He is
managing director of investment advisory companies Lufin Asia Pacific and SCA International.
Edison is an investment research and advisory company, with offices in North America, Europe, the Middle East and AsiaPac. The heart of Edison is our world-renowned equity research platform and deep multi-sector expertise. At Edison Investment Research, our research is widely read by international investors, advisers and stakeholders. Edison Advisors leverages our core research platform to provide differentiated services including investor relations and strategic consulting. Edison is authorised and regulated by the Financial Conduct Authority. Edison Investment Research (NZ) Limited (Edison NZ) is the New Zealand subsidiary of Edison. Edison NZ is registered on the New Zealand Financial Service Providers Register (FSP number 247505) and is registered to provide wholesale and/or generic financial adviser services only. Edison Investment Research Inc (Edison US) is the US subsidiary of Edison and is regulated by the Securities and Exchange Commission. Edison Investment Research Limited (Edison Aus) [46085869] is the Australian subsidiary of Edison and is not regulated by the Australian Securities and Investment Commission. Edison Germany is a branch entity of Edison Investment Research Limited [4794244]. www.edisongroup.com
DISCLAIMER Copyright 2017 Edison Investment Research Limited. All rights reserved. This report has been commissioned by Vietnam Enterprise Investments and prepared and issued by Edison for publication globally. All information used in the publication of this report has been compiled from publicly available sources that are believed to be reliable; however we do not guarantee the accuracy or completeness of this report. Opinions contained in this report represent those of the research department of Edison at the time of publication. The securities described in the Investment Research may not be eligible for sale in all jurisdictions or to certain categories of investors. This research is issued in Australia by Edison Aus and any access to it, is intended only for "wholesale clients" within the meaning of the Australian Corporations Act. The Investment Research is distributed in the United States by Edison US to major US institutional investors only. Edison US is registered as an investment adviser with the Securities and Exchange Commission. Edison US relies upon the "publishers' exclusion" from the definition of investment adviser under Section 202(a)(11) of the Investment Advisers Act of 1940 and corresponding state securities laws. As such, Edison does not offer or provide personalised advice. We publish information about companies in which we believe our readers may be interested and this information reflects our sincere opinions. The information that we provide or that is derived from our website is not intended to be, and should not be construed in any manner whatsoever as, personalised advice. Also, our website and the information provided by us should not be construed by any subscriber or prospective subscriber as Edison’s solicitation to effect, or attempt to effect, any transaction in a security. The research in this document is intended for New Zealand resident professional financial advisers or brokers (for use in their roles as financial advisers or brokers) and habitual investors who are “wholesale clients” for the purpose of the Financial Advisers Act 2008 (FAA) (as described in sections 5(c) (1)(a), (b) and (c) of the FAA). This is not a solicitation or inducement to buy, sell, subscribe, or underwrite any securities mentioned or in the topic of this document. This document is provided for information purposes only and should not be construed as an offer or solicitation for investment in any securities mentioned or in the topic of this document. A marketing communication under FCA rules, this document has not been prepared in accordance with the legal requirements designed to promote the independence of investment research and is not subject to any prohibition on dealing ahead of the dissemination of investment research. Edison has a restrictive policy relating to personal dealing. Edison Group does not conduct any investment business and, accordingly, does not itself hold any positions in the securities mentioned in this report. However, the respective directors, officers, employees and contractors of Edison may have a position in any or related securities mentioned in this report. Edison or its affiliates may perform services or solicit business from any of the companies mentioned in this report. The value of securities mentioned in this report can fall as well as rise and are subject to large and sudden swings. In addition it may be difficult or not possible to buy, sell or obtain accurate information about the value of securities mentioned in this report. Past performance is not necessarily a guide to future performance. Forward-looking information or statements in this report contain information that is based on assumptions, forecasts of future results, estimates of amounts not yet determinable, and therefore involve known and unknown risks, uncertainties and other factors which may cause the actual results, performance or achievements of their subject matter to be materially different from current expectations. For the purpose of the FAA, the content of this report is of a general nature, is intended as a source of general information only and is not intended to constitute a recommendation or opinion in relation to acquiring or disposing (including refraining from acquiring or disposing) of securities. The distribution of this document is not a “personalised service” and, to the extent that it contains any financial advice, is intended only as a “class service” provided by Edison within the meaning of the FAA (ie without taking into account the particular financial situation or goals of any person). As such, it should not be relied upon in making an investment decision. To the maximum extent permitted by law, Edison, its affiliates and contractors, and their respective directors, officers and employees will not be liable for any loss or damage arising as a result of reliance being placed on any of the information contained in this report and do not guarantee the returns on investments in the products discussed in this publication. FTSE International Limited (“FTSE”) © FTSE 2017. “FTSE®” is a trade mark of the London Stock Exchange Group companies and is used by FTSE International Limited under license. All rights in the FTSE indices and/or FTSE ratings vest in FTSE and/or its licensors. Neither FTSE nor its licensors accept any liability for any errors or omissions in the FTSE indices and/or FTSE ratings or underlying data. No further distribution of FTSE Data is permitted without FTSE’s express written consent.
Frankfurt +49 (0)69 78 8076 960 Schumannstrasse 34b 60325 Frankfurt Germany
London +44 (0)20 3077 5700 280 High Holborn London, WC1V 7EE United Kingdom
New York +1 646 653 7026 295 Madison Avenue, 18th Floor 10017, New York US
Sydney +61 (0)2 8249 8342 Level 12, Office 1205 95 Pitt Street, Sydney NSW 2000, Australia